Embed Size (px)
Citation preview

Technical Bulletin 249
1965
technological and market forces affecting
Vertical Integration in the Hog Industry
Harlan J. Dirks
and
Darrell F. Fienup
lRICULTURAL EXPERIMENT STATION • UNIVERSITY OF MINNESOTA

Introduction 3
Objective Of The Study 5
Phases Of The Study . 5
I)ata 5
Vertical Integration Defined . 6
Technological Aspects Of Swine Production As Related To Vertical Integration 8
Specialization In Hog Production . 8
Intraprocess Specialization 18
Technological Limitations To Largescaie Hog Production 26
Market Forces Affecting Vertical Integration In Hogs 28
Forward Integration By Suppliers 29
Backward Integration By Processors And Retailers 32
Role Of Cooperatives 37
Supply And Demand For Hogs 39
Summary And Conclusions 43
Institutional Considerations 44
Need For Greater Coordination . 45
Appendix: Estimated Costs And Capital Requirements Used In Ap-pendix Tables 46
Product Prices And Factor Costs 46
Capital Requirements . 47
Literature Cited 50
No endorsement is intended by mention of products or firms nor is criticism implied of those not named.
Submitted for publication January 30, 1964
Approved for publication May 11, 1965 3M-9-65

technological and market forces affecting
Vertical Integration In The Hog Industry
Harlan J. Dirks and Darrell F. Fienup
During the 1950's, considerable concern developed about vertical integration in agriculture. Although much "emotionalism" now has subsided, integrated production and marketing systems continue to grow. Estimates are that 95 percent of the broilers reach consumers via integrated arrangements with nonfarm businesses. Turkey and egg production appear to be following the same path, and increasing numbers of cattle and hogs are being fed under contract and integration (figure 1).
Vertical integration is still relatively unimportant with hogs. Nevertheless, many people believe that the same integration which occurred in the broiler industry might extend to hogs. This speculation is based primarily on the following factors:
1. Rapid technological advance.
2. Declining importance of labor relative to capital in farming.
3. Availability of resources from outside of agriculture.
Midwestern farmers are concerned about this trend because hogs ac-count for 16 percent of the cash farm income and are produced on about 50 percent of the farms in the north-central region. However, extensive integration in one industry does not necessarily mean similar development in another-each industry is unique.
Experience from other industries indicates that vertical integration often results from scientific and technological advances which encourage higher levels of specialization and permit new production patterns. New technology is always a major factor in structural changes in agriculture. For example, the latest trend is the gradual separation of livestock and poultry production from general farming. Highly specialized feeding operations now perform many functions once done almost exclusively on diversified crop and livestock farms. Specialization and integration have been particularly important for enterprises adaptable to mass production techniques common to industry.1
Harlan J. Dirks is an assistant professor, Economics Department, South Dakota State University. He formerly was a research assistant, Department of Agricultural Economics, University of Minnesota. Darrell F. Fienup is a professor, Department of Agricultural Economics, University of Minnesota.
1 Harold Breimyer, a USDA economist, suggests that there are three emerging economies in agriculture: ( 1) production of primary products of the soil, ( 2) conversion of feedstuffs into livestock products, and ( 3) marketing of livestock and livestock products. Formerly, these functions were performed on the general farm, but technological advances and specialization advantages are bringing about a mutual detachment of the three phases. For further explanation see (10). -
3

Percent
0 50 100
Broilers
Turkeys
Eggs
Cattle on feed
Hogs
Figure l. Estimated output of livestock and poultry products produced under integrated or contractual arrangements with nonfarm firms. Source: ( 37).
Several important scientinc developments, which may affect vertical integration in the hog industry, have occurred: continuous production systems with increased specialization in breeding, farrowing, and finishing; significant improvements in feed efficiency and meat-type hogs; confinement production systems; Specific Pathogen Free ( SPF) herds; and largescale, highly mechanized hog operations.
One important development in hog production with respect to vertical integration is the growth of the feeder pig industry. An estimated 15 percent of the nation's hogs start life on one farm and are fed out on another as compared to only 5 percent a decade ago.2 Development of this segment of the swine industry is heightening concern that a relatively few specialized feeder pig operations may someday turn out numerous, uniform, disease-free pigs. Such a major development could profoundly affect the swine industry.
Technological change has also affected the relationship between farm producers and nonfarm firms supplying production items and marketing services. During the past 3 decades, many functions formerly associated with hog production moved off the farm; they are now performed by the nonfarm or agribusiness sector. This change brought about a shift in "input mix," causing hog producers to be more dependent on nonfarm businesses.
2 Wall Street Journal, 711 W. Monroe Street, Chicago, Illinois, February 29, 1963, p. l. In Minnesota, a recent study showed that ll percent of Minnesota's hog producers sold feeder pigs in 1961. See ( 39).
4

Another important change is the movement toward largescale procurement with uniform specifications by food processors and retailers. Changes in consumer preference and advances in food merchandising have meant tightly defined product specifications and a system of forward-buying for many food products. Special merchandising and procurement programs are difficult for pork because of the diversity of the present market system and the difficulty of securing enough meat-type pork. Consequently, some believe that integrated systems may replace the present open market for hogs.
Because of the many changes occurring in pork production and marketing, general farmers are concerned that the hog enterprise may become a highly specialized, largescale operation extensively integrated with nonfarm firms. Although most agricultural leaders, economists; and politicians desire increased efficiency in agriculture, disagreement often exists about how to attain this objective.
OBJECTIVE OF THE STUDY
It is not this study's purpose to determine if vertical integration is desirable. Rather, its principal objective is to discover whether changes occurring in pork production and marketing will result in a highly integrated market structure for hogs. The objective can be subdivided into two parts:
• To determine whether technological and market forces will cause the swine industry to become extensively integrated in the near future.
• If integration is to be important, to determine the organizational form and direction it will take.
PHASES OF THE STUDY
This study is divided into two major areas. The first phase concerns the technological forces underlying incentives for and limitations of vertical integration in hogs. Technological conditions may be thought of as the application of scientific principles or the adoption of new and improved techniques that are expected to lower production costs. Technological change may induce new investment, even where existing capacity is adequate, because new methods often increase the efficiency of the production process.
The second phase concerns market structure aspects of vertical integration. Changes and characteristics of the market which may encour-age (or discourage) vertical integration are examined. ·
DATA
Data and information used in this study were developed from primary and secondary sources. The major sources of primary data were personal interviews and field surveys in a six state area-Iowa, Nebraska, \Visconsin, Illinois, Missouri, and Minnesota. In the combined years of
5

1959 and 1962, 105 personal interviews were made. Many of the same firms and individuals interviewed in 1959 were contacted again in 1962 to determine if attitudes concerning future developments in the swine industry had changed.
Hog producers comprised the main source of primary cost data. Other important data sources were feed manufacturers, building and equipment contractors, agricultural engineers, farm management specialists, animal scientists, and meat processors. Secondary data were obtained mostly from state and federal statistical reporting agencies. Current literature from various experiment stations was also used. An explanation of cost data developed for this study can be found in the appendix.
VERTICAL INTEGRATION DEFINED
The term vertical integration has many meanings. Traditionally, it referred to interindustry mergers or vertical expansion of companies via direct purchase of an adjacent process. (53) The modern day concept of vertical integration in agriculture emphasizes coordination of the decision-making function of management in two or more vertically related processes. The key feature revolves around control or centralization of the decision-making process with respect to supervision, risk-bearing, and financing. The degrees of control and risk assumed by the integrator often indicate the degree of vertical integration.
In its present day context, vertical integration is not new to agriculture. For example, grower-processor contracts have been used for many years in vegetable and fruit industries. Many food products reach the consumer via integrated production and marketing systems. However, integrated arrangements have come into prominence in livestock and poultry industries only in recent years.
Vertical integration-the process of gaining control over a related stage of production and marketing-can be accomplished in various ways and in varying degrees. Three basic business arrangements involved in vertical integration are:
l. Full ownership-a firm gains full control of a separate stage through acquisition or direct ownership of adjacent facilities.
2. Contractual arrangement-control between firms is accomplished by contract but ownership does not change.
3. Cooperative effort-individuals working together in a cooperative effort assume control over another stage.
Horizontal integration means the linking together of two or more firms at the same stage in the production or marketing process. In other words, horizontal integration involves the combining of like units at the same stage which were previously operated as independent firms.
Cooperative effort is an example of both horizontal and vertical integration. Individuals working together in a cooperative effort pool their resources horizontally and then integrate vertically to enhance their com-
6

petitive position. Various horizontal and vertical combinations are formed for integrating backward into the supply sector or forward into the marketing sector.
Although the general idea of vertical integration in agriculture apparently is well understood, there are nearly as many formal definitions of vertical integration as there are authors of studies. The "definition" problem arises because of the many degrees of vertical integration. However, some classification system is needed for studying the development of vertical integration within an industry.
A case in point is the broiler industry. Vertical integration started in that industry with some rather loose dealer-grower contract arrangements. This informal contracting gradually gave way to more formalized contracts. Today, the typical broiler grower no longer assumes normal entrepreneurial risks common to agricultural producers but, in fact, is a wage earner. The most advanced form of vertical integration, complete ownership, is presently gaining in the broiler industry. (50)
Since vertical integration via direct ownership is still unimportant in hog production, the main concern is classification of production and marketing contracts. Informal contract arrangements must be distinguished from vertical contract integration. For this study, contracts are divided into two major classifications: ( 1) formal contract integration and ( 2) partial or informal contract integration.
Formal Integration-Before a contractual arrangement can be considered formal contract integration, evidence must exist of profit and/or risk sharing or of some form of joint ownership of production factors. The contract may be considered a formal agreement if the risk is allocated in a way that is different from the normal risk allocation of a typical sales contract. In other words, the integrator must assume at least some price andjor production risk in the related activity.
Under formal contract integration, contract conditions are clearly defined before production and normally extend over more than one production period. Resources are often transferred between stages through internal administration rather than the traditional market channel. Under formal contracting, decisions in the adjacent sector are usually so crucial to the integrating firm that the integrator is willing to bear some risk in order to gain some control over the decision making of management.
Partial Or Informal Integration-While this type of integration generally involves some kind of contractual arrangement, the integrator will only seek to control one or two key managerial decisions in the related sector without sharing any price or production risks.
Informal production and marketing contracts account for most integrated activities in livestock production. Although these arrangements usually require the farmer to sign a written contract, the integrator normally is restricted in his control over the enterprise; the agreement usually covers only one production period. Some joint control is achieved in selected areas of decision making under informal contracting, but the farmer assumes all normal entrepreneurial risks common to livestock production.
7

Technological Aspects of Swine Production as Related to Vertical Integration
The rapid development and use of technology provide continuing forces for vertical integration in agriculture. The incentive for integration always increases when existing producers generally lack the capacity to organize and exploit new cost-reducing technology. Therefore, the initial force for integration in hog production relates to production costs at the farm level.
SPECIALIZATION IN HOG PRODUCTION Integration tends to follow high levels of specialization, particularly
when production units become large and complex. The general hypothesis is that vertical integration in hog production will not be important until: ( 1) financing requirements of the optimum size unit exceed what most producers can borrow on their equity position, or ( 2) managerial requirements exceed those available on general farms.
The important question is what level of specialization and output in hogs is best. Any enterprise that becomes highly specialized may eventually become too competitive with other enterprises to remain on the general farm. The cost structure of the typical commercial corn-hog producer, as compared to large specialized operations, is important in assessing future hog production trends.
Although the basic corn-hog structure in the Midwest remains almost unaltered, a few largescale, highly specialized hog operations are being tried. The investment risk is high and managerial experience is limited. But confidence among these producers also runs high. As more of these units are organized and the technological advance 'Continues, the likeli-hood of their success increases. \ '
Technological Gains To date, most technological gains in hog production concern the use
of labor and capital. Declining use of labor relative to capital greatly increases the productive capacity of individual hog producers. The immediate potential for integration lies partly in the high propensity among hog producers to acquire the capital necessary for increasing output per unit of labor. Studies show that many midwestern hog farmers now handle only about one-third of the litters they could manage with efficient work methods and modern buildings and equipment. ( 19)
The reduction in labor requirements for hogs resulted from improved work methods, better organization of facilities, and increased use of housing and mechanical equipment. Improved work methods increase efficiency without increasing cost. Housing and mechanical equipment increase unit costs unless the same amount of labor and management can be spread over more units of output.
8

Engineered hog systems are slowly changing hog production from a labor extensive to a capital extensive enterprise.
Courtesy of the N a:tional Hog Farmer
Benefits from specialized and highly engineered hog units center around raising hogs under confinement. The small advantages from pasture feeding are slowly disappearing with use of intensive crop production, improved nutrition and management, and increased automation.
Formerly, labor efficiencies gained in feed and water handling under confinement were lost in manure handling. New means for disposing of manure were important technological breakthroughs to confined feeding. Manure disposal in confinement systems took an average of three-quarters of the total labor input. But mechanical cleaners, slatted floors, and lagoons now provide efficient means of manure disposal. Because of high handling costs, research indicates that the most profitable practices are disposal of manure in a lagoon and use of commercial fertilizers on fields. (68)
Economies Of Size Economies of size may arise in many ways. In hog production, econo
mies presumably accrue from mechanization which results either in lower per unit costs or greater utilization of labor and managerial talent. In general, economies arise by: ( 1) lowering per unit costs through utilizing plant and management more intensely, or ( 2) enlarging the operation through horizontal expansion or additional units.
Relatively few studies have been made on economies of size in hog production. A Purdue University study ( 4) shows that costs decreased moderately up to about 50 sows and then increased. Net returns increased similarly up to this point. However, the study concludes that the optimum
9

Table I. Cost of producing 100 pounds ( cwt.) of pork for largescale hog enterprises~~>
Number of sows Number of
farms visited
0- 49 ..... ·························· 50- 99 .................................. .
100-199 ............................................................................................. . 200-399 ......................................... ··························· ·························· 400-799 ····························· ............................................. . 800 and over
Average
4 6 3 2 2 1
Cost per cwt.f
$13.55 14.50 14.25 15.40 15.30 15.00
$14.65
~~>Cost includes feed, building, equipment, labor, breeding, health, and interest on investment for complete farrow-to-finish hog operation.
f An analysis of variance showed no significant differences among means at the 5-percent level of significance.
number of sows per farm may vary and that further developments in science and technology would likely increase this number.
A field study was conducted in 1962 to determine if any economies exist in some so-called, large hog operations. Cost data were obtained by personal visits to hog farms located in Minnesota, Iowa, and Missouri. Sixteen of the 18 farms were combination corn-hog farms; the two large farms were specialized operations separated from corn production. Costs were taken from their records. These operations ranged in size from 350 to 15,000 hogs marketed annually (see table 1).
Although observations in this survey are limited, data apparently conform with findings in the Purdue study; that is, costs tend to increase as the number of sows per farm exceeds 50. The production cost per cwt. of pork for units with less than 50 sows was $13.55. On the other hand, the largest unit in the survey, with 1,000 sows, showed a $15 cost per cwt.
The field data collected indicate that as units become larger, production costs tend to become more uniform. At lower levels of output, more variation exists in the production cost. The degree of mechanization and managerial ability vary considerably more for smaller than for larger units. Generally, as mechanization increases, the volume of output per man also increases. On the other hand, capital costs in large units tend to increase per unit production costs.
Analysis Of Size In Hog Production In most farm management studies, enterprise average cost curves are
assumed to be similar, which indicates an optimum size plant under existing technologies. However, because of changing technology, a wide variation in size and costs is observed. Reasons given for these variations are usually managerial capacity, capital limitations, goals, and differences in risk preference. However, if technology is assumed to be sufficiently developed to warrant increased specialization in hog production, then management and capital become the relevant limiting factors.
10
Managerial Restrictions-Largescale hog operations require unique managerial ability. Managerial proficiency with a latitude for expansion could be the most important limiting resource. However, largescale hog production under existing technology may place such great demands on management and make errors so costly to the entrepreneur that small units have an economic advantage.
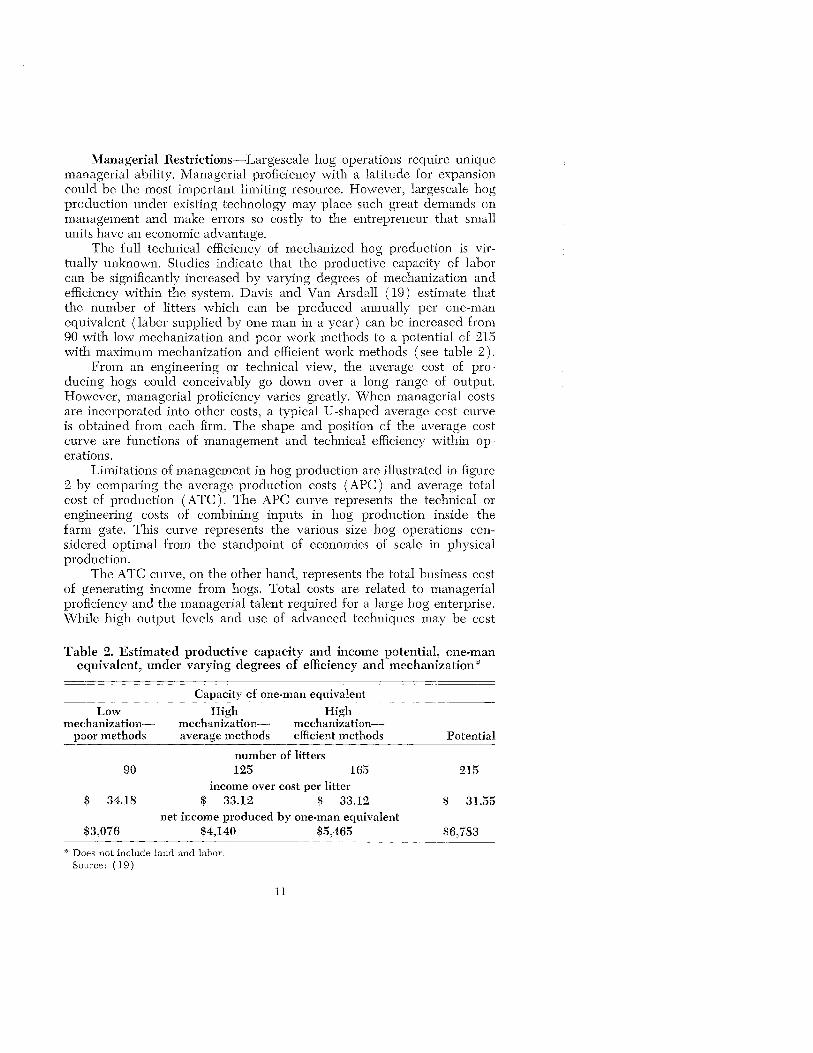
The full technical efficiency of mechanized hog production is virtually unknown. Studies indicate that the productive capacity of labor can be significantly increased by varying degrees of mechanization and efficiency within the system. Davis and Van Arsdall ( 19) estimate that the number of litters which can be produced annually per one-man equivalent (labor supplied by one man in a year) can be increased from 90 with low mechanization and poor work methods to a potential of 215 with maximum mechanization and efficient work methods (see table 2).
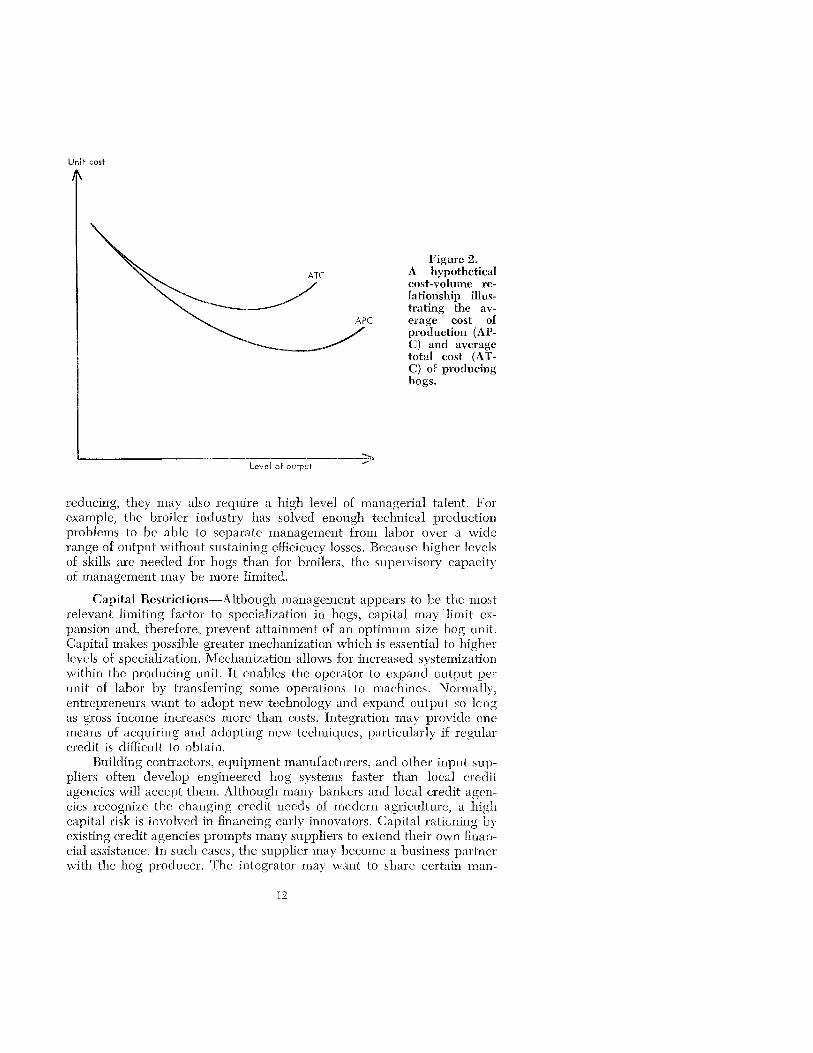
From an engineering or technical view, the average cost of producing hogs could conceivably go down over a long range of output. However, managerial proficiency varies greatly. When managerial costs are incorporated into other costs, a typical U -shaped average cost curve is obtained from each firm. The shape and position of the average cost curve are functions of management and technical efficiency within operations.
Limitations of management in hog production are illustrated in figure 2 by comparing the average production costs ( APC) and average total cost of production (A TC). The APC curve represents the technical or engineering costs of combining inputs in hog production inside the farm gate. This curve represents the various size hog operations considered optimal from the standpoint of economies of scale in physical production.
The A TC curve, on the other hand, represents the total business cost of generating income from hogs. Total costs are related to managerial proficiency and the managerial talent required for a large hog enterprise. While high output levels and use of advanced techniques may be cost
Table 2. Estimated productive capacity and income potential, one-man equivalent, under varying degrees of efficiency and mechanization*
Low mechanization
poor methods
90
$ 34.18
$3,076
Capacity of one-man equivalent
High High mechanization- mechanization-average methods efficient methods
number of litters 125
income over cost per litter 165
$ 33.12 $ 33.12 net income produced by one-man equivalent
$4,140 $5,465
"' Does not include land and labor. Source: (19)
11
Potential
215
$ 31.55
$6,783
Unit cost
ATC
~
Level of output
Figure 2. A hypothetical cost-volume relationship illustrating the average cost of production (APC) and average total cost (ATC) of producing hogs.
reducing, they may also require a high level of managerial talent. For example, the broiler industry has solved enough technical production problems to be able to separate management from labor over a wide range of output without sustaining efficiency losses. Because higher levels of skills are needed for hogs than for broilers, the supervisory capacity of management may be more limited.
Capital Restrictions-Although management appears to be the most relevant limiting factor to specialization in hogs, capital may limit expansion and, therefore, prevent attainment of an optimum size hog unit. Capital makes possible greater mechanization which is essential to higher levels of specialization. Mechanization allows for increased systemization within the producing unit. It enables the operator to expand output per unit of labor by transferring some operations to machines. Normally, entrepreneurs want to adopt new technology and expand output so long as gross income increases more than costs. Integration may provide one means of acquiring and adopting new techniques, particularly if regular credit is difficult to obtain.
Building contractors, equipment manufacturers, and other input suppliers often develop engineered hog systems faster than local credit agencies will accept them. Although many bankers and local credit agencies recognize the changing credit needs of modern agriculture, a high capital risk is involved in financing early innovators. Capital raticning by existing credit agencies prompts many suppliers to extend their own financial assistance. In such cases, the supplier may become a business partner with the hog producer. The integrator may want to share certain man-
12
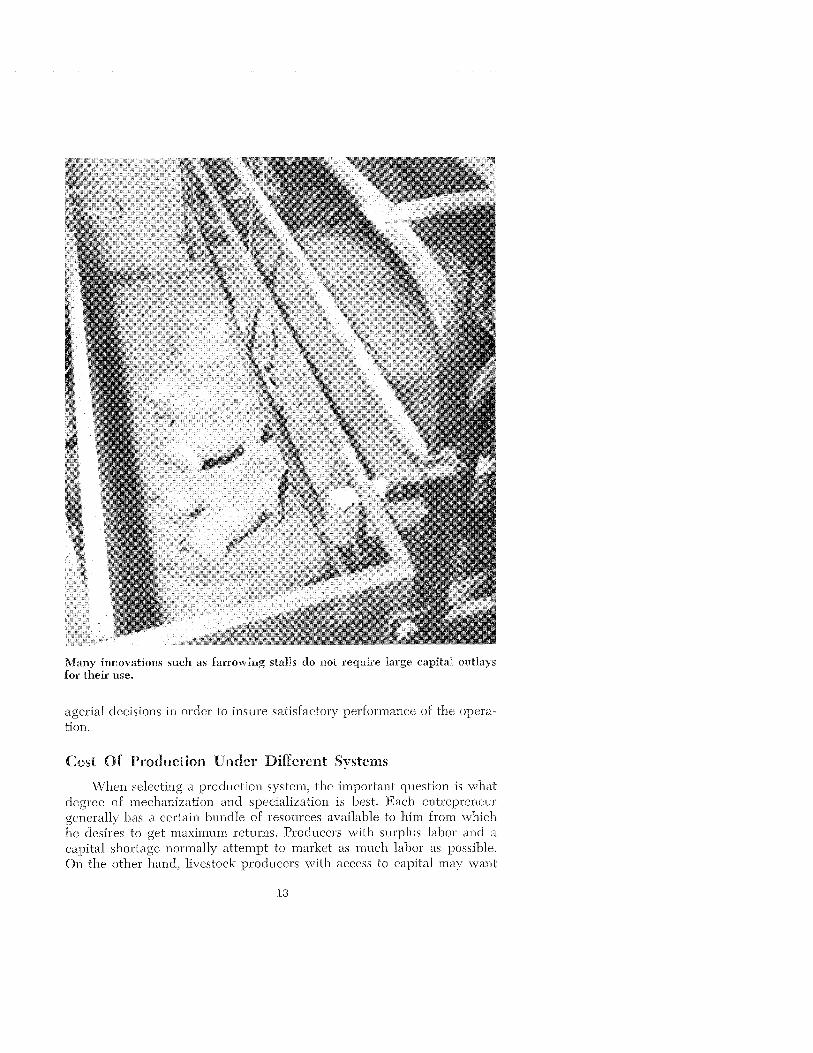
Many innovations such as farrowing stalls do not require large capital outlays for their use.
agerial decisions in order to insure satisfactory performance of the operation.
Cost Of Production Under Different Systems
When selecting a production system, the important question is what degree of mechanization and specialization is best. Each entrepreneur generally has a certain bundle of resources available to him from which he desires to get maximum returns. Producers with surplus labor and a capital shortage normally attempt to market as much labor as possible. On the other hand, livestock producers with access to capital may want
13

Table 3. Hog production costs under average farm conditions for a complete enterprise
Item Cost per cwt. of hogs produced
Capital costs: Buildings and equipment Interest ................... .
Labor ( $1.50 per hour) Power Health ... Breeding ............................................................................................................ . Feed" ............................ .
Total costs ..................................... .
Summary of costs and receipts
$ 0.79 0.22 2.70 0.11 0.70 0.11
10.10
$14.73
(one-man equivalent operations, 100 litters per year) Total receipts ................................... ...... .. . $23,814 Total costs ............................ $21,653 Net returns .... ............................. $ 2,161 Labor income .............. .................... ......... $ 5,911 Net return on investment . .. . 9.2 percent
"Feed prices used: corn $1.05 and protein $5 per cwt. Source: (49).
to extend their operations by increasing the number of hogs produced per unit of labor. The objective of this phase of the study is to determine how much income might be influenced by more intensive production systems compared to more conventional systems.
Average Farm Conditions-In order to get a benchmark for studying advantages of increased specialization in hog production, certain basic production costs must be established. On the basis of farm management studies, University of Minnesota economists ( 22) estimate the cost of producing 100 pounds of pork under normal farm conditions at about $14.73 (see table 3). This amount is for a complete hog operation where pigs are farrowed and finished on the same farm and the level of mechanization is relatively low. This cost estimate includes labor costs, sow costs, and replacement gilts needed for maintaining the enterprise.
Using the system described above, a one-man equivalent could farrow and finish about 100 litters per year. So one man working with hogs full time could raise and market about 700 hogs annually. Assuming a net selling price of $16.20 per cwt.,3 annual net return for the enterprise is $2,161, or an estimated labor income of $5,911 per year. Since there is a relatively low investment in facilities, the net return on investment after all expenses including operator wages and a market rate of interest on capital is 9.2 percent.4 In this case, the operator mainly sells labor because only a small capital investment is involved (see table 3).
3 For an explanation of net selling price, see appendix. • For an explanation of net returns on investment, see appendix.
14

Specialized Production Systems-Using the cost estimate for the average farm as a guide, the cost of production and returns on investment under higher levels of mechanization and intensification can be considered. Before moving to increased mechanization and a confinement system for hogs, a larger than average production unit is needed. Most hog producers interviewed agreed that an increase in volume and the use of multiple farrowing are almost essential in mechanized systems for maximum use of facilities, labor, and management.
In this analysis, costs and returns for two different levels of specialization are studied. A system of partial budgeting was used to determine costs and returns. Although budget figures may appear somewhat synthetic, actual case studies and research results were used to verify them. For an explanation of the costs used, see appendix tables A-1, A-2, A-3, and A-4.
Costs for each system are broken down into three categories: ( 1 ) capital requirements, ( 2) capital costs on an annual basis, and ( 3) current operating expenses. Because the larger unit is separate from corn production, an additional 10 cents a bushel are added to the corn price for handling and transportation.
Level of management is assumed to be approximately the same for both units.5 Each has a high degree of mechanization including automatic feeding and watering and partially slatted floors and lagoons for manure disposal. Building space includes provisions for preparation and storage of feed; space for farrowing, starting, growing, and finishing of hogs; and housing for the sow herd. To get maximum use of facilities, each unit is programmed for 12 farrowings per year.
One-man equivalent operations-The first system analyzed is a one-man equivalent, owner-manager operation. Although this unit involves a high degree of specialization and intensification, it is still considered part of a corn-hog farm. The total output is estimated to be 215 litters or 1,500 hogs marketed per year. The manager, working only with hogs, can provide all labor inputs needed for the hog operation. However, under normal conditions, some labor inputs are furnished by family or hired labor. The important aspect of this operation is the close tie between management, labor, and capital, as well as crop and hog production.
Total capital required for this hog operation is $69,500 of which $48,500 are for buildings and equipment and $21,000 for working capital. Some equipment costs for this system are taken as a prorated share of equipment currently used on the farm. The cost to produce 100 pounds of pork in this operation is estimated at $14.78. Assuming the average net selling price of hogs to be $16.20 per cwt., the net return for the enterprise is $4,470 per
5 Level of management refers here to the level of enterprise performance with respect to feed efficiency and the number of pigs sold annually per sow. For a detailed explanation of feed requirements, see appendix table A-1. It is assumed that each unit markets 14 pigs per sow annually at the same weight ( 210-pound average) and grade.
15

year. In terms of labor income, the hog enterprise returns an estimated $8,220 per year. The net return on investment after paying all costs, including a wage for the operator and a market rate of interest on capital used, is estimated at 6.4 percent (table 4).
Mechanized hog operations as small as half-man equivalent size appear possible with little loss in efficiency, particularly if existing facilities are converted and modernized. A minimum size unit of between 600 and 800 hogs marketed annually is almost essential for getting optimum use of labor and facilities. ( 66)
Largescale operation-The larger of the two systems budgeted is a highly specialized operation producing 10,000 hogs annually. The purpose of this analysis is to determine if there are economies in largescale units-those with capital and managerial requirements beyond that which most hog farmers can provide.
Table 4. Estimated capital requirements, operating costs, and returns for a one-man equivalent operation marketing 1,500 hogs annually
CAPITAL REQUIREMENTS" Buildings and equipment . Working capital
Total capital required
ANNUAL CAPITAL COSTS Buildings and equipment ( 15 percent per year for depreciation,
taxes, insurance, repairs, obsolescence, and. interest) Interest (working capital, $21,000 at 6 percent)
Total. annual capital cost .
COST $48,500
21,000 ---$69,500
ANNUAL COST
$ 7,275 1,260
$ 8,460
ANNUAL COST PER CWT. OF ANNUAL OPERATING COSTS COST HOGS PRODUCED Capital costs:
Buildings and equipment Interest on working capital
Labor (one man, 2,500 hours at $1.50 per hour)
Power and utilities Breeding .. Health Feed costs
Total operating costs .
$ 7,275 1,260
3,750 1,200
375 2,400
30,300
$46,560
SUMMARY OF COSTS AND RECEIPTS Total receipts . .. $51,030 Total costs $46,560 Net returns $ 4,470 Labor income $ 8,220 Net return on investment . . 6.4 percent
" For details, see appendix table A-2.
16
$ 2.31 0.40
1.19 0.38 0.12 0.76 9J}2
$14.78

Table 5. Estimated capital requirements, operating costs, and returns for a largescale hog operation marketing 10,000 hogs annually
CAPITAL REQUIREMENTS" Buildings and equipment ...................................... . Working capital ........................ .
Total capital required ............................................................................ .
ANNUAL CAPITAL COSTS
COST $293,250
164,000 $457,250
ANNUAL COST
Buildings and equipment ( 15 percent per year for depreciation, $43,988
9,840 taxes, insurance, repairs, obsolescence, and interest) ................. .
Interest on investment (working capital, $164,000 at 6 percent) Total annual capital cost ...... . $53,828
ANNUAL COST PER CWT. OF ANNUAL OPERATING COSTS Capital costs:
COST HOGS PRODUCED
Buildings and equipment ..... Interest on working capital
Labor and management: Manager ........................................ . Two herdsmen at $4,500 ..... . Three workers at $3,750 ..... . Bookkeeper ( part time ) ........ . Total ................................................. .
Power and utilities ................................ . Breeding Health ... H • •• • H ••••••••••••••••••
Feed costs ............................................ H •• H.
Total operating costs ..
$ 8,500 9,000
11,250 1,250
$ 43,988 9,840
30,000 7,500 2,500
16,000 214,200
$324,028
SUMMARY OF COSTS AND RECEIPTS Total receipts ............................................. H. $340,200 Total costs . ..................................................... $324,028 Net returns ........................................................ HH.. $ 16,172 Net return on investment ......................... 3.5 percent
" For details, see appendix table A-3.
$ 2.10 0.47
1.43 0.36 0.12 0.76
10.20 $15.44
This unit involves a complete separation of functions; ownership (capital) is separated from management and management is separated from labor. The system provides full-time employment for a manager and five men. This operation is independent of corn production; all equipment is specialized to the extent that no alternative uses exist for the various machines.
Total capital requirements of this unit are estimated to be $457,250, including $293,250 for buildings and equipment and $164,000 for working capital. The cost to produce 100 pounds of pork is estimated at $15.44. Assuming the average net selling price of hogs to be $16.20 per cwt., the net return for the operation is $16,172 per year. Net return on investment after paying all expenses, including the cost of hired labor and management and a market rate of interest on capital, is 3.5 percent (see table 5).
17

Summary Of Costs And Returns-From the standpoint of returns on investment and cost of production, the two smaller com-hog units have lower costs and higher returns to capital than the larger unit. According to this analysis, returns to the largest unit might present something less than an attractive investment to capital interests, particularly when risk of disease losses and management problems are considered. 6 In addition to problems directly related to management, the problem of price and income stability also exists.
A comparison of the average annual price of hogs, based on prices received by Minnesota farmers for 10 years ( 1955-64), and the cost of producing 100 pounds of pork in the two systems budgeted is shown in figure 3. Note that the price of hogs dropped below the cost of production in 6 out of the 10 years for the larger of the two operations.
The management necessary for meeting all problems associated with largescale hog production could take nearly all of the possible profit. Owners of largescale operations who were visited invariably agreed that labor and management problems intensify as operation size increases. As one largescale operator said: "An owner watches every corner and he usually does a better job. To get good men you must pay them high wages or give them a bonus, with no assurance of performance. If you pay out too much in wages, there's no profit in it."
INTRAPROCESS SPECIALIZATION
In the past few years, there has been a trend toward intraprocess specialization in hog production. The split between farrowing and finish-
Dollars per cwt. 20
19
)8
17
16
15 /
14 -----~
13
1955 1956
;'''\ // \ (Average annual price
// \ ,./ received by Minnesota farmers ,; \
I' \ I \
I \ I \
I \ I \
/ Cost of production- Largescale operation
Cost of production - One-~an equivalenl~peration \ "' \ / v"'
1957 1958 1959 1960 Year
1961
---- ....
1962 1963 1964
Figure 3. Average price of hogs received by Minnesota farmers, 1955-64, compared to production costs for two different systems. Source: ( 40).
• Russ Price, economic analyst, Consumers Cooperative Association, Kansas City, stated in an interview, "We shoot for 22 percent return on investment for expansion or new construction. I feel that most feed manufacturers will explore other possibilities before going into hogs." 0
18

Feeder pig production is a major enterprise for some midwestern farmers.
Courtesy of the Wisconsin Feeder Association
ing will probably continue. This premise is built on the ideas that: ( 1) the least-cost combination is achieved through specialization and ( 2) a oneman, corn-hog complex cannot achieve perfect specialization in all activities.
Feeder Pig Production The feeder pig industry grew rapidly in the past 10 years; this growth
has some significant overtones regarding this study. Feeder pigs are now available in relatively large numbers. With continued growth, intraprocess specialization might someday be as important in swine production as it now is in beef cattle or poultry.
The most plausible explanation for growth in the feeder pig industry revolves around the division of labor coupled with advantages of interregional specialization. According to the economic principle of comparative advantage: where there is a feed shortage but labor surplus, specialized feeder pig production may be most profitable. On the other hand, where there is an abundant feed supply but little extra labor, most profit may result from specializing in growing and finishing.
Management and disease problems now appear to be the major limiting factors to intensified feeder pig production. Some largescale feeder pig operations were started several years ago, but virtually all failed because of disease. Disease problems at this stage tend to multiply
19

faster than operation size. Then, too, progress in mechanization and automation at the farrowing stage has been much slower than in other production phases. Producing feeder pigs still tends to be more of an art than a science. Because of many unsolved technical problems, the separation of management and labor will likely come slowly in feeder pig production.
Although the typical feeder pig producer today has a relatively small operation, the industry is attracting specialists who turn out a large volume of feeder pigs.7 Under present levels of technology, the upper limit in size for feeder pig production may be limited to the owner-labor size unit or, in some cases, an owner-manager arrangement. Managerial skills and close supervision are critical to the operation's success. Some relatively efficient one-man equivalent feeder pig operations appear possible. One man working full time with hogs, in a highly automated farrowing and starting unit, could produce and sell an estimated 3,000 feeder pigs annually. 8
A one-man equivalent feeder pig operation was budgeted. Capital requirements for a modern multiple farrowing unit, large enough to produce and start 3,000 feeder pigs annuaUy, are estimated to be $63,000. This amount includes $42,000 for buildings and equipment and $21,000 for operating capital. Enough building space is provided for farrowing and starting baby pigs ( 12 farrowings per year), housing sows, feed preparation and storage, and automatic water and feeding equipment.
The average cost of producing a 40-pound feeder pig in this operation is estimated at $11.72. Annual costs of the entire operation are $35,160. Assuming a net selling price of $13 per head, net returns for the enterprise are $3,840 per year.9 The labor income is $7,590 per year. Net returns on investment after paying all expenses, including a wage for the operator and a market rate of interest on capital, is estimated to be 6.1 percent (see table 6).
On the basis of costs and returns developed in this study, the most profitable one-man equivalent hog operation is the farrow and finish operation rather than the specialized feeder pig operation. This finding suggests that specialization in feeder pig production is preferable to a complete hog operation only where feed grain is in short supply or where the entrepreneur's goals are other than profit maximization.
Finishing Operations
Problems in handling feeder pigs past 40 pounds are not nearly so acute as when they are below 40 pounds. Management requirements are lower and the feeding operation can be highly automated. The real difficulty of resource concentration at the finishing stage is related to securing
7 The average number of sows kept per farm by members of the \'lisconsin Feeder Pig Association was seven in 1962.
8 This number, estimated by T. E. Hazen, agricultural engineer, Iowa State University, was observed in two actual operations.
9 The $13 figure is the calculated price of 40-pound feeder pigs when the market price of barrows and gilts is between $16 and $16.50 (see table 8).
20
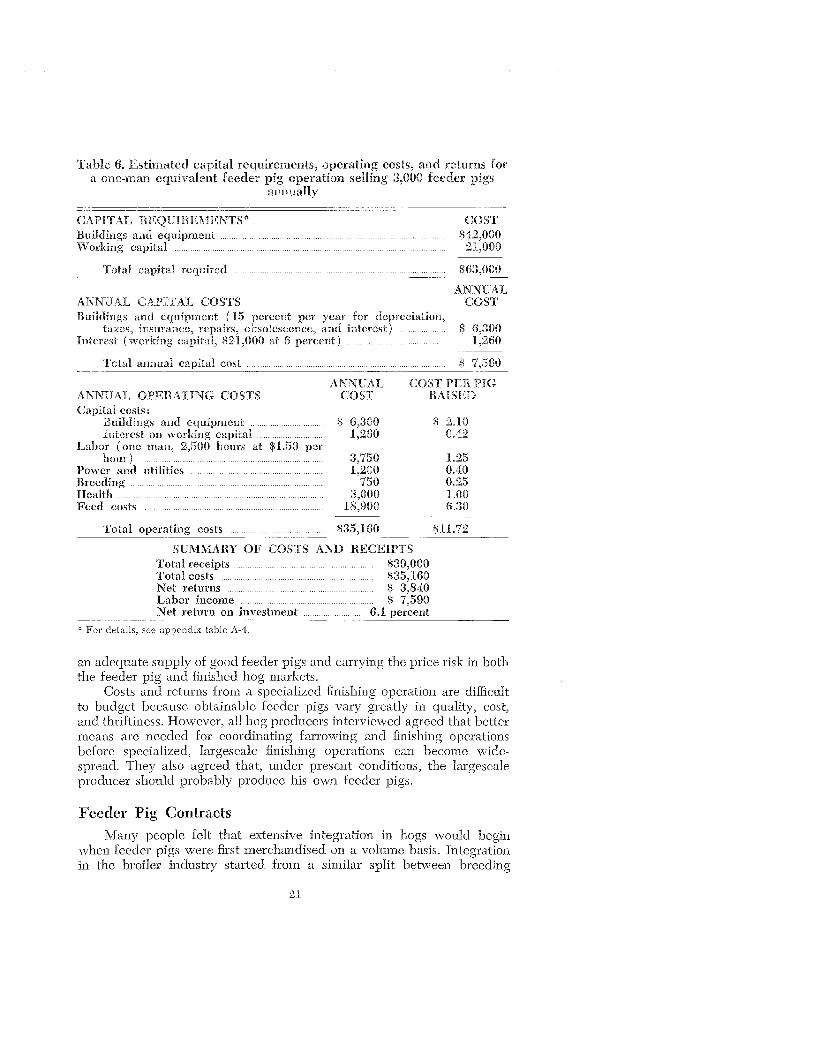
Table 6. Estimated capital requirements, operating costs, and returns for a one-man equivalent feeder pig operation selling 3,000 feeder pigs
annually
CAPITAL REQUIREMENTS" Buildings and equipment . .................... . ................................. .
COST $42,000
21,000 Working capital .................. . ........................................ .
Total capital required
ANNUAL CAPITAL COSTS
$63,000
ANNUAL COST
Buildings and equipment ( 15 percent per year for depreciation, taxes, insurance, repairs, obsolescence, and interest) ... $ 6,300
1,260 Interest (working capital, $21,000 at 6 percent) ........ .
Total annual capital cost ..... $ 7,560
ANNUAL OPERATING COSTS Capital costs:
ANNUAL COST
COST PER PIG RAISED
Buildings and equipment ................................ . Interest on working capital ............................. .
Labor (one man, 2,500 hours at $1.50 per hour) ............................................................................... .
Power and utilities .......................................................... .. Breeding ...................................................................................... . Health ............................................................................................ . Feed costs ................................................................................ .
Total operating costs ........................................ ..
$ 6,300 1,260
3,750 1,2()0
750 3,000
18,900
$35,160
SUMMARY OF COSTS AND RECEIPTS Total receipts ............................................................... $39,000 Total costs ..................................................................... $35,160 Net returns .................................................................. $ 3,840 Labor income ............................................................ $ 7,590 Net return on investment ........................... 6.1 percent
" For details, see appendix table A-4.
$ 2.10 0.42
1.25 0.40 0.25 1.00 6.30
$11.72
an adequate supply of good feeder pigs and carrying the price risk in both the feeder pig and finished hog markets.
Costs and returns from a specialized finishing operation are difficult to budget because obtainable feeder pigs vary greatly in quality, cost, and thriftiness. However, all hog producers interviewed agreed that better means are needed for coordinating farrowing and finishing operations before specialized, largescale finishing operations can become widespread. They also agreed that, under present conditions, the largescale producer should probably produce his own feeder pigs.
Feeder Pig Contracts Many people felt that extensive integration in hogs would begin
when feeder pigs were first merchandised on a volume basis. Integration in the broiler industry started from a similar split between breeding
21

flocks and the finishing operation. Nevertheless, only a limited amount of such integration has developed.
Original thinking was that feed manufacturers would put out groups of feeder pigs along with feed under various feeder contracts. For example, one feed firm offers a feeder contract to a selected group of farmers, each of whom signs a 3-year contract to finish 1,000 feeder pigs three times a year. The feed company furnishes pigs, feed, and medication while the farmer furnishes housing, equipment, and labor. The farmer gets the feeder pigs at 40 pounds and feeds to about 205 pounds. He receives 2 cents per pound of gain. So, for 165 pounds of gain, he receives $3.30. Although farmers under the program must have certain minimum buildings, they usually get financing easily from local bankers upon receipt of a 3-year contract. ( 43)
An economic analysis reveals that the contract may not be very profitable to either party, particularly if the farmer must provide modern finishing facilities. Net returns to the farmer are a function of the capital invested in buildings and equipment. However, total income from feeding hogs is $9,900 per year if the unit operates at full capacity for the entire year.
The feed manufacturer's profit or loss is more difficult to calculate (see table 7). In this example, 40-pound feeder pigs are assumed to cost $14 each delivered to the farm. Feed costs include preparing the feed at the mill and hauling it to the farm. In this case, the feed manufacturer has to receive an estimated net market price of $16.70 per cwt. for the hogs on the farm just to break even (see table 7).
Although feed manufacturers have had a strong incentive to integrate toward production in many enterprises in order to achieve a uniform flow of feed output, they have not done so to any extent with hogs. The absence of economic profits under existing conditions is perhaps the most logical explanation why they have not. By the time the feed manufacturer purchases feed grain, prepares rations, transports them back to
Table 7. Estimated cost to feed manufacturer per hog finished under feeder contract
Item
Feed costs" Health Interest Feeding costs (farmer) t Cost of 40-pound feeder pigl .
Total cost ... 34.20 --;-- 205 = $16.68 ( breakeven price)
Cost per hog finished, 40 to 205 pounds
$15.35 0.85 0.70 3.30
14.00
$34.20
" Feed costs were taken from an actual operation where hogs were fed under this type of program.
f Labor costs were calculated at 2 cents per pound of gain ( 0.02 x 165 pounds = $3.30) t Estimated price of feeder pigs delivered to the farm.
22

the farm, and adds administrative, labor, and other overhead costs, he cannot realize a profit even with good feed conversion efficiency. The combination corn-hog farmer has an advantage since most feed and other inputs are on his farm.
Managers of one large midwestern feeder pig cooperative were interviewed regarding the outlet for feeder pigs. 10 Their typical sales were made on a regular basis directly to farmers seeking a market for surplus feed grain and labor. They reported few sales to nonfarm groups and practically no repeat sales to them on a regular basis.
Lack Of Coordination
Lack of coordination exists between feeder pig producers and growing and finishing operations. Achieving joint equilibrium in these two segregated processes through normal marketing channels results in misallocation of resources. The economic feasibility of increased resource concentration at the growing and finishing stage is lagging behind the technical feasibility of finishing feeder pigs on a volume basis. Less than optimal size finishing operations stem primarily from: ( 1) price and quality uncertainties and ( 2) problems associated with concentrating many feeder pigs from several different sources under open market conditions.
Better coordination of the two processes could be achieved with contractual agreements. A profit-sharing arrangement between feeder pig producers and finishers was tried on a limited basis. The feeder pig pro-
Table 8. Profit-sharing contract plan for a feeder pig producer and a finishing operation~:>
Quoted market price of finished hog at designated point
$12.50 and under . 12.55 to 13.00 13.05 to 13.50 13.55 to 14.00 14.05 to 14.50 14.55 to 15.00 15.05 to 15.50 15.55 to 16.00 16.05 to 16.50 16.55 to 17.00 17.05 to 17.50 17.55 to 18.00 18.05 to 18.50 18.55 to 19.00 19.05 and over
Value of 40-pound feeder pig
$ 9.00 9.50
10.00 10.50 11.00 11.50 12.00 12.50 13.00 13.50 14.00 14.50 15.00 15.50 16.00
" This program was developed and used by a midwestern company to coordinate feeder pig production with finishing operations.
10 Personal interview with personnel of the 'Nisconsin Feeder Pig Association, Frmicis Creek, vVisconsin, May 29, 1962.
23

ducer agreed to supply a specified number and quality of feeder pigs to the finishing operation on a contract basis. The price of feeder pigs was based on a formula or a percentage of the final market price of the finished hogs. Feeder pig producers were usually paid $9 per feeder pig at delivery time and the balance when the market price of the finished hogs was established. The basic plan is shown in table 8.
Contract marketing arrangements of this type could increase resource concentration at both feeder pig and finishing stages. The feeder pig producer could hope to gain from sharing in higher profit prospects by supplying thrifty, high quality feeder pigs. The finisher could gain from having a constant supply of uniform, high quality feeder pigs. Transfer costs between the two activities could be minimized. In general, productive resources could be allocated more rationally if some uncertainty inherent in the present market system is removed.
The final degree of separation between farrowing and finishing processes will depend on the profitability of splitting the two operations. Future largescale finishing operations may seek dependable sources of feeder pigs by integrating with several feeder pig producers. The two operations could be linked together on a profit-sharing basis. Or, if hog prices become more stable than at present, the two groups could negotiate for an annual contract price for feeders.
Corn-Hog Split Regional production shifts are often associated with vertical integra
tion. For example, the broiler industry is less oriented to consumption and feed production since becoming extensively integrated. However, hog
Figure 4. Percentage distribution of U. S. hog production by regions for 1954, 1959, and 1964. Source: USDA statistical publications.
24
Cost per cwt. $0. 80
$0.70
so. 60
$0.50
$0.40
$0.30
$0.20
---
" Minnesota truck rates
------50
Increased feed costs per cwt. goin (_
Transportation costs per 100 pounds feed grain*
---------~-------------100
Miles 150 200
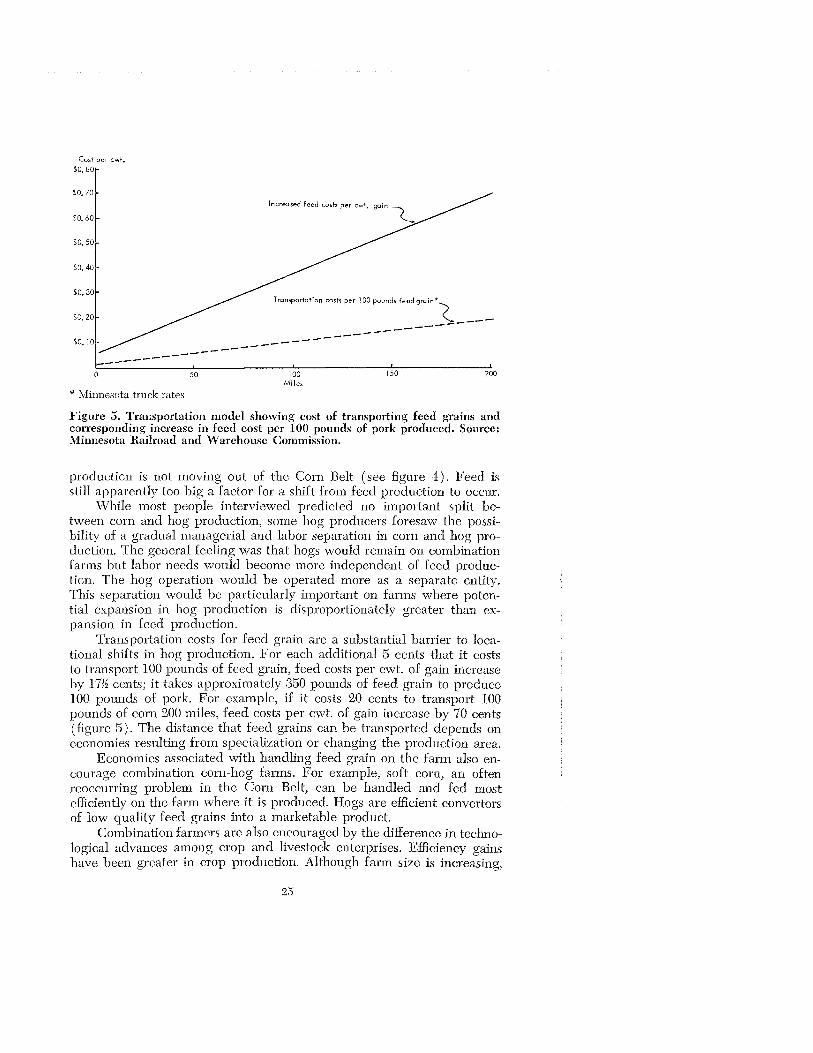
Figure 5. Transportation model showing cost of transporting feed grains and corresponding increase in feed cost per 100 pounds of pork produced. Source: Minnesota Railroad and Ware house Commission.
production is not moving out of the Corn Belt (see figure 4). Feed is still apparently too big a factor for a shift from feed production to occur.
While most people interviewed predicted no important split between corn and hog production, some hog producers foresaw the possibility of a gradual managerial and labor separation in corn and hog production. The general feeling was that hogs would remain on combination farms but labor needs would become more independent of feed production. The hog operation would be operated more as a separate entity. This separation would be particularly important on farms where potential expansion in hog production is disproportionately greater than expansion in feed production.
Transportation costs for feed grain are a substantial barrier to Iocational shifts in hog production. For each additional 5 cents that it costs to transport 100 pounds of feed grain, feed costs per cwt. of gain increase by 17:f cents; it takes approximately 350 pounds of feed grain to produce 100 pounds of pork. For example, if it costs 20 cents to transport 100 pounds of corn 200 miles, feed costs per cwt. of gain increase by 70 cents (figure 5). The distance that feed grains can be transported depends on economies resulting from specialization or changing the production area.
Economies associated with handling feed grain on the farm also encourage combination corn-hog farms. For example, soft corn, an often reoccurring problem in the Corn Belt, can be handled and fed most efficiently on the farm where it is produced. Hogs are efficient convertors of low quality feed grains into a marketable product.
Combination farmers are also encouraged by the difference in technological advances among crop and livestock enterprises. Efficiency gains have been greater in crop production. Although farm size is increasing,
25

Percent of man hours 90
70
50
30
]QL---19~1-0 _______ l9~2-0 ______ l~9~3-0----~l~94~0~----~l~95~0~----7.19t6~0--~~l~970
Year
Figure 6. Percent of man hours spent on feed crops and meat animal production, 1910-62. Source: (54).
labor requirements for crop production are decreasing. Due to increased mechanization, many farmers now have more surplus labor during the cropping season than they did formerly. So year-round hog production is now more compatable on many farms than it was 20 years ago (see figure 6) .11
Actual input-output studies fail to show advantages of a corn-hog split. For example, a recent farm management study ( 23) shows that returns on labor for corn are greater than for other enterprises. The study suggests that labor would likely be allocated to crop production first, with the residual going to livestock production. A general complex of enterprises associated with corn production appears to be the most profitable system on most farms. The study also points out that highly specialized hog operations are not likely, in terms of profits, to displace more general management systems.
TECHNOLOGICAL LIMITATIONS TO LARGESCALE HOG PRODUCTION
Although Inany technological gains have been made in hog production, management is still the major limiting factor. The ultimate potential for specialization and largescale hog production may not be as great as in other industries. While technical problems unique to hog production
n Between 1945-62, production per man hour in feed grain production increased 425 percent. During the same period, production per man hour in meat animal production increased only 43 percent. See (54).
26

may not necessarily prevent integrated activities, they could delay, limit, or alter the degree and type of integration taking place.
Present management problems in swine production are concentrated at the breeding and farrowing stages. Important gains in these areas probably will be slow. Success with sows and litters requires a high level of management or "the eye of the master." The incubator and the nature of the reproductive process for poultry probably allows more specialization and flexibility in the poultry industry than in hog production.
At the same time, gains in labor and feed conversion efficiency have been greater for poultry than for meat animals in general. Output per man hour in meat animal production increased only 43 percent between 1945-62, as compared to 275 percent for poultry. Feed conversion efficiency gains have been about 50 percent greater for broilers than for hogs over the same period. (54)
One important technological gap for largescale hog production is treatment of disease problems. AU. S. Department of Agriculture study ( 45) estimates that swine losses attributable to diseases equal $500 million per year. Economic losses from disease are not restricted to death alone but also to reduced feed efficiency and cost of medication.
The latest technological advance in disease control is the SPF hog. A special hysterectomy technique used in delivering SPF pigs breaks the cycle for certain diseases such as atrophic rhinitis and virus pig pneumonia. Although the SPF program could be an important start toward disease control, little is known about its full economic potential.12
In the past, progress in improving breeding stock was accomplished by selection and natural breeding. Perfection of artificial insemination could greatly accelerate this program; researchers believe that artificial insemination in hogs will be forthcoming. ( 48)
Perfection of artificial insemination could greatly change the industry. It would mean increased use of superior boars and, therefore, progress toward quality control and product standardization. Breeding sows artificially would reduce certain contact diseases. Artificial insemination could affect the industry's technical and market structure, particularly from the standpoint of merchandising quality pork on a volume basis.
Significant technological gains have been made in hog production. Nevertheless, assembly line production or pork factories probably will not be important without improved means for: ( 1) controlling diseases, ( 2) synchronizing the estrous cycle and using artificial insemination, ( 3) mechanizing farrowing and starting processes, and ( 4) increasing the number of pigs sold annually per sow.
But even with these developments, integration would not necessarily become important unless adoption of innovations requires unique managerial skills and high capital-using techniques-until hog production can be classified as a science and operations can be entrusted to hired labor.
J.2 Robert R. Burr and Charles Beer ( 12) found that SPF hogs may have some advantages. But, farmers who have no hog disease problems and follow good management practices may find no increase in profits from using SPF breeding stock. -
27

Market Forces Affecting Vertical
Integration in Hogs
In the past 3 decades, the market structure of the livestock and meat economy has changed greatly. The most significant changes taking place are:
e Growing capacity and increased competition for sales among farm input suppliers.
e Growing size and purchasing power of retail chains.
e Decentralization in livestock marketing and processing.
• Development of cooperatives and bargaining associations to improve producer bargaining power.
This chapter analyzes these changes as they relate to vertical integration in hogs. Structural elements used for examining motivational forces underlying integrated activities are: ( 1) number of buyers and sellers in the market (concentration), ( 2) degree of product and/ or service differentiation, and ( :3) conditions of exit and entry.
Specialization and technological developments are causing major market structure changes in the swine industry. Many diverse elements make up the complex whole in pork production and marketing (see figure 7). While specialization may increase efficiency, it also changes the interdependence among firms and adds to the difficulty of coordinating various vertically related processes. Therefore, the incentive for integra-
Auxiliary services and suppliers
Feed suppliers
Building and equipment
manufacturers Feed
Prime feed producers
Drug wppliers
Credit agencies
Health services
Educational institutions
Research -public and private
manufacturers
Local dealers
Figure 7. Flow chart showing the vertically related processes in the swine industry complex.
28

Million tons 45
Figure 8. Annual production of U. S. feed manufacturing industry, 1948-63. Source: American Feed Manufacturing Association Reporting Service, Market Research Department, Chicago, Illinois.
tion is stronger in the marketing sector of the hog-pork industry than in the production sector.
FORWARD INTEGRATION BY SUPPLIERS
Agricultural marketing and supply firms are constantly searching for programs that will give them a market advantage. Such action tends to favor vertical integration in agriculture. Firms supplying inputs used in agricultural production integrate forward to gain advantages in selling their products; processors and distributors generally integrate backwards to gain advantages in supply procurement. The incentive to integrate varies by commodities and production areas. ( 37)
Because of the industry's tremendous productive capacity, the greatest pressure for integration comes from firms supplying agricultural inputs. All suppliers are under pressure to integrate toward production, particularly the feed industry in livestock and poultry production. Feed companies originally became interested in integration to expand sales. They had excess capacity and needed increased volume to reduce costs. Growth in the feed industry between 1948-63 is shown in figure 8.
The three main areas in which feed firms can reduce costs are: ( 1) buying inputs, ( 2) manufacturing, and ( 3) selling outputs. Most feed manufacturers accomplish the first two but encounter difficulties in balancing sales with optimal purchasing and manufacturing levels.
To alleviate the excess capacity problem, some feed manufacturers integrate directly into livestock and poultry production. Practically all sell feed on contract. Where feasible, direct integration is preferred because it provides a captive outlet and reduces selling costs. However, due
29

to the large investment, high risk, and low returns of direct integration in hogs, most feed manufacturers rely heavily on contract sales programs. Sales and production contracts not only increase volume for many feed firms, but also increase manufacturing efficiency by allowing an effective production and distribution system.
Market Structure Of The Feed Industry
Although there are many feed manufacturers in total, the industry's structure does not conform to a competitive industry. The industry has some oligopolistic characteristics, particularly at the local market where hog producers generally can choose from only a few feed brands. In this market, actions of any one firm greatly affect sales of other firms, thereby causing high interdependence.
Rivalrous activities in feed sales directly relate to the excess capacity problem in feed manufacturing. And excess capacity and the need to expand sales are just as important to small local feed manufacturers as to large ones. To compete in local markets and to reduce costs, large feed manufacturers are moving into direct retail selling.
Rivalry among feed manufacturers can be expressed by: ( 1) price competition, and ( 2) product and/ or service differentiation (non price competition). Differentiating a feed on a product basis is becoming increasingly difficult. Experiment stations release too much information for any one firm to have an advantage for long in feed formulation. Feed manufacturers interviewed agreed that differentiating feeds through brand name advertisement and formula changes alone is losing ground as a means of establishing consumer loyalty.
Price cutting is not a satisfactory solution either. It leads to price wars and, in the longrun, to reduced profits for all. Feed firms in this market structure generally prefer competitive means other than price alone-one means is vertical integration. In many respects, use of contracts is a sales innovation used to give the individual firm a market advantage or to enhance its competitive sales position.
To circumvent the problem of price competition, feed manufacturers have a variety of sales techniques. Some offer package programs including credit for feed and other supplies, services, and technical advice. Some feed dealers are able to sell feed and other supplies under contract at full retail prices by offering a minimum of fringe benefits. ( 21)
Currently, feed manufacturers and other suppliers for hogs use three basic sales and production contracts: ( 1) feeder pig contracts, ( 2) breeding stock and building and equipment leasing contracts, and ( 3) contract financing. The first two contracts are relatively formalized agreements; the latter is a "weak" form of integration.
Feeder pig contracts are perhaps the most formal contracts now used in hog production. Under this contract the feed manufacturer essentially hires a farmer to finish feeder pigs. By supplying most inputs and assuming virtually all price and production risks, the integrator can almost completely control the hog operation. Transfer costs between certain pro-
30

duction stages are minimized because resources are transferred through internal administration rather than the open market. However, this type of vertical integration has been limited by the lack of a constant supply of good feeder pigs at reasonable prices.
The other kind of formal contract is the leasing contract. These contracts began with leasing bred sows that were suppose to help farmers establish good strains of meat-type hogs. But recent contracts cover buildings, equipment, and other production items. Some contracts have comparatively rigid provisions for both parties. By providing a certain portion of production capital, the integrator often gains considerable control over management decisions of the hog operation and establishes a captive outlet for feed and other supplies. Although the integrator may assume some production risk, practically all price risk is left with the producer.
All feed manufacturers and suppliers interviewed offer contractual arrangements for financing feed and other production items. Most of these contracts are informal agreements under which the farmer is extended credit for purchased inputs. The contracts usually specify the brand and type of input to be used, feeding program to be followed, and conditions of repayment. But little direct supervisory control over the hog operation is included.
Feed manufacturers generally agreed that contracts are used primarily to meet competition. Some dealers maintained that many feeders prefer such financing because it provides a convenient and prearranged credit source. Sales and service contracts are essentially another means of differentiating a commercial feed for feed manufacturers and dealers.
A survey of midwestern feed sales made in 1959 showed that only about 13 percent of the hog feed was sold on a contract basis. Of this amount, less than 1 percent of the sales involved risk-sharing contracts. ( 47) Integration in hogs by feed manufacturers probably will never be as great as for poultry. Most of the feed fed to poultry comes from the feed manufacturer; the same situation does not exist with swine. Moreover, specialized and interstage coordination apparently are not as important for hogs as for poultry. Then, too, most corn-hog producers can get bank credit and, therefore, avoid the higher cost of contract credit.
Future Considerations
In the transitional period of increasing specialization in hog production, many trial and error systems for producing hogs will appear. Resource concentration will be important in this change. The shift in "input mix" will make capital increasingly significant in hog production. To avoid some capitalization problems, potential largescale hog producers may want to form new corporate structures which may or may not be part of an existing business.
Operational efficiencies from preparing, mixing, and distributing feed in one continuous unit close to the feeding point could adversely affect existing feed plants. On-site construction of new feed preparation facili-
31

ties allows the design, location, storage, and size of the feed unit to be tailored to the hog operation. Certain operational difficulties may be encountered where feed-processing equipment is located far from the farm. Therefore, many future largescale hog operations may develop as "new businesses" rather than as part of an existing feed firm. However, feed manufacturers will want to remain a part of these operations in order to establish outlets for premixes and protein concentrates.
Many present largescale cattle feeding operators may also want to expand and diversify their operations by adding hog production and feeding, especially if technical difficulties of confined hog systems are solved. Addition of a hog unit would help level out labor requirements and contribute toward full utilization of feed manufacturing facilities and managerial skill. Furthermore, price risk is reduced by diversifying across commodity lines. Some feeding operations may attain sufficient size to integrate into related activities such as processing and distributing.
But, if largescale hog operations can greatly reduce costs and improve the marketing position of hog producers, farmers may integrate horizontally and form cooperative hog farms. Cooperative feedlots are now used for fattening cattle.
BACKWARD INTEGRATION BY PROCESSORS AND RETAILERS
Changes In Retailing
Numerous changes are occurring on the output procurement side of the market for agricultural products. The most significant change has been the power build-up in the retail food trade. More than two-thirds of the retail food business by volume is done in less than 10 percent of the retail stores. For example, estimates are that 15 accounts handle over 80 percent of the volume for major meatpackers in the Chicago sales area. ( 36) The result is an oligopsonistic market structure giving food retailers increased control over delivery conditions and quality and quantity aspects of food products.
Vertical integration is not new to retail outlets. They are integrated into many food product lines, particularly where supplies are unreliable ox quality and timing are critical. However, integrated activities initiated by chainstores are usually discontinued when a dependable supply of uniform quality is available in normal market channels. Retail buyers are turning to specification and the "offer-and-acceptance" method of procuring fresh meats.
A few retail outlets have livestock feeding and meat processing facilities. However, Mueller and Garoian ( 41) found little vertical integration by chainstores in meat packing. Annual reports filed with the Packers and Stockyards Division, USDA, between 1959 and 1963 show that no hog processed in retail owned packing plants came from their own feeding operations. Most chains find it difficult to operate and utilize the total output of an efficient size packing plant.
32

A recent survey ( 46) of retail meat procurement departments found that virtually all were interested in developing reliable means of specification buying of fresh meats. Retailers generally favored use of federal grades. Nevertheless, they advocated a close working relationship between the grower, packer, and retailer in order to achieve efficiency in marketing and to maintain consumer satisfaction.
Retailers constantly strive to develop procurement and merchandis· ing programs that individualize their stores. Consequently, they probably would not want a full line of consumer-ready, prepackaged fresh pork cuts to come to their stores directly from an established packer, particularly if the packer insisted upon leaving his own brand name on the products. ( 46) However, improved means for specification buying of fresh pork have made it possible for retailers to develoo their own special oi private label lines. A lack of meat-type pork is a limiting factor.
Market research work on meat-type pork probably does not yet allow reliable merchandising decisions. Recent consumer preference studies ( 71) do not provide conclusive evidence that consumers will pay enough more for meat-type pork to allow for differentiating it from the less uniform or regular pork cuts. So, retailers are reluctant to develop a special line of pork products or to provide sufficient showcase space for handling both a premium and regular line. However, a few retailers have started merchandising "store branded" fresh pork products purchased to specification for trim and meatiness.
Hetailers are not likely to integrate pork production and processing without some distinct economic and market advantages. At present,
Some retailers are merchandising fresh meat-type pork products purchased to specification for trim and meatiness.
Courtesy of the National Hog Farmer.
33

little incentive apparently exists to integrate or contract for private label brands of pork. The superior buying power of chainstores makes integration unlikely. However, just the threat of integration by retailers could force increased quality and volume control in the industry.
Integration By Meat Processors
In recent years, the balance of bargaining power in the meat economy shifted from the processing sector toward the retail segment. For one thing, national processors tended to lose their differentiated status, particularly on fresh meat volume. Increased integrated wholesaler-retailer procurement resulted in less full line national meat processing and more processing specialization. Most retail distributors now purchase fresh meat from many sources on a specification basis; consequently, considerable decentralization exists in the meatpacking industry. The number of meatpackers in the United States almost tripled in the past 30 years. ( 36)
Volume Control-It was once thought that processors would use contracts to achieve a coordinated flow of hogs from farm to market. To date, the pricing system performs this balancing role; there is little evidence of any contracting. A few packers may have informal agreements with certain producers offering premiums for the direct delivery of meat-type hogs, but usually there is no written agreement about price or delivery date.
The packers surveyed indicated that the major incentive for contracting is control over the time and volume of hogs marketed in order to reduce processing costs. Packers face the daily problem of fitting the available hog supply to a plant's capacity. This problem has heightened in recent years by labor contracts guaranteeing a 36-hour week.
Percent of annual overage 120
115
110
105
90 --._.. // --_., 85
.,...-~----·\ 1947-55 / \r-.l
,/ \11- ~ / \
/ \
v; 1956-64
\ \
~~~47~--~1794~8----~19t4~9----~1~95~0~--~1~95~1----~1~95~2~--~1~95~3----~19~54~--~19~55 1956 1957 1958 1959 1960 1961 1962 1963 1964
Year
Figure 9. Index of U. S. hog marketings, 1947-55 and 1956-64. Source: (58).
34

While most packers indicated a problem of equating hog purchases to plant capacity during certain periods, none thought the problem serious enough to warrant contracts. And the problem declines as marketings level out both seasonally and cyclically. Year-to-year changes in the number of hogs marketed have been much less in the past 9 years than in the first 9 years following World War II (see figure 9). Increased multiple farrowing and specialized producing units may mean an even steadier flow of market hogs in the future.
Procurement problems are not limited to timing and volume alonethere are also procurement costs. Contracts with producers are considered one means of reducing procurement costs. But their potential for substantially reducing costs is limited. The cost of procuring hogs accounts for only about 4 percent of the total operating costs of buying, processing, and distributing fresh pork or about 10 cents per cwt. of live hog.13
One packer stated that he had considered using contracts with producers for scheduling a hog slaughtering system. However, he decided against it because of bookwork, pricing, and scheduling problems. His plant, with a capacity of 10,000 hogs per week, would have required 2,600 contracts-assuming each producer supplied an average of 200 hogs per year.
Quality Control-Packers may eventually want to increase their control over the type and quality of hogs produced. Some packers are doing this now in various ways. Contracts could develop if special "controlled quality" merchandising programs are used, particularly if such activities would help packers maintain brand name identification through to the consumer. At present, the packing industry is more volume than quality control oriented.
As the percentage of meat-type hogs produced grows, efforts to differentiate meat-type pork products probably will increase. Lack of meat-type hogs and the problem of marketing low quality products have been limiting factors. Most packers currently sell loins from meat-type hogs at a premium over regular loins, but the price differential is based mainly on cutout value.
Most packers interviewed saw no immediate need for contracting to improve quality. One packer said: "If we had a strong demand for a certain high quality, meat-type product and could not get an adequate supply of the right kind of hogs for this product through the normal marketing channels, we might contract to get them. Under present market conditions, we would have little incentive to integrate toward production for quality control."
Even if packers did want contracts, hog producers might not accept them. Survey studies show that farmers generally are adverse to contracts, particularly certain advance price contracts. Farmers generally
13 Operating costs, as used here, do not include the cost of the live hog. Procurement costs include only the cost of buying hogs. For a more complete treatment of meatpackers' costs, see ( 63) .
35

want a premium over the expected open market price before contracting. This feeling could greatly deter use of contracts. ( 37)
The advent of futures trading in hogs could help correct some contracting problems. Hedging opportunities in live hog futures would provide a basis for forward pricing contracts between producer and packer by transferring risk of loss to a third party. While such contracts may not necessarily increase prices paid to farmers, they would help stabilize incomes and product How.
Price Discrimination-Packers might gain some market advantages by controlling part of the total supply. A packer producing some of his own hogs could possibly use price discrimination. Theoretically, a controlled portion of the supply would provide a flexible reserve to help smooth irregularities in purchased supplies.
Packer-owned feeding operations are not new. According to Packers and Stockyards Division data, approximately 8 percent of the commercial fed cattle slaughter and 4 percent of the commercial sheep slaughter in 1963 came from integrated feeding operations of meatpackers. However, the same report shows that only one-twentieth of 1 percent ( 44,500 head) of the total commercial hog slaughter came from feeding operations of packers. The report shows little if any direct integration in hogs by packers. (59)
Vertical integration in livestock feeding by packers is probably more a matter of short-term inventory adjustment than price discrimination. Most integrated activities are in cattle and lambs. Lambs are fed primarily as a means of handling underfinished animals coming to market and of insuring future supplies of fat lambs. Cattle feedlots are maintained to fill orders when a supply of specific cattle is not readily available. Forces favoring integration in hogs do not now appear directly related to either condition.
One packer said: "We have considered several schemes to insure a constant supply of hogs, but in each case we decided that the risk premium was too high. There is only a slim chance that our hogs would be ready in the right amount when needed, and a good chance that they might add to a surplus. The knowledge about future supplies has been about equalized."
Packers interviewed expressed a definite preference for keeping hog marketing within a price-regulated market system rather than contracts with producers. Moreover, there is little chance for direct integration on the selling side; the 1920 antitrust consent decree prohibits major packers from integrating into meat retailing. However, use of packerretailer meat sale and purchase contracts has been increasing.
The present market structure for pork does not favor extensive vertical integration by processors. The atomistic market structure at the farm level virtually assures packers of getting hogs at or near the cost of production in the long run. Because of his narrow operating margin, the packer can hardly offer risk-sharing contracts in return for increased control over quality and volume. Under open market conditions, the
36

farmer bears most of the unfavorable aspects of a fluctuating market. The packer's ultimate goal is a favorable marketing margin rather than stable prices for hogs.
ROLE OF COOPERATIVES Market structure changes are increasing producers' interests in im
proving their bargaining power when selling livestock. The shift in market power has become increasingly apparent in recent years as the market has decentralized at the farm level and concentrated at the buying level. About 61 percent of the market hogs are now sold direct from farm to slaughter. (59)
Decentralization in hog marketing, and its effect on prices, prompted many producer groups to evaluate alternative methods of assembling and marketing hogs. Some cooperative marketing associations have new contract marketing programs aimed at coordinating the breeding, feeding, and marketing of high quality feeder pigs and market hogs. The major objectives of contract marketing are to:
1. Reduce marketing costs.
Some cooperatives are developing contract marketing programs for pooling and marketing meat-type hogs.
Courtesy of the Farmers Cooperative Service
37

2. Promote stability in the supply and price of hogs.
3. Force price competition-particularly for meat-type.hogs.
4. Provide previously nonexistent marketing services.
Since hogs are not subject to the same geographic and entry barriers characteristic of many other commodities produced under contract, these marketing associations concentrate on marketing efficiency and product andjor service differentiation.
Producer interest in contract marketing developed from dissatisfaction with prices received for meat-type hogs. Early organizers felt they could gain by pooling hogs and marketing through tightly controlled associations. By contracting with members for a committed supply of hogs, associations can guarantee a specified volume and quality on a predetermined delivery schedule. This type of organization has a strong bargaining basis.
In order to bargain effectively, some cooperatives have their own processing facilities. Others have arrangements for custom processing. Technological and market structure changes in the meatpacking industry have greatly affected forward integration into pork processing. Formerly, a super sales structure was needed to sell meat products. Selling by description and product specification opens distant markets to relatively small processors. Smallscale processing plants are being built, even with the surplus capacity in meat processing nationally. These small compact plants are thriving because of efficiency. (52)
The potential success of cooperatively operated local assemblyslaughter plants may be excellent, particularly where cooperative members agree to a rigid quality improvement program and scheduled slaughtering. The success of these associations may depend on whether the end products can be differentiated in the market. Figure 10 illustrates a farmer-controlled cooperative marketing association for hogs.
Cooperatives now handle only about 15 percent of the total volume of livestock marketed; larger percentages are needed for effective bargaining. Although contract marketing accounts for only a small part of the total volume handled by cooperatives, contracts should play an increasingly important role in future hog marketing programs. However, changes in attitude toward contracts may be needed. A new relationship between producers and their cooperatives will be necessary. Strict requirements over production and marketing, as well as some discipline over member-producers, must be established if gains are to result.
Contract marketing of hogs through cooperatives will grow only if members can achieve economic gains. The important unanswered questions are how much more packers can pay for a known daily supply of meat-type hogs and how much more it will cost members to produce and deliver hogs meeting contract specifications. Although some problems still must be worked out, contracts probably will become more important in cooperative marketing than they are now. ( 20)
38

Retailer (brand name
lobe/)
I Carcass sales
Cooperative Private packing plant packing
(coordinator) plants
~ I I Custom killing
Cooperative I marketing association
(coordinator)
(Alternative)
Testing Member- Private grower- r- suppliers
station finishers services
I Seed Member- Member- Cooperative stock - feeder pig market hog t--'- suppliers
producers producers producers services
Figure 10. Farmer-controlled integration in hogs through cooperative production and marketing associations.
SUPPLY AND DEMAND FOR HOGS
Barriers To Entry
Characteristics of the supply and demand for pork greatly affect the entry of new firms and vertical integration in hog production. The demand for pork is inelastic; the income elasticity is lower than for any other meat. Per capita pork consumption has been decreasing in spite of decreasing retail prices and increasing efforts to improve quality. After World War II price controls were removed, per capita consumption trended downward from 70 to 64 pounds between 1947-64. At the same time, the deflated retail price of pork declined nearly 26 cents per pound.
Therefore, there is not an expanding market into which new firms may enter. Successful entry requires an almost equal displacement of existing firms if prices are to be maintained. Potential hog producers must recognize that the demand for pork relative to other meats is decreasing and that price elasticity for hogs at the farm level is low. For example, the coefficient of price flexibility for hogs is estimated to be -2.22. So a 1-percent change in supply would bring about a 2.22-percent change in
39

Price of hogs
$]6
Volume of output
s
Figure 11. Programmed supply response for hogs in the Lake States considered to be optimal at alternative prices. Source: ( 66).
the hog price. Even a small aggregate expansion in hog production could bring serious results. 14
To evaluate the potential of entry or vertical integration in hog production, the supply response of existing firms must be considered. A Lake States agricultural adjustment study was used for predicting the supply response of existing hog producers. This study indicates a "kinked" output response curve for hogs. Using linear programming, the research shows that when hog prices move above $16 cwt., existing hog farms can profitably shift resources to hogs and expand output. The supply function for hogs tends to become elastic above $16 per cwt. (figure 11).
In effect, if hog prices move above $16, present hog producers would likely adopt new technology and expand hog production. But implications are that unless the entire cost and demand structure for pork changes, hogs prices are not likely to stay much above $16 in the Midwest. Potential entrants have to face this supply-price structure. The potential existing capacity for producing hogs virtually assures that price will equal the average cost of production in the long run.
Barriers To Exit
The fixity of resources in agriculture presents an exit barrier to farmers currently producing hogs. Some producers will produce hogs as long
14 The coefficient of price flexibility is the reciprocal of the more commonly used price elasticity of demand. The price elasticity for hogs at the farm level is estimated to be -0.45; thus, 1/-0.45 = -2.22. See (8).
40

as they can at least cover their direct or out-of-pocket variable costs because of their inability to liquidate fixed assets. This situation results from the low salvage value of fixed capital assets and the lack of alternative uses for them. Hogs still provide a good market for surplus family labor and farm-produced feeds. In many cases, opportunity costs, rather than market prices, allocate production factors.
The family farm structure in agriculture actually perpetuates the corn-hog complex. The difficulty of horizontal expansion in crop production compels the farmer to maintain his farm's vertical size. Land in total is plentiful but, on an individual farm basis, it is scarce. The land shortage on individual farms often leads to underemployment of labor. Due to the lack of off-farm employment opportunities, many commercial family farmers will accept greatly reduced margins before leaving the hog business.
If all production factors were completely mobile and divisible, increased specialization in hogs would likely occur. Due to the "lumpiness" of such resources as land and labor, some significant advantages must accrue to highly specialized, largescale hog operations before much hog production moves off the commercial family farm.
Future Market Limitations
Pork has had severe competition from beef and poultry since World War II. Although hog slaughter held fairly steady at about 80 million head for the past .5 years ( 1960-64), prices paid to farmers decreased. Many small hog producers, who enter and leave the business depending on price, have already been eliminated.
When considering what might be a favorable supply-price balance for hogs, several factors must be examined. It is difficult to estimate how predicted changes in the meat-type quality of pork will affect per capita consumption. However, most hogs marketed by 1975 probably will grade
Table 9. Projected pork needs for 1975
With estimated 1975 population of 226 million:"
Projected per capita pork consumption (pounds)
Total pork needed, carcass weight, ex-eluding lard (billion pounds) f
Total number of hogs needed (million head) t
Projected levels of pork production and consumption
Low Medium High
55 60 63
12.4 13.6 14.7
92 101 109
"Estimate is based on series III data which predict a fertility level the same as for 1949 to 1951 and includes military personnel. See ( 6.5).
f Per capita consumption times population. t Total pounds of pork, carcass weight equivalent, divided by 135, average production in
pounds of pork-carcass weight, excluding lard-for hogs slaughtered between 1950 and 1963. See (58).
41

::~.~.'per person"
r\\ ,...~'1 cActual I \ f l_.;>
I \"" 70' ~ / I
" I "--../ I
I
Trend _5 Trend line
Y=74. 26 - 8. 8767 log X 65
/''' \
60
---\ ----------\
55
i___--~----~----~~----~~--~~----~ 1946 1950 1955 1960 1965 1970 1975
Year
" 1964 estimated; 1965 projected.
Figure 12. Per capita U. S. pork consumption, trend and projection, 1946-75.
U. S. No. 1. Should these quality changes be made, pork consumption is likely to level off at about 60 pounds per person by 1975 (see figure 12).
Imports and exports of pork are relatively unimportant in terms of total supply. Net pork imports amounted to less than one half of 1 percent of total U. S. pork production during 1953-62. Therefore, required domestic inventories of hogs for U. S. pork needs by 1975 can be closely determined by multiplying the estimated population times the projected pounds of pork consumed per person. Such estimates were made for three levels of per capita consumption (see table 9).
Assuming that per capita consumption will range between 55-65 pounds per person, between 12.4-14.7 billion pounds of pork-carcass weight, excluding lard-will be needed by 1975. If per capita consumption levels out at 60 pounds, 13.6 billion pounds of dressed pork will be needed. This amount is about a 25-percent increase over the 1960-64 slaughter rate. About 101 million head of hogs would be needed to supply 13.6 billion pounds of pork (see table 9) .15
Even at present levels of technology, a 25-percent increase in hog production could be accomplished with only minor adjustments in producing facilities. Although the number of farms producing hogs is declining, advancing technology could reduce the number of hog farms
15 The projected per capita pork consumption of 60 pounds for 1975 appears consistent with estimates made by other researchers, particularly if a growing preference for beef is taken into account. See ( 13), ( 30), and ( 70).
42

even faster than the past decline suggests. For example, a 27-percent increase in output per sow is expected by 1975. ( 13) Therefore, 600,000 hog farms with an average of 10 sows, each sow producing two marketable litters of nine pigs each, could supply 108 million hogs annually. The same number of hogs could be produced by 200,000 hog farmers with 30 sows each or by 60,000 hog farmers with 100 sows each. The 1959 census found that about 1.3 million farmers produced and sold hogs.
Indications are that the estimated 1975 demand for pork could easily be met within the existing com-hog structure. At present, there is excess capacity for producing hogs. Since expansion possibilities are limited in hogs, most hogs probably will continue to be produced on the combination com-hog farms of the Midwest.
Summary and Conclusions
Due to technological and market structure changes, hog producers and agricultural leaders continue to be concerned that hog production might become extensively integrated by nonfarm firms. This study examines the effect of recent technological developments and market structure changes. It also discusses how these forces might influence the future structure of the industry.
New technology is always a major inducement to investment and organizational changes in agriculture. Capital is becoming increasingly important as hog producers adopt new technology and attempt to increase output per unit of labor. But, apparently, the extent to which capital can be profitably substituted for labor in hogs is limited.
Study results show no cost advantage for highly specialized, largescale hog operations. Most economies of size can be achieved in com-hog operations of 50 sows. Based on costs developed in this study, the cost of producing 100 pounds of pork in a one-man equivalent, com-hog operation is $14.78. This amount compares to $15.44 for the highly specialized, largescale operation separated from com production.
Advancing technology and intercommodity competition will virtually insure increased size and specialization in hog production. Narrowing margins per pig will eliminate many small hog producers. In addition to hog units getting larger, specialized feeder pig and finishing operations probably will develop. As technical problems of feeder pig production are solved, future growth in that activity will be limited to the profitability of separating farrowing and finishing processes. At present, the increased profitability of combining farrowing and finishing on the same farm limits incentive for separation. Intraprocess specialization will probably never be as great for hogs as for poultry because of differences in the reproductive process.
The greatest pressure for vertical integration comes from suppliers. However, high capital requirements, low investment returns, and high risk all limit the amount of capital flowing into hog production from non-
43

farm sources. Technological progress has not resulted in any unique advantages to feed manufacturers in the combined process of formulating, manufacturing, and feeding hogs. The corn-hog producer still has the advantage since most inputs are on his farm.
Once it was felt that processors would integrate toward production to gain control over volume and quality; however, there is little evidence of such contracting. Vertical integration tends to develop for those commodities where open markets do not coordinate effectively production and marketing processes. The pork industry is still more volume than quality oriented. Multiple farrowing helps reduce seasonal variations in pork supplies-the most important problem facing packers.
There are market limitations to vertical integration in the hog industry. An inelastic and declining demand for pork limits expansion and integrated activities by nonfarm firms. Several implications can be drawn from technical and market forces operating in the swine industry:
1. Economies of size and intraprocess specialization apparently are not as important in hogs as in the poultry industry.
2. Technological changes in the hog industry come slowly over time, allowing adjustment within the structure of the commercial family farm.
3. The swine industry will not be under pressure to meet the anticipated pork demand between now and 1975. Because of the "lumpiness" of inputs in agriculture, a surplus capacity for producing hogs probably will persist.
4. Greater cost savings from the use of capital equipment and major changes in processing, distribution, and merchandising of pork will have to take place before there is extensive formal integration.
The rate of technological and market structure changes in hog production and the adoption rate of innovations cannot be accurately predicted. In the past, new technology generally resulted in reorganization of productive resources within the corn-hog complex. Technology is perhaps a necessary but not a sufficient condition for vertical integration.
INSTITUTIONAL CONSIDERATIONS
Some institutional considerations may greatly affect vertical integration in hog production. For example, extensive integration and contract production by nonfarm firms could lead to serious public relations problems and antagonize public opinion. Moreover, suppliers, processors, and retailers may fear that vertical integration in hog production could bring antitrust action as well as strict government regulation.
Pressure now is being exerted for legislation prohibiting all vertical integration in agriculture. A recent report ( 64) to the Secretary of Agriculture hit hard at vertical integration by nonfarm organizations. The reporting committee pointed out that concern is growing about farms being vertically integrated by giant food processors and corporations.
44

Several recommendations are given for keeping the family farm in control of agricultural production.
Agricultural leaders maintain that integration in hog production will be slight as long as there are good, strong, educational institutions. This rationale is based on the fact that if the farmer doesn't adopt efficient production methods, someone else will. Many educators feel that a progressive hog producer can have the latest production techniques without entering into contracts and that most good hog producers will continue to have entrepreneurial independence.
NEED FOR GREATER COORDINATION
Some changes in hog production and marketing can be expected. The need for coordination will call for development and use of more contractual arrangements between farm and nonfarm firms. Suppliers will continue to offer contracts mostly as competitive sales devices. Processors will continue to eye marketing contracts for gaining cost and product advantages. Producer groups will continue to search for marketing associations to improve their bargaining power.
Many cooperative associations have formed various horizontal and vertical combinations for producing and marketing high quality feeder pigs and market hogs. Such integrated production and marketing associations will probably expand. These programs may eventually involve forward pricing contracts and prearranged selling of hogs. Commercial market agencies, processors, and suppliers may also organize coordinated production and marketing programs. But prospects of the hog industry becoming extensively integrated by nonfarm firms do not appear as imminent as was anticipated in the 1950's.
45

Appendix: Estimated Costs and Capital
Requirements Used in Appendix Tables
Cost estimates were developed in this study for comparing capital requirements, annual costs, and returns for different levels of specialization in hog production. Product and factor prices used are shown in table A-l. Estimated capital requirements for different systems budgeted are shown in tables A-2, A-3, and A-4.
Numerous problems are encountered when assembling cost data of this type. Technology is changing so rapidly in hog production that it is nearly impossible to get a representative set of cost figures that remain meaningful for long. Capital requirements constantly change as hog producers adjust for maximum efficiency. Because modern facilities are an important part of modern hog production, certain cost estimates are essential for a study of this type.
Estimates used in this study are based on a careful examination of information assembled from contractors, commercial hog producers, suppliers, agricultural engineers, animal scientists, and published literature. Nevertheless, the costs presented are estimates and may not be entirely appropriate for all uses.
PRODUCT PRICES AND FACTOR COSTS
Product and factor prices shown in table A-1 were developed from prices published by the Minnesota Crop and Livestock Reporting Service. The net selling price of hogs was computed by multiplying the long-time average Minnesota corn-hog ratio times the price of corn: 15.44 x $1.05 = $16.20 per cwt.
Feed costs were developed from feed utilization data fer swine furnished by L. E. Hanson, Department of Animal Husbandry, University of Minnesota. Costs are based on feed requirements for a sow producing two litters, or 14 marketable hogs at 210 pounds each, in a well managed hog operation. Sow rations include all feed consumed by the sow through breeding, gestation, and lactation. Starter rations are based on feed requirements for pigs during the first 56 days or up to 40 pounds. Finishing rations include all feed consumed by pigs from 40 pounds to market weight. A summary of feed requirements is shown in table A-l.
Other estimated variable costs are based on recent farm management studies. Health costs including vaccination, medicine, spraying, and worming are estimated to be $1.60 per hog and $1 per feeder pig raised. Breeding costs are based on the net cost of keeping a good boar or about 25 cents per pig produced. Power costs are based on fuel and electricity costs as observed in highly mechanized hog operations. ( 22)
46

CAPITAL REQUIREMENTS
Building and equipment costs used are based on estimates prepared by R. A. Hinton ( 26); some adjustments were made as suggested by commercial building and equipment contractors. Building costs are based on a contract job using new materials.
Investment costs and building space requirements used are for a modern, fully mechanized, confinement system for hog production. Estimates include the cost of grading and fill, partially slatted floors, automatic feeding and watering, ventilation, insulation, wiring, pens, etc.
Farrowing and starting facilities provided cost $500 per sow unit. The farrowing unit includes an overall floor space of 67 square feet per sow unit. The starting or nursery unit for weaned pigs up to 40 pounds provides 30 square feet of floor space per litter. A new group of sows is assumed to farrow each month, thereby permitting pigs to be in the farrowing and starting house an average of 56 days.
Finishing facilities can accommodate pigs from 40 pounds to market weight. The cost of finishing facilities is estimated to be $40 per hog housed. The design provides 4 square feet of floor space per pig up to 100 pounds and 8 square feet from 100 pounds until finished out. Total space requirements were calculated on the basis that one-third of the annual output of hogs would be in the finishing unit at one time. Therefore, each pig is allowed approximately 4 months in the finishing house.
Sow facilities accommodate the breeding herd by lots. The cost estimated for these facilities-$50 per sow-includes shelters and pens, concrete slab, and equipment for feeding and watering.
Feed-processing equipment is semiautomatic and adequate to prepare and mix all rations. Commercial equipment dealers estimated the cost of each unit. Storage facilities are provided for a 3-month supply of feed. A contractor estimated costs of bringing water to buildings and disposing of waste materials. The miscellaneous equipment includes all other items essential to a well managed hog operation. Since the two smaller units are part of a corn-hog operation, miscellaneous equipment for these units are taken as a prorated share of equipment on the farm.
Working capital requirements are computed from variable costs or the capital required for the power, health, breeding, and feed costs for 6 months. Investment in the breeding herd is part of the working capital and is based on the approximate replacement value of sows-$40 each. Since labor costs are not normally considered out-of-pocket costs under typical farm conditions, labor is not included as working capital for the two small units but it is for the large unit. The interest rate on working capital is 6 percent.
The annual cost of owning and using buildings and equipment is 15 percent of the initial investment. This amount includes 7"!f percent for depreciation and obsolescence, 5 percent for interest on depreciated value or 2~~ percent of new value, 3 percent for maintenance and repairs, 1.5 percent for taxes, and 0.5 percent for insurance. Net returns on investment as used in this study are calculated with the following formula:
47

R-C-D-(i·V) v
Where: R =total revenue, C =operating expenses, D = depreciation, i = market rate of interest on fixed assets and operating capital, and V = investment. This formula is used in market structure studies to determine the flow of capital resources into various enterprises. ( 2)
Table A-1. Product and factor prices and feed requirements
Item
Labor Hogs:
Feeder pigs Market hogs
Interest: Fixed capital ... Operating capital
Feed: Corn (on farm)
( delivered to farm) Oats Protein ( starter ration)
Premix Mineral
(other) H • •
Unit
hour
head cwt.
bushel $1.05
1.15 0.70
FEED REQUIREMENTS
Price
cwt. $ 1.88
2.05 2.20 5.00 4.25
25.00 3.00
Rate
$ 1.50
$ 13.00 $ 16.20
5% 6% ton
$ 37.50 41.05 43.75
100.00 85.00
500.00 60.00
(Sow and two litters, 14 pigs to market weight of 210 pounds each) Sows"
2,400 pounds, 15 percent protein Starter ( to 40 pounds )
840 pounds, 18 percent protein Finisher ( 40 to 210 pounds)
8,400 pounds, 13 percent protein
" Does not include feed required for gain beyond replacement weight of gilts. It is assumed that any additional gain in weight would just equal the cost of putting on that weight.
Table A-2. Estimated capital requirements for one-man equivalent hog operation marketing 1,500 hogs annually
Item
Buildings and equipment: Farrowing and starting ( 18 sow capacity, $500 per unit) Finishing facilities ( 500 pig capacity, $40 per pig housed) Sow facilities ( 90 sow capacity, $50 per sow) Feed mill and storage . Water and disposal system Miscellaneous equipment (hog enterprise share)"
Total buildings and equipment Working capital
Total capital required
Cost
$ 9,000 20,000
4,500 5,000 3,000 7,000
48,500 21,000
$69,500 " Capital cost for miscellaneous equipment includes 50 percent of the investment for such
items as tractor, truck, auger wagon, sprayer, pickup, scales, shop equipment, feed storage space, and improvements. Estimated total cost is $14,000.
48

Table A-3. Estimated capital requirements for an operation marketing 10,000 hogs annually
Item
Buildings and equipment: Farrowing and starting ( 120 sow capacity, $500 per unit) ..... . Finishing facilities (3,000 hog capacity, $40 per pig housed) Sow facilities ( 600 sow capacity, $50 per sow) Feed mill and storage ....... . ............................................................................... . Other buildings" .................................................. . Water system (well and distribution) ......................................... . Disposal system and lagoon ............................. . Truck and box ......... . ................................................... .. Scales ........................................................................................... .
Miscellaneous equipment: t Improvements ............................................................................................ . 1 tractor ( chore ) .. . ........................................................................ . 1 auger wagon ......... . ........................................................ . Used truck and box .............................................................................. . Low type trailer for hauling sows ................................................ .. Pickup .......................................................................................................................... . Loading chutes .................................................................................................... . Sprayer ...................................................................................................................... . Manure spreader .................................................................................................. . Shop equipment .................................................................................................. .
Total miscellaneous equipment ................................................................. . Total buildings and equipment ....................................................................... .
Working capital .......................................................................................................................... .
Total capital required ............................................................................................... .
Cost
$ 60,000 120,000
30,000 40,000 10,000
7,500 7,500 3,000 2,000
2,500 1,500 1,000 1,500
750 1,500
750 500 750
2,500
13,250 293,250 164,000
$457,250
" Includes such buildings as machine shed and shop, isolation building, office space, and dressing and lunchroom for workers.
f Miscellaneous equipment items listed are considered the minimum necessary for a successful largescale hog operation as based on actual observation of several largescale units.
Table A-4. Estimated capital requirements for a one-man equivalent feeder pig operation producing and selling 3,000 feeder pigs annually
Item
Buildings and equipment: Farrowing and starting ( 36 sow capacity, $500 per unit) ........ . Sow facilities ( 180 sow capacity, $50 per sow) .................................... .. Feed mill and storage ..................................................................................................... . Water and disposal system ...................................................................................... . Miscellaneous equipment" (hog enterprise share) ............................. .
Total buildings and equipment .......................................................................... . Working capital ............................................................................................................................. .
Total capital required .................................................................................................. .
" Same as miscellaneous equipment costs given for table A-2.
49
Cost
$18,000 9,000 5,000 3,000 7,000
$42,000 20,000
$62,000

Literature Cited (I) Andrews, R. A. 1959. Study of the Sweet Com Industry in the Midwest
Farm Economy. Unpub. Ph.D. thesis. Dept. of Agr. Econ. Univ. of Minn.
(2) Bain, J. S. 1959. Industrial Organization. John Wiley and Sons. New York.
(3) Bauman, R. H. Economies of the Hog Business. Mimeo. leaflet. Agr. Econ. Dept. Purdue Univ.
( 4) , Eisgruber, L. M., Partenheimer, R. E., and Pow len, P. A. Sept. 1961. Economies of Size and Economic Efficiency in the Hog Enterprise. Purdue Univ. Res. Bull. 699.
(5) Bishop, C. E. and Toussaint, W. D. 1954. Agricultural Economic Analysis. Prentice-Hall, Inc. New York.
(6) Blaich, 0. P. Dec. 1960. "Integration in Theory with an Application to Hogs."]. Farm Econ. XLII (5): 1280-93.
(7) ---------·Nov. 1961. Vertical Integration in Theory. Dept. of Agr. Econ. Spec. Rpt. 520. Univ. of Minn.
(8) Brandow, G. E. Aug. 1961. Interrelations Among Demands for Farm Products and Implications for Control of Market Supply. Penn. State Univ. Agr. Exp. Sta. Bull. 680.
(9) Breimyer, Harold F. Dec. 1961. Demand a:nd Prices for Meat, Factors Influencing Their Historical Development. USDA Tech. Bull. 125.3.
(10) -----· Aug. 1962. "The Three Economies of Agriculture," f. Farm Econ. XLIV (3): 679-99.
(ll) Burk, M. C. June 1961. Measures and Procedures for Analysis of U. S. Food Consumption. USDA Agr. Handbook 206.
(12) Burr, R. R. and Beer, C. Jan. 1962. The Economies of Specific Pathogen Free Swine for the Commercial Swine Producer. Agr. Econ. Circ. 856. Mich. State Univ.
( 13) Butz, Dale E. and Eaker, George L. 1960. The Changing Structure of the Meat Economy. Harvard Business School Div. of Res. Boston.
( 14) Chamberlain, Edward. 1938. Monopolistic Competition, a Re-orientation of the Theory of Value. Harvard Univ. Press. Cambridge.
( 15) Clodius, R. L. and Mueller, W. F. Aug. 1961. "Market Structure and Analysis as an Orientation for Research in Agricultural Economics." ]. Farm Econ. XLIII (3): 515-53.
(16) Cochrane, W. W. 1957. Farm Prices: Myth and Reality. Univ. of Minn. Press. Minneapolis.
(17) Collins, H. R., Mueller, W. F., and Birch, E. M. Oct. 1957. GrowerProcessor Integration, a Study of Vertical Integration Between Growers and Processors of Tomatoes ·in CaUfornia. Univ. of Calif. Agr. Exp. Sta. Bull. 768.
( 18) Croxton, F. E. and Cowden, D. J. 1962. Applied General Statistics. Sir Isaac Pitman and Sons, Ltd. London.
(19) Davis, V. W. and VanArsdall, R. H. Sept. 1960. "Costs and Benefits of Engineered Farmsteads." Agr. Eng. 41 (9) :622-27.
(20) Eighth National Institute of Animal Ag1•iculture Proceedings. 1958. Purdue Univ., plus copies for years 1962, 63, and 64.
(21) Frazier, T. L., Padgett, J. H., and Thompson, J. C. May 1962. An Economic Appraisal of Hog Marketing Contracts in Georgia. Univ. of Ga. Agr. Exp. Sta. Mimeo Series N.S. 141.
50

(22) Hasbargen, Paul and Routhe, Hal. Jan. 1963. Planning Guide for a Hog Enterprise. Univ. of Minn. Agr. Ext. Serv. Form FM-28.
(23) Heady, E. 0., Gibbons, J. R., and Irwin, G. Oct. 1961. Specialization and Pork Production Methods in Relation to Over-all Farm Resource Use and Integration. Iowa State Univ. Agr. Exp. Sta. Res. Bull. 496.
(24) and Jensen, H. R. 1954. Farm Management Economics. Prentice-Hall Inc. New York.
(25) Henry, H. R. and Raunikar, Robert. Dec. 1960. "Integration in PracticeThe Broiler Case."]. Farm Econ. XLII (5): 1265-74.
(26) Hinton, R. A. Jan. 1964. Guides for Use in Planning Hog Pmduction Systems. AE-3973. Univ. of Ill.
(27) Hoepner, Paul H. 1960. An Economic Analysls of Risk and Uncertainty in Dairy and Hog Production. Unpub. Ph.D. thesis. Dept. of Agr. Econ. Univ. of Minn.
(28) Jensen, H. R., Kehrberg, E. W., and Thomas, D. W. Apr. 1962. "Integration as an Adjustment to Risk and Uncertainty." Southem Econ. ]. XXVIII ( 4): 378-84.
(29) Johnson, Leon. 1956. A Competitor's Point of View. Mimeo. paper presented at Iowa Svvine Producers Field Day. Ames.
(30) Kelly, D. L., McCoy, J. H., and Manuel, M. L. Oct. 1961. The Competitive Position of Kansas ·in Marketing Hogs. Kans. State Univ. Agr. Exp. Sta. Tech. Bull. 118.
( 31) Kramer, Robert C. 1952. Retailing Prepackaged Meat. Mich. State Univ. Agr. Exp. Sta. Spec. Bull. 385.
( 32) Lanzillotti, Robert F. Dec. 1960. "The Superior Market Power of Food Processors and Agricultural Supply Firms-Its Relation to the Farm Problem."]. Farm Econ. XLII ( 5): 1228-47.
(33) Larson, N. G. June 1958. Contract Farming and Vertical Integration, A Selected Llst of References. USDA Library List 64.
( 34) Leftwich, Richard H. 1960. The Price System and Resource Allocation. Rev. Ed. Holt, Rinehart, and Winston. New York
(35) Maki, Wilbur R. Aug. 1962. "Decomposition of the Beef and Pork Cycles."]. Farm Econ. XLIV (3): 731-43.
( 36) Mehren, George L. Jan. 28, 1963. Evolving Patterns in Meat Processing. Mimeo. paper. Agr. Econ. Dept. Univ. of Ill.
( 37) Mighell, R. L. and Jones, L. A. Feb. 1963. Vertical Coordination in Agriculture. Agr. Econ. Rept. 19. ERS, USDA.
(38) Miller, M., Egertson, K., and Fienup, D. Nov. 1963. "Producer Specialization, Location, and Hog Marketing Patterns." Minn. Farm Business Notes 57: 1-3.
(39) Minn. Dept. of Agr. June 1962. Minnesota's Hog Industry. Crop and Livestock Reporting Service.
( 40) ~------· Annual Reports 1940-64. Minnesota Agricultural Statistics. Crop and Livestock Reporting Service.
(41) Mueller, W. F. and Garoian, Leon. 1961. Changes in the Structure of Grocery Retailing. Univ. of Wise. Press. Madison.
(42) National Hog Farmer. Monthly. Webb Pub. Co. Iowa. (43) Nelson, A. P. May 19, 1962. "Indiana Feed Firm Does Extensive Con
tracting." Feedstuffs 34(20) :26-7, 30-l. ( 44) Nicholls, William H. 1941. Imperfect Competition Within Agricultural
Industries. Iowa State Coli. Press. Ames. ( 45) Nordquist, A. V. and Pals, C. H. 1956. "Economic Losses from Animal
Diseases and Parasites." Yearbook of Agriculture, 1956, Animal Diseases. U. S. Government Printing Office.

( 46)
(47)
(48)
(49)
(50)
(51)
(52)
(53)
(5S)
(.56) (57) (58)
(59)
(60)
(61)
(62)
(63)
(65)
(66)
(68)
(70)
('71)
Parsons, Don. Sept. 1961. "How to Increase the Sale and Profitability of Meat Together." The Meat Team Looks at the Future. Amer. Meat Institute. Chicago.
Phillips, R. Apr. 1961. Feed Industry Financing and Contract Programs in Iowa and Surrounding States. Iowa State Univ. Spec. Rept. 28.
Proceedings of National Pork Conference. 1962-64. Mimeo. of proceedings, reports made available by Amer. Meat Institute. Chicago.
Routhe, Hal and Thomas, Kenneth. Sept. 1962. Hog Feeder's Guide, 1962-63. Univ. of Minn. Agr. Ext. Ser~r.
Roy, Ewell P. Dec. 1960. "Discussion: Integration in Practice-The Broiler Case."]. Farm Econ. XLII (5): 1274-75.
Shepherd, Geoffrey S. 1955. Farm Products. Third Ed. Iowa State Univ. Press. Ames.
Smith, Norton. Notes Regarding Potential for Small Killer-Shipper Hog Operations in Indiana. Mimeo. leaflet. Purdue Univ.
Trifon, Rapheal. Nov. 1959. "Guides for Speculation About Vertical In-· tegration of Agriculture with Allied Industries." ]. Farm Econ. XLI ( 4): 734-46.
U. S. Dept. of Agr. Annual copies. Changes in Farm Production and Efficiency. Stat. Bull. 233.
~--~----· Apr. 1962 .. Grades of Hog Slaughtered in the United States September 1960 through August 1961. ERS. AMS.
--~----· 1958. Integration in the Livestock AMS 282. ---------· Bimonthly. Livestock and Meat Situation. ERS. -------· 1957 plus supplements. Livestock and Meat Statistics.
Stat. Bull. 230. AMS . . 1964. Livestock Purchasing and Feeding Activities of
Packers, 1959-63. AMS. Packers and Stockyards Div . . Nov. 1960. Marketing Costs and Margins Livestock
and Meats. AMS. Res. BulL 418. ~~-~-· Apr. 1958. Marketing Meat-type Hogs. Marketing Res.
Rept. 227. -----· July 1960. Meat Consumption Trends and Patterns. Agro
Handbook 187. ------· Feb. 1964. Meat Packers' Cost for Slaughtering Hogs
and Distributing Fresh Pork. ERS 160. ----· Dec. 6-7, 1962. Report and Recommendations of Family
Farm Subcommittee. National Advisory Committee on Rural Areas Development. Washington. -
U. S. Dept. of Commerce. July 1962. Current Population Reports, Population Estimates. Series P-25. No. 251.
Univ. of Minn. Agr. Exp. Sta. Oct. 1963. Equilibrium Analysis of In· come-Improving Adjustments on Farms in the Lake States Dairy Region, 1965. Tech. Bull. 246.
Urevig, Edgar. Nov. 8, 1962. A View of Commercial Swine Pmduction. Mimeo. talk presented at National Swine Industry Conf. Columbus.
VanArsdall, R. H. May 1962. The Economic Value of Manure from Confinement Finishing of Hogs. Univ. of IlL Agr. Exp. Sta. BulL 687.
Waugh, F. V. July 1957. Graphic Analysis ·in Agricultural Economics. USDA Agr. Handbook 128.
Wilcox, W. W. and Cochrane, W. W. 1960. Economics of American Sec. Ed. Prentice-Hall, Inc. Englewood Cliffs, N. J.
Williams, Willard F. and Stout, Thomas T. 1964. Economics of the Live· stock-Meat Macmillan Co. New York