Embed Size (px)
Citation preview
Vertical nanopillars for highly localizedfluorescence imagingChong Xiea,1, Lindsey Hansonb,1, Yi Cuia, and Bianxiao Cuib,2
aDepartment of Materials Science and Engineering, Stanford University, Stanford, CA 94305; and bDepartment of Chemistry, Stanford University,Stanford, CA 94305
Edited by Charles Lieber, Harvard University, Cambridge, MA, and approved January 21, 2011 (received for review October 16, 2010)
Observing individual molecules in a complex environment byfluorescence microscopy is becoming increasingly important inbiological and medical research, for which critical reduction ofobservation volume is required. Here, we demonstrate the useof vertically aligned silicon dioxide nanopillars to achieve below-the-diffraction-limit observation volume in vitro and inside livecells. With a diameter much smaller than the wavelength of visiblelight, a transparent silicon dioxide nanopillar embedded in a non-transparent substrate restricts the propagation of light and affordsevanescence wave excitation along its vertical surface. This effectcreates highly confined illumination volume that selectively excitesfluorescence molecules in the vicinity of the nanopillar. We showthat this nanopillar illumination can be used for in vitro single-molecule detection at high fluorophore concentrations. In addition,we demonstrate that vertical nanopillars interface tightly with livecells and function as highly localized light sources inside the cell.Furthermore, specific chemical modification of the nanopillar surfacemakes it possible to locally recruit proteins of interest and simulta-neously observe their behavior within the complex, crowded envir-onment of the cell.
nanowire ∣ confocal volume ∣ sub-diffraction ∣ nano-bio interface
The rapidly evolving field of nanotechnology creates newfrontiers for biological sciences, such as quantum dots for
fluorescence imaging, electrode-free nanometer light sources,nanowire-based transistor biosensors, and carbon nanotubeRaman probes (1–7). In 2007, an intriguing study by Kim etal. reported that vertical silicon nanowires penetrated livingmammalian cells that grew attached to the substrate withoutaffecting the cell viability in the long term (8). Recently, Shaleket al. reported the use of vertical silicon nanowires to deliver bio-molecules such as proteins and DNA plasmids into living cellsthat grew attached to the nanowires (9). Together with otherworks that show vertical nanowires can support cell culture(10–14), these observations suggest a new and exciting possibilityof using vertical nanowires as a universal platform to probeintracellular molecular events.
Far-field fluorescence microscopy remains one of the mostpopular tools in studying interactions, dynamics, and functionsin biological systems. However, for highly sensitive measurementssuch as single-molecule fluorescence imaging, it is essential torestrict the detection volume so that only one fluorescent mole-cule is observed at any given time (15–18). It is this nontrivial taskto which nanotechnology can contribute, simultaneously improv-ing access to the cell interior and limiting detection volume by vir-tue of the same nanoscale features. Previously, several techniquesfor limiting observation volumes have relied on the generation ofevanescent waves, which arise when wave propagation over aboundary is forbidden so that the intensity of the electromagneticfield decays exponentially at the interface. One commonly usedexample of this approach is total internal reflection fluorescence(TIRF) microscopy, which generates an evanescent wave at arefractive boundary when the incident light is beyond the criticalangle (19, 20). This evanescent field penetrates only approxi-mately 100 nm into the solution and thus enables a selective
visualization of fluorescence molecules near the surface. Anothertechnique, zero-mode waveguide, utilizes subwavelength aper-tures in a metal film to block propagating modes of light, whichproduces a tightly confined evanescent field within the aperturecavity to achieve an excitation volume well below the diffractionlimit (21–23).
While both TIRF and zero-mode waveguide drastically reducethe excitation volume and have proven to be valuable tools forsingle-molecule imaging, the volume confinement is usuallyrestricted to a small depth along a flat surface or inside theextremely small aperture cavity. For live cell studies, this verycharacteristic that provides their utility also serves as a limitation:They are mainly used to probe cellular events on the plasmamembrane (24–26) and do not allow deeper imaging into the cellinterior. Likewise, other related methods such as the nanoprobe-based near-field scanning microscopy are subject to the sameworking distance limitations and additionally suffer from probeinconsistencies and incompatibility with parallel implementations(27, 28). Therefore, a detection method that affords a sub-diffrac-tion-limited excitation volume as well as access to the cell interiorwill improve the sensitivity and cellular application of fluores-cence measurements such as fluorescence correlation spectro-scopy (29, 30), Forster resonance energy transfer (31, 32), andfluorescence fluctuation spectroscopy (33, 34).
In this work, we explore the use of vertical nanopillars to mod-ulate light for the generation of a quickly decaying excitation fieldin a live cell. For this purpose, we fabricated transparent verticalsilicon dioxide nanopillars in a substrate coated with a nontran-sparent platinum layer. With a diameter smaller than the wave-length of visible light, the transparent nanopillar restricts thepropagation of light and generates an evanescence wave alongits vertical surface that runs to about 1 μm deep into cell interior.Therefore, we employed the vertical nanopillars to create a highlyconfined observation volume that has been demonstrated toachieve single-molecule observation in high fluorescence back-ground. In addition, we show that with specific surface modifica-tions, silicon dioxide nanopillars can also serve as chemicalprobes to address cellular events with high specificity. As such,the vertical nanopillar affords a versatile experimental platformfor simultaneous recruitment and sensitive optical measurementsof proteins of interest in the natural cell environment.
ResultsFabrication of Nanopillar Substrates. The nanopillar probes are ver-tical silicon dioxide nanopillars with diameters smaller than thewavelength of visible light. The SiO2 nanopillars were fabricatedon fused quartz substrates with gold nanoparticles as etching
Author contributions: C.X., L.H., Y.C., and B.C. designed research; C.X. and L.H. performedresearch; C.X., L.H., and B.C. contributed new reagents/analytic tools; C.X., L.H., and B.C.analyzed data; and C.X., L.H., Y.C., and B.C. wrote the paper.
The authors declare no conflict of interest.
This article is a PNAS Direct Submission.1C.X. and L.H. contributed equally to this work.2To whom correspondence may be addressed. E-mail: [email protected] or [email protected].
www.pnas.org/cgi/doi/10.1073/pnas.1015589108 PNAS Early Edition ∣ 1 of 6
CHEM
ISTR
YAPP
LIED
BIOLO
GICAL
SCIENCE
S
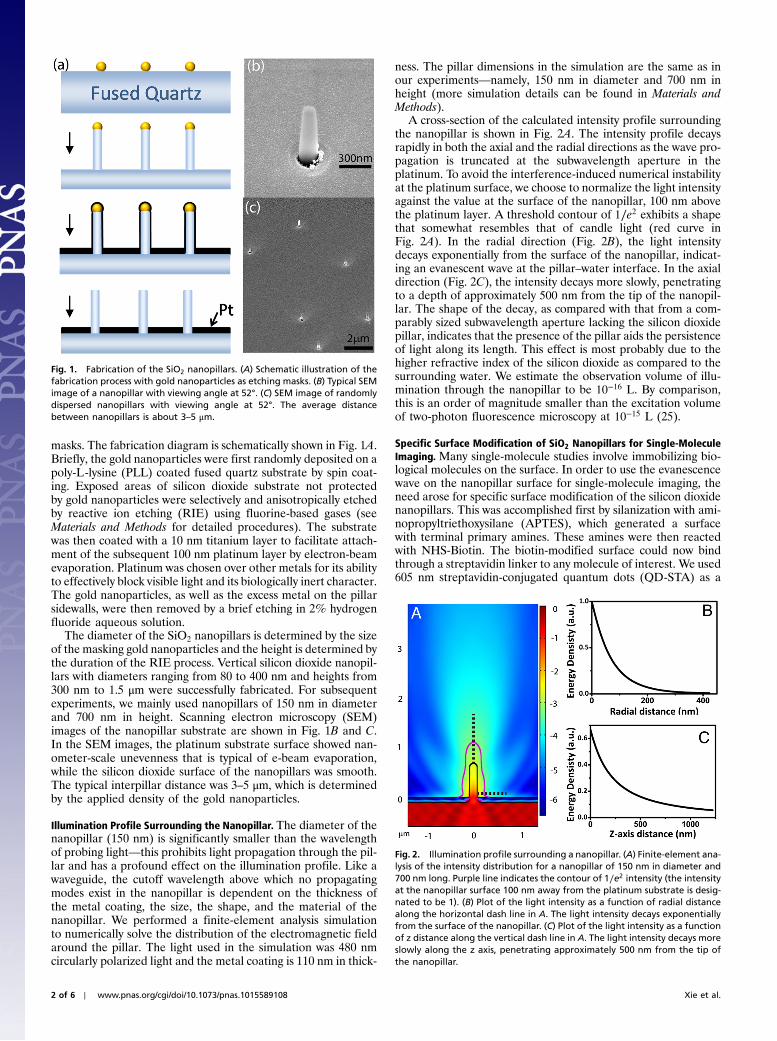
masks. The fabrication diagram is schematically shown in Fig. 1A.Briefly, the gold nanoparticles were first randomly deposited on apoly-L-lysine (PLL) coated fused quartz substrate by spin coat-ing. Exposed areas of silicon dioxide substrate not protectedby gold nanoparticles were selectively and anisotropically etchedby reactive ion etching (RIE) using fluorine-based gases (seeMaterials and Methods for detailed procedures). The substratewas then coated with a 10 nm titanium layer to facilitate attach-ment of the subsequent 100 nm platinum layer by electron-beamevaporation. Platinum was chosen over other metals for its abilityto effectively block visible light and its biologically inert character.The gold nanoparticles, as well as the excess metal on the pillarsidewalls, were then removed by a brief etching in 2% hydrogenfluoride aqueous solution.
The diameter of the SiO2 nanopillars is determined by the sizeof the masking gold nanoparticles and the height is determined bythe duration of the RIE process. Vertical silicon dioxide nanopil-lars with diameters ranging from 80 to 400 nm and heights from300 nm to 1.5 μm were successfully fabricated. For subsequentexperiments, we mainly used nanopillars of 150 nm in diameterand 700 nm in height. Scanning electron microscopy (SEM)images of the nanopillar substrate are shown in Fig. 1B and C.In the SEM images, the platinum substrate surface showed nan-ometer-scale unevenness that is typical of e-beam evaporation,while the silicon dioxide surface of the nanopillars was smooth.The typical interpillar distance was 3–5 μm, which is determinedby the applied density of the gold nanoparticles.
Illumination Profile Surrounding the Nanopillar. The diameter of thenanopillar (150 nm) is significantly smaller than the wavelengthof probing light—this prohibits light propagation through the pil-lar and has a profound effect on the illumination profile. Like awaveguide, the cutoff wavelength above which no propagatingmodes exist in the nanopillar is dependent on the thickness ofthe metal coating, the size, the shape, and the material of thenanopillar. We performed a finite-element analysis simulationto numerically solve the distribution of the electromagnetic fieldaround the pillar. The light used in the simulation was 480 nmcircularly polarized light and the metal coating is 110 nm in thick-
ness. The pillar dimensions in the simulation are the same as inour experiments—namely, 150 nm in diameter and 700 nm inheight (more simulation details can be found in Materials andMethods).
A cross-section of the calculated intensity profile surroundingthe nanopillar is shown in Fig. 2A. The intensity profile decaysrapidly in both the axial and the radial directions as the wave pro-pagation is truncated at the subwavelength aperture in theplatinum. To avoid the interference-induced numerical instabilityat the platinum surface, we choose to normalize the light intensityagainst the value at the surface of the nanopillar, 100 nm abovethe platinum layer. A threshold contour of 1∕e2 exhibits a shapethat somewhat resembles that of candle light (red curve inFig. 2A). In the radial direction (Fig. 2B), the light intensitydecays exponentially from the surface of the nanopillar, indicat-ing an evanescent wave at the pillar–water interface. In the axialdirection (Fig. 2C), the intensity decays more slowly, penetratingto a depth of approximately 500 nm from the tip of the nanopil-lar. The shape of the decay, as compared with that from a com-parably sized subwavelength aperture lacking the silicon dioxidepillar, indicates that the presence of the pillar aids the persistenceof light along its length. This effect is most probably due to thehigher refractive index of the silicon dioxide as compared to thesurrounding water. We estimate the observation volume of illu-mination through the nanopillar to be 10−16 L. By comparison,this is an order of magnitude smaller than the excitation volumeof two-photon fluorescence microscopy at 10−15 L (25).
Specific Surface Modification of SiO2 Nanopillars for Single-MoleculeImaging. Many single-molecule studies involve immobilizing bio-logical molecules on the surface. In order to use the evanescencewave on the nanopillar surface for single-molecule imaging, theneed arose for specific surface modification of the silicon dioxidenanopillars. This was accomplished first by silanization with ami-nopropyltriethoxysilane (APTES), which generated a surfacewith terminal primary amines. These amines were then reactedwith NHS-Biotin. The biotin-modified surface could now bindthrough a streptavidin linker to any molecule of interest. We used605 nm streptavidin-conjugated quantum dots (QD-STA) as a
Fig. 1. Fabrication of the SiO2 nanopillars. (A) Schematic illustration of thefabrication process with gold nanoparticles as etching masks. (B) Typical SEMimage of a nanopillar with viewing angle at 52°. (C) SEM image of randomlydispersed nanopillars with viewing angle at 52°. The average distancebetween nanopillars is about 3–5 μm.
Fig. 2. Illumination profile surrounding a nanopillar. (A) Finite-element ana-lysis of the intensity distribution for a nanopillar of 150 nm in diameter and700 nm long. Purple line indicates the contour of 1∕e2 intensity (the intensityat the nanopillar surface 100 nm away from the platinum substrate is desig-nated to be 1). (B) Plot of the light intensity as a function of radial distancealong the horizontal dash line in A. The light intensity decays exponentiallyfrom the surface of the nanopillar. (C) Plot of the light intensity as a functionof z distance along the vertical dash line in A. The light intensity decays moreslowly along the z axis, penetrating approximately 500 nm from the tip ofthe nanopillar.
2 of 6 ∣ www.pnas.org/cgi/doi/10.1073/pnas.1015589108 Xie et al.
model system to test the use of nanopillars for single-moleculefluorescence imaging. For imaging purposes, the nanopillar sub-strate was flipped over onto a coverslip so that the nanopillarswere pointing downward toward the objective of an invertedmicroscope. Brightfield images with white-light illumination fromabove (white-light mode) revealed the nanopillar locations(Fig. 3A). Quantum dots were excited with a 532 nm laser eitherthrough the objective (epi-illumination mode) or through thenanopillars (nanopillar-illumination mode) (Fig. 3 B and C).Fluorescence signal was collected through the objective anddetected by a cooled, back-illuminated CCD camera at 10 framesper second.
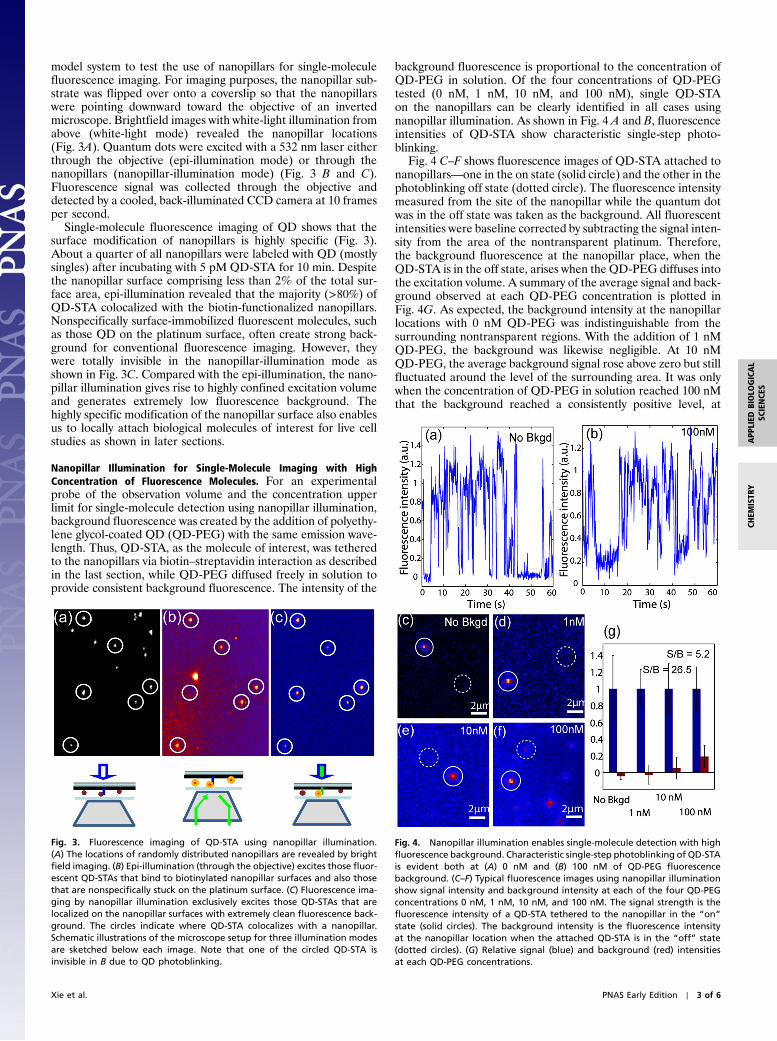
Single-molecule fluorescence imaging of QD shows that thesurface modification of nanopillars is highly specific (Fig. 3).About a quarter of all nanopillars were labeled with QD (mostlysingles) after incubating with 5 pM QD-STA for 10 min. Despitethe nanopillar surface comprising less than 2% of the total sur-face area, epi-illumination revealed that the majority (>80%) ofQD-STA colocalized with the biotin-functionalized nanopillars.Nonspecifically surface-immobilized fluorescent molecules, suchas those QD on the platinum surface, often create strong back-ground for conventional fluorescence imaging. However, theywere totally invisible in the nanopillar-illumination mode asshown in Fig. 3C. Compared with the epi-illumination, the nano-pillar illumination gives rise to highly confined excitation volumeand generates extremely low fluorescence background. Thehighly specific modification of the nanopillar surface also enablesus to locally attach biological molecules of interest for live cellstudies as shown in later sections.
Nanopillar Illumination for Single-Molecule Imaging with HighConcentration of Fluorescence Molecules. For an experimentalprobe of the observation volume and the concentration upperlimit for single-molecule detection using nanopillar illumination,background fluorescence was created by the addition of polyethy-lene glycol-coated QD (QD-PEG) with the same emission wave-length. Thus, QD-STA, as the molecule of interest, was tetheredto the nanopillars via biotin–streptavidin interaction as describedin the last section, while QD-PEG diffused freely in solution toprovide consistent background fluorescence. The intensity of the
background fluorescence is proportional to the concentration ofQD-PEG in solution. Of the four concentrations of QD-PEGtested (0 nM, 1 nM, 10 nM, and 100 nM), single QD-STAon the nanopillars can be clearly identified in all cases usingnanopillar illumination. As shown in Fig. 4 A and B, fluorescenceintensities of QD-STA show characteristic single-step photo-blinking.
Fig. 4 C–F shows fluorescence images of QD-STA attached tonanopillars—one in the on state (solid circle) and the other in thephotoblinking off state (dotted circle). The fluorescence intensitymeasured from the site of the nanopillar while the quantum dotwas in the off state was taken as the background. All fluorescentintensities were baseline corrected by subtracting the signal inten-sity from the area of the nontransparent platinum. Therefore,the background fluorescence at the nanopillar place, when theQD-STA is in the off state, arises when the QD-PEG diffuses intothe excitation volume. A summary of the average signal and back-ground observed at each QD-PEG concentration is plotted inFig. 4G. As expected, the background intensity at the nanopillarlocations with 0 nM QD-PEG was indistinguishable from thesurrounding nontransparent regions. With the addition of 1 nMQD-PEG, the background was likewise negligible. At 10 nMQD-PEG, the average background signal rose above zero but stillfluctuated around the level of the surrounding area. It was onlywhen the concentration of QD-PEG in solution reached 100 nMthat the background reached a consistently positive level, at
Fig. 3. Fluorescence imaging of QD-STA using nanopillar illumination.(A) The locations of randomly distributed nanopillars are revealed by brightfield imaging. (B) Epi-illumination (through the objective) excites those fluor-escent QD-STAs that bind to biotinylated nanopillar surfaces and also thosethat are nonspecifically stuck on the platinum surface. (C) Fluorescence ima-ging by nanopillar illumination exclusively excites those QD-STAs that arelocalized on the nanopillar surfaces with extremely clean fluorescence back-ground. The circles indicate where QD-STA colocalizes with a nanopillar.Schematic illustrations of the microscope setup for three illumination modesare sketched below each image. Note that one of the circled QD-STA isinvisible in B due to QD photoblinking.
Fig. 4. Nanopillar illumination enables single-molecule detection with highfluorescence background. Characteristic single-step photoblinking of QD-STAis evident both at (A) 0 nM and (B) 100 nM of QD-PEG fluorescencebackground. (C–F) Typical fluorescence images using nanopillar illuminationshow signal intensity and background intensity at each of the four QD-PEGconcentrations 0 nM, 1 nM, 10 nM, and 100 nM. The signal strength is thefluorescence intensity of a QD-STA tethered to the nanopillar in the “on”state (solid circles). The background intensity is the fluorescence intensityat the nanopillar location when the attached QD-STA is in the “off” state(dotted circles). (G) Relative signal (blue) and background (red) intensitiesat each QD-PEG concentrations.
Xie et al. PNAS Early Edition ∣ 3 of 6
CHEM
ISTR
YAPP
LIED
BIOLO
GICAL
SCIENCE
S
which the signal to background ratio was calculated to be approxi-mately 5. Thus, single-molecule detection through nanopillar-illumination can be achieved at solution concentrations of up to100 nM. This detection tolerance already renders some intracel-lular targets accessible.
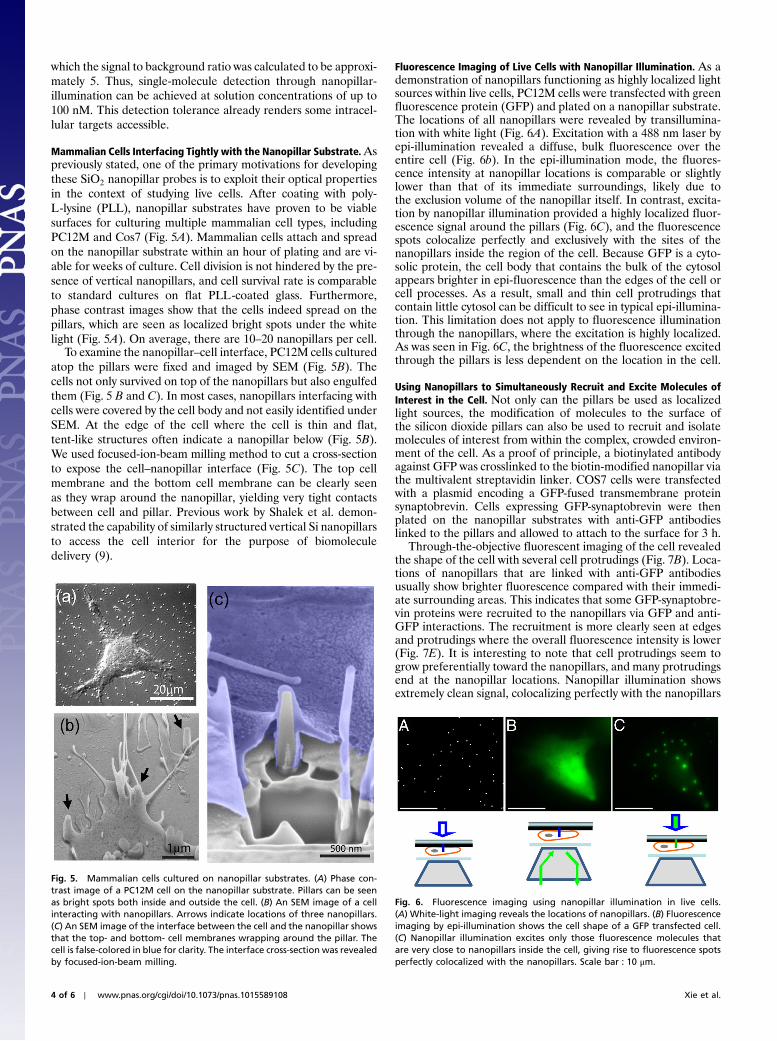
Mammalian Cells Interfacing Tightly with the Nanopillar Substrate.Aspreviously stated, one of the primary motivations for developingthese SiO2 nanopillar probes is to exploit their optical propertiesin the context of studying live cells. After coating with poly-L-lysine (PLL), nanopillar substrates have proven to be viablesurfaces for culturing multiple mammalian cell types, includingPC12M and Cos7 (Fig. 5A). Mammalian cells attach and spreadon the nanopillar substrate within an hour of plating and are vi-able for weeks of culture. Cell division is not hindered by the pre-sence of vertical nanopillars, and cell survival rate is comparableto standard cultures on flat PLL-coated glass. Furthermore,phase contrast images show that the cells indeed spread on thepillars, which are seen as localized bright spots under the whitelight (Fig. 5A). On average, there are 10–20 nanopillars per cell.
To examine the nanopillar–cell interface, PC12M cells culturedatop the pillars were fixed and imaged by SEM (Fig. 5B). Thecells not only survived on top of the nanopillars but also engulfedthem (Fig. 5 B and C). In most cases, nanopillars interfacing withcells were covered by the cell body and not easily identified underSEM. At the edge of the cell where the cell is thin and flat,tent-like structures often indicate a nanopillar below (Fig. 5B).We used focused-ion-beam milling method to cut a cross-sectionto expose the cell–nanopillar interface (Fig. 5C). The top cellmembrane and the bottom cell membrane can be clearly seenas they wrap around the nanopillar, yielding very tight contactsbetween cell and pillar. Previous work by Shalek et al. demon-strated the capability of similarly structured vertical Si nanopillarsto access the cell interior for the purpose of biomoleculedelivery (9).
Fluorescence Imaging of Live Cells with Nanopillar Illumination. As ademonstration of nanopillars functioning as highly localized lightsources within live cells, PC12M cells were transfected with greenfluorescence protein (GFP) and plated on a nanopillar substrate.The locations of all nanopillars were revealed by transillumina-tion with white light (Fig. 6A). Excitation with a 488 nm laser byepi-illumination revealed a diffuse, bulk fluorescence over theentire cell (Fig. 6b). In the epi-illumination mode, the fluores-cence intensity at nanopillar locations is comparable or slightlylower than that of its immediate surroundings, likely due tothe exclusion volume of the nanopillar itself. In contrast, excita-tion by nanopillar illumination provided a highly localized fluor-escence signal around the pillars (Fig. 6C), and the fluorescencespots colocalize perfectly and exclusively with the sites of thenanopillars inside the region of the cell. Because GFP is a cyto-solic protein, the cell body that contains the bulk of the cytosolappears brighter in epi-fluorescence than the edges of the cell orcell processes. As a result, small and thin cell protrudings thatcontain little cytosol can be difficult to see in typical epi-illumina-tion. This limitation does not apply to fluorescence illuminationthrough the nanopillars, where the excitation is highly localized.As was seen in Fig. 6C, the brightness of the fluorescence excitedthrough the pillars is less dependent on the location in the cell.
Using Nanopillars to Simultaneously Recruit and Excite Molecules ofInterest in the Cell. Not only can the pillars be used as localizedlight sources, the modification of molecules to the surface ofthe silicon dioxide pillars can also be used to recruit and isolatemolecules of interest from within the complex, crowded environ-ment of the cell. As a proof of principle, a biotinylated antibodyagainst GFP was crosslinked to the biotin-modified nanopillar viathe multivalent streptavidin linker. COS7 cells were transfectedwith a plasmid encoding a GFP-fused transmembrane proteinsynaptobrevin. Cells expressing GFP-synaptobrevin were thenplated on the nanopillar substrates with anti-GFP antibodieslinked to the pillars and allowed to attach to the surface for 3 h.
Through-the-objective fluorescent imaging of the cell revealedthe shape of the cell with several cell protrudings (Fig. 7B). Loca-tions of nanopillars that are linked with anti-GFP antibodiesusually show brighter fluorescence compared with their immedi-ate surrounding areas. This indicates that some GFP-synaptobre-vin proteins were recruited to the nanopillars via GFP and anti-GFP interactions. The recruitment is more clearly seen at edgesand protrudings where the overall fluorescence intensity is lower(Fig. 7E). It is interesting to note that cell protrudings seem togrow preferentially toward the nanopillars, and many protrudingsend at the nanopillar locations. Nanopillar illumination showsextremely clean signal, colocalizing perfectly with the nanopillars
Fig. 5. Mammalian cells cultured on nanopillar substrates. (A) Phase con-trast image of a PC12M cell on the nanopillar substrate. Pillars can be seenas bright spots both inside and outside the cell. (B) An SEM image of a cellinteracting with nanopillars. Arrows indicate locations of three nanopillars.(C) An SEM image of the interface between the cell and the nanopillar showsthat the top- and bottom- cell membranes wrapping around the pillar. Thecell is false-colored in blue for clarity. The interface cross-section was revealedby focused-ion-beam milling.
Fig. 6. Fluorescence imaging using nanopillar illumination in live cells.(A) White-light imaging reveals the locations of nanopillars. (B) Fluorescenceimaging by epi-illumination shows the cell shape of a GFP transfected cell.(C) Nanopillar illumination excites only those fluorescence molecules thatare very close to nanopillars inside the cell, giving rise to fluorescence spotsperfectly colocalized with the nanopillars. Scale bar : 10 μm.
4 of 6 ∣ www.pnas.org/cgi/doi/10.1073/pnas.1015589108 Xie et al.

inside the cell area (Fig. 7 C and F). The success of this schemeindicates that nanopillars not only function as localized lightsources inside the cell but can also locally probe cellular eventsor recruit molecules of interest.
DiscussionVertical SiO2 nanopillars provide highly localized excitation lightsources for in vitro systems as well as in live cells. The sub-diffraction-limited excitation volume would be very useful forprobing only a small number of fluorescence molecules in acrowded environment. For example, nanopillar probes could beused to photoactivate a small number of cell-expressed photoac-tivatable fluorescent proteins (35, 36), which would allow one tofollow the fate or diffusion of individual molecules in live cells.We are currently working on using nanopillar illumination forlocal photo uncaging of glutamate (37–40) for highly localizedapplication of neurotransmitter. Molecular specificity can beadded to the optical localization by virtue of the molecular mod-ification available to the nanopillars.
Materials and MethodsFabrication of SiO2 Nanopillars. Four-inch fused-silica wafers (500 μm thick-ness) were cleaned by standard prediffusion cleaning method (41) and sub-sequently coated with Poly-L-Lysine (PLL) by soaking in 1% PLL solution for5 min. After thoroughly rinsing the wafers with DI water, gold colloidalnanoparticle solution (Ted Pella) was applied on the wafer surface and incu-bated at room temperature for 10 min before rinsing off. The area density ofthe nonspecifically stuck gold colloidal particles depends on the concentra-tion of the colloidal solution applied. For most of our experiments, the den-sity was controlled to be about one per 10 μm2. The wafers were then dryetched in a reactive ion etcher with a gas mixture of O2 and CHF3 at flowrates of 30 standard cubic centimeters per minute (sccm) for O2 and 50 sccmfor CHF3. The pressure was kept at 40 milli-Torr and the voltage to ionize thegas mixture was maintained at 400 V. The RIE process lasted for 20–25 min atan etching rate of 35 nm∕min. Following the RIE process, a 5 min O2 plasmaetching step removed the organic residue produced by the RIE etching step.Ti and Pt layers were sequentially deposited by electron-beam evaporation at1–2 Å∕s to produce a double layer of 10nmTi/100nmPt. The 10 nm Ti under-layer allowed for good adhesion of Pt overlayer to the fused quartz sub-strate. The 100 nm Pt layer effectively blocks >99.9% of visible light. Toremove the excess metal deposited on the top and side walls of the nano-pillars, a brief hydrogen fluoride (HF) etching was applied. 2% HF solutionetches SiO2 slowly and can be well controlled. About 5 nm SiO2 was removedfrom each nanopillar in order to lift off the excess metal on the pillarside walls.
Surface Modification of SiO2 Nanopillars. For preparation and modification ofthe surface, silicon dioxide nanopillar substrates were first cleaned by oxygenplasma to remove any organic residues on the surface. The substrates werethen silanized with 2% aminopropyltriethoxysilane (APTES) in acetone for1 h, resulting in amine-terminated surface. After washing with acetone fol-lowed by isopropanol, the surfaces were dried in air. The new terminalamines were then reacted with 0.1 mg∕ml NHS-Biotin (Thermo Scientific)for 1 h by diluting 1 mg∕ml stock solution in DMSO into phosphate bufferedsaline (PBS). After thorough washing with PBS, the resulting biotin-termi-nated nanopillar substrates were stored in clean container for future uses.For single-molecule imaging of QD-STA, the biotin-modified substrate wasfirst blocked with 0.1 mg∕ml BSA in PBS for 1 hr before applying QD-STAat concentrations stipulated by the experiment. For high concentration back-ground studies, QD-PEG solutions at various concentrations were suppliedwith 0.1 mg∕ml BSA in water.
Computer Simulation of Optical Profile Surrounding the Nanopillar. Finite-element time-domain simulations of the optical intensity near the nanopil-lars were carried out using Comsol (COMSOL Inc.). The light used in thesimulation was 480 nm circularly polarized light. The refractive indices forfused quartz, water, and Pt were set at 1.48, 1.33, and 1.94–3.38i, respectively.The dimension of simulation area was set at 4 × 4 μm, an area large enoughso that the boundary effect is not significant. The grid spacing was setbetween 30 and 150 nm according to the need of spatial resolution. Finergrids were used for nanopillar and surrounding areas. The adaptive meshconsists of 30,000–35,000 elements.
Imaging Setup for fluorescence Imaging with Epi- and Nanopillar Illuminations.An inverted Nikon ECLIPSE Ti microscope was modified to incorporate bothepi- and nanopillar-illumination modes. The excitation light source was a50 mW 488 nm laser (Spectra-Physics). For epi-illumination, the excitationlaser beamwas introduced into a TIRF objective (1.49 NA, Nikon) that focusedthe light on the sample from the bottom. The beam hit the nanopillar sub-strate at an angle and was reflected by the Pt layer. For the nanopillar illu-mination, the laser beam was guided above the microscope and hit thesample from the top. The beam was focused to an approximately 100-μmdiameter spot covering the field of view uniformly. In both illuminationmodes, the fluorescent emission was collected by the same objective, passedthrough a long-pass dichroic mirror and a band-pass emission filter, and col-lected by an EMCCD camera (Andor). For fluorescence imaging, the sub-strates were housed in a sealed custom-designed polydimethylsiloxanechamber to prevent evaporation of the solutions.
Scanning Electron Microscopy. To prepare samples for SEM imaging, PC12Mcells were plated on nanopillar substrates and allowed to attach for 1 d.The cells were then fixed overnight in 2% glutaraldehyde in 0.1 M sodiumcacodylate buffer (pH 7.3), washed for 5 min in the same buffer, and post-fixed for 1–2 h in 1% osmium tetroxide. After washing in DI water twice for5 min each, the sample was dehydrated by successive exchanges to increasingconcentrations of ethanol (50%, 70%, 90%, 100%, and 100% again). Thesample in 100% ethanol was then dried with liquid CO2 in a critical pointdrier and sputter coated with a 2 nm layer of Pd/Au to enhance the contrast.The sample was imaged using a FEI Strata 235B dual-beam SEM/FIB systemthat combines high resolution SEM imaging and ion beam etching at thesame time. FIB provides submicron dissection of the prepared samples inorder to expose the cell–nanopillar cross-section.
Cell Culture on the Nanopillar Substrate. PC12M or COS7 cells were plated onnanopillar substrates at a cell density of 106∕ml and cultured in Dulbecco’sModified Eagle Medium (DMEM) supplemented with 10% fetal bovineserum and 1% penicillin/streptomycin. Plasmid transfections were achievedby adding amixture of 1 μg of DNA and 3 μl of lipofectamine to each well in a12-well tissue culture plate. The cells were allowed to recover for 24 hrsbefore replated on the nanopillar substrate. To label anti-GFP antibodiesto the nanopillars, the biotin-conjugated nanopillar substrates were pre-pared as noted previously and treated with 1 nM nonfluorescent streptavidinfor 10 min. After washing out excess streptavidin, 1 nM biotin-labeled anti-GFP antibody (Invitrogen) was linked to the nanopillars via the multivalentstreptavidin linker.
ACKNOWLEDGMENTS. This work was supported by the Bio-X InterdisciplinaryInitiatives Program, National Institutes of Health Grant NS057906, a Dreyfusnew faculty award, a Searle Scholar Award, and a Packard Science andEngineering Fellowship to B.C.
Fig. 7. Antibody-labeled nanopillars simultaneously recruit and illuminateproteins of interest in live cells. (A) White-light imaging reveals the locationsof the nanopillars modified with antibodies against GFP. (B) Fluorescenceimaging by epi-illumination shows the shape of a COS7 cell expressingGFP-synaptobrevin. (C) Nanopillar illumination shows extremely clean signal,colocalizing perfectly with the nanopillars inside the cell area. (D–F) Zoom-inimages show that nanopillar locations usually have brighter fluorescencecompared with surrounding areas, suggesting that some GFP-synaptobrevinproteins were recruited to the nanopillars via GFP and anti-GFP interactions.Scale bar : 10 μm.
Xie et al. PNAS Early Edition ∣ 5 of 6
CHEM
ISTR
YAPP
LIED
BIOLO
GICAL
SCIENCE
S

1. Medintz IL, Uyeda HT, Goldman ER, Mattoussi H (2005) Quantum dot bioconjugatesfor imaging, labelling and sensing. Nat Mater 4:435–446.
2. Alivisatos AP, Gu W, Larabell C (2005) Quantum dots as cellular probes. Annu RevBiomed Eng 7:55–76.
3. Howarth M, et al. (2008) Monovalent, reduced-size quantum dots for imaging recep-tors on living cells. Nat Methods 5:397–399.
4. Cui Y, Wei Q, Park H, Lieber CM (2001) Nanowire nanosensors for highly sensitive andselective detection of biological and chemical species. Science 293:1289–1292.
5. Nakayama Y, et al. (2007) Tunable nanowire nonlinear optical probe. Nature447:1098–1101.
6. Tian B, et al. (2010) Three-dimensional, flexible nanoscale field-effect transistors aslocalized bioprobes. Science 329:830–834.
7. Kam NW, O’Connell M, Wisdom JA, Dai H (2005) Carbon nanotubes as multifunctionalbiological transporters and near-infrared agents for selective cancer cell destruction.Proc Natl Acad Sci USA 102:11600–11605.
8. Kim W, Ng JK, Kunitake ME, Conklin BR, Yang P (2007) Interfacing silicon nanowireswith mammalian cells. J Am Chem Soc 129:7228–7229.
9. Shalek AK, et al. (2010) Vertical silicon nanowires as a universal platform for deliveringbiomolecules into living cells. Proc Natl Acad Sci USA 107:1870–1875.
10. Xie C, et al. (2010) Noninvasive neuron pinning with nanopillar arrays. Nano Lett10:4020–4024.
11. Hallstrom W, et al. (2007) Gallium phosphide nanowires as a substrate for culturedneurons. Nano Lett 7:2960–2965.
12. Jiang K, et al. (2009) Medicinal surface modification of silicon nanowires: Impact oncalcification and stromal cell proliferation. ACS Appl Mater Interfaces 1:266–269.
13. Qi S, Yi C, Ji S, Fong CC, Yang M (2009) Cell adhesion and spreading behavior onvertically aligned silicon nanowire arrays. ACS Appl Mater Interfaces 1:30–34.
14. Turner AM, et al. (2000) Attachment of astroglial cells to microfabricated pillar arraysof different geometries. J Biomed Mater Res 51:430–441.
15. Moerner WE (2007) New directions in single-molecule imaging and analysis. Proc NatlAcad Sci USA 104:12596–12602.
16. Sako Y, Yanagida T (2003) Single-molecule visualization in cell biology. Nat Rev MolCell Biol Suppl:SS1–5.
17. Hell SW (2009) Microscopy and its focal switch. Nat Methods 6:24–32.18. Joo C, Balci H, Ishitsuka Y, Buranachai C, Ha T (2008) Advances in single-molecule fluor-
escence methods for molecular biology. Annu Rev Biochem 77:51–76.19. Axelrod D, Burghardt TP, Thompson NL (1984) Total internal reflection fluorescence.
Annu Rev Biophys Bioeng 13:247–268.20. Sako Y, Uyemura T (2002) Total internal reflection fluorescence microscopy for single-
molecule imaging in living cells. Cell Struct Funct 27:357–365.21. Levene MJ, et al. (2003) Zero-mode waveguides for single-molecule analysis at high
concentrations. Science 299:682–686.
22. Moran-Mirabal JM, Craighead HG (2008) Zero-mode waveguides: Sub-wavelengthnanostructures for single molecule studies at high concentrations. Methods 46:11–17.
23. Samiee KT, Foquet M, Guo L, Cox EC, Craighead HG (2005) λ-Repressor oligomerizationkinetics at high concentrations using fluorescence correlation spectroscopy inzero-mode waveguides. Biophys J 88:2145–2153.
24. Steyer JA, Almers W (2001) A real-time view of life within 100 nm of the plasmamembrane. Nat Rev Mol Cell Biol 2:268–275.
25. Jaiswal JK, Simon SM (2007) Imaging single events at the cell membrane. Nat ChemBiol 3:92–98.
26. Murcia MJ, Garg S, Naumann CA (2007) Single-molecule fluorescence microscopy todetermine phospholipid lateral diffusion. Methods Mol Biol 400:277–294.
27. Betzig E, Trautman JK (1992) Near-field optics: Microscopy, spectroscopy, and surfacemodification beyond the diffraction limit. Science 257:189–195.
28. Lewis A, et al. (2003) Near-field optics: From subwavelength illumination tonanometric shadowing. Nat Biotechnol 21:1378–1386.
29. Krichevsky O, Bonnet G (2002) Fluorescence correlation spectroscopy: The techniqueand its applications. Rep Prog Phys 65:251–297.
30. Haustein E, Schwille P (2007) Fluorescence correlation spectroscopy: Novel variationsof an established technique. Annu Rev Bioph Biom 36:151–169.
31. Roy R, Hohng S, Ha T (2008) A practical guide to single-molecule FRET. Nat Methods5:507–516.
32. Xia Z, Rao J (2009) Biosensing and imaging based on bioluminescence resonanceenergy transfer. Curr Opin Biotechnol 20:37–44.
33. Blom H, Kastrup L, Eggeling C (2006) Fluorescence fluctuation spectroscopy in reduceddetection volumes. Curr Pharm Biotechno 7:51–66.
34. Medina MA, Schwille P (2002) Fluorescence correlation spectroscopy for the detectionand study of single molecules in biology. Bioessays 24:758–764.
35. Lippincott-Schwartz J, Patterson GH (2009) Photoactivatable fluorescent proteins fordiffraction-limited and super-resolution imaging. Trends Cell Biol 19:555–565.
36. Patterson GH (2008) Photoactivation and imaging of photoactivatable fluorescentproteins. Current Protocols in Cell Biology (Wiley, New York), Unit 21.6.
37. Ellis-Davies GC (2007) Caged compounds: Photorelease technology for control ofcellular chemistry and physiology. Nat Methods 4:619–628.
38. Adams SR, Tsien RY (1993) Controlling Cell Chemistry with Caged Compounds. AnnuRev Physiol 55:755–784.
39. Callaway EM, Yuste R (2002) Stimulating neurons with light. Curr Opin Neurobiol12:587–592.
40. Kramer RH, Chambers JJ, Trauner D (2005) Photochemical tools for remote control ofion channels in excitable cells. Nat Chem Biol 1:360–365.
41. Reinhardt KA, Kern W (2008) Handbook of Silicon Wafer Cleaning Technology(William Andrew, Norwich, NY), 2nd Ed.
6 of 6 ∣ www.pnas.org/cgi/doi/10.1073/pnas.1015589108 Xie et al.