Embed Size (px)
Citation preview

Veterinary clinical studies Key issues for
statistical analysis
Didier [email protected]
ECVPT Workshop July 2009
Ecole NationaleVétérinairede Toulouse
Can be downloaded at http://www.biostat.envt.fr/spip/spip.php?article34
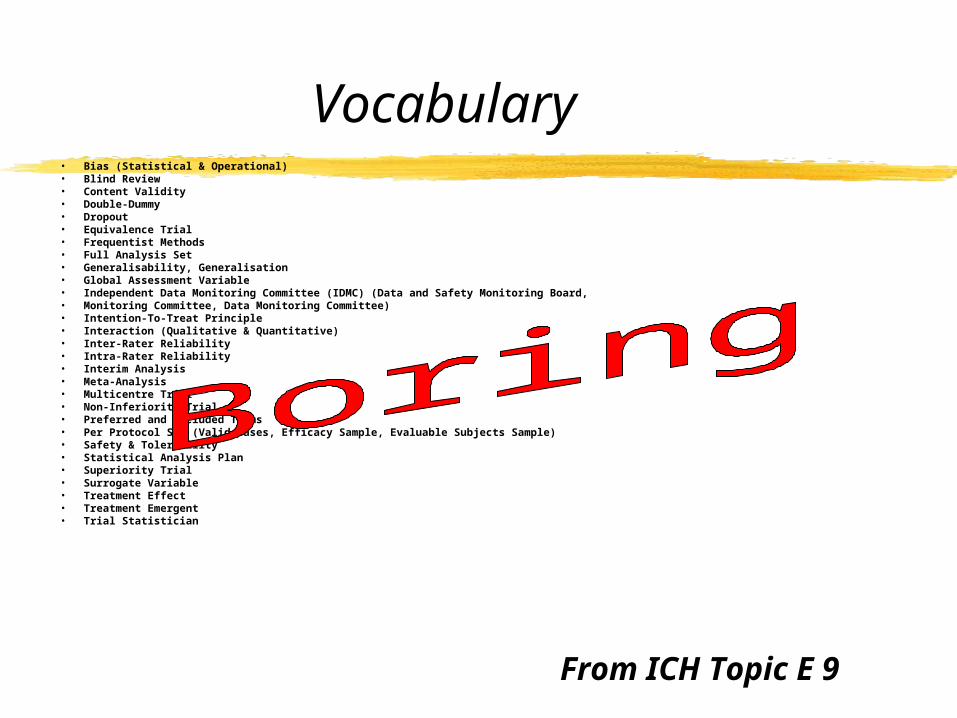
Vocabulary• Bias (Statistical & Operational)• Blind Review• Content Validity• Double-Dummy• Dropout• Equivalence Trial• Frequentist Methods• Full Analysis Set• Generalisability, Generalisation• Global Assessment Variable• Independent Data Monitoring Committee (IDMC) (Data and Safety Monitoring Board,• Monitoring Committee, Data Monitoring Committee)• Intention-To-Treat Principle• Interaction (Qualitative & Quantitative)• Inter-Rater Reliability• Intra-Rater Reliability• Interim Analysis• Meta-Analysis• Multicentre Trial• Non-Inferiority Trial• Preferred and Included Terms• Per Protocol Set (Valid Cases, Efficacy Sample, Evaluable Subjects Sample)• Safety & Tolerability• Statistical Analysis Plan• Superiority Trial• Surrogate Variable• Treatment Effect• Treatment Emergent• Trial Statistician
From ICH Topic E 9
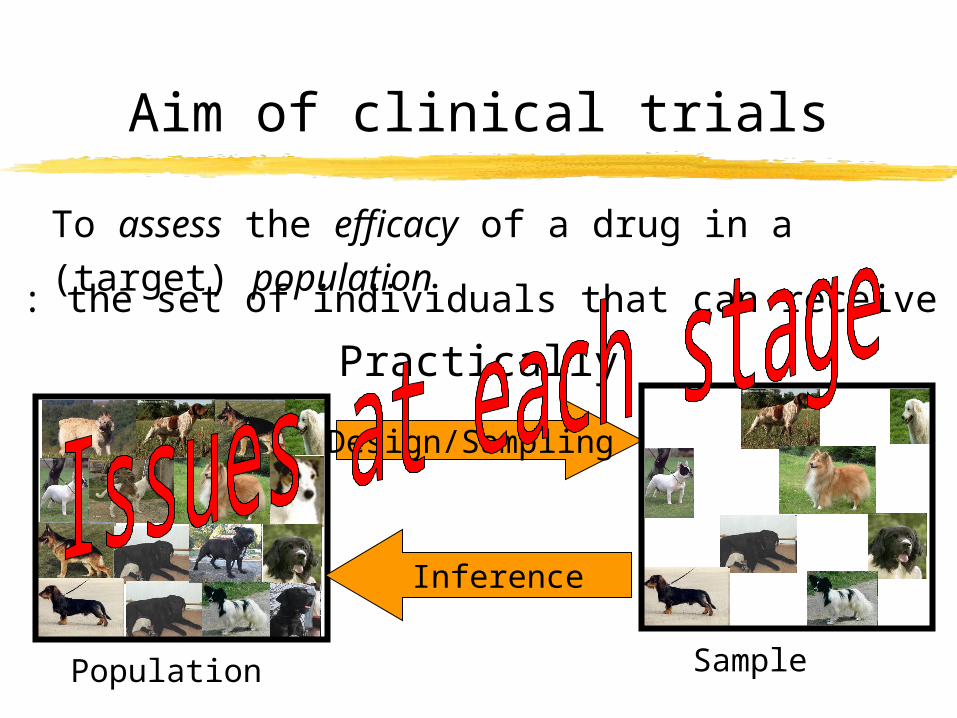
Aim of clinical trials
To assess the efficacy of a drug in a (target) population
Population : the set of individuals that can receive the drug
Practically
Population
Design/Sampling
Sample
Inference
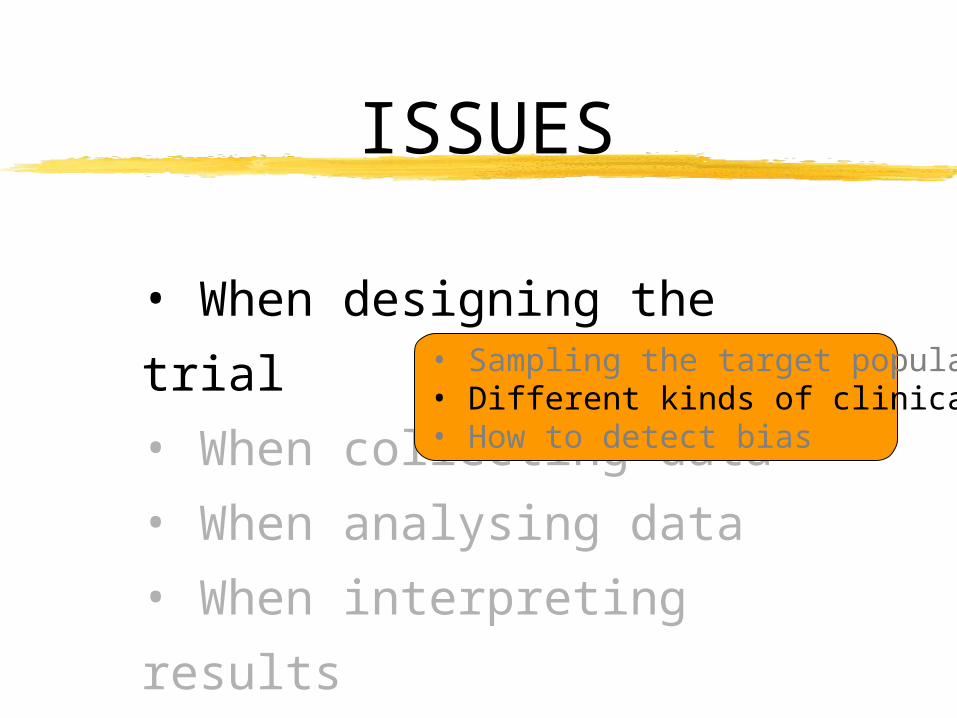
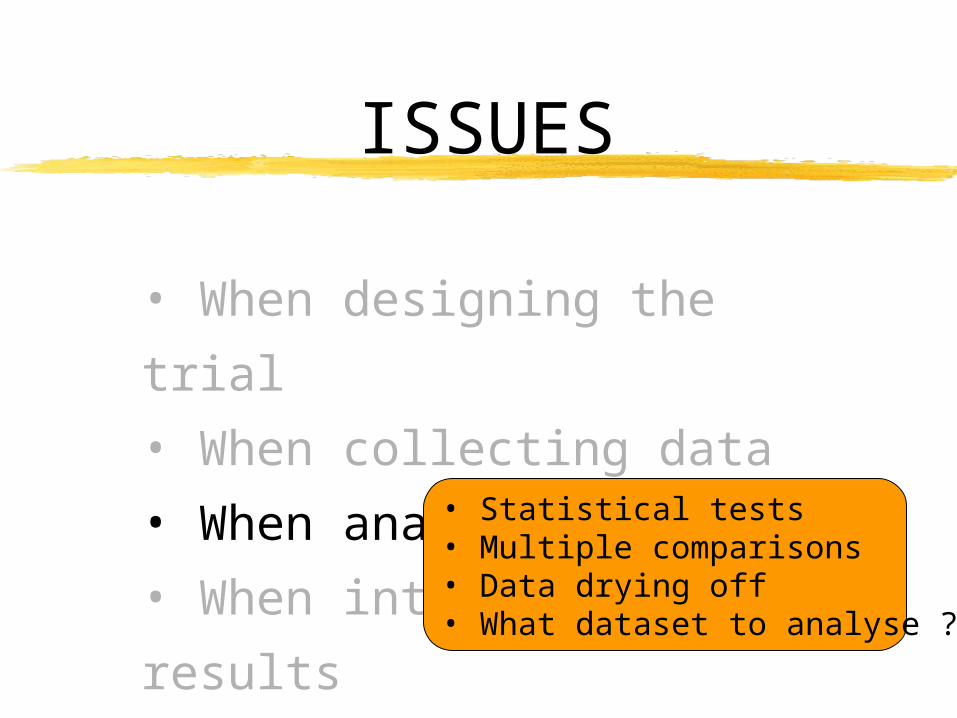
ISSUES
• When designing the trial
• When collecting data
• When analysing data
• When interpreting results
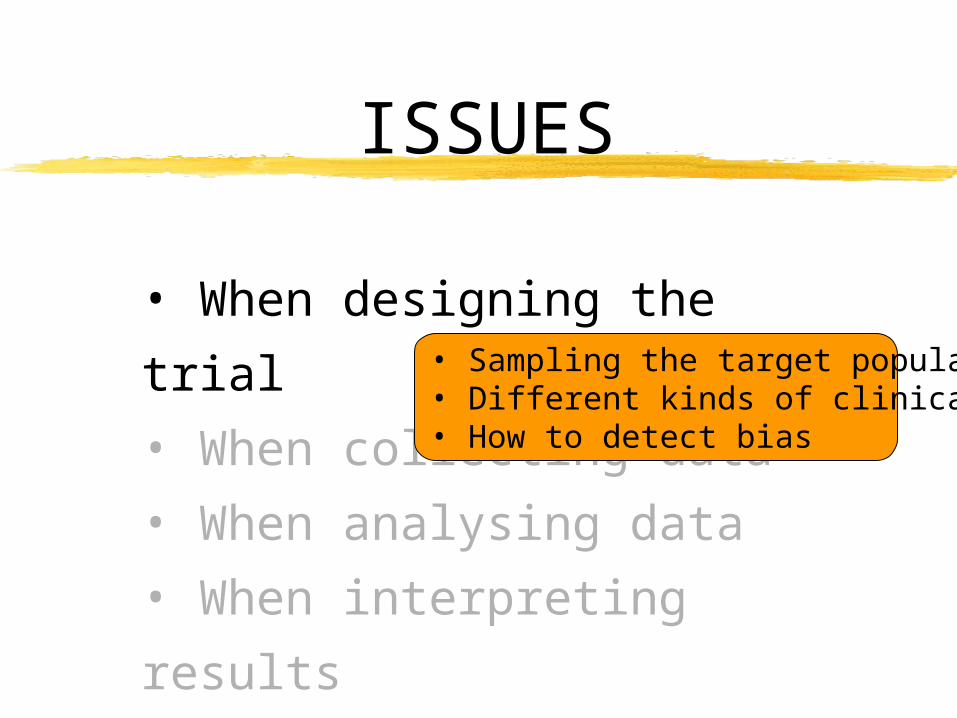
ISSUES
• When designing the trial
• When collecting data
• When analysing data
• When interpreting results
• Sampling the target population• Different kinds of clinical trials• How to detect bias
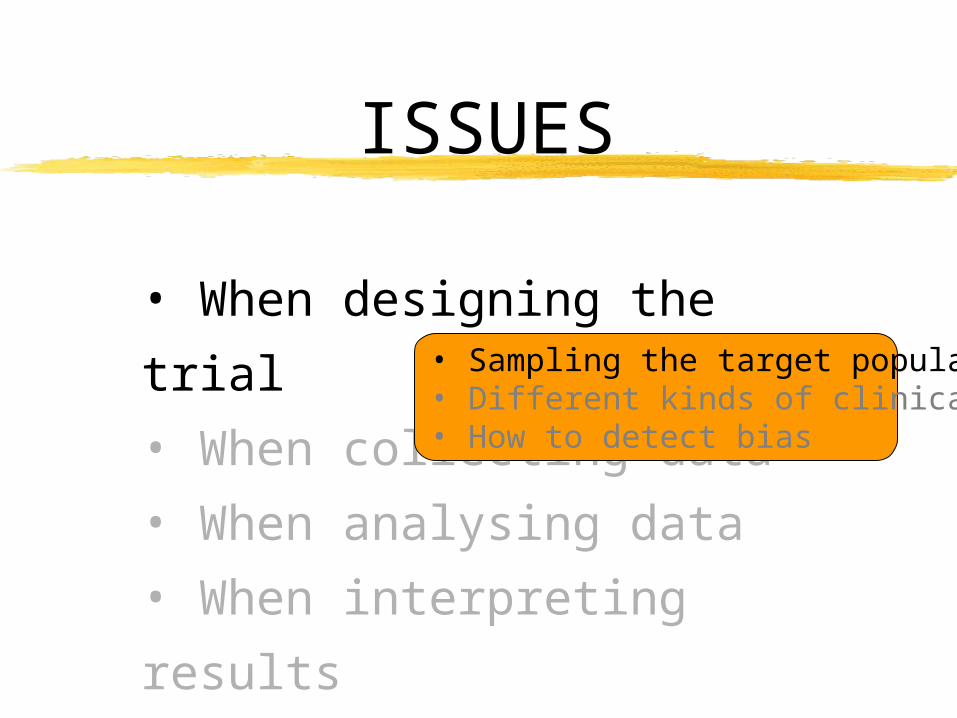
ISSUES
• When designing the trial
• When collecting data
• When analysing data
• When interpreting results
• Sampling the target population• Different kinds of clinical trials• How to detect bias
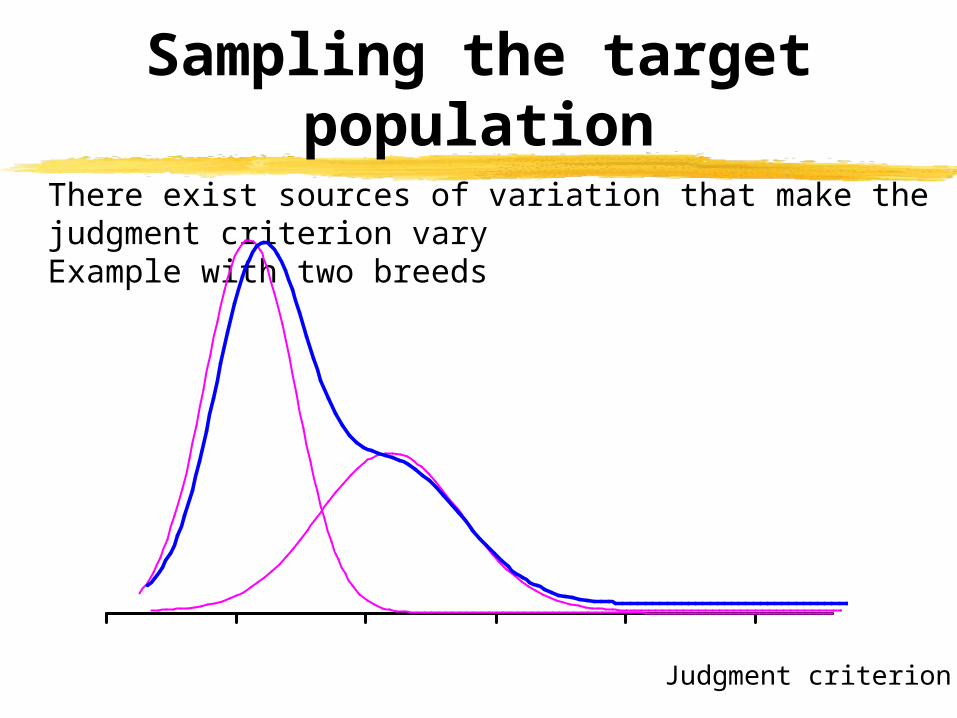
Sampling the target population
There exist sources of variation that make the judgment criterion varyExample with two breeds
Judgment criterion
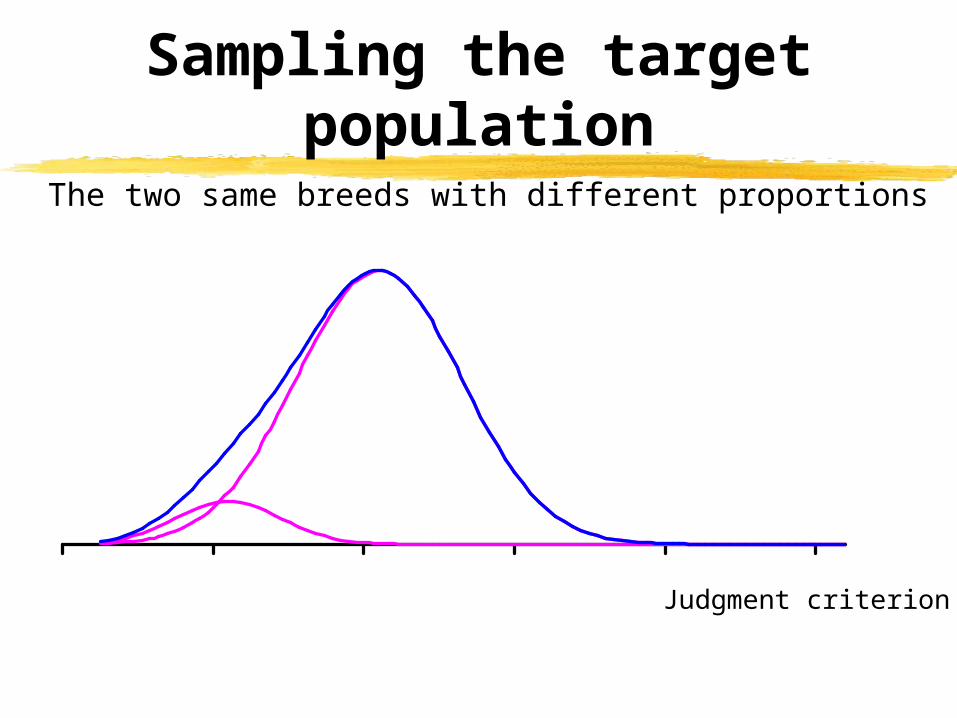
Sampling the target population
The two same breeds with different proportions
Judgment criterion
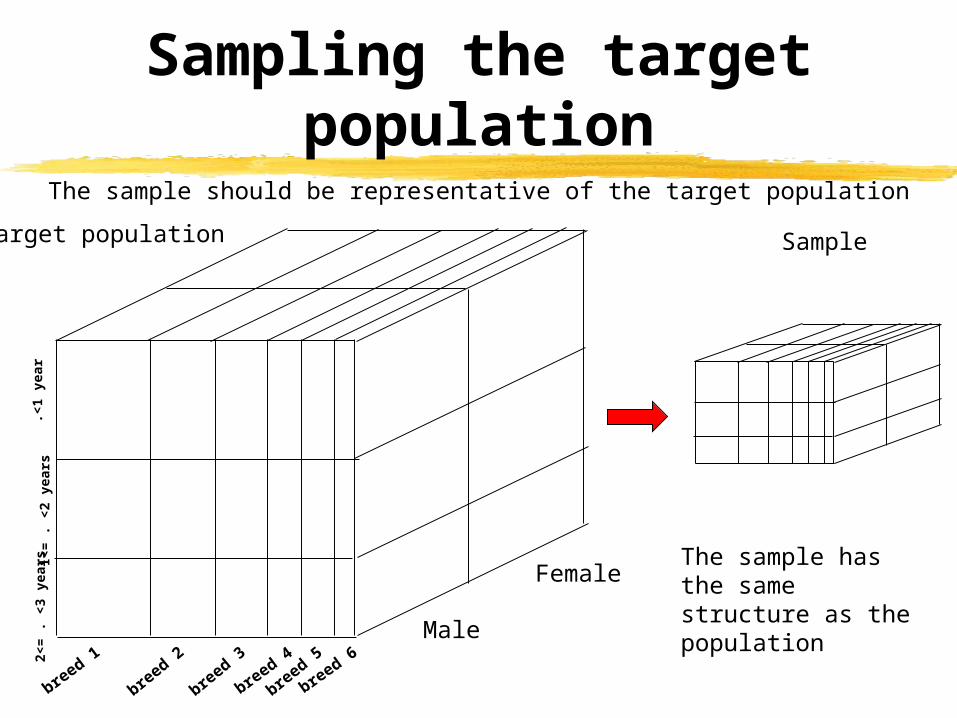
Sampling the target population
The sample should be representative of the target population
Target population
breed 3
breed 5
breed 1
breed 2
breed 4
breed 6
.<1
year
1<=
. <
2 ye
ars
2<=
. <
3 ye
ars
Male
Female
Sample
The sample has the same structure as the population
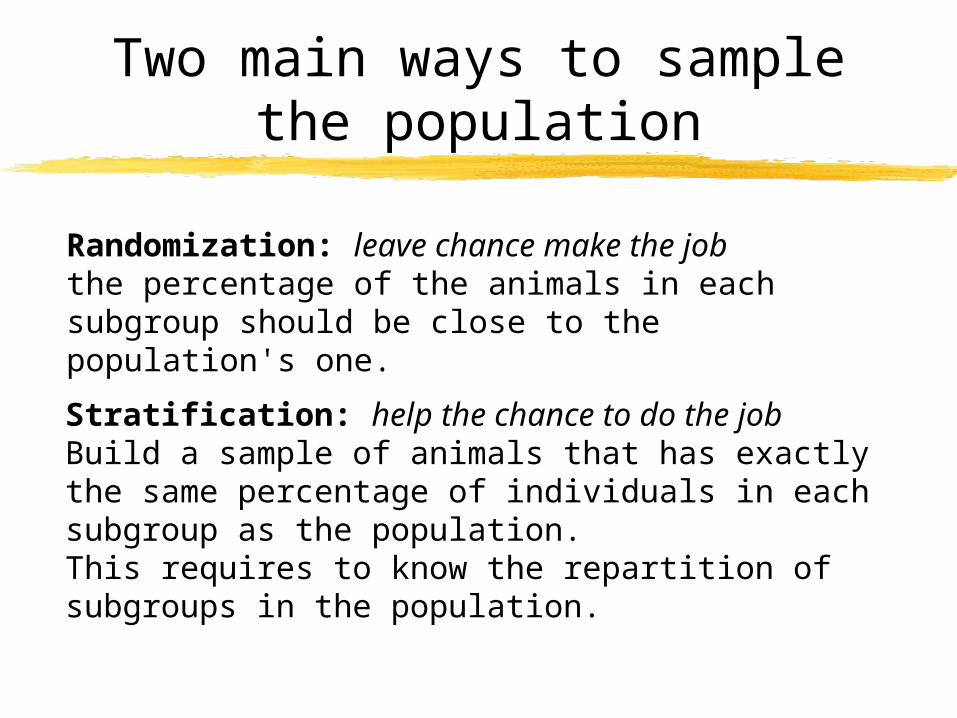
Two main ways to sample the population
Randomization: leave chance make the jobthe percentage of the animals in each subgroup should be close to the population's one.
Stratification: help the chance to do the jobBuild a sample of animals that has exactly the same percentage of individuals in each subgroup as the population.This requires to know the repartition of subgroups in the population.
11
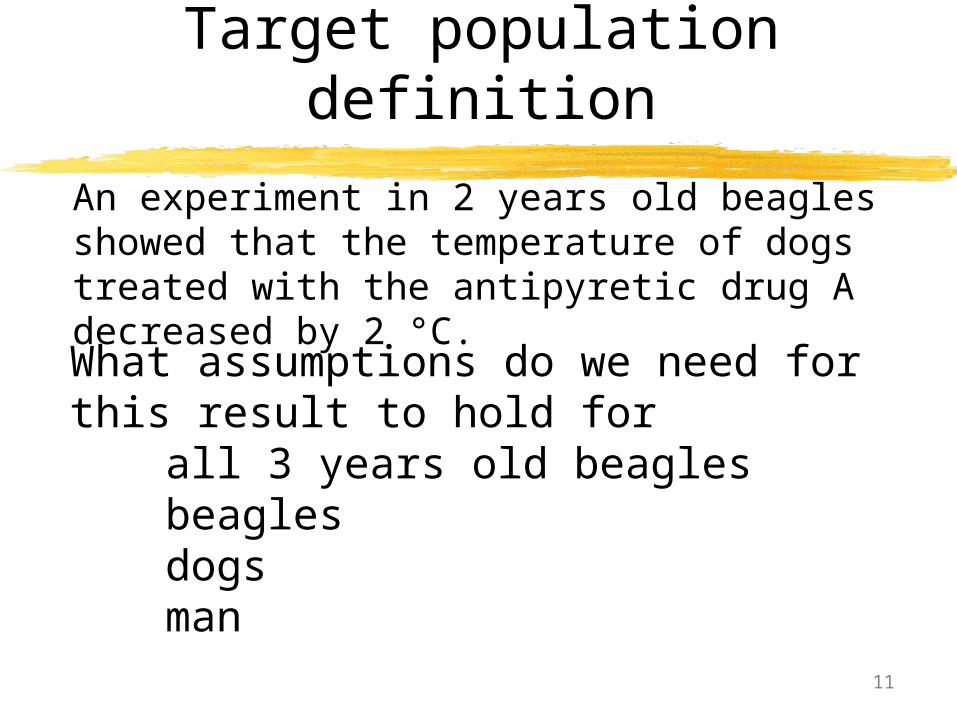
Target population definition
An experiment in 2 years old beagles showed that the temperature of dogs treated with the antipyretic drug A decreased by 2 °C.
What assumptions do we need for this result to hold for
all 3 years old beaglesbeaglesdogsman
ISSUES
• When designing the trial
• When collecting data
• When analysing data
• When interpreting results
• Sampling the target population• Different kinds of clinical trials• How to detect bias
Different kinds of clinical trials
• Non inferiority
• Superiority
• Equivalence
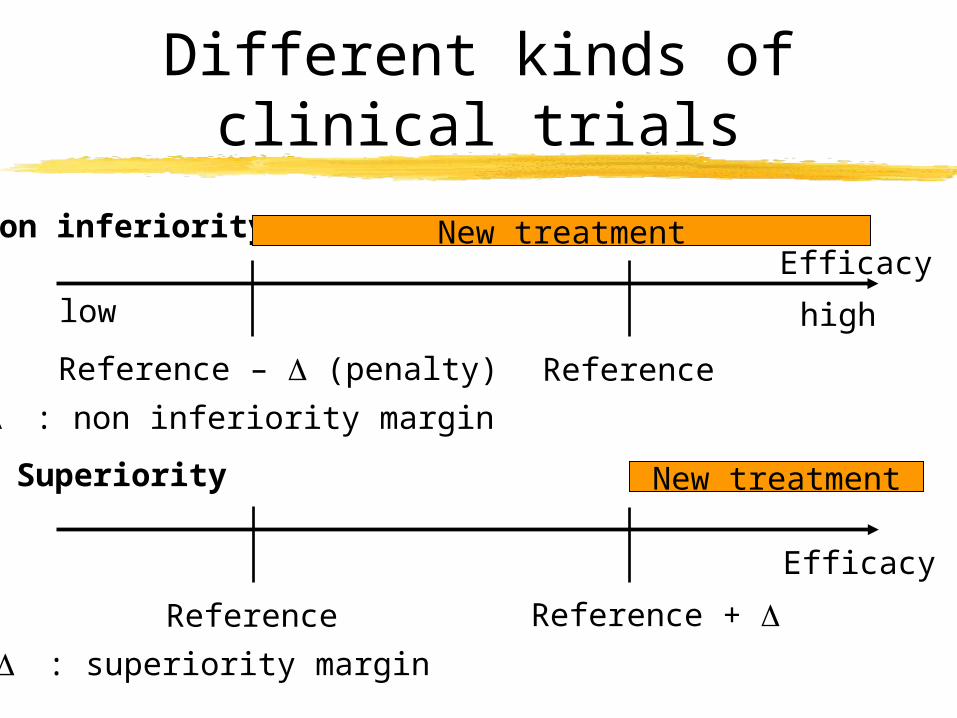
Different kinds of clinical trials
EfficacyNon inferiority
Reference
New treatment
Reference – (penalty)
: non inferiority margin
Efficacy
Reference + Reference
New treatmentSuperiority
: superiority margin
low high
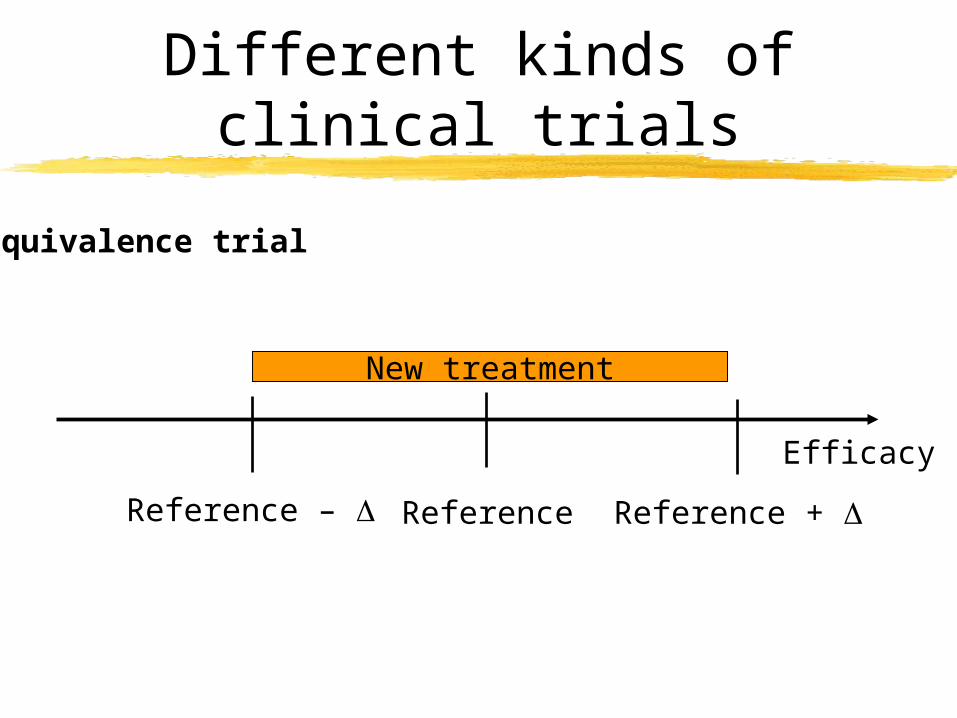
Different kinds of clinical trials
Efficacy
Equivalence trial
ReferenceReference –
New treatment
Reference +
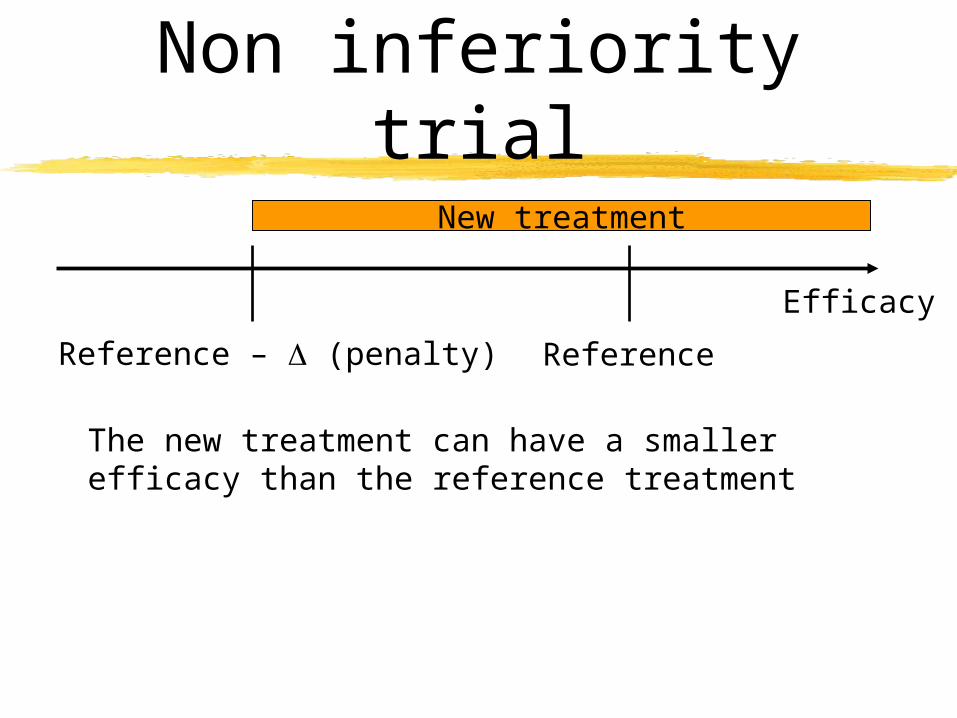
Non inferiority trial
Efficacy
ReferenceReference – (penalty)
New treatment
The new treatment can have a smaller efficacy than the reference treatment
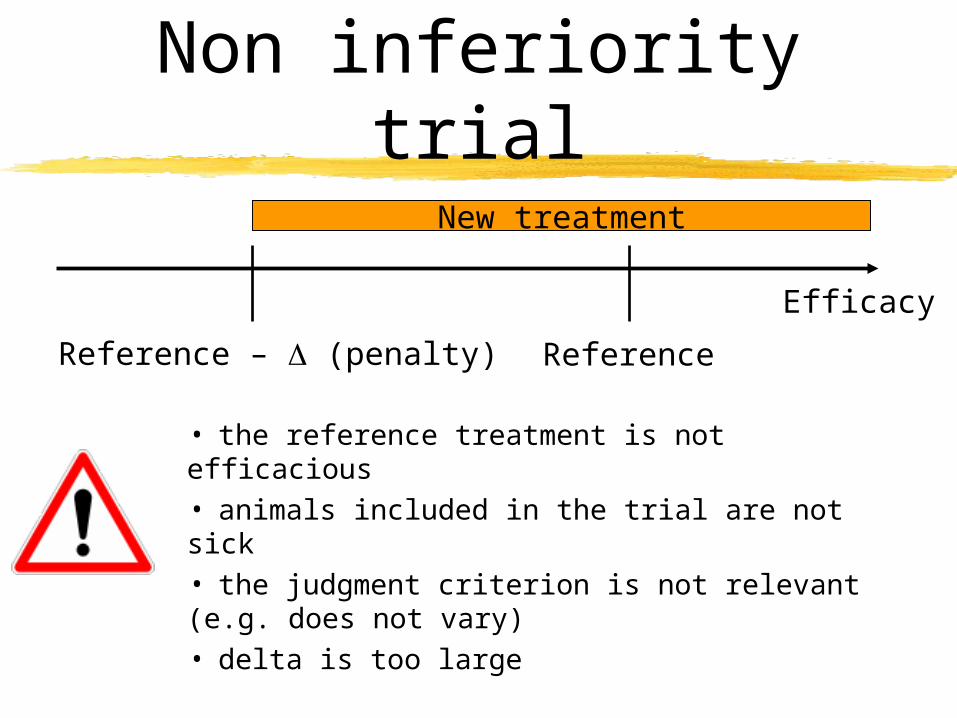
Non inferiority trial
Efficacy
ReferenceReference – (penalty)
New treatment
• the reference treatment is not efficacious• animals included in the trial are not sick• the judgment criterion is not relevant (e.g. does not vary)• delta is too large
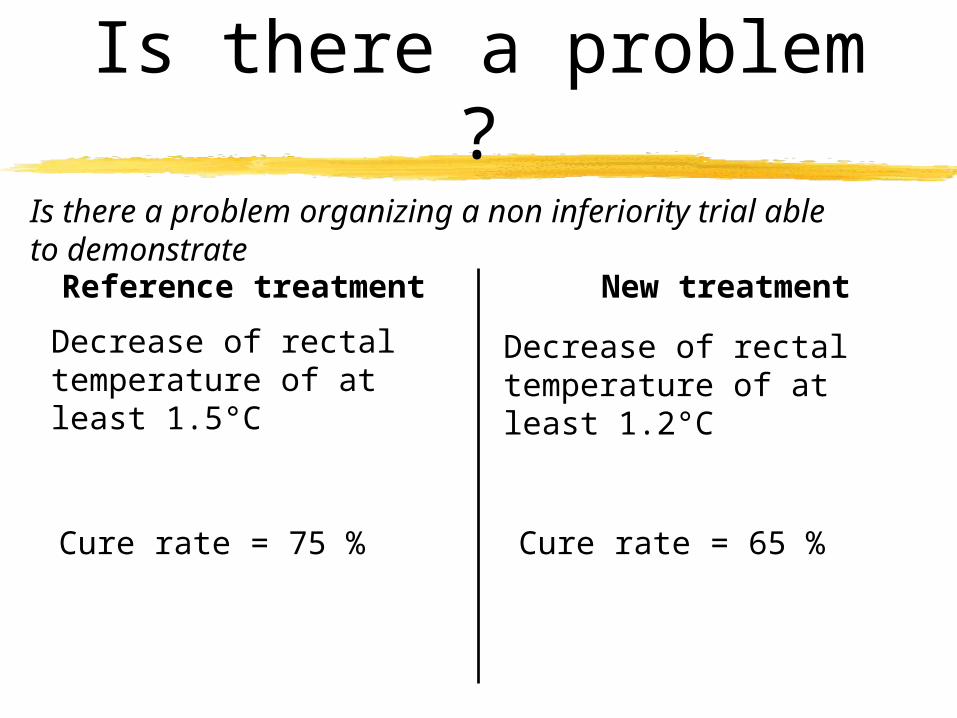
Is there a problem ?
Reference treatment New treatment
Decrease of rectal temperature of at least 1.5°C
Decrease of rectal temperature of at least 1.2°C
Cure rate = 75 % Cure rate = 65 %
Is there a problem organizing a non inferiority trial able to demonstrate
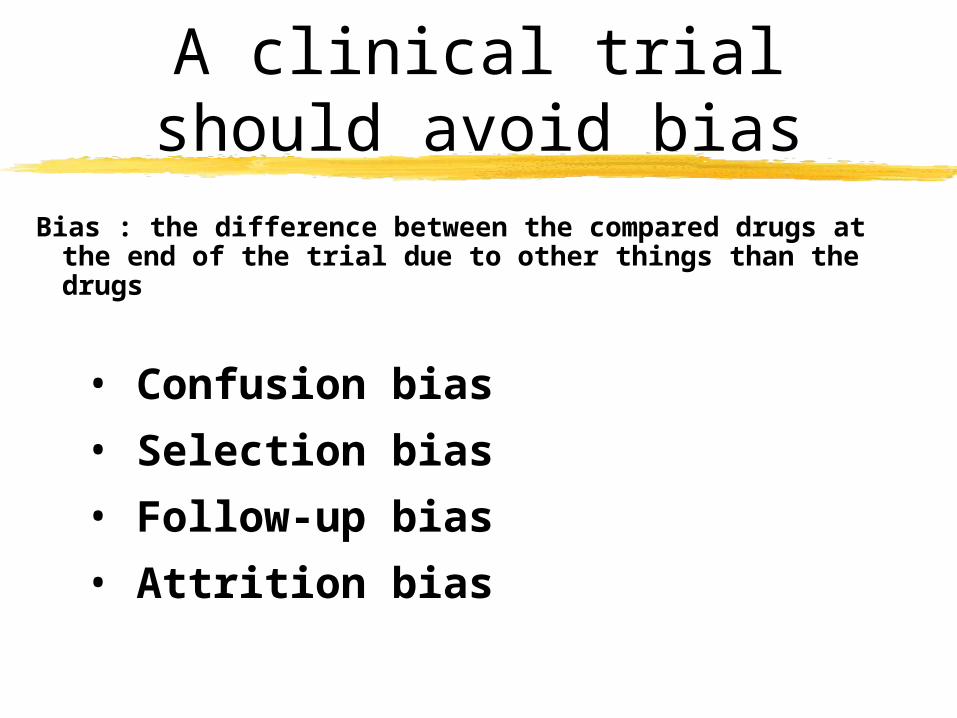
A clinical trial should avoid bias
Bias : the difference between the compared drugs at the end of the trial due to other things than the drugs
• Confusion bias
• Selection bias
• Follow-up bias
• Attrition bias
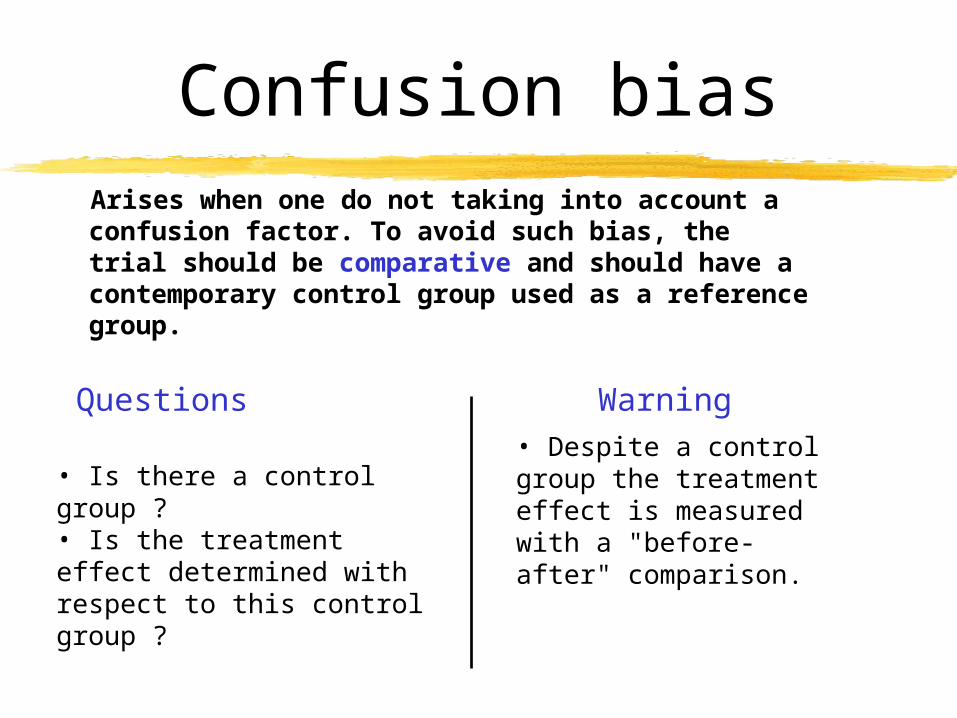
Confusion biasArises when one do not taking into account a confusion factor. To avoid such bias, the trial should be comparative and should have a contemporary control group used as a reference group.
Questions Warning
• Is there a control group ?• Is the treatment effect determined with respect to this control group ?
• Despite a control group the treatment effect is measured with a "before-after" comparison.
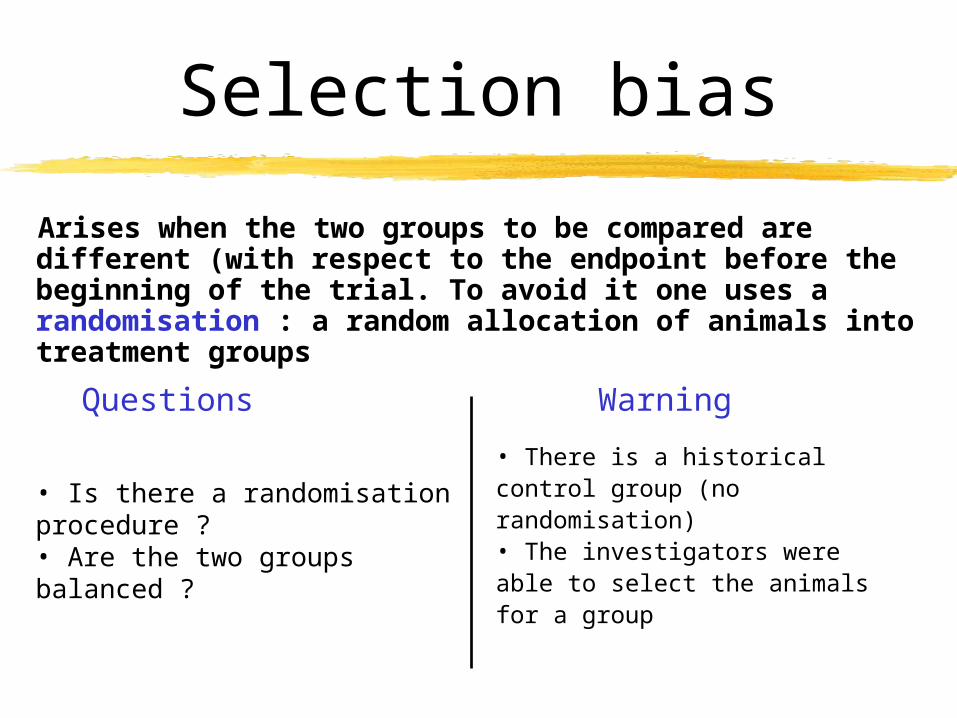
Selection bias
Arises when the two groups to be compared are different (with respect to the endpoint before the beginning of the trial. To avoid it one uses a randomisation : a random allocation of animals into treatment groups
Questions Warning
• Is there a randomisation procedure ? • Are the two groups balanced ?
• There is a historical control group (no randomisation)• The investigators were able to select the animals for a group
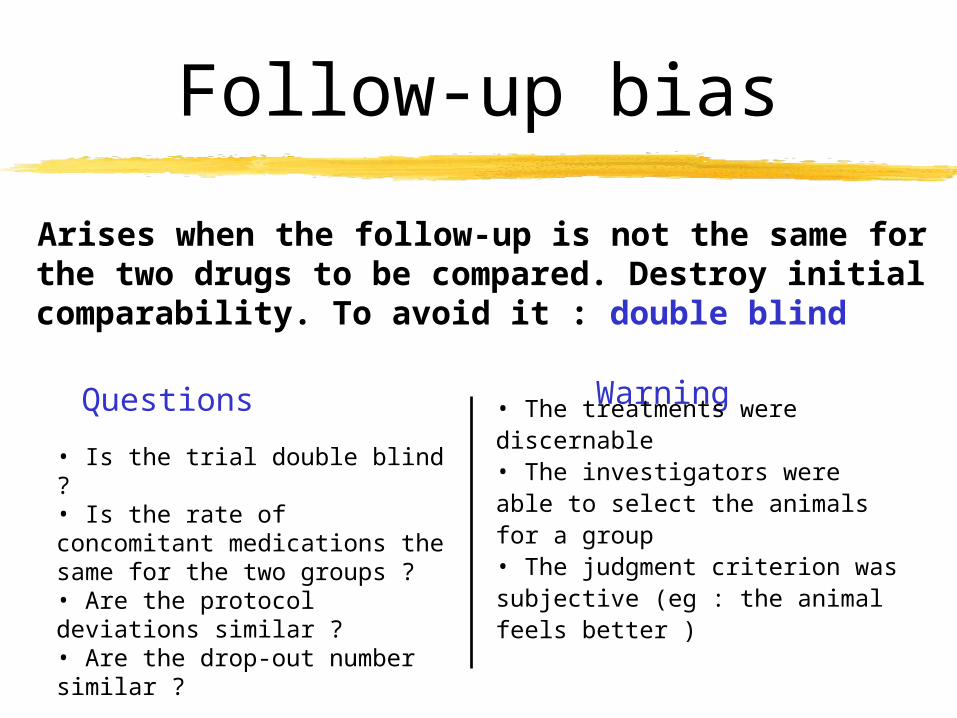
Follow-up bias
Arises when the follow-up is not the same for the two drugs to be compared. Destroy initial comparability. To avoid it : double blind
Questions Warning
• Is the trial double blind ?• Is the rate of concomitant medications the same for the two groups ?• Are the protocol deviations similar ?• Are the drop-out number similar ?
• The treatments were discernable• The investigators were able to select the animals for a group • The judgment criterion was subjective (eg : the animal feels better )
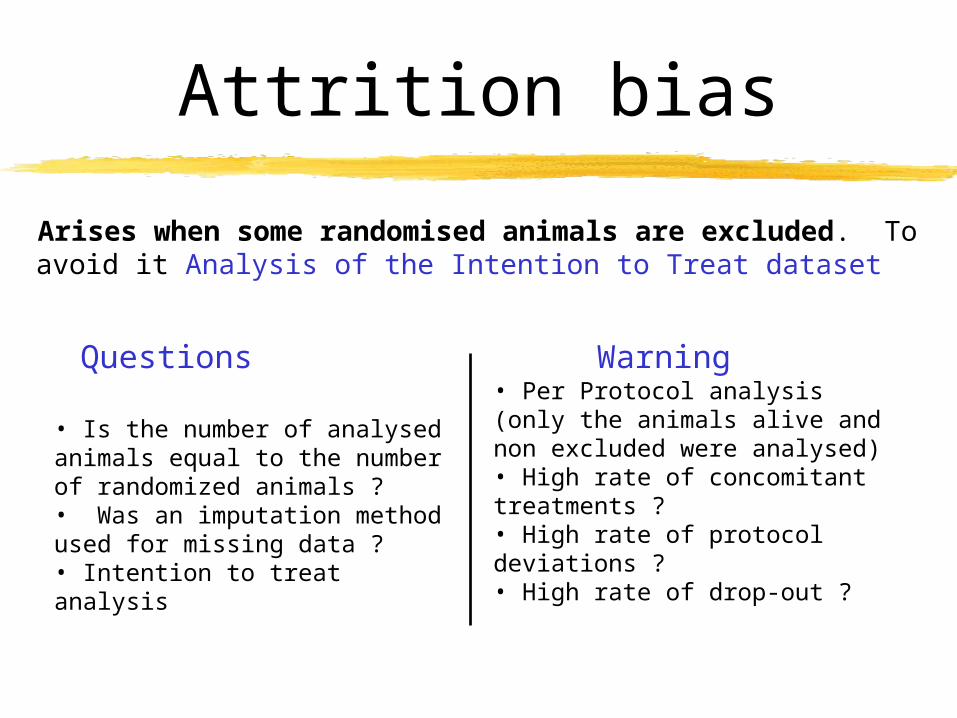
Attrition bias
Arises when some randomised animals are excluded. To avoid it Analysis of the Intention to Treat dataset
Questions Warning
• Is the number of analysed animals equal to the number of randomized animals ?• Was an imputation method used for missing data ?• Intention to treat analysis
• Per Protocol analysis (only the animals alive and non excluded were analysed)• High rate of concomitant treatments ?• High rate of protocol deviations ?• High rate of drop-out ?
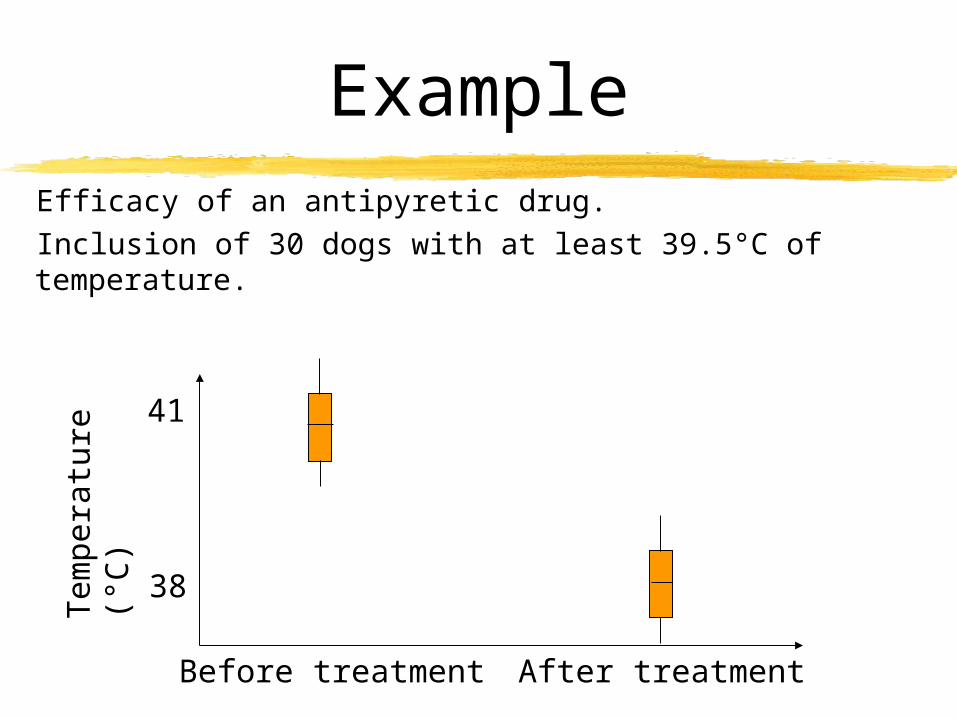
Example
Efficacy of an antipyretic drug.
Inclusion of 30 dogs with at least 39.5°C of temperature.
Tem
pera
ture
(°C
)
Before treatment After treatment
41
38
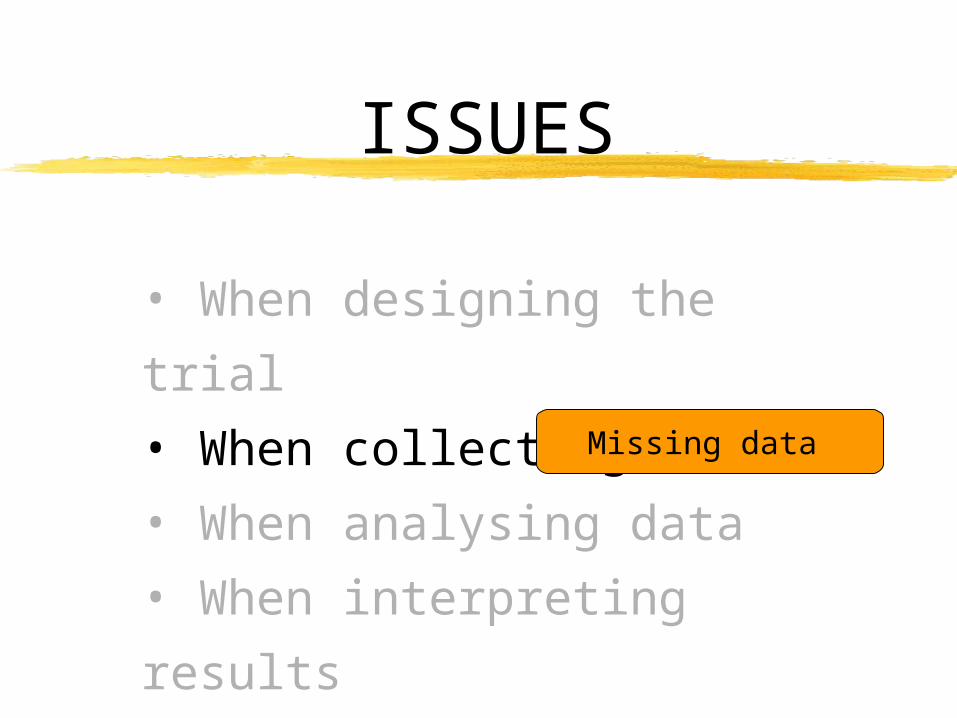
ISSUES
• When designing the trial
• When collecting data
• When analysing data
• When interpreting results
Missing data
26
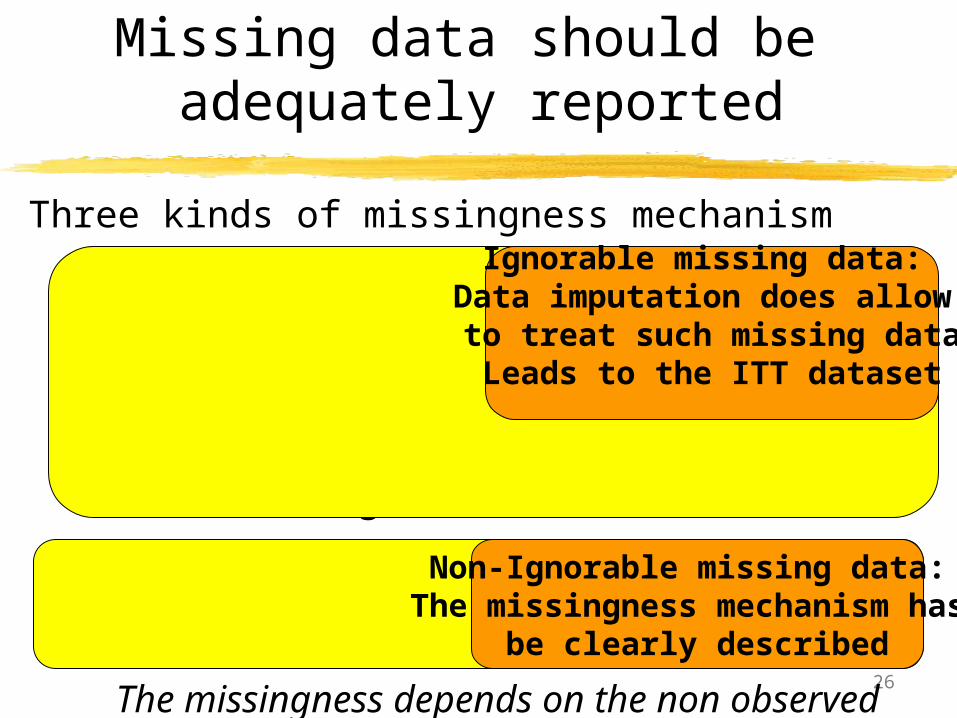
Missing data should be adequately reported
Three kinds of missingness mechanism
• data Missing Completely At Random (MCAR)
The missingness is independent of data
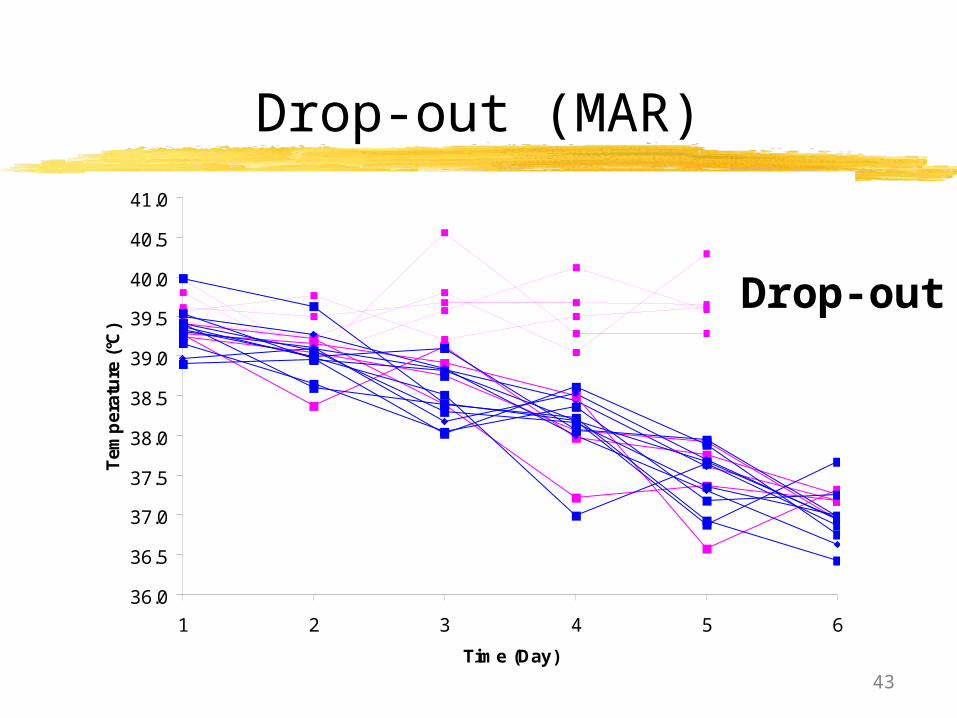
• data Missing At Random (MAR)
The missingness depends on observed data
• data Missing Not At Random (MNAR)
The missingness depends on the non observed data
Ignorable missing data: Data imputation does allow to treat such missing dataLeads to the ITT dataset
Non-Ignorable missing data: The missingness mechanism has
be clearly described
27
Missing Completely At RandomMCAR
Missingness and outcome are independent
• the owner of the animal missed a visit to the vet
• the investigator forgot to write the results
• the owner moves house
Unlikely to occur in a clinical trial
28
Missing At RandomMAR
Missingness depends on data that have been observed
but not on the unobserved (missing) data
• dropout related to baseline characteristics
• the animal health has markedly improved or
deteriorated since inclusionAssumes that the future trajectories of animals who dropout are similar to those who share the same measurements whether or not they dropout.Frequent in clinical trials.
29
Missing Not At RandomMNAR
Missingness depends on data that have been unobserved
(missing data)
• sudden decline or improve in health that has not
been observed in the previous visits
Assumes that the future trajectories of animals who dropout are different to those who share the same measurements Occurs in clinical trials.
30
Can you classify these missing data ?
• The battery of the thermometer is discharged. I cannot
measure the temperature.
• At the last visit, the dog was well. I called the owner by
phone, he did not want to come because he said that the dog
was cured.
• The owner did not come back. I don't know why.
ISSUES
• When designing the trial
• When collecting data
• When analysing data
• When interpreting results • Statistical tests• Multiple comparisons• Data drying off • What dataset to analyse ?
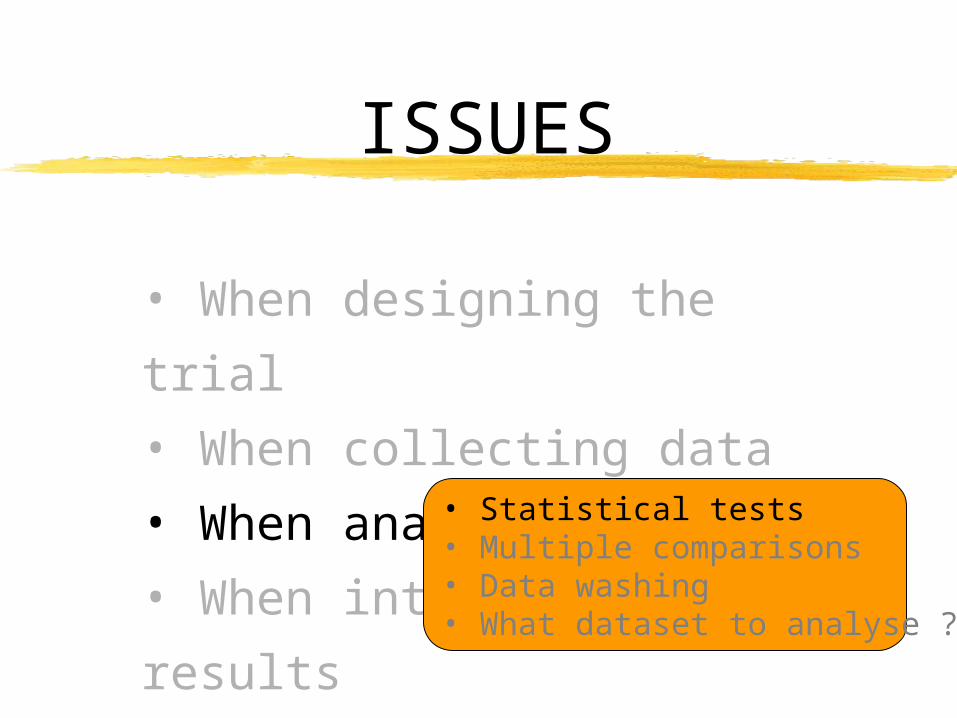
ISSUES
• When designing the trial
• When collecting data
• When analysing data
• When interpreting results • Statistical tests• Multiple comparisons• Data washing • What dataset to analyse ?
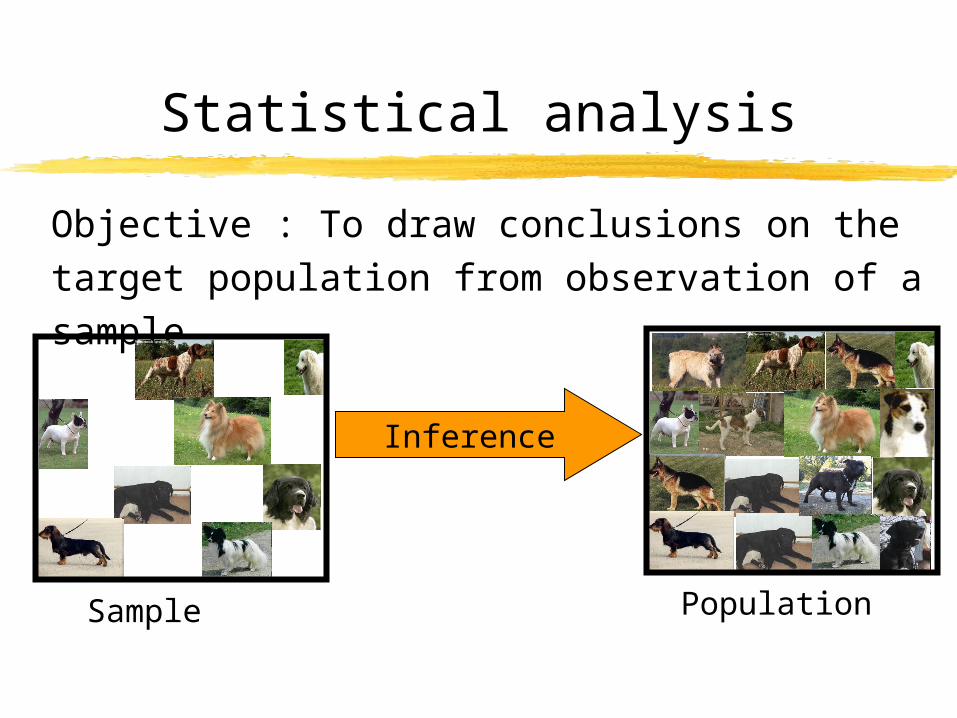
Statistical analysis
Objective : To draw conclusions on the target population
from observation of a sample
PopulationSample
Inference
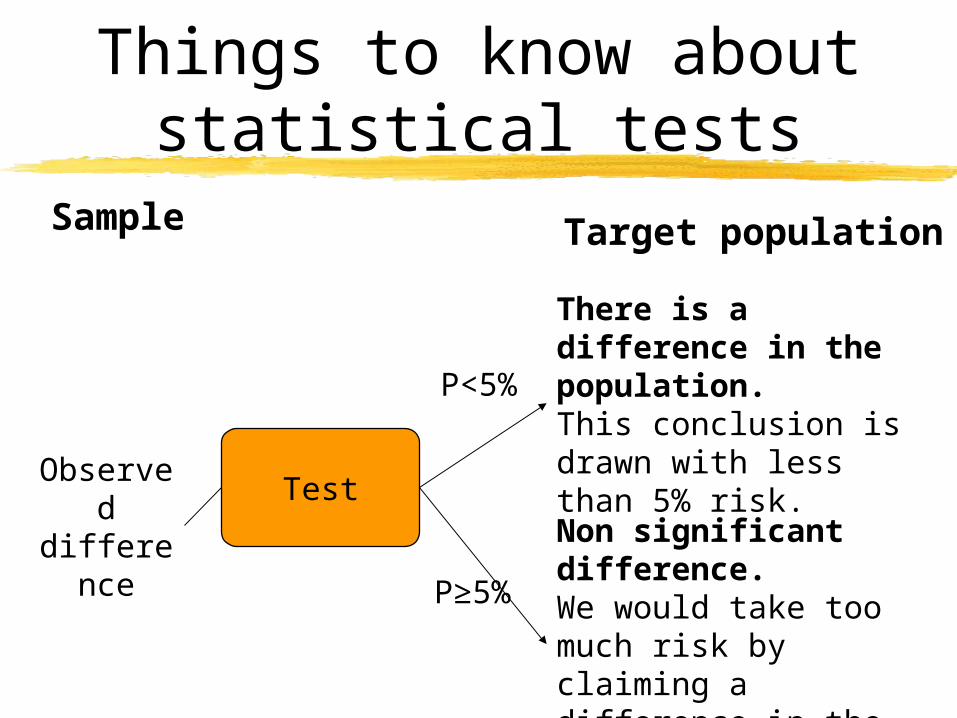
Things to know about statistical tests
Observed difference
Test
There is a difference in the population.This conclusion is drawn with less than 5% risk.
Non significant difference.We would take too much risk by claiming a difference in the population.
P≥5%
P<5%
Sample Target population
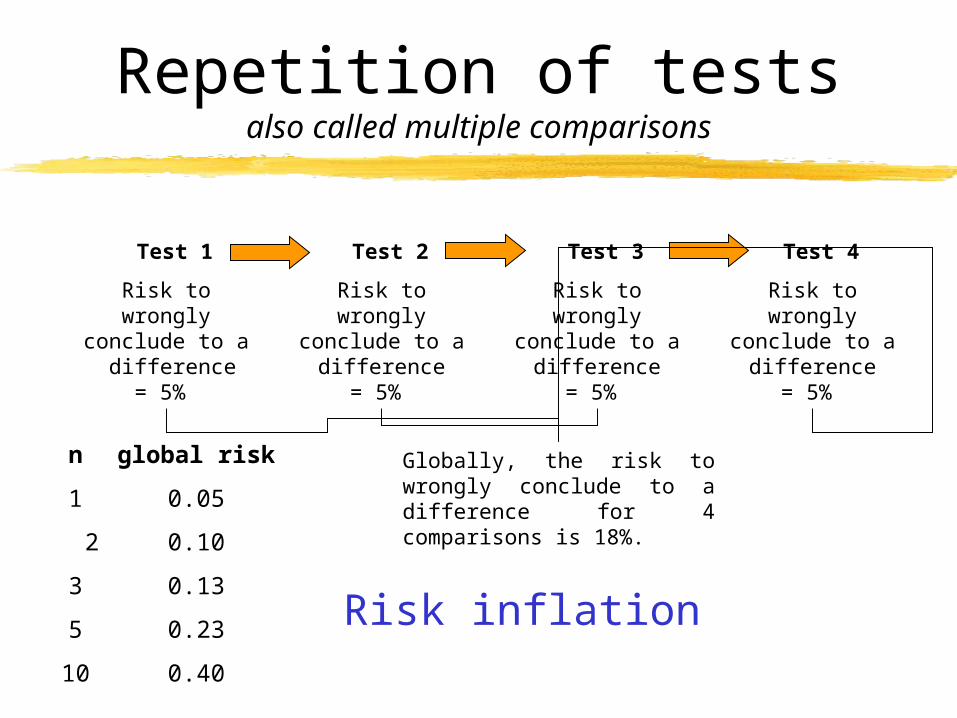
Repetition of testsalso called multiple comparisons
Test 1
Risk to wrongly conclude to a
difference= 5%
Test 2
Risk to wrongly conclude to a
difference = 5%
Test 4
Risk to wrongly conclude to a
difference = 5%
Test 3
Risk to wrongly conclude to a
difference = 5%
Globally, the risk to wrongly conclude to a difference for 4 comparisons is 18%.
n global risk
1 0.05
2 0.10
3 0.13
5 0.23
10 0.40
Risk inflation
36
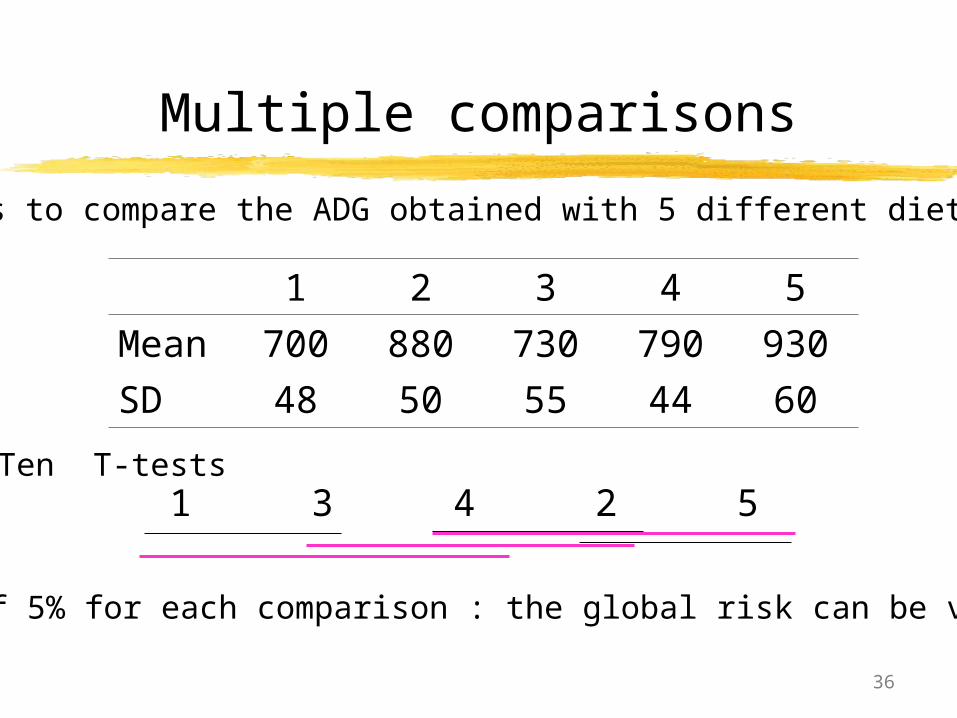
Multiple comparisons
1 2 3 4 5
Mean 700 880 730 790 930
SD 48 50 55 44 60
One wants to compare the ADG obtained with 5 different diets in pig
1 3 4 2 5Ten T-tests
A risk of 5% for each comparison : the global risk can be very largehere 40%
37
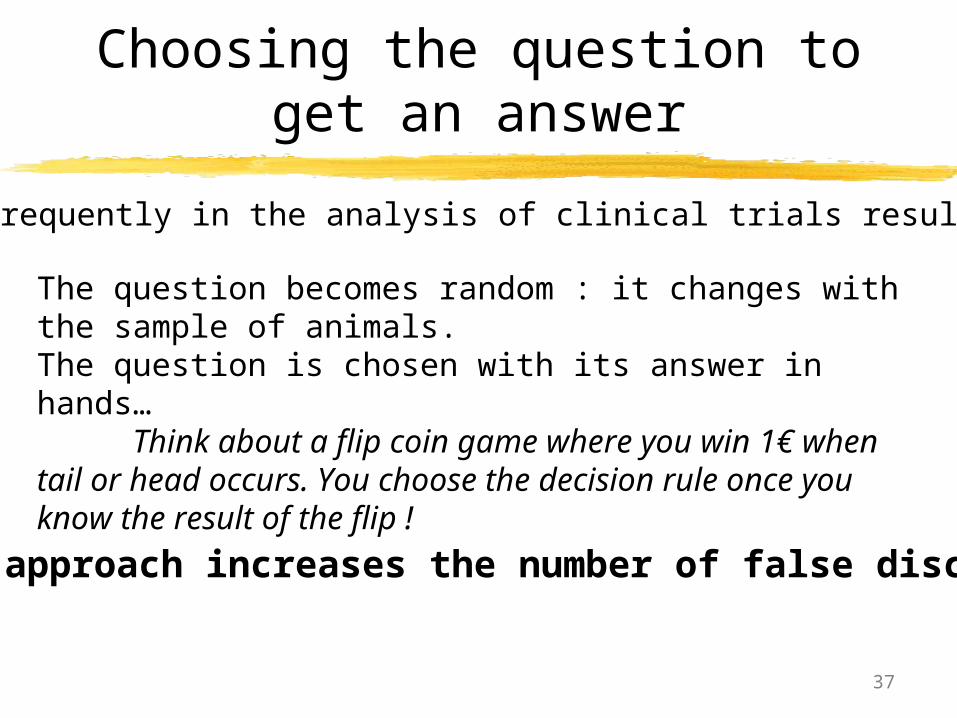
Choosing the question to get an answer
Occurs frequently in the analysis of clinical trials results
The question becomes random : it changes with the sample of animals. The question is chosen with its answer in hands… Think about a flip coin game where you win 1€ when tail or head occurs. You choose the decision rule once you know the result of the flip !
Such an approach increases the number of false discoveries.
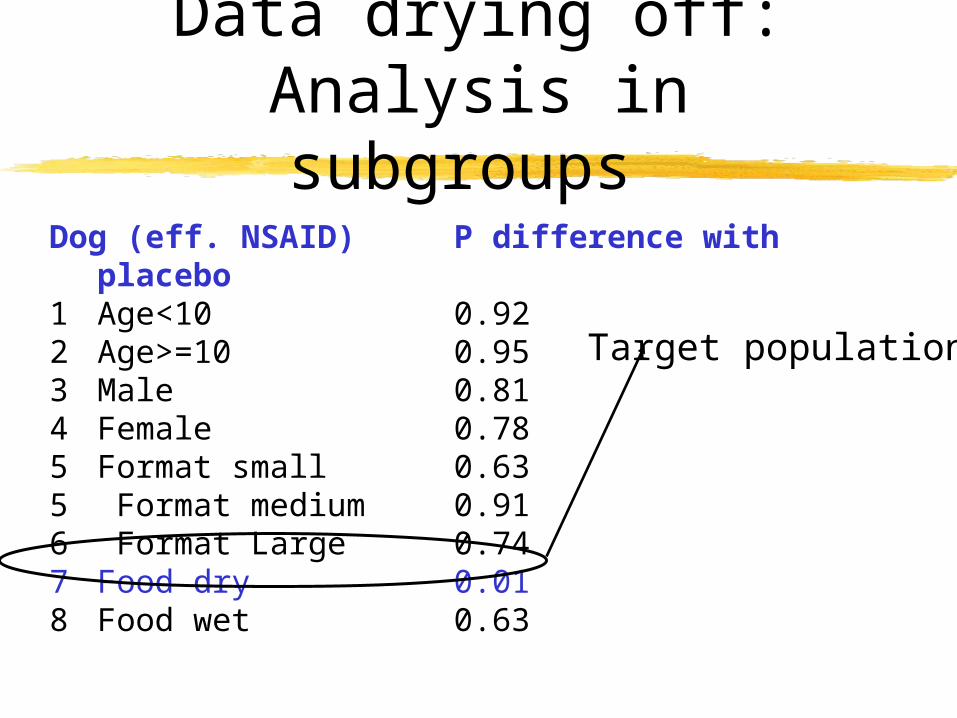
Dog (eff. NSAID) P difference with placebo1 Age<10 0.922 Age>=10 0.953 Male 0.814 Female 0.785 Format small 0.635 Format medium 0.916 Format Large 0.747 Food dry 0.018 Food wet 0.63
Data drying off:Analysis in subgroups
Target population?!
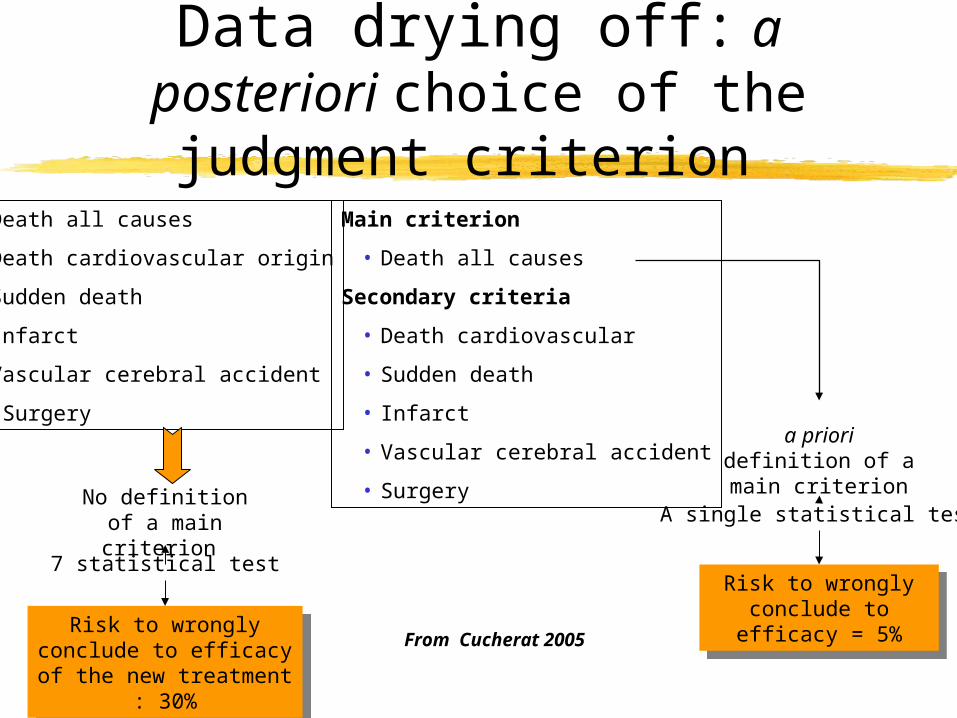
Data drying off: a posteriori choice of the judgment criterion
Main criterion
• Death all causes
Secondary criteria
• Death cardiovascular
• Sudden death
• Infarct
• Vascular cerebral accident
• Surgery
• Death all causes
• Death cardiovascular origin
• Sudden death
• Infarct
• Vascular cerebral accident
• Surgery
No definition of a main criterion
Risk to wrongly conclude to efficacy of the new
treatment : 30%
Risk to wrongly conclude to efficacy of the new
treatment : 30%
7 statistical testRisk to wrongly
conclude to efficacy = 5%
Risk to wrongly conclude to efficacy =
5%
a priori definition of a main criterion
A single statistical test
From Cucherat 2005
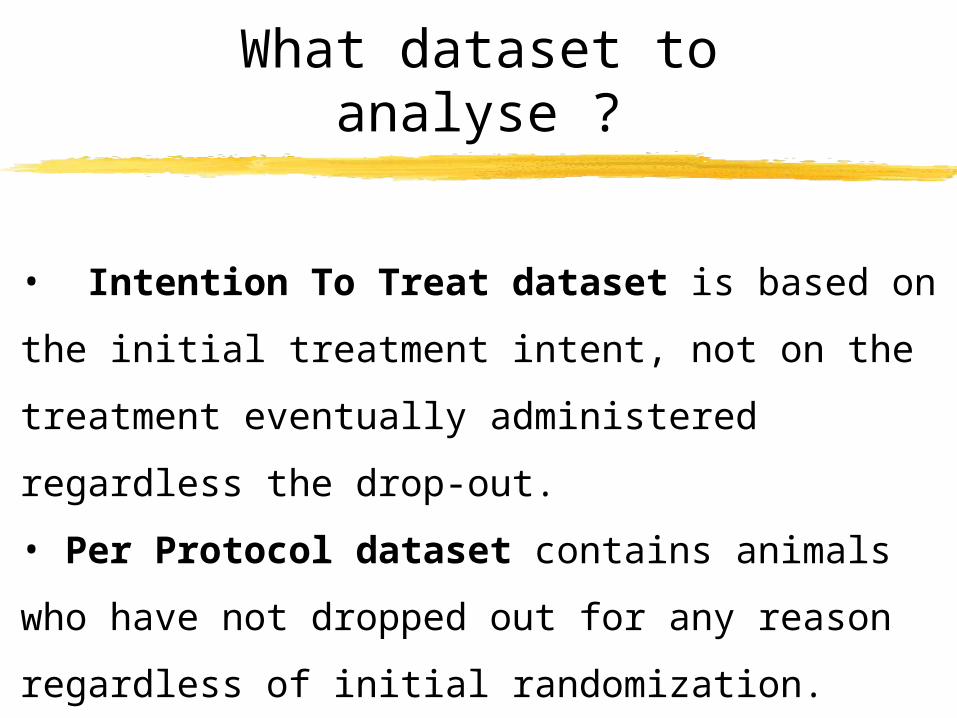
What dataset to analyse ?
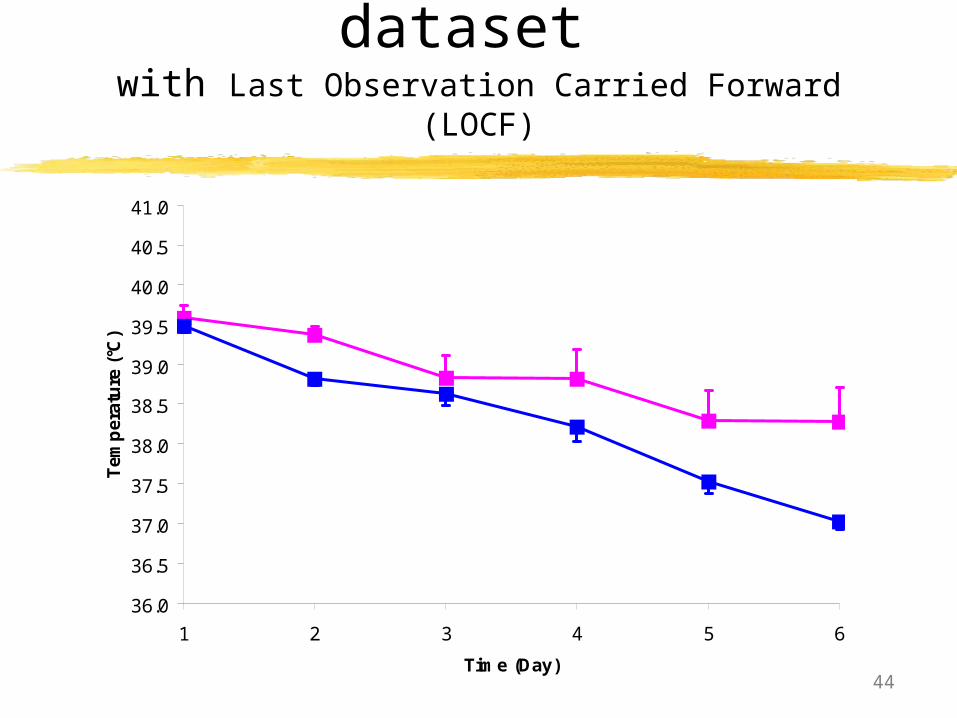
• Intention To Treat dataset is based on the initial
treatment intent, not on the treatment eventually
administered regardless the drop-out.
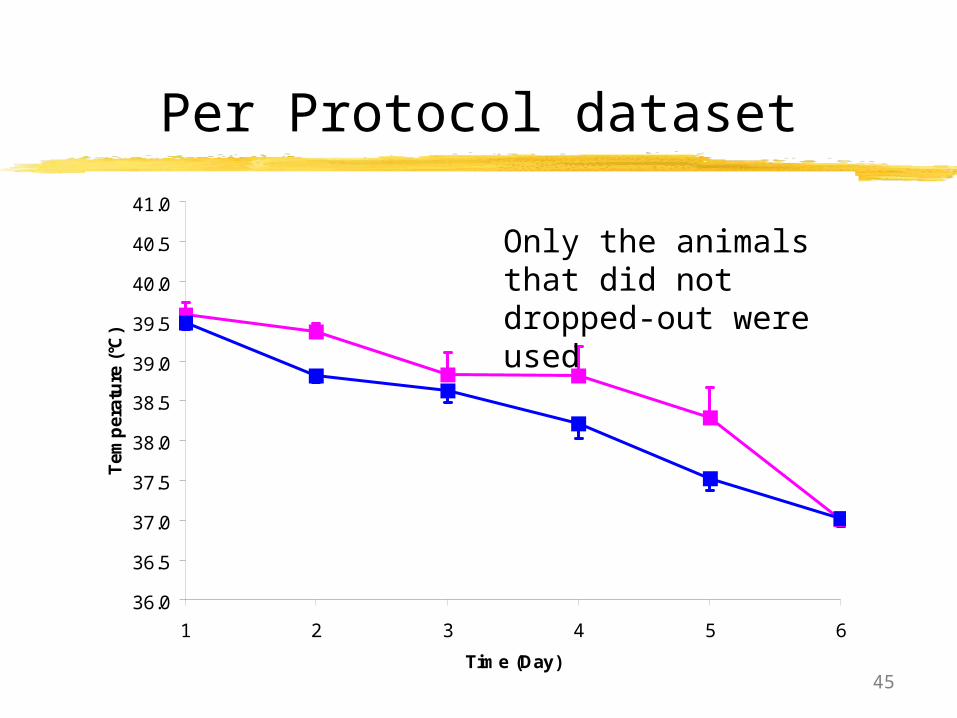
• Per Protocol dataset contains animals who have not
dropped out for any reason regardless of initial
randomization.
41
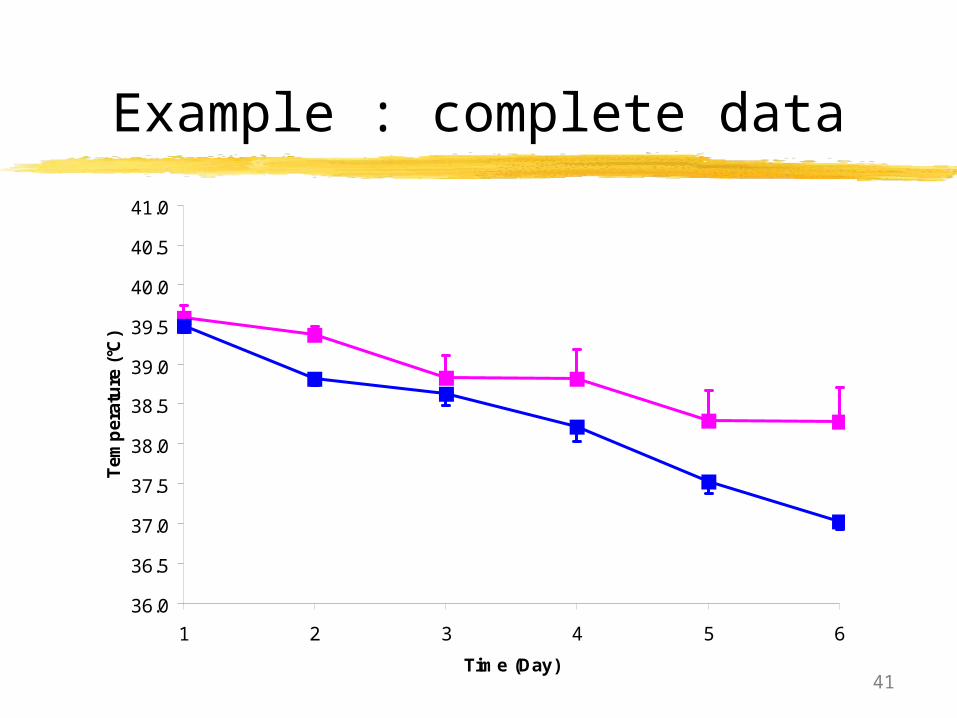
36.0
36.5
37.0
37.5
38.0
38.5
39.0
39.5
40.0
40.5
41.0
1 2 3 4 5 6
Time (Day)
Tem
per
atu
re (
°C)
Example : complete data
42
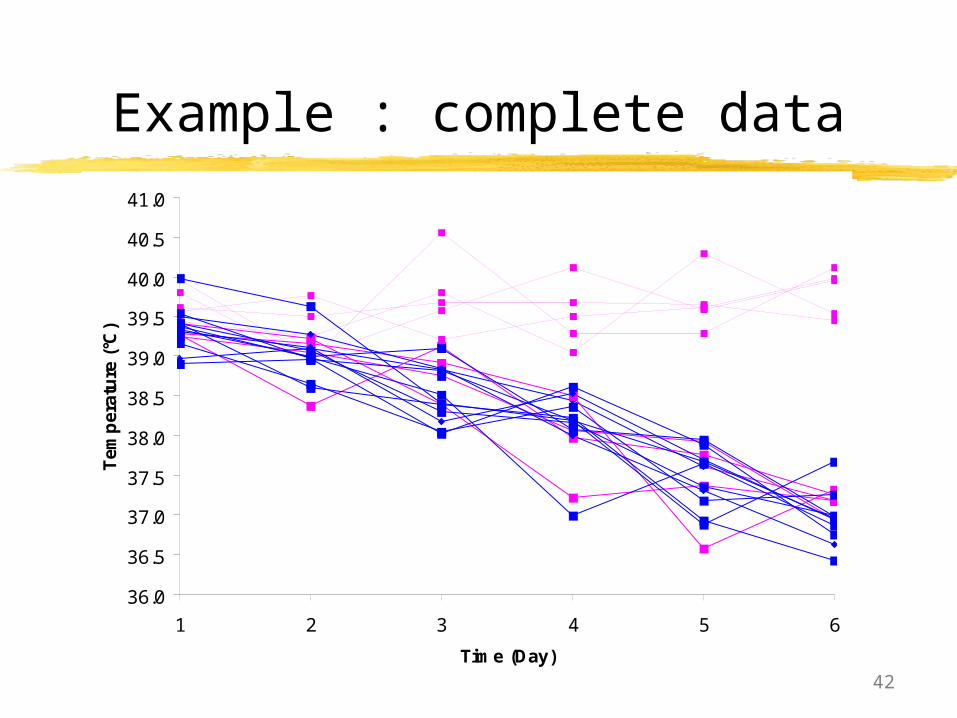
36.0
36.5
37.0
37.5
38.0
38.5
39.0
39.5
40.0
40.5
41.0
1 2 3 4 5 6
Time (Day)
Tem
per
atu
re (
°C)
Example : complete data
36.0
36.5
37.0
37.5
38.0
38.5
39.0
39.5
40.0
40.5
41.0
1 2 3 4 5 6
Time (Day)
Tem
per
atu
re (
°C)
43
Drop-out (MAR)
36.0
36.5
37.0
37.5
38.0
38.5
39.0
39.5
40.0
40.5
41.0
1 2 3 4 5 6
Time (Day)
Tem
per
atu
re (
°C)
Drop-out
44
Intention To Treat dataset with Last Observation Carried Forward (LOCF)
36.0
36.5
37.0
37.5
38.0
38.5
39.0
39.5
40.0
40.5
41.0
1 2 3 4 5 6
Time (Day)
Tem
per
atu
re (
°C)
45
Per Protocol dataset
36.0
36.5
37.0
37.5
38.0
38.5
39.0
39.5
40.0
40.5
41.0
1 2 3 4 5 6
Time (Day)
Tem
per
atu
re (
°C)
36.0
36.5
37.0
37.5
38.0
38.5
39.0
39.5
40.0
40.5
41.0
1 2 3 4 5 6
Time (Day)
Tem
per
atu
re (
°C)
Only the animals that did not dropped-out were used
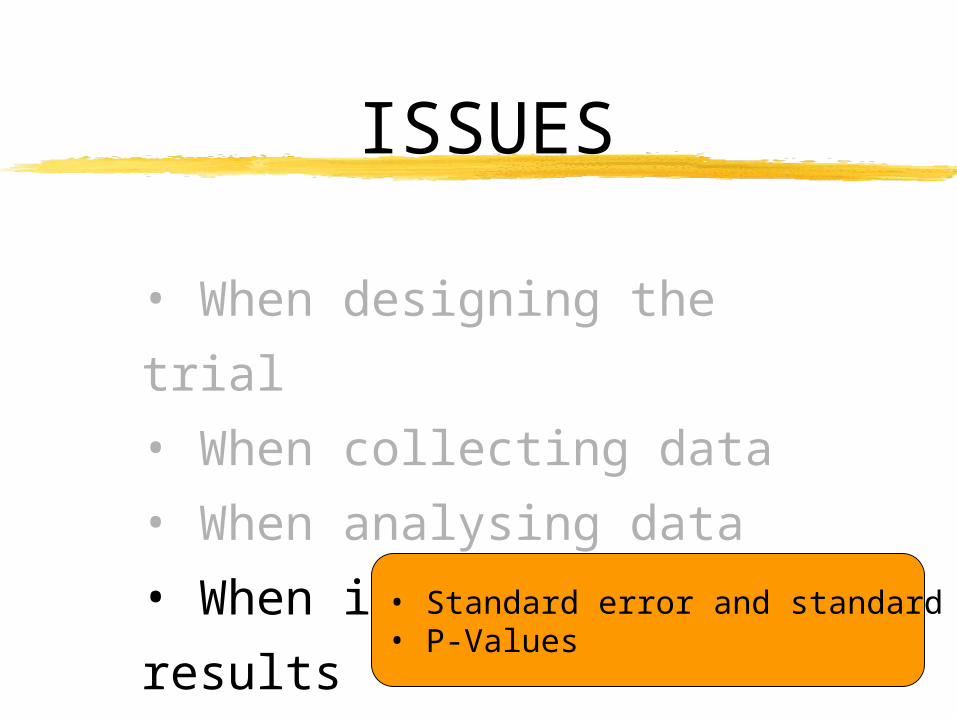
ISSUES
• When designing the trial
• When collecting data
• When analysing data
• When interpreting results • Standard error and standard deviation• P-Values
47
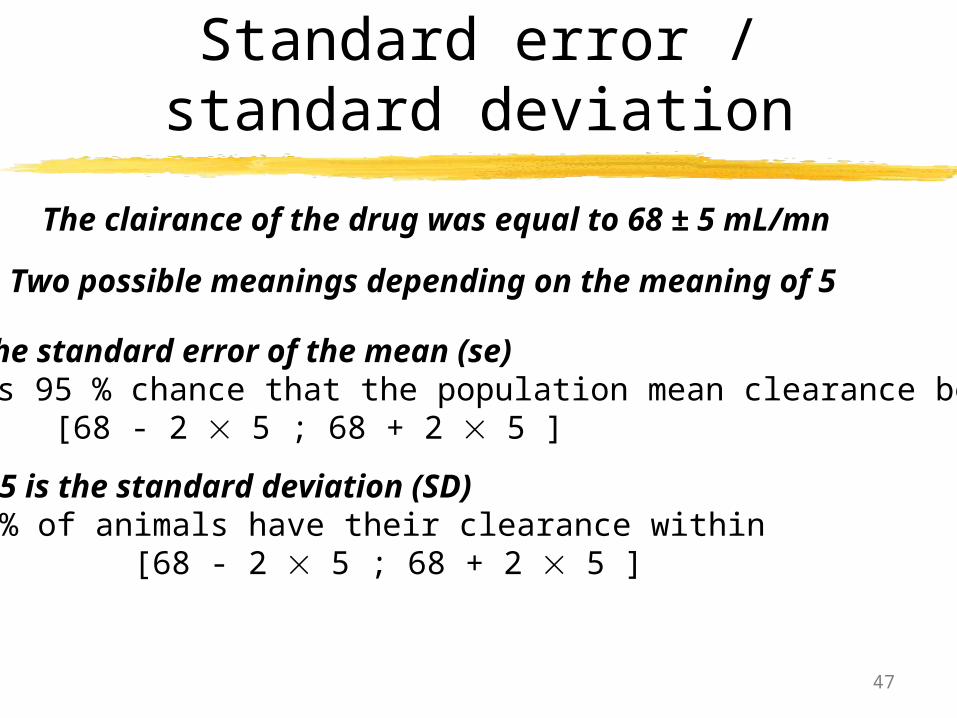
Standard error / standard deviation
The clairance of the drug was equal to 68 ± 5 mL/mn
Two possible meanings depending on the meaning of 5
If 5 is the standard error of the mean (se) there is 95 % chance that the population mean clearance belongs to
[68 - 2 5 ; 68 + 2 5 ]
If 5 is the standard deviation (SD) 95 % of animals have their clearance within
[68 - 2 5 ; 68 + 2 5 ]
48
P values
The difference between the effect of the drugs A and B is not significant (P = 0.56) therefore drug A can be substituted by drug B.
NOThe only conclusion that can be drawn from such a P value is that you didn't see any difference between the effect of the drugs A and B. That does not mean that such a difference does not exist.
Absence of evidence is not evidence of absence
49
P values
The drug A has a higher efficacy than the drug B (P = 0.001)The drug C has a higher efficacy than the drug B (P = 0.04) Since 0.001<0.04 the drug A has a higher than the drug B. NOThe only conclusion that can be drawn from such a P value is that you are sure than A>B and less sure than C>B.This does not presume anything about the amplitude of the differences.
Significant does not mean important
50
How to avoid these problems ?
• Consult your preferred statistician for help in the design of complicated experiments• Use basic descriptive statistics first (graphics, summary statistics,…)• Use common sense• Consider to learn more statistics