Embed Size (px)
Citation preview
VIBRATION ACCEPTANCE REPORT
PUMPING PLANT 1
DATA COLLECTED: 12/15/18
SAMPLE CUSTOMER
TABLE OF CONTENTS
PAGE
SAMPLE CUSTOMER VIBRATION REPORT
PUMPING PLANT 1
SUMMARY OF FINDINGS 3
STANDARDS AND APPLIED LIMITS 4
PUMP 1 6
RECOMMENDATIONS 3
PUMP 2 12
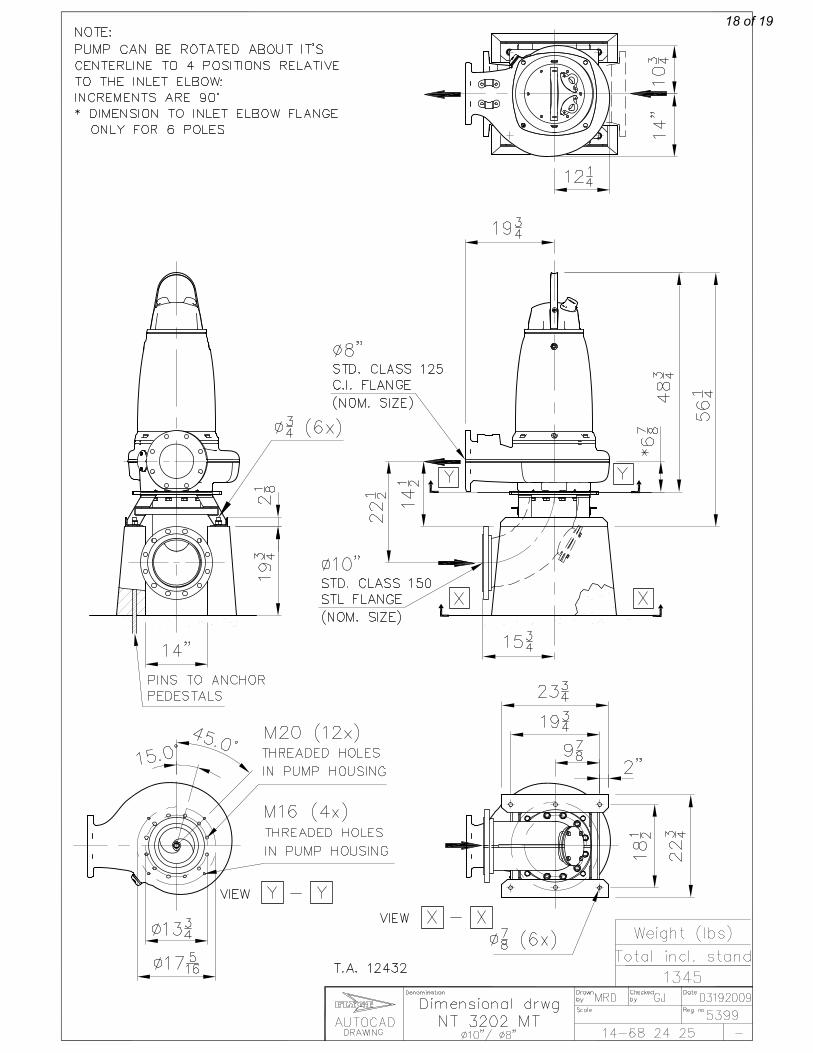
PUMP SPECIFIC INFORMATION 18
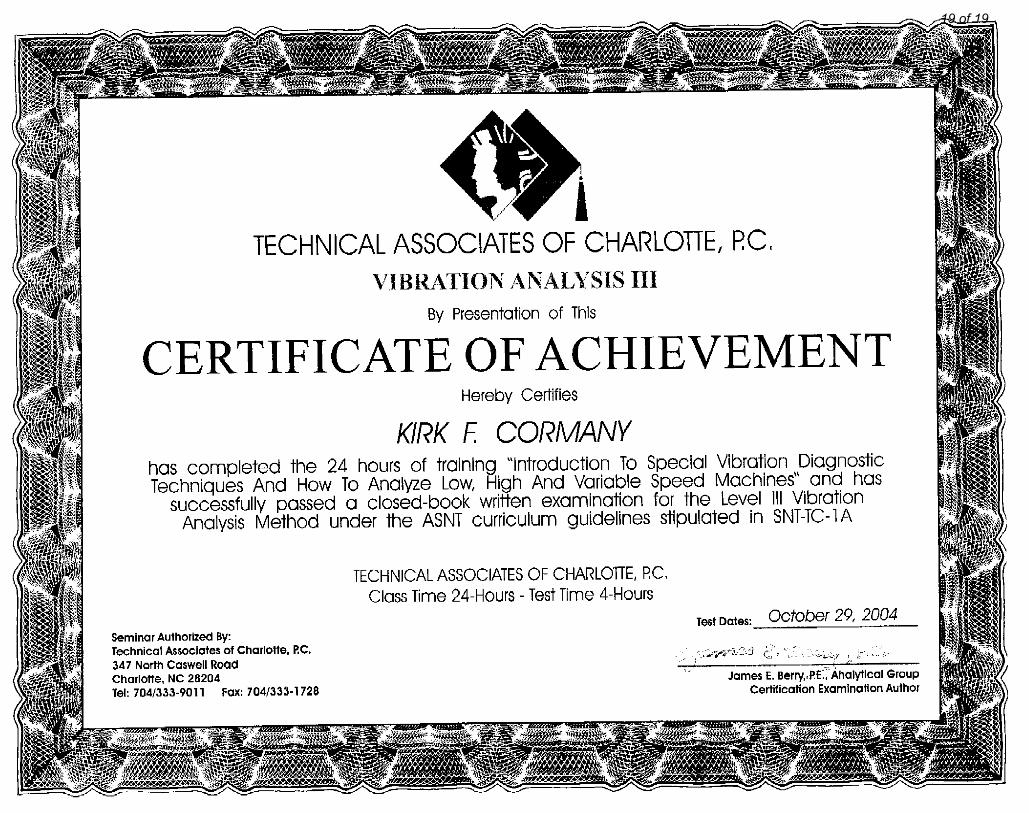
VIBRATION ANALYST CERTIFICATES 19
A R e l i a b i l i t y R e s o u r c e C o m p a n y
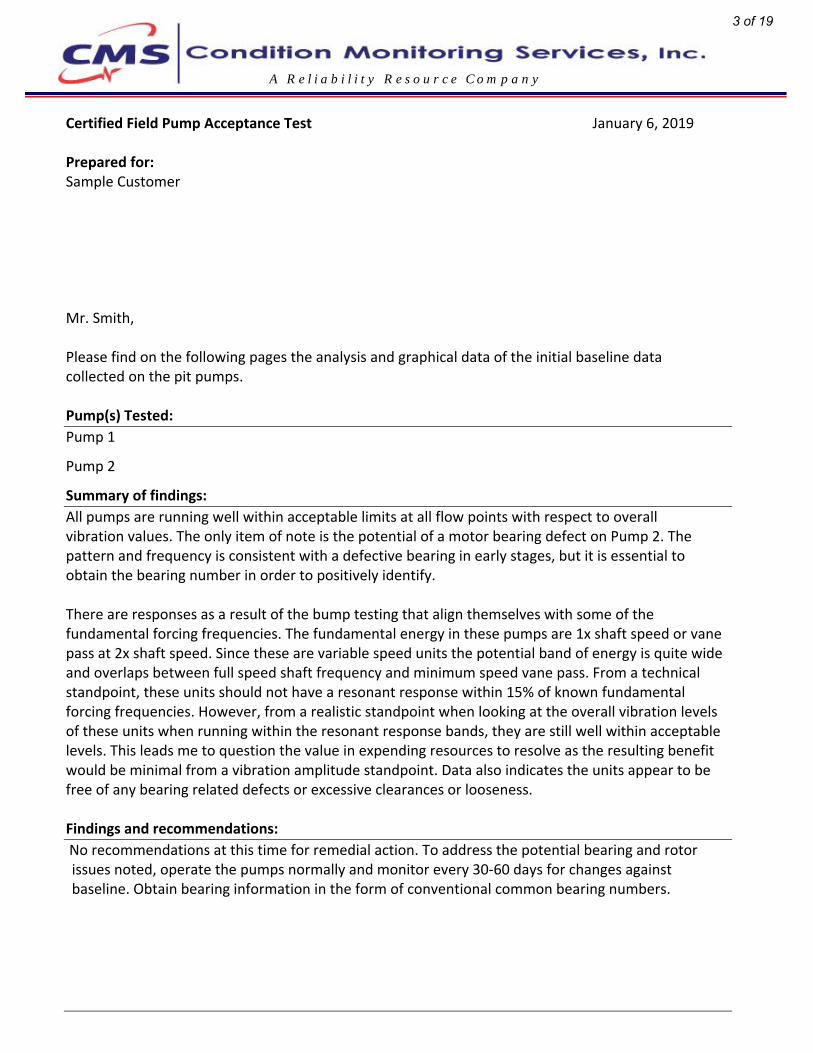
Certified Field Pump Acceptance Test January 6, 2019
Prepared for: Sample Customer
Mr. Smith,
Please find on the following pages the analysis and graphical data of the initial baseline data collected on the pit pumps.
Pump(s) Tested:
Pump 1
Pump 2
Summary of findings:
All pumps are running well within acceptable limits at all flow points with respect to overall vibration values. The only item of note is the potential of a motor bearing defect on Pump 2. The pattern and frequency is consistent with a defective bearing in early stages, but it is essential to obtain the bearing number in order to positively identify.
There are responses as a result of the bump testing that align themselves with some of the fundamental forcing frequencies. The fundamental energy in these pumps are 1x shaft speed or vane pass at 2x shaft speed. Since these are variable speed units the potential band of energy is quite wide and overlaps between full speed shaft frequency and minimum speed vane pass. From a technical standpoint, these units should not have a resonant response within 15% of known fundamental forcing frequencies. However, from a realistic standpoint when looking at the overall vibration levels of these units when running within the resonant response bands, they are still well within acceptable levels. This leads me to question the value in expending resources to resolve as the resulting benefit would be minimal from a vibration amplitude standpoint. Data also indicates the units appear to be free of any bearing related defects or excessive clearances or looseness.
Findings and recommendations:
No recommendations at this time for remedial action. To address the potential bearing and rotor issues noted, operate the pumps normally and monitor every 30‐60 days for changes against baseline. Obtain bearing information in the form of conventional common bearing numbers.
3 of 19
A R e l i a b i l i t y R e s o u r c e C o m p a n y
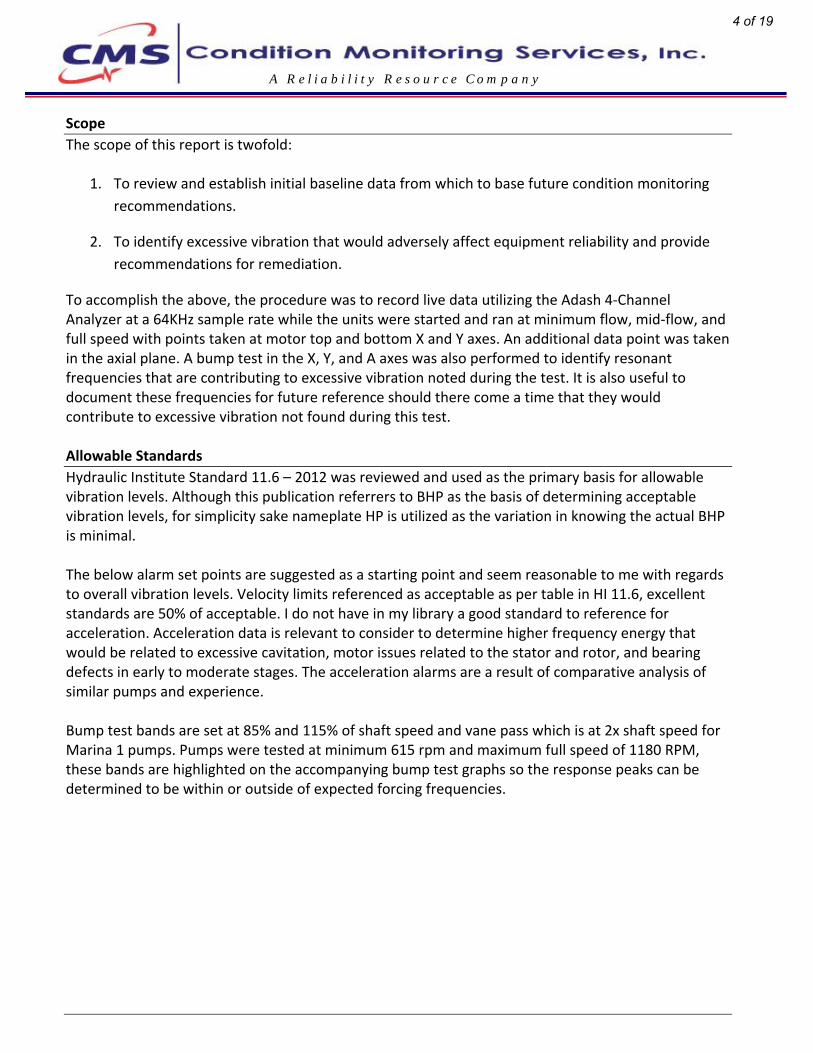
Scope
The scope of this report is twofold:
1. To review and establish initial baseline data from which to base future condition monitoring
recommendations.
2. To identify excessive vibration that would adversely affect equipment reliability and provide
recommendations for remediation.
To accomplish the above, the procedure was to record live data utilizing the Adash 4‐Channel Analyzer at a 64KHz sample rate while the units were started and ran at minimum flow, mid‐flow, and full speed with points taken at motor top and bottom X and Y axes. An additional data point was taken in the axial plane. A bump test in the X, Y, and A axes was also performed to identify resonant frequencies that are contributing to excessive vibration noted during the test. It is also useful to document these frequencies for future reference should there come a time that they would contribute to excessive vibration not found during this test.
Allowable Standards
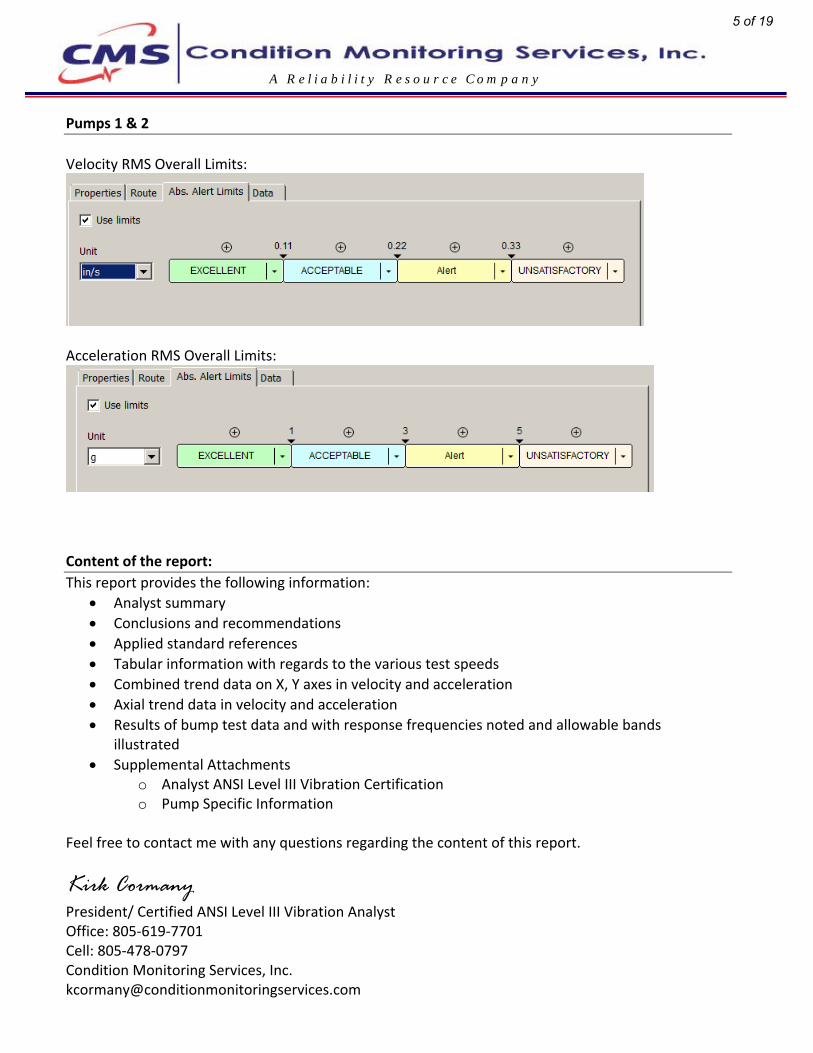
Hydraulic Institute Standard 11.6 – 2012 was reviewed and used as the primary basis for allowable vibration levels. Although this publication referrers to BHP as the basis of determining acceptable vibration levels, for simplicity sake nameplate HP is utilized as the variation in knowing the actual BHP is minimal.
The below alarm set points are suggested as a starting point and seem reasonable to me with regards to overall vibration levels. Velocity limits referenced as acceptable as per table in HI 11.6, excellent standards are 50% of acceptable. I do not have in my library a good standard to reference for acceleration. Acceleration data is relevant to consider to determine higher frequency energy that would be related to excessive cavitation, motor issues related to the stator and rotor, and bearing defects in early to moderate stages. The acceleration alarms are a result of comparative analysis of similar pumps and experience.
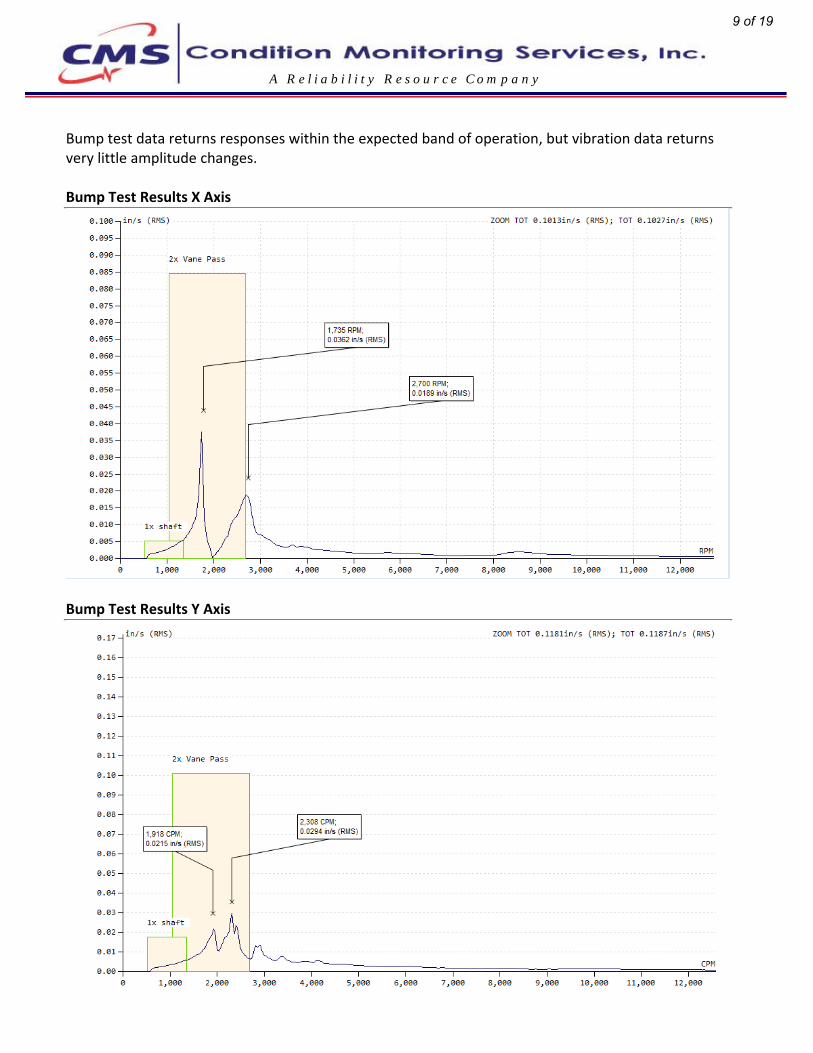
Bump test bands are set at 85% and 115% of shaft speed and vane pass which is at 2x shaft speed for Marina 1 pumps. Pumps were tested at minimum 615 rpm and maximum full speed of 1180 RPM, these bands are highlighted on the accompanying bump test graphs so the response peaks can be determined to be within or outside of expected forcing frequencies.
4 of 19
A R e l i a b i l i t y R e s o u r c e C o m p a n y
Pumps 1 & 2
Velocity RMS Overall Limits:
Acceleration RMS Overall Limits:
Content of the report:
This report provides the following information:
Analyst summary
Conclusions and recommendations
Applied standard references
Tabular information with regards to the various test speeds
Combined trend data on X, Y axes in velocity and acceleration
Axial trend data in velocity and acceleration
Results of bump test data and with response frequencies noted and allowable bandsillustrated
Supplemental Attachmentso Analyst ANSI Level III Vibration Certificationo Pump Specific Information
Feel free to contact me with any questions regarding the content of this report.
Kirk Cormany President/ Certified ANSI Level III Vibration Analyst Office: 805‐619‐7701 Cell: 805‐478‐0797 Condition Monitoring Services, Inc. [email protected]
5 of 19
A R e l i a b i l i t y R e s o u r c e C o m p a n y
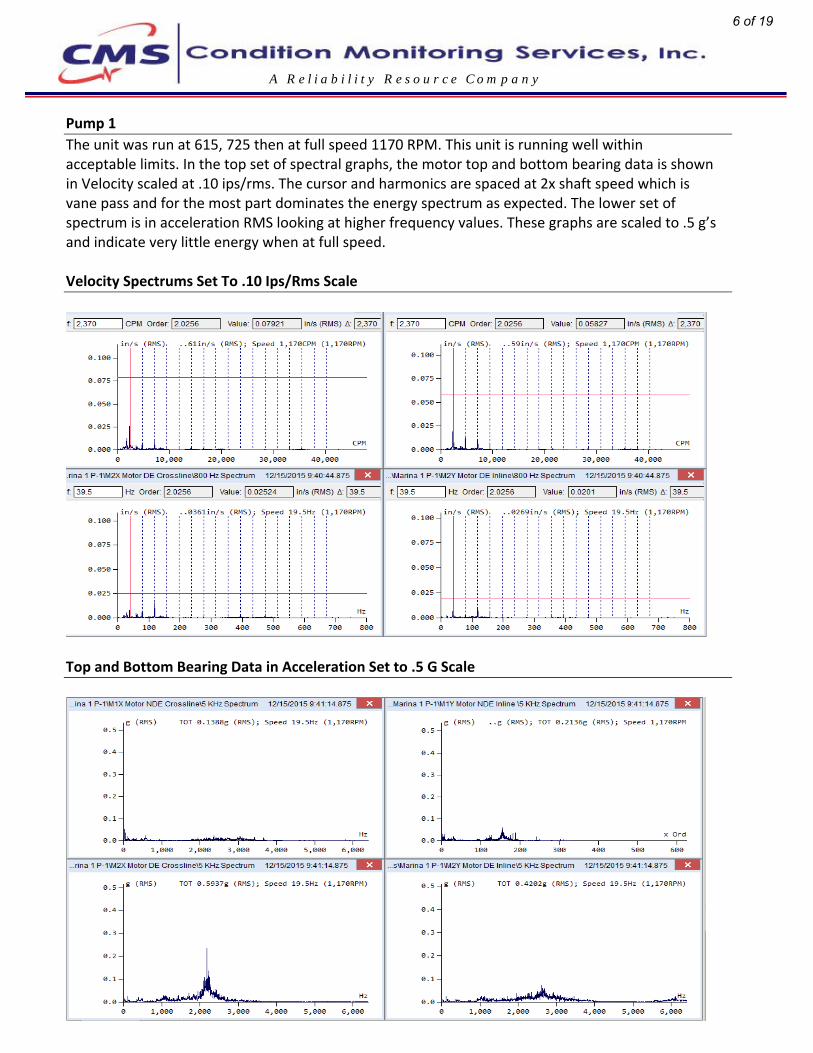
Pump 1
The unit was run at 615, 725 then at full speed 1170 RPM. This unit is running well within acceptable limits. In the top set of spectral graphs, the motor top and bottom bearing data is shown in Velocity scaled at .10 ips/rms. The cursor and harmonics are spaced at 2x shaft speed which is vane pass and for the most part dominates the energy spectrum as expected. The lower set of spectrum is in acceleration RMS looking at higher frequency values. These graphs are scaled to .5 g’s and indicate very little energy when at full speed.
Velocity Spectrums Set To .10 Ips/Rms Scale
Top and Bottom Bearing Data in Acceleration Set to .5 G Scale
6 of 19
A R e l i a b i l i t y R e s o u r c e C o m p a n y
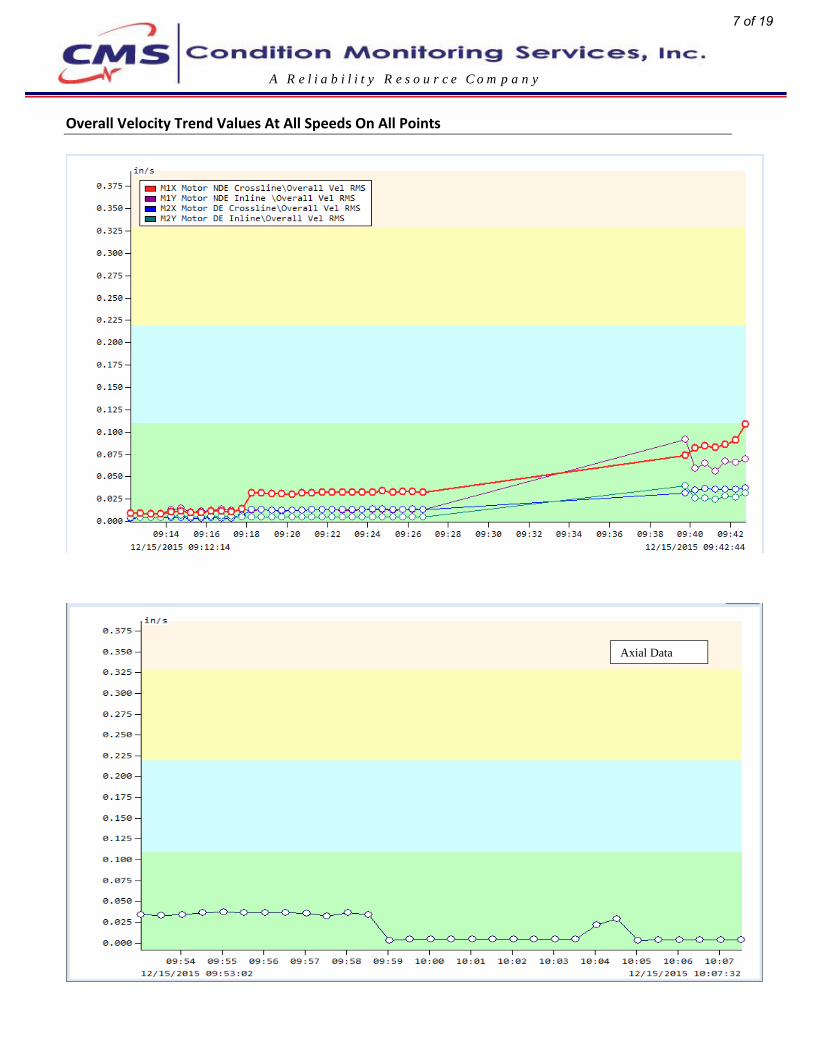
Overall Velocity Trend Values At All Speeds On All Points
Axial Data
7 of 19
A R e l i a b i l i t y R e s o u r c e C o m p a n y
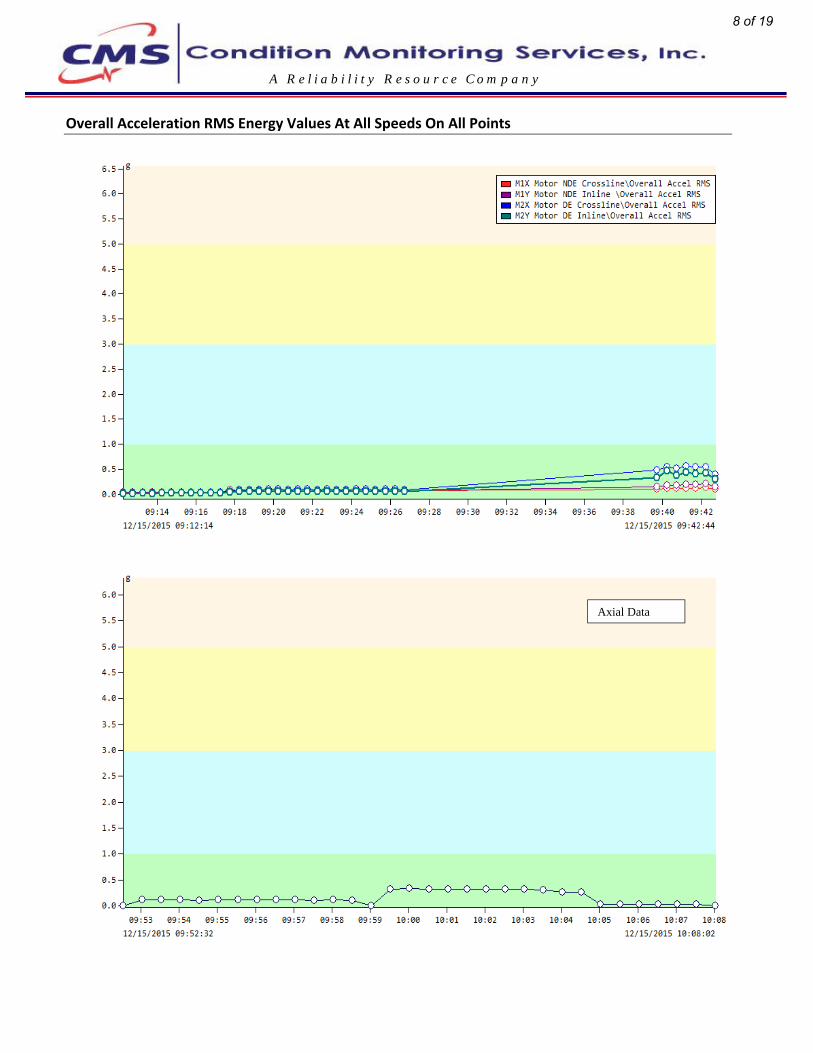
Overall Acceleration RMS Energy Values At All Speeds On All Points
Axial Data
8 of 19
A R e l i a b i l i t y R e s o u r c e C o m p a n y
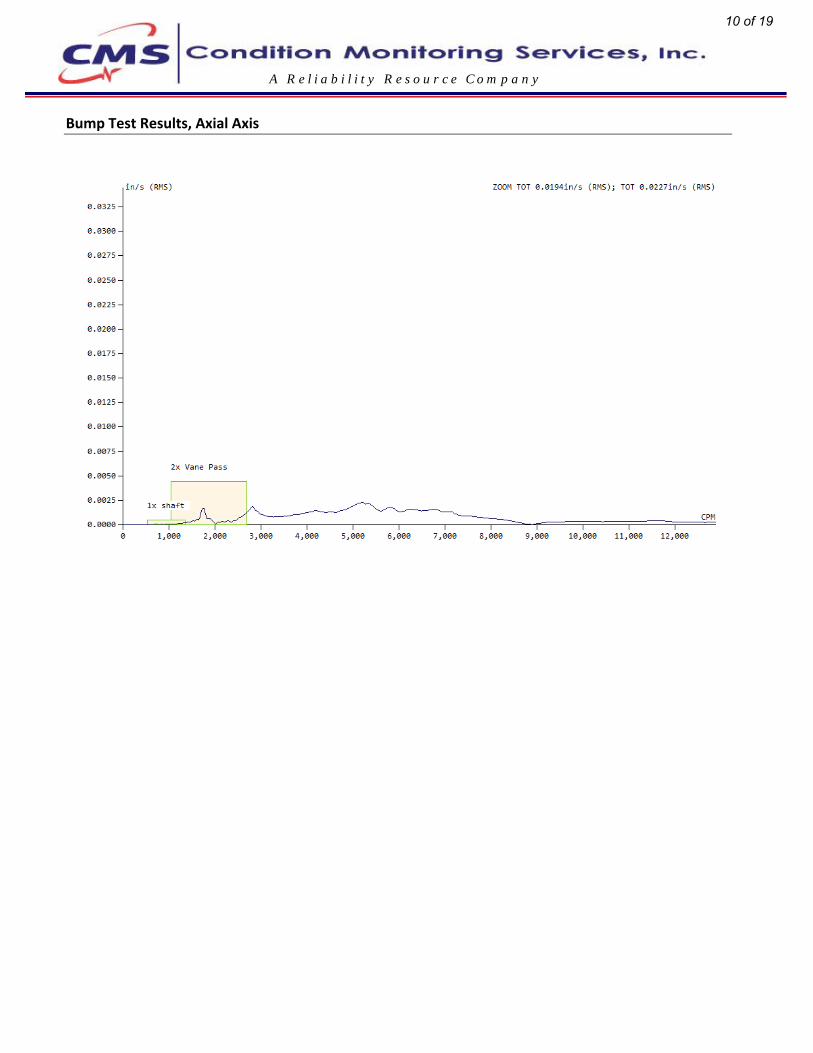
Bump test data returns responses within the expected band of operation, but vibration data returns very little amplitude changes.
Bump Test Results X Axis
Bump Test Results Y Axis
9 of 19
A R e l i a b i l i t y R e s o u r c e C o m p a n y
Bump Test Results, Axial Axis
10 of 19
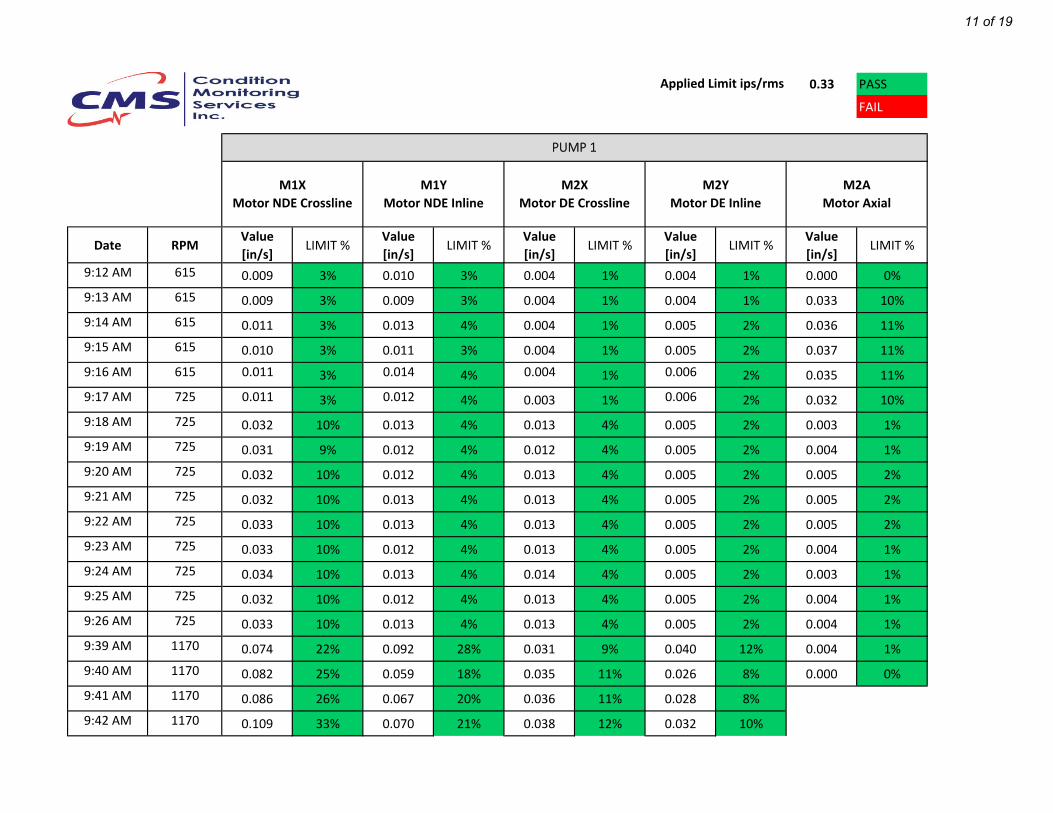
0.33 PASS
FAIL
Date RPMValue
[in/s]LIMIT %
Value
[in/s]LIMIT %
Value
[in/s]LIMIT %
Value
[in/s]LIMIT %
Value
[in/s]LIMIT %
9:12 AM 615 0.009 3% 0.010 3% 0.004 1% 0.004 1% 0.000 0%
9:13 AM 615 0.009 3% 0.009 3% 0.004 1% 0.004 1% 0.033 10%
9:14 AM 615 0.011 3% 0.013 4% 0.004 1% 0.005 2% 0.036 11%
9:15 AM 615 0.010 3% 0.011 3% 0.004 1% 0.005 2% 0.037 11%
9:16 AM 615 0.011 3% 0.014 4% 0.004 1% 0.006 2% 0.035 11%
9:17 AM 725 0.011 3% 0.012 4% 0.003 1% 0.006 2% 0.032 10%
9:18 AM 725 0.032 10% 0.013 4% 0.013 4% 0.005 2% 0.003 1%
9:19 AM 725 0.031 9% 0.012 4% 0.012 4% 0.005 2% 0.004 1%
9:20 AM 725 0.032 10% 0.012 4% 0.013 4% 0.005 2% 0.005 2%
9:21 AM 725 0.032 10% 0.013 4% 0.013 4% 0.005 2% 0.005 2%
9:22 AM 725 0.033 10% 0.013 4% 0.013 4% 0.005 2% 0.005 2%
9:23 AM 725 0.033 10% 0.012 4% 0.013 4% 0.005 2% 0.004 1%
9:24 AM 725 0.034 10% 0.013 4% 0.014 4% 0.005 2% 0.003 1%
9:25 AM 725 0.032 10% 0.012 4% 0.013 4% 0.005 2% 0.004 1%
9:26 AM 725 0.033 10% 0.013 4% 0.013 4% 0.005 2% 0.004 1%
9:39 AM 1170 0.074 22% 0.092 28% 0.031 9% 0.040 12% 0.004 1%
9:40 AM 1170 0.082 25% 0.059 18% 0.035 11% 0.026 8% 0.000 0%
9:41 AM 1170 0.086 26% 0.067 20% 0.036 11% 0.028 8%
9:42 AM 1170 0.109 33% 0.070 21% 0.038 12% 0.032 10%
M2A
Motor Axial
M2Y
Motor DE Inline
Applied Limit ips/rms
PUMP 1
M1X
Motor NDE Crossline
M1Y
Motor NDE Inline
M2X
Motor DE Crossline
11 of 19
A R e l i a b i l i t y R e s o u r c e C o m p a n y
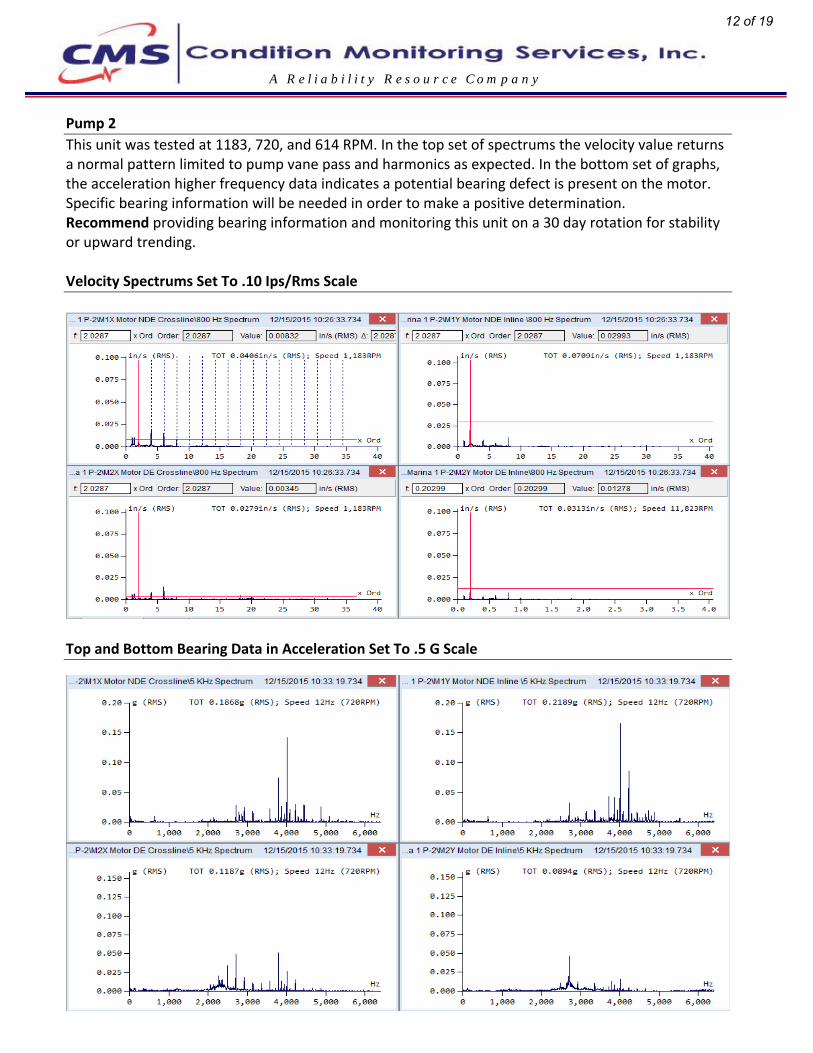
Pump 2
This unit was tested at 1183, 720, and 614 RPM. In the top set of spectrums the velocity value returns a normal pattern limited to pump vane pass and harmonics as expected. In the bottom set of graphs, the acceleration higher frequency data indicates a potential bearing defect is present on the motor. Specific bearing information will be needed in order to make a positive determination. Recommend providing bearing information and monitoring this unit on a 30 day rotation for stability or upward trending.
Velocity Spectrums Set To .10 Ips/Rms Scale
Top and Bottom Bearing Data in Acceleration Set To .5 G Scale
12 of 19
A R e l i a b i l i t y R e s o u r c e C o m p a n y
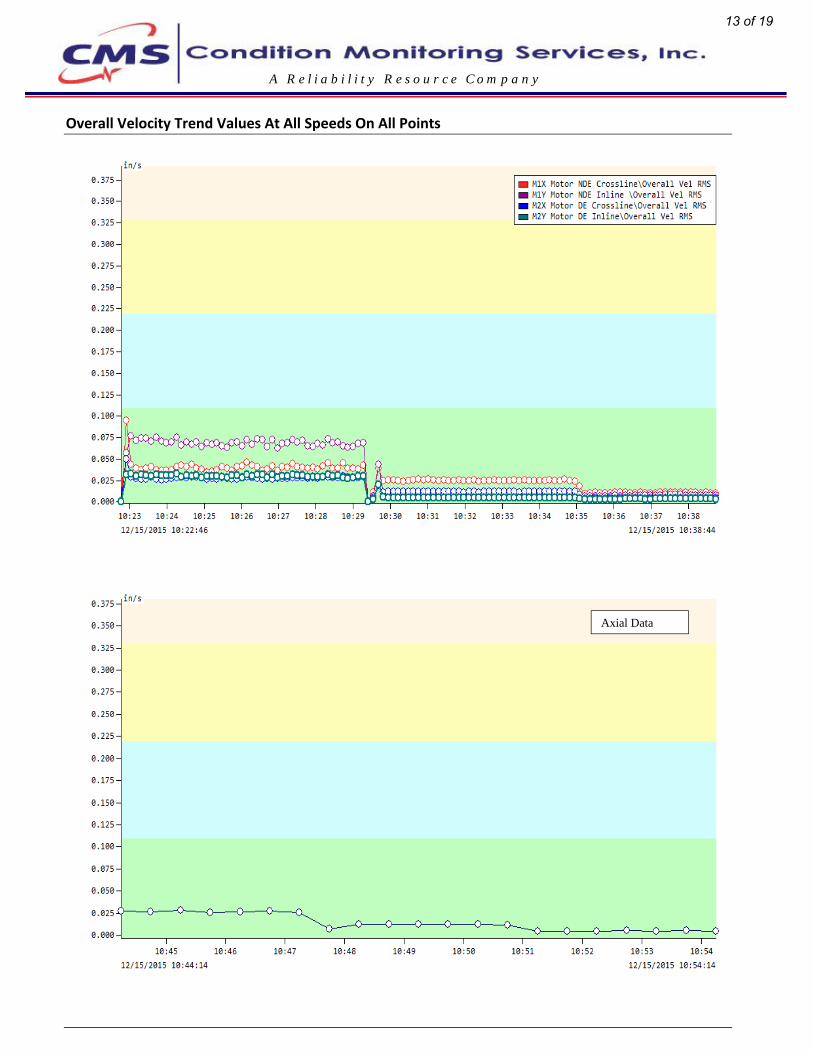
Overall Velocity Trend Values At All Speeds On All Points
Axial Data
13 of 19
A R e l i a b i l i t y R e s o u r c e C o m p a n y
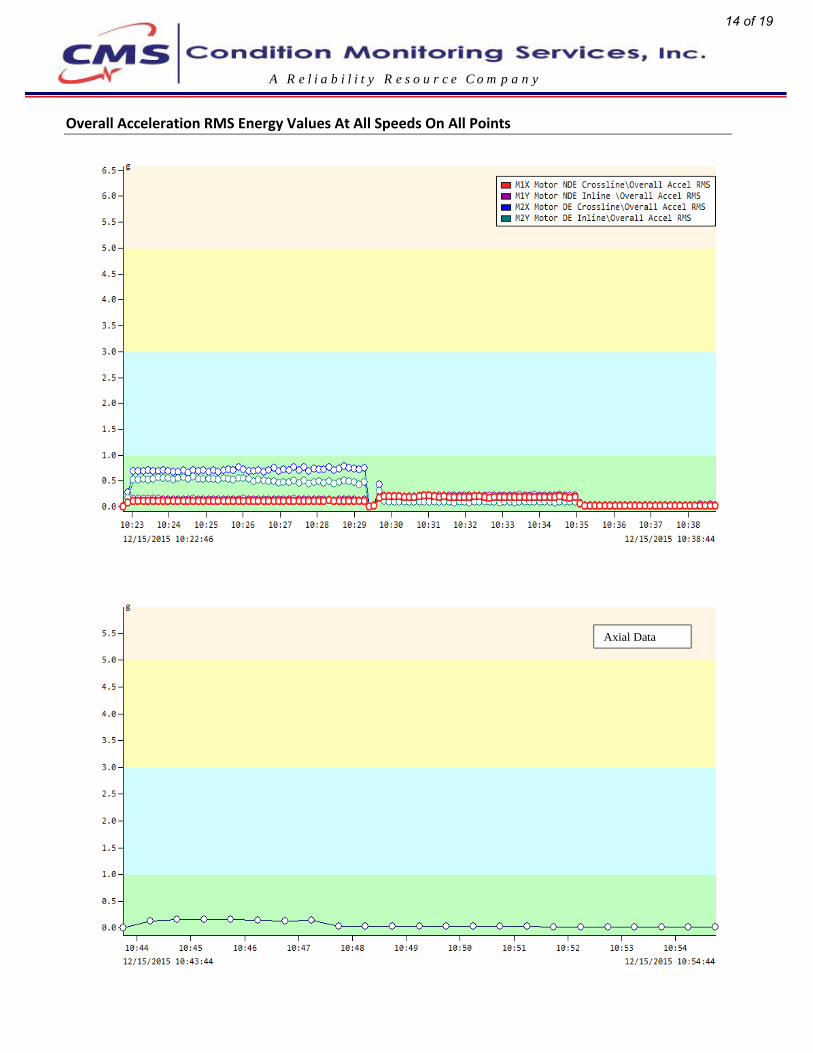
Overall Acceleration RMS Energy Values At All Speeds On All Points
Axial Data
14 of 19
A R e l i a b i l i t y R e s o u r c e C o m p a n y
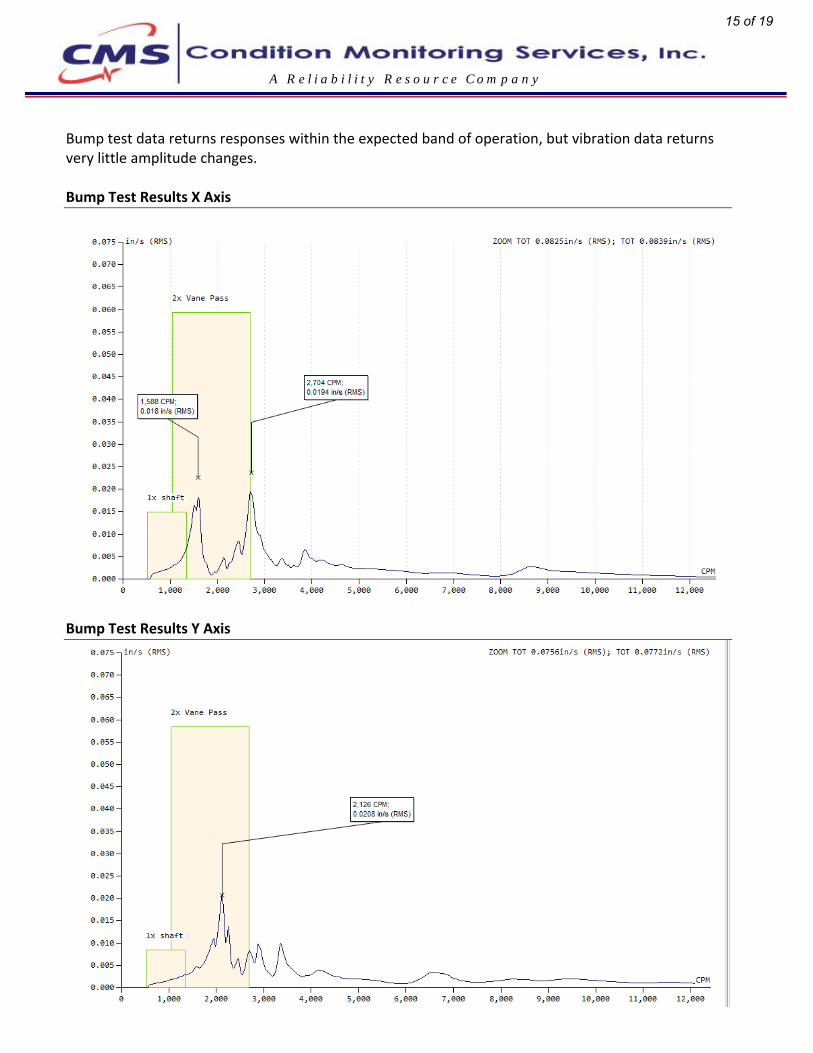
Bump test data returns responses within the expected band of operation, but vibration data returns very little amplitude changes.
Bump Test Results X Axis
Bump Test Results Y Axis
15 of 19
A R e l i a b i l i t y R e s o u r c e C o m p a n y
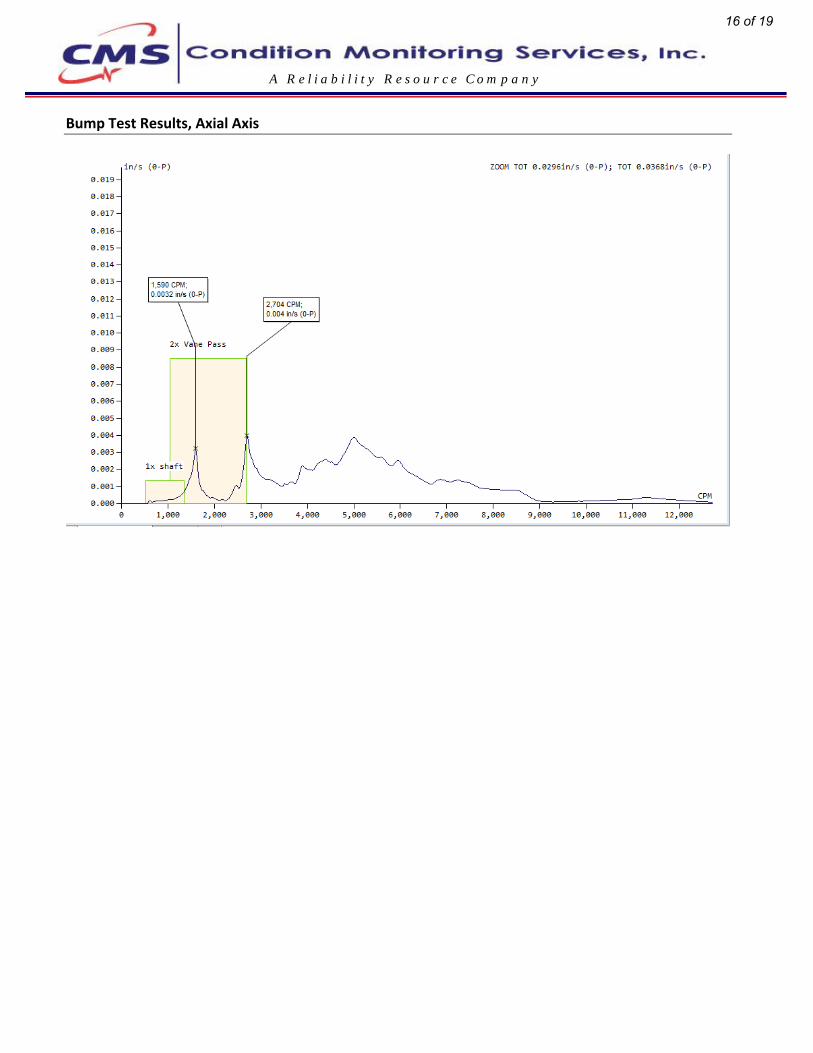
Bump Test Results, Axial Axis
16 of 19
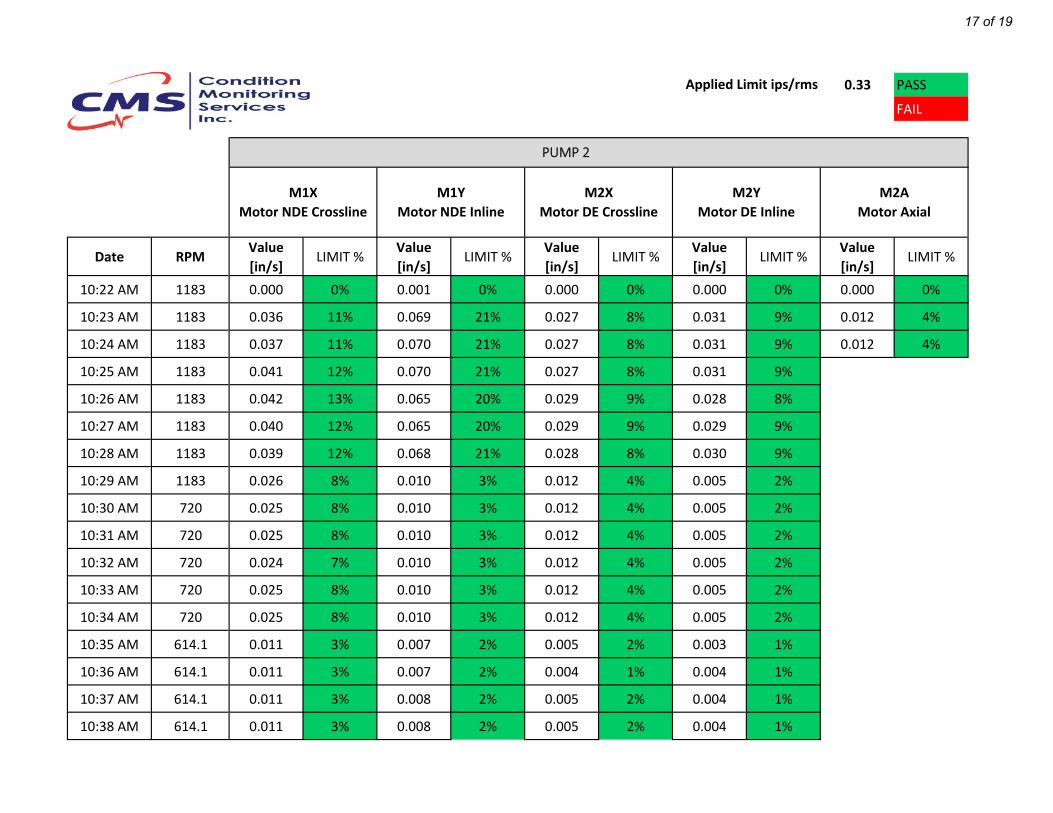
0.33 PASS
FAIL
Date RPMValue
[in/s]LIMIT %
Value
[in/s]LIMIT %
Value
[in/s]LIMIT %
Value
[in/s]LIMIT %
Value
[in/s]LIMIT %
10:22 AM 1183 0.000 0% 0.001 0% 0.000 0% 0.000 0% 0.000 0%
10:23 AM 1183 0.036 11% 0.069 21% 0.027 8% 0.031 9% 0.012 4%
10:24 AM 1183 0.037 11% 0.070 21% 0.027 8% 0.031 9% 0.012 4%
10:25 AM 1183 0.041 12% 0.070 21% 0.027 8% 0.031 9%
10:26 AM 1183 0.042 13% 0.065 20% 0.029 9% 0.028 8%
10:27 AM 1183 0.040 12% 0.065 20% 0.029 9% 0.029 9%
10:28 AM 1183 0.039 12% 0.068 21% 0.028 8% 0.030 9%
10:29 AM 1183 0.026 8% 0.010 3% 0.012 4% 0.005 2%
10:30 AM 720 0.025 8% 0.010 3% 0.012 4% 0.005 2%
10:31 AM 720 0.025 8% 0.010 3% 0.012 4% 0.005 2%
10:32 AM 720 0.024 7% 0.010 3% 0.012 4% 0.005 2%
10:33 AM 720 0.025 8% 0.010 3% 0.012 4% 0.005 2%
10:34 AM 720 0.025 8% 0.010 3% 0.012 4% 0.005 2%
10:35 AM 614.1 0.011 3% 0.007 2% 0.005 2% 0.003 1%
10:36 AM 614.1 0.011 3% 0.007 2% 0.004 1% 0.004 1%
10:37 AM 614.1 0.011 3% 0.008 2% 0.005 2% 0.004 1%
10:38 AM 614.1 0.011 3% 0.008 2% 0.005 2% 0.004 1%
Applied Limit ips/rms
PUMP 2
M1X
Motor NDE Crossline
M1Y
Motor NDE Inline
M2X
Motor DE Crossline
M2Y
Motor DE Inline
M2A
Motor Axial
17 of 19
18 of 19
19 of 19