Embed Size (px)
Citation preview

INTERNATIONAL JOURNAL ON SMART SENSING AND INTELLIGENT SYSTEMS VOL. 9, NO. 1, MARCH 2016
215
VIBRATION BASED HEALTH MONITORING OF
HONEYCOMB CORE SANDWICH PANELS USING SUPPORT
VECTOR MACHINE
Saurabh Guptaa, Satish B Satpala, Sauvik Banerjeeb and Anirban Guhaa*
aDepartment of Mechanical Engineering, Indian Institute of Technology Bombay, Powai,
Mumbai 400076, India bDepartment of Civil Engineering, Indian Institute of Technology Bombay, Powai,
Mumbai 400076, India *Email: [email protected]
Submitted: Dec. 2, 2015 Accepted: Jan. 16, 2016 Published: Mar. 1, 2016
Abstract- Honeycomb sandwich structures are extensively used in aerospace, aeronautic, marine and
automotive industries due to their high strength-to-weight ratios, high energy absorption capability and
effective acoustic insulation. Unfortunately, either presence of disbond along the skin-core interface or
emergence of disbond due to repeated loading, aging or an intensive load can jeopardize the integrity
and safety of the whole structure The current work presents a new array based technique for health
monitoring of these structures using support vector machine (SVM). The proposed technique is first
used on simulated mode shape data of the structure and then the technique is validated using
experimental mode shape data. The experimental set up has been developed in laboratory and Laser
Doppler Vibrometer (LDV) is used to extract the experimental mode shapes. The results have been
obtained using both support vector classification and regression analysis and it is found that that the
former is better at prediction of debond location.
Index terms: Support vector machine, Structural health monitoring, Laser Doppler Vibrometer, Mode Shape
Data, Honeycomb core sandwich panel.

Saurabh Gupta, Satish B Satpal, Sauvik Banerjee and Anirban Guha, VIBRATION BASED HEALTH MONITORING OF HONEYCOMB CORE SANDWICH PANELS USING SUPPORT VECTOR MACHINE
216
I. INTRODUCTION
Honeycomb sandwich panels are made by adhering two high rigidity thin sheets with low density
honeycomb core as shown in Figure 1. These panels exhibit very high specific strength and
specific stiffness and are widely used in the aerospace industry. The depth of honeycomb core is
much higher than the thickness of face sheets. In such a scenario, the transverse shear stiffness is
almost completely contributed by the honeycomb core as reported in [1]. The honeycomb core is
generally assumed to be a homogeneous material and its equivalent properties are used for the
purpose of analysis.
Figure 1.Construction of honeycomb core sandwich panel structure
Bonding of the face sheets to the honeycomb core is a difficult process and the quality of this
bonding usually decides the strength of the structure. The most common damage in such
structures is debonding between skin and core which occurs either due to manufacturing defects
or service loads. Debonded region in a sandwich structure is equivalent to a delamination of
composite laminates [2]. Debonding reduces the bending stiffness and resonant frequencies of
sandwich structures, and, as the length of debonding increases, the natural frequency decreases
and the damping ratio increases. The results indicate that damping can be used as a damage
identification feature for honeycomb structures. Figure 2 shows a typical debonding defect in
honeycomb structure.
Adhesive
Honeycomb core
Facing skin
INTERNATIONAL JOURNAL ON SMART SENSING AND INTELLIGENT SYSTEMS VOL. 9, NO. 1, MARCH 2016
217
Figure 2.Typical defect in honeycomb structure [3]
A mechanical impedance based method for damage detection in honeycomb core sandwich
structure is used by [3] and concluded that for detecting debonding, the test frequency should be
lower than the natural frequency of the structure. Delamination is the phenomenon of separation
between two composite laminates due to lack of reinforcement in the thickness direction.
Delamination occurs under flexural and transverse shear stresses due to quasi-static or dynamic
loading. The growth of delamination cracks under subsequent loading leads to a rapid reduction
in the mechanical properties and may cause catastrophic failure of the composite structure [4].
The development of the inter-laminar stresses is the primary cause of delamination in laminated
fiber composites. Due to the complex nature of laminated composite materials, the onset of
damage does not usually lead to ultimate failure, and it is necessary to account for the loss in
performance caused by any damage in order to accurately predict the composite material’s
performance. A technique based on the mode shapes and the variation of the modal damping
factors between the undamaged and damaged states of the structure is proposed in [5]. When
delamination occurs in a composite structure, energy loss occurs due to friction between the two
debonded surfaces. A plane shape function (PSF) is defined for mode r at a node with coordinates
(i, j) as given by equation 1.
, ,
,
,,
max max
rr
i j i jr
i j r r
i ji j
yxPSF
x y (1)
where x and y are two arbitrary mode dependent physical quantities in directions x and y
respectively. Strain or displacements can be used for x and y. It is assumed that delamination only
leads to increase in damping factor .
D
Dr r
r
r
(2)

Saurabh Gupta, Satish B Satpal, Sauvik Banerjee and Anirban Guha, VIBRATION BASED HEALTH MONITORING OF HONEYCOMB CORE SANDWICH PANELS USING SUPPORT VECTOR MACHINE
218
where = Damping factor
and superscript D stands for damage. Damping Damage Indicator (DaDI) is given by equation 3.
,1
,
,1
NDr
i j rr
Ni jr
i jr
PSFDaDI
PSF
(3)
The damage detection techniques can be classified into two categories, model-driven and data-
driven techniques. The first technique requires constructing a physical model of a structure
(perhaps using FEA) and then comparing the response of damaged and un-damaged structure
leading to a decision about its status. In a data-driven technique, the status of the structure is
monitored using statistical parameters. Recently, two modeling methods traditionally used in the
field of machine learning have been used for SHM. They are Artificial Neural Network (ANN)
and Support Vector Machine (SVM). They are different from traditional modeling methods in
that the models created using these techniques do not lend themselves to any physical
interpretation of the process. They act somewhat like a black box. However, their ability to
capture the intricacies of a complex structure is usually superior to the traditional modeling
methods. SVM has some advantages over ANN such as:
1. SVM ensures unique and global solution unlike ANN, which may suffer from multiple
local minima.
2. SVM can handle high dimensional input data.
3. ANNs are highly prone to over-fitting.
A multi-class pattern classification algorithm of C-support vector machine and the regression
algorithm of ε-support vector machine to identify the damage location and damage extent, in a
continuous girder bridge used in a railway [6]. Banerjee et.al [7] demonstrated the health
monitoring of isotropic thin plate structure without base-line signal using a wavelet-based sensing
technique. With the help of PZT wafer array of small footprint consisting of a single transmitter
and multi-receiver is used. The signals are recorded first for undamaged plate and compared with
theoretical model in order to tune an appropriate guided wave. The types of defect attempted to
indentify are cracks and loose rivet holes with damage index algorithm and depending on the

INTERNATIONAL JOURNAL ON SMART SENSING AND INTELLIGENT SYSTEMS VOL. 9, NO. 1, MARCH 2016
219
value of damage index the damages have been quantified. Generating and monitoring lamb
waves using PZT transducers and fiber optic sensors to monitor health of aerospace structure is
demonstrated in [8]. This proposed hybrid approach together with an in-house developed
algorithm is explored to detect and localize through thickness damage and surface damage
located on backside of the plate. Cross-correlation of forward and backward propagating
wavefields in composite structures using flexural wave signals is studied in [9]. The proposed
approach is verified by conducting experiments using laser Doppler vibrometer to receive the
scattered wave signals along a linear array. SHM of aerospace structures based on dynamic strain
measurements using SVM classification has been studied in [10]. The feature space has been
reduced using Independent Component Analysis (ICA). The results show that SVMs using
nonlinear kernel is a reliable and consistent pattern recognition scheme for damage diagnosis.
The use of SVM for prediction of fault in power systems has been demonstrated [11]. They used
support vector classification to predict the damage location. The inputs used for SVM model are
power and voltage values. A demonstration of damage detection process in civil structures using
SVM classifiers and wavelet is given in [12]. They found that the SVM was a robust classifier in
presence of noise whereas wavelet-based compression gracefully degrades its classification
accuracy. A SVM classifier for fault diagnosis of the broken rotor bars of a squirrel-cage
induction motor is explored in [13]. They used the spectral information of the motor current,
voltage and shaft field as selected features from the input vector applied to the support vector
machine. Recently, SVM (regression) based approach to locate the damage in an aluminium
beam using mode shape data corresponding to first natural frequency has been proposed in [14].
The technique has been validated using experimental mode shape data of the beam. Thus,
literature shows promising results in SHM using both support vector classification and
regression, the latter being more common. However, a comparative study of these two techniques
in a complex structure like a honeycomb core sandwich panel has not been attempted. This paper
attempts to do this using only the first mode shape displacement data. The motivation for using
the first mode shape displacement data is that this would lead to less pre-processing of the data
compared to other techniques. A cantilever boundary condition has been chosen for ease of
conducting the experiment. Initially, FEA analysis of honeycomb panel is done using Abaqus®
and mode shape data is extracted at the first natural frequency. Thereafter, experimental mode

Saurabh Gupta, Satish B Satpal, Sauvik Banerjee and Anirban Guha, VIBRATION BASED HEALTH MONITORING OF HONEYCOMB CORE SANDWICH PANELS USING SUPPORT VECTOR MACHINE
220
shape data has been obtained using Laser Doppler Vibrometer (LDV) and has been used for
validation of the proposed technique.
II. FINITE ELEMENT MODELING AND ANALYSIS
The honeycomb core is modeled in Abaqus® 6.10. The properties used for modeling honeycomb
panel are listed in table 1. Two regions, intact and debond, were defined in the plate’s FE model
as shown Figure 3. The surfaces have been created on each face sheet and core, then tie constraint
is applied except for the debond region in order to create debond of the required area.
Table 1.Honeycomb panel parameters
Parameters Value
Length of panel 250mm
Width of panel 250mm
Element size 5mm
Element type S4R shell
Face Sheet-Aluminum (AA 2024 T3)
Thickness 0.25mm
Young’s Modulus 70GPa
Poisson’s Ratio 0.33
Density 2800Kg/mm3
Shear Modulus 27GPa
Honeycomb Core-Aluminum ( Low density) Core 3/16-5056-0.0007)
Thickness 25mm
Density 32Kg/m3
Young’s Modulus 1KPa, 1Kpa (Ex , Ey)
Shear Modulus 1KPa,0.185GPa,0.89Gpa (Gxy, Gyz, Gzx)

INTERNATIONAL JOURNAL ON SMART SENSING AND INTELLIGENT SYSTEMS VOL. 9, NO. 1, MARCH 2016
221
Figure 3.Debond modeling approach used in Abaqus® 6.10
The displacement values of the plate at first natural frequency have been measured at various
points which are marked in red color along X and Y direction as shown in Figure 4.
Figure 4. Data measurement points shown in red color
III. OVERVIEW OF SUPPORT VECTOR MACHINE (SVM)
SVM is an algorithm drawn from pattern recognition background. Initially it was developed for
classification problem and eventually it has been applied for regression analysis. In this section a
brief overview of SVM is given.

Saurabh Gupta, Satish B Satpal, Sauvik Banerjee and Anirban Guha, VIBRATION BASED HEALTH MONITORING OF HONEYCOMB CORE SANDWICH PANELS USING SUPPORT VECTOR MACHINE
222
a. SVM for classification
Consider the problem of binary classification. Training data are given as
1 21 2, , , , , , x , y 1, -1
n
l ly y yx x x (1)
For simplicity consider a 2-dimensional input space i.e.,2
x which is linearly separable in +1
and -1 classes with a hyperplane say H
0T
x bw (2)
where, x is input space, w is weight vector and b is bias term.
In Figure 5 the separating hyperplane H, is shown in dashed line and the planes shown in thick
line are called margins. Let them be called H1 and H2 in class 1 and 2 respectively and the
distance between them is called as margin, M.
Figure 5. Two out of many separating lines: right, a good one with a large margin, and left, a less
acceptable one with a small margin
They pass through the closest points in both classes. The closest points are called the support
vectors. There can be infinite hyper planes which separate the given data, but the best classifier is
one that maximizes the margin which is given by
2
Mw
(3)
Maximizing margin given by equation (3) means minimizing the norm of the weight vector w
and minimization of norm 2 2 2
1 2
T
nw ww w w w equals a minimization of
2 2 2 2
1 21
nT
i ni
ww w w w w
. Hence, the problem becomes
Minimize 1
2
T
ww (4)
INTERNATIONAL JOURNAL ON SMART SENSING AND INTELLIGENT SYSTEMS VOL. 9, NO. 1, MARCH 2016
223
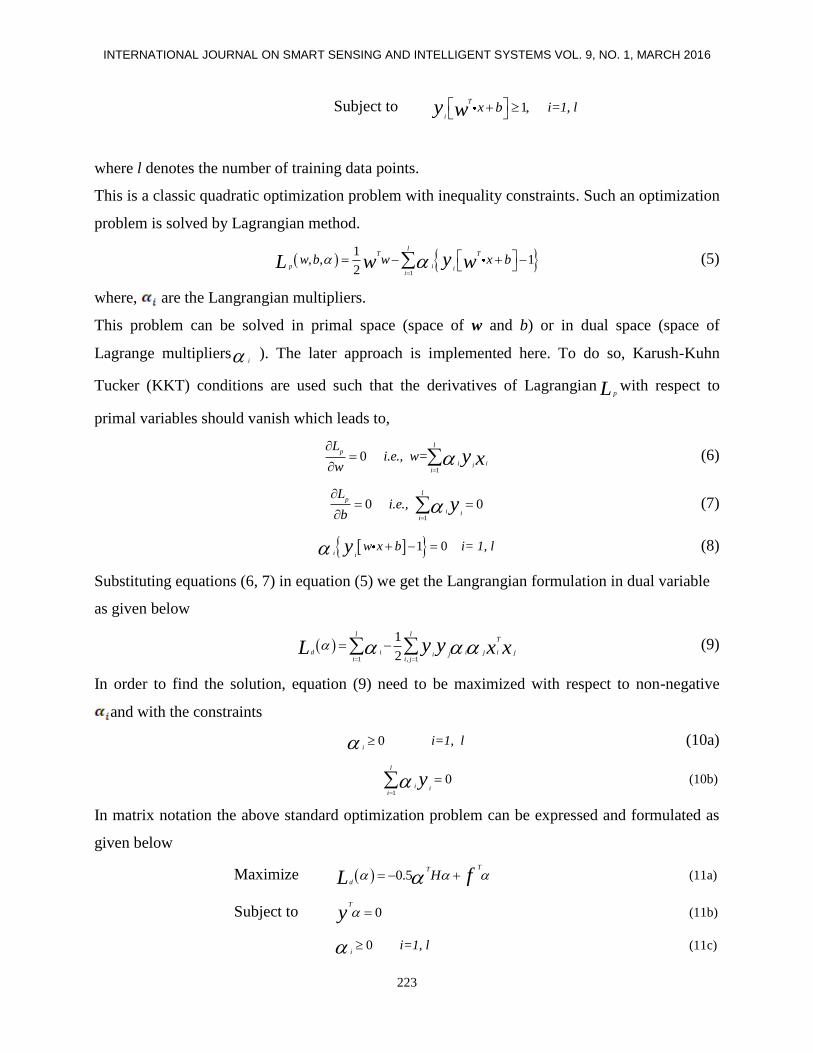
Subject to 1,T
ix b i=1, ly w
where l denotes the number of training data points.
This is a classic quadratic optimization problem with inequality constraints. Such an optimization
problem is solved by Lagrangian method.
1
1, , 1
2
lT T
p i ii
w b w x byw wL
(5)
where, are the Langrangian multipliers.
This problem can be solved in primal space (space of w and b) or in dual space (space of
Lagrange multipliersi ). The later approach is implemented here. To do so, Karush-Kuhn
Tucker (KKT) conditions are used such that the derivatives of LagrangianpL with respect to
primal variables should vanish which leads to,
1
0l
p
i iii
L i.e., w=
wy x
(6)
1
0 0l
p
i ii
L i.e.,
by
(7)
1 0i i
w x b i= 1, ly (8)
Substituting equations (6, 7) in equation (5) we get the Langrangian formulation in dual variable
as given below
1 , 1
1
2
l lT
d i i j i ji ji i j
y y x xL
(9)
In order to find the solution, equation (9) need to be maximized with respect to non-negative
and with the constraints
0i
i=1, l (10a)
1
0l
i ii
y
(10b)
In matrix notation the above standard optimization problem can be expressed and formulated as
given below
Maximize 0.5TT
dH fL (11a)
Subject to 0T
y (11b)
0i
i=1, l (11c)

Saurabh Gupta, Satish B Satpal, Sauvik Banerjee and Anirban Guha, VIBRATION BASED HEALTH MONITORING OF HONEYCOMB CORE SANDWICH PANELS USING SUPPORT VECTOR MACHINE
224
where, ,1 2
TT
i ji j H = l , y y x x and f is an (l, 1) unit vector. After obtaining
solution from the above optimization problem, the weight vector w and bias b are calculated as
1
l
i iii
w y x
(12a)
1,
T
s svs
sv
b w s = 1, y x NN
(12b)
Where, svN denotes the number of support vectors. Training input data having non-zero Lagrange
multipliers are called support vectors. Having calculated the value of weight vector and bias term,
final expression for separating hyperplane is written as
1
l T
i i ii if x = by x x
(13)
In case the two classes are not completely separable, positive slack parameters are introduced
into the equations of the margins. This is referred as soft margins. The modified equations of
margins are
1T
iix b , i=1, ly w
(14)
i
C (15)
The primal form of the Lagrangian for the non-separable case is:
2
1 1
11
2
l lT
p ii i i iii i
C x bw y wL
(16)
where i
are Lagrangian parameters to force 0i
.
In reality, most classes are overlapped and the genuine separation lines are nonlinear
hypersurfaces. SVM can create a nonlinear decision hypersurface which will be able to classify
nonlinearly separable data. The idea is to map the input vector x to a higher dimension vector z
using a mapping vector function vector Φ. The dot product i jx x will change to i j
. But
the computation can be very costly depending on the dimension of vector z. The best way to
address the problem is to introduce a function K such that
i j i jK x x (17)
The function K is called kernel function. The same approach with some modifications is
implemented to formulate SVM to perform regression analysis [15].

INTERNATIONAL JOURNAL ON SMART SENSING AND INTELLIGENT SYSTEMS VOL. 9, NO. 1, MARCH 2016
225
IV. PREDICTION OF DEBOND LOCATION USING SIMULATION DATA
a. Procedure
A total of 17 samples having single damage (debond) of 30x30 mm2 area at particular locations
have been modeled and the corresponding first mode shape data is obtained. The feature vector
for SVM is prepared using mode shape displacement data. Out of 17, mode shape data of 13
damaged honeycomb panels have been used as training set and 4 damaged sample’s mode shape
data is used as test set. The locations of damages used for the training set are shown in Figure 5
and those for the test set as shown in Figure 6. The training set should be prepared in such a way
that it includes information from all regions of the structure, therefore the mode shape data
associated with the debond locations from all the region of honeycomb panel is included in the
training set. Prediction of debond location is carried out in two ways, SV classification and SV
regression. In case of classification the debond locations have been assigned class numbers. For
example, panel having damage no 1 (S1) lies in horizontal zone C4 and C5 and in vertical zones
V4 and V5. Therefore, the training output for the feature vector associated with these zones are
assigned as class 1 and rest as class -1. Table 2 demonstrates the output of the training set for all
the debond locations considered in the study. In case of SV regression analysis, the outputs of the
training set have been assigned X and Y co-ordinates of the debond location. Therefore, SV
regression analysis involves two steps (prediction of X and Y co-ordinate independently) in order
to locate debond. A Matlab® toolbox developed by Gunn [16] is used to carry out the SV
analysis.
Figure 5.Debond locations associated with training set

Saurabh Gupta, Satish B Satpal, Sauvik Banerjee and Anirban Guha, VIBRATION BASED HEALTH MONITORING OF HONEYCOMB CORE SANDWICH PANELS USING SUPPORT VECTOR MACHINE
226
Figure 6.Debond locations associated with test set
Table 2. Training output vectors for seven horizontal and eight vertical zones
Damage No.
Class 1 2 3 4 5 6 7 8 9 10 11 12 13
C1 -1 -1 -1 -1 1 -1 -1 -1 -1 1 -1 -1 1
C2 -1 -1 -1 -1 1 1 -1 -1 1 1 -1 -1 1
C3 -1 -1 -1 -1 -1 1 -1 -1 1 -1 -1 -1 -1
C4 1 1 1 -1 -1 -1 -1 -1 -1 -1 -1 -1 -1
C5 1 1 1 -1 -1 -1 1 1 -1 -1 -1 -1 -1
C6 -1 -1 -1 1 -1 -1 1 1 -1 -1 1 1 -1
C7 -1 -1 -1 1 -1 -1 -1 -1 -1 -1 1 1 -1
V1 -1 -1 1 -1 -1 -1 -1 -1 -1 1 1 -1 -1
V2 -1 -1 1 -1 -1 -1 -1 1 1 1 1 -1 -1
V3 -1 -1 -1 -1 -1 -1 -1 1 1 -1 -1 -1 -1
V4 1 -1 -1 1 1 -1 -1 -1 -1 -1 -1 -1 -1
V5 1 -1 -1 1 1 -1 -1 -1 -1 -1 -1 -1 -1
V6 -1 -1 -1 -1 -1 1 1 -1 -1 -1 -1 -1 -1
V7 -1 1 -1 -1 -1 1 1 -1 -1 -1 -1 1 1
V8 -1 1 -1 -1 -1 -1 -1 -1 -1 -1 -1 1 1
b. Results
The results obtained after prediction of the debond location by SV classification have been
presented in tabular form as shown in table 3. The debond location numbers 2 and 3 have been
predicted accurately but there is a considerable error in prediction of X any Y co-ordinates of

INTERNATIONAL JOURNAL ON SMART SENSING AND INTELLIGENT SYSTEMS VOL. 9, NO. 1, MARCH 2016
227
debond locations 1 and 4. The last two columns represent percentage error in prediction of X and
Y co-ordinate respectively which are normalized with the length of the panel. The predictions are
reasonably accurate except for X co-ordinate of debond region T1 and Y co-ordinate of debond
region T4.
Table 3. Results for Honeycomb panel using SV classification
Predicted Actual Absolute
Error X
(mm)
Absolute
Error Y
(mm)
Percentage
Error in X
normalized
Percentage
Error in Y
normalized
Test zone zone zone zone Damage C V C V
T1 5 2 4 2 30 0 12 0
T2 5 4 5 4 0 0 0 0
T3 1 7 1 7 0 0 0 0
T4 4 1 4 5 0 120 0 48
With help of same data set (first mode shape displacements), the debond locations have next been
predicted using SV regression analysis.The results have been reported in table 4. The last two
columns show the percentage error which have been normalized with length of the panel. In this
case, prediction of X co-ordinate is better as compared to Y co-ordinate.
Table 4. Results for Honeycomb panel using SV regression based on simulation data
V. VALIDATION OF THE PROPOSED TECHNIQUE
In this section, the proposed technique has been validated using experimental mode shape data.
Four specimens of honeycomb core sandwich panels were fabricated at ISRO Satellite Centre,
Predicted Actual Absolute
Error in
X (mm)
Absolute
Error in
Y (mm)
Percentage
Error in X
normalized
Percentage
Error in Y
normalized
Test X Y X Y Damage
T1 85.13 121.55 40 120 45.13 1.55 18.052 0.62
T2 125.78 143.6 130 160 4.22 16.4 1.688 6.56
T3 174.37 114.49 180 70 5.63 44.49 2.252 17.796
T4 140.71 152.14 150 120 9.29 32.14 3.716 12.856
Saurabh Gupta, Satish B Satpal, Sauvik Banerjee and Anirban Guha, VIBRATION BASED HEALTH MONITORING OF HONEYCOMB CORE SANDWICH PANELS USING SUPPORT VECTOR MACHINE
228
Bangalore. The material and properties for the panel are mentioned in table 1. The debond in all
the four specimens was created during fabrication at known locations. All the four panels were
made out of a single panel and later they were cut to four pieces. Three holes were provided in
each panel to hold them as cantilever during vibration test.
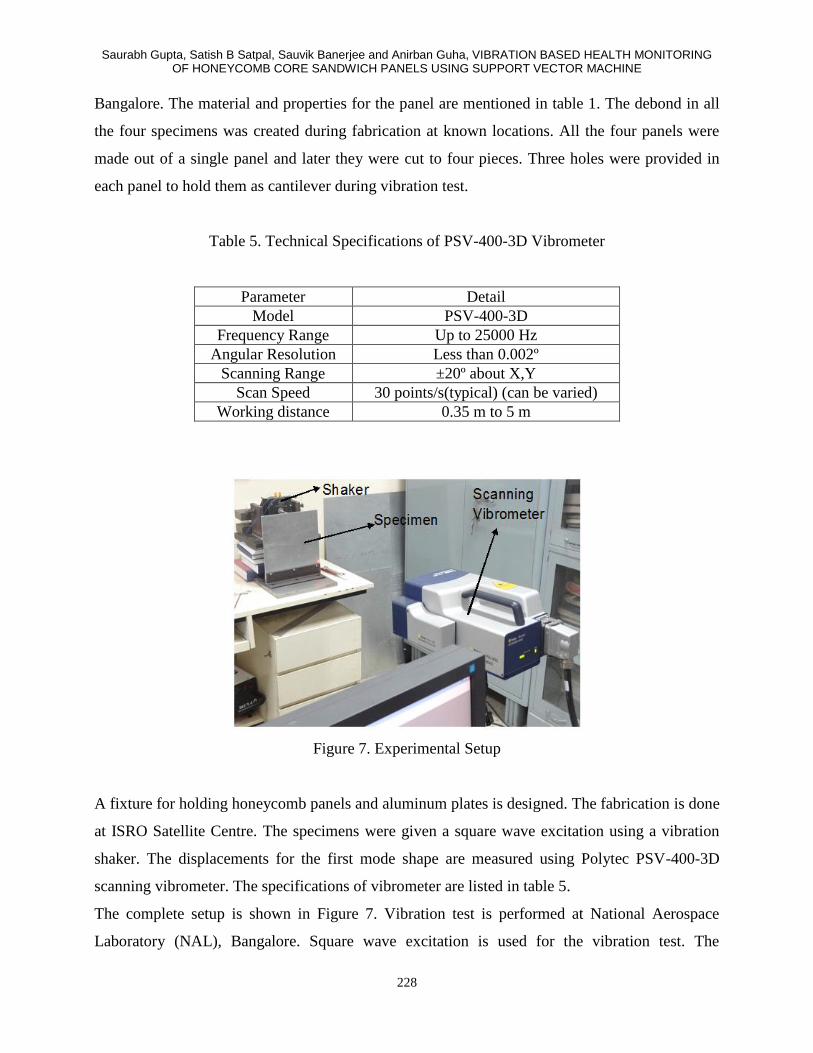
Table 5. Technical Specifications of PSV-400-3D Vibrometer
Parameter Detail
Model PSV-400-3D
Frequency Range Up to 25000 Hz
Angular Resolution Less than 0.002º
Scanning Range ±20º about X,Y
Scan Speed 30 points/s(typical) (can be varied)
Working distance 0.35 m to 5 m
Figure 7. Experimental Setup
A fixture for holding honeycomb panels and aluminum plates is designed. The fabrication is done
at ISRO Satellite Centre. The specimens were given a square wave excitation using a vibration
shaker. The displacements for the first mode shape are measured using Polytec PSV-400-3D
scanning vibrometer. The specifications of vibrometer are listed in table 5.
The complete setup is shown in Figure 7. Vibration test is performed at National Aerospace
Laboratory (NAL), Bangalore. Square wave excitation is used for the vibration test. The
INTERNATIONAL JOURNAL ON SMART SENSING AND INTELLIGENT SYSTEMS VOL. 9, NO. 1, MARCH 2016
229
displacements are measured at predefined locations. A sweep of frequency in the range of the
natural frequency of the structure is made. The first mode shape is identified from the first peak
in the displacements over the frequency range scanned.
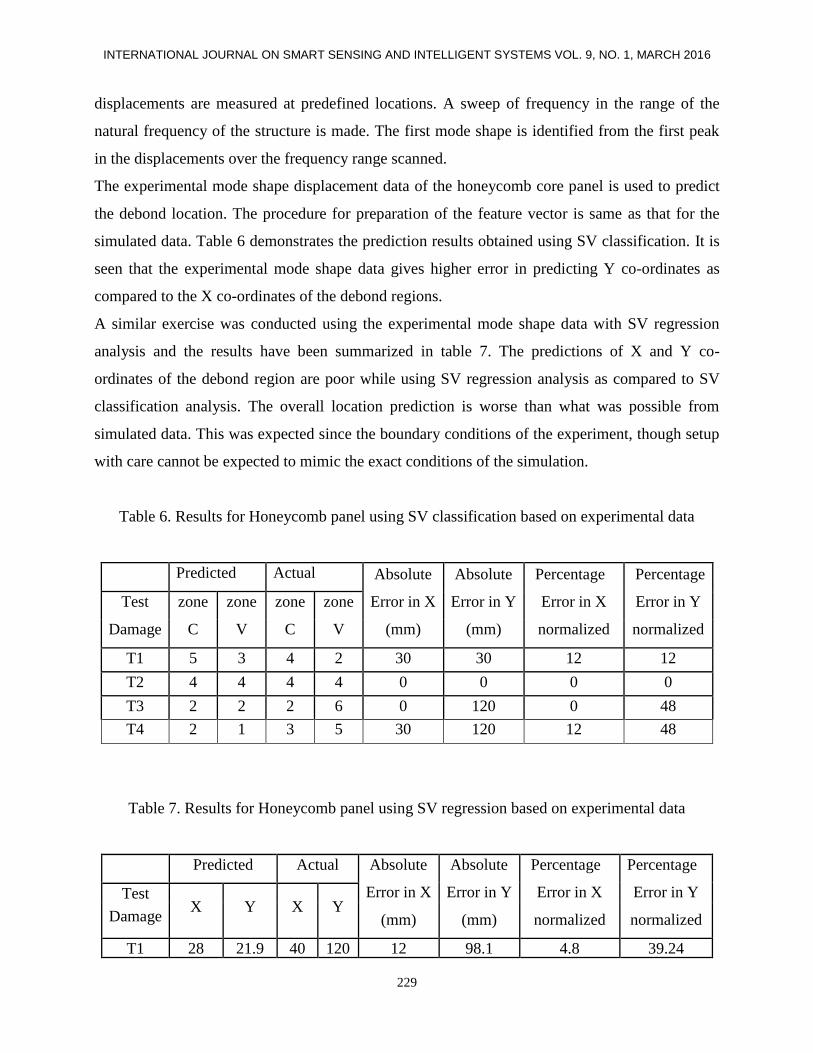
The experimental mode shape displacement data of the honeycomb core panel is used to predict
the debond location. The procedure for preparation of the feature vector is same as that for the
simulated data. Table 6 demonstrates the prediction results obtained using SV classification. It is
seen that the experimental mode shape data gives higher error in predicting Y co-ordinates as
compared to the X co-ordinates of the debond regions.
A similar exercise was conducted using the experimental mode shape data with SV regression
analysis and the results have been summarized in table 7. The predictions of X and Y co-
ordinates of the debond region are poor while using SV regression analysis as compared to SV
classification analysis. The overall location prediction is worse than what was possible from
simulated data. This was expected since the boundary conditions of the experiment, though setup
with care cannot be expected to mimic the exact conditions of the simulation.
Table 6. Results for Honeycomb panel using SV classification based on experimental data
Predicted Actual Absolute
Error in X
(mm)
Absolute
Error in Y
(mm)
Percentage
Error in X
normalized
Percentage
Error in Y
normalized
Test zone zone zone zone
Damage C V C V
T1 5 3 4 2 30 30 12 12
T2 4 4 4 4 0 0 0 0
T3 2 2 2 6 0 120 0 48
T4 2 1 3 5 30 120 12 48
Table 7. Results for Honeycomb panel using SV regression based on experimental data
Predicted Actual Absolute
Error in X
(mm)
Absolute
Error in Y
(mm)
Percentage
Error in X
normalized
Percentage
Error in Y
normalized
Test X Y X Y
Damage
T1 28 21.9 40 120 12 98.1 4.8 39.24

Saurabh Gupta, Satish B Satpal, Sauvik Banerjee and Anirban Guha, VIBRATION BASED HEALTH MONITORING OF HONEYCOMB CORE SANDWICH PANELS USING SUPPORT VECTOR MACHINE
230
T2 24.21 19.51 130 160 105.79 140.49 42.316 56.196
T3 27.63 21.83 180 70 152.37 48.17 60.948 19.268
T4 27.24 81.63 150 120 122.76 38.37 49.104 15.348
The error predicted for the X and Y co-ordinates have been represented graphically in figures (8
and 9) using SV classification and regression respectively as shown below.
Figure 8. Error prediction using SV
Classification
Figure 9. Error prediction using SV regression
ACKNOWLEDGMENT
Authors would like to specially thank Shri S. Kalyana Sundaram, Principal Scientist, National
Aerospace Laboratories, Bangalore for making his facility available to conduct vibration test.
Authors would like to sincerely thank Structures Group and Facilities Group of ISRO Satellite
Centre for the fabrication of Honeycomb Core Sandwich Panels and fixture for experimental
setup.
REFERENCES
[1] H.Meifeng and H.Wenbin, “A study on composite honeycomb sandwich panel”, Materials
and design, Vol. 29, 2008, pp. 709-713.

INTERNATIONAL JOURNAL ON SMART SENSING AND INTELLIGENT SYSTEMS VOL. 9, NO. 1, MARCH 2016
231
[2] Y.K.Hyeung and H.Woonbong, “Effect of debonding on natural frequencies and frequency
response functions of honeycomb sandwich beams”, Composite structures, Vol.55, 2002, pp. 51-
62.
[3] M.K.Lim, S.C.Low, L.Jiang and K.M.Liew, “Dynamic characteristics of disbands in
honeycomb structures”, Engineering structures, Vol. 17, 1995, pp. 27–38.
[4] K.B.Su, “Delamination resistance of stitched thermoplastic matrix composite laminates”,
Advances in thermoplastic matrix composite materials, Vol. 1044, 1989, pp. 279-300.
[5] D.Montalvao, A.M.R.Ribeeiro, J.Duarte-Silva, “A method for the localization of damage in
CFRP plate using damping”, Mechanical systems and signal processing, Vol. 23, 2009, pp. 1846-
1854.
[6] B.Sauvik,M.Debdatta and M.S.Shaik, “ wavlet-based active sensing for health monitoring of
plate structures using baseline free ultrasonic guided wave signals”, International journal on
smart sensing and intelligent systems, vol. 6, no. 4, 2013, pp. 1435-1455.
[7] S.Deshan, F.U.Chunyu, LI. Qiao LI, “Experimental investigation of damage identification for
continuous railway bridges”, Journal of Modern Transportation, Vol. 20, No.1, 2012, pp. 1-9.
[8] B.Darun,M.Marcias,R.Bruno and Y.Marko, “ A Hybrid Structural Health Monitoring System
for the Detection and Localization of Damage in Composite Structures”, Journal of Sensors,
2014, vol. 2014, doi:10.1155/2014/109403.
[9] H.Jiaze and Y. Fuh-Gwo , “Damage identification for composite structures using a cross-
correlation reverse-time migration technique”, Structural Health Monitoring, 2015, vol. 14 No. 6,
pp. 558-570.
[10] T.H.Loutas, A.O.Panop, D.Rouliasand V.Kostopoulos, “Intelligent health monitoring of
aerospace composite structures based on dynamic strain measurements”, Expert systems with
application, Vol. 39, 2012, pp. 8412-8422.
[11] S.K.Kumar, T.Jayabarathiand S.Naveen, “Fault identification and location in distribution
systems using support vector machines”, European Journal of Scientific Research, Vol. 51, 2011,
pp. 53-60.
[12] B. Ahmet, S. K.Ambuj, S.Peter, F.Tony, J.Hector, Y.Linjun and E.Ahmed, “Real-time
nondestructive structural health monitoring using support vector machines and wavelets”, Proc.

Saurabh Gupta, Satish B Satpal, Sauvik Banerjee and Anirban Guha, VIBRATION BASED HEALTH MONITORING OF HONEYCOMB CORE SANDWICH PANELS USING SUPPORT VECTOR MACHINE
232
SPIE 5770, Advanced Sensor Technologies for Nondestructive Evaluation and Structural Health
Monitoring, 2005, doi:10.1117/12.597685.
[13] K. Jaroslaw and S.Osowski, “Support vector machine for fault diagnosis of the broken rotor
bars of squirrel-cage induction motor”, Neural Computation & Application, Vol. 19, 2010, 557-
564.
[14] S. Satish, G.Anirban and B.Sauvik, “Damage identification in aluminium beams using
support vector machine: Numerical and Experimental studies”, Struct. Control Health Monit.,
2015, doi:10.1002/stc.1773.
[15] A.J.Smola and B.Scholkopf, “A tutorial on support vector regression”, Statistics and
Computing, Vol. 14, 2004, No. 3, pp 199-222.
[16] S.R. Gunn, “Support Vector Machines for Classification and Regression,” technical report,
School of Electronics and Computer Science, Univ. of Southampton, Southampton, U.K., 1998.


![Sauvik Das -- Curriculum Vitae · 2018-10-16 · [W2] Sauvik Das, Thomas Zimmermann, Nachiappan Nagappan, Bruce Phillips, and Chuck Harrison. Revival Actions in a Shooter Game. CHI](https://img.pdfslide.net/doc/110x75/5f19e1e57c7ea053e41f903e/sauvik-das-curriculum-vitae-2018-10-16-w2-sauvik-das-thomas-zimmermann.jpg)