Embed Size (px)
Citation preview

Inter-noise 2014 Page 1 of 10
Vibro-acoustic measurements and techniques for electric
automotive applications
Mathieu SARRAZIN1; Steven GILLIJNS
1; Karl JANSSENS
1; Herman VAN DER AUWERAER
1;
Kevin VERHAEGHE2
1 SIEMENS INDUSTRY SOFTWARE NV, Interleuvenlaan 68, B-3001 Leuven, Belgium
2 Inverto NV, Jacques Parijslaan 8, B-9940 Evergem, Belgium
ABSTRACT
In this study, noise and vibration measurements were carried out on a multi-phase 12/8 switched reluctance
(SR) motor and analyzed with vibro-acoustic techniques. When evaluating the behavior of electric
powertrains for automotive applications, it is necessary to perform a vibro-acoustic analysis, particularly in
view of the acoustic comfort perceived by the driver and passengers. High frequency tonal noise can be very
annoying and even causes long term damage. Therefore, the noise and vibrations must be deliberately
optimized. In case of a SR motor, the radial magnetic forces between the stator and rotor are the main
excitation source, yielding large deformations of the stator housing and emissions of noise. Measurements
and simulation results are compared for different load conditions. The dominant vibration modes are
analyzed with modal analysis techniques. The unpleasant tonal noise of the motor is objectively quantified by
noise metrics. Finally, the relationship between the current profiles, radial magnetic forces, and mechanical
and acoustical vibrations is investigated in order to obtain a better understanding of the mechanisms
underlying the vibro-acoustic behavior of the motor.
Keywords: NVH, Electric Powertrains and Vehicles, Data Acquisition I-INCE Classification of Subjects
Number(s): 11.5, 13.2, 21.7, 74.
1. INTRODUCTION
Nowadays, Switched Reluctance (SR) motors reflect a very attractive alternative to other electric
motor types for automotive traction. An advantage of the SR motor is its simple design, which yields a
cost-effective construction. The SR motor suffers, however, from a Noise, Vibration and Harshness
(NVH) issue which has caused some concern in the automotive industry. The noise and vibration
radiation produced by SR motors is one of the most crucial problems to be solved before it will find its
growth into the automotive industry. The NVH properties of a SR motor depend on several factors such
as machine dimensions, material properties and electromagnetic design. A NVH analysis provides an
essential value towards the challenges of designing SR motors in terms of ride comfort and acoustic
comfort inside a vehicle.
This paper presents the results of a detailed experimental NVH assessment of a SR motor with the
aim to establish an understanding of the main noise generation and propagation mechanisms. Firstly,
an acoustic noise generation process for a SR motor is presented. Next, the measurement test setup and
the objectives of this research are discussed, followed by the vibro-acoustic measurement results.
More in detail, a signature time and frequency analysis, a modal analysis, sound metrics and the
operational deflection shapes are described for this specific type of electric driveline. Finally, some
conclusions are drawn.
2. ACOUSTIC NOISE GENERATION PROCESS
A multi-phase SR motor is a type of synchronous machine, but with particular features: the field

Page 2 of 10 Inter-noise 2014
Page 2 of 10 Inter-noise 2014
coil is wound around the stator poles, but no coil or magnetic material is presented on the rotor. The
motor works by energizing opposite stator poles, thereby generating a magnetic field. This magnetic
field forces the rotor poles to rotate to the position of minimum reluctance, aligning them to the closest
stator poles. By energizing consecutive stator poles, continuous rotation is generated (1). Figure 1
shows the principle for a 12/8 SR motor, which has 12 stator poles and 8 rotor poles. Considering one
phase, it can be observed that two main equilibrium positions of the rotor exist. The rotor position
illustrated in Figure 1a is called the unaligned position in relation to phase AA’. The position with the
smallest magnetic reluctance is called the aligned position (Figure 1b). Typically, the number of rotor
poles is lower than the number of stator poles, which prevents the poles from all aligning at the same
time, such that, by switching the poles in an appropriate way a continuous rotary motion can be
established.
(a) Unaligned position
(b) Aligned position
Figure 1 - Cross-sections of the analysed 12/8 SR motor and distribution of one coil group
In a 12/8 SR motor, each of the stator phases is activated eight times per revolution. Table 1
compares other configurations, where Np is the number of poles excited at the same time, N e the
number of electrical phases, N t, the total number of phase excitations per revolution and O the number
of times that a phase is excited per revolution:
Table 1 - Different SR motor configurations
Parameters Configuration
8/6 12/8 16/12
Np
Ne
Nt
O
2
4
24
6
4
3
24
8
4
4
48
12
As shown in Figure 2a, the acoustic noise generation process of a SR motor consists of three steps.
Generally, the torque originating from the radial magnetic forces, which are determined by the phase
currents, controlled by the switching pattern, plays a dominant role in the noise generation of a SR
motor. In the first step, the phase currents flowing through the stator coils generate time-varying radial
forces (Equation 1) in the air gap between the stator and the rotor poles. The considered radial force
𝐹𝑟 is proportional to the square of the phase current i:
𝐹𝑟(𝜃, 𝑙𝑔 , 𝑖) = −1
2𝑖2𝐿(𝜃, 𝑖)
𝑙𝑔 (1)
where 𝐿(𝜃, 𝑖) is the self-inductance of a single phase in function of the rotor position θ and lg is the air
gap length between rotor and stator. In the second step, these radial forces excite vibrations in the
stator which are propagated through the mechanical structure. The largest vibration levels arise when
the natural modes of the stator are excited by the pulsating radial magnetic forces (Fig ure 2b). In the
final step, the deformations of the stator and the attached components cause air vibrations resulting in
pressure differences detectable by the human ear.

Inter-noise 2014 Page 3 of 10
Inter-noise 2014 Page 3 of 10
(a) Noise generation process of a SR motor
(b) Simulated finite element model
of the stator mode shapes (2)
Figure 2 - Noise generation process of a SR motor with its corresponding mode shapes
Each type of SR motor has its own unique acoustic and vibration signature which is defined by
several factors such as the mechanical design, the electromagnetic design and the excitation pattern of
the phase currents. It is expected that a 12/8 SR motor has better NVH properties than the 8/6
configuration. In general, the natural frequencies of the square mode are higher and the ‘ovalization’
mode is not expected because four poles are excited at the same time resulting in a symmetric
distribution. As a result, a lower noise contribution for a 12/8 configuration should be achieved in the
most sensitive frequency area of the human ear.
3. EXPERIMENTAL TEST SETUP AND THE OBJECTIVES
Before presenting the vibro-acoustic analysis, this section introduces the reader to the setup and the
objectives of the measurements. The setup includes two different machines, a 12/8 SR motor and
110 kW squirrel cage induction motor. It concerns a 2-pole induction motor with a modular three-level
IGBT converter. A PC-based controller, a programmable powerful target PC, is used to compile
graphical block diagram algorithms and run real-time. To satisfy the high performance over the full
speed range, a field-oriented control (FOC) is implemented to control the induction motor. The SR
drive used a conventional control technique, hysteresis current control and is coupled to the induction
motor with belts. Figure 3 shows the principal parts of the test rig setup. The properties of the SR
motor are described in Table 2.
Table 2 - Properties of the SR motor
Parameters Value Unit
E-motor dimensions (LxD)
E-motor weight
E-motor inertia
Nominal continuous power
Maximum speed
215x256
50
21087
45
15000
mm
kg
kgmm2
kW
min-1
In total, sixty tri-axial accelerometers were mounted on the jacket and the side panels. Furthermore,
four microphones were placed: two in the near-field, two in far-field. An acoustic insulation box was
placed around the SR driveline to separate the acoustic motor noise from environmental noise. To
measure very accurately the rotational speed, an incremental encoder is used. Its output is measured in
2048 pulses per revolution which gives a very detailed rotational speed profile.
The main objective of the measurement campaign is to evaluate a 12/8 SR motor in terms of NVH

Page 4 of 10 Inter-noise 2014
Page 4 of 10 Inter-noise 2014
performance. More specific objectives are i) to verify with the help of operational deflection shapes
that the square mode is the first excited mode, ii) to identify the dominant orders in different conditions,
iii) to assess the tonality, loudness and sharpness with sound metrics.
Figure 3 - Test rig with a SR drive system coupled to a two-pole induction motor
An electric motor for vehicle applications should be able to operate in the four quadrants of the
speed-torque plane. In this study, motor quadrant I and II (Figure 4) are considered as they are the most
used ones in automotive applications. Quadrant 1 indicates forward motoring since the torque is in the
direction of motion. Quadrant 2 indicates forward braking since the torque is opposite to the direction
of motion.
Figure 4 - Four quadrant motion control of an electric motor
In both quadrants, different torque levels from 0% to 49% were studied (Figure 5) for this type of machine.
Figure 5 - Torque conditions during acceleration and deceleration in forward direction
4. VIBRO-ACOUSTIC STUDY BASED ON EXPERIMENTAL DATA
In this paragraph, both the results of a modal analysis and operational measurements in a speed
range from 0 up to 10000 RPM are studied in different load conditions.
Inter-noise 2014 Page 5 of 10
Inter-noise 2014 Page 5 of 10
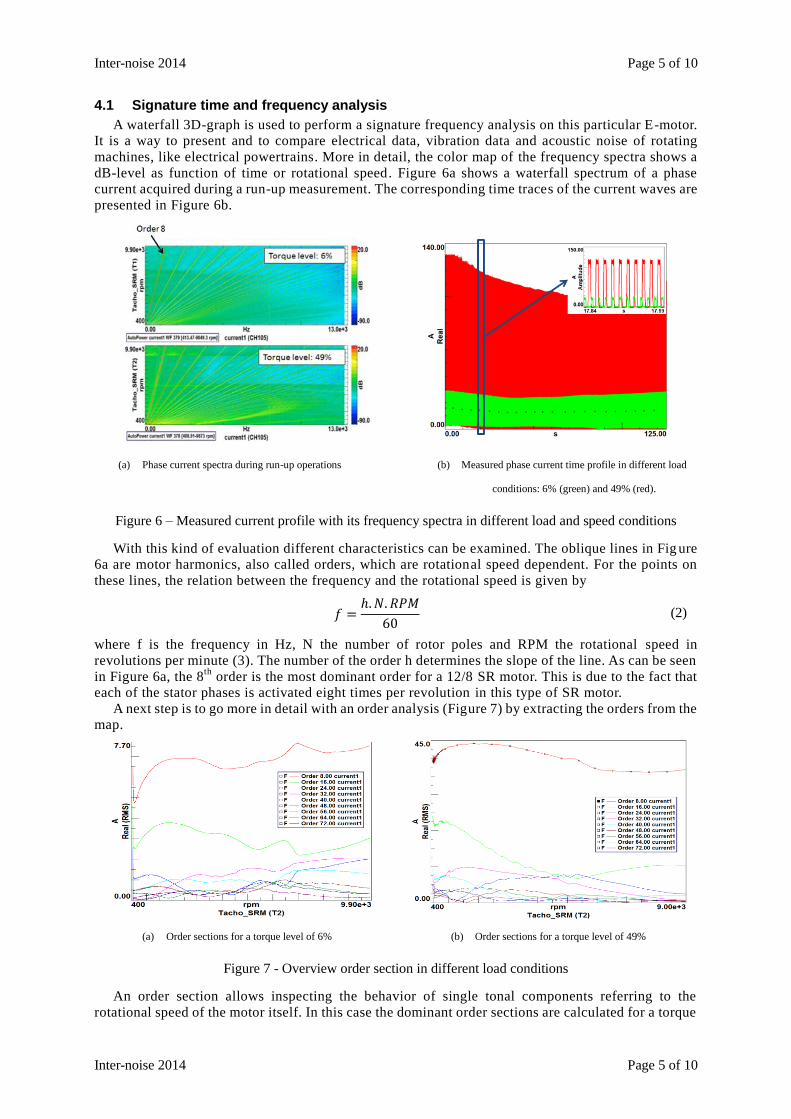
4.1 Signature time and frequency analysis
A waterfall 3D-graph is used to perform a signature frequency analysis on this particular E-motor.
It is a way to present and to compare electrical data, vibration data and acoustic noise of rotating
machines, like electrical powertrains. More in detail, the color map of the frequency spectra shows a
dB-level as function of time or rotational speed. Figure 6a shows a waterfall spectrum of a phase
current acquired during a run-up measurement. The corresponding time traces of the current waves are
presented in Figure 6b.
(a) Phase current spectra during run-up operations (b) Measured phase current time profile in different load
conditions: 6% (green) and 49% (red).
Figure 6 – Measured current profile with its frequency spectra in different load and speed conditions
With this kind of evaluation different characteristics can be examined. The oblique lines in Fig ure
6a are motor harmonics, also called orders, which are rotational speed dependent. For the points on
these lines, the relation between the frequency and the rotational speed is given by
𝑓 =ℎ.𝑁. 𝑅𝑃𝑀
60 (2)
where f is the frequency in Hz, N the number of rotor poles and RPM the rotational speed in
revolutions per minute (3). The number of the order h determines the slope of the line. As can be seen
in Figure 6a, the 8th
order is the most dominant order for a 12/8 SR motor. This is due to the fact that
each of the stator phases is activated eight times per revolution in this type of SR motor.
A next step is to go more in detail with an order analysis (Figure 7) by extracting the orders from the
map.
(a) Order sections for a torque level of 6%
(b) Order sections for a torque level of 49%
Figure 7 - Overview order section in different load conditions
An order section allows inspecting the behavior of single tonal components referring to the
rotational speed of the motor itself. In this case the dominant order sections are calculated for a torque
Page 6 of 10 Inter-noise 2014
Page 6 of 10 Inter-noise 2014
level of 6% and 49%. As shown, the higher the harmonic number is, the lower the amplitude for a
specific order line is.
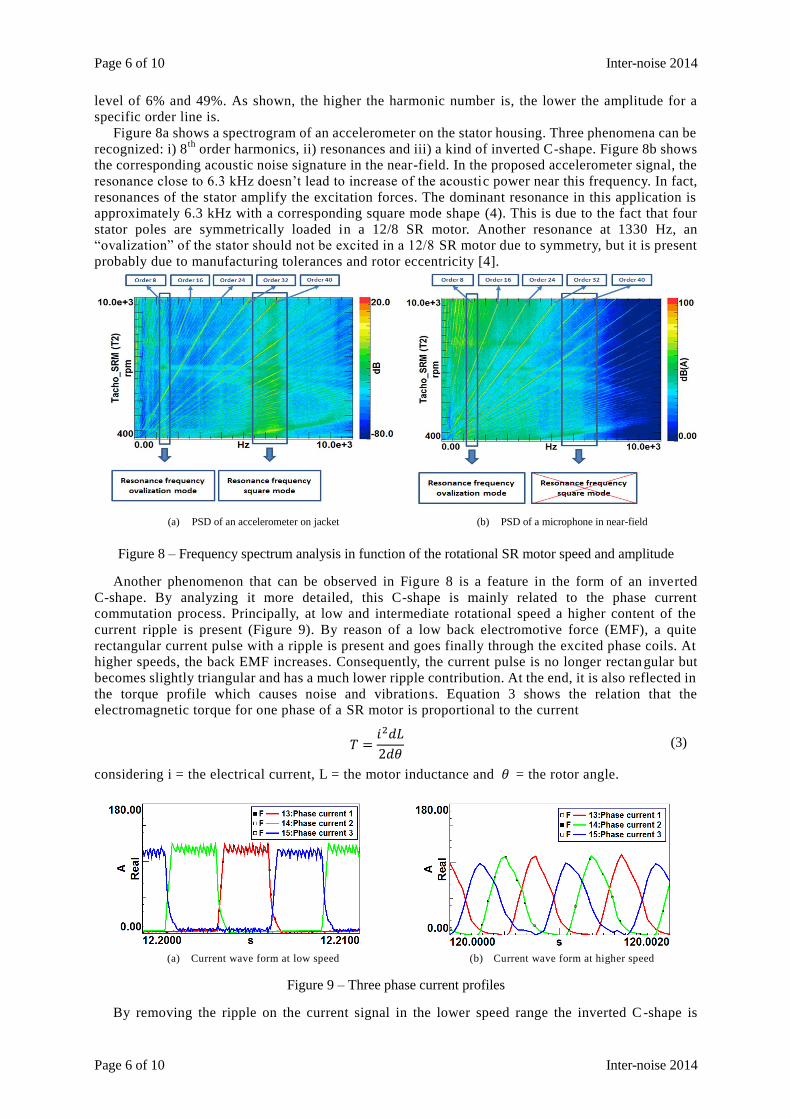
Figure 8a shows a spectrogram of an accelerometer on the stator housing. Three phenomena can be
recognized: i) 8th
order harmonics, ii) resonances and iii) a kind of inverted C-shape. Figure 8b shows
the corresponding acoustic noise signature in the near-field. In the proposed accelerometer signal, the
resonance close to 6.3 kHz doesn’t lead to increase of the acoustic power near this frequency. In fact,
resonances of the stator amplify the excitation forces. The dominant resonance in this application is
approximately 6.3 kHz with a corresponding square mode shape (4). This is due to the fact that four
stator poles are symmetrically loaded in a 12/8 SR motor. Another resonance at 1330 Hz, an
“ovalization” of the stator should not be excited in a 12/8 SR motor due to symmetry, but it is present
probably due to manufacturing tolerances and rotor eccentricity [4].
(a) PSD of an accelerometer on jacket (b) PSD of a microphone in near-field
Figure 8 – Frequency spectrum analysis in function of the rotational SR motor speed and amplitude
Another phenomenon that can be observed in Figure 8 is a feature in the form of an inverted
C-shape. By analyzing it more detailed, this C-shape is mainly related to the phase current
commutation process. Principally, at low and intermediate rotational speed a higher content of the
current ripple is present (Figure 9). By reason of a low back electromotive force (EMF), a quite
rectangular current pulse with a ripple is present and goes finally through the excited phase coils. At
higher speeds, the back EMF increases. Consequently, the current pulse is no longer rectan gular but
becomes slightly triangular and has a much lower ripple contribution. At the end, it is also reflected in
the torque profile which causes noise and vibrations. Equation 3 shows the relation that the
electromagnetic torque for one phase of a SR motor is proportional to the current
𝑇 =𝑖2𝑑𝐿
2𝑑𝜃 (3)
considering i = the electrical current, L = the motor inductance and 𝜃 = the rotor angle.
(a) Current wave form at low speed
(b) Current wave form at higher speed
Figure 9 – Three phase current profiles
By removing the ripple on the current signal in the lower speed range the inverted C -shape is

Inter-noise 2014 Page 7 of 10
Inter-noise 2014 Page 7 of 10
disappeared. Figure 10 shows a part of the time traces for the original current wave form (red) and the
modified current wave form without the ripple (blue) at a negative torque condition of - 49%.
Figure 10 - Original current wave with ripple (red) and modified current wave without ripple (blue)
The corresponding waterfall plots are visualized in Figure 11. It can be noted that the inverted
C-shape, has disappeared when the ripple is removed. Consequently, editing the current ripple gives a
different content in terms of noise and vibrations.
Figure 11 – Evaluation of the source of the inverted C-shape
The sound pressure level reaches its maximum when order 24 excites the ‘ovalization’ mode at
1330Hz. Hence, the claim that the ‘ovalization’ mode is not excited in a 12/8 SR motor and therefore
doesn’t contribute to the acoustic noise, is not fully consistent with the practice: excitation of the
‘ovalization’ mode is still a major source of acoustic noise (Figure 12).
Figure 12 - Order sections of a phase current (top), an accelerometer (middle) and a microphone (bottom)

Page 8 of 10 Inter-noise 2014
Page 8 of 10 Inter-noise 2014
To verify the ‘ovalization’ mode shape, a modal analysis is carried out on the 12/8 SR motor.
Results can be found in Figure 13a. All measurement conditions should be taken into account. Firstly,
the modal analysis is performed on a complete SR motor including, stator, rotor, end shields, cooling
water, etc. Secondly, the SR motor was clamped at one side. Consequently, this means that the
measured mode frequencies (Figure 13) are a little bit different from the calculated FEM structural
mode shapes (Figure 2b) because only the stator housing in free-free conditions is there considered.
(a) Ovalization modes
(b) Triangular modes
Figure 13 – Mode shapes obtained by modal analysis
Two ‘ovalization’ modes are presented (Figure 13a) at 1324Hz and 1425Hz. The ‘ovalization’ mode
with out-of-phase of front/back is not presented due to the end shields. Measured resonance
frequencies are higher and are more apart than simulated ones due to the end shields and clamping. The
triangular modes (Figure 13b) at 2835Hz and 3135Hz are less visible because of the different boundary
conditions between the measured and simulated modes. It was not possible to measure the square mode
as the sampling frequency was too low during the modal analysis.
Finally, one resonance at 1330Hz in the frequency content of spectrograms in Figure 8 is confirmed
by a modal analysis on the stator housing which visualizes the ‘ovalization’ mode at this frequency.
4.2 Deflection shapes and time domain animation
During the development process of a new electric motor, several numerical techniques, such as
BEM and FEM, can be applied to characterize the dynamic properties. As shown in the discussion of
the experiments, the mode shapes play an important role in the vibro-acoustic behavior of the motor.
However, not all modes have equal importance. Furthermore, very often in operational conditions, the
deformation of the structure doesn’t correspond to a pure mode shape. Operational Deflection Shapes
(ODS) can be used to evaluate the contribution of a mode during normal operating conditions. In this
paragraph, the mode shapes are analyzed in terms of the dominant orders. For lowly damped structures,
it can be proven that the form of the ODS highly corresponds to the real (modal) mode. For highly
damped structures, the response of a certain frequency will also be contributed by other resonance
frequencies. In other words, the resulting ODS will contain in this case different modes. The virtual
reproduction of the mode shapes, carried out by an ODS analysis, is depicted in Figure 14 and Figure
15.
Figure 14 - Ovalization (above) at 3370 RPM and square (below) deflection shapes at 5120 RPM

Inter-noise 2014 Page 9 of 10
Inter-noise 2014 Page 9 of 10
The ‘ovalization’ deflection shape of the housing is visible in all orders at a particular frequency,
RPM or time, but best in the 24th
order. The ‘ovalization’ happens at both side panels. Both flanks
move in phase with each other. The main difference with the modal analysis is that the effects of the
mechanical structure behavior and excitation forces are now included during operational conditions.
The square deflection shape is also visible in all orders, but the best in 56th order. Deflections happen
at both side panels but they are less pronounced at the clamped flank, especially at higher speeds
(Figure 15).
Figure 15 - Square deflection shapes at 5960rpm
4.3 Sound Quality evaluation
Characteristic for electric and hybrid vehicles is that their NVH performance is judged
predominantly in noise perception terms rather than in noise levels. This is to a large extent due to the
specific noise behavior of the electric drive systems, causing a higher annoyance than expected from
the sound pressure level (5). The magnetic forces of the SR motor generate a typical tonal and high
frequency noise, which is referred as whining noise. This source is the most dominant noise generated
by the SR motor. Also other components of the SR motor are producing noise, as the unbalance of the
rotor and the power electronics. The tonal and high frequency noise are annoying. This subjective
appreciation can be more objectified by Sound Quality metrics. The ones used in this paper are:
sharpness, tonality, loudness and prominence ratio. These values should be reduced for more pleasant
sound in the vehicle. In Figure 16, three torque levels 0% (green), 6% (red), 49% (blue) are considered
for a run between 0 and 9900 RPM.
A first valuable metric is tonality. The object of this metric is to evaluate the presence of tonal
components in the spectrum of a noisy electric motor like a SR motor. Narrowband noises can also
sound like tonal. The smaller the bandwidth is, the more tonal the noise propagates. Figure 16a shows
a reproduction of the tonality. It can be noticed that the higher the torque level of the SR motor is, the
higher the tonality of the sound is. Another feature which is relevant to the agreeableness of the sound
of rotational devices is its sharpness. In this way, it is possible to classify sound as shrill (sharp) or
‘flat’. The sharpness can be expressed in the unit acum. When switching the SR motor on, a doubling
of the sharpness is obtained, as shown in Figure 16b. The amount of noise coming from one
microphone in different load conditions can also be expressed in sones instead of the more familiar
decibel (Figure 16c). An advantage is that the sone scale is linear, meaning that doubling the amplitude
corresponds to a doubling of the perceived loudness. As a result, it is easier to interpret the sound
levels for the different torque levels.
(a) Tonality
(b) Sharpness
(c) Loudness Stevens
Figure 16 – Sound metrics: tonality, sharpness, loudness Stevens VII

Page 10 of 10 Inter-noise 2014
Page 10 of 10 Inter-noise 2014
Figure 17 shows one example of the ‘ovalization’ mode confirmation in the acoustic noise based on
a prominence ratio sound metric in different load conditions. In the prominence ratio method, a
discrete tone nominee is said prominent if the average SPL of the ‘crit ical band’ centered on the tone is
at least 9dB higher than the average SPL of the contiguous critical bands.
a) Sound metric: prominence ratio
b) Frequency content of one microphone near to the SR
motor
Figure 17 – Sound metrics versus frequency spectra
Based on all these objectives techniques, it can be noticed that the torque level has a big effect on
the tonality, the loudness and a smaller effect on the sharpness of the sound. In addition, prominence
ratio can serve as a detection tool of the various stator mode shapes which are translated in the sound
radiation. In this way, noise problems can be detected faster at a particular time, rotational speed and
a known frequency which eventually enhances the optimization process of one typical problem.
5. CONCLUSIONS
Advanced NVH analytical tools, to analyze the spectral content of noise, current and vibrations in
a 12/8 SR motor, have been introduced and applied to test rig measurements. In this way natural modes,
harmonic components related to the motor construction and relations between measured signals are
identified for a 12/8 SR motor. All these tools should help engineers in the future to gain insight in the
vibro-acoustic behavior of electrical powertrains to optimize the NVH characteristics for automotive
applications.
ACKNOWLEDGEMENTS
The presented research was achieved in the context of the research project Asterics –Ageing ad
efficiency Simulation & Testing under Real world conditions for Innovative electric vehicle
Components and Systems.
REFERENCES
1. Krishnan R., Switched Reluctance Motor Drives: Modeling, Simulation. CRC Press, 2001.
2. Dos Santos F.L.M., Anthonis J., Naclerio F., Gyselinck J., Van der Auweraer H., Sandoval Goes L.,
Multiphysics NVH Modeling: Integrated Simulation of a Switched Reluctance Motor Drivetrain for an
Electric Vehicle, IEEE Transactions on Industrial Electronics, 61(1), 469 – 476, 2014, DOI
10.1109/TIE.2013.2247012.
3. Sarrazin M., Janssens K., Van der Auweraer H., Virtual Car Sound synthesis technique for brand sound
design of hybrid and electric vehicles, SAE international 2012, 2012-36-0614 (2012)
4. Fiedler J.O. et. Al., Calculation of the Acoustic Noise Spectrum of SRM Using Modal Superposition,
IEEE Transactions on Industrial Electronics, 57(2010), 2939-2945.
5. Van der Auweraer H., Meek B., Sarrazin M., Janssens K., NVH challenges with hybrid and electric
vehicles, SAE International 2013-26-0511, Proc. SIAT, Pune, India, 9-12 Jan. 2013