Embed Size (px)
Citation preview
VICE PRESIDENT WHO?
Media Coverage and Public Opinion in the 2016 Election
Stacy G. Ulbig
Department of Political Science
Sam Houston State University SHSU Box 2149
Huntsville, TX 77341-2149
936.294.1468 [email protected]
ABSTRACT
How did media coverage of Tim Kaine and Mike Pence during the 2016 election affect the public’s
evaluation of the bottom of them? Previous research suggests that when vice presidential candidates
receive more, and particularly more negative, coverage, voters’ evaluations of the candidates come to
influence their voting decisions more. Further, candidates possessing unique characteristics tend to
receive the most critical media coverage, and consequently have the largest impact on voters. The
galvanizing nature of the 2016 presidential candidates combined with the prototypical characteristics of
their running mates, however, suggests that voters were likely to have few distinct impressions of Pence
and Kaine. The analyses presented in this paper examine the connection between the amount and nature
of media coverage Pence and Kaine received over the course of the 2016 general election campaign and
the public’s assessment of them. Findings confirm the expectation that the media attention given to the
vice presidential candidates did little to influence the public’s perceptions of them in the shadow of their
more influential running mates.
Paper presented at the annual Meeting of the Midwest Political Science Association. Chicago, IL: April
6-9, 2017.
1
It stands as a truism in American presidential elections that vice presidential candidates matter little
to most voters. Journalists typically see vice presidents (VPs) as nothing more than “frosting on the cake”
and not “game changers.” Academics tend to ignore them as well, with variables related to the vice president
rarely making an appearance in presidential election models. Yet previous research suggests that when vice
presidential candidates receive more, and particularly the more negative, coverage, voters’ evaluations of
the candidates come to influence their voting decisions more. And candidates possessing unique
characteristics tend to have the largest impact on voters because they attract more, and more critical, media
coverage. So despite the conventional wisdom, vice presidential candidates can make impressions on
voters, sometimes enough to affect their decisions in the voting booth.
Approaching the 2016 election with these things in mind, I examined the connection between the
amount and nature of media coverage vice presidential candidates Pence and Kaine received over the
course of the campaign and the public’s assessment of them. Given previous research findings, I did not
anticipate strong media effects emerging in this election. Rather I expected the riveting personalities of
the 2016 presidential candidates to show a stronger relationship with public opinion of their running
mates, especially if there was a relative paucity of compelling vice presidential coverage. Findings
confirm the expectation that the media attention given to the vice presidential candidates did little to
influence the public’s perceptions of them in the wake of their astronomically high profile running mates.
The Value of Vice Presidential Candidates
Researchers tend to assert that electoral imperatives compel the selection of vice presidential
candidates (Hiller & Kriner, 2008; see also Goldstein, 1982; Natoli, 1985; Polsby & Wildavsky, 1991;
Sigelman & Wahlbeck, 1997). In fact, those filling out the bottom of the ticket have been viewed as largely
expendable once the election ends. Some even felt that “[i]f elected, the vice president could look forward
to being replaced four years later” when a different vice presidential candidate might prove more electorally
advantageous (Nelson, 1988, p. 859). Creating a balanced ticket to attract voters has been seen as the key
factor in vice presidential candidate selection (e.g., Goldstein, 1982; Natoli, 1985; Nelson, 1988; Polsby &
Wildavsky, 1991; Pomper, 1963). Balancing a presidential candidate’s age, experience, ideology, gender,
2
race, religion, or state or regional affiliation, for instance, typically motivates these selections
(Baumgartner, 2008; Bryce, 1893; Goldstein, 1982; Hiller & Kriner, 2008; Hurwitz, 1980; Mayer, 2000;
Sigelman & Wahlbeck, 1997; Watson & Yon, 2006).
Though many put appreciable effort into explaining and forecasting the selection of vice
presidential candidates, research on the importance of vice presidential nominees to voters has been
relatively sparse and offers, at best, mixed findings. Some studies see little electoral impact emanating from
the bottom of the ticket, pointing to no more than a small vice presidential home state advantage (Campbell,
1992; Dudley & Rapoport, 1989; Holbrook, 1991; Rosenstone, 1983) or vote choice effect (Frankovic,
1984; Romero, 2004). Others counter that feelings about VP candidates do exert influence on some voters’
decisions (Adkison, 1982; Wattenberg, 1984, 1995), pointing to a small (2% to 2.5%) “home state bump”
in votes attributable to the bottom of the ticket (Campbell, Ali, & Jalazai, 2006; Garand, 1988; Holbrook,
1991; Lewis-Beck & Rice, 1983; Rosen-stone, 1983).
Still, researchers and pundits alike tend to paint vice presidential candidates as largely irrelevant to
voters by the time they enter the voting booth, and there are good reasons to believe that vice presidential
candidates should not play much of a role in shaping voter opinion and decision making. Since the media
typically pay far less attention to vice presidential candidates than to their presidential running mates (Ulbig
2010), voters probably have no more than scant information about the bottom of the ticket. Even the
spotlight of a vice presidential debate appears to not “do much at all to alter the political landscape”
(Holbrook, 1996, p. 109), with any impression the candidates make on voters evaporating long before
Election Day. In fact, some have suggested “a 72-hour rule of thumb for running mates: if they are still on
the front page three days after their nomination, it means there’s a problem” (Turque, Isikoff, Hosenball,
Bai, & Barry, 2000, p. 29). Voters report much the same when asked about the bottom of the ticket in
opinion surveys, with only about 8% to 15% of the electorate typically saying that the vice presidential
candidate was an important consideration for them when they cast their ballot (Frankovic, 1984;
Wattenberg, 1995).
Still, some vice presidential candidates have been shown to exert an electoral impact on certain
3
segments of the electorate (Ulbig 2013). Heightened media attention to the bottom of the ticket has
historically created a context within which those voters most susceptible to media and campaign messages
have formed distinct impressions of the vice presidential candidates and allowed those feelings influence
their self-reported vote choice. For example, voter sentiment about Geraldine Ferraro, Joe Lieberman, and
Sarah Palin exhibited sizable impacts on the predicted vote choices of independent voters. The voluminous,
intense media coverage, particularly the negative media attention to their competency, political experience,
and/or intelligence, appears to have been most strongly related to their electoral impacts.
Thus, there are good reasons to believe that when the media spends more time covering vice
presidential candidates, voters can better form potentially influential opinions about them. Media attention
to the bottom of the ticket certainly fluctuates over the course of a campaign, but there are at least two
moments in the campaign when the media concentrate on VP candidates—at convention time when the
nominees are announced and when they participate in televised debates (Romero, 2004). Furthermore, the
media have increasingly covered the presidential ticket as a team. Consequently, “[i]t is reasonable to
hypothesize that, because voters are exposed to a two-person team, the popularity of each player should
have an impact on their vote decisions” (Wattenberg, 1995, p. 505).
Theoretically, then, it seems that feelings about vice presidential candidates are likely to be more
clearly formed, and thus electorally important, at some times than others. Elections in which the media
offers little coverage of a vice presidential candidate afford voters little opportunity to form opinions about
him/her that stand apart from their impressions of the top of the ticket. Conversely, in those times when the
media readily present VP candidates to the public, voters are better able to develop feelings about them
independent of their feelings about the presidential candidates. Importantly, though, the media finds some
candidates more attractive than others. Vice presidential candidates who are somehow “newsworthy,” that
is, they offer a story that is unique and compelling, such as being an improbable candidate, being new to
the national political scene, possessing a unique characteristic or shortcoming, being involved in scandal,
and so on, typically prove especially attractive.
4
Casting an eye toward the 2016 presidential election, these findings suggest that the public should
have been better able to express opinions about vice presidential candidates Pence and Kaine at times
when the media provided more information about the bottom of the tickets. Further, existing research
would predict that the tint of the media coverage should have colored voter opinion of them as well. Thus,
if 2016 had offered a typical election, we might expect increased media coverage of the vice presidential
nominees to be associated with lower levels of unformed opinion about the candidates, and that the nature
of the coverage should affect the impressions formed. More positive coverage that is positive should
correlate with opinion that is more favorable while less favorable impressions should accompany negative
coverage.
The “Dumpster Fire” Election of 2016
The 2016 presidential contest, however, was anything but typical. The contest between Donald
Trump and Hillary Clinton offered voters “one of the most shocking U.S. elections in modern political
history” (Berenson 2016) and was compared to a dumpster fire by Former CBS News anchor Dan
Rather.1 Despite voter distaste for the presidential candidates, both grabbed media headlines and the
public’s attention at levels rarely seen in recent elections. By the start of the 2016 primary election
season, the public knew both of the eventual presidential nominees well. Clinton’s history as first lady,
U.S. Senator, 2008 presidential primary candidate, and Secretary of State had kept her name in headlines
for nearly a quarter of a century. Similarly, Trump’s years as a real estate mogul, businessman, and
television personality placed him in the public eye for at least as long. Despite, or perhaps because of,
their visibility, both nominees went into the general election campaign with ardent admirers as well as
fervent detractors. Both candidates also offered voters something unusual in a presidential candidate.
Never, before Clinton, had a former first lady been elected to office, nor had one been appointed to a
position as high within the executive branch. And though others having no history of service in elected
1 Rather made the comment on November 7, 2016, in an appearance on CNN’s New Day.
5
public office, the military, or government had made bids for the nation’s highest office, no such person
before Trump had received a major party’s nomination.
At the same time, their running mates offered little in the way of publicized pasts or
distinctiveness. Both had followed fairly common trajectories to arrive at the vice presidential
nomination. Clinton tapped Tim Kaine, the junior Senator from Virginia, as her running mate. Kaine had
previously held a number of elected offices, having served as mayor, lieutenant governor, and governor.
Trump’s running mate, Mike Pence, had served as U.S. Congressman and Governor of Indiana. Both had
also been active in their respective parties, with Pence serving as chairman of the House Republican
Conference and Kaine taking on the role of chairman of the Democratic National Committee.
Demographically, both represent typical vice presidential nominees. Both are middle aged, law-degreed,
white males whose religious faiths do not depart from those of most previous candidates.
Taken in the context of previous research, the galvanizing nature of the 2016 presidential
candidates combined with the prototypical characteristics of their running mates, suggests that the media
likely concentrated its energy on the tickets’ headliners and gave the supporting players little attention.
Voters were likely to have few distinct impressions of Pence and Kaine going into the general election.
Therefore, I expect media coverage of VPs to show little relationship with the public’s sentiment about
Pence and Kaine themselves. Rather, I expect public opinion about the bottom of the tickets to be more
closely associated with feelings about Trump and Clinton.
Data and Measures
I tested these hypotheses using a dataset built from publicly available survey data, newspaper
database archives, and an original content analysis of a sample of news content. I collected candidate
approval data from the Huffington Post Pollster webpage.2 Pollster provides a summary of representative
public opinion survey results collected by numerous polling houses employing varying data collection
2 For access to this data or more information about the surveys reported on the site, see:
http://elections.huffingtonpost.com/pollster.
6
methodologies. Their focus on trial heat polls for relevant candidates provides a readily available source
of credible polling data at frequent intervals over the general election season. I used the Newsbank/Readex
library database to gather information on media coverage of the candidates.3 This database offers access
to a comprehensive collection of news reported in a variety of formats, including print and online-only
newspapers, blogs, newswires, journals, broadcast transcripts and videos. Finally, I conducted a content
analysis of a random sample of AP Newswire Service reports about the 2016 vice presidential candidates
over the course of the general campaign. The Associated Press is an independent, not-for-profit news
cooperative owned by its contributing newspapers and radio and television stations in the United States,
all of which contribute stories to the AP and use material written by its staff journalists providing content
to more than 15,000 news outlets, including print and broadcast media producers. As such it offers a
reasonably representative sample of the information voters were likely to receive from a range of media
sources.
I take public opinion about each vice presidential candidate as my dependent variable. I measure
public approval of these candidates using poll results from candidate favorability questions, which track
the degree to which the public holds an opinion about each candidate and whether any existing impression
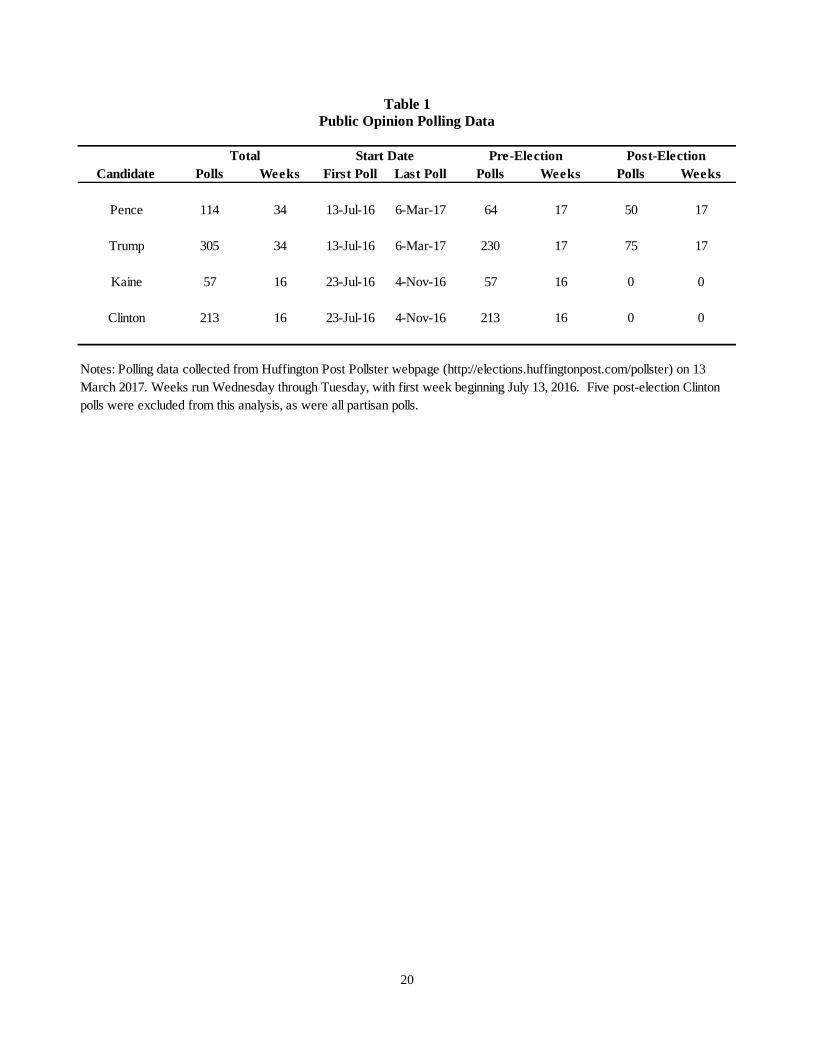
of the candidate is favorable or not. As reported in Table 1, I collected favorability ratings for each of the
2016 presidential and vice presidential candidates between the nomination period (beginning at the time
of the respective party’s national convention) and Election Day.4 In total, I collected information from 57
polls over a period of 16 weeks for Kaine and ratings from 64 polls over 17 weeks for Pence. In addition,
I collected seventeen additional weeks of post-election data on Pence.5 With a mean margin of error of
3 For information about Readex, a division of Newsbank, see: http://www.readex.com/who-we-are-what-we-do.
4 Start and end dates of pre-election data collection were determined by the first available vice presidential candidate
poll and Election Day (between July 23 and November 4, 2016, for Clinton and Kaine, and July 13 and November 4,
2016, for Trump and Pence). The Clinton/Kaine pre-election period is one week shorter than that of Trump/Pence
because the Republican Party’s National Convention was held one week before the Democratic Party’s.
5 I collected information from 50 post-election polls covering the period from November 9, 2016, to March 6, 2017.
7
2.89 (std. dev: 0.85), all polling data is from non-partisan polling houses and more than half (53.3%) of
the polls were conducted using live phone interviews.6 Adults residing in the United States constituted
the sample subpopulations for about 61% of the polls, while registered voters (30%) and likely voters
(9%) were sampled in the others.
[Table 1 about here]
I take the percentage of respondents reporting neither a favorable nor an unfavorable impression
of each candidate as a measure of unformed opinion about each candidate, vice presidential and
presidential alike. I also calculated a net favorability rating for each candidate by subtracting the reported
information about the percentage of respondents to each poll who reported viewing the candidate
unfavorably from the percentage of those reporting him or her favorably (i.e., % favorable - %
unfavorable). Thus, higher values on this measure indicate a more favorable rating. Taking the mean of
these measures of unformed opinion and net favorability ratings, I aggregated the data to the candidate-
week level based on poll start date to create weekly candidate opinion ratings for each vice presidential
and presidential candidate.7
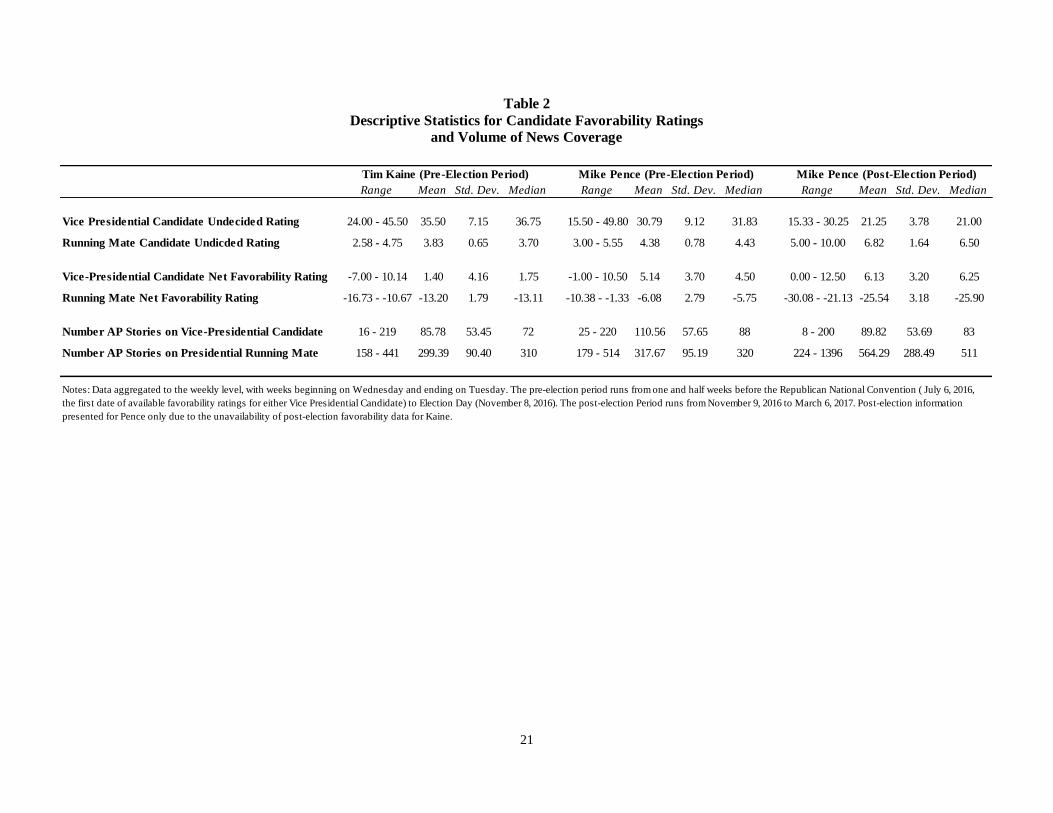
I report descriptive statistics for all public opinion measures in Table 2. Unsurprisingly, unformed
opinion about the vice presidential candidates was much higher than that about the presidential
candidates. While about a third of respondents reported not having an impression of Tim Kaine (35.5%)
and Mike Pence (30.8%), less than five percent said the same about Hillary Clinton (3.8%) and Donald
Trump (4.4%). Even in the post-election period, the public reported having more strongly formed
opinions about Trump than Pence. Given the remarkable distaste with which the public held both
presidential candidates, it is also not startling to see the disparity in net favorability ratings between the
top and bottom of the tickets either. Both presidential candidates netted, on average, negative favorability
6 Data from internet surveys comprised another 45.2% of the polling data, while the remainder were either automated (0.9%) or interactive voice recognition/online (0.6%) polls. 7 All weeks begin on Wednesday and run through the following Tuesday (i.e., 1st week = Wednesday, July 13 –
Tuesday, July 19). I aggregated all polls starting in a week to that week, even if they were not completed in that
week.
8
ratings over the general election campaign season, with the public’s expressed dislike of Clinton (-13.2)
being about twice as large as that of Trump (-6.08). In contrast, both Kaine and Pence appear to have
made marginally positive impressions on the public (average net favorability ratings of 1.40 and 5.14,
respectively).
[Table 2 about here]
I took three different news volume measures as my key independent variables when modeling the
effects of volume of coverage and presidential coattails. I first used the total number of AP Newswire
Service stories reported by Readex/Newsbank during each week. As shown on the last two rows of Table
2, the print media focused its attention overwhelmingly on each ticket’s headliners during the general
election campaign. Clinton and Trump garnered about three times as many stories as their running mates.8
This pattern becomes even more pronounced for Vice President Pence in the post-election period, during
which he merits attention in less than one-sixth as many stories as the newly elected president.
I supplemented this information with two measures of media volume based on the content of a
subset of the total AP news stories reported.9 I randomly selected 10% of each month’s news coverage for
each candidate (i.e., 10% of the stories about Kaine in July, 10% about him in August, etc., and the same
for Pence) for coding. In total, 154 stories about Kaine and 240 about Pence were coded.10 The mean
number of words contained in each week’s stories and the mean intensity level of the coverage of the
candidate in this subset of stories serve as two additional measures of the volume of news coverage.
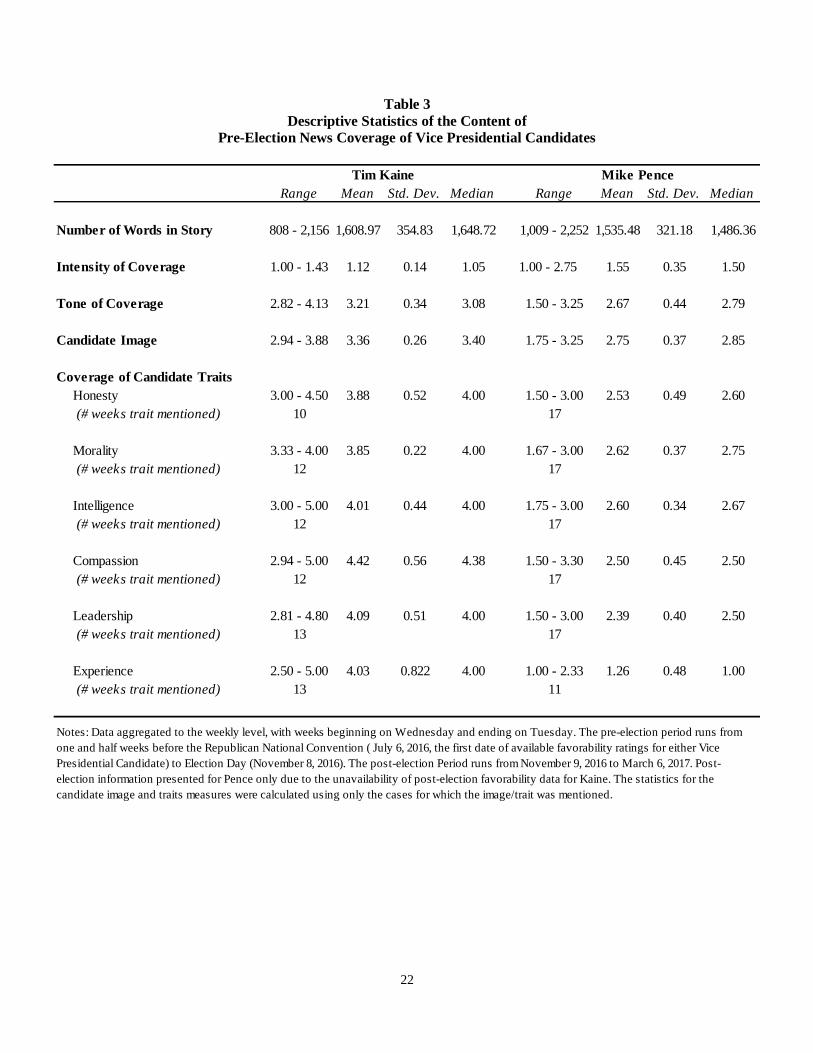
Based on the results of the content analysis (reported in Table 3), the print media appears to have
treated the vice presidential candidates comparably. The length of stories about the candidates, as
8 The level of vice presidential news coverage is about typical of most VPs since the 1970s (Ulbig 2013).
9 I identified stories about each candidate by searching the database for the candidate’s name during the designated
time periods. Searches were made on all versions of the candidates’ names (e.g., “Mike Pence,” “Michael Richard Pence”; “Michael R. Pence”; “Pence”). Clinton searches were also conducted for versions of former president Bill
Clinton’s name and any stories referencing only him, and not candidate Hillary Clinton, were excluded.
10 See Appendices for details on story selection and content coding.
9
indicated by number of words, is roughly equivalent, as is the intensity of coverage. While stories about
Kaine were a bit longer than those about Pence (mean number of words: Kaine=1,609; Pence=1,536), the
media more intensely focused on Pence, though only slightly so. With a mean intensity rating of 1.12 (on
the three-point scale), Kaine appears to have drawn very little coverage in the stories mentioning him,
while Pence merits slightly more with a 1.41 coverage intensity level, on average.
[Table 3 about here]
Turning more specifically to the media image of each vice presidential candidate, which serves as
the key independent variable in the test of the second hypothesis, the remaining content measures begin to
suggest some dissimilitude. Though coders rated newswire stories of Pence more negatively in terms of
overall tone of stories, overall candidate image, and in discussions of particular traits, independent
samples comparison of means tests reveal that only the differences in candidate ratings on honesty and
experience are statistically significant. In particular, the media’s treatment of Pence’s political experience
and honesty lags well behind that of his counterpart’s. Perhaps the relative experience of their running
mates can explain the pronounced differences here. While Clinton’s experience in office might have led
the media to be less questioning of Kaine’s readiness for office, Trump’s dearth of explicit political
experience, and the consequent importance of his running mate’s capabilities, might have led the media to
give Pence’s record more critical treatment. Despite these differences the newswire stories analyzed
offered generally neutral to favorable coverage of both VP candidates.
Analyses and Findings
To explore the relationship between media coverage and public opinion, I first regressed the
degree to which the public expresses an opinion about vice presidential candidates on the volume of
media content to test the hypothesis that a higher volume of media coverage would be associated with less
unformed opinion. I next tested the hypothesis that more favorable opinion would accompany more
positive media coverage by regressing vice presidential favorability on measures of media content.
Finally, I tested the hypothesis that media attention to and public opinion about the top of the tickets
10
would relate to impressions of the vice presidential candidates by regressing vice presidential favorability
on presidential media coverage and favorability.
Hypothesis 1: Volume of Media Coverage
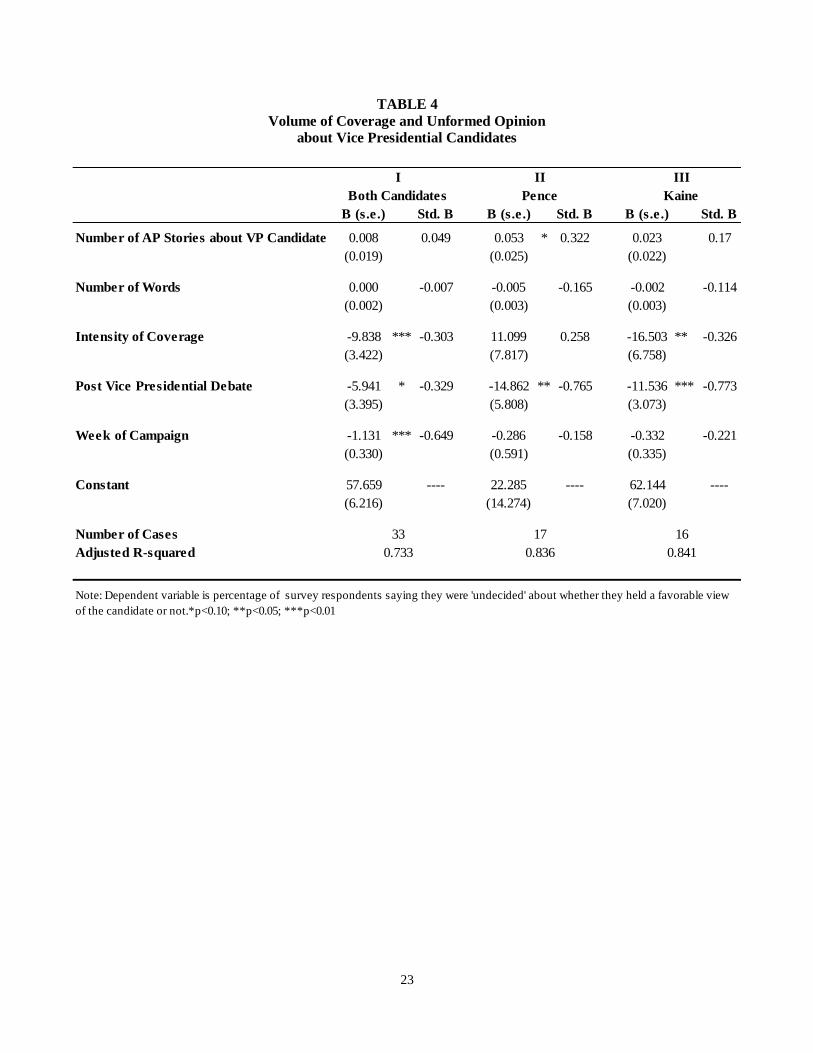
Table 4 displays the results of an OLS regression taking the percentage of survey respondents
saying they were “undecided” about whether they held a favorable view of the candidate or not as my
dependent variable and the number and length of news stories, and intensity of coverage of the candidate
as my independent variables. I also control for the week of the campaign and the post-vice presidential
debate period with the expectation that as the campaign progressed, and especially after the vice
presidents squared off in a televised debate, the public was likely to have more information about them
regardless of the volume of media coverage. Model I examines both candidates and suggests that, as
might be expected, at times of intense vice presidential media coverage, fewer members of the public are
without expressible opinions about the candidates. Neither the sheer number nor length of stories,
however, shows a relationship with the formation of public opinion when looking at the pooled data in
Model I.
[Table 4 about here]
Turning to each candidate individually, there seem to be different media effects at play. The
intensity of the coverage Kaine received shows a relationship with marginally lower levels of public
uncertainty about him. The coefficient for this variable suggests that very intense coverage of Kaine is
associated with about 2.3% more members of the public being able to say if they feel favorably toward
him (or not) than when coverage is at the typical level.11 The same cannot be said with regard to Pence,
for whom intensity of coverage is unrelated to opinion formation. Alternatively, the public’s ability to
form an impression of him might be related to the overall number of stories about him that are available,
though this effect operates opposite of expectations, the coefficient is only marginally significant, and the
11 Substantive impact calculated using the regression coefficient presented in Model III on Table 4. Intensity of
coverage was increased by one standard deviation over the mean to estimate this effect.
11
predicted substantive impact small. The model indicates that for fifty additional news stories about Pence,
approximately 2.7% more members of the public are able to express an opinion about him.12
While both control variables perform in the expect manner, only the post-debate period seems to
exert a significant impact on voter opinion formation. The results of the pooled model (model I) suggest
that as the campaign progressed, more people formed opinions of the candidates, and while the
coefficients remain negative in separate candidate models, they are not statistically significant. The post-
debate period, however, does exhibit a consistently negative, statistically significant relationship with
public opinion. The public was substantially more able to express an opinion about the candidates
following the debate and the estimated effect is slightly stronger for Pence than Kaine. Using the
coefficients presented in models II and III, I estimate that about 15% more people were able to express an
opinion about Pence and about 12% about Kaine following the debate.13 Importantly, this effect holds
even in the presence of measures of media attention, suggesting that campaign events unrelated to
campaign coverage of the vice presidential candidates largely accounts for the increased opinion
formation.
Hypothesis 2: Content of Coverage
Turning next to the content of the media’s vice presidential coverage, Table 5 presents the results
of a multiple regression taking candidate net favorability as my dependent variable and the number and
nature of coverage of the candidate as my independent variables. Higher values of all independent
variables indicate more positive coverage of the candidate(s), thus the traditional hypothesis would
predict positive relationships for all measures. The remarkably few significant relationships represents
perhaps the most striking feature of these results. In the first model examining both candidates, only
media treatment of the candidates’ honesty appears to be even marginally related to the favorability with
12 Both of the effects discussed here equal about one-half of a standard deviation on the respective VP candidate’s
net favorability rating.
13 The standardized coefficients also document the stronger post-debate effects.
12
which the public held Pence and Kaine, and the substantive impact for this coefficient is small. The model
coefficients suggest that a very positive treatment of candidate honesty is predicted to be associated with
only about a 2.7% increase in candidate favorability.14
[Table 5 about here]
The results are much the same with respect to Kaine (model III), with only one aspect of his
media coverage showing a marginal relationship with his favorability rating, and this coefficient runs
counter to expectation. The results suggest a possibility that as Kaine’s media image improved, his
favorability rating dropped. Similar results emerge from with regard to Pence, but model II reveals
negative relationships between more positive treatment of his morality and experience.15 That is, more
positive media presentations of his morality and experience are associated with lower favorability ratings.
The predicted effects, however, are substantively small.16 While marginally significant, very positive
media coverage of Pence’s intelligence performed in the expected manner, with very positive coverage
leading about a 3.1% increase in his net favorability with the public over his favorability at times when
such coverage was unflattering.
Taken together, these effects, like the small or insignificant findings regarding volume of vice
presidential media coverage discussed above, might be indicative of the influence the media’s coverage of
and public’s sentiments about the presidential candidates exert on vice presidential favorability. It is
perhaps telling that the coverage of traits showing negative relationships to Pence’s favorability are
morality and intelligence, two of the traits on which his running mate came under intense and negative
media scrutiny over the course of the campaign. And though Clinton’s honesty suffered the same media
14 Substantive impact calculated using the regression coefficient presented in Model I on Table 5. Coverage of
candidate honesty was increased by one standard deviation over the mean to estimate this effect.
15 However, the morality coefficient is only marginally significant at traditional levels.
16 The results suggest that very positive coverage of Pence’s morality and experience lead to only about a 5% or
2.3%, respectively, increase in his net favorability rating. Substantive impact calculated using the regression
coefficient presented in Model II on Table 5. Coverage of candidate morality and experience was increased by one
standard deviation over the mean to estimate this effect.
13
treatment, her overall media image, including her personal qualities, was also remarkably poor (Patterson
2016), and it is to this trait that Kaine’s favorability might be tied. Perhaps, then, the public was judging
the vice presidential candidates in light of the failings of their running mates – an electoral incarnation of
voters “visiting the iniquity of the fathers on the children.”
Hypothesis 3: Presidential Coattails
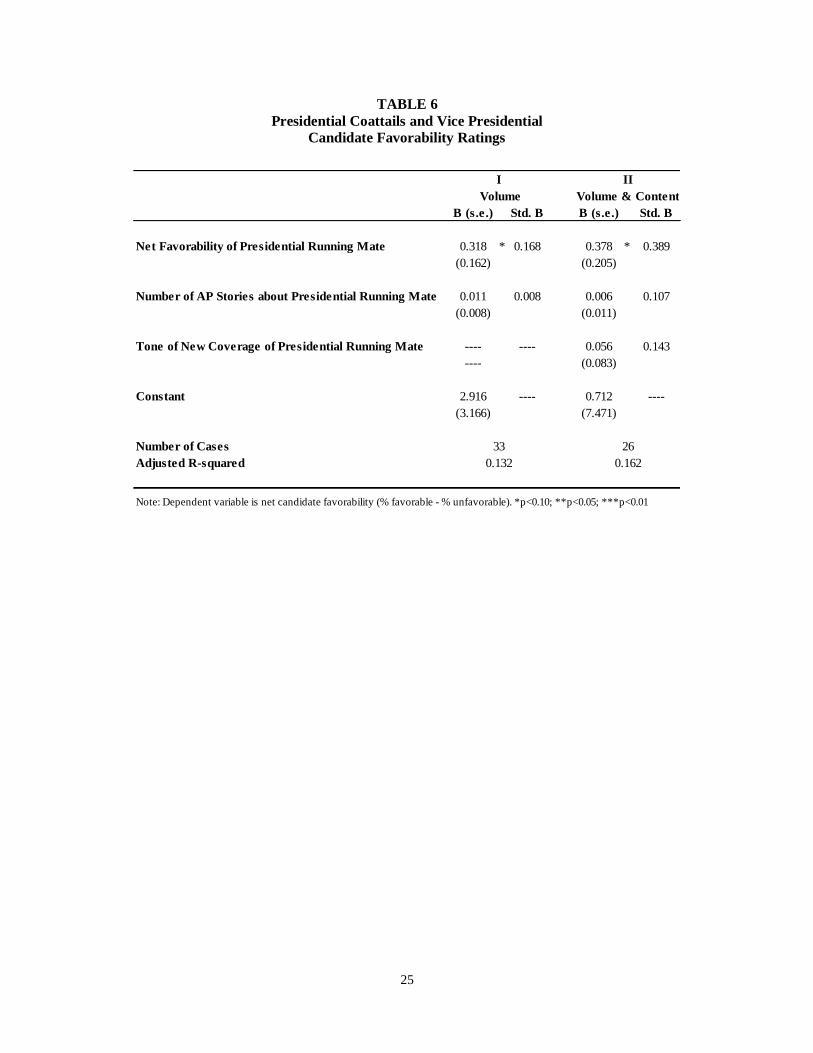
I test this possibility by taking presidential favorability and the volume of presidential news
coverage as independent variables and vice presidential favorability as my dependent variable in the
analysis presented in the first column of Table 6. I expected both, but especially presidential favorability,
to be positively associated with vice presidential favorability, and the results confirm this expectation.
Both the volume of news coverage and the public’s impressions of the presidential candidates are
positively related to vice presidential favorability, though only net presidential favorability is statistically
significant (at the two-tailed p<0.10 level).17 Substantively, these results indicate that a three percent
decrease in presidential favorability is associated with about a one percent decrease for the vice
presidential candidates.
[Table 6 about here]
Though I did not content code media coverage of presidential candidates, Patterson (2016)
provides some information about the media’s treatment of Trump and Clinton for a thirteen week period
between August 14 and November 7, 2016. I incorporated the available data into the second model
presented on Table 6, and the results reiterate the presidential favorability effect. The tone of presidential
media coverage also shows a positive association with vice presidential favorability, though the
coefficient is statistically insignificant.18
17 The results do not differ by vice presidential candidate.
18 These results may be affected in part, however, by the misalignment of the two data sources due to differences in
aggregation techniques.
14
Summary and Conclusions
On the whole, the findings here suggest that voters in the 2016 presidential election were left
asking themselves, “Vice President Who?” Media coverage of Mike Pence and Tim Kaine presented
voters with relatively little information about the candidates and what was presented tended to be fairly
neutral. While some might be tempted to fault either the media or the men seeking to be one heartbeat
away from the presidency, it is difficult to imagine more engaging and polarizing candidates heading each
ticket. Donald Trump and Hillary Clinton’s ability to attract both the public’s and media’s attention left
the vice presidential nominees standing in the shadows during much of the campaign. In addition, there
was little mesmerizing about either Pence or Kaine. Both represented fairly typical vice presidential
nominees, the type of which rarely exert much influence on voters.
Of course, the present study, like most research, is open to criticisms targeted at data quality,
measurement strategy, and statistical modelling, among others. To address some possible shortcomings, I
would like to work to better align my measures of public opinion with those of news coverage.
Aggregation to the week-level might be masking some potential relationships and exaggerating others. It
is also likely that there are some time lags at play which are not modelled in the analyses presented here.
It is possible that fluctuations in public opinion did not immediately respond to news coverage, but that
such effects might take days or weeks to develop. I would further like to explore the ways in which
information sources beyond newswire stories might relate to public opinion. To that end, I would like to
explore the ways in which public interest in the candidates might be related to favorability ratings.
Perhaps Google Trends data on news and web searches by the American public could shed some light on
how informed the public was beyond the information they received from media outlets relying on AP
Newswire stories.
The findings presented here also suggest a number of additional questions that might be fruitfully
investigated. For instance, questions about the ways in which media coverage of the sitting vice president
might shape the public’s impressions of him could prove an interesting contrast to findings from the
campaign season. While the literature suggests that vice presidents have traditionally become almost
15
invisible after the election, some research suggests an increased role for more recent holders of that office
(David 1967; Hiller and Kriner 2008; Light 1984; Pomper 1966; Williams 1956). Given the skepticism
expressed about President Trump’s temperament and abilities by both the media and the public, it is
possible that media coverage of Vice President Pence could play a more important role in shaping public
opinion than in the past. As a preliminary foray into this line of questioning, I replicated the analyses
presented here for the seventeen weeks of post-election data I collected for Trump and Pence. Though
statistically non-significant, the findings revealed the expected negative association between increased
news coverage of Pence the level of unformed opinion about him, while increased coverage of Trump
displayed a positive association with the public’s ability to form an opinion about Pence. Conversely,
more news stories about Pence are associated with gains in his net favorability ratings, while more Trump
news displays a negative association with Pence’s favorability with the public (though also statistically
non-significant). This, admittedly shallow, analysis suggests the continuance of a pattern of vice
presidential media coverage becoming overwhelmed by that of the president.
Beyond questions of public opinion, I would also like to revisit some of my earlier work on the
electoral impact of vice presidential candidates over time and set the 2016 election in context. The
evidence presented here suggests this election was primarily about the headliners and not their supporting
players. Though unlikely, it would be interesting to see if voting behavior exhibited a different pattern
than the public opinion examined here, especially among independent voters who would have likely been
most open to the influence of media messages about the vice presidential candidates. If not, just how
electorally inconsequential were these vice presidential candidates compared to others since the 1970s?
16
Appendix A
Story Content Coding
Intensity: The amount of coverage of the candidate in the story:
1 = very little
2 = medium amount 3 = a lot
Tone: the overall tone the story takes toward the candidate:
1 = mostly negative 2 = more negative than positive
3 = equally negative and positive or completely neutral (basic facts)
4 = more positive than negative 5 = mostly positive
Image: Imagine you are in charge of this person’s campaign. How satisfied are you with your candidate’s
image/description in this story?
1 = very unsatisfied
2 = unsatisfied
3 = neither unsatisfied nor satisfied (neutral); no image/description of candidate
4 = satisfied 5 = very satisfied
How does the article mention and/or assess the candidate’s ….
Honesty: honesty, trustworthiness
Morality: morality, decency
Intelligence: intelligence, knowledge about important things
Compassion: compassion, caring about people, being empathetic, understanding the common American
Leadership: leadership ability, being a strong leader
Experience: level of political experience, experience relevant to the position of VP or president
0 = no mention of trait
1 = mostly negative 2 = more negative than positive
3 = equally negative and positive
4 = more positive than negative
5 = mostly positive
17
Appendix B
Selection of Media Content and Coding Reliability
I took a stratified random sample of AP Newswire Service stories about vice presidential
candidates Mike Pence and Tim Kaine between July 13 and November 4, 2016. Stories about Kaine
between July 23 and November 4, 2016, were sampled, and stories published about Pence between July
13 and November 4, 2016. I identified stories about each candidate by searching the database for the
candidate’s name during the designated time periods. Searches were made on all versions of the
candidates’ names (e.g., “Mike Pence,” “Michael Richard Pence”; “Michael R. Pence”; “Pence”). Clinton
searches were also conducted for versions of former president Bill Clinton’s name and any stories
referencing only him, and not candidate Hillary Clinton, were excluded. I then randomly selected 10% of
each month’s news coverage for each candidate (i.e., 10% of the stories about Kaine in July, 10% about
him in August, etc., and the same for Pence) for coding. In total, 154 stories about Kaine and 240 about
Pence were coded.
Two student assistants served as coders to code the selected stories using the coding scheme
presented in Appendix A. Since the value of these measures depends on the quality of the coding, I
conducted a series of reliability tests to ensure that the coders accurately and consistently analyzed the
content of the news stories. A third, independent reader then coded a 5% random sample of the stories for
each candidate in each month originally read and coded by the primary coders. I then conducted a series
of inter-coder reliability tests that compared the coders’ ratings of the stories. Both a simple percent
agreement measure (i.e., “the percentage of all coding decisions made by pairs of coders on which the
coders agree” (Lombard, Snyder-Duch, and Bracken 2002: 590) and Krippendorff’s alpha (2004)
confirmed intercoder reliability that was quite high.
The coders agreed on the coding of variables between 82% and 100% of the time, with
Krippendorff’s alpha values ranging between 0.74 and 1.00. Not surprisingly, measures related to the
more objective references to candidates’ traits exhibited the highest levels of reliability. At the same time,
the more subjective measures related to tone of coverage or candidate image exhibit lower, yet
respectable, levels of agreement.
18
References
Adkison, Danny M. 1982. “The Electoral Significance of the Vice Presidency”.” Presidential Studies
Quarterly 12(2): 330-336.
Baumgartner, Jody C. 2008. “The Veepstakes: Forecasting Vice Presidential Selection in 2008.” PS: Political Science and Politics 41(4): 765-772
Berenson, Tessa. 2016. “Donald Trumps Wins the 2016 Election.” Time Magazine. Published online
November 9, 2016: http://time.com/4563685/donald-trump-wins/.
Bryce, James. 1893. The American Commonwealth. Volume 2. New York: Macmillan.
Campbell, James E. 1992. “Forecasting the Presidential Vote in the States.” American Journal of Political
Science 36(2): 386-407.
Campbell, James E., Syed Ali and Farida Jalazai. 2006. “Forecasting Presidential Vote in the States, 1948-2004: An Update, Revision, and Extension of a State-Level Presidential Forecasting Model.” Pp.
33-57 in Campaigns and Political Marketing, ed. Waybe P. Steger, Sean Q. Kelly, and J. Mark
Wrighton. New York: The Haworth Press.
David, Paul. 1967. “The Vice Presidency: Its Institutional Evolution and Contemporary Status.” Journal
of Politics 29: 721-48.
Dudley, Robert L. and Ronald B. Rapoport. 1989. “Vice-Presidential Candidates and the Home State Advantage: Playing Second Banana at Home and on the Road.” American Journal of Political Science
33(2): 537-540.
Frankovic, Kathleen A. 1984. “The 1984 Election: The Irrelevance of the Campaign.” PS: Political
Science and Politics 18(1): 39-47.
Garand, James C. 1988. ”Localism and Regionalism in Presidential Elections: Is There a Home State or
Regional Advantage?” Political Research Quarterly 41 (March): 85-103.
Goldstein, Joel K. 1982. The Modern American Vice Presidency: The Transformation of a Political Institution. Princeton, NJ: Princeton University Press.
Hiller, Mark and Douglas Kriner. 2008. “Institutional Change and the Dynamics of Vice Presidential
Selection.” Presidential Studies Quarterly 38(3): 401-421.
Holbrook, Thomas M. 1991. “Presidential Elections in Time and Space.” American Journal of Political Science 35:91-109.
Holbrook, Thomas M. 1996. Do Campaigns Matter? Thousand Oaks, CA: Sage Publications, Inc.
Hurwitz, Jay A. [chap 1] 1980. “Presidential Eligibility and Selection Patterns.” Polity 12(3): 509-521.
Krippendorff, Klaus. 2004. Content Analysis: An Introduction to its Methodology, 2nd ed. Thousand Oaks,
CA: Sage.
Lewis-Beck, Michael S. and Tom W. Rice. 1983. “Localism in Presidential Elections: The Home State Advantage.” American Journal of Political Science 27: 548-556.
Light, Paul C. 1984. Vice-Presidential Power: Advice and Influence in the White House. Baltimore: Johns
Hopkins University Press.
Lombard, M., J. Snyder-Duch, and C. C. Bracken. 2010. “Practical Resources for Assessing and Reporting Intercoder Reliability in Content Analysis Research Projects.” Accessed on January 3,
2012: http://matthewlombard.com/reliability/.
19
Mayer, William G. 2000. “A Brief History of Vice Presidential Selection.” In In Pursuit of the White
House 2000: How We Choose Our Presidential Nominees. New York: Chatham House.
Natoli, Marie D. 1985. American Prince, American Pauper: The Contemporary Vice Presidency in
Perspective. Westport, CT: Greenwood Press.
Nelson, Michael. 1988. “Choosing the Vice President.” PS: Political Science and Politics 21(4): 858-868.
Patterson, Thomas E. 2016. “News Coverage of the 2016 General Election: How the Press Failed Voters.” Shorenstein Center on media, Politics and Public Policy website. Published online December
7, 2016: https://shorensteincenter.org/news-coverage-2016-general-election/
Polsby, N. W., and A. Wildavsky. 2012. Presidential elections: Strategies and Structures of American politics (12th ed.). Lanham, MD: Rowman & Littlefield Publishers, Inc.
Pomper, Gerald. 1963. Nominating the President. Evanston, IL: Northwestern University Press.
Pomper, George. 1966. “The Nomination of Hubert Humphrey for Vice-President.” Journal of Politics 28: 639-659.
Romero, David W. 2004. “Requiem for a Lightweight: Vice Presidential Candidate Evaluations and the
Presidential Vote.” Presidential Studies Quarterly 31(3): 454-463.
Rosenstone, Steven J. 1983. Forecasting Presidential Elections. New Haven: Yale University Press.
Sigelman, Lee and Paul J. Wahlbeck. 1997. “The ‘Veepstakes’: Strategic Choice in Presidential Running
Mate Selection.” American Political Science Review 91(4): 855-864.
Turque, Bill, Michael Isikoff, Mark Hosenball, Matt Bai and John Barry. 2000. “The Soul and the Steel.” Newsweek, August 21.
Ulbig, Stacy G. “The Appeal of Second Bananas: The Impact of Vice Presidential Candidates on
Presidential Vote Choice, Yesterday and Today.” 2010. American Politics Research 38(2): 330-355.
Ulbig, Stacy G. 2013. Vice Presidents, Presidential Elections, and the Media. Boulder CO: First Forum
Press - A Division of Lynne Rienner Publishers, Inc.
Watson, Robert P., and Richard M. Yon. 2006. “Vice Presidential Selection in the Modern Era.” White
House Studies 6: 163–78.
Wattenberg, Martin. 1984. “And Tyler, too.” Public Opinion 7:52-54.
Wattenberg, Martin 1995. “The Role of Vice-Presidential Candidate Ratings in Presidential Voting
Behavior.” American Politics Quarterly 23(4): 504-14.
Williams, Irving G. 1956. The Rise of the Vice-Presidency Washington: Public Affairs Press, 1956.
20
Table 1
Public Opinion Polling Data
Polls Weeks First Poll Last Poll Polls Weeks Polls Weeks
Pence 114 34 13-Jul-16 6-Mar-17 64 17 50 17
Trump 305 34 13-Jul-16 6-Mar-17 230 17 75 17
Kaine 57 16 23-Jul-16 4-Nov-16 57 16 0 0
Clinton 213 16 23-Jul-16 4-Nov-16 213 16 0 0
Notes: Polling data collected from Huffington Post Pollster webpage (http://elections.huffingtonpost.com/pollster) on 13
March 2017. Weeks run Wednesday through Tuesday, with first week beginning July 13, 2016. Five post-election Clinton
polls were excluded from this analysis, as were all partisan polls.
Total Start Date Pre-Election Post-Election
Candidate
21
Table 2
Descriptive Statistics for Candidate Favorability Ratings
and Volume of News Coverage
Range Mean Std. Dev. Median Range Mean Std. Dev. Median Range Mean Std. Dev. Median
Vice Presidential Candidate Undecided Rating 24.00 - 45.50 35.50 7.15 36.75 15.50 - 49.80 30.79 9.12 31.83 15.33 - 30.25 21.25 3.78 21.00
Running Mate Candidate Undicded Rating 2.58 - 4.75 3.83 0.65 3.70 3.00 - 5.55 4.38 0.78 4.43 5.00 - 10.00 6.82 1.64 6.50
Vice-Presidential Candidate Net Favorability Rating -7.00 - 10.14 1.40 4.16 1.75 -1.00 - 10.50 5.14 3.70 4.50 0.00 - 12.50 6.13 3.20 6.25
Running Mate Net Favorability Rating -16.73 - -10.67 -13.20 1.79 -13.11 -10.38 - -1.33 -6.08 2.79 -5.75 -30.08 - -21.13 -25.54 3.18 -25.90
Number AP Stories on Vice-Presidential Candidate 16 - 219 85.78 53.45 72 25 - 220 110.56 57.65 88 8 - 200 89.82 53.69 83
Number AP Stories on Presidential Running Mate 158 - 441 299.39 90.40 310 179 - 514 317.67 95.19 320 224 - 1396 564.29 288.49 511
Tim Kaine (Pre-Election Period) Mike Pence (Pre-Election Period) Mike Pence (Post-Election Period)
Notes: Data aggregated to the weekly level, with weeks beginning on Wednesday and ending on Tuesday. The pre-election period runs from one and half weeks before the Republican National Convention ( July 6, 2016,
the first date of available favorability ratings for either Vice Presidential Candidate) to Election Day (November 8, 2016). The post-election Period runs from November 9, 2016 to March 6, 2017. Post-election information
presented for Pence only due to the unavailability of post-election favorability data for Kaine.
22
Table 3
Descriptive Statistics of the Content of
Pre-Election News Coverage of Vice Presidential Candidates
Range Mean Std. Dev. Median Range Mean Std. Dev. Median
Number of Words in Story 808 - 2,156 1,608.97 354.83 1,648.72 1,009 - 2,252 1,535.48 321.18 1,486.36
Intensity of Coverage 1.00 - 1.43 1.12 0.14 1.05 1.00 - 2.75 1.55 0.35 1.50
Tone of Coverage 2.82 - 4.13 3.21 0.34 3.08 1.50 - 3.25 2.67 0.44 2.79
Candidate Image 2.94 - 3.88 3.36 0.26 3.40 1.75 - 3.25 2.75 0.37 2.85
Coverage of Candidate Traits
Honesty 3.00 - 4.50 3.88 0.52 4.00 1.50 - 3.00 2.53 0.49 2.60
(# weeks trait mentioned) 10 17
Morality 3.33 - 4.00 3.85 0.22 4.00 1.67 - 3.00 2.62 0.37 2.75
(# weeks trait mentioned) 12 17
Intelligence 3.00 - 5.00 4.01 0.44 4.00 1.75 - 3.00 2.60 0.34 2.67
(# weeks trait mentioned) 12 17
Compassion 2.94 - 5.00 4.42 0.56 4.38 1.50 - 3.30 2.50 0.45 2.50
(# weeks trait mentioned) 12 17
Leadership 2.81 - 4.80 4.09 0.51 4.00 1.50 - 3.00 2.39 0.40 2.50
(# weeks trait mentioned) 13 17
Experience 2.50 - 5.00 4.03 0.822 4.00 1.00 - 2.33 1.26 0.48 1.00
(# weeks trait mentioned) 13 11
Tim Kaine Mike Pence
Notes: Data aggregated to the weekly level, with weeks beginning on Wednesday and ending on Tuesday. The pre-election period runs from
one and half weeks before the Republican National Convention ( July 6, 2016, the first date of available favorability ratings for either Vice
Presidential Candidate) to Election Day (November 8, 2016). The post-election Period runs from November 9, 2016 to March 6, 2017. Post-
election information presented for Pence only due to the unavailability of post-election favorability data for Kaine. The statistics for the
candidate image and traits measures were calculated using only the cases for which the image/trait was mentioned.
23
TABLE 4
Volume of Coverage and Unformed Opinion
about Vice Presidential Candidates
B (s.e.) Std. B B (s.e.) Std. B B (s.e.) Std. B
Number of AP Stories about VP Candidate 0.008 0.049 0.053 * 0.322 0.023 0.17
(0.019) (0.025) (0.022)
Number of Words 0.000 -0.007 -0.005 -0.165 -0.002 -0.114
(0.002) (0.003) (0.003)
Intensity of Coverage -9.838 *** -0.303 11.099 0.258 -16.503 ** -0.326
(3.422) (7.817) (6.758)
Post Vice Presidential Debate -5.941 * -0.329 -14.862 ** -0.765 -11.536 *** -0.773
(3.395) (5.808) (3.073)
Week of Campaign -1.131 *** -0.649 -0.286 -0.158 -0.332 -0.221
(0.330) (0.591) (0.335)
Constant 57.659 ---- 22.285 ---- 62.144 ----
(6.216) (14.274) (7.020)
Number of Cases
Adjusted R-squared
III
16
0.841
Note: Dependent variable is percentage of survey respondents saying they were 'undecided' about whether they held a favorable view
of the candidate or not.*p<0.10; **p<0.05; ***p<0.01
I II
33
0.733
17
0.836
Both Candidates Pence Kaine
24
TABLE 5
Content of Coverage and Vice Presidential
Candidate Favorability Ratings
B (s.e.) Std. B B (s.e.) Std. B B (s.e.) Std. B
Tone of News Coverage 1.040 0.115 0.887 0.105 3.004 0.247
(2.780) (2.062) (4.955)
Candidate Image in News Coverage -2.593 -0.268 3.856 0.389 -12.920 * -0.820
(3.375) (2.867) (6.280)
Coverage of Candidate's Honesty 3.448 * 0.632 -1.571 -0.229 2.890 0.577
(1.715) (3.253) (2.171)
Coverage of Candidate's Morality -2.482 -0.387 -11.356 * -1.367 0.890 0.179
(5.255) (3.570)
Coverage of Candidate's Intelligence -0.831 -0.156 5.967 * 0.832 -1.108 -0.281
(2.875) (2.852)
Coverage of Candidate's Compassion 1.771 0.429 1.854 0.236 1.758 0.596
(2.016) (2.400) (2.253)
Coverage of Candidate's Leadership 0.856 0.175 6.466 0.789 -3.123 -0.890
(2.368) (2.293) (3.858)
Coverage of Candidate's Experience -0.823 -0.225 -15.628 ** -0.626 2.800 0.854
5.326 2.598
Constant 5.235 ---- -5.987 ---- 30.211 ----
(7.114) (16.992)
Number of Cases
Adjusted R-squared
I.
Note: Dependent variable is net candidate favorability (% favorable - % unfavorable).*p<0.10; **p<0.05; ***p<0.01
17
0.628
16
II. III.
Both Candidates Pence Kaine
0.271
33
0.080
25
TABLE 6
Presidential Coattails and Vice Presidential
Candidate Favorability Ratings
B (s.e.) Std. B B (s.e.) Std. B
Net Favorability of Presidential Running Mate 0.318 * 0.168 0.378 * 0.389
(0.162) (0.205)
Number of AP Stories about Presidential Running Mate 0.011 0.008 0.006 0.107
(0.008) (0.011)
Tone of New Coverage of Presidential Running Mate ---- ---- 0.056 0.143
---- (0.083)
Constant 2.916 ---- 0.712 ----
(3.166) (7.471)
Number of Cases
Adjusted R-squared 0.132 0.162
Note: Dependent variable is net candidate favorability (% favorable - % unfavorable). *p<0.10; **p<0.05; ***p<0.01
I II
33 26
Volume Volume & Content
![Plenaria II Peter Ulbig [Modo de compatibilidad] · Title: Microsoft PowerPoint - Plenaria II_Peter Ulbig [Modo de compatibilidad] Author: nrodrigu Created Date: 12/8/2008 6:31:39](https://img.pdfslide.net/doc/110x75/6018143d74a3fe206c5e0356/plenaria-ii-peter-ulbig-modo-de-compatibilidad-title-microsoft-powerpoint-plenaria.jpg)