Embed Size (px)
Citation preview


Victorian Local Government Waste Services Report2016-17
Victorian Local Government Annual Waste Services Report 2016-17 2
Authorised and published by Sustainability Victoria,Level 28, Urban Workshop50 Lonsdale Street MelbourneVictoria 3000 Australia
Victorian Local Government Annual Waste Services Report 2016-17© Sustainability Victoria 2018
October 2018
AccessibilityThis document is available in PDF and Word format on the internet at www.sustainability.vic.gov.au
While reasonable efforts have been made to ensure that the contents of this publication are factually correct, Sustainability Victoria gives no warranty regarding its accuracy, completeness, currency or suitability for any particular purpose and to the extent permitted by law, does not accept any liability for loss or damages incurred as a result of reliance placed upon the content of this publication. This publication is provided on the basis that all persons accessing it undertake responsibility for assessing the relevance and accuracy of its content. This publication supersedes all previous reports.
Victorian Local Government Annual Waste Services Report 2016-17 should be attributed to Sustainability Victoria.
Victorian Local Government Annual Waste Services Report 2016-17 is licensed under a Creative Commons Attribution 4.0 Australia licence. In essence, you are free to copy, distribute and adapt the work, as long as you attribute the work and abide by the other licence terms. Go to http://creativecommons.org/licenses/by/4.0/ to view a copy of this licence.
Victorian Local Government Annual Waste Services Report 2016-17 3

ContentsVictorian Local Government Waste Services Report 2016-17.............................................................2
Introduction...................................................................................................................................... 5
Household kerbside collection services key findings..............................................................................5
Environmental benefits of household kerbside recyclables and organics services...................................6
Other Council waste services findings..................................................................................................6
1. Local government household kerbside collection results.............................................................7
Composition..................................................................................................................................8
Cost and geography.......................................................................................................................9
Diversion rates.............................................................................................................................10
2. Garbage collection service results............................................................................................12
Cost and geography.....................................................................................................................13
Bin collection system...................................................................................................................14
3. Recycling collection service results..........................................................................................15
Cost and geography.....................................................................................................................16
Bin collection system...................................................................................................................17
Materials collected and contamination.......................................................................................18
4. Organics collection service results...........................................................................................19
Cost and geography.....................................................................................................................19
Bin collection system...................................................................................................................20
5. Other council services.............................................................................................................21
Litter maintenance and street sweeping service..................................................................................21
Cost and geography.....................................................................................................................21
Household hard waste services..........................................................................................................22
Cost and geography.....................................................................................................................22
Landfill and Resource Recovery Centre operations.............................................................................23
Resource recovery centres..........................................................................................................23
Landfills........................................................................................................................................23
Appendix A: Survey methodology....................................................................................................24
Appendix B: Local government classification....................................................................................25
Appendix C: Local governments by diversion rate.............................................................................27
Victorian Local Government Annual Waste Services Report 2016-17 4
IntroductionSince 2000, Sustainability Victoria (SV) has surveyed Victorian Local Governments about their waste and recycling services to produce the Victorian Local Government Annual Waste Services Report (Report). The report outlines the tonnages, costs, trends and diversion rates for each service as well as the overarching total.
More information about the survey methodology can be found in Appendix A: Survey Methodology.
Household kerbside collection services key findings In 2016-17:
> The amount of Kerbside Garbage, Recyclables and Organics1 collected by local governments was 2.23 million tonnes (equivalent to 353 kg per person). This figure increased by more than 86,000 tonnes (4.0%) from 2015-16.
> Of the 2.23 million tonnes collected:o 1.18 million tonnes of this was Garbage (equivalent to 462 kg per household2 or 186 kg
per person). This is an increase of 1.4% or just over 16,000 tonnes from 2015-16o 591,000 tonnes of this was Recyclables (equivalent to 236 kg per household or 93 kg per
person), an increase of 0.1% and 652 tonnes from 2015-16o 463,000 tonnes were Organics (equivalent to 324 kg per household or 73 kg per person)
an increase of 17.6% or a little more than 69,000 tonnes from 2015-16. This was the result of a huge increase in regional garden organics collections including FOGO (Food Organics & Garden Organics) collections.
> The rate of kerbside recyclables and organics diverted from landfill was 46%, an increase of two percentage points from the previous year. This figure is net of contamination.
In 2016-17 it cost local government:
> $405 million to provide household kerbside waste collection services (equivalent to $64.07 per person). This is $19 million (5%) more than the previous year.
> Of the $405 million, approximately:o $260 million was spent on providing a Garbage service (equivalent to $102.13 per
household or $41.17 per person) an increase of nearly $7.5 million or 3.0% since 2015-16o $68 million was spent on providing a Recyclables service (equivalent to $27.09 per
household or $10.71 per person). This increased by $4 million or 6.6% since 2015-16
o $77 million to provide an Organics service (equivalent to $54.00 per household or $12.20 per person). This is an increase of nearly $8 million or 11.3% since 2015-16.
1 Please note: Organics also includes food organics collected through kerbside collections by some local governments.2 Households refers to residential properties serviced by a regular kerbside service provided by council, in some instances small businesses may also be included in the kerbside service collection where council has provided a kerbside bin. In many cases these cannot be identified separately and are included in the residential properties serviced figures.Victorian Local Government Annual Waste Services Report 2016-17 5
Environmental benefits of kerbside recyclables and organics servicesIn 2016-17, of the 591,103 tonnes of Recyclables collected by local government household kerbside services, 552,704 tonnes (94%) was recovered (less contaminates).
Applying this figure – along with 462,599 tonnes of recovered Organics (less contaminates) to the Life Cycle Assessment Calculator http://www.sustainability.vic.gov.au/publications-and-research/research/life-cycle-assessment/life-cycle-assessment-calculator - the environmental benefits of the combined 1,015,303 tonnes are estimated to include savings of:> 8,726 megalitres of water – equivalent to filling 3,491 Olympic-sized swimming pools, or 17 showers for
every Victorian for a year.> 477,884 tonnes of greenhouse gases (CO2-e) in a year, or equivalent to taking 125,759 cars off the
road3 for an entire year.> saving 3,747,243 gigajoules of energy – enough to provide power to almost a million Victorian
households for a month.
Other local government waste services findingsIn 2016-17 the amount of hard waste:> collected by local government was 103,396 tonnes of which 83,084 tonnes were disposed to
landfill and the rest recovered. This represents a diversion rate of 20%.> On average 54 kg was collected per household that had access to a hard waste collection.
In 2016-17 it cost local government:> $95 million ($15.05 per person) to provide litter maintenance and street sweeping services
compared to $92 million in 2015-16. Of the $95 million, local governments spent:o $37 million (38%) on the provision of litter services including litter bins, traps and clean-up
services (e.g. dumped rubbish and road side litter). Of this, litter bins cost $22 million or 59% of these services
o $59 million (62%) on street sweeping services.> $31 million or $4.91 per person, to provide a household hard waste service, an increase of
$581,604 since the previous year.
In 2016-17 of the 53 operational landfills reported by local governments:> 33 were licensed – most these are in small provincial local government areas
(16 or 48%). > 20 were unlicensed - there are no unlicensed landfills in Metropolitan Melbourne. Most
unlicensed landfills are in small provincial and rural townships with 19 (95%).> 17 local government-owned landfills closed4 –. Most landfill closures (12) were in small
provincial areas.
There were 249 operational Resource Recovery Centres / Transfer Stations; 198 of these were maintained in rural townships and small provincial municipalities. This reflects the need in rural communities for drop-off facilities where kerbside recyclable services are not provided.
3Australian Bureau of Statistics, Cat. No. 9208.0, Survey of Motor Vehicle Use, Australia (released August 2011). Fuel Emission Factors were obtained from the General Transport Full Fuel Cycle (Scope 1 + Scope 3) calculated from the Australian Government's National Greenhouse Accounts Factors (July 2012).
4 Please note: In some instances, councils reported the closure of unlicensed landfills and had not reported the operation of these landfills in previous years which may skew the results.
Victorian Local Government Annual Waste Services Report 2016-17 6
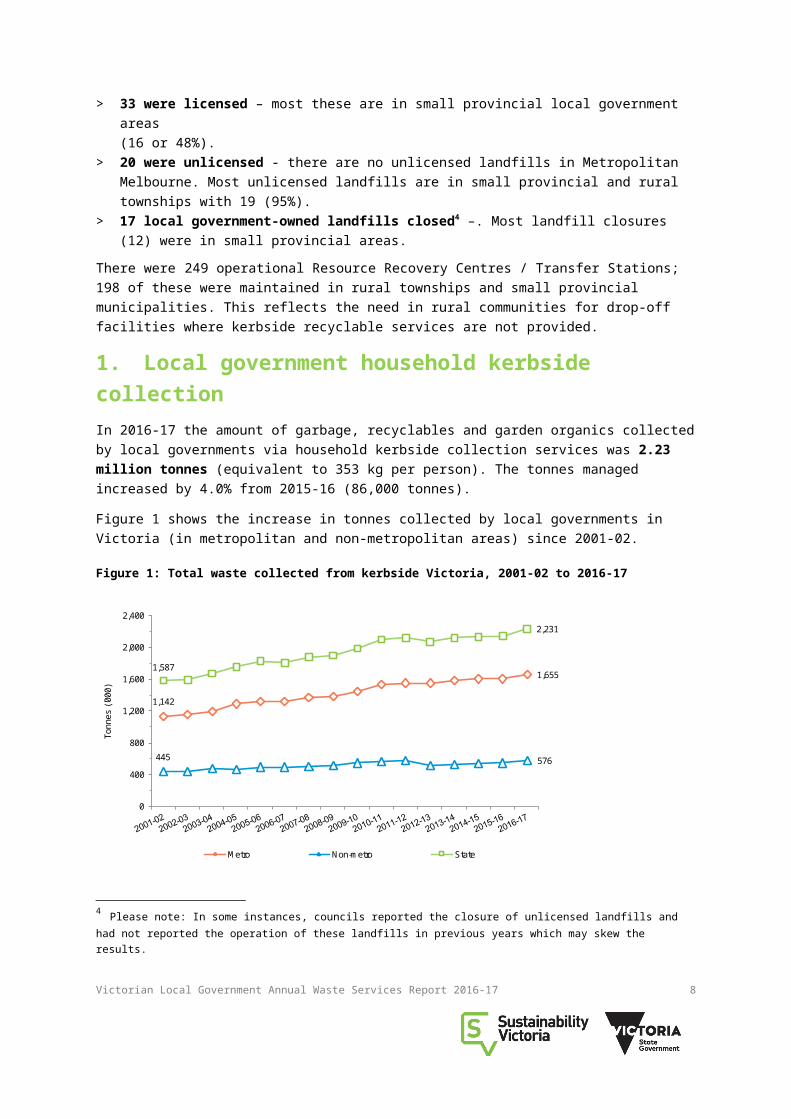
1. Local government household kerbside collectionIn 2016-17 the amount of garbage, recyclables and garden organics collected by local governments via household kerbside collection services was 2.23 million tonnes (equivalent to 353 kg per person). The tonnes managed increased by 4.0% from 2015-16 (86,000 tonnes).
Figure 1 shows the increase in tonnes collected by local governments in Victoria (in metropolitan and non-metropolitan areas) since 2001-02.
Figure 1: Total waste collected from kerbside Victoria, 2001-02 to 2016-17
1,142
1,655
445 576
1,587
2,231
0
400
800
1,200
1,600
2,000
2,400
Tonn
es ('
000)
Metro Non-metro State
Figure 2 shows the trends in tonnages of materials collected by local governments since 2001-02. Recyclables and Organics collected from kerbside services has significantly increased since 2001-02 by 65% and 296% respectively, whilst the amount of Garbage has remained relatively stable; increasing by only 6% despite a 30% increase in population over the same period.
Figure 2: Total waste collected for the three main kerbside services, Victoria 2001-02 to 2016-17
1,116 1,177
361
591
132
463
0
200
400
600
800
1000
1200
1400
Tonn
es (
'000
)
Garbage Recyclables Garden organics
Victorian Local Government Annual Waste Services Report 2016-17 7
CompositionIn 2016-17, Garbage accounted for more than half (53%) of the 2.23 million tonnes of waste collected by local government household kerbside collection services. Garbage still represents the largest component of the waste stream, whilst the number of Recyclables and Organics collected over the past 12 years has steadily increased relative to Garbage.
Figure 3: Composition of waste collected through kerbside services, Victoria 2016-17
Garbage53%
Recyclables26%
Organics21%
Victorian Local Government Annual Waste Services Report 2016-17 8

Cost and geographyIn 2016-17 it cost local government $405 million to provide household kerbside waste collection services (equivalent to $64.07 per person). This figure is $19.5 million (5.0%) more than the previous year.
Metropolitan local governments (31 of 79) collected most of Victoria’s total municipal waste from kerbside and drop-off facilities, accounting for nearly 1.7 million tonnes (74%). Regional local governments (48 of 79) collected nearly 576,000 tonnes (26%).
Figure 4 shows the relative proportion of material collected by metropolitan and non-metropolitan local governments from kerbside and drop-off facilities. Drop-off includes commingled recyclables and organics from households although occasionally small businesses may also drop-off at transfer stations without being recorded as small businesses.
Figure 4: Proportion of waste generation by metro / non-metro local governments, Victoria 2016-17
50%39%
25%
21%
20%
16%
2%
6%
4%
18%
0%
20%
40%
60%
80%
100%
Metro Non-metro
Kerbside garbage Kerbside recyclables Kerbside green organics
Drop-off recyclables Drop-off green organics
Non-metropolitan local governments, especially those in rural areas, may provide less access to kerbside services than metropolitan local governments and may use (in part) a drop-off facility in lieu of a kerbside system. Figure 4 shows non-metropolitan local governments generated 11% less garbage, 4% less recyclables, and 4% less organics through kerbsides services than metropolitan councils and made significantly more use of drop-off facilities for organics (16% more) and recyclables (4% more) than metropolitan local governments.
Victorian Local Government Annual Waste Services Report 2016-17 9

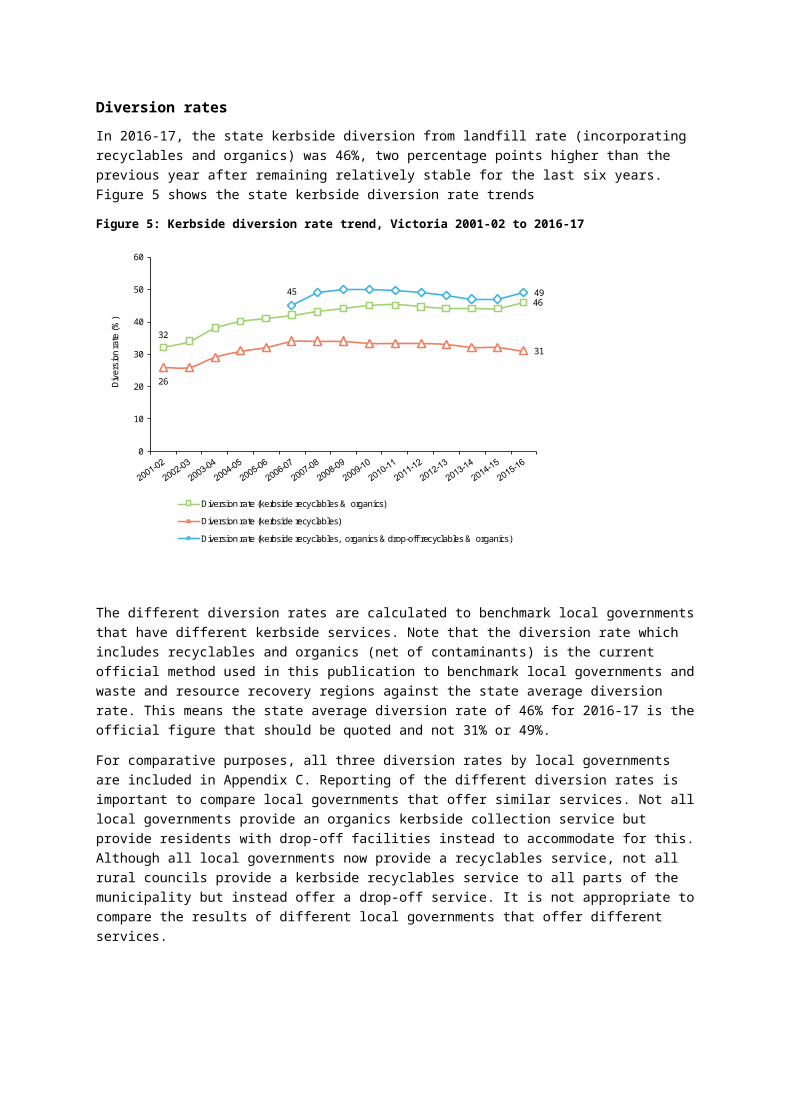
Diversion ratesIn 2016-17, the state kerbside diversion from landfill rate (incorporating recyclables and organics) was 46%, two percentage points higher than the previous year after remaining relatively stable for the last six years. Figure 5 shows the state kerbside diversion rate trends
Figure 5: Kerbside diversion rate trend, Victoria 2001-02 to 2016-17
32
46
26
31
45 49
0
10
20
30
40
50
60
Dive
rsio
n ra
te (%
)
Diversion rate (kerbside recyclables & organics)
Diversion rate (kerbside recyclables)
Diversion rate (kerbside recyclables, organics & drop-off recyclables & organics)
The different diversion rates are calculated to benchmark local governments that have different kerbside services. Note that the diversion rate which includes recyclables and organics (net of contaminants) is the current official method used in this publication to benchmark local governments and waste and resource recovery regions against the state average diversion rate. This means the state average diversion rate of 46% for 2016-17 is the official figure that should be quoted and not 31% or 49%.
For comparative purposes, all three diversion rates by local governments are included in Appendix C. Reporting of the different diversion rates is important to compare local governments that offer similar services. Not all local governments provide an organics kerbside collection service but provide residents with drop-off facilities instead to accommodate for this. Although all local governments now provide a recyclables service, not all rural councils provide a kerbside recyclables service to all parts of the municipality but instead offer a drop-off service. It is not appropriate to compare the results of different local governments that offer different services.
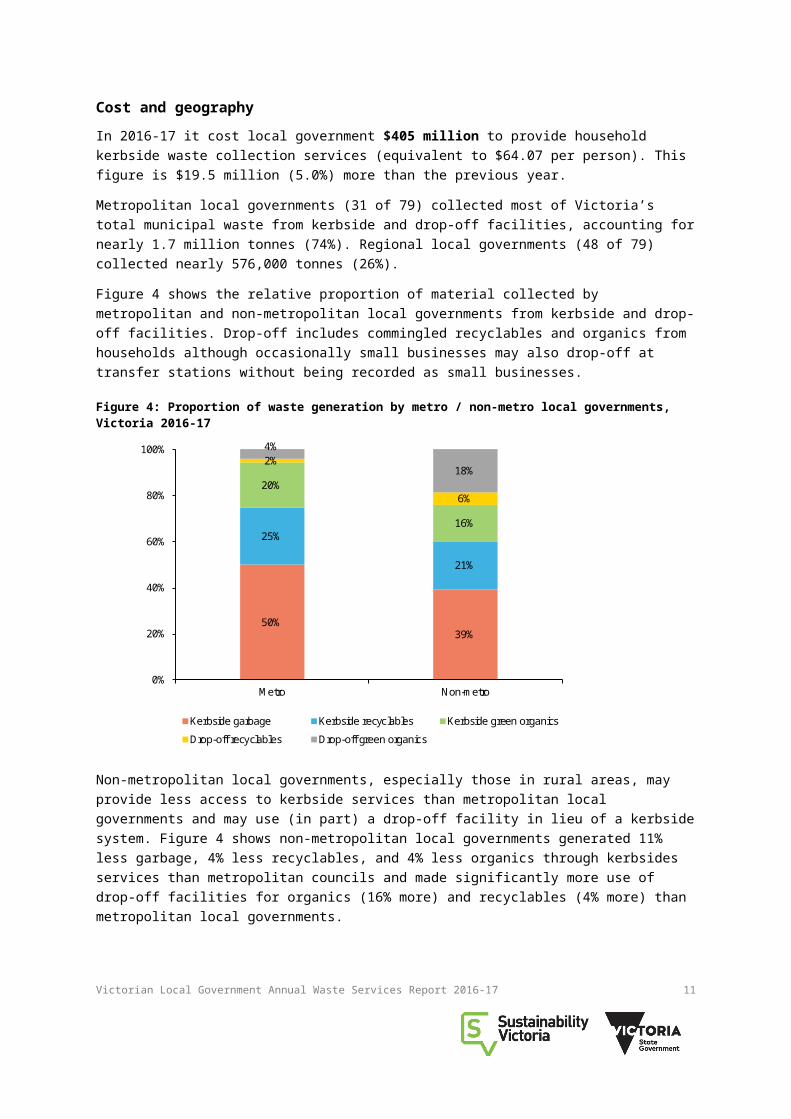
Figure 6 shows the diversion rate achieved for kerbside waste by each of the state’s seven waste and resource recovery regions. The North East region has the highest diversion rate of 60%, surpassing the state average of 46%.
Barwon South West continued to achieve a diversion rate well above the state average with 54%.
Figure 6: Diversion rate by waste and resource recovery region, Victoria 2016-17
37%
37%
45%
46%
46%
54%
60%
46%
0% 10% 20% 30% 40% 50% 60% 70%
Loddon Mallee
Grampians Central West
Metropolitan
Goulburn Valley
Gippsland
Barwon South West
North Eastern
State
Victorian Local Government Annual Waste Services Report 2016-17 11
2. Garbage collection serviceAll 79 local governments in Victoria offer household kerbside Garbage collection services, which collectively cover 96% of Victorian households. The remaining 4% are generally located in remote areas where providing a kerbside garbage service is not a feasible option.
In 2016-17 the amount of garbage collected by local government via household kerbside collection services was nearly 1.18 million tonnes (equivalent to 462 kg per household or 186 kg per person). This figure increased by 16,384 tonnes (1.4%) from 2015-16.
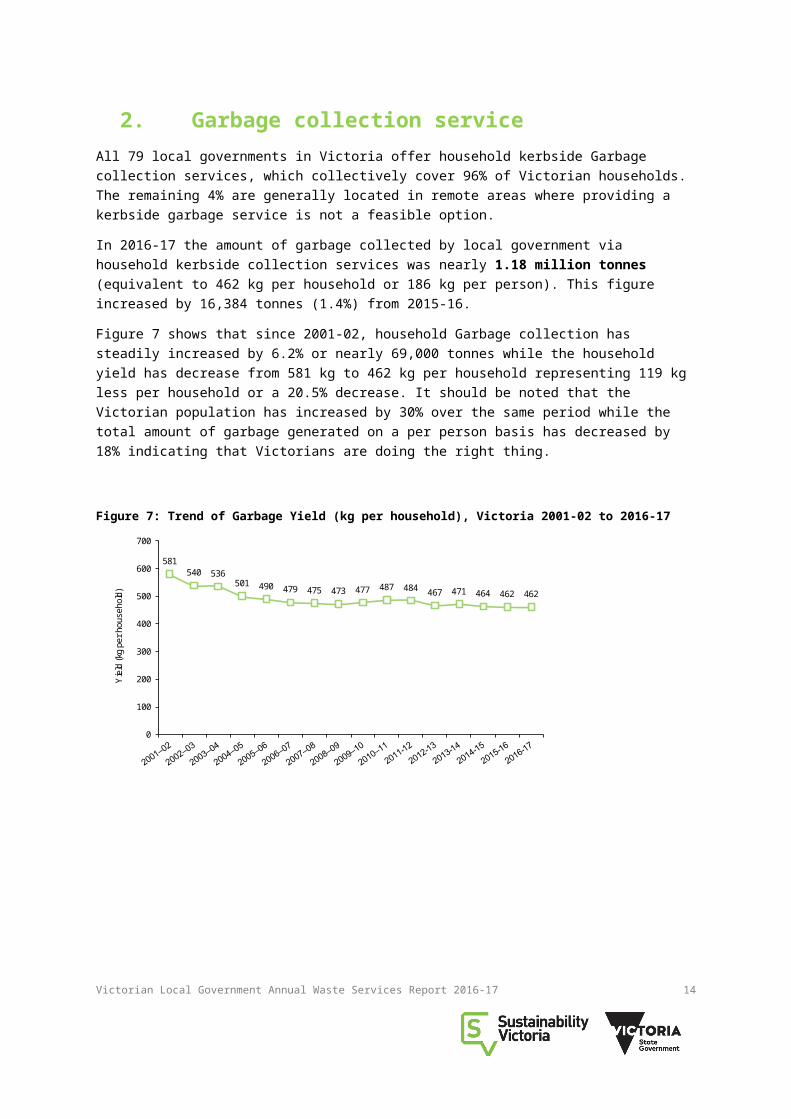
Figure 7 shows that since 2001-02, household Garbage collection has steadily increased by 6.2% or nearly 69,000 tonnes while the household yield has decrease from 581 kg to 462 kg per household representing 119 kg less per household or a 20.5% decrease. It should be noted that the Victorian population has increased by 30% over the same period while the total amount of garbage generated on a per person basis has decreased by 18% indicating that Victorians are doing the right thing.
Figure 7: Trend of Garbage Yield (kg per household), Victoria 2001-02 to 2016-17
581540 536
501 490 479 475 473 477 487 484 467 471 464 462 462
0
100
200
300
400
500
600
700
Yie
ld (k
g pe
r hou
seho
ld)
Victorian Local Government Annual Waste Services Report 2016-17 12

Cost and geographyIn 2016-17 the cost for local governments to provide a Garbage collection service was $260 million (equivalent to $102.13 per household or $41.17 per person). This has increased by nearly $7.5 million or 3.0% since 2015-16 and can be partly explained by additional 37,000 kerbside services provided by local governments and a CPI5 increase of 2.4 index points (2.2%) since June 2015-16.
Households in non-metropolitan local government areas (LGAs) generated on average about 8% or 39 kg less garbage than households in metropolitan LGAs. Non-metropolitan local governments continue to pay higher prices to deliver their services, with the average cost per tonne of Garbage collected being $26.49 or 12% higher than metropolitan local governments.
Figure 8 illustrates the steady increase in cost per tonne since 2001-02 and represents an increase of $137 over 16 years.
Figure 8: Trend of kerbside garbage collection cost per tonne, Victoria 2001-02 to 2016-17
84 8895 105
112 123 132142 147
167186
208 214 215 218 221
$0
$50
$100
$150
$200
$250
Cost
per
tonn
e ($
)
5 ABS Cat. no. 6401.0 - Consumer Price Index, Australia, Mar 2018, Index Numbers, All groups CPI, Melbourne, Original Series, ID A2325811C
Victorian Local Government Annual Waste Services Report 2016-17 13
Bin collection systemThe 120L household garbage bin continues to be the most commonly used with 50 (63%) of 79 local governments providing it (Table 1).
Table 1: Garbage bin system, Victoria 2016-17
Bin Type Metro Non-metro Total
80 L 7 3 10
120 L 19 31 50
140 L 4 11 15
240 L 1 3 4
Total 31 48 79
Over the past 16 years, it has consistently been shown that as the bin size increases, corresponding household garbage generation increases. Figure 9 highlights this using 2016-17 household garbage generation data by bin collection system.
Figure 9: Household garbage generation by bin collection system, Victoria 2016-17
398
458509
572
0
100
200
300
400
500
600
700
80L 120L 140L 240L
Yie
ld (k
g pe
r hou
seho
ld)
Victorian Local Government Annual Waste Services Report 2016-17 14

3. Recycling collection serviceAll 79 local governments offer a household kerbside recycling service, which covers 95% of Victorian households. The remaining 4% are generally located in remote areas where providing a kerbside recyclables service is not feasible.
In 2016-17 the amount of Recyclables collected by local governments via household kerbside collection services was 591,103 tonnes (equivalent to 236 kg per household or 93 kg per person). This figure slightly decreased by 0.1% from 2015-16.
Figure 10 shows that since the survey began in 2001-02, the recovery of Recyclables steadily increased until 2010-11. Since then, the quantity of Recyclables collected has decreased by 5% from 622,223 tonnes in 2010-11 to 591,103 tonnes in 2015-16.
This decline in collected Recyclables may be due to the reduction in weight of individual plastic and glass packaging materials.
Figure 10: Kerbside Recyclables collected (tonnes), Victoria 2001-02 to 2016-17
359397
431
496537
561604 608 613 622 619 599 594 592 590 591
0
100
200
300
400
500
600
700
Tonn
es ('
000)
Victorian Local Government Annual Waste Services Report 2016-17 15

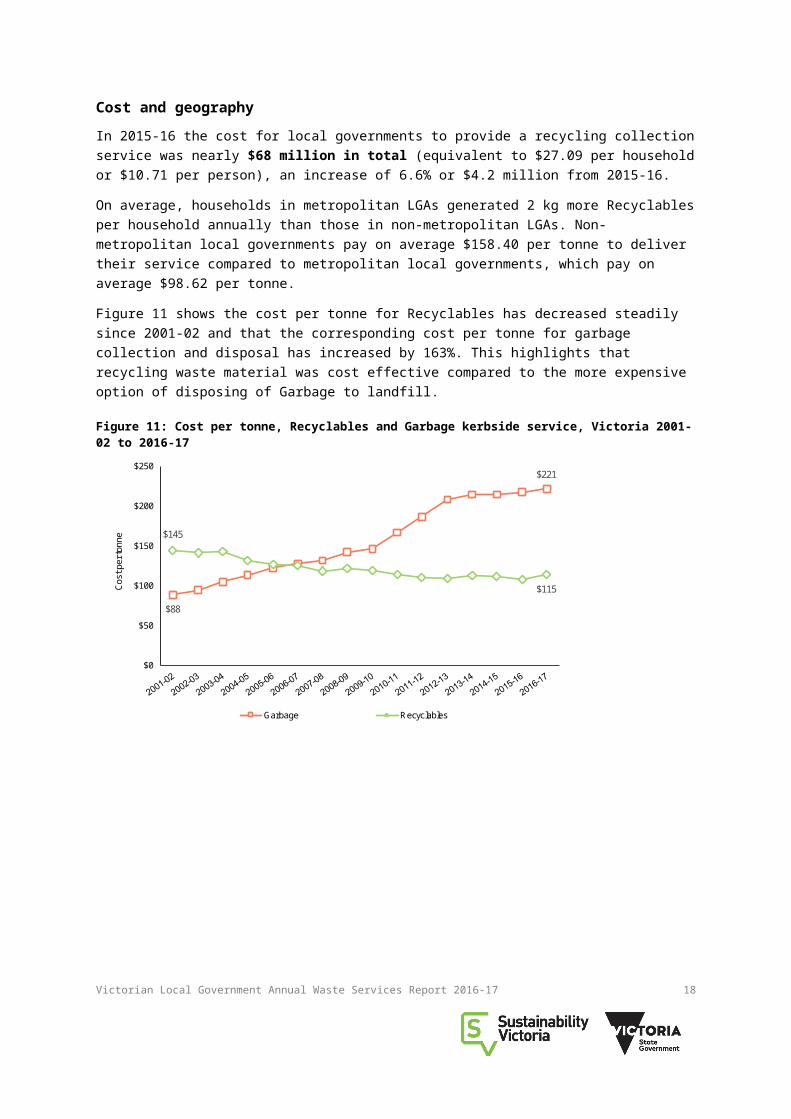
Cost and geographyIn 2015-16 the cost for local governments to provide a recycling collection service was nearly $68 million in total (equivalent to $27.09 per household or $10.71 per person), an increase of 6.6% or $4.2 million from 2015-16.
On average, households in metropolitan LGAs generated 2 kg more Recyclables per household annually than those in non-metropolitan LGAs. Non-metropolitan local governments pay on average $158.40 per tonne to deliver their service compared to metropolitan local governments, which pay on average $98.62 per tonne.
Figure 11 shows the cost per tonne for Recyclables has decreased steadily since 2001-02 and that the corresponding cost per tonne for garbage collection and disposal has increased by 163%. This highlights that recycling waste material was cost effective compared to the more expensive option of disposing of Garbage to landfill.
Figure 11: Cost per tonne, Recyclables and Garbage kerbside service, Victoria 2001-02 to 2016-17
$88
$221
$145
$115
$0
$50
$100
$150
$200
$250
Cost
per
tonn
e
Garbage Recyclables
Victorian Local Government Annual Waste Services Report 2016-17 16

Bin collection systemThere are currently seven different combinations of garbage and recycling bin systems used by Victorian local governments (in the past there has been up to 14). The most common recycling / garbage bin combination is a 240L commingled fortnightly recyclables bin with a 120L weekly garbage bin. This system is used by 45 (57%) of 79 local governments.
Figure 12 shows that a 240L fortnightly Recyclables collection system generates 52 kg (21%) more recyclables per household annually than a 120L weekly Recyclables collection system.
Figure 12: Recycling generation by collection system, Victoria 2016-17
192
244
-
50
100
150
200
250
300
120L commingled Weekly 240L commingled Fortnightly
Yie
ld (k
g pe
r hou
seho
ld)
Victorian Local Government Annual Waste Services Report 2016-17 17
Materials collected and contaminationIn 2016-17, Paper items were the largest category of Recyclables collected through kerbside recycling services accounting for 58%. Glass containers made up 29% and Plastic containers made up 9%.
In 2016-17 contamination levels averaged 6.5% an increase of 1.2 percentage points from the previous year. Figure 13 shows contamination rates fluctuate from year to year; however, data validation shows that this may be due to the accuracy of data rather than a significant change in contamination rates. Although the wide scale adoption of the 240L commingled bin system in 2003-04 significantly increased contamination rates compared to the traditional 50L crate based system that had a very low contamination rate. Educational campaigns over time have decreased the contamination rate by 5 percentage points.
Figure 13: Contamination rate of kerbside recyclables, Victoria 2001-02 to 2016-17
6.6 6.7
8.7
10.3
11.5
10.0 10.3
8.8
7.78.3
7.0
5.86.7
6.05.3
6.5
0
2
4
6
8
10
12
14
Cont
amin
atio
n ra
te (%
)
Victorian Local Government Annual Waste Services Report 2016-17 18

4. Organics collection serviceIn Victoria, 56 of 79 local governments offer household Organics bin collection services that cover 56% of Victorian households while a further three local governments offered only an on-call service. Of the 56 councils offering a bin service, 13 of those also offered residents an on-call service mostly annually or biannually. There were 15 Councils collecting both Food and Garden Organics (FOGO) from the kerbside system. The councils with FOGO services indicated that approximately 22% of the organics stream was composed of food organics. This represents 3% of the total kerbside waste stream collected from households. The majority of Councils which do not offer a kerbside Organics service are based in regional areas.
In 2016-17 the amount of Organics collected by local governments via household kerbside collections services was 462,874 tonnes (equivalent to 324 kg per household or 73 kg per person). This figure increased by 17.6% or 69,147 tonnes from 2015-16 (393,727 tonnes).
Of the total amount collected, almost 100% was processed; less than 1% was not and this is likely sent to landfill or burnt due to contamination.
Figure 14 shows that since 2001-02, household Organics collection has almost quadrupled. During this time, there has been an expansion of the three-bin system, typically to a small bin for Garbage, one large bin for Recyclables and another large bin for Organics. As a result, this has encouraged households to divert Organics from landfill.
Quantities collected over the five years prior to 2009-10 remained relatively stable. This can be attributed largely to the prevailing drought conditions in Victoria and the watering restrictions enforced in many parts of the state at that time.
The large increase in 2009-10 can be attributed to the drought coming to an end and the change in regulations introduction by State Government in 2009, which saw residents in bushfire prone areas able to clear trees within 10 metres and shrubs within 30 metres of their homes without a permit.
Figure 14: Organics tonnes collected, Victoria 2001-02 to 2016-17
119141
179
239257 248 256 267
315
390 397369
393 382 394
463
0
100
200
300
400
500
Tonn
es (
'000
)
Cost and geographyIn 2016-17 the cost to local governments to provide an Organics collection service was $77 million (equivalent to $54.00 per household or $12.20 per person). This is an increase of $7.8 million or 11.3% since 2015-16 ($69 million). This increase can be partly explained by additional 112,000 (9%
Victorian Local Government Annual Waste Services Report 2016-17 19

increase) services undertaken by local governments; the introduction of food collection, and a CPI increase of 2.2% since 2015-16.
Non-metropolitan local governments spent on average 17% or $27.33 more per household for a garden Organics collection than Metropolitan local governments and yielding 5 kg per household less material than in Metropolitan LGAs, which yielded 328 kg on average.
Bin collection systemTable 2 shows the range and frequency of bins used for garden Organic collections. The predominant bin used by Victorian local governments is the 240L bin, accounting for 49 (68%) of all garden Organics collection services provided. Although there are 56 local governments that offer a kerbside Organics bin service, 13 local governments also offer an on-call garden collection service. Three offered just an on-call service.
Table 2: Organics bin systems, Victoria 2016-17
Primary binMetro Non-metro Total
120L 5 1 6
240L 23 26 49
Tied bundle / Loose stack 16 1 17
Total 44 28 72
Victorian Local Government Annual Waste Services Report 2016-17 20

5. Other council servicesThe Survey also asks local governments about the other waste services they provide, including:
> Litter maintenance and street sweeping services> Household hard waste service> Landfill and transfer station operations.
Litter maintenance and street sweeping serviceAll 79 local governments provide litter maintenance and street sweeping services. In 2016-17, 71 of 79 local governments reported on these services. The figures below are a general indication of these services.
In 2016-17, Victorian local governments collected:
> 34,942 tonnes of material from litter bins, a 15.5% increase from 30,263 reported in 2015-16> 20,142 tonnes of illegally dumped rubbish, an increase of 10.6% from 18,211 in 2015-16> 2,104 tonnes of material from litter traps, more than doubling the previous figure of 921 tonnes in
2015-16.
Cost and geographyIn 2016-17, the cost for local governments to provide litter maintenance and street sweeping services was more than $95 million (or $15.05 per person) of this, local governments spent:
> $37 million (38%) on the provision of litter services including litter bins, traps and clean-up services (e.g. dumped rubbish)
> $59 million (62%) on street sweeping services.
Figure 15 shows the breakdown of service cost.
Figure 15: Litter and street sweeping services annual service cost, Victoria 2016-17
Litter Bins23%
Litter traps2%
Illegally dumped rubbish
9%
Roadside Litter4%
Cigarette bins<1%
Street sw eeping62%
Victorian Local Government Annual Waste Services Report 2016-17 21

Household hard waste servicesIn 2016-17, 43 of 79 local governments provided a hard waste collection service. Hard waste is household waste not normally accepted or possible to fit into garbage bins e.g. white goods and timber.
In 2016-17, 103,396 tonnes of hard waste were collected, and 83,084 tonnes was disposed to landfill with the rest recovered. This represents an average diversion rate of 20%. On average 54 kg of hard waste was collected per household with access to a hard waste service.
Cost and geographyIn 2016-17, the cost for local governments to provide a hard waste service was $31 million and the cost per household was $16.31.
Of the 103,396 tonnes collected in 2016-17, Metropolitan local governments collected 101,655 tonnes (98% of total) and non-metropolitan local governments collected only a small fraction (1,741 tonnes). This is likely due to hard waste collections being contingent upon densely populated areas to be economically viable.
Victorian Local Government Annual Waste Services Report 2016-17 22
Landfill and Resource Recovery Centre operationsLocal governments own/operate or own landfills (licensed and unlicensed by EPA) and Resource Recovery Centres (also known as Transfer Stations) across the state. The figures below do not include privately owned sites.
Resource recovery centresThere were, 249 local government owned/operated Resource Recovery Centres / Transfer Stations (RRC/TS) operational and 198 of these were maintained in rural townships and small provincial municipalities. This reflects the need in rural communities for drop-off facilities and consolidating recyclables and waste.
LandfillsIn 2016-17, of the 53 operational landfills reported by local governments:
33 were licensed – inner metropolitan local governments did not operate or own any landfills; 20 were unlicensed, the majority were in rural townships (9) and small provincial (10) LGAs; 17 local government owned landfills closed6 –. Most landfill closures (12) were in small
provincial areas. Five of these were licensed and 12 were unlicensed.
There has been a gradual decrease in the number of licensed and unlicensed landfills since 2001-02 and a corresponding increase in the number of (RRC/TSs) established and / or upgraded across the state. Figure 16 highlights these trends.
Figure 16: Number of licensed/unlicensed landfills and RRC/TSs, Victoria 2001-02 to 2016-17*
57 33
105
20
193
249
0
50
100
150
200
250
300
Num
ber
Licensed landfills Unlicensed landfills TS / RRCs
*No survey was conducted for the landfill and RRC/TS component of the 2003-04 survey. Data has been estimated from existing information for this period.
6 Please note: In some instances, councils reported the closure of unlicensed landfills and had not reported the operation of these landfills in previous years which may skew the results.
Victorian Local Government Annual Waste Services Report 2016-17 23

Appendix A: Survey methodologyThe Victorian Local Government Annual Waste Services Survey 2016-17 (Survey) was conducted between August 2017 and February 2018 and sought data from all 79 local governments.
Each local government was emailed a Survey and asked to provide information for the 2016-17 financial year about the tonnages and costs relating to their waste services with a focus on the three main household kerbside waste services e.g. Garbage, Recycling and Organics collection. The Survey questions focused on the following areas:
> household Garbage collection and disposal> household Recyclables (e.g. containers and paper / cardboard) collection and sorting> household Organics collection and processing> litter bin and litter trap collection and disposal> litter clean-up services> street sweeping> hard waste collection services> landfill and resource recovery centre / transfer centre operations.
This data collection included all 79 Victorian local governments, representing a 100% response rate. All local governments have a weighting of one, which means that the numerical findings in this report are entirely derived from the data provided by the 79 participating local governments without any estimation for missing data.
The diversion rate is calculated by comparing the tonnes recovered (collected less contaminants) to the tonnes collected, and includes Garbage, Recyclables and Organics recovered from household kerbside services only.
The data is presented in aggregated form. This reduces the impact of statistical anomalies on the findings. The findings are therefore more representative of costs, yields and other features being analysed.
In various parts of the report, the data is grouped by:
> service provision categories;> metropolitan / non-metropolitan classifications;> waste and resource recovery region;> collection system type;> collection frequency.
SV has sought to verify the information provided via the Survey with local governments and Waste and Resource Recovery Groups. Findings in this report are subject to the accuracy of data provided by individual local governments.
Victorian Local Government Annual Waste Services Report 2016-17 24

Appendix B: Local government classification Table 3: Victorian local governments by region, service provision category, and metropolitan / non-metropolitan classification.
Local Government Area Waste and Resource Recovery Region
Service provision category
Metro / Non-metro classification
Alpine Shire North East Small Provincial Non-MetroArarat Rural City Grampians Central West Small Provincial Non-MetroBallarat City Grampians Central West Major Provincial Non-MetroBanyule City Metropolitan Outer Metropolitan MetroBass Coast Shire Gippsland Small Provincial Non-MetroBaw Baw Shire Gippsland Small Provincial Non-MetroBayside City Metropolitan Outer Metropolitan MetroBenalla Rural City North East Small Provincial Non-MetroBoroondara City Metropolitan Outer Metropolitan MetroBrimbank City Metropolitan W Outer Metropolitan MetroBuloke Shire Loddon Mallee Rural Township Non-MetroCampaspe Shire Goulburn Valley Small Provincial Non-MetroCardinia Shire Metropolitan Melbourne Fringe MetroCasey City Metropolitan Outer Metropolitan MetroCentral Goldfields Shire Grampians Central West Small Provincial Non-MetroColac Otway Shire Barwon South West Small Provincial Non-MetroCorangamite Shire Barwon South West Rural Township Non-MetroDarebin City Metropolitan Inner Metropolitan MetroEast Gippsland Shire Gippsland Small Provincial Non-MetroFrankston City Metropolitan Outer Metropolitan MetroGannawarra Shire Loddon Mallee Rural Township Non-MetroGlen Eira City Metropolitan Inner Metropolitan MetroGlenelg Shire Barwon South West Rural Township Non-MetroGolden Plains Shire Grampians Central West Rural Township Non-MetroGreater Bendigo City Loddon Mallee Major Provincial Non-MetroGreater Dandenong City Metropolitan Outer Metropolitan MetroGreater Geelong City Barwon South West Major Provincial Non-MetroGreater Shepparton City Goulburn Valley Major Provincial Non-MetroHepburn Shire Grampians Central West Small Provincial Non-MetroHindmarsh Shire Grampians Central West Rural Township Non-MetroHobsons Bay City Metropolitan Inner Metropolitan MetroHorsham Rural City Grampians Central West Small Provincial Non-MetroHume City Metropolitan Outer Metropolitan MetroIndigo Shire North East Small Provincial Non-MetroKingston City Metropolitan Outer Metropolitan MetroKnox City Metropolitan Outer Metropolitan MetroLatrobe City Gippsland Major Provincial Non-MetroLoddon Shire Loddon Mallee Rural Township Non-MetroMacedon Ranges Shire Loddon Mallee Melbourne Fringe Non-MetroManningham City Metropolitan Outer Metropolitan MetroMansfield Shire North East Rural Township Non-MetroMaribyrnong City Metropolitan Inner Metropolitan Metro
Victorian Local Government Annual Waste Services Report 2016-17 25

Local Government Area Waste and Resource Recovery Region
Service provision category
Metro / Non-metro classification
Maroondah City Metropolitan Outer Metropolitan MetroMelbourne City Metropolitan Inner Metropolitan MetroMelton Shire Metropolitan Outer Metropolitan MetroMildura Rural City Loddon Mallee Small Provincial Non-MetroMitchell Shire Goulburn Valley Small Provincial Non-MetroMoira Shire Goulburn Valley Rural Township Non-MetroMonash City Metropolitan Outer Metropolitan MetroMoonee Valley City Metropolitan Inner Metropolitan MetroMoorabool Shire Grampians Central West Melbourne Fringe Non-MetroMoreland City Metropolitan Inner Metropolitan MetroMornington Peninsula Shire Metropolitan Melbourne Fringe MetroMount Alexander Shire Loddon Mallee Small Provincial Non-MetroMoyne Shire Barwon South West Rural Township Non-MetroMurrindindi Shire Goulburn Valley Rural Township Non-MetroNillumbik Shire Metropolitan Melbourne Fringe MetroNorthern Grampians Shire Grampians Central West Small Provincial Non-MetroPort Phillip City Metropolitan Inner Metropolitan MetroPyrenees Shire Grampians Central West Rural Township Non-MetroQueenscliffe Borough Barwon South West Small Provincial Non-MetroSouth Gippsland Shire Gippsland Small Provincial Non-MetroSouthern Grampians Shire l Barwon South Western Small Provincial Non-MetroStonnington City Metropolitan Inner Metropolitan MetroStrathbogie Shire Goulburn Valley Rural Township Non-MetroSurf Coast Shire Barwon South West Small Provincial Non-MetroSwan Hill Rural City Loddon Mallee Small Provincial Non-MetroTowong Shire North East Rural Township Non-MetroWangaratta Rural City North East Small Provincial Non-MetroWarrnambool City Barwon South West Small Provincial Non-MetroWellington Shire Gippsland Small Provincial Non-MetroWest Wimmera Shire Grampians Central West Rural Township Non-MetroWhitehorse City Metropolitan Outer Metropolitan MetroWhittlesea City Metropolitan Outer Metropolitan MetroWodonga City North East Major Provincial Non-MetroWyndham City Metropolitan Outer Metropolitan MetroYarra City Metropolitan Inner Metropolitan MetroYarra Ranges Shire Metropolitan Melbourne Fringe MetroYarriambiack Shire Grampians Central West Rural Township Non-Metro
Victorian Local Government Annual Waste Services Report 2016-17 26

Appendix C: Local governments by diversion rateTable 4: Kerbside diversion rate by local government area, Victoria 2016-17
Rank Local government
Diversion rate 1* (%) (Recyclables and Organics diverted)
Diversion rate 2* (%) (Recyclables only diverted)
Diversion rate 3* (%) (Recyclables, Organics & RRC/TS drop-off diverted)
1 Wodonga City Council 70% 43% 74%
2 Strathbogie Shire Council 67% 48% 74%
3 Indigo Shire Council 66% 47% 68%
4 Nillumbik Shire Council 66% 47% 67%
5 Benalla Rural City Council 63% 48% 73%
6 Moyne Shire Council 60% 39% 63%
7 Corangamite Shire Council 58% 33% 65%
8 Wangaratta Rural City Council 57% 38% 57%
9 Greater Geelong City Council 57% 37% 57%
10 Manningham City Council 56% 35% 58%
11 Moira Shire Council 55% 39% 63%
12 Surf Coast Shire Council 55% 41% 60%
13 Baw Baw Shire Council 54% 35% 59%
14 Queenscliffe Borough Council 54% 35% 54%
15 Frankston City Council 53% 36% 56%
16 Monash City Council 53% 33% 57%
17 Maroondah City Council 52% 32% 52%
18 Casey City Council 52% 33% 52%
19 Knox City Council 52% 30% 54%
20 Banyule City Council 52% 35% 52%
21 Mornington Peninsula Shire Council
51% 42% 61%
22 Bayside City Council 51% 35% 54%
23 East Gippsland Shire Council 50% 33% 58%
24 Greater Shepparton City Council
50% 33% 58%
25 Alpine Shire Council 49% 48% 57%
26 South Gippsland Shire Council 49% 33% 62%
27 Whitehorse City Council 49% 35% 59%
28 Latrobe City Council 49% 25% 58%
29 Kingston City Council 48% 31% 48%
30 Colac Otway Shire Council 47% 30% 48%
31 Cardinia Shire Council 47% 34% 47%
32 Hobsons Bay City Council 47% 32% 47%
33 Yarra Ranges Shire Council 47% 34% 47%
34 Melton Shire Council 46% 30% 58%
35 Ballarat City Council 46% 29% 51%
36 Gannawarra Shire Council 46% 33% 51%
37 Glen Eira City Council 45% 30% 45%
Victorian Local Government Annual Waste Services Report 2016-17 27
Rank Local government
Diversion rate 1* (%) (Recyclables and Organics diverted)
Diversion rate 2* (%) (Recyclables only diverted)
Diversion rate 3* (%) (Recyclables, Organics & RRC/TS drop-off diverted)
38 Macedon Ranges Shire Council 44% 32% 57%
39 Greater Dandenong City Council
44% 26% 44%
40 Darebin City Council 44% 29% 46%
41 Moonee Valley City Council 44% 31% 46%
42 Boroondara City Council 44% 28% 45%
43 Campaspe Shire Council 43% 33% 50%
44 Whittlesea City Council 42% 26% 45%
45 Moreland City Council 41% 29% 41%
46 Southern Grampians Shire Council
41% 34% 67%
47 Central Goldfields Shire Council 41% 35% 55%
48 Golden Plains Shire Council 41% 41% 41%
49 Greater Bendigo City Council 39% 23% 45%
50 Wellington Shire Council 39% 39% 51%
51 Warrnambool City Council 38% 38% 38%
52 Brimbank City Council 37% 24% 37%
53 Yarra City Council 36% 35% 37%
54 Stonnington City Council 36% 29% 37%
55 Wyndham City Council 36% 28% 41%
56 Mount Alexander Shire Council 35% 35% 46%
57 Moorabool Shire Council 35% 33% 41%
58 Maribyrnong City Council 34% 28% 33%
59 Northern Grampians Shire Council
33% 33% 34%
60 Mansfield Shire Council 33% 33% 33%
61 Bass Coast Shire Council 32% 32% 49%
62 Swan Hill Rural City Council 32% 29% 37%
63 Towong Shire Council 32% 32% 32%
64 Murrindindi Shire Council 32% 32% 44%
65 Mildura Rural City Council 31% 31% 49%
66 Port Phillip City Council 30% 30% 31%
67 Mitchell Shire Council 30% 30% 38%
68 Glenelg Shire Council 29% 29% 43%
69 Hume City Council 29% 22% 36%
70 Pyrenees Shire Council 27% 23% 27%
71 Melbourne City Council 26% 26% 26%
72 Horsham Rural City Council 24% 24% 39%
73 Ararat Rural City Council 24% 24% 35%
74 Buloke Shire Council 23% 23% 39%
75 Yarriambiack Shire Council 23% 23% 40%
76 Hepburn Shire Council 21% 21% 47%
77 Loddon Shire Council 20% 20% 34%
Victorian Local Government Annual Waste Services Report 2016-17 28
Rank Local government
Diversion rate 1* (%) (Recyclables and Organics diverted)
Diversion rate 2* (%) (Recyclables only diverted)
Diversion rate 3* (%) (Recyclables, Organics & RRC/TS drop-off diverted)
78 West Wimmera Shire Council 18% 18% 40%
79 Hindmarsh Shire Council 16% 16% 18%
State average 46% 31% 49%
*Diversion rate 1 refers to tonnes of recyclables and organics collected (less contamination) divided by tonnes of garbage, recyclables and organics collected
*Diversion rate 2 equals tonnes of recyclables collected (less contamination) divided by tonnes of garbage and recyclables collected
*Diversion rate 3 equals tonnes of recyclables, organics and drop-off material (recyclables and organics) collected (less contamination), divided by tonnes of garbage, recyclables, organics and drop-off material (recyclables and organics) collected.
Table 5: Victorian local government by service provision category and metro and non-metro classification
Service Provision Classification Metro Non-Metro State totalInner Metropolitan 10 — 10
Outer Metropolitan 17 — 17
Melbourne Fringe 4 2 6
Major Provincial — 6 6
Small Provincial — 24 24
Rural Township — 16 16
Total 31 48 79
Victorian Local Government Annual Waste Services Report 2016-17 29

Table 6: Victorian Population7 figures
Year Population
Year on year change
(%)
Per cent change from base year
2001-02 (%)
2001-2002 4,863,084 0.0% 0.0%2002-2003 4,923,485 1.2% 1.2%2003-2004 4,981,467 1.2% 2.4%2004-2005 5,048,602 1.3% 3.8%2005-2006 5,126,540 1.5% 5.4%2006-2007 5,153,522 0.5% 6.0%2007-2008 5,256,375 2.0% 8.1%2008-2009 5,371,934 2.2% 10.5%2009-2010 5,461,101 1.7% 12.3%2010-2011 5,537,817 1.4% 13.9%2011-2012 5,632,521 1.7% 15.8%2012-2013 5,736,672 1.8% 18.0%2013-2014 5,901,970 2.9% 21.4%2014-2015 6,032,968 2.2% 24.1%2015-2016 6,179,249 2.4% 27.1%2016-2017 6,323,606 2.3% 30.0%
Table 7: Melbourne CPI8 figures
Quarter
Index Numbers All groups CPI
Melbourne
Jun-2001 75.1
Jun-2002 77.3
Jun-2003 79.6
Jun-2004 81.3
Jun-2005 83.0
Jun-2006 86.2
Jun-2007 87.9
Jun-2008 91.8
Jun-2009 92.9
Jun-2010 95.8
Jun-2011 99.2
Jun-2012 100.4
Jun-2013 102.6
Jun-2014 105.9
Jun-2015 107.1
Jun-2016 108.6
Jun-2017 111.0
7 ABS Catalogue number 3101.0 Australian Demographic Statistics, September 2017, published 22 March 2018. Table 5, Population by Sex States and territories, Persons, Victoria. Victorian 2016-17 population figure has been used to calculate the Victorian ‘per person rate’ in this publication (pop 6,323,606). 8 ABS Cat. no. 6401.0 - Consumer Price Index, Australia, Mar 2018, Index Numbers, All groups CPI, Melbourne, Original Series, ID A2325811C
Victorian Local Government Annual Waste Services Report 2016-17 30

Victorian Local Government Annual Waste Services Report 2016-17 31