Embed Size (px)
Citation preview
Fritz Breuss
18.07.2005, 1/83
Fritz Breuss
Does the ‘Development Round’ Foster Development?
I. Introduction xxx II. Multilateral Trade Liberalization and Development xxx A. Openness, Growth and Poverty Reduction xxx 1. The Trade and Development Linkage xxx 2. What Determines the Huge Income
Differences in the World?
xxx B. Is WTO Membership Good for Trade at All? xxx III. After Eight GATT Rounds - Markets Remain Still
Subtly Protected: Market Access Issues
xxx A. Patterns of Protection xxx B. Divergence of Applied Tariffs and their
Bindings
xxx C. Developing Countries Face Higher Barriers
to their Exports than Industrial Countries
xxx D. Tariff Peaks and Tariff Escalation xxx 1. Tariff Peaks xxx 2. Tariff Escalation xxx E. Contingent Protection xxx 1. Antidumping Measures xxx 2. Standards and Non-tariff Barriers to Trade xxx F. Trade Preferences xxx G. Regionalism versus Multilateralism xxx 1. Increasing Attractiveness of RTAs xxx 2. Does the EU Need the WTO at All? xxx H. Developing Countries’ Market Access in
Agriculture
xxx 1. Costs of Agricultural Distortion xxx 2. Removing Agricultural Subsidies alone is
Negative for Developing Countries
xxx
Does the ‘Development Round’ Foster Development?
18.07.2005, 2/83
3. Agricultural Liberalization Benefits all Countries
xxx
I. Developing Countries’ Market Access in Textile and Clothes
xxx
IV. Gains from Trade Liberalization under a Successful Doha Round
xxx
A. Formula Approaches to Market Access Negotiations
xxx
1. The General Procedure of Negotiations xxx 2. The Danger of Preference Erosion for the
Developing Countries
xxx B. How to Estimate Gains from Multilateral Trade
Liberalization?
xxx 1. UNCTAD Simulations xxx 2. CGE Model Simulations with Imperfect
Competition
xxx V. Conclusions xxx Bibliography xxx Appendix: Tables and Figure on World Trade xxx
I. Introduction
After the failed attempts in Seattle in late 1999, the Ministerial Conference in its Fourth Session in Doha, on November 9-14, 2001 launched the agenda for a new comprehensive round of multilateral trade negotiations. At the behest of the European Union (EU), the ministerial declaration emphasised that the Doha Round should provide a major opportunity for developing countries. Consequently the agenda for the new WTO round has been coined the ‘Doha De-velopment Agenda’ (DDA). On September 10-14, 2003 the fifth Ministerial Conference in Cancún ended without reaching a con-sensus.
According to press reports and subsequent statements by those present at that meeting, the apparent and proximate cause of the Ministerial’s collapse was a failure to agree on launching formal negotiations on the so-called Singapore Issues. Others, however, have put forward alternative explanations for the meeting’s failure, including poor chairmanship of the Ministerial meeting by Mexi-cos’s Foreign Minister, Mr. Luis Ernesto Derbez; a failure to agree on the modalities for negotiations on agricultural trade barriers,

Fritz Breuss
18.07.2005, 3/83
export subsidies, and domestic support policies; the inability of many WTO members to negotiate or discuss many issues simulta-neously during and before the Cancún Ministerial Conference; and a perception that some national representatives in Cancun were not prepared to go beyond pre-determined demands of others and showed little propensity to ‘negotiate seriously’ with other delega-tions.1
The Doha Round was after all aiming at opening markets in or-der to foster growth and alleviate poverty in the developing world. In this respect Cancún was a ‘disaster’ which could badly hit the developing countries, in particular the least developing countries (LDCs), notwithstanding the emergence of the G90 and G22.2 Al-though the previously-agreed commitments by WTO members are still binding, the Cancún failure may have political consequences. On the one hand liberalization (market access) is delayed; on the other hand representatives of the United States and the EU immedi-ately afterwards expressed their sympathy with a switch in their trade policy preferences towards more bi- or unilateralism.
Before Cancún, public opinion was focusing on the interpreta-tion of the TRIPs agreement, concerning the enforcement of intel-lectual property rights for affordable medicines (compulsory li-censes, production of generic drugs) to protect health in case of diseases such as AIDS. The WTO TRIPs agreement of August 30, 2003 together with a similar solution of the EU for this problem (Council Regulation 953/2003) has been a major achievement in legal and economic terms and from a moral point of view. It is, however the only result of Cancún.
Some commentators argue that the present round was not only ‘overburdened’ by the so-called Singapore Issues (which are pri-marily in the interest of the developed world) but also by putting development considerations at the centre of the Doha Round. Evenett even questions the new development mandate of the WTO at all. This agenda is an intricate menu of objectives and means that could lead to deceptive or undesired outcomes.3
The DDA contains a series of other key issues on which pro-gress has been delayed as a follow up of Cancún (even the follow-
1 Evenett (2003), 11. 2 Fontagné (2003), 3. 3 Evenett (2003), 16.

Does the ‘Development Round’ Foster Development?
18.07.2005, 4/83
up conference in Geneva on December 15-16, 2003 did not bring a break-through): 1) Implementation-related issues: The developing world considers
that developed economies have not fulfilled their commitments of Marrakech (1994) concerning the pace of liberalization in la-bour intensive industries (implementation of the Agreement on Textiles and Clothing – ATC), whereas their own commitments (TRIPs) are disproportionate.
2) Agriculture: Market access as well as the distorting domestic policies (subsidies in the USA and EU) are key issues.
3) Services (GATS). 4) Market access for non-agricultural products. 5) The four Singapore issues: the relationship between trade and
investment policy; the interaction between trade and competition policies; transparency in public procurement practices; and trade facilitation practices (more efficient customs procedures).
6) LDCs: Considering their specific needs: duty-free, quota-free market access for their products; Special and Differential Treat-ment (SDT); technical co-operation and capacity building etc. The DDA raises a lot of concerns which are dealt with in this
article. In the next chapter the relationship between market access (trade liberalization) and development and its complex connections with poverty reduction are analysed. Their relationships are far from clear. The third chapter addresses market access issues, rang-ing from the problems of tariff peaks and escalation to more subtle forms of protectionism still in place vis-à-vis the developing coun-tries. The fourth chapter looks at gains from further liberalization or more generally, the potential loss of welfare and income in the de-veloping countries due to a delayed Doha Round. Conclusions are drawn at the end.
II. Multilateral Trade Liberalization and Development
A. Openness, Growth and Poverty Reduction In the discussion of whether trade liberalization and foreign di-
rect investment have helped to spur growth in China and India, the answer by participants at a conference organized by the IMF and India’s National Council of Applied Economic Research in New Delhi, November 14-16, 2003 was a unanimous and resounding ‘yes’, while in the case of broader capital account liberalization,
Fritz Breuss
18.07.2005, 5/83
opinions were more divided.4 Although poverty reduction in both India and China has been strongly correlated with economic growth, the wide regional differences within the two countries sug-gest hat other policies are also relevant in enhancing the ‘poverty-reduction efficiency of growth’. Participants in this conference sought to identify the factors behind the two countries’ impressive track record over the past two decades. Interestingly, both are nowadays fast growing developing countries but had a quite differ-ent attitude towards trade liberalization and membership in world trade organizations. India is a GATT signatory country since July 8, 1948 and WTO member since January 1, 1995. China became a WTO member only on December 11, 2001.
Both countries witnessed an increase in openness. In 1980 the ratio to GDP of total trade in goods and services in both India and China stood at about 15 percent. By 2001, this ratio had more than tripled to about 50 percent in China, while it had risen to only around 25 percent in India.
1 . The Trade and Deve lopmen t L inkage In general the question whether more openness is better for
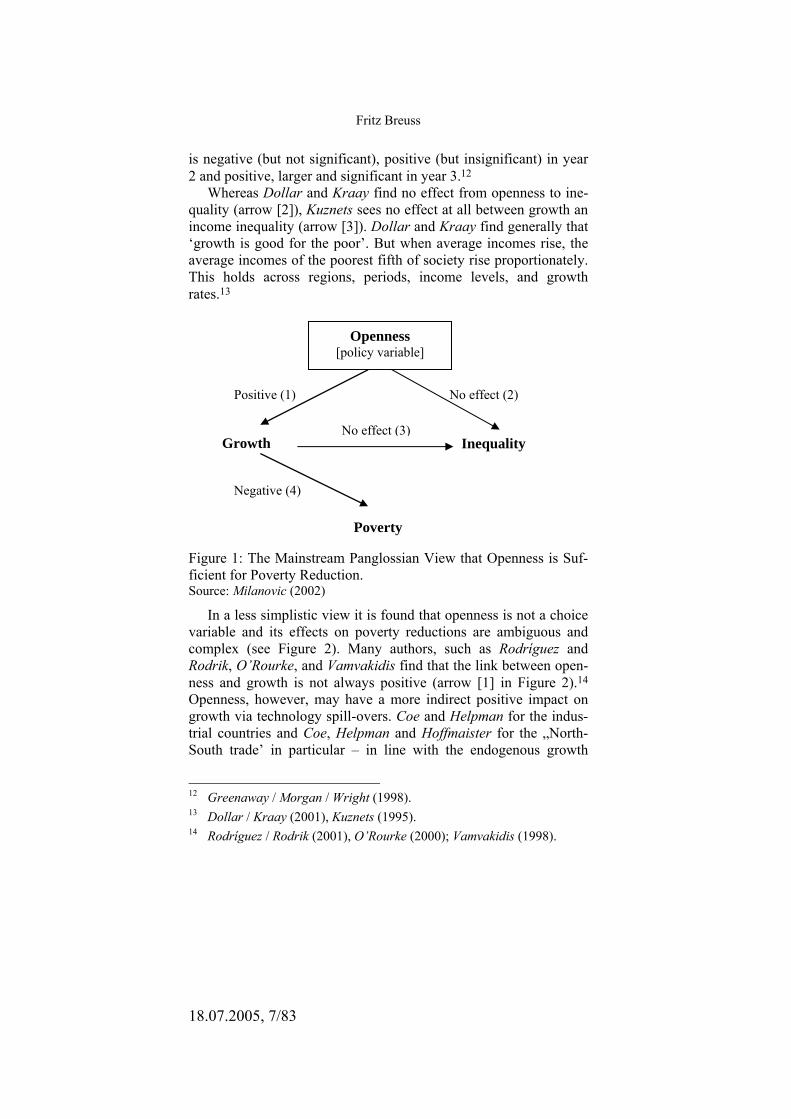
growth and development and whether it is even a remedy for pov-erty reduction is not always easy to answer. There is a huge amount of development literature on this topic. The nexus of openness and poverty reduction is ambiguous and complex. Reimer surveys and classifies thirty-five studies of the emerging literature which quanti-fies how international trade affects the poor in developing coun-tries.5 A general discussion of the problems connected with trade and development linkages is also offered by the UNCTAD.6 The manifold relationships between trade and development may be demonstrated with the Figures 1 and 2.
Let’s look first to the mainstream ‘Panglossian’ view in Figure 1. Representatives of researchers, seeing a positive link between openness and growth (arrow 1) are Sachs and Warner; Dollar and Kraay; Dowrick; Dowrick and de Long; and Greenaway, Morgan and Wright.7
4 IMF (2003). 5 Reimer (2002). 6 UNCTAD (2003). 7 Sachs / Warner (1995); Dollar / Kraay (2001, 2002); Dowrick (1994);
Dowrick / de Long (2001); Greenaway / Morgan / Wright (1998).
Does the ‘Development Round’ Foster Development?
18.07.2005, 6/83
For a sample of up to 73 countries Greenaway, Morgan and Wright8 estimate in a panel over the period 1975 to 1993 a ‘core’ new growth theory model. Growth of real GDP per capita is ex-plained by the GDP per capita as in 1965 (catching-up variable), the level of secondary school enrolment as in 1965, a terms of trade index, population, the ratio of gross domestic investment to GDP (proxy for capital input) and liberalization dummies. They use three different definitions of liberalization, those of Sachs and Warner, Dean et al. and one provided by the World Bank.9 The first is con-structed on the basis of measuring whether an economy is open or not. Their index of openness is based on five criteria relating to non-tariff barriers, average tariff levels, the black market exchange rate, whether state monopolies exist for major exports and whether the economy is socialist or not. By contrast, Dean et al. are more qualitatively based.10 They use information on average nominal tariffs, QR coverage and average black market premia to identify when reform has taken place. The liberalization indicator provided by the World Bank is indicated by Structural Adjustment Loans (SAL) as one of a number of possible determinants of growth, ex-port and investment performance.11 Greenaway, Morgan and Wright equate the first year of a SAL with a trade component as the beginning of the liberalization episode [nicht ‘period’?]. The au-thors find the following empirical results: A low initial GDP and high initial level of schooling are associated with faster growth in GDP per capita as are a higher investment ratio and favourable terms of trade movement. Faster population growth is associated with slower GDP per capita growth and liberalization appears to have on average a favourable and substantial (2.7%) impact on growth in years following liberalization. Looking at the impact of the timing of reform on growth they estimate the current [nicht ‘initial’?] impact of liberalization and the effects of two years later. They find evidence of a ‘J curve effect’ of liberalization on per capita GDP growth: in year 1 of liberalization the impact on growth
8 Greenaway / Morgan / Wright (1998). 9 Sachs / Warner (1995), Dean et al. (1994); World Bank (1993). 10 Dean et al. (1994). 11 World Bank (1993).
Fritz Breuss
18.07.2005, 7/83
is negative (but not significant), positive (but insignificant) in year 2 and positive, larger and significant in year 3.12
Whereas Dollar and Kraay find no effect from openness to ine-quality (arrow [2]), Kuznets sees no effect at all between growth an income inequality (arrow [3]). Dollar and Kraay find generally that ‘growth is good for the poor’. But when average incomes rise, the average incomes of the poorest fifth of society rise proportionately. This holds across regions, periods, income levels, and growth rates.13
Figure 1: The Mainstream Panglossian View that Openness is Suf-ficient for Poverty Reduction. Source: Milanovic (2002)
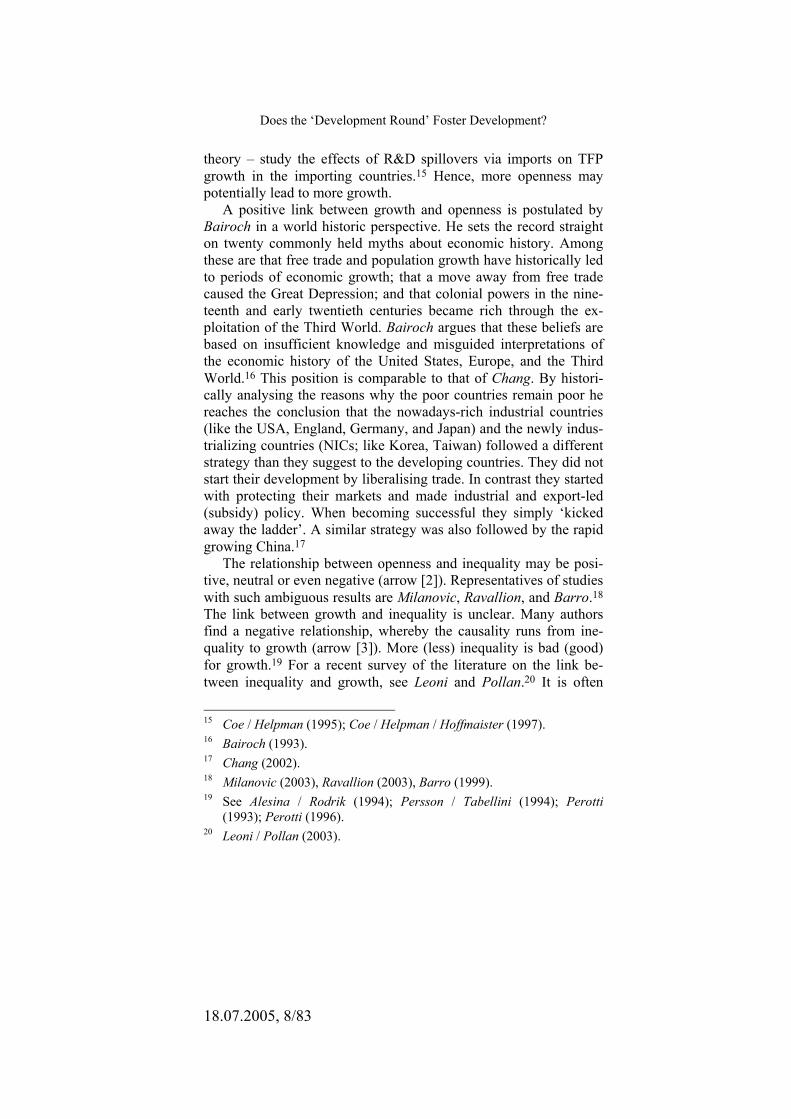
In a less simplistic view it is found that openness is not a choice variable and its effects on poverty reductions are ambiguous and complex (see Figure 2). Many authors, such as Rodríguez and Rodrik, O’Rourke, and Vamvakidis find that the link between open-ness and growth is not always positive (arrow [1] in Figure 2).14 Openness, however, may have a more indirect positive impact on growth via technology spill-overs. Coe and Helpman for the indus-trial countries and Coe, Helpman and Hoffmaister for the „North-South trade’ in particular – in line with the endogenous growth
12 Greenaway / Morgan / Wright (1998). 13 Dollar / Kraay (2001), Kuznets (1995). 14 Rodríguez / Rodrik (2001), O’Rourke (2000); Vamvakidis (1998).
Openness [policy variable]
Growth Inequality
Poverty
Negative (4)
No effect (3)
No effect (2) Positive (1)
Does the ‘Development Round’ Foster Development?
18.07.2005, 8/83
theory – study the effects of R&D spillovers via imports on TFP growth in the importing countries.15 Hence, more openness may potentially lead to more growth.
A positive link between growth and openness is postulated by Bairoch in a world historic perspective. He sets the record straight on twenty commonly held myths about economic history. Among these are that free trade and population growth have historically led to periods of economic growth; that a move away from free trade caused the Great Depression; and that colonial powers in the nine-teenth and early twentieth centuries became rich through the ex-ploitation of the Third World. Bairoch argues that these beliefs are based on insufficient knowledge and misguided interpretations of the economic history of the United States, Europe, and the Third World.16 This position is comparable to that of Chang. By histori-cally analysing the reasons why the poor countries remain poor he reaches the conclusion that the nowadays-rich industrial countries (like the USA, England, Germany, and Japan) and the newly indus-trializing countries (NICs; like Korea, Taiwan) followed a different strategy than they suggest to the developing countries. They did not start their development by liberalising trade. In contrast they started with protecting their markets and made industrial and export-led (subsidy) policy. When becoming successful they simply ‘kicked away the ladder’. A similar strategy was also followed by the rapid growing China.17
The relationship between openness and inequality may be posi-tive, neutral or even negative (arrow [2]). Representatives of studies with such ambiguous results are Milanovic, Ravallion, and Barro.18 The link between growth and inequality is unclear. Many authors find a negative relationship, whereby the causality runs from ine-quality to growth (arrow [3]). More (less) inequality is bad (good) for growth.19 For a recent survey of the literature on the link be-tween inequality and growth, see Leoni and Pollan.20 It is often
15 Coe / Helpman (1995); Coe / Helpman / Hoffmaister (1997). 16 Bairoch (1993). 17 Chang (2002). 18 Milanovic (2003), Ravallion (2003), Barro (1999). 19 See Alesina / Rodrik (1994); Persson / Tabellini (1994); Perotti
(1993); Perotti (1996). 20 Leoni / Pollan (2003).

Fritz Breuss
18.07.2005, 9/83
claimed – not only by globalization critiques – that growth may have a negative impact on poverty, meaning more growth is con-nected with greater poorness (arrow [4]). Even if trade liberaliza-tion results in aggregate welfare gains over all households, it is possible that the poorest households could lose. Harrison, Ruther-ford and Tarr demonstrate with a computable general equilibrium (CGE) model two approaches to designing trade liberalization in Turkey which ensure that the poor will not lose. The first approach uses direct compensation to losers. The second approach uses lim-ited policy reform, where exceptions to the across-the board reform are chosen to meet the equity goal. In each case, the authors map out some of the efficiency costs of attaining these equity [nicht ‘equality’?] goals so as to inform policy makers about the least costly way of attaining them.21
Anderson et al. evaluate the fear that China’s accession to WTO will impoverish its farmers via greater import competition in its agricultural markets. Results of simulations with the GTAP CGE world model suggest that farm/no-farm income inequality may well rise within China but rural-urban income inequality need not.22
Figure 2: A Less Simplistic View: Openness is not a Choice Vari-able and its Effects on Poverty Reduction are Ambiguous and Complex Source: Milanovic (2002)
21 Harrison / Rutherford / Tarr (2003). 22 Anderson et al. (2004).
Openness [not fully a choice
variable]
Growth Inequality
Poverty
Positive (5)
Negative, positive or neutral (2)
Unclear
Negative (3)
Negative (4)
Not always positive (1)
Does the ‘Development Round’ Foster Development?
18.07.2005, 10/83
2 . Wha t De te rmines the Huge Income Di f f e rences in the Wor ld?
In a comprehensive study, Rodrik, Subramanian and Trebbi as well as Rodrik estimate the respective contributions of institutions, geography, and trade in determining income levels around the world. Their results indicate that the quality of institutions ‘trumps’ everything else. Once institutions are controlled for, measures of geography have at best weak direct effects on incomes; also trade is almost always insignificant, and often enters the income equations with the ‘wrong’ (i.e., negative) sign.23
In the voluminous literature on the determinants of the huge in-come differences in the world (average income levels in the world’s richest and poorest nations differ by a factor of more than 100), three strands of thoughts stand out:24 1) Geography: Geography is a key determinant of climate, endow-
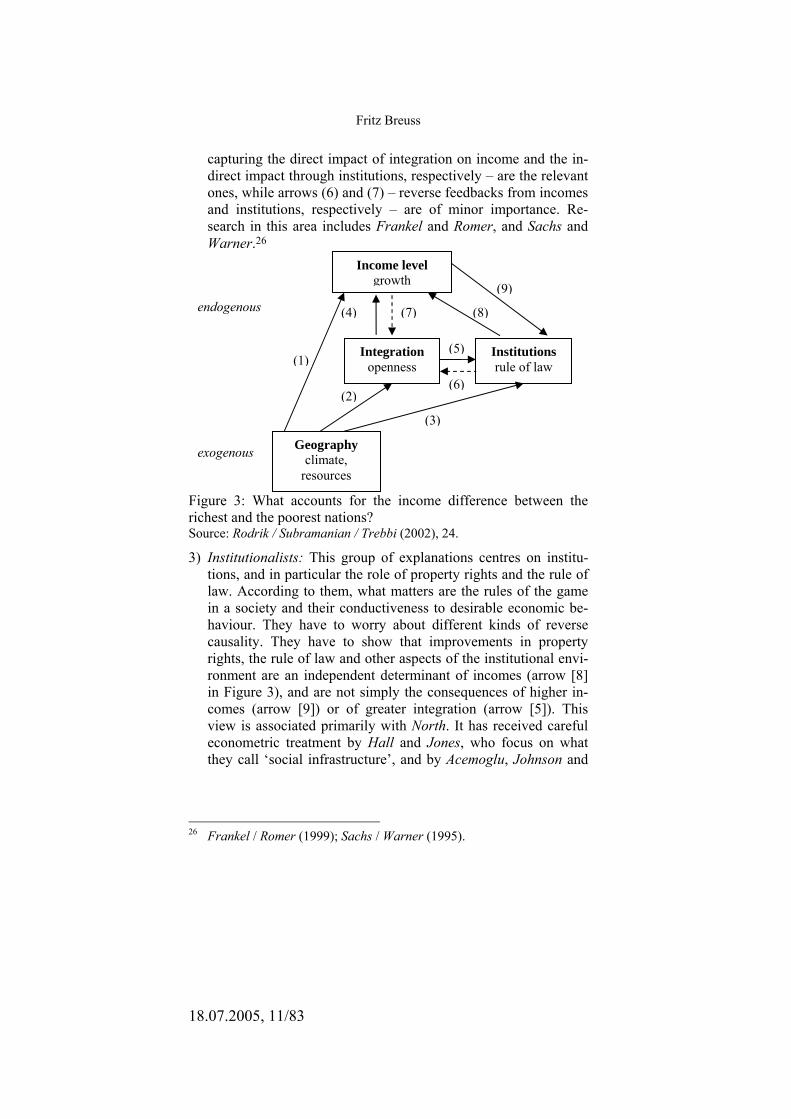
ment of natural resources, disease burden, transport costs, and diffusion of knowledge and technology from more advanced ar-eas. Geography has a direct effect on incomes, through its effect on agricultural productivity and morbidity. This is shown with arrow (1) in Figure 3. It may also have an indirect effect through its impact on distance from markets and the extent of integration (arrow [2]) or its impact on the quality of domestic institutions (arrow [3]). As geography is as exogenous a determinant as an economist can ever hope to get, it is easiest to identify the cau-sality. Representatives of this school are Diamond; Gallup, Sachs and Mellinger, and Sachs.25
2) Integration view: Another camp emphasizes the role of interna-tional trade as a driver of productivity change. This view (also identified as trade fundamentalists) gives market integration, and impediments thereof, a starring role in fostering economic con-vergence between rich and poor regions of the world. This school and also the third school of institutionalists have it harder, since they have to demonstrate the causality of their pre-ferred determinants, as well as identify the effective channels through which it works (see Figure 3). For the trade fundamen-talists the task consists of showing that arrows (4) and (5) –
23 Rodrik / Subramanian / Trebbi (2002); Rodrik (2003a); Rodrik (2003b). 24 See Rodrik / Subramanian / Trebbi (2002), 1-5. 25 Diamond (1997); Gallup / Sachs / Mellinger (1998); Sachs (2001).
Fritz Breuss
18.07.2005, 11/83
capturing the direct impact of integration on income and the in-direct impact through institutions, respectively – are the relevant ones, while arrows (6) and (7) – reverse feedbacks from incomes and institutions, respectively – are of minor importance. Re-search in this area includes Frankel and Romer, and Sachs and Warner.26
Figure 3: What accounts for the income difference between the richest and the poorest nations? Source: Rodrik / Subramanian / Trebbi (2002), 24.
3) Institutionalists: This group of explanations centres on institu-tions, and in particular the role of property rights and the rule of law. According to them, what matters are the rules of the game in a society and their conductiveness to desirable economic be-haviour. They have to worry about different kinds of reverse causality. They have to show that improvements in property rights, the rule of law and other aspects of the institutional envi-ronment are an independent determinant of incomes (arrow [8] in Figure 3), and are not simply the consequences of higher in-comes (arrow [9]) or of greater integration (arrow [5]). This view is associated primarily with North. It has received careful econometric treatment by Hall and Jones, who focus on what they call ‘social infrastructure’, and by Acemoglu, Johnson and
26 Frankel / Romer (1999); Sachs / Warner (1995).
Income level growth
Integration openness
(7)(4)
Institutions rule of law
(9)
(8)
Geography climate,
resources
(1)
(3)
(2)
(5)
(6)
endogenous
exogenous
Does the ‘Development Round’ Foster Development?
18.07.2005, 12/83
Robinson, who focus on the expropriation risk that current and potential investors face.27
Growth theory has traditionally focused on physical and human capital accumulation, and, in its endogenous growth variant, on technological change. But long-term economic development is a very complex phenomenon, which cannot easily be explained by any one of the above determinants. Therefore Rodrik, in line with historians and many social scientists prefers nuanced, layered ex-planations of centuries of economic history, where the factors of the three schools interact with human choices and many other not-so-simple twists and turns of fate.28
As is indicated in Figure 3, the extent to which an economy is integrated with the rest of the world and the quality of its institu-tions are both endogenous, shaped potentially not just by each other and by geography, but also by income levels. Problems of endoge-neity and reverse causality plague any empirical researcher trying to make sense of the relationships among these factors.
Rodrik, Subramanian and Trebbi estimate the following equa-tion:29
iiiii GEOINTINSy εγβαµ ++++=log (1) where yi is income per capita (in Purchasing-Power-Parity in
US$, PPP GDP, in 1995) in country i, INSi, INTi, and GEOi are respectively measures for institutions,30 integration (measured by openness = ratio of nominal imports plus exports to GDP), and geography (distance from equator of capital city), and εi is the ran-dom error term. The authors are interested in the size, sign, and significance of the three coefficients a, b, and g. Three country samples are used, one with 64, one with 80, and one with 140 countries. First, there is a clear and unambiguously positive rela-tionship between income and its possible three determinants. Also the OLS (one stage least-square) estimation of equation (1) results in the correct (positive) sings for all three indicators – institutions, openness, and geography. This suggests that countries with stronger 27 North (1990); Hall / Jones (1999); Acemoglu / Johnson / Robinson
(2001). 28 Rodrik (2003b). 29 Rodrik / Subramanian / Trebbi (2002), 6. 30 Institutional quality measure by Kaufman / Kraay / Zoido-Lobaton
(2002).
Fritz Breuss
18.07.2005, 13/83
institutions, more open economies, and more distant from the equator (measure of geography) are likely to have higher levels of income. However, if one takes into account the possibility of re-verse causality, omitted variables bias, and measurement errors, equation (1) cannot be interpreted as causal or accurate. To address these problems, the authors employ a two-stage least squares esti-mation procedure, using instruments to determine the variables INSi and INTi, respectively. As a result, once the institutional variable is added, geography and openness do not have any additional power in explaining growth and hence development. Institutions trump geography and openness. The importance of institution building for development is also stressed by the World Bank.31
B. Is WTO Membership Good for Trade at All? In provocative papers, Rose asserts that WTO membership does
not stimulate trade. He estimates the effect on international trade of multilateral trade agreements: the World Trade Organization (WTO), its predecessor the General Agreement on Tariffs and Trade (GATT), and the Generalized System of Preferences (GSP) extended from rich countries to developing countries. He uses a standard ‘gravity’ model of bilateral merchandise trade and a large panel data set covering over fifty years and 175 countries. An ex-tensive search reveals little evidence that countries joining or be-longing to the GATT/WTO have very different trade patterns than outsiders. The GSP does seem to have a strong effect, and is associ-ated with an approximate doubling of trade.32
To estimate the effects of international institutions on trade, Rose uses the following specification of the gravity model:33
+++= tjiijtij YYDX )ln(ln)ln( 210 βββ
++++ tijijtjiji FTALangPopPopYY )()/ln( 543 βββ ++++ tijtijtij WTOGSPCU )()()( 876 βββ
ijttijtij DummiesOECDIMF εββ ++++ )()( 109 (2) where i and j and denote trading partners, t denotes time, and the variables are defined as follows: Xij denotes the average value of real bilateral trade between countries i and j; Y is real GDP; Pop is
31 World Bank (2002), chapter 3. 32 Rose (2003); Rose (2004). 33 Rose (2003), 5-6.
Does the ‘Development Round’ Foster Development?
18.07.2005, 14/83
population; D is the distance between i and j; Lang is a binary ‘dummy’ variable which is unity if i and j have a common language and zero otherwise; FTA is a binary variable which is unity if i and j both belong to the same regional trade agreement (e.g. EU coun-tries); CU is a binary variable which is unity if i and j use the same currency (‘currency union’) at t; GSP is a binary variable which is unity if i extended a GSP concession to j at t or vice versa; WTO is a binary variable which is unity if i and j are GATT/WTO members at t; IMF is a binary variable which is unity if i and j are IMF mem-bers at t; OECD is a binary variable which is unity if i and j are OECD members at t; Dummies represent all the additional variables used in the gravity model, such as sharing a land border, landlocked countries, islands, area of countries in square kilometres, colony countries, colonizer countries, fixed effects etc.; εij represents the omitted other influences on bilateral trade.
Rose finds the following benchmark results (OLS estimation; using other estimation techniques the key results remain quite ro-bust): Distance (in the geographic, linguistic, monetary, and histori-cal senses) reduces trade, while greater economic ‘mass’ (real GDP and/or GDP per capita) expands it. The effects are economically and statistically significant.34 The coefficients of interest concern the effects of membership in international organizations; what do they reveal? There are two surprises; one negative and one positive. The negative surprise is that membership in neither the GATT/WTO nor the IMF is associated with deeper trade. Indeed, the point estimates for all four coefficients (both or one of the countries being in the GAT/WTO or IMF) are negative. The other surprise is the effect of OECD membership on trade that appears to be strong and positive. The estimations suggest that trade between one OECD member and another is 55% higher (between one OECD member and a non-member is 49% higher). Belonging to a regional free trade arrangement (NAFTA, EFTA, EU etc.) leads to trade creation by a considerable amount. According to Rose’s estimates bilateral trade between FTA members may rise by around 200%.35 In contrast to GATT/WTO membership, the extension of the GSP from one country to another (which primarily concerns North-South trade) seems to have a large positive effect on trade. Trade may be
34 Rose (2004), 9-14. 35 222% in Rose (2003), and 232% in Rose (2004).

Fritz Breuss
18.07.2005, 15/83
raised to around hundred percent.36 Belonging to a currency union raises trade by around 200%.37 This is also good news for the EMU of the European Union.
In concluding, Rose finds his results puzzling in many respects. If WTO membership is irrelevant, why is it so attractive for many (also developing) countries to become members of WTO? Why should one care whether China is in the WTO? Anyhow, member-ship seems to be a big deal. Perhaps the GATT and WTO have large effects on income or welfare but only through mechanisms other than trade. Perhaps, he conjectures, the GATT and WTO have acted as an international public good, freeing trade for all countries independent of whether they are members or not.38 However, one cannot test this hypothesis, since there is no data for the counter-factual GATT-free world. It is an open question whether the liber-alization of world trade after World-War II would have happened without GATT. Anyway, estimates by Baier and Bergstrand indi-cate that post-war growth of world trade, although primarily stimu-lated by income growth, was nevertheless propelled by tariff reduc-tions.39 Similar results were found by Badinger and Breuss in a dynamic panel data approach to estimate the relative contributions of income growth, income convergence, and the reductions in tar-iffs and trade costs to the growth of intra-EU trade over the period 1960 to 2000.40 The results suggest that income growth was the major force, accounting for approximately two third of total growth. Trade liberalization still had a sizeable effect, accounting de facto for the rest of growth, while income convergence played only a minor role. Reductions in trade costs had no significant effect on the growth of intra-EU trade. Of course this leaves open the ques-tion whether this was due to the institution of GATT. Rose con-cludes by speculating that perhaps the GATT has not had much of an effect on trade, but the WTO will. Members of WTO use a more wide-reaching permanent framework to resolve disputes about trade in goods, services, and intellectual property.41
36 93% in Rose (2003), and 136% in Rose (2004). 37 194% in Rose (2003) and 206% in Rose (2004). 38 Rose (2004), 22-23. 39 Baier / Bergstrand (2001). 40 Badinger / Breuss (2004). 41 Rose (2004), 22.
Does the ‘Development Round’ Foster Development?
18.07.2005, 16/83
III. After Eight GATT Rounds - Markets Remain Still Subtly Protected: Market Access Issues
A. Patterns of Protection Even after eight GATT rounds of trade liberalization improving
market access is still an ‘unfinished business’.42 Despite low aver-age level of protection, agriculture and labour intensive industries carry a much higher level of protection than the average.
The IMF and the World Bank notice in this context that averages of most-favoured-nation (MFN) applied tariffs by importing coun-try or region provide an incomplete picture of protection.43 First, a number of barriers are not covered by the standard MFN databases, including specific tariffs (that is an absolute monetary value per unit of imports), tariff rate quotas (TRQs), prohibitions, contingent protection (refers to import barriers which, rather than being per-manent, are introduced on a temporary and often selective basis in response to certain events – import surges, alleged unfair trading practices), the costs of rules of origin, and environmental and tech-nical standards. Second, the averages do not capture the impact of tariff dispersion, in particular tariff peaks and escalation (interna-tional tariff peaks are defined as tariffs of 15 percent or higher; escalation refers to tariffs rising with the degree of processing of imports, and the resultant high levels of effective protection). Third, because of preference schemes (GSP) and differing export struc-tures, the barriers faced by exporters to the same market can vary widely. Finally, uncertainty about market access, related to contin-gent protection, interpretation of norms and procedures, and the discretionary nature of many preference schemes, may represent a further disincentive to exporters.
In the context of the DDA, WTO members are committed to ne-gotiations aimed at substantially improving market access for agri-cultural and industrial products,44 in particular for developing coun-tries in general and for the LDCs.45 There are a lot of subtle barriers 42 See WTO (2002). 43 IMF / The World Bank (2002), 11. 44 IMF / The World Bank (2002) studies in detail the problems of market
access for developing countries in the sectors agriculture and textiles and clothing.
45 See Doha Ministerial Declaration, paras. 13 and 16; WTO (2001). ‘Least-Developed Countries’ means 40 countries designated as such by
Fritz Breuss
18.07.2005, 17/83
to market access for developing countries. There remain ‘pockets of protection’ in products of particular interest to developing coun-tries.46
The patterns of protection the development countries are con-fronted with are characterized by the following features:47
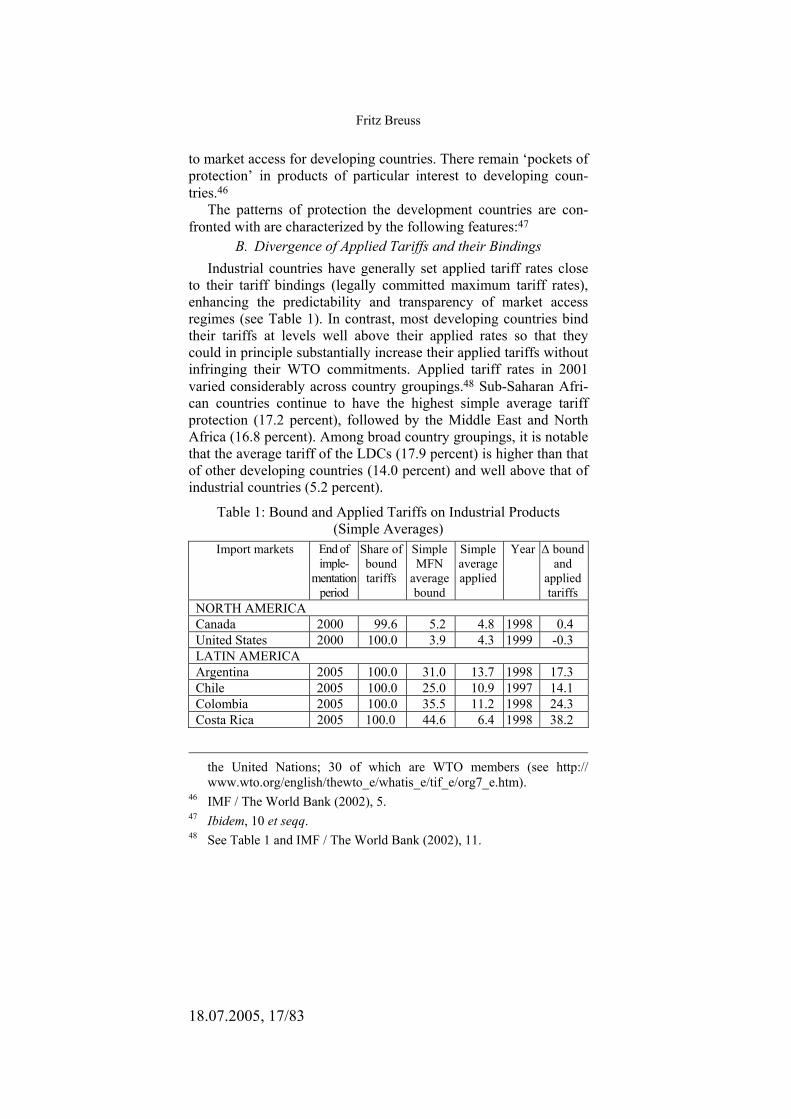
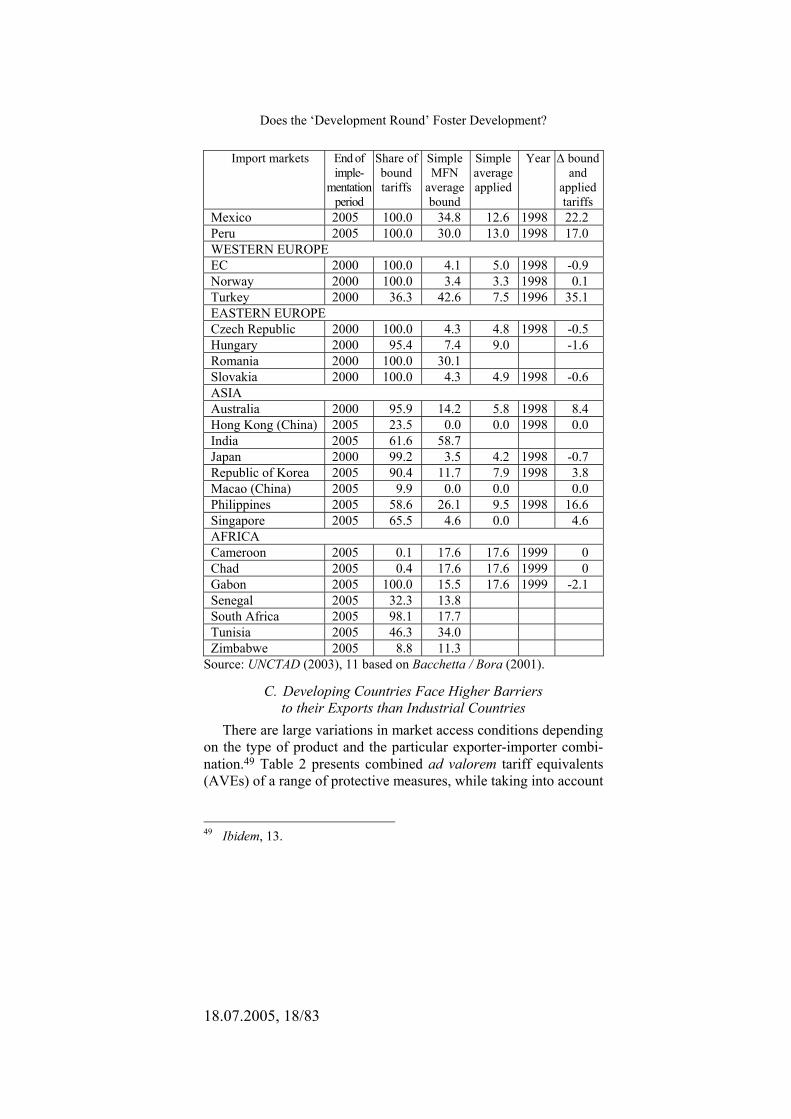
B. Divergence of Applied Tariffs and their Bindings Industrial countries have generally set applied tariff rates close
to their tariff bindings (legally committed maximum tariff rates), enhancing the predictability and transparency of market access regimes (see Table 1). In contrast, most developing countries bind their tariffs at levels well above their applied rates so that they could in principle substantially increase their applied tariffs without infringing their WTO commitments. Applied tariff rates in 2001 varied considerably across country groupings.48 Sub-Saharan Afri-can countries continue to have the highest simple average tariff protection (17.2 percent), followed by the Middle East and North Africa (16.8 percent). Among broad country groupings, it is notable that the average tariff of the LDCs (17.9 percent) is higher than that of other developing countries (14.0 percent) and well above that of industrial countries (5.2 percent).
Table 1: Bound and Applied Tariffs on Industrial Products (Simple Averages)
Import markets End of imple-
mentation period
Share of bound tariffs
Simple MFN
average bound
Simple average applied
Year ∆ bound and
applied tariffs
NORTH AMERICA Canada 2000 99.6 5.2 4.8 1998 0.4 United States 2000 100.0 3.9 4.3 1999 -0.3 LATIN AMERICA Argentina 2005 100.0 31.0 13.7 1998 17.3 Chile 2005 100.0 25.0 10.9 1997 14.1 Colombia 2005 100.0 35.5 11.2 1998 24.3 Costa Rica 2005 100.0 44.6 6.4 1998 38.2
the United Nations; 30 of which are WTO members (see http:// www.wto.org/english/thewto_e/whatis_e/tif_e/org7_e.htm).
46 IMF / The World Bank (2002), 5. 47 Ibidem, 10 et seqq. 48 See Table 1 and IMF / The World Bank (2002), 11.
Does the ‘Development Round’ Foster Development?
18.07.2005, 18/83
Import markets End of imple-
mentation period
Share of bound tariffs
Simple MFN
average bound
Simple average applied
Year ∆ bound and
applied tariffs
Mexico 2005 100.0 34.8 12.6 1998 22.2 Peru 2005 100.0 30.0 13.0 1998 17.0 WESTERN EUROPE EC 2000 100.0 4.1 5.0 1998 -0.9 Norway 2000 100.0 3.4 3.3 1998 0.1 Turkey 2000 36.3 42.6 7.5 1996 35.1 EASTERN EUROPE Czech Republic 2000 100.0 4.3 4.8 1998 -0.5 Hungary 2000 95.4 7.4 9.0 -1.6 Romania 2000 100.0 30.1 Slovakia 2000 100.0 4.3 4.9 1998 -0.6 ASIA Australia 2000 95.9 14.2 5.8 1998 8.4 Hong Kong (China) 2005 23.5 0.0 0.0 1998 0.0 India 2005 61.6 58.7 Japan 2000 99.2 3.5 4.2 1998 -0.7 Republic of Korea 2005 90.4 11.7 7.9 1998 3.8 Macao (China) 2005 9.9 0.0 0.0 0.0 Philippines 2005 58.6 26.1 9.5 1998 16.6 Singapore 2005 65.5 4.6 0.0 4.6 AFRICA Cameroon 2005 0.1 17.6 17.6 1999 0 Chad 2005 0.4 17.6 17.6 1999 0 Gabon 2005 100.0 15.5 17.6 1999 -2.1 Senegal 2005 32.3 13.8 South Africa 2005 98.1 17.7 Tunisia 2005 46.3 34.0 Zimbabwe 2005 8.8 11.3
Source: UNCTAD (2003), 11 based on Bacchetta / Bora (2001).
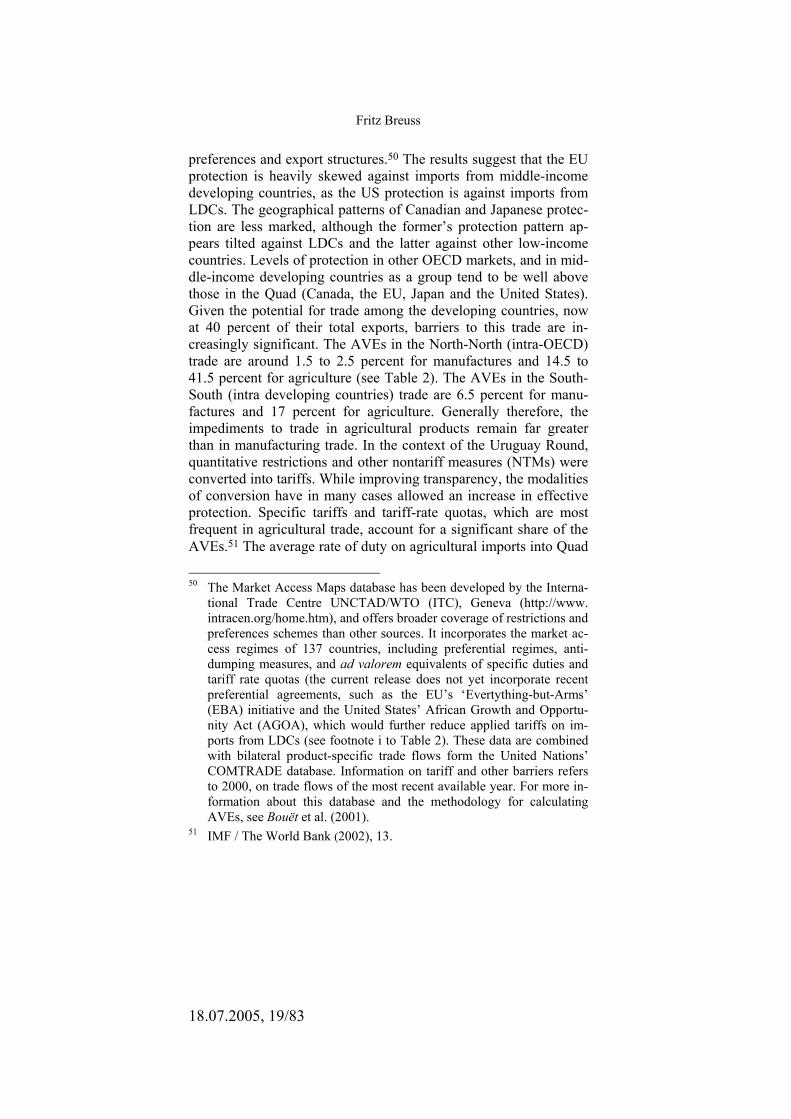
C. Developing Countries Face Higher Barriers to their Exports than Industrial Countries
There are large variations in market access conditions depending on the type of product and the particular exporter-importer combi-nation.49 Table 2 presents combined ad valorem tariff equivalents (AVEs) of a range of protective measures, while taking into account
49 Ibidem, 13.
Fritz Breuss
18.07.2005, 19/83
preferences and export structures.50 The results suggest that the EU protection is heavily skewed against imports from middle-income developing countries, as the US protection is against imports from LDCs. The geographical patterns of Canadian and Japanese protec-tion are less marked, although the former’s protection pattern ap-pears tilted against LDCs and the latter against other low-income countries. Levels of protection in other OECD markets, and in mid-dle-income developing countries as a group tend to be well above those in the Quad (Canada, the EU, Japan and the United States). Given the potential for trade among the developing countries, now at 40 percent of their total exports, barriers to this trade are in-creasingly significant. The AVEs in the North-North (intra-OECD) trade are around 1.5 to 2.5 percent for manufactures and 14.5 to 41.5 percent for agriculture (see Table 2). The AVEs in the South-South (intra developing countries) trade are 6.5 percent for manu-factures and 17 percent for agriculture. Generally therefore, the impediments to trade in agricultural products remain far greater than in manufacturing trade. In the context of the Uruguay Round, quantitative restrictions and other nontariff measures (NTMs) were converted into tariffs. While improving transparency, the modalities of conversion have in many cases allowed an increase in effective protection. Specific tariffs and tariff-rate quotas, which are most frequent in agricultural trade, account for a significant share of the AVEs.51 The average rate of duty on agricultural imports into Quad
50 The Market Access Maps database has been developed by the Interna-
tional Trade Centre UNCTAD/WTO (ITC), Geneva (http://www. intracen.org/home.htm), and offers broader coverage of restrictions and preferences schemes than other sources. It incorporates the market ac-cess regimes of 137 countries, including preferential regimes, anti-dumping measures, and ad valorem equivalents of specific duties and tariff rate quotas (the current release does not yet incorporate recent preferential agreements, such as the EU’s ‘Evertything-but-Arms’ (EBA) initiative and the United States’ African Growth and Opportu-nity Act (AGOA), which would further reduce applied tariffs on im-ports from LDCs (see footnote i to Table 2). These data are combined with bilateral product-specific trade flows form the United Nations’ COMTRADE database. Information on tariff and other barriers refers to 2000, on trade flows of the most recent available year. For more in-formation about this database and the methodology for calculating AVEs, see Bouët et al. (2001).
51 IMF / The World Bank (2002), 13.

Does the ‘Development Round’ Foster Development?
18.07.2005, 20/83
markets from LDCs, excluding specific tariffs and effect of tariff-rate quotas, is 1.7 percent.52 Ad valorem tariff equivalents (not cov-ering domestic measures of support or the effect of export subsi-dies) of middle-income developing countries are broadly compara-ble with those of the Quad (see Table 2).
Table 2: Effective Ad-Valorem Tariff Equivalents on Bilateral Trade Flowsi)ii)
Exporters
Importers
LDCs Other Low-Income
Countries
Middle-Income
Countries
All Deve-loping
Countries
OECD
Total Trade Canada 6.7 5.4 4.4 4.4 - EU 2.8 7.0 10.3 7.2 - Japan 4.9 6.4 4.5 4.7 - USA 13.6 6.2 3.6 4.5 - Other OECD Countries
8.7 13.1 10.4 10.2 -
Developing Countries
- - - 7.5 -
Middle Income Countries
8.1 11.9 12.7 - -
Trade in Agriculture Canada 3.4 18.7 16.3 17.5 33.7 EU 7.6 13.4 24.8 20.0 41.6 Japan 29.1 16.3 21.2 21.9 28.3 USA 28.1 9.5 13.0 12.7 14.5 Other OECD Countries
19.6 28.0 35.4 32.5 42.1
Developing Countries
- - - 17.0 14.5
Middle Income Countries
18.2 18.4 23.1 - -
Trade in Manufactures Canada 7.7 4.2 2.0 2.9 2.0 EU 0.0 5.7 5.5 4.5 2.5 Japan 0.1 5.0 1.4 2.5 1.2 USA 8.0 5.9 2.1 3.6 1.6 Other OECD Countries
5.0 10.8 5.7 7.4 7.4
52 See Bacchetta / Bora (2002).
Fritz Breuss
18.07.2005, 21/83
Exporters
Importers
LDCs Other Low-Income
Countries
Middle-Income
Countries
All Deve-loping
Countries
OECD
Developing Countries
- - - 6.4 6.9
Middle Income Countries
6.0 11.1 10.9 - -
Source: IMF / The World Bank (2002), 12, based on ITC.iii) i) The information in the table does not yet reflect the EU’s EBA initia-
tive and the United States’ AGOA. Taking account of the former would reduce AVEs on EU agricultural imports from LDCs signifi-cantly, though not to zero (restrictions remain on sugar, rice and ba-nanas for a transition period). AGOA would lower AVEs on both agri-cultural and manufactured imports into the United States for some Af-rican LDCs and low-income countries, but the extent of the reduction is hard to predict.
ii) The protection levels of importing countries in this table are weighted by the imports of the reference group this country belongs to, with the grouping criteria being GDP per capita. This is done to minimize the potential endogeneity bias of using national import weights (a high tariff can limit imports, and in the extreme could carry zero weight if its level is prohibitive).
iii) For the methodology in calculating AVEs, see Bouët et al. (2001).
D. Tariff Peaks and Tariff Escalation As far as the current pattern of protection is concerned, tariff
barriers to exports from developing countries appear to be heavily concentrated in agriculture, textiles and clothing, and other sectors of export interest to developing countries. The post-Uruguay Round protection pattern is characterized by a high dispersion in tariff rates, with a large number of tariff peaks concerning products of interest to developing countries in agriculture, food, textiles, ap-parel and some mid-technology products. Tariff escalation also affects trade flows in a number of products of interest to developing countries. It is a pervasive feature in both developed and developing countries and concerns both agricultural and industrial goods.53
Even tariffs are sometimes applied as specific or mixed rates or tariff rate quotas, whose ad valorem or percentage equivalents can be difficult to estimate. Tariff duties are sometimes waived under a
53 UNCTAD (2003), VIII.
Does the ‘Development Round’ Foster Development?
18.07.2005, 22/83
variety of national schemes. Non-tariff barriers (NTBs) are inher-ently complex, they have multiple effects and their incidence varies across time and trade partners. The UNCTAD reports that reduc-tions of tariff rates have gone together with the reduced use of NTBs.54
Participation in the WTO has been a mixed experience for the developing countries, providing benefits and also challenges. On the one hand it means an improved and more secure access to third country markets. On the other hand it entails taking on an increas-ing level of obligations, including market opening and the applica-tion of WTO rules.
The future challenge – in particular vis-à-vis the developing countries – is the mitigation of the problem of tariff peaks and tariff escalation. All important world-trade related international institu-tions identify the reduction (phasing out) of tariff peaks and tariff escalation as the most important issue to increase market access for the developing world.55
1 . Ta r i f f Peaks While negotiations on reducing trade barriers and support meas-
ures in agriculture are part of the ‘built-in-agenda’ established dur-ing the Uruguay Round, market access in industrial products was added to the negotiating agenda in Doha. WTO members, acknowl-edging the importance of enhanced market access for developing countries, started to negotiate on the reduction or elimination of tariff peaks, high tariffs and tariff escalation. It was pointed out that ‘tariff peaks’ and ‘high tariffs’ are not defined in the WTO.56 Fol-lowing the practice of the OECD, tariff peaks may be defined as rates that are more than three times the national average.57 IMF and World Bank define international tariff peaks as tariffs of 15 percent or higher.58 It is widely agreed among trade economists that a rela-tively uniform or flat tariff structure is preferable to one exhibiting considerable dispersion. At least two reasons are advanced in fa-vour of a flat tariff structure. First, the costs in terms of welfare and 54 Ibidem, 13. 55 See European Commission (2002), 83; IMF / The World Bank, (2002),
5, 20; UNCTAD (2003), 16 et seqq.; WTO (2003), XIX, 45, 61. 56 UNCTAD (2003), 18. 57 OECD (1997). 58 IMF / The World Bank (2002), 11.

Fritz Breuss
18.07.2005, 23/83
economic efficiency of a tariff regime increase as the degree of dispersion increases. Tariff peaks increase the economic ineffi-ciency stemming from protection, as it hampers the exploitation of increasing returns to scale across different markets, while reducing competition and specialization according to comparative advantage.
Second, political economy arguments support a flat tariff struc-ture. Uniform tariff rates are more transparent and easier to admin-ister than non-uniform tariffs, and are less likely to be determined by the relative political power of domestic industries. Finding a formula to reduce tariff peaks is therefore highly desirable.59
The UNCTAD gives a comprehensive picture on the problems of tariff peaks in agriculture and manufactures. The incidence of international tariff peaks is calculated by comparing each tariff line with a 15 percent benchmark. This gives an indicator for interna-tional peaks. They are more frequent in developing (22.5%) than in developed countries (OECD, 7.3%). The international tariff peaks for manufactured exports from developing countries are highest in South Asia (55.12%) and Sub-Saharan Africa (31%) and Latin America (28.4%), followed by Asian NICs (19.7%) and North Af-rica and Middle East (10.8%).60
59 See UNCTAD (2003), 19. 60 Ibidem, 19-25.
Does the ‘Development Round’ Foster Development?
18.07.2005, 24/83
0
2
4
6
8
10
12
14
16
18
Prim
ary
prod
ucts
Oth
er re
sour
ce-b
ased
man
ufac
ture
s
Low
tech
nolo
gy,
text
ile/fa
shio
n cl
uste
r
Med
ium
tech
nolo
gy,
proc
ess i
ndus
tries
Hig
h te
chno
logy
,el
ectro
nic/
elec
tgric
al p
rodu
cts
Oth
er
CanadaEUJapanUnited States
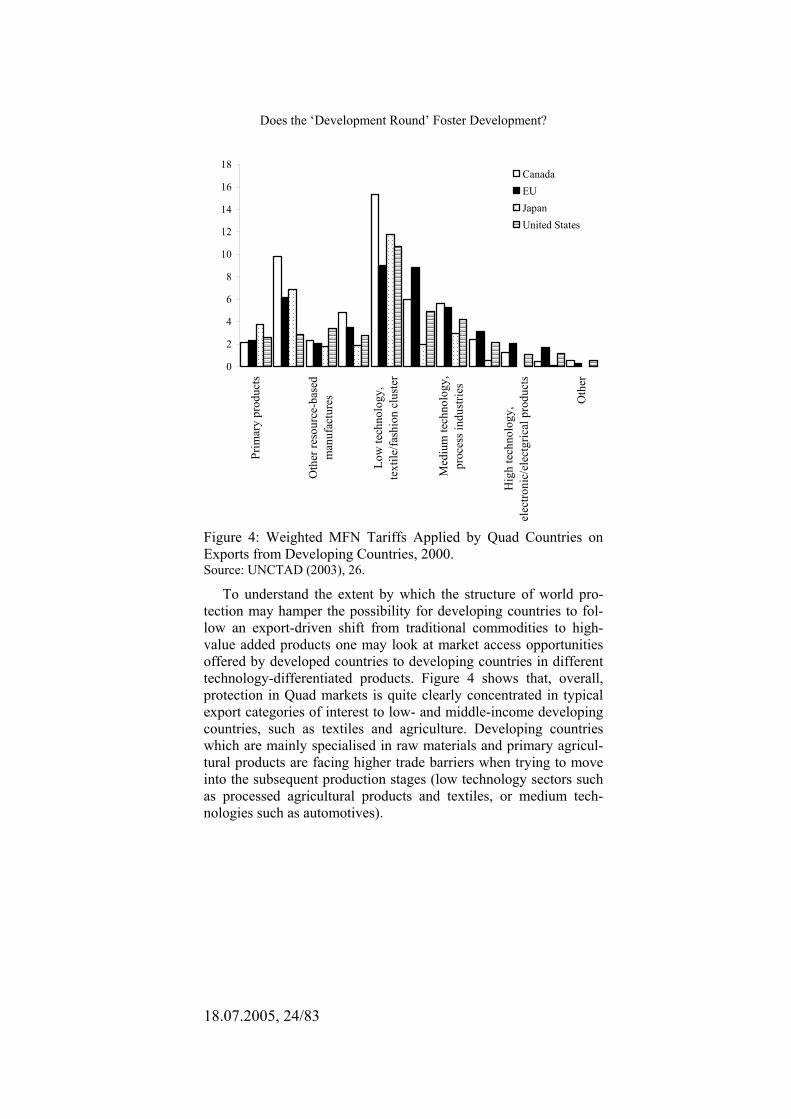
Figure 4: Weighted MFN Tariffs Applied by Quad Countries on Exports from Developing Countries, 2000. Source: UNCTAD (2003), 26.
To understand the extent by which the structure of world pro-tection may hamper the possibility for developing countries to fol-low an export-driven shift from traditional commodities to high-value added products one may look at market access opportunities offered by developed countries to developing countries in different technology-differentiated products. Figure 4 shows that, overall, protection in Quad markets is quite clearly concentrated in typical export categories of interest to low- and middle-income developing countries, such as textiles and agriculture. Developing countries which are mainly specialised in raw materials and primary agricul-tural products are facing higher trade barriers when trying to move into the subsequent production stages (low technology sectors such as processed agricultural products and textiles, or medium tech-nologies such as automotives).

Fritz Breuss
18.07.2005, 25/83
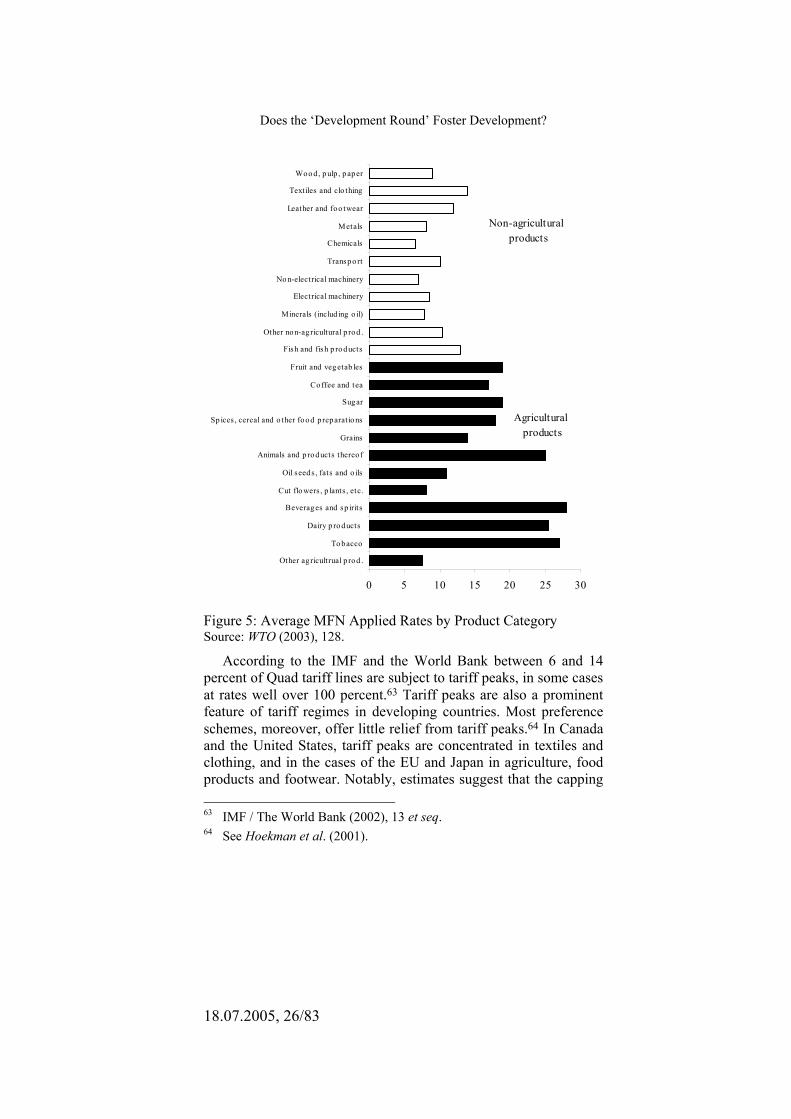
According the World Trade report of the WTO the average ap-plied tariff across 23 categories used during the Uruguay Round shows that the average tariff in the agricultural categories is higher than that in most of the industrial categories (see Figure 5). The highest rates are applied to animals, beverages and spirits, dairy products and tobacco. In general the pattern of protection is lower on lower value-added products such as cut flowers, fruits and vegetables, coffee and tea.61
According to the report the incidence of high tariffs in agricul-tural products poses a particular challenge to negotiations. Further-more, some developed countries have insulated sensitive sectors from international trade reform: the United States (peanuts), Canada (dairy and poultry), Japan (rice) and the Republic of Korea (rice).62
61 WTO (2003). 62 Ibidem, 128.
Does the ‘Development Round’ Foster Development?
18.07.2005, 26/83
0 5 10 15 20 25 30
Other ag ricultrual p rod .
To bacco
Dairy p ro ducts
Beverag es and sp irits
Cut flo wers , p lants , etc.
Oil seed s , fats and o ils
Animals and p ro ducts thereo f
Grains
Sp ices , cereal and o ther fo od p reparatio ns
Sugar
Co ffee and tea
Fruit and veg etab les
Fish and fish p ro ducts
Other non-ag ricultural p rod .
Minerals (includ ing o il)
Electrical machinery
No n-electrical machinery
Transpo rt
Chemicals
Metals
Leather and foo twear
Text iles and clo thing
Woo d , p ulp , p aper
Non-agricultural products
Agricultural products
Figure 5: Average MFN Applied Rates by Product Category Source: WTO (2003), 128.
According to the IMF and the World Bank between 6 and 14 percent of Quad tariff lines are subject to tariff peaks, in some cases at rates well over 100 percent.63 Tariff peaks are also a prominent feature of tariff regimes in developing countries. Most preference schemes, moreover, offer little relief from tariff peaks.64 In Canada and the United States, tariff peaks are concentrated in textiles and clothing, and in the cases of the EU and Japan in agriculture, food products and footwear. Notably, estimates suggest that the capping 63 IMF / The World Bank (2002), 13 et seq. 64 See Hoekman et al. (2001).

Fritz Breuss
18.07.2005, 27/83
of all peaks at the threshold of 15 percent would reduce AVEs in textiles and clothing by around 20 percent for imports from most source countries into the United States, and by 59 percent for im-ports from China. In agriculture and food products, they would decline by 40-60 percent on imports into the EU.65 According to simulations by Hoekman et al. full duty and quota free access for LDCs in the Quad for tariff peak products would result in a 11 per-cent increase in their total exports – on the order of $ 2.5 billion. Exports to Quad countries of tariff peak products would expand by 30 to 60 percent.66 Given that LDC exports on tariff peak items account for only a small share of total developing country exports, granting LDCs duty free access would have a negligible impact on other developing countries. For the same reason, Quad imports increase only marginally, suggesting that this should not be a factor constraining implementation of duty free access for the poorest countries.
Most developing countries enjoy preferential access to Quad markets, either through unilateral schemes such as the GSP,67 or through free trade agreements such as NAFTA or EU Association Agreements. In the case of Canada, Japan and the EU, around 170 developing countries benefit from GSP (or better) preferences. In the case of the US, 29 developing countries are excluded from GSP, so that only 140 developing countries benefit from some sort of preferential access. Preferences granted by the Quad are of a cas-cading nature.68 Countries with FTAs generally get the best treat-ment, followed by LDCs and other developing countries (see Table 3). The US grants preferences to the members of the Andean Pact (ATP) and the Caribbean countries (CAR), and to Mexico under NAFTA. For the EU, in Table 3 both Lomé preferences (ACP), and the FTA preferences granted to Eastern Europe (Europe Agree-ments) and Mediterranean countries are reported. In the case of the EU three different groups of countries are constructed: Non-ACP LDCs; ACP countries (broken down into LDCs and non-LDCs); and non-ACP, non-LDC developing countries that benefit from 65 See Bouët et al. (2001). 66 Hoekman et al. (2001). 67 The EU was the first customs territory to grant GSP preferences to
developing countries in 1971. See Kennan / Stevens (1997) for a de-tailed description of the European GSP.
68 See Hoekman et al. (2001), 13.
Does the ‘Development Round’ Foster Development?
18.07.2005, 28/83
GSP treatment. Finally, in the case of Canada, developing countries are grouped into those benefiting from LDC, GSP, or Caribbean preferences, and Mexico and Chile that benefit from FTAs.
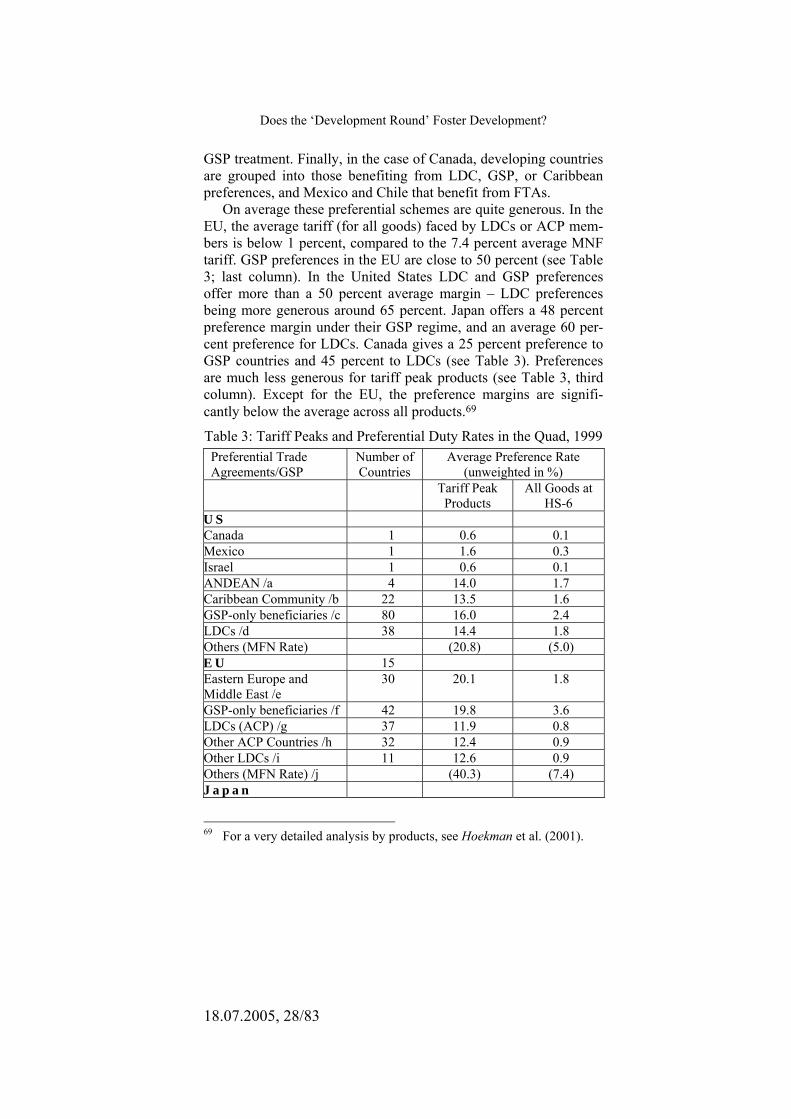
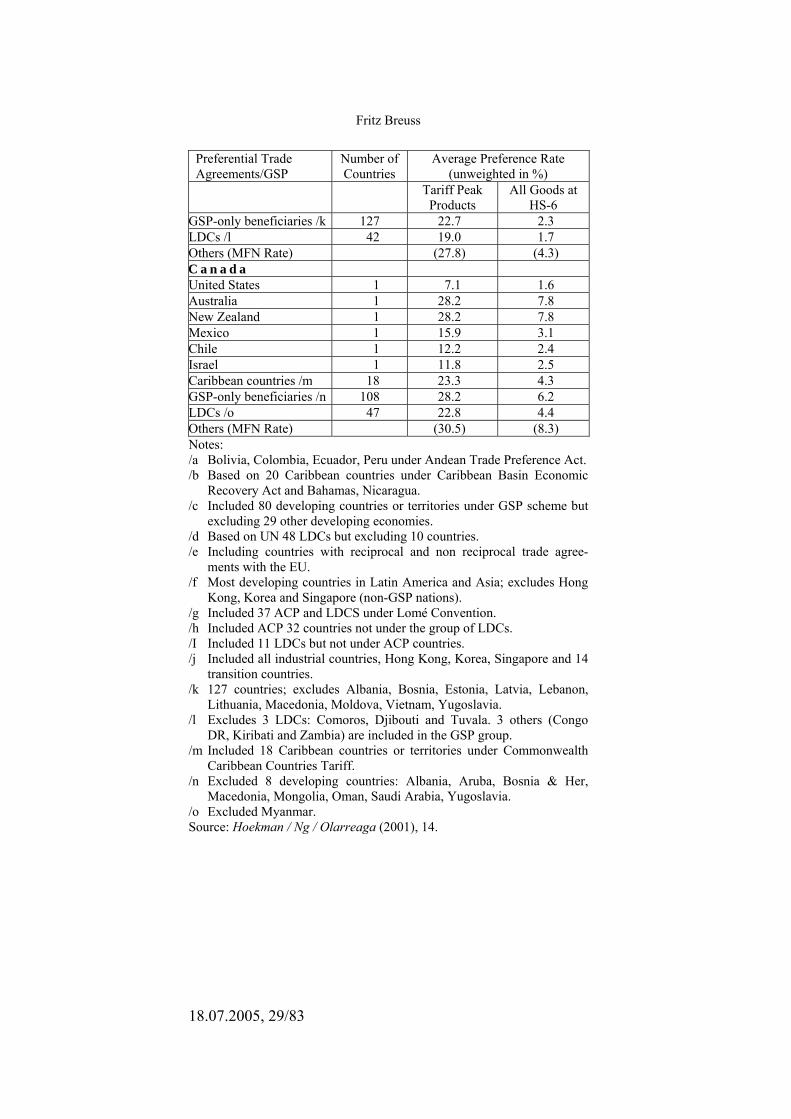
On average these preferential schemes are quite generous. In the EU, the average tariff (for all goods) faced by LDCs or ACP mem-bers is below 1 percent, compared to the 7.4 percent average MNF tariff. GSP preferences in the EU are close to 50 percent (see Table 3; last column). In the United States LDC and GSP preferences offer more than a 50 percent average margin – LDC preferences being more generous around 65 percent. Japan offers a 48 percent preference margin under their GSP regime, and an average 60 per-cent preference for LDCs. Canada gives a 25 percent preference to GSP countries and 45 percent to LDCs (see Table 3). Preferences are much less generous for tariff peak products (see Table 3, third column). Except for the EU, the preference margins are signifi-cantly below the average across all products.69
Table 3: Tariff Peaks and Preferential Duty Rates in the Quad, 1999 Preferential Trade Agreements/GSP
Number of Countries
Average Preference Rate (unweighted in %)
Tariff Peak Products
All Goods at HS-6
U S Canada 1 0.6 0.1 Mexico 1 1.6 0.3 Israel 1 0.6 0.1 ANDEAN /a 4 14.0 1.7 Caribbean Community /b 22 13.5 1.6 GSP-only beneficiaries /c 80 16.0 2.4 LDCs /d 38 14.4 1.8 Others (MFN Rate) (20.8) (5.0) E U 15 Eastern Europe and Middle East /e
30 20.1 1.8
GSP-only beneficiaries /f 42 19.8 3.6 LDCs (ACP) /g 37 11.9 0.8 Other ACP Countries /h 32 12.4 0.9 Other LDCs /i 11 12.6 0.9 Others (MFN Rate) /j (40.3) (7.4) J a p a n
69 For a very detailed analysis by products, see Hoekman et al. (2001).
Fritz Breuss
18.07.2005, 29/83
Preferential Trade Agreements/GSP
Number of Countries
Average Preference Rate (unweighted in %)
Tariff Peak Products
All Goods at HS-6
GSP-only beneficiaries /k 127 22.7 2.3 LDCs /l 42 19.0 1.7 Others (MFN Rate) (27.8) (4.3) C a n a d a United States 1 7.1 1.6 Australia 1 28.2 7.8 New Zealand 1 28.2 7.8 Mexico 1 15.9 3.1 Chile 1 12.2 2.4 Israel 1 11.8 2.5 Caribbean countries /m 18 23.3 4.3 GSP-only beneficiaries /n 108 28.2 6.2 LDCs /o 47 22.8 4.4 Others (MFN Rate) (30.5) (8.3) Notes: /a Bolivia, Colombia, Ecuador, Peru under Andean Trade Preference Act. /b Based on 20 Caribbean countries under Caribbean Basin Economic
Recovery Act and Bahamas, Nicaragua. /c Included 80 developing countries or territories under GSP scheme but
excluding 29 other developing economies. /d Based on UN 48 LDCs but excluding 10 countries. /e Including countries with reciprocal and non reciprocal trade agree-
ments with the EU. /f Most developing countries in Latin America and Asia; excludes Hong
Kong, Korea and Singapore (non-GSP nations). /g Included 37 ACP and LDCS under Lomé Convention. /h Included ACP 32 countries not under the group of LDCs. /I Included 11 LDCs but not under ACP countries. /j Included all industrial countries, Hong Kong, Korea, Singapore and 14
transition countries. /k 127 countries; excludes Albania, Bosnia, Estonia, Latvia, Lebanon,
Lithuania, Macedonia, Moldova, Vietnam, Yugoslavia. /l Excludes 3 LDCs: Comoros, Djibouti and Tuvala. 3 others (Congo
DR, Kiribati and Zambia) are included in the GSP group. /m Included 18 Caribbean countries or territories under Commonwealth
Caribbean Countries Tariff. /n Excluded 8 developing countries: Albania, Aruba, Bosnia & Her,
Macedonia, Mongolia, Oman, Saudi Arabia, Yugoslavia. /o Excluded Myanmar. Source: Hoekman / Ng / Olarreaga (2001), 14.
Does the ‘Development Round’ Foster Development?
18.07.2005, 30/83
2 . Ta r i f f Esca la t ion The practice of tariff escalation biases exports towards unproc-
essed resource-based commodities, characterized by low value-added. This may cause difficulties to commodity-dependent devel-oping countries in their attempt to diversify their export base. The pattern of protection creates particular hurdles for countries taking the first steps up the technology ladder. According to the IMF and the World Bank protection is relatively low for primary products, but increases sharply for low-technology, labor-intensive food processing and light industries, declines somewhat in the medium-technology range – such as automotive products – and is lowest at the upper end of the technology spectrum (see also Figure 4).70 In a snapshot of the post-Uruguay Round tariff levels by product and by processing stage in the Quad markets the UNCTAD study shows the following picture: First, with few exceptions, post-Uruguay Round tariffs escalate (that means increase between these catego-ries) not only between raw and semi-finished but also between semi-finished and finished goods.71
On average, the escalation in Canada and Japan and the EU is higher between raw and finished, while in the United States the highest average escalation is found between semi-finished and fin-ished goods. Tariffs tend to escalate not only in agriculture but also in manufacturing. The average post-Uruguay Round tariff for all industrial products ranges from 0.8 percent on raw materials to 4.8 percent on the finished product, resulting in an average tariff level of around 3 percent.
A more detailed analysis of tariff escalation, distinguishing be-tween markets of developing countries shows that tariff escalation is not just a feature of developed markets but is present in fact (sometimes even more prominently) in developing countries as well.72 As in the case of Quad countries, in most cases escalation in developing countries is greatest between raw and finished products. However, as in the case of the United States, in Asian NICs, there is de-escalation between raw and semi-finished products, and the highest escalation is found between semi-finished and finished products. Of course the pattern of escalation is different in the
70 IMF / The World Bank (2002), 14. 71 UNCTAD (2003), 27. 72 Ibidem, 28.
Fritz Breuss
18.07.2005, 31/83
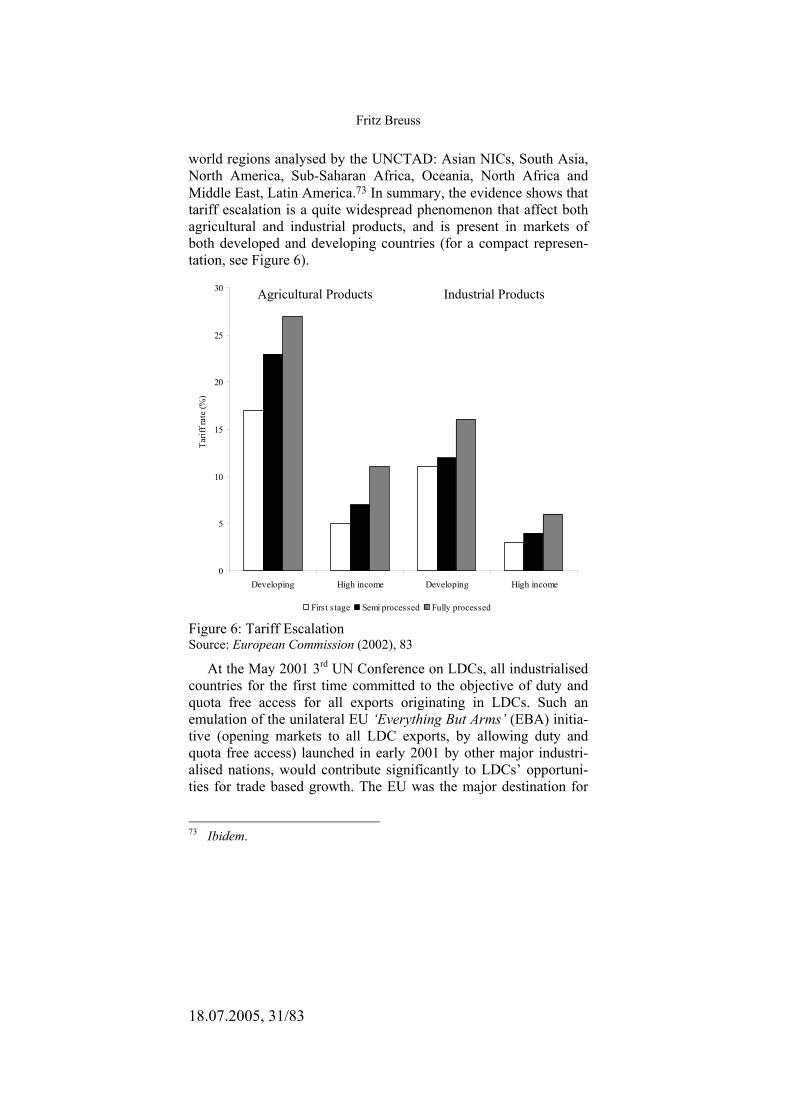
world regions analysed by the UNCTAD: Asian NICs, South Asia, North America, Sub-Saharan Africa, Oceania, North Africa and Middle East, Latin America.73 In summary, the evidence shows that tariff escalation is a quite widespread phenomenon that affect both agricultural and industrial products, and is present in markets of both developed and developing countries (for a compact represen-tation, see Figure 6).
0
5
10
15
20
25
30
Developing High income Developing High income
First stage Semi processed Fully processed
Tarif
f rat
e (%
)
Figure 6: Tariff Escalation Source: European Commission (2002), 83
At the May 2001 3rd UN Conference on LDCs, all industrialised countries for the first time committed to the objective of duty and quota free access for all exports originating in LDCs. Such an emulation of the unilateral EU ‘Everything But Arms’ (EBA) initia-tive (opening markets to all LDC exports, by allowing duty and quota free access) launched in early 2001 by other major industri-alised nations, would contribute significantly to LDCs’ opportuni-ties for trade based growth. The EU was the major destination for
73 Ibidem.
Agricultural Products Industrial Products
Does the ‘Development Round’ Foster Development?
18.07.2005, 32/83
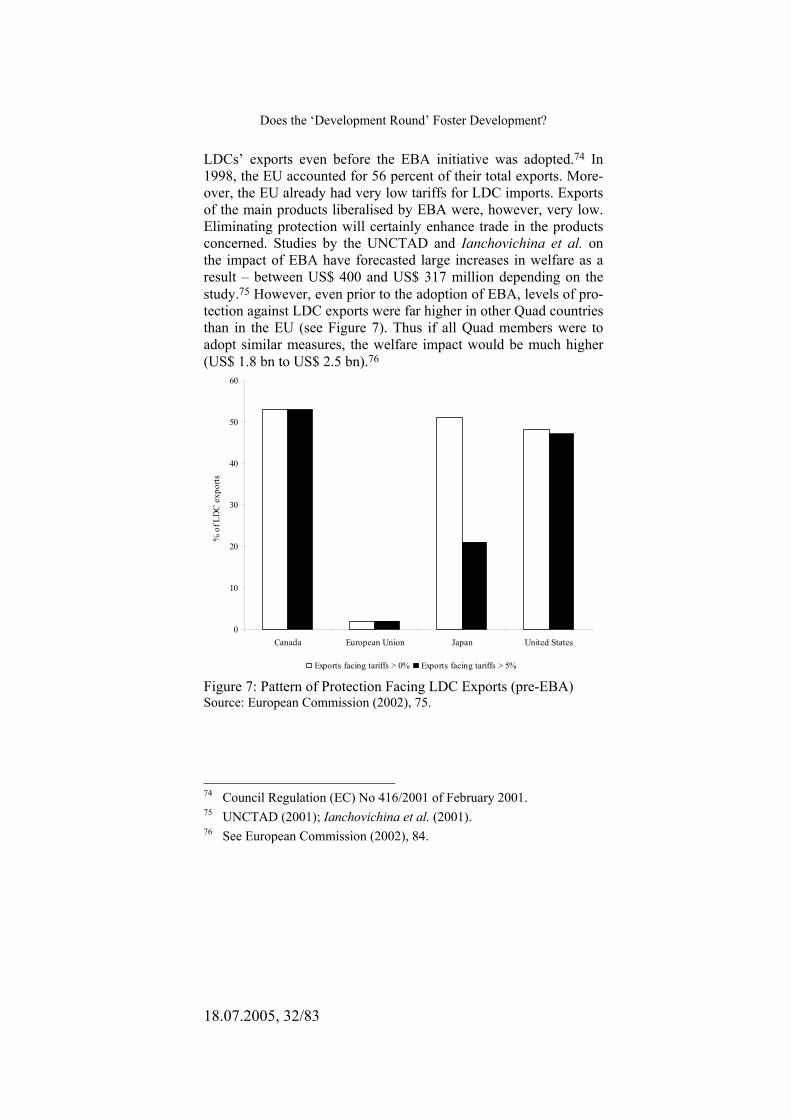
LDCs’ exports even before the EBA initiative was adopted.74 In 1998, the EU accounted for 56 percent of their total exports. More-over, the EU already had very low tariffs for LDC imports. Exports of the main products liberalised by EBA were, however, very low. Eliminating protection will certainly enhance trade in the products concerned. Studies by the UNCTAD and Ianchovichina et al. on the impact of EBA have forecasted large increases in welfare as a result – between US$ 400 and US$ 317 million depending on the study.75 However, even prior to the adoption of EBA, levels of pro-tection against LDC exports were far higher in other Quad countries than in the EU (see Figure 7). Thus if all Quad members were to adopt similar measures, the welfare impact would be much higher (US$ 1.8 bn to US$ 2.5 bn).76
0
10
20
30
40
50
60
Canada European Union Japan United States
Exports facing tariffs > 0% Exports facing tariffs > 5%
% o
f LD
C e
xpor
ts
Figure 7: Pattern of Protection Facing LDC Exports (pre-EBA) Source: European Commission (2002), 75.
74 Council Regulation (EC) No 416/2001 of February 2001. 75 UNCTAD (2001); Ianchovichina et al. (2001). 76 See European Commission (2002), 84.
Fritz Breuss
18.07.2005, 33/83
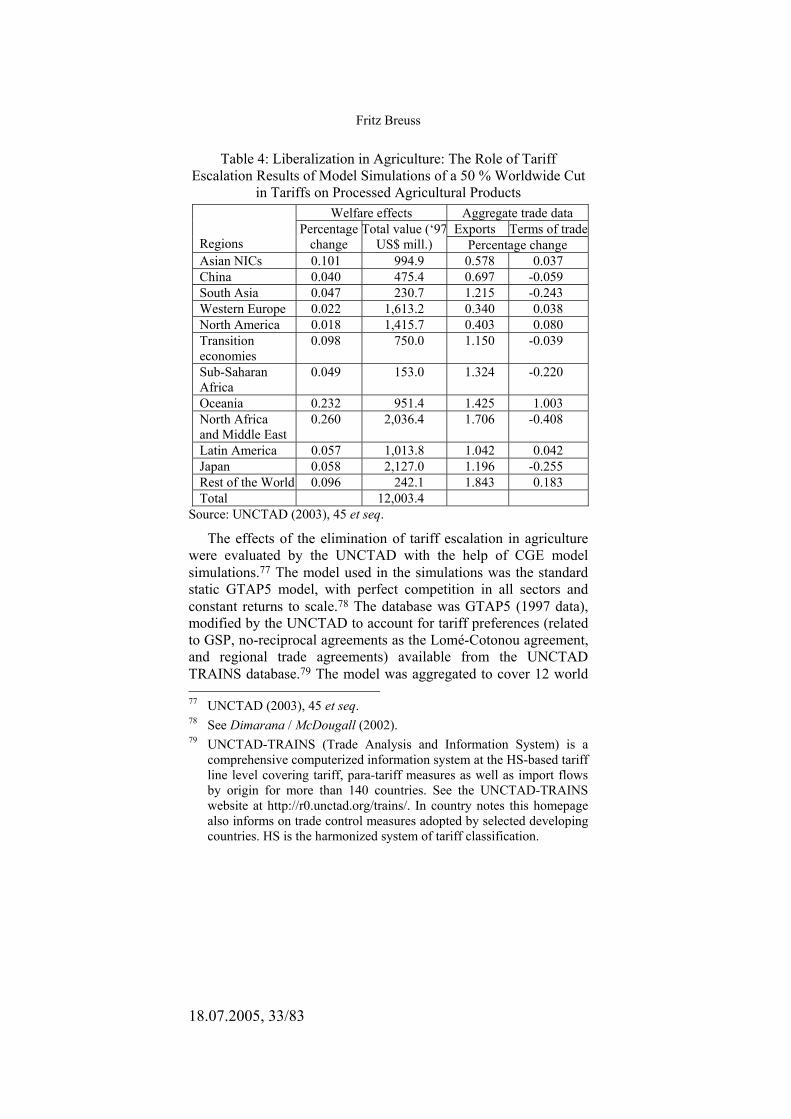
Table 4: Liberalization in Agriculture: The Role of Tariff Escalation Results of Model Simulations of a 50 % Worldwide Cut
in Tariffs on Processed Agricultural Products Welfare effects Aggregate trade data
Exports Terms of trade Regions
Percentage change
Total value (‘97US$ mill.) Percentage change
Asian NICs 0.101 994.9 0.578 0.037 China 0.040 475.4 0.697 -0.059 South Asia 0.047 230.7 1.215 -0.243 Western Europe 0.022 1,613.2 0.340 0.038 North America 0.018 1,415.7 0.403 0.080 Transition economies
0.098 750.0 1.150 -0.039
Sub-Saharan Africa
0.049 153.0 1.324 -0.220
Oceania 0.232 951.4 1.425 1.003 North Africa and Middle East
0.260 2,036.4 1.706 -0.408
Latin America 0.057 1,013.8 1.042 0.042 Japan 0.058 2,127.0 1.196 -0.255 Rest of the World 0.096 242.1 1.843 0.183 Total 12,003.4
Source: UNCTAD (2003), 45 et seq.
The effects of the elimination of tariff escalation in agriculture were evaluated by the UNCTAD with the help of CGE model simulations.77 The model used in the simulations was the standard static GTAP5 model, with perfect competition in all sectors and constant returns to scale.78 The database was GTAP5 (1997 data), modified by the UNCTAD to account for tariff preferences (related to GSP, no-reciprocal agreements as the Lomé-Cotonou agreement, and regional trade agreements) available from the UNCTAD TRAINS database.79 The model was aggregated to cover 12 world 77 UNCTAD (2003), 45 et seq. 78 See Dimarana / McDougall (2002). 79 UNCTAD-TRAINS (Trade Analysis and Information System) is a
comprehensive computerized information system at the HS-based tariff line level covering tariff, para-tariff measures as well as import flows by origin for more than 140 countries. See the UNCTAD-TRAINS website at http://r0.unctad.org/trains/. In country notes this homepage also informs on trade control measures adopted by selected developing countries. HS is the harmonized system of tariff classification.
Does the ‘Development Round’ Foster Development?
18.07.2005, 34/83
regions (3 of which comprise developing countries: South Asia, Sub-Saharan Africa, North Africa and Middle East) and 6 sectors (natural resources, manufactures, primary agriculture, processed agricultural products, textiles and apparel, services).80
A 50 percent worldwide cut in tariffs on processed agricultural products would result in increase world welfare by about 12 US$ billion, roughly half those obtained from the liberalization of all agricultural sectors. The largest welfare gains are received in Oce-ania, North Africa and Middle East and in the Asian NICs (see Table 4). The elimination of tariff escalation in the agricultural sector improves export chances for developing regions such as South Asia, Sub-Saharan Africa as well as North Africa and Middle East (see Table 4).
E. Contingent Protection
1 . An t idumping Measures Among the trade remedies permitted under WTO rules, anti-
dumping has become by far the most widely used, in both industrial and developing countries. Since 1995 over 1,800 antidumping in-vestigations have been initiated.81 While industrial countries (511 cases) have traditionally been the main users of such measures, developing countries (1086 cases) have been more active in recent years, led by India, Argentina, Brazil, and South Africa. The transi-tion countries initiated 248 cases since 1995. In the seven years to 2001, developing countries initiated almost two thirds of all inves-tigations, well in excess of their share in world trade. However, developing countries have also been the target of nearly 60 percent of investigations, mostly initiated by other developing countries.
According to the IMF and the World Bank the recent steep rise in antidumping investigations may put at risk the predictability and non-discriminatory application of trade policies.82 Recent enforce-ment practices have raised serious concerns about the influence of special interests on public policy, and may impose large costs on consumers and downstream industries in importing countries. Moreover, the deterrent effect of an investigation typically reaches well beyond the targeted exporter, and impedes incentives to pass
80 See UNCTAD (2003), 50 et seq. 81 See IMF / The World Bank (2002) 15. 82 Ibidem, 15 et seq.
Fritz Breuss
18.07.2005, 35/83
on efficiency gains.83 Additionally the frequency of antidumping measures increases during, and may thus reinforce, economic downturns.84 Small firms and countries face greater uncertainty as they often lack the resources to challenge antidumping. The intro-duction of competition law principles and of public interest clauses, giving affected importers and users legal standing to argue against protection, could reduce the protectionist bias of antidumping.85
2 . S tandards and Non- ta r i f f Bar r i e r s to Trade Many developing countries are concerned that they are ill-pre-
pared to meet increasingly complex and burdensome standards and regulations. Such regulations play an important role in facilitating trade by ensuring quality, safety and technical compatibility. How-ever, there is often a risk that such regulations may be captured by special interests, particularly when regulatory processes are not transparent. And because the industrial countries are leaders in such standards, conditions might be imposed that are tighter than needed to achieve their objectives and hence just serve as a new kind of protectionist measure.
Technical barriers have become a key concern regarding market access. Annual notifications of new technical barriers (including health and safety standards, and product standards) to GATT/WTO increased steadily from a dozen or two in the early 1980s to over 400 in 1999. Low- and middle-income countries reported that over the period from 1996-1999 more than 50 percent of their potential exports of fresh and processed fish, meat, fruit and vegetables into the EU were ‘prevented’ by their inability to comply with SPS (Sanitary and Phytosanitary Measures) requirements.86 SPS and other technical requirements have been viewed by developing country trade officials as a greater constraint on their ability to ex-ploit their comparative advantages and hence to export than tariffs and quantitative restrictions.
According to Henson et al. surveying government officials in 65 low- and middle-income countries SPS requirements were consid-ered the most significant impediment to exports to the EU.87 Other 83 Finger (1993). 84 Knetter / Prusa (2000). 85 Hoekman / Mavroïdis (1996). 86 See IMF / The World Bank (2002), 16. 87 Henson et al. (2000).
Does the ‘Development Round’ Foster Development?
18.07.2005, 36/83
technical requirements (e.g. labeling regulations or compositional standards) were also considered significant impediments to trade. Other factors of impediments are transport and other direct export costs, tariffs and only at the last palce quantitative restrictions.88 Overall, the developing countries have found it difficult to partici-pate in designing standards in ways that better reflect their concerns and capabilities, and to challenge them where they were imposed in a discriminatory manner. A number of agreements in the Uruguay Round have addressed these concerns by strengthening interna-tional rules governing product standards in order to minimize their abuse for protectionist purposes. Among others, these are the Agreement on Technical Barriers to Trade (TBT, for trade in manu-factured products), and the Agreement on the Application of Sani-tary and Phytosanitary Measures (SPS, relating to health and safety for humans and animals). Nevertheless, SPS and TBT adversely affect LDCs exports.89
F. Trade Preferences Most developing countries have preferential access to industrial
country markets for a wide range of products. This departure from the traditional non-discrimination principle of the GATT has been sanctioned under the GSP. In 2001, some 15 such schemes were in effect, though country coverage and preference margins over ap-plied MFN tariffs varied widely. In addition to GSP an important recent development has been the proliferation of bilateral and re-gional free trade agreements between industrial and developing countries. Such agreements have to cover substantially all trade, unlike GSP schemes. However, the drawbacks related to rules of origin apply to both measures.
According to the IMF and the World Bank the benefits of many GSP schemes for their beneficiaries have been limited.90 The rea-son is that preference margins are smaller for products that the im-porting country deems to be sensitive – which are also among the most protected.91 Ozden and Reinhard found evidence that the availability of unreciprocated market access preferences has un-dermined the incentives of benefiting countries to engage in trade 88 See also IMF / The World Bank (2002), 17. 89 See Fontagné (2003), 5. 90 IMF / The World Bank (2002), 18. 91 Ibidem.
Fritz Breuss
18.07.2005, 37/83
liberalization, thus at times perpetuating anti-export biases in their trade regimes.92 The cost of monitoring of rules of origin to avoid transshipment may have reduced the benefits expected from such schemes. Rules of origin are akin to local content requirements (value added thresholds). Costs arise both from exporters seeking to benefit from preferences by producing inputs from less efficient sources (trade diversion), and from the administration of, and ac-counting for ‘origin’.93 Brenton and Manchin have shown that as a result of unattractive rules of origin, only one-third of imports that were eligible for preferential treatment did in fact enter the EU market with reduces duties.94 This problem is particularly acute for textiles and clothing.
Recently market access under GSP schemes has been enhanced on a regional basis, in particular for African countries. To date 36 Sub-Saharan African countries have qualified in principle for pref-erential access under the United States’ AGOA (African Growth and Opportunity Act), adopted in 2000 (signed into law on May 18, 2000).95 Margins of preference are substantial for textile and ap-parel products as well as for a range of other light manufactures and food products. In order to benefit from this scheme, countries have to meet, in addition to relatively tight rules of origin and standard GSP criteria, requirements relating to child labour and the protec-tion of internationally recognized workers’ rights. The administra-tive requirement involved in documenting eligibility may explain why only 15 countries had availed themselves of benefits under this scheme in the year 2002, with most of the benefits accruing to four countries – Gabon, Lesotho, Nigeria, and South Africa and with fuel accounting for 85 percent of AGOA imports.96 Mattoo et al. estimate that by 2008 the volume of African exports to the US mar-ket may rise by an additional 6-7 percent.97 Presently Sub-Saharan African exporters hold their US market share in textiles and cloth-ing of 1.6 percent. In 2002 the AGOA imports increased by 10 per-
92 Ozden / Reinhardt (2002) 93 IMF / The World Bank (2002), 18 et seq. give examples in case of
NAFTA and the EU. 94 Brenton / Manchin (2002) 95 IMF and the World Bank (2002), 19. 96 Ibidem; and USITC website at http://www.usitc.gov/. 97 Mattoo et al. (2002).
Does the ‘Development Round’ Foster Development?
18.07.2005, 38/83
cent to US$ 9 billion. Excluding petroleum imports, the AGOA imports were less than US$ 2.2 billion.98 However, effective prefer-ence margins will decline as quotas under the WTO Agreement on Textiles and Clothing are phased out.
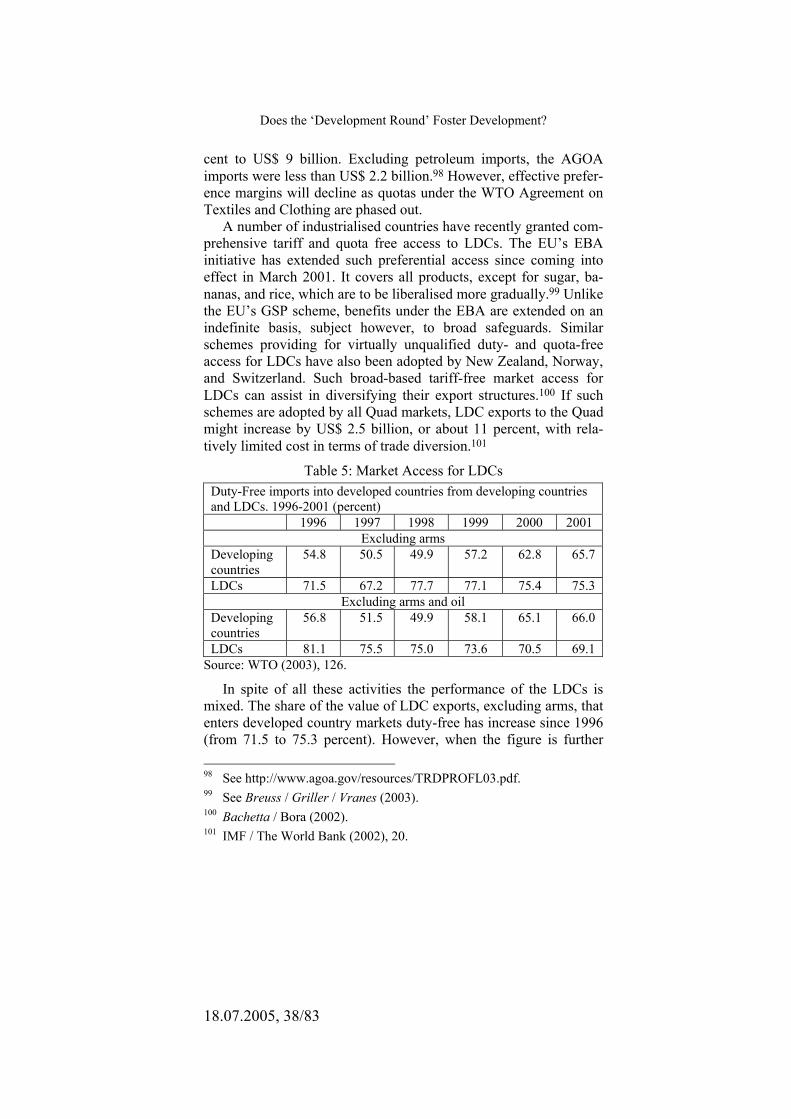
A number of industrialised countries have recently granted com-prehensive tariff and quota free access to LDCs. The EU’s EBA initiative has extended such preferential access since coming into effect in March 2001. It covers all products, except for sugar, ba-nanas, and rice, which are to be liberalised more gradually.99 Unlike the EU’s GSP scheme, benefits under the EBA are extended on an indefinite basis, subject however, to broad safeguards. Similar schemes providing for virtually unqualified duty- and quota-free access for LDCs have also been adopted by New Zealand, Norway, and Switzerland. Such broad-based tariff-free market access for LDCs can assist in diversifying their export structures.100 If such schemes are adopted by all Quad markets, LDC exports to the Quad might increase by US$ 2.5 billion, or about 11 percent, with rela-tively limited cost in terms of trade diversion.101
Table 5: Market Access for LDCs Duty-Free imports into developed countries from developing countries and LDCs. 1996-2001 (percent) 1996 1997 1998 1999 2000 2001
Excluding arms Developing countries
54.8 50.5 49.9 57.2 62.8 65.7
LDCs 71.5 67.2 77.7 77.1 75.4 75.3 Excluding arms and oil
Developing countries
56.8 51.5 49.9 58.1 65.1 66.0
LDCs 81.1 75.5 75.0 73.6 70.5 69.1 Source: WTO (2003), 126.
In spite of all these activities the performance of the LDCs is mixed. The share of the value of LDC exports, excluding arms, that enters developed country markets duty-free has increase since 1996 (from 71.5 to 75.3 percent). However, when the figure is further 98 See http://www.agoa.gov/resources/TRDPROFL03.pdf. 99 See Breuss / Griller / Vranes (2003). 100 Bachetta / Bora (2002). 101 IMF / The World Bank (2002), 20.
Fritz Breuss
18.07.2005, 39/83
adjusted for oil there is a clear downward trend by around 12 per-centage points (see Table 5). This downward trend reflects the shift in LDC exports to products and export markets that are not duty-free. In fact, the trade values show that there is basically no increase in the value of duty-free imports from LDCs while at the same time there is a significant increase in the dutiable imports from LDCs.102
In 2001, the average trade weighted tariff facing LDC agricul-tural exports into developed country markets was 3.2 percent. The equivalent figures for textiles and clothing are 4.5 and 8.5, respec-tively.103
LDCs account for less than one half of one percent of world trade. In the Doha Ministerial Declaration, Ministers committed themselves to considering additional measures to progressively improve market access for LDCs and to the objective of duty-free and quota-free access for products originating in LCDs. Similar goals were also proclaimed in the context of the eighth Millennium Development Goal (MDG). The WTO noticed that in 2000, the distribution of markets for LDC products remains heavily concen-trated.104 Sixty-three percent of all exports go to the EU and the United States. In addition to the EU and US, the major developed country markets are Australia, Canada, Japan, Norway and Swit-zerland. Together the developed countries import 69 percent of total LDC exports. Three of the top five markets are developing coun-tries in East Asia, China, Republic of Korea and Thailand. These countries account for 20 percent of total LDC exports. The remain-ing top 10 markets are: Canada, India, Japan, Singapore and Chi-nese Taipei. The market penetration of LDC exports is greatest in India and Thailand at 2.1 percent, followed by the EU at 1.4 per-cent. This in a way underlines the general trend of the last decade of a steady increase of the South-South trade noticed by the WTO.105 Accordingly, over the eleven-year period (1990-2001), South-South trade expanded twice as fast as world trade. The share of develop-ing country exports to developing countries rose from 28 percent to 37 percent of their total exports. In the same period, the import share rose by 10 percentage points to over 41 percent. More than
102 WTO (2003), 126. 103 Ibidem. 104 Ibidem. 105 Ibidem, 24 et seqq.
Does the ‘Development Round’ Foster Development?
18.07.2005, 40/83
two-thirds of intra-developing country trade originates from and is destined to developing Asia.106
G. Regionalism versus Multilateralism
1 . Inc reas ing At t r ac t iveness o f RTAs The global trading system has seen a sharp increase in regional
trade agreements (RTAs) over the past decade. A total of 259 RTAs had been notified to the GATT/WTO by the end of December 2002,107 although only 176 RTAs are currently in force. An addi-tional 70 RTAs are estimated to be operational although not yet notified and about 70 are under negotiation. As of March 2003, only four WTO members – Hong Kong, China; Macao, China; Mongolia and Chinese Taipei – were not party to a regional trade agreement. With the sole exception of Mongolia, these WTO mem-bers are all engaged in negotiations on preferential agreements.
While the recent rapid growth of RTAs began in the 1990s, the seeds of this development were sown in the early 1980s. Part of the impulse towards regionalism was driven then by the bleak prospects for progress on the multilateral agenda and the decision of the United States to explore the preferential approach to trade. The United States signed its first free trade agreement (FTA) with Israel in the mid-1980s, followed by an FTA with Canada in 1988 and the North American Free Trade Agreement (NAFTA) in 1994. The current negotiations on free trade for the Americas (FTAA) span two continents and involve over 30 countries. More recently, also Japan and other Asian countries have departed from exclusive reli-ance on MFN-based trade.
The WTO sees the major explanation for the expansion in the number of RTAs in the 1990s in the collapse of the COMECON (the preferential arrangement involving the old Soviet Union and Eastern European countries) and the alignment of the Central and Eastern European countries (CEEC) to the EU.108 Of the 123 new RTAs in force since 1990 (see Table 6), covering trade in goods, about a third were signed among transition economies (e.g. CEFTA). Another third were agreements concluded as part of the effort of the transition economies to integrate with the EU (e.g. Europe Agreements). 106 Ibidem, 25. 107 Ibidem, 46 et seq. 108 Ibidem, 46.
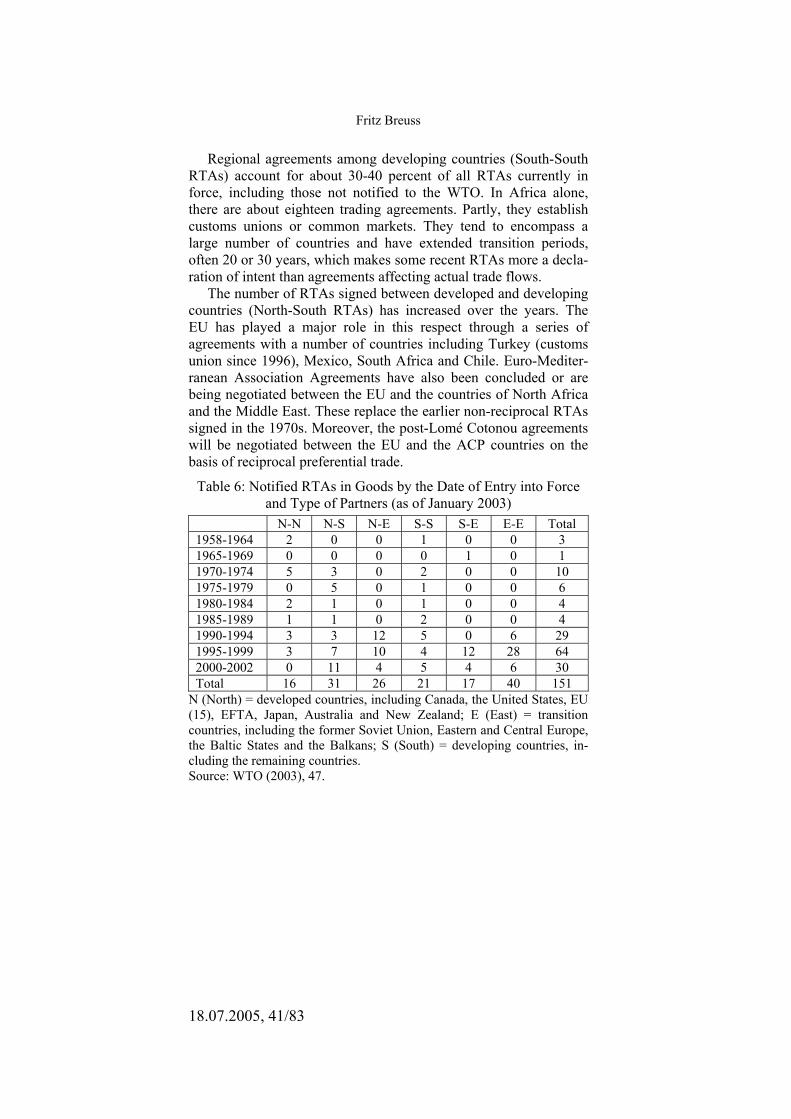
Fritz Breuss
18.07.2005, 41/83
Regional agreements among developing countries (South-South RTAs) account for about 30-40 percent of all RTAs currently in force, including those not notified to the WTO. In Africa alone, there are about eighteen trading agreements. Partly, they establish customs unions or common markets. They tend to encompass a large number of countries and have extended transition periods, often 20 or 30 years, which makes some recent RTAs more a decla-ration of intent than agreements affecting actual trade flows.
The number of RTAs signed between developed and developing countries (North-South RTAs) has increased over the years. The EU has played a major role in this respect through a series of agreements with a number of countries including Turkey (customs union since 1996), Mexico, South Africa and Chile. Euro-Mediter-ranean Association Agreements have also been concluded or are being negotiated between the EU and the countries of North Africa and the Middle East. These replace the earlier non-reciprocal RTAs signed in the 1970s. Moreover, the post-Lomé Cotonou agreements will be negotiated between the EU and the ACP countries on the basis of reciprocal preferential trade.
Table 6: Notified RTAs in Goods by the Date of Entry into Force and Type of Partners (as of January 2003)
N-N N-S N-E S-S S-E E-E Total 1958-1964 2 0 0 1 0 0 3 1965-1969 0 0 0 0 1 0 1 1970-1974 5 3 0 2 0 0 10 1975-1979 0 5 0 1 0 0 6 1980-1984 2 1 0 1 0 0 4 1985-1989 1 1 0 2 0 0 4 1990-1994 3 3 12 5 0 6 29 1995-1999 3 7 10 4 12 28 64 2000-2002 0 11 4 5 4 6 30 Total 16 31 26 21 17 40 151
N (North) = developed countries, including Canada, the United States, EU (15), EFTA, Japan, Australia and New Zealand; E (East) = transition countries, including the former Soviet Union, Eastern and Central Europe, the Baltic States and the Balkans; S (South) = developing countries, in-cluding the remaining countries. Source: WTO (2003), 47.

Does the ‘Development Round’ Foster Development?
18.07.2005, 42/83
There are several economic and political considerations why countries are interested in regionalism.109 Anyhow, the interna-tional trading system is increasingly characterized by a complex network of preferential trade regimes, sitting side-by-side with the WTO multilateral trading system.110 There is a rise in cross-re-gional bilateral agreements, the growing involvement of countries that have traditionally remained outside regional arrangements, the development of inter-linked (overlapping) agreements, and consid-erable variations in the design and content of RTAs. One third of the FTAs currently under negotiations are among countries that belong to different geographical areas. All major countries are in-volved in cross-regional FTAs. The EU has concluded FTAs with Mexico, Chile, South Africa and numerous other African and Mid-dle Eastern countries and is in the process of negotiating regional agreements with ACP countries under the framework of the Coto-nou Agreement. The EU is also negotiating an agreement with MERCOSUR. EFTA has signed a FTA with Mexico and various African countries, and is negotiating FTAs with Canada, Chile and South Africa. The United States signed a FTA with Jordan, and is negotiating with Australia, Chile, Egypt and Singapore. Countries that have traditionally remained outside regional agreements are now negotiating and joining RTAs. The last major country to join the trend is Japan, which singed a FTA with Singapore in January 2002.
Table 7: Preferential Trade Share of Intra RTAs Trade in Merchandise Imports, 2002 and 2005 (as of January 2003)
2000 2005 Western Europe 64.7 67.0 Transition economies 61.6 61.6 North America (incl. Mexico) 41.4 51.6 Africa 37.2 43.6 Middle East 19.2 38.1 Latin America (excl. Mexico) 18.3 63.6 Asia 5.6 16.2 World 43.2 51.2
Source: WTO (2003), 48.
109 See WTO (2003), 49 et seqq. for a discussion.
110 See WTO (2003), 53 for an impressive world map of such a network.
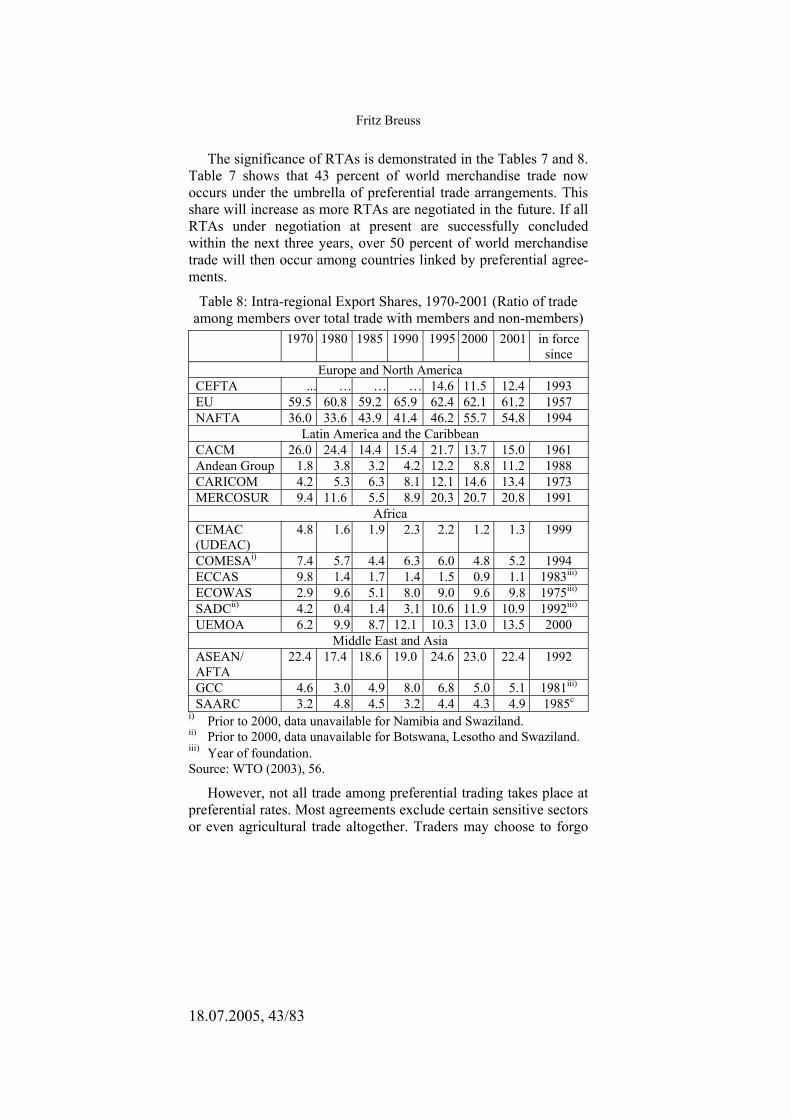
Fritz Breuss
18.07.2005, 43/83
The significance of RTAs is demonstrated in the Tables 7 and 8. Table 7 shows that 43 percent of world merchandise trade now occurs under the umbrella of preferential trade arrangements. This share will increase as more RTAs are negotiated in the future. If all RTAs under negotiation at present are successfully concluded within the next three years, over 50 percent of world merchandise trade will then occur among countries linked by preferential agree-ments.
Table 8: Intra-regional Export Shares, 1970-2001 (Ratio of trade among members over total trade with members and non-members) 1970 1980 1985 1990 1995 2000 2001 in force
since Europe and North America
CEFTA ... … … … 14.6 11.5 12.4 1993 EU 59.5 60.8 59.2 65.9 62.4 62.1 61.2 1957 NAFTA 36.0 33.6 43.9 41.4 46.2 55.7 54.8 1994
Latin America and the Caribbean CACM 26.0 24.4 14.4 15.4 21.7 13.7 15.0 1961 Andean Group 1.8 3.8 3.2 4.2 12.2 8.8 11.2 1988 CARICOM 4.2 5.3 6.3 8.1 12.1 14.6 13.4 1973 MERCOSUR 9.4 11.6 5.5 8.9 20.3 20.7 20.8 1991
Africa CEMAC (UDEAC)
4.8 1.6 1.9 2.3 2.2 1.2 1.3 1999
COMESAi) 7.4 5.7 4.4 6.3 6.0 4.8 5.2 1994 ECCAS 9.8 1.4 1.7 1.4 1.5 0.9 1.1 1983iii) ECOWAS 2.9 9.6 5.1 8.0 9.0 9.6 9.8 1975iii) SADCii) 4.2 0.4 1.4 3.1 10.6 11.9 10.9 1992iii) UEMOA 6.2 9.9 8.7 12.1 10.3 13.0 13.5 2000
Middle East and Asia ASEAN/ AFTA
22.4 17.4 18.6 19.0 24.6 23.0 22.4 1992
GCC 4.6 3.0 4.9 8.0 6.8 5.0 5.1 1981iii) SAARC 3.2 4.8 4.5 3.2 4.4 4.3 4.9 1985c
i) Prior to 2000, data unavailable for Namibia and Swaziland. ii) Prior to 2000, data unavailable for Botswana, Lesotho and Swaziland. iii) Year of foundation. Source: WTO (2003), 56.
However, not all trade among preferential trading takes place at preferential rates. Most agreements exclude certain sensitive sectors or even agricultural trade altogether. Traders may choose to forgo
Does the ‘Development Round’ Foster Development?
18.07.2005, 44/83
preferential treatment because the costs of satisfying the requisite rules of origin might be higher than the advantage offered by the preferential margin.111 Moreover, many applied MFN tariffs in developed countries are already zero. For these reasons, the esti-mates reported in Table 7 will overstate the impact of preferential trading arrangement as far as tariffs are concerned.
The WTO in defending multilateralism sees no strong evidence of trade creation due to RTAs.112 Its own data can, however, also be interpreted differently (see Table 8). The share of intra-regional exports as a percentage of regional bloc exports has been increasing since 1970 in most of the major regional trade blocs. Over 60 per-cent of EU exports are to other EU-15 partners, a share which may increase by an additional 10 percentage points after enlargement by 10 new Member States on May 1, 2004. Taking into account that the EU and EFTA have free trade arrangements via the Free Trade Agreements of 1973 one must also add EU-EFTA intra-trade which accounts for another five percentage points. That amounts to a share of intra-EU-EFTA trade of around three quarters of their total trade. Over half of NAFTA exports are to other NAFTA partners. Whereas intra-regional export shares within the EU have remained nearly constant, the intra-NAFTA trade share has shown an upward trend well before NAFTA entered into force in 1994. Similar pat-terns can be identified for other major RTAs. MERCOSUR is an exception, where data show a sharp increase in intra-regional export shares after the agreement entered into force in 1991.
2 . Does the EU Need the WTO a t Al l ? The significance of RTAs depends on its degree of integration.
Most of the RTAs are simple free trade agreements or customs unions. Only the NAFTA goes a little bit beyond this status imply-ing besides free movements of goods also partial free movement of services and of capital and labour. The highest form of integration however, is reached in the EU. It not only consists of a customs union and the four freedoms (Single Market concept) but is also an Economic and Monetary Union (EMU) with a single currency (Euro). EU-25 together with the EU-EFTA free trade realtions will comprise a potential of nearly three quarters of intra-EU-EFTA regional trade relative to total trade. Other RTAs (with the ACP,
111 WTO (2000), 48. 112 Ibidem, 55.
Fritz Breuss
18.07.2005, 45/83
with Mexico, South Africa, the Andean pact) make the EU a trading superpower of its own. In addition, in contrast to most RTAs the EU does go much beyond the WTO commitments.113
This provokes the question why the EU needs the WTO at all? Nearly three quarter of all merchandise trade is conducted with free trade partners. Measured by this huge intra-trade share the EU could easily forgo the multilateral commitments of the WTO. The EU is, however, also a leading world trader. The EU holds a world market share of around 19 percent (excluding intra-EU trade). Adding EFTA’s world market share of around three percentage points and that of the 10 new EU members of Central and Eastern Europe of also around three percentage points this increases the world market share of the enlarged EU-EFTA to 25 percent. In comparison the United States hold a market share of 14 percent, Japan one of only nine percent and China nearly seven percent, followed by Canada with five percent. All other single countries are far below a five percent world market share (measured with exports figures of the year 2002).114 If the EU would just rely on its bilat-eral and unilateral agreements with developing countries via GSP and the Lomé-Cotonou agreements with the ACP countries it would be self sustainable. Intra-EU trade would cover industrial trade, EU-ACP trade would fulfil the function of supplying the necessary raw material inputs. The only important trade partners in the industrial world are the United States and to a lesser degree Japan.
From an optimal tariff theory point of view a dominant player in world trade (such as the EU) can improve welfare by imposing an optimal tariff rate which is usually very high (more than 100 per-cent), whereas the optimal tariff for small countries is zero (i.e. free trade).115 This implies that the starting position for trade liberaliza-tion is quite different for large and small (and developing) coun-tries. Larger countries and regions tend to lose from unilateral re-ductions in protection, which move them further away from their optimal level of protection. Only mutual or co-operative tariff re-ductions can benefit all countries. This highlights the importance of the WTO multilateral negotiations for a co-operative solution to bring together the different interests of large and small, rich and poor countries, resulting in world-wide trade liberalization. 113 See OECD (2002). 114 See WTO (2003), 69. 115 See Breuss (2003), 140 et seqq.

Does the ‘Development Round’ Foster Development?
18.07.2005, 46/83
Bagwell and Staiger in formulating an economic theory of GATT/WTO reach the conclusion that GATT’s major principles, reciprocity and non-discrimination are thus simple rules that, when used together can deliver an efficient outcome.116 Non-discrimina-tion (the MFN clause) ensures that all international externalities are channelled through world-price movements, and the principle of reciprocity serves effectively to neutralize externalities of exactly this nature (terms-of-trade effects).
More interesting in answering the question whether the EU needs the WTO, however, is the treatment of cases of bilateral im-balances. Maggi analyses such cases in the context of a three-coun-try CGE model of trade with the presence of bilateral imbalances of power, where the ‘more powerful’ country (e.g. the EU) in a given pair is the one that stands to lose less (or to gain more) from a trade war (increasing tariffs). Hence, in case of trade liberalization a large and powerful country would lose more (or gain less) than smaller countries.117 Seen from a world perspective of welfare maximiza-tion and the target of equality Maggi comes to the following con-clusions: a) In the presence of bilateral imbalances of power (e.g. the EU versus small and developing countries), countries can sus-tain a higher symmetric welfare with multilateral enforcement (or punishment strategy whereby any defection is followed by a per-manent Nash reversion in multialteral relationships) than with bilat-eral enforcement. b) Under bilateral enforcement (punishment strat-egy whereby any defection is followed by a permanent Nash rever-sion in bilateral relationships) the weaker partner makes a larger ‘concession’ than the stronger partner.118 The reverse is true under multilateral enforcement. To overcome this inequality, international transfers (e.g. development aid) could be used. According to Maggi such a strategy is, however, an imperfect substitute for multilateral enforcement.119 c) Under absent power imbalances (if all countries would be of equal size and power), bilateral and multilateral en-forcement are equally efficient. An important conclusion of Maggi’s game-theoretic analysis is that international trade institu-tions like WTO are important in order to neutralise the imbalances of power in world trade via rule-making procedures. 116 Bagwell / Staiger (1999); see also Breuss (2003), 140 et seqq. 117 Maggi (1999); see also Breuss (2003), 155 et seqq. 118 Maggi (1999), 198. 119 Ibidem, 200.

Fritz Breuss
18.07.2005, 47/83
The more power the EU accrues in world trade the more is its attitude towards multilateral solutions of WTO no more than a fig leaf to calm down its own sole or the critiques of globalization or a demonstration of its good governance.
H. Developing Countries’ Market Access in Agriculture A key achievement of the Uruguay Round has been to extend
multilateral discipline to domestic support in the farming sector, as well as to export subsidies. Domestic support related measures have been classified according to the associated level of market distor-tions. The so-called ‘boxes’ characterise what is prohibited, al-lowed, or to be phased out. A slight reduction in the market distor-tion (domestic support granted to farmers) can be observed in the 1990s. The ratio of producer support for the OECD was 31 percent in 2000-2002, compared to 36 percent in 1986-1988. The coeffi-cient of nominal protection was 31 percent in 2002, compared to 57 percent in 1986-1988.120
Agriculture belongs to the built-in Agenda of the Uruguay Round and hence also in the Doha Round. Rich countries can afford farm support. Therefore the US$ 300 billion spent by the industri-alised countries on farm support are often compared to the amount of their aid to development, which represents only a sixth of this sum.121 The Official Development Assistance (ODA) defined by the OECD122 as the sum of grants and concessional loans (i.e. with grant elements of at least 25 percent), undertaken by the official sector and with the primary objective of promoting the economic development stayed at US$ 53 billion in the last decade (2002, US$ 58.3 billion).123 In contrast total long-term capital flows to develop-ing countries increased from US$ 98 billion in 1990 to over US$ 295 billion in 2000.124 Nevertheless the share of ODA decreased
120 See OECD (2003). 121 See Fontagné (2003), 6. 122 Chapter 3 of the OECD (2004) report describes the „Millennium
Development Goals’ (MDG) defined at the UN Millennium Summit. The Millennium Declaration signed by 189 countries, including 147 Heads of State, in September 2000 can be found on the UN website at http:// ods-dds-ny.un.org/doc/UNDOC/GEN/N00/559/51/PDF/N00559 51.pdf?OpenElement.
123 See OECD (2004), 22. 124 See European Commission (2002), 65.

Does the ‘Development Round’ Foster Development?
18.07.2005, 48/83
from 0.33 percent in 1990 to 0.23 percent of GDP in 2002125 and hence further away from the recommended aid target of 0.7 percent. In 2002 only five OECD members (Denmark, Luxembourg, Neth-erlands, Norway and Sweden) have reached the level of 0.7 percent GDP to be spent on ODA.
1 . Cos t s o f Agr icu l tu ra l Dis to r t ion According to the comprehensive analyses of international or-
ganizations increased market access for agricultural products would work to directly address poverty reduction in developing coun-tries.126 While the rapid expansion of demand for unskilled labour in manufacturing and urban services in many developing countries has sharply reduced rural poverty, about three quarters of the world’s poor still live in rural areas, where agriculture is often the dominant economic activity. Agriculture accounts for about 27 percent of GDP in developing countries, a similar share of exports and 50 percent of employment. This dependency on agriculture is most pronounced in LDCs and in Sub-Saharan Africa, where, in addition, production tends to be concentrated in only a small num-ber of commodities.
Agricultural distortions inflict large costs on the global econ-omy, by some estimates exceeding those of protection in the indus-trial sector. Based on CGE model simulations with the GTAP5 model the IMF and World Bank study finds that the global income loss from agricultural distortions worldwide may be well over US$ 128 billion (US$ 98 billion in industrial and US$ 30 billion in de-veloping countries).127 Most of the cost results from market price support measures, of which tariffs are the dominant form. The losses of export revenues (US$ 378 billion worldwide) are much larger, by a factor of three to four in the case of developing coun-tries (US$ 256 billion in industrial and US$ 122 in developing countries).
Interestingly, both groups of countries suffer the most from their own restrictive polices. For developing countries, these policies are responsible for about 71 percent of the total income loss, while for developed (industrial) countries, the share is as high as 95 percent.
125 See OECD (2004), 62. 126 IMF / The World Bank (2002), chapter III; UNCTAD (2003), chapter
III; WTO (2003), chapter II. 127 IMF / The World Bank (2002), 32.

Fritz Breuss
18.07.2005, 49/83
Within the group of the industrial countries the major players in protecting its agricultural markets are the United States and the European Union.128 For example, the United States granted US$ 3.6 billion subsidy to US cotton producers in 2001.129
2 . Removing Agr i cu l tu ra l Subs id ies a lone i s Nega t ive fo r Deve lop ing Count r i e s
While global liberalization of both tariffs and subsidies would benefit every region, the static effect of removing subsidies alone is likely to be negative for developing countries as a group and many individual countries.
It is less clear whether the various objectives contemplated in the DDA are mutually compatible.130 If market access is favourable to growth in the LDCs, then liberalising imports in the North on a multilateral basis will erode the margin of preference conceded to LDCs and will reduce their access to these markets. If less distort-ing farm support in the North increases world prices of food prod-ucts, LDCs that are net importers of food will be adversely affected through negative terms-of-trade effects.131
This can be demonstrated by the simulation outcomes of the UNCTAD study.132 The elimination of export subsidies in agricul-ture, without parallel changes in tariffs leads to modest worldwide welfare losses. The distributional implications are the following (see Table 9): After the elimination of subsidies, all regions except Europe start increasing their agricultural value-added. However, since many countries still face high protection against their agri-culture export, this shift might be counterproductive. Most regions actually stand to lose from the elimination of subsidies, while the gains appear to be very concentrated in Western Europe – which (in particular due to the CAP of the EU) is the area characterised by the highest value of initial subsidies – and in regions that are net agri-cultural exporters, such as Oceania and Latin America. Western
128 For a short description of the main features of the US Farm and Secu-
rity and Rural Investment Act of 2002 and of the EU’s Common Agri-cultural Policy (CAP) and its reform proposals, the 2002 mid-term re-view of the CAP, see IMF / The World Bank (2002), 29 et seq.
129 See Fontagné (2003), 6. 130 Ibidem, 3. 131 For similar results, see also Hoekman et al. (2002). 132 UNCTAD (2003), 44 et seq.
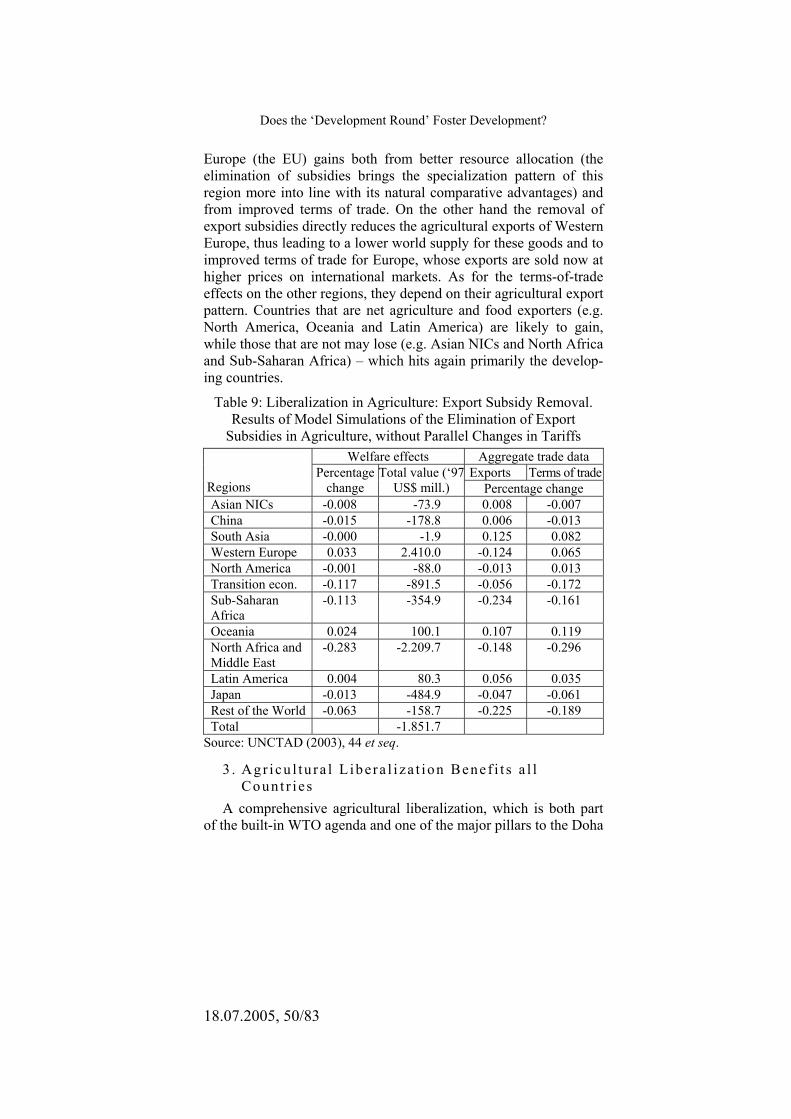
Does the ‘Development Round’ Foster Development?
18.07.2005, 50/83
Europe (the EU) gains both from better resource allocation (the elimination of subsidies brings the specialization pattern of this region more into line with its natural comparative advantages) and from improved terms of trade. On the other hand the removal of export subsidies directly reduces the agricultural exports of Western Europe, thus leading to a lower world supply for these goods and to improved terms of trade for Europe, whose exports are sold now at higher prices on international markets. As for the terms-of-trade effects on the other regions, they depend on their agricultural export pattern. Countries that are net agriculture and food exporters (e.g. North America, Oceania and Latin America) are likely to gain, while those that are not may lose (e.g. Asian NICs and North Africa and Sub-Saharan Africa) – which hits again primarily the develop-ing countries.
Table 9: Liberalization in Agriculture: Export Subsidy Removal. Results of Model Simulations of the Elimination of Export
Subsidies in Agriculture, without Parallel Changes in Tariffs Welfare effects Aggregate trade data
Exports Terms of trade Regions
Percentage change
Total value (‘97US$ mill.) Percentage change
Asian NICs -0.008 -73.9 0.008 -0.007 China -0.015 -178.8 0.006 -0.013 South Asia -0.000 -1.9 0.125 0.082 Western Europe 0.033 2.410.0 -0.124 0.065 North America -0.001 -88.0 -0.013 0.013 Transition econ. -0.117 -891.5 -0.056 -0.172 Sub-Saharan Africa
-0.113 -354.9 -0.234 -0.161
Oceania 0.024 100.1 0.107 0.119 North Africa and Middle East
-0.283 -2.209.7 -0.148 -0.296
Latin America 0.004 80.3 0.056 0.035 Japan -0.013 -484.9 -0.047 -0.061 Rest of the World -0.063 -158.7 -0.225 -0.189 Total -1.851.7
Source: UNCTAD (2003), 44 et seq.
3 . Agr icu l tu ra l L ibera l i za t ion Benef i t s a l l Coun t r i e s
A comprehensive agricultural liberalization, which is both part of the built-in WTO agenda and one of the major pillars to the Doha
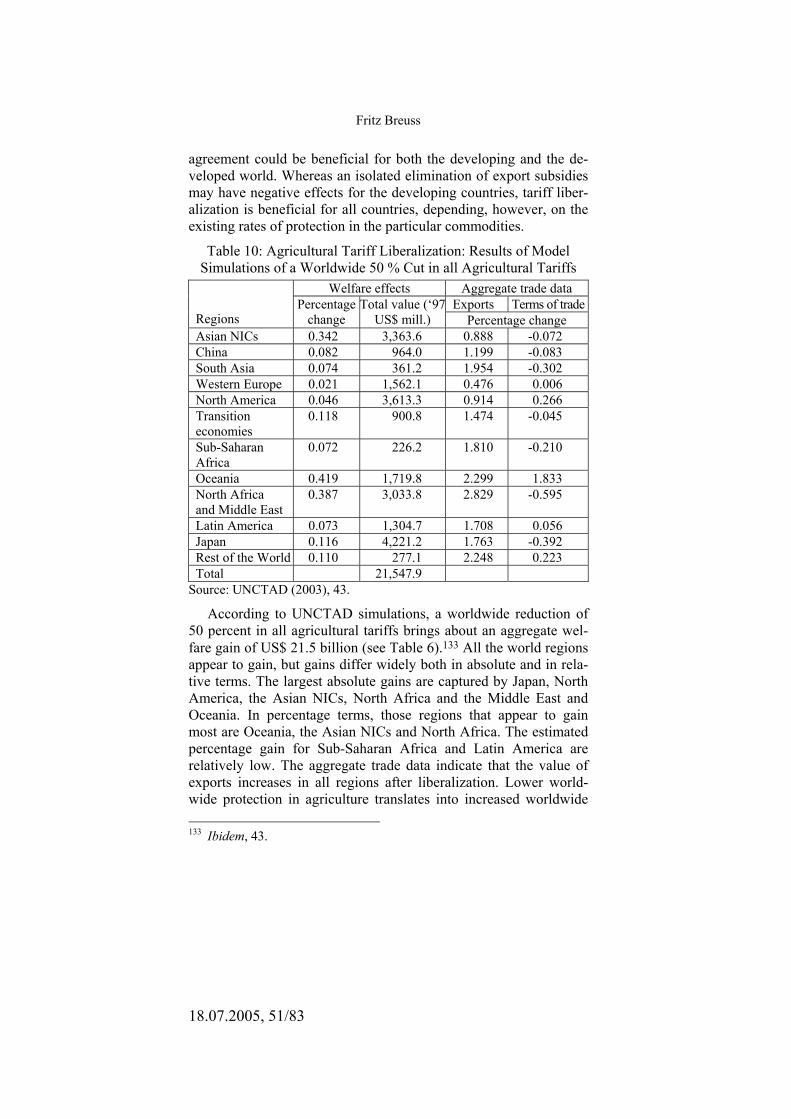
Fritz Breuss
18.07.2005, 51/83
agreement could be beneficial for both the developing and the de-veloped world. Whereas an isolated elimination of export subsidies may have negative effects for the developing countries, tariff liber-alization is beneficial for all countries, depending, however, on the existing rates of protection in the particular commodities.
Table 10: Agricultural Tariff Liberalization: Results of Model Simulations of a Worldwide 50 % Cut in all Agricultural Tariffs
Welfare effects Aggregate trade data Exports Terms of trade
Regions
Percentage change
Total value (‘97US$ mill.) Percentage change
Asian NICs 0.342 3,363.6 0.888 -0.072 China 0.082 964.0 1.199 -0.083 South Asia 0.074 361.2 1.954 -0.302 Western Europe 0.021 1,562.1 0.476 0.006 North America 0.046 3,613.3 0.914 0.266 Transition economies
0.118 900.8 1.474 -0.045
Sub-Saharan Africa
0.072 226.2 1.810 -0.210
Oceania 0.419 1,719.8 2.299 1.833 North Africa and Middle East
0.387 3,033.8 2.829 -0.595
Latin America 0.073 1,304.7 1.708 0.056 Japan 0.116 4,221.2 1.763 -0.392 Rest of the World 0.110 277.1 2.248 0.223 Total 21,547.9
Source: UNCTAD (2003), 43.
According to UNCTAD simulations, a worldwide reduction of 50 percent in all agricultural tariffs brings about an aggregate wel-fare gain of US$ 21.5 billion (see Table 6).133 All the world regions appear to gain, but gains differ widely both in absolute and in rela-tive terms. The largest absolute gains are captured by Japan, North America, the Asian NICs, North Africa and the Middle East and Oceania. In percentage terms, those regions that appear to gain most are Oceania, the Asian NICs and North Africa. The estimated percentage gain for Sub-Saharan Africa and Latin America are relatively low. The aggregate trade data indicate that the value of exports increases in all regions after liberalization. Lower world-wide protection in agriculture translates into increased worldwide 133 Ibidem, 43.
Does the ‘Development Round’ Foster Development?
18.07.2005, 52/83
import demand and improved trade opportunities in all areas. Inter-estingly, the strongest increases are in the developing regions North Africa and Middle East, Oceania and Sub-Saharan Africa. In West-ern Europe the export gains are modest (see Table 10).
In addition to this static welfare gains a worldwide liberalization in agricultural trade would cause additional gains. On the one hand it would stabilize agricultural prices and lead to a downward pres-sure on world prices for key commodities. Developing countries suffer the most from price instability as they have fewer resources available to smooth consumption and income flows. On the other hand agricultural liberalization is likely to have long-term, dynamic effects on world production and trade. These effects could include increased farm investment and enhanced technologies and produc-tivity in response to better market opportunities. According to the IMF and the World Bank for the developing countries to reap the full benefits of liberalization, a framework of supportive policies is required – including the elimination of anti-agriculture biases in pricing policies so that (higher) world prices are passed through to the farm-gate – and essential infrastructure (transport, logistic, credit, extension services).134
Hoekman and his collaborators in recognizing that a number of developing countries could lose from agricultural liberalization (in particular from reducing domestic support measures) suggest that agricultural reforms should be accompanied by compensation mechanism, which could include additional ‘aid for trade’.135
I. Developing Countries’ Market Access in Textile and Clothes The production of textiles and clothing is intensive in unskilled
labour and uses only simple technology. Therefore, a regional shift in specialization (from the developed to the developing countries) took place since the sixties. In the mid-1960s, developing countries accounted for 15 percent of world textile exports and less than 25 percent of world clothing exports. By the end of the 1990s, these shares had reached 50 percent and 70 percent respectively.136 Al-though exports of textiles and clothing (T&C) account only for 5.5 percentage points of total world exports (see Appendix, Table A1) their production is highly concentrated in the developing countries.
134 IMF / The World Bank (2002), 33. 135 Hoekman and Hoekman et al. (2002), 18. 136 See IMF / The World Bank (2002), 36 et seq.
Fritz Breuss
18.07.2005, 53/83
This development has created a high dependency on these products for export earnings. In some developing countries textiles and clothing account for more than 80 percent of total merchandise exports.137 In Pakistan (73 percent), Mauritius (64 percent), Sri Lanka (54 percent), Tunisia (43 percent), Turkey (38 percent) and Morocco (34 percent) these products account for more than one third of their total exports. Then there is a group of countries with export shares between 20 and 30 percent (India, 28; Romania, 24; China, 21 percent).
Despite extensive quantitative restrictions discriminating against developing countries and high tariffs in developed countries (the main export markets for most developing countries) there was a remarkable growth in T&C exports. For nearly half a century, world trade in T&C has been subject to quantitative restrictions under derogation from GATT rules, beginning with Japan’s 1955 voluntary export restraints on its export of cotton fabrics and clothing to the United States. These led to the multilateral Short-Term Arrangement regarding International Trade in Cotton Textiles in 1961, the Long-Term Arrangement in 1962, and eventually the Multifiber Arrangement (MFA) in 1974.138 The MFA expanded quantitative restrictions beyond cotton products to wool and man-made fibre products and was extended several times until the Uru-guay Round Agreement on Textiles and Clothing (ATC) took effect at the beginning of 1995. In the MFA’s last year of operation, six participants (Austria, Canada, EU, Finland, Norway, and the United States) applied quotas under the Agreement.
The salient feature of the MFA was bilateral quotas. The MFA called on importing countries to endeavour to grow quota volumes by at least 6 percent per year. In practice quota growth was lower for established suppliers, while small and new exporting countries were generally granted more generous quota growth. MFA quotas act like bilateral export restrictions. The export tax equivalents of these quotas vary substantially across countries. The most competi-tive exporting countries, such as China and India, face more strin-gent restrictions than the less competitive countries. The export tax equivalents of quotas for textiles varied from zero in Japan to 7.8 percent in Canada (USA, 6.7 percent; EU, 4.5 percent). The tax 137 Cambodia, Macao SAR and Bangladesh, see IMF / The World Bank,
(2002), 38. 138 See IMF / The World Bank (2002), 36.

Does the ‘Development Round’ Foster Development?
18.07.2005, 54/83
equivalents of quotas for clothing were higher (Japan zero; Canada, 16.8 percent; USA 11 percent; EU 5.3 percent).139
Under the ATC, quotas are to be phase out progressively over a 10-year period (ending in 2005). In the first stage (January 1, 1995), WTO members were required to integrate products representing not less than 16 percent in volume terms of their 1990 imports of tex-tiles and clothing products. In stage 2 (January 1998), not less than a further 17 percent had to be integrated, and in stage 3 (January 2002), a further 18 percent. Finally, on January 1, 2005, all re-maining products (amounting to a maximum 49 percent) are to be automatically integrated. After integration, regular GATT safe-guards apply.
In spite of the time plan of the ATC, market access barriers still remained. With the exception of Norway, whose T&C imports have been all freed from quotas, the major importers (the United States and the EU) eliminated only a small percentage of quotas originally in place during the first two stages (the USA from 750 quotas only 13, the EU from 219 only 14). Therefore, the vast majority of re-strictions is left to be abolished at the end of the implementation period.140
In addition to the MFA quotas, T&C imports are subject to ex-ceptionally high tariffs. During the Uruguay Round tariffs on T&C were cut less than those on other manufactures, and tariff peaks and escalation (tariffs on clothing are higher than those on textiles) re-main common in this sector. In OECD import regimes, tariff peaks affect 27 percent of total tariff lines on T&C. Tariffs in the United States for textiles are 11.2 percent (for clothing 13.3 percent; for all manufactures 2.8 percent), in the EU 9.1, 11.9 and 3.6 percent re-spectively, in Japan 8.5, 12.5 and 1.4 percent respectively and in Canada 15.7, 21.2 and 3.9 respectively.141 However, tariffs on T&C are also very high in developing countries (16 percent).
According to simulations with the GTAP model by the IMF and the World Bank, the cost of barriers to trade in T&C imports are a substantial burden on both developing and industrial countries. The combined income loss for developing countries quota and tariffs on industrial country imports amounts to US$ 24 billion, and the ex-port revenue loss to US$ 40 billion. Industrial countries suffer 139 Ibidem, 39. 140 See ibidem, 41 for more details. 141 See ibidem, 39.
Fritz Breuss
18.07.2005, 55/83
around half the income loss but almost the same export shortfall as developing countries, namely around US$ 40-46 billion. As intra-developing country trade accounts for about half of their total ex-ports of textiles and 20 percent of clothing exports, the cost of bar-riers (mainly import tariffs) are larger for developing countries (US$ 28 billion) than for industrial countries (US$ 3 billion). The losses of exports amount to US$ 42 billion for developing countries and only for US$ 9 billion for industrial countries. Overall, the incomes loss due to MFA quotas and T&C tariffs for the world amount to US$ 66 billion, and the losses of export revenues are US$ 137 billion world-wide.142 The same model simulated indi-cates that as many as 27 million jobs are foregone in developing countries due to the combined effect of quota and tariffs.143 On average, each job saved in developed countries by tariffs and quotas is estimated to cost 35 jobs in developing countries, many of which are in China and India. MFA quotas and tariffs tend to be most hurtful to the poor, as T&C industries primarily employ low-skilled workers, often migrants from rural areas. Also, low-income house-holds in industrial countries bear the brunt of the cost of MFA and high tariff restrictions as the poor spend a larger share of their in-come on necessities such as T&C.
The delay in the integration plan according to the ATC leads to adjustment needs. The above mentioned back loading of effective liberalization turns what was planned as a gradual adjustment proc-ess into a shock at the end of the transition period (in 2005) – for both importing and exporting countries. According to the IMF and World Bank study, this raises concern that political pressures might spark greater recourse to other forms of protection once quotas are phase out, with trade remedy action and perhaps non-transparent ‘voluntary’ export restraints (prohibited in principle under the WTO) becoming a ‘new line of defence’.144 A sudden withdrawal of quota protection at the end of the transition period might also increase resistance to further reductions in tariffs. Accelerating the removal of quotas on textiles and clothing imports is an urgent pri-ority. Additionally, the Doha round negotiations should lead to substantially lower tariffs on T&C trade, in both industrial and de-veloping countries. 142 Ibidem, 42 et seq. 143 Ibidem, 3. 144 Ibidem, 44.
Does the ‘Development Round’ Foster Development?
18.07.2005, 56/83
Preferences for LDCs are not a long-term solution to problems of competitiveness, but schemes that provide LCDs with duty- and quota-free market access may ease problems of transition. Benefits of preferential market access can be substantially reduced and even negated by restrictive rules of origin, either because of the need to switch to higher-cost sourcing of intermediate goods, or because value added thresholds for preferential access are hard to meet. Mattoo et al. estimate that benefits under the AGOA could be re-duced by as much as 75-80 percent because of onerous rules of region (there are similar problems with EU preferential schemes).145 In addition to the rules of origin, there is often a fine balance to strike on social and environmental conditions. As dem-onstrated in the case of minimum labour standards in connection with Cambodia’s exports of T&C, minimum wages and other con-ditions for preferential access may have limited the benefits the country has drawn from these preferential schemes.146
IV. Gains from Trade Liberalization under a Successful Doha Round
A. Formula Approaches to Market Access Negotiations
1 . The Genera l P rocedure o f Nego t i a t ions Concerning market access for products, there are 146 members
negotiating on thousands of products. Under such circumstances, any means for simplifying negotiations are welcome. One instru-ment is the ‘formula approach’.
A variety of approaches has been used in the past to negotiate the reduction of bound tariffs starting with the request and offer approach. This technique, grounded in the selected product by product approach proved cumbersome and yielded results that were not particularly ambitious. Two significant departures from this approach occurred during the Kennedy Round. Industrialised coun-tries adopted a linear tariff reduction technique and developing countries were granted ‘less than full reciprocity’.147
In the Tokyo Round an explicit reference was made to ‘appro-priate formulae’. A number of proposals were submitted in re-sponse to the mandate, including some that had the effect of higher 145 Mattoo et al. (2002). 146 See IMF / The World Bank (2002), 46 for a case study on Cambodia. 147 Hoda (2001).
Fritz Breuss
18.07.2005, 57/83
reductions for higher tariff rates in contrast to a linear reduction. The proposal from Switzerland was ultimately adopted by some countries.
In the so-called ‘Swiss formula’148 the target tariff rate, 1t depends non-linearly on the initial tariff rate 0t and a coeffi-
cient a :
0
01 ta
att+
= , (3)
where a is a coefficient corresponding to the upper limit of de-sired tariff rates after the cut. In applying this formula some coun-tries used a coefficient a equal to 14, others adopted 16. The for-mula was not universally applied by all countries and those that applied it did so with exceptions. Francois and Martin survey a range of formula options and examine both targeted and flexible applications of the Swiss formula that target tariff escalation and peaks, and would allow policymakers to directly target how far they will move towards free trade, while providing some flexibility for trading off reductions in peak tariffs against reductions in lower-tariff sectors.149
The mandate for the Uruguay Round negotiations and the DDA did not specifically mention the use of formulae as the core modal-ity. However, during both negotiations proposals for modalities based on formulae have figured prominently. In the current Doha agriculture negotiations some Members proposed the Swiss formula with a coefficient a equal 25. In the non-agricultural market access negotiations the Swiss formula was proposed by the United States with a coefficient of 8 for certain phases of their proposed tariff reduction plan. In addition, variants of the Swiss formula that take into account the diversity of Members’ profiles were proposed.150
The Chair’s draft proposal for the Doha negotiations on agri-culture followed the approach used during the Uruguay Round which was a target rate of reduction based on a simple average of out-quota tariff rates with a minimum cut per line. The reductions 148 See WTO (2003), 150; Fontagné (2003), 6; Francois / Martin (2003). 149 Francois / Martin (2003), see also Panagariya (2002) for more details
on the general properties of formulas that have been used for reciprocal negotiations.
150 See WTO (2003), 150 et seq. with references to the documents for the full variety of proposals.
Does the ‘Development Round’ Foster Development?
18.07.2005, 58/83
would apply across three different bands of tariffs with a higher average reduction for tariffs in the high range. Developing countries were proposed a similar approach, but with higher thresholds for tariffs to be reduced and lower percentage reductions.
In the Doha non-agricultural market access negotiations the Chair proposed a number of elements for the reduction of tariffs. The core element is the following formula to be applied on a line-by-line basis:
0
01 tBt
tBtta
a
+= (4)
Where, t1 is the final rate, to be bound in ad valorem terms; t0 is the base rate for negotiations, ta is the average of the base rates and B is a coefficient with a unique value to be determined by the par-ticipants.
Less than reciprocity in this context is incorporated into the for-mula through the ta coefficient. A higher coefficient implies a lower reduction and developing countries in general have higher average applied and bound tariffs (see Table 1). The Chair further proposed that WTO members could consider the elimination of tariffs in cer-tain sectors of export interest to developing countries. As with agri-culture, the Chair’s proposal in non-agricultural market access takes into account the issue of special and differential treatment (SDT) for developing countries.
The impact of a 50 percent Swiss-formula based reduction of average tariff bindings for industrial and developing countries has been demonstrated151 (see Table 11a and Table 11b).
With the implementation of the Uruguay Round commitments, average ad valorem tariffs in the industrial countries, generally are around 3 percent (see Table 11a, first column). However, there are important exceptions. One of these is textiles and clothing, where the average rate is roughly three times this overall average. This is reflected in the standard deviation and maximum tariff columns. With full implementation of current commitments, the estimated simple average industrial tariff in the United States is 3.2 percent, with a standard deviation of 4.3, and a maximum tariff of 37.5 per-cent. The European Union has a higher average (3.7 percent), but less dispersion (3.6 percent) and a maximum tariff rate of 17 per-cent. For the developing countries, average industrial tariffs range
151 Francois / Martin (2003); Francois / van Meijl / van Tongeren (2003).
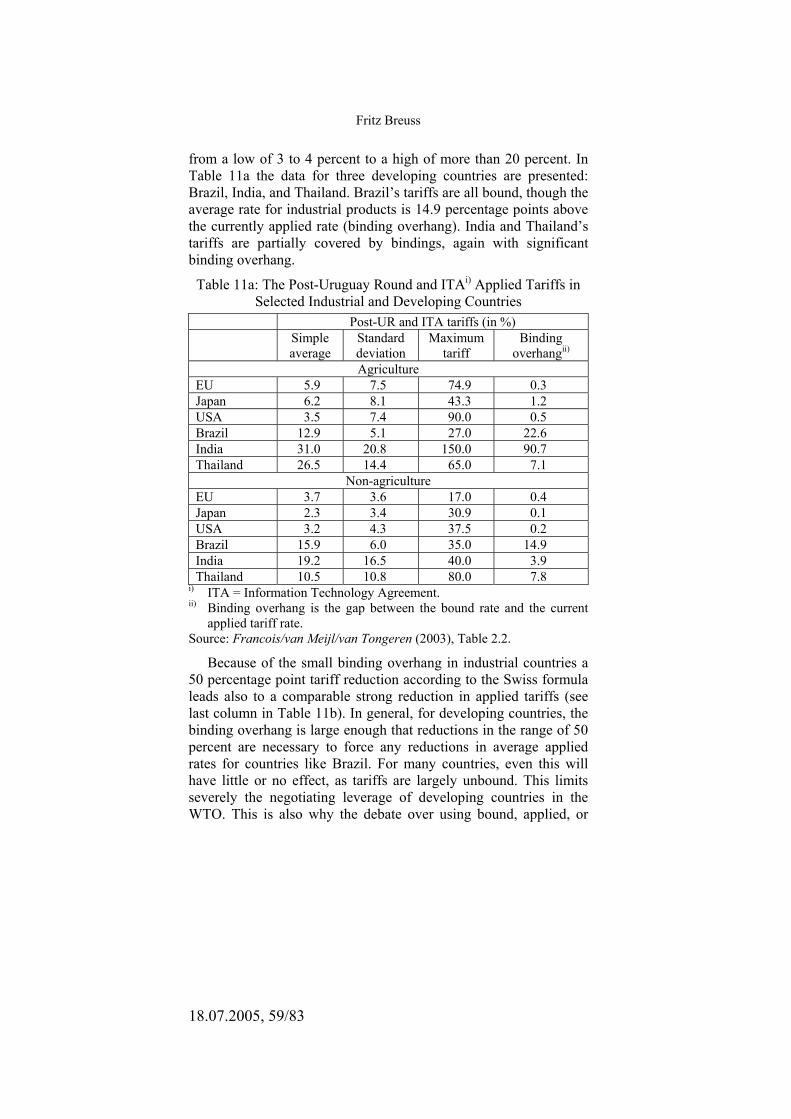
Fritz Breuss
18.07.2005, 59/83
from a low of 3 to 4 percent to a high of more than 20 percent. In Table 11a the data for three developing countries are presented: Brazil, India, and Thailand. Brazil’s tariffs are all bound, though the average rate for industrial products is 14.9 percentage points above the currently applied rate (binding overhang). India and Thailand’s tariffs are partially covered by bindings, again with significant binding overhang.
Table 11a: The Post-Uruguay Round and ITAi) Applied Tariffs in Selected Industrial and Developing Countries
Post-UR and ITA tariffs (in %) Simple
average Standard deviation
Maximum tariff
Binding overhangii)
Agriculture EU 5.9 7.5 74.9 0.3 Japan 6.2 8.1 43.3 1.2 USA 3.5 7.4 90.0 0.5 Brazil 12.9 5.1 27.0 22.6 India 31.0 20.8 150.0 90.7 Thailand 26.5 14.4 65.0 7.1
Non-agriculture EU 3.7 3.6 17.0 0.4 Japan 2.3 3.4 30.9 0.1 USA 3.2 4.3 37.5 0.2 Brazil 15.9 6.0 35.0 14.9 India 19.2 16.5 40.0 3.9 Thailand 10.5 10.8 80.0 7.8
i) ITA = Information Technology Agreement. ii) Binding overhang is the gap between the bound rate and the current
applied tariff rate. Source: Francois/van Meijl/van Tongeren (2003), Table 2.2.
Because of the small binding overhang in industrial countries a 50 percentage point tariff reduction according to the Swiss formula leads also to a comparable strong reduction in applied tariffs (see last column in Table 11b). In general, for developing countries, the binding overhang is large enough that reductions in the range of 50 percent are necessary to force any reductions in average applied rates for countries like Brazil. For many countries, even this will have little or no effect, as tariffs are largely unbound. This limits severely the negotiating leverage of developing countries in the WTO. This is also why the debate over using bound, applied, or
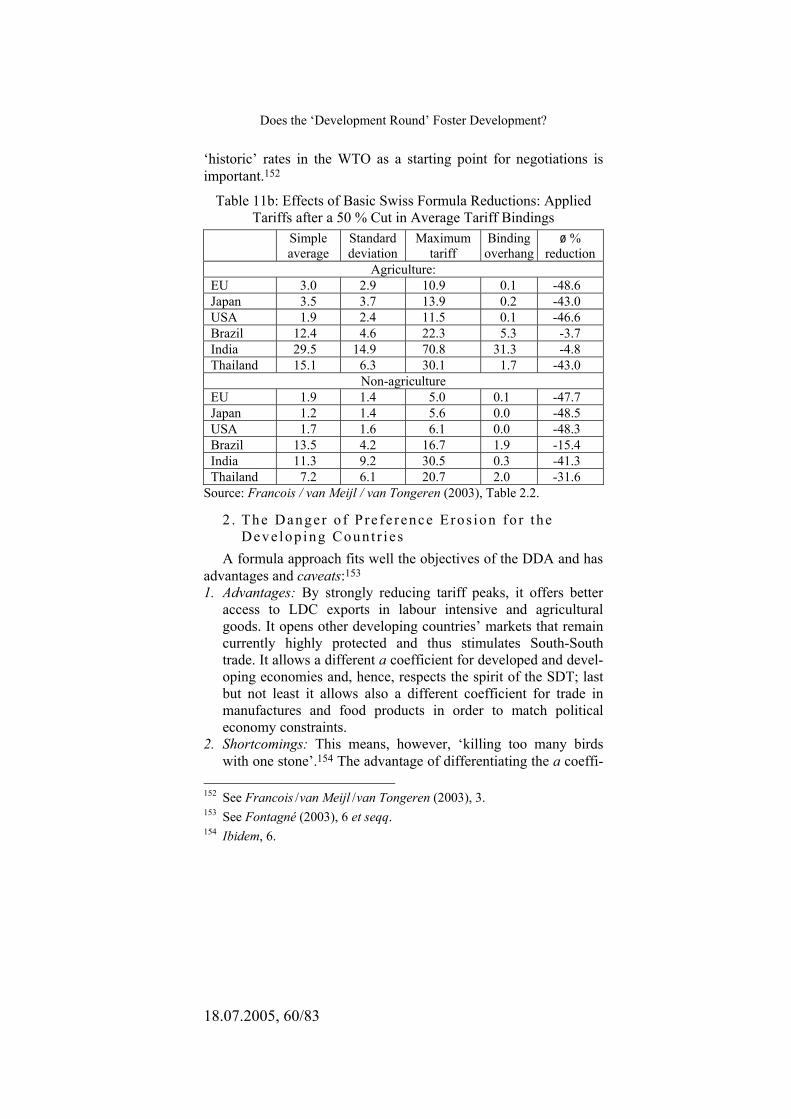
Does the ‘Development Round’ Foster Development?
18.07.2005, 60/83
‘historic’ rates in the WTO as a starting point for negotiations is important.152
Table 11b: Effects of Basic Swiss Formula Reductions: Applied Tariffs after a 50 % Cut in Average Tariff Bindings
Simple average
Standard deviation
Maximum tariff
Binding overhang
ø % reduction
Agriculture: EU 3.0 2.9 10.9 0.1 -48.6 Japan 3.5 3.7 13.9 0.2 -43.0 USA 1.9 2.4 11.5 0.1 -46.6 Brazil 12.4 4.6 22.3 5.3 -3.7 India 29.5 14.9 70.8 31.3 -4.8 Thailand 15.1 6.3 30.1 1.7 -43.0
Non-agriculture EU 1.9 1.4 5.0 0.1 -47.7 Japan 1.2 1.4 5.6 0.0 -48.5 USA 1.7 1.6 6.1 0.0 -48.3 Brazil 13.5 4.2 16.7 1.9 -15.4 India 11.3 9.2 30.5 0.3 -41.3 Thailand 7.2 6.1 20.7 2.0 -31.6
Source: Francois / van Meijl / van Tongeren (2003), Table 2.2.
2 . The Danger o f P re fe rence Eros ion fo r the Deve lop ing Count r i e s
A formula approach fits well the objectives of the DDA and has advantages and caveats:153 1. Advantages: By strongly reducing tariff peaks, it offers better
access to LDC exports in labour intensive and agricultural goods. It opens other developing countries’ markets that remain currently highly protected and thus stimulates South-South trade. It allows a different a coefficient for developed and devel-oping economies and, hence, respects the spirit of the SDT; last but not least it allows also a different coefficient for trade in manufactures and food products in order to match political economy constraints.
2. Shortcomings: This means, however, ‘killing too many birds with one stone’.154 The advantage of differentiating the a coeffi-
152 See Francois / van Meijl / van Tongeren (2003), 3. 153 See Fontagné (2003), 6 et seqq. 154 Ibidem, 6.

Fritz Breuss
18.07.2005, 61/83
cient contradicts the objective of making agricultural markets more open, or of enhancing South-South trade. Tariff peaks po-tentially affect exports of LDCs which are nevertheless con-ceded preferential market access (ACP countries, the GSP scheme, AGOA, EBA, etc.). Hence, any (non-linear) formula approach will have two effects: a) to eradicate the remaining peaks faced by LCDs exporters, and b) to erode the margin of preferences they had been conceded. The net effect may be negative. Fontagné by discussing a number of other subtle problems con-
nected with the impact of formula based trade liberalization for developing countries simulates the different formula approaches with a multi-country CGE model (see Table 12).155
Table 12: Formula Approaches – which Differences for Welfare Changes? (Simulations with a CGE world model)
Long-run welfare change in %
Linear formula
Linear formula
excl. peaks
Swiss formula
Swiss formula +SDT
EU-25 0.38 0.14 0.55 0.47 USA 0.18 0.09 0.24 0.12 Japan 0.86 0.29 1.45 1.29 Cairns 0.30 0.14 0.35 0.39 Developing Asia 0.80 0.28 1.07 0.91 ACP countries 0.43 0.26 0.41 0.29 Other countries 0.55 0.20 0.79 0.70 World 0.42 0.16 0.61 0.51
Assumptions for coefficient a = 35 % for the linear formula t1 = at0 and a Swiss formula, and a coefficient a equal to 28 (manufactures) or 58 (food). Source: Fontagné (2003), 8.
Fontagné focuses on market access with a menu of scenarios in which developing countries are conceded SDT. Bilateral tariffs at the product level (HS-6 level), derived from MAcMaps, are cut according to a linear formula (where tariff peaks156 can be included or excluded from the liberalization), versus a truncated Swiss for-
155 Ibidem, 7 et seq. 156 Tariff peaks are defined as those superior to 15 percent in manufactur-
ing, energy and raw materials, and those above 85 percent in agricul-ture and agrofood.
Does the ‘Development Round’ Foster Development?
18.07.2005, 62/83
mula157 (applied to all tariffs). Coefficients of reduction are those suggested by previous rounds, and the SDT offered to developing countries is a lower coefficient of linear reduction and a larger a coefficient in the Swiss formula.158
The results of Table 12 highlight that benefits of increased mar-ket access at the world level are much higher with a Swiss formula and, in contrast, rather limited if one adopts a linear formula ex-cluding peaks. Considering the Swiss formula combined with the SDT, the largest benefits accrue to Japan, where agriculture is highly protected. This is also why EU gains are much larger than US ones. Lastly, ACP countries record very limited gains, in par-ticular in comparison to developing Asia which has in the past been conceded less preferences by industrialised importers.
In summing up, Fontagné asserts that a formula approach leads to a sizeable erosion of preferences conceded to the poorest devel-oping countries so far, with the aim of favouring exports of small and insufficiently diversified economies. The more specialised the exporters, the larger the benefits extracted in the past from prefer-ential access schemes and the stronger the adverse effects of market opening they will have to cope with.159 B. How to Estimate Gains from Multilateral Trade Liberalization?
The estimation in quantitative terms of the potential gains from trade liberalization is now done primarily with CGE models. The systematic use of CGE models to simulate the effects of trade ne-gotiations started during the Tokyo Round.160 Since then rapid pro-gress has been made as regards both modelling and data collection and assembly. Results from CGE simulations found a wide echo before the conclusion of the Uruguay Round, showing that nearly all countries would have lost opportunities from a failure to reach agreement.161
157 In a truncated Swiss formula, the reduction is linear up to the threshold
defined as a tariff peak, and non-linear thereafter. 158 Fontagné (2003), 8. 159 Ibidem. 160 See Deardorff / Stern (1981); Deardorff / Stern (1986); Whalley (1985). 161 See the surveys of Harrison et al. (1997), and Francois et al. (1994)
and (1996).
Fritz Breuss
18.07.2005, 63/83
In recent years, several CGE analyses of the effects of trade policy reforms in a future WTO Round have been produced.162 Some of them only consider agricultural liberalization (with welfare gains ranging from US$ 27 billion to US$ 384 billion, depending on the liberalization assumptions and the model type), others in-clude manufacturing tariff reform (the welfare gains range from US$ 284 billion to US$ 1,210 billion). Only a few analyses con-sider the impact of service trade liberalization, mainly because of poor data on trade flows in the services sector and poor measure-ment of service trade barriers. The few studies considering liberali-zation in trade in services produce very large welfare gains.163 These large gains are due to two reasons: 1) Services account for a large share in consumption in most middle and high-income coun-tries, much larger than that of agriculture. 2) Services are major inputs in the production of manufactures. Estimations of the World Bank of the effects of a 100 percent cut in merchandise protection and a 100 percent cut in service protection lead to a welfare gain in the static case of US$ 255 billion and in the dynamic version of US$ 830 billion.164 Brown et al. with the same liberalization experi-ment reach welfare gains of US$ 1,857 billion.165
There are several reasons for the large discrepancies in the esti-mations of welfare gains: a) assumption about the deepness of the liberalization; b) results are sensitive to model specifications: liber-alization gains are higher in models allowing for increasing returns to scale and imperfect competition in the manufacturing sector. The gains are further enhanced in specifications allowing for dynamic (growth) effects of trade liberalization (trade-related changes in savings and investment or with development in productivity); c) also the chosen baseline influences the outcome; in most recent studies the GATP database (of 1997) is used to replicate the world economy. These most updated versions yield lower estimates of the world-wide liberalization effects since the status-quo level of trade barriers is lower (after the tariff cuts of the Uruguay Round); d) also the dimensionality of the models (the number of sectors and regions considered) influences the outcome.
162 For a survey, see UNCTAD (2003), 39, and also Francois (2000). 163 See Brown et al. (2001); World Bank (2001). 164 World Bank (2001). 165 Brown et al. (2001).

Does the ‘Development Round’ Foster Development?
18.07.2005, 64/83
Notwithstanding the notable differences in results from the vari-ous CGE analyses, there are a number of common findings:166 1) Global welfare results of agricultural liberalization are quite similar across models and studies. This is due to the consensus of model-ling agriculture as a constant returns to scale sector where trade-related dynamic gains are quite limited. 2) A common feature of static, constant returns to scale CGE models is that the global gains associated with (full) agricultural liberalization are not very differ-ent from those originating from trade liberalization in manufactures. 3) Concerning the source of gains, almost all studies show that the major source of the gains accruing to each country is its own liber-alization, rather than that of partner countries. 4) As for the distri-bution of the global gains between developed and developing countries, in the majority of the studies it was found that the gains are shared quite equally between the two groups. Among develop-ing countries, Asian countries will reap the largest gains, while the gains for Latin American and African countries will be more lim-ited. Even possible losses are found for Sub-Saharan countries as-sociated with agricultural liberalization, markedly with terms-of-trade developments as a consequence of export subsidies removal.
In the following two recent CGE model exercises are presented. One is a simulation of a world-wide cut of all merchandise tariffs (agricultural and manufactures) with a static model.167 The other one by Francois et al. is more ambitious as it considers a complete liberalization package (agriculture, manufactures, services) and uses a model with imperfect competition and dynamic elements.168
1 . UNCTAD Simula t ions UNCTAD uses a static CGE model based on GTAP5 data base
with a benchmark year 1997, disaggregated to six sectors (natural resources, manufactures, primary and processed agricultural prod-ucts, textiles and apparel, services) and twelve world regions of which four are developing country regions.169 A worldwide 50 per-cent reduction of all merchandise tariffs (agricultural and manu-factures) – a so-called comprehensive liberalization scenario – leads to the following results (see Table 13): The global welfare gain of 166 See UNCTAD (2003), 40. 167 Ibidem, 48 et seq. 168 Francois / van Meijl / van Tongeren (2003) 169 UNCTAD (2003), 48 et seq.
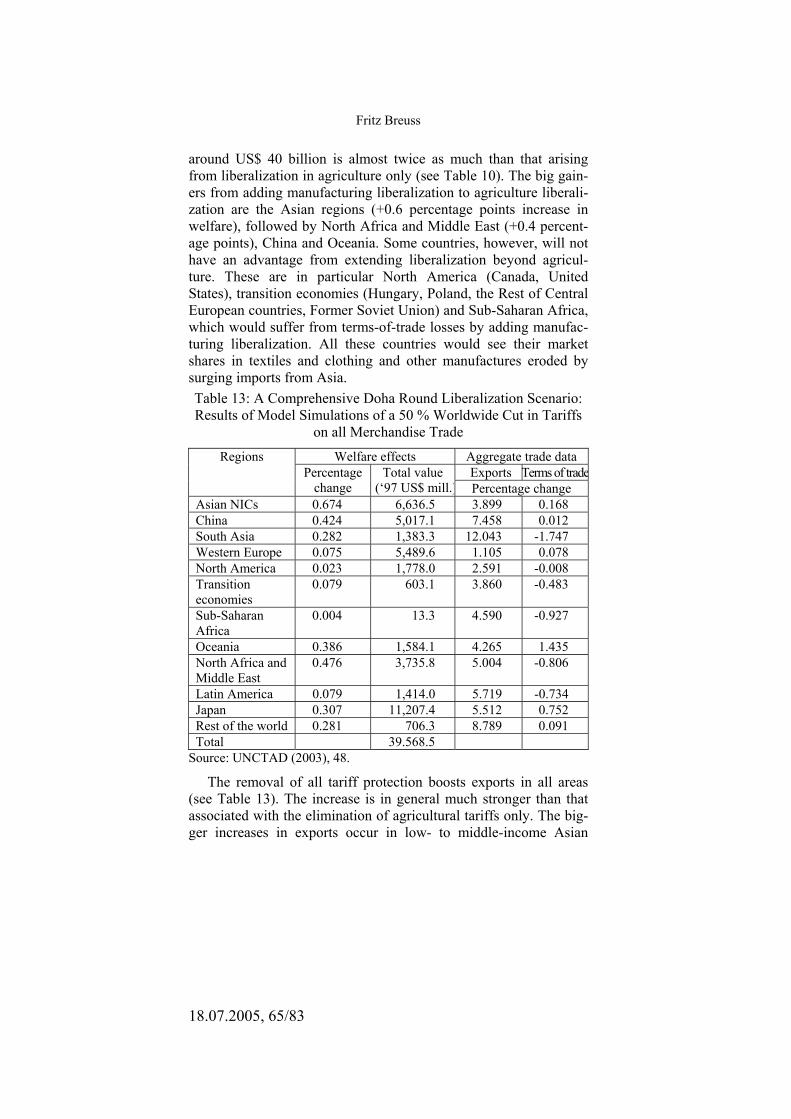
Fritz Breuss
18.07.2005, 65/83
around US$ 40 billion is almost twice as much than that arising from liberalization in agriculture only (see Table 10). The big gain-ers from adding manufacturing liberalization to agriculture liberali-zation are the Asian regions (+0.6 percentage points increase in welfare), followed by North Africa and Middle East (+0.4 percent-age points), China and Oceania. Some countries, however, will not have an advantage from extending liberalization beyond agricul-ture. These are in particular North America (Canada, United States), transition economies (Hungary, Poland, the Rest of Central European countries, Former Soviet Union) and Sub-Saharan Africa, which would suffer from terms-of-trade losses by adding manufac-turing liberalization. All these countries would see their market shares in textiles and clothing and other manufactures eroded by surging imports from Asia. Table 13: A Comprehensive Doha Round Liberalization Scenario: Results of Model Simulations of a 50 % Worldwide Cut in Tariffs
on all Merchandise Trade
Welfare effects Aggregate trade data Exports Terms of trade
Regions Percentage
change Total value
(‘97 US$ mill.) Percentage change Asian NICs 0.674 6,636.5 3.899 0.168 China 0.424 5,017.1 7.458 0.012 South Asia 0.282 1,383.3 12.043 -1.747 Western Europe 0.075 5,489.6 1.105 0.078 North America 0.023 1,778.0 2.591 -0.008 Transition economies
0.079 603.1 3.860 -0.483
Sub-Saharan Africa
0.004 13.3 4.590 -0.927
Oceania 0.386 1,584.1 4.265 1.435 North Africa and Middle East
0.476 3,735.8 5.004 -0.806
Latin America 0.079 1,414.0 5.719 -0.734 Japan 0.307 11,207.4 5.512 0.752 Rest of the world 0.281 706.3 8.789 0.091 Total 39.568.5
Source: UNCTAD (2003), 48.
The removal of all tariff protection boosts exports in all areas (see Table 13). The increase is in general much stronger than that associated with the elimination of agricultural tariffs only. The big-ger increases in exports occur in low- to middle-income Asian

Does the ‘Development Round’ Foster Development?
18.07.2005, 66/83
countries (China, South Asia), followed by other developing coun-tries and by Japan and Oceania. Western Europe and North Amer-ica do not achieve major expansion of their exports.
These results - not taking into account dynamic effects and im-perfect competition in the manufacturing sectors - underline what was found in previous studies,170 namely that the inclusion of manufacturing liberalization in a ‘comprehensive round’ of nego-tiations would be especially interesting for the developing coun-tries. This conclusion holds for developing economies taken as a single broad aggregate. There are, however, regions, in particular Sub-Saharan Africa, that might actually lose from extending liber-alization from agriculture alone to all merchandise trade.
2 . CGE Mode l S imu la t ions wi th Imper fec t Compe t i t ion
Francois, van Meijl and van Tongeren with a CGE model with imperfect (monopolistic) competition and investment (dynamic) effects simulated the potential gains from a comprehensive Doha-Round trade liberalization.171 They take the short-run (static) and the long-run (dynamic model) view. They include in their scenarios of trade liberalization tariff reductions (in agricultural, manufac-tures and in services trade), elimination of border controls, export subsidies, agricultural support and trade facilitation.
The data on tariffs are taken from the WTO’s integrated data-base, with supplemental information from the World Bank’s recent assessment of detailed pre- and post-Uruguay Round tariff sched-ules and from the UNCTAD/World Bank WITS dataset. All of this tariff information has been concorded to GTAP model sectors. Ser-vices trade barriers are based on the gravity model estimates. Also the schedule of China accession commitments is implemented. While the basic GTAP dataset is benchmarked to 1997, and reflects applied tariffs actually in place in 1997, the authors want to work with a representation of a post-Uruguay Round world. This includes the accession of China, the enlargement of the EU; and Agenda 2000 reforms a part of the baseline. In the baseline scenario there-fore the following inclusions have been made:172
170 See Hertel / Martin (2000). 171 Francois / van Meijl / van Tongeren (2003). 172 Ibidem, 8.
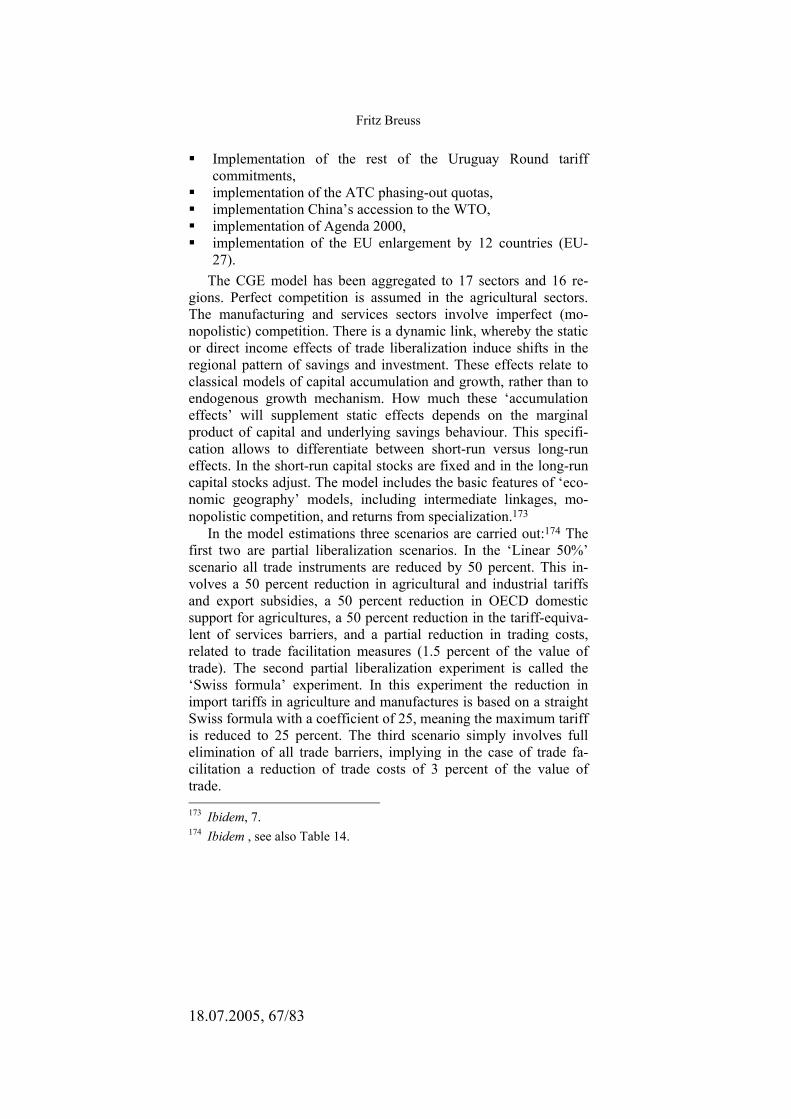
Fritz Breuss
18.07.2005, 67/83
Implementation of the rest of the Uruguay Round tariff commitments,
implementation of the ATC phasing-out quotas, implementation China’s accession to the WTO, implementation of Agenda 2000, implementation of the EU enlargement by 12 countries (EU-
27). The CGE model has been aggregated to 17 sectors and 16 re-
gions. Perfect competition is assumed in the agricultural sectors. The manufacturing and services sectors involve imperfect (mo-nopolistic) competition. There is a dynamic link, whereby the static or direct income effects of trade liberalization induce shifts in the regional pattern of savings and investment. These effects relate to classical models of capital accumulation and growth, rather than to endogenous growth mechanism. How much these ‘accumulation effects’ will supplement static effects depends on the marginal product of capital and underlying savings behaviour. This specifi-cation allows to differentiate between short-run versus long-run effects. In the short-run capital stocks are fixed and in the long-run capital stocks adjust. The model includes the basic features of ‘eco-nomic geography’ models, including intermediate linkages, mo-nopolistic competition, and returns from specialization.173
In the model estimations three scenarios are carried out:174 The first two are partial liberalization scenarios. In the ‘Linear 50%’ scenario all trade instruments are reduced by 50 percent. This in-volves a 50 percent reduction in agricultural and industrial tariffs and export subsidies, a 50 percent reduction in OECD domestic support for agricultures, a 50 percent reduction in the tariff-equiva-lent of services barriers, and a partial reduction in trading costs, related to trade facilitation measures (1.5 percent of the value of trade). The second partial liberalization experiment is called the ‘Swiss formula’ experiment. In this experiment the reduction in import tariffs in agriculture and manufactures is based on a straight Swiss formula with a coefficient of 25, meaning the maximum tariff is reduced to 25 percent. The third scenario simply involves full elimination of all trade barriers, implying in the case of trade fa-cilitation a reduction of trade costs of 3 percent of the value of trade. 173 Ibidem, 7. 174 Ibidem , see also Table 14.
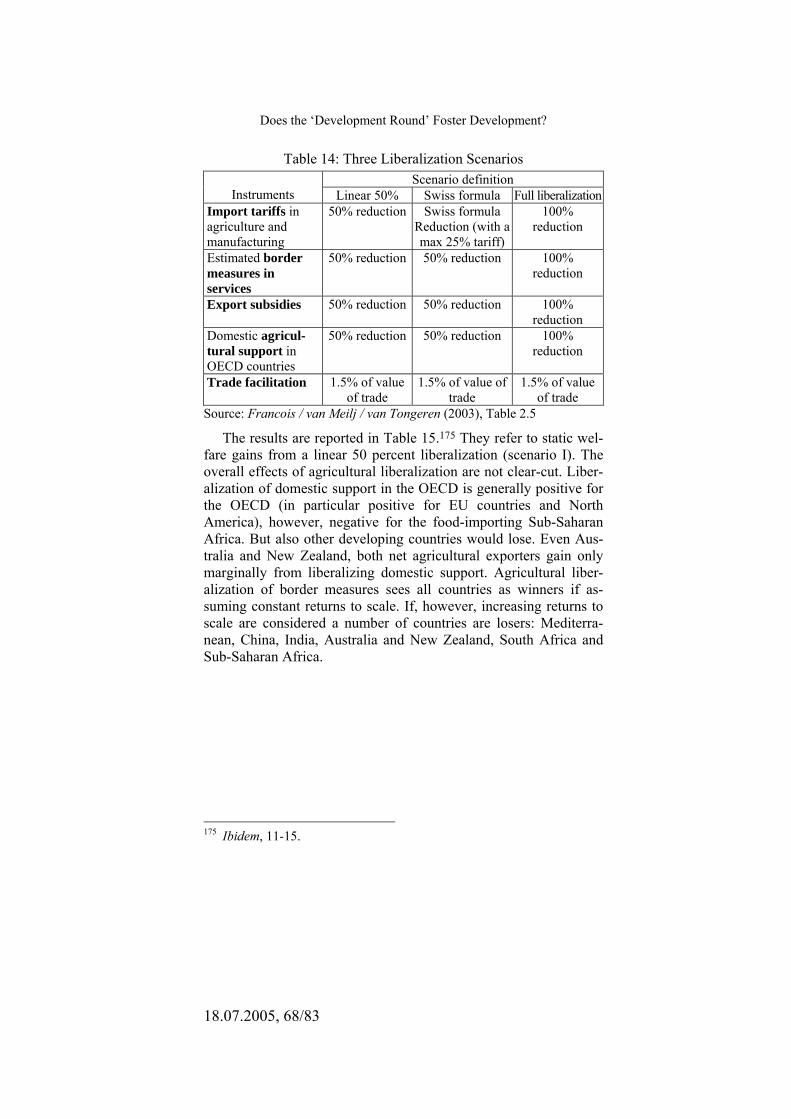
Does the ‘Development Round’ Foster Development?
18.07.2005, 68/83
Table 14: Three Liberalization Scenarios Scenario definition
Instruments Linear 50% Swiss formula Full liberalization Import tariffs in agriculture and manufacturing
50% reduction Swiss formula Reduction (with a max 25% tariff)
100% reduction
Estimated border measures in services
50% reduction 50% reduction 100% reduction
Export subsidies 50% reduction 50% reduction 100% reduction
Domestic agricul-tural support in OECD countries
50% reduction 50% reduction 100% reduction
Trade facilitation 1.5% of value of trade
1.5% of value of trade
1.5% of value of trade
Source: Francois / van Meilj / van Tongeren (2003), Table 2.5
The results are reported in Table 15.175 They refer to static wel-fare gains from a linear 50 percent liberalization (scenario I). The overall effects of agricultural liberalization are not clear-cut. Liber-alization of domestic support in the OECD is generally positive for the OECD (in particular positive for EU countries and North America), however, negative for the food-importing Sub-Saharan Africa. But also other developing countries would lose. Even Aus-tralia and New Zealand, both net agricultural exporters gain only marginally from liberalizing domestic support. Agricultural liber-alization of border measures sees all countries as winners if as-suming constant returns to scale. If, however, increasing returns to scale are considered a number of countries are losers: Mediterra-nean, China, India, Australia and New Zealand, South Africa and Sub-Saharan Africa.
175 Ibidem, 11-15.

Fritz Breuss
18.07.2005, 69/83
Table 15: Static Welfare Effects (Equivalent Variations) from a Linear 50% Liberalization (Scenario I of Table 14), US$ mill.
OECD Developing countries
Other countries
Total (World)
Agriculture (border measures)
24.482 (16.818)
32.446 (11.083)
4.630 61.558 [96.743]
Agriculture (domestic support)
8.744
- 711 9.455 [12.368]
Manufactures (border meas-ures)
12.057 (5.622)
22.230 (12.012)
2.789 37.076 [54.247]
Services liberalization
17.225 (17.918)
6.907 (5.609)
1.963 26.095 [53.053]
Trade facilitation
46.159 (41.204)
26.152 (21.953)
5.881 78.192 [150.870]
Total 108.667 (81.562)
87.735 (50.657)
15.974 212.376 [367.281]
The figures in round brackets refer to the constant returns to scale case; all other figures refer to the increasing returns to scale case. The figures in square brackets refer to the overall welfare gains of a full liberalization (100 percent; scenario III of Table 10). Source: Francois/van Meijl/van Tongeren (2003), Table 2.6 and Tables 4.1 to 4.4.
The results for manufacturing liberalization are more consistent and generally positive. Generally, with increasing returns to scale the effects are twice that of constant returns to scale. Similar to the UNCTAD results the developing countries gain nearly twice as much as the OECD countries from opening-up the markets for manufactures. The gains in the industrial world must be lower be-cause the OECD tariffs are, on average, already below 3 percent for manufacturing whereas the tariffs of the developing countries are five time as high (see Table 11a). China will be hurt by significant manufacturing liberalization. Once the WTO accession is fully im-plemented, the Doha round cannot be expected to yield much addi-tional gains for China. The negative results for China follow pri-marily from an erosion of its terms of trade.
Another important source of overall effects is services, which yield static income gains similar to those of liberalizing manufac-turing. One obvious winner from services liberalization is the
Does the ‘Development Round’ Foster Development?
18.07.2005, 70/83
United States, which picks up more than half of the global welfare gains. Another big (not so obvious) winner is India.
An astonishing result of the simulations by Francois, van Meijl and van Tongeren is that the gains from trade facilitation amount to nearly half of the total welfare gains (see Table 15).176 Biggest win-ners are North America and High Income Asia but also the EU.
Overall the total welfare gain from a really comprehensive Doha round liberalization would be between US$ 212 billion (for a partial 50 percent liberalization) and US$ 367 billion.
In terms of labour market effects, both unskilled and skilled la-bour gain from the partial and full liberalization scenarios in most regions, except for some cases in the CEEC economies and in China. Similarly, there are positive wage effects for unskilled workers in all regions, except for China in all scenarios and the CEEC in some cases.177
Overall export effects are clear-cut.178 Export growth, under all scenarios, is greatest in the developing countries, especially in Asia and the Pacific (including India and China), but also in the Mediter-ranean, African, and Latin American economies. The CEEC suffer from trade-erosion with respect to market access to the EU-15 economies. A decomposition of bilateral trade effects shows that much of the potential gains for developing countries depend on the realization of South-South trade opportunities. This would foster the positive development in this respect in the last decade.179
The bilateral trade effects – decomposed into the broad aggre-gate trade flows between the major world regions: North-North, North-South and South-South – resulting form the liberalization experiments by Francois, van Meijl and van Tongeren underpin the above raised question whether the EU needs the WTO at all (see chapter II.F.2).180
176 Ibidem. 177 Ibidem, 13. 178 Ibidem, 13 and Figure 4.2. 179 See WTO (2003), 24 et seqq. 180 Francois / van Meijl / van Tongeren (2003), 14.
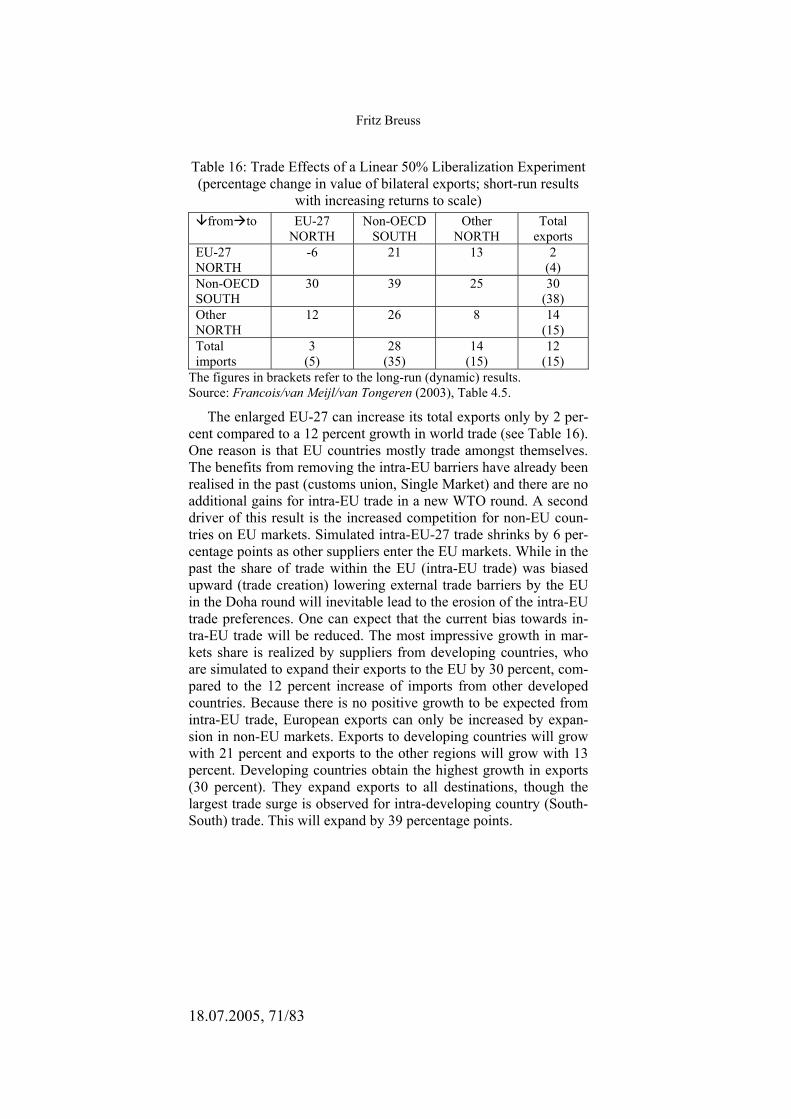
Fritz Breuss
18.07.2005, 71/83
Table 16: Trade Effects of a Linear 50% Liberalization Experiment (percentage change in value of bilateral exports; short-run results
with increasing returns to scale) from to EU-27
NORTH Non-OECD
SOUTH Other
NORTH Total
exports EU-27 NORTH
-6 21 13 2 (4)
Non-OECD SOUTH
30 39 25 30 (38)
Other NORTH
12 26 8 14 (15)
Total imports
3 (5)
28 (35)
14 (15)
12 (15)
The figures in brackets refer to the long-run (dynamic) results. Source: Francois/van Meijl/van Tongeren (2003), Table 4.5.
The enlarged EU-27 can increase its total exports only by 2 per-cent compared to a 12 percent growth in world trade (see Table 16). One reason is that EU countries mostly trade amongst themselves. The benefits from removing the intra-EU barriers have already been realised in the past (customs union, Single Market) and there are no additional gains for intra-EU trade in a new WTO round. A second driver of this result is the increased competition for non-EU coun-tries on EU markets. Simulated intra-EU-27 trade shrinks by 6 per-centage points as other suppliers enter the EU markets. While in the past the share of trade within the EU (intra-EU trade) was biased upward (trade creation) lowering external trade barriers by the EU in the Doha round will inevitable lead to the erosion of the intra-EU trade preferences. One can expect that the current bias towards in-tra-EU trade will be reduced. The most impressive growth in mar-kets share is realized by suppliers from developing countries, who are simulated to expand their exports to the EU by 30 percent, com-pared to the 12 percent increase of imports from other developed countries. Because there is no positive growth to be expected from intra-EU trade, European exports can only be increased by expan-sion in non-EU markets. Exports to developing countries will grow with 21 percent and exports to the other regions will grow with 13 percent. Developing countries obtain the highest growth in exports (30 percent). They expand exports to all destinations, though the largest trade surge is observed for intra-developing country (South-South) trade. This will expand by 39 percentage points.

Does the ‘Development Round’ Foster Development?
18.07.2005, 72/83
The simulation experiments by Francois, van Meijl and van Tongeren, including nearly all possible issues of market access issues under the Doha Round show remarkable welfare gains. Nev-ertheless Singapore issues (the relationship between trade and in-vestment policy, the interaction between trade and competition policies, transparency in government procurement practices, and trade facilitation practices) are only partly and then somewhat ex-aggerated (e.g. in the case of trade facilitation) included. Very little is known about the welfare and/or growth effects of a more secure network of regulations concerning Foreign Direct Investments (FDI), a cornerstone of globalization of multinational firms.
V. Conclusions
The development agenda of the Doha Round may turn out to be a mere act of window-dressing. Most empirical studies confirm that there is no simple relationship between openness (trade liberaliza-tion) and growth and therefore development. Recent experience with the success and/or failure of poverty alleviation programs at the World Bank and the IMF may, however, help to teach the WTO that it should concentrate on its primal business, namely market access. The mandates of the WTO increased from Round to Round. In the Doha Round a climax in complexity seems to have been reached which may well be the reason that it is so difficult to reach an overall agreement. Given the heterogeneity of mandates, it is not always clear whether the various objectives (development, Singa-pore issues, market access in general) in the DDA are mutually compatible.
The simulation studies discussed above give a clear picture of winners and losers of a delayed Doha Round. The large industrial countries and regions (United States with NAFTA) and the enlarged European Union with its extended regional trade agreements (e.g. with the ACP) have no distinctive interest in further liberalising world trade. Its intra-trade shares are already – in particular in the case of the EU – so large that any further liberalization only hurts them. The big losers of further delayed trade liberalization are the developing countries. All simulations studies show that they would gain the most from further market access in particular when elimi-nating the still considerably high tariff peaks in products where they have comparative advantage vis-à-vis the industrial countries. Al-though the average industrial goods tariffs are already very low, there are still in place many subtle forms of protectionism (like
Fritz Breuss
18.07.2005, 73/83
tariff peaks and escalation and contingent protection) - in particular in the relations between the North and the South. Furthermore the tariffs in the developing countries are generally higher than in the industrial countries. It is therefore of utmost importance to elimi-nate the tariff peaks and generally to cut tariffs in developing coun-tries. This would increase welfare in the developed world and spur South-South trade.
Bibliography
Daron Acemoglu / Simon Johnson / James A. Robinson (2001), The Colonial Origins of Comparative Development: An Empirical Investigation, in: The American Economic Review 91 (2001), No. 5, 1369-1401.
Alberto F. Alesina / Dani Rodrik (1994), Distributive Politics and Economic Growth, in: Quarterly Journal of Economics 109 (1994), 465-490.
Kym Anderson / Jikun Huang / Elena Ianchovichina (2004), Will China’s WTO Accession Worsen Rural Poverty?, CEPR Discus-sion Paper Series, No 4196, London, January 2004.
Marc Bacchetta / Bijit Bora (2001), Post-Uruguay Round Market Access Barriers for Industrial Products, UNCTAD Policy Issues in International Trade and Commodities, Study Series No. 12, Sales No. E.01.II.D.23, New York / Geneva (United Nations) 2001.
Marc Bacchetta / Bijit Bora (2002), Market Access for Industrial Products and the Doha Development Agenda, paper prepared for the World Bank Conference on ‘Informing the Doha Process: New Trade Research for Developing Countries’, Cairo, May 20-21, 2002.
Harald Badinger / Fritz Breuss (2004), What Has Determined the Rapid Post-War Growth of Intra-EU Trade?, in: Review of World Economics (Weltwirtschaftliches Archiv), Vol. 140 (2004), No. 1, 31-51.
Does the ‘Development Round’ Foster Development?
18.07.2005, 74/83
Kyle Bagwell / Robert W. Staiger (1999), An Economic Theory of GATT, in: The American Economic Review 89 (1999), No. 1, 215-248.
Scott L. Baier / Jeffrey H. Bergstrand (2001), The Growth of World Trade: tariffs, transport costs and income similarity, in: Journal of International Economics 53 (2001), 1-17.
Paul Bairoch (1993), Economics and World History: Myths and Paradoxes, Chicago / IL (The University of Chicago Press) 1993.
Robert J. Barro (1999), Inequality and Growth in a Panel of Coun-tries, Harvard University, 1999.
Antoine Bouët / Lionel Fontagné / Mondher Mimouni / Xavier Pichot (2001), Market Access Maps: A Bilateral and Disag-gregated Measure of Market Access, CEPII Working Paper No. 18, Centre d’Etudes Prospectives et d’Informations Internation-ales, Paris 2001.
Paul Brenton / Miriam Manchin (2002), Making the EU Trade Agreements Work: The Role of Rules of Origin, CEPS Working Document No 183, Center for European Policy Studies, Brussels 2002.
Fritz Breuss (2003), WTO Dispute Settlement in Practice – An Economic Assessment, in: Breuss / Griller / Vranes (2003), 131-184.
Fritz Breuss / Stefan Griller / Erich Vranes (Eds.) (2003), The Ba-nana Dispute: An Economic and Legal Analysis (= Europa-institut Wirtschaftsuniversität Wien Publication Series Vol. 19), Wien / New York (Springer) 2003.
Drusilla K. Brown / Alan V. Deardorff / Robert M. Stern (2001), CGE Modelling and Analysis of Multilateral and Regional Neogtiation Options, Research Seminar in International Eco-nomics, Discussion Paper No. 468, University of Michigan: Ann Arbor/MI 2001.
Ha-Joon Chang (2002), Kicking away the Ladder, London (Anthem Press: Wimbledon Publishing Company) 2002.
David T. Coe / Elhanan Helpman (1995), International R&D spill-overs, in: European Economic Review 39 (1995), No. 5, 859-887.

Fritz Breuss
18.07.2005, 75/83
David T. Coe / Elhanan Helpman / Alexander W. Hoffmaister (1997), North-south R&D spillovers, in: The Economic Journal 107 (1997), 134-149.
Judith M. Dean / Seema Desai / James Riedel (1994), Trade Policy Reform in Developing Countries since 1985: A review of the Evidence, World Bank Discussion Papers 267, Washington/DC 1994.
Alan V. Deardorff / Robert M. Stern (1981), A disaggregated model of world production and trade: An estimate of the impact of the Tokyo Round, in: Journal of Policy Modeling 3 (1981), 127-152.
Alan V. Deardorff / Robert M. Stern (1986), The Michigan Model of World Production and Trade: Theory and Application, Cam-bridge/MA / London (The MIT Press) 1986.
Betina V. Dimaranan / Robert A. McDougall (Eds.) (2002), Global Trade, Assistance, and Production: The GTAP 5 Data Base, Purdue University, Center for Global Trade Analysis, West Lafayette/IN, May 2002.
David Dollar / Aart Kraay (2001), Growth is Good for the Poor, The World Bank Development Research Group, Macroeco-nomics and Growth, Policy Research Working Paper, WPS 2587, Washington/DC, April 2001.
David Dollar / Aart Kraay (2002), Institutions, Trade, and Growth, Carnegie-Rochester Conference Series on Public Policy, 2002, available at http://www.carnegie-rochester.rochester.edu/April 02-pdfs/ITG2.pdf.
Steve Dowrick (1994), Openness and Growth, RBA Annual Con-ference Volume, 2, Reserve Bank of Australia, 1994.
Steve Dowrick / J. Bradford deLong (2001), Globalisation and Convergence, Paper for NBER Conference on Globalisation in Historical Perspective, Santa Barbara, California, May 4-5, 2001, available at http://www.nps.navy.mil/rmmcnab/intlecon/ intlecon01/Globalization%20and%20Convergence.pdf.
European Commission (2002), Responses to the Challenges of Globalisation: A Study on the International Monetary and Fi-nancial System and on Financing for Development, Working Document of the Commission Services, Commission of the
Does the ‘Development Round’ Foster Development?
18.07.2005, 76/83
European Communities, SEC(2002) 185 final, Brussels, 14 Feb-ruary 2002.
Simon J. Evenett (2003), The Doha Development Agenda: The Failure of the WTO Ministerial Meeting in Cancun: Implications for Future Research, CESifo Forum, Vol. 4, No. 3, Autumn 2003, 11-17.
Lionel Fontagné (2003), The Doha Development Agenda: Market Access and Domestic Support Measures, CESifo Forum, Vol. 4, No. 3, Autumn 2003, 3-10.
J. Michael Finger (1993), Antidumping: How It Works and Who Gets Hurt, Ann Arbor/MI (Michigan University Press) 1993.
Jeffrey A. Frankel / David Romer (1999), Does Trade Cause Growth?, in: The American Economic Review, 89 (1999) No. 3, 379-399.
Joseph F. Francois (2000), Assessing the Results of General Equi-librium Studies of Multilateral Trade Negotiations, UNCTAD Policy Issues in International Trade and Commodities, Study Series, No. 3, Sales No. E.00.II.D.24, New York / Geneva (United Nations) 2000.
Joseph F. Francois / Will Martin (2003), Formula Approaches for Market Access Negotiations, CEPR Discussion Paper Series, No. 3720, London, January 2003.
Joseph F. Francois / Brad McDonald / Håkan Nordström (1994), The Uruguay Round: A Global General Equilibrium Assess-ment, Working Paper, GATT, Geneva, November 1994.
Joseph F. Francois / Brad McDonald / Håkan Nordström (1996), A Users’s Guide to Uruguay Round Assessments, CEPR Discus-sion Paper Series, No. 1410, London, June 1996.
Joseph F. Francois / Hans van Meijl / Frank van Tongeren (2003), Trade Liberalization and Developing Countries under the Doha Round, CEPR Discussion Paper Series, No. 4032, London, August 2003.
John L. Gallup / Jeffrey D. Sachs / Aandrew D. Mellinger (1998), Geography and Economic Development, NBER Working Paper, No. W6849, December 1998.

Fritz Breuss
18.07.2005, 77/83
David Greenaway / Wyn Morgan / Peter Wright (1998), Trade Re-form, Adjustment and Growth: What does the Evidence Tell us?, in: The Economic Journal 108 (1998), Issue 450, 1547-1561.
Spencer J. Henson / Rupert J. Loader / Alan Swinbank / Maury Bedahl / Nicole Lux (2000), Impact of Sanitary and Phytosani-tary Measures on Developing Countries, Centre for Food Eco-nomics Research, University of Reading, Reading 2000.
Robert Hall / Charles I. Jones (1999), Why Do Some Countries Produce So Much More Output per Worker than Others?, in: Quarterly Journal of Economics, 114 (1999), No. 1, 83-116.
Glenn W. Harrison / Thomas F. Rutherford / David G. Tarr (1997), Quantifying the Uruguay Round, in: The Economic Journal 107 (1997), 1405-1430.
Glenn W. Harrison / Thomas F. Rutherford / David G. Tarr (2003), Trade liberalization, poverty and efficient equity, in: Journal of Development Economics 71 (2003), 97-128.
Tom W. Hertel / Will Martin (2000), Liberalizing agriculture and manufactures in a millennium round: Implications for develop-ing countries, in: World Economy 23 (2000), 455-470.
Anwarul Hoda (2001), Tariff Negotiations and Renegotiations un-der the GATT and WTO: Procedures and Practices, Cambridge (Cambridge University Press) 2001.
Bernard Hoekman (2002a), Strengthening the Global Trade Archi-tecture for Development: The Post-Doha Agenda, in: World Trade Review 1 (2002), No. 1, 23-45.
Bernard Hoekman (2002b), Economic Development and the WTO After Doha, CEPR Discussion Paper Series, No. 3374, London, May 2002.
Bernard Hoekman / Petros Mavroïdis (1996), Dumping, Anti-dumping and Antitrust, in: Journal of World Trade 30 (1996), No. 1, 27-52.
Bernard Hoekman / Francis Ng / Marcelo Olarreaga (2001), Eliminating Excessive Tariffs on Exports of Least Developed Countries, Washington/D.C. (The World Bank) 2001 (published in: The World Bank Economic Review 16 (2002), No. 1, 1-21).

Does the ‘Development Round’ Foster Development?
18.07.2005, 78/83
Bernard Hoekman / Francis Ng / Marcelo Olarreaga (2002), Re-ducing Agriculture Tariffs versus Domestic Support: What’s More Important for Developing Countries?, CEPR Discussion Paper Series, No. 3576, London, October 2002.
Elena Ianchovichina / Aaditya Mattoo / Marcelo Olarreaga (2001), Unrestricted Market Access for Sub-Saharan Africa: How much is it worth and who pays?, World Bank Working Paper, No. 2595, April 2001.
IMF (2003), The tale of two giants: India and China, IMF Survey, International Monetary Fund, Vol. 32, No. 22, December 15, 2003.
IMF and The World Bank (2002), Market Access for Developing Country Exports – Selected Issues, Prepared by the Staffs of the International Monetary Fund (IMF) and World Bank, approved by Timothy Geithner and Gobind Nankani, Washington/D.C., September 26, 2002.
Daniel Kaufman / Aart Kraay / Pablo Zoido-Lobatón (2002), Gov-ernance Matters II – Updated Indicators for 2000/01, World Bank Policy Research department Working Paper No. 2772, Washington/D.C. 2002.
Jane Kennan / Christopher Stevens (1997), From Lomé to the GSP: Implications for the ACP of Losing Lomé Trade preferences, In-stitute for Development Studies, Brighton (University of Sussex) 1997.
Michael Knetter / Thomas Prusa (2000), Macroeconomic Factors and Antidumping Filings: Evidence from Four Countries, NBER Working Paper No. W8010, National Bureau of Economic Re-search, Cambridge/MA 2000.
Simon Kuznets (1955), Economic Growth and Income Inequality, in: The American Economic Review, 45 (1955), No. 1, 1-28.
Thomas Leoni / Wolfgang Pollan (2003), The Impact of Inequality on Economic Growth, WIFO Working Papers No. 211, Novem-ber 2003.
Giovanni Maggi (1999), The Role of Multilateral Institutions in International Trade Cooperation, in: The American Economic Review 89 (1999), No. 1, 190-214.
Fritz Breuss
18.07.2005, 79/83
Branko Milanovic (2002), Making Globalization Work, presenta-tion at the Brookings/ILO/CEIP conference, Washington/D.C., December 2, 2002.
Branko Milanovic (2003), Income Convergence During the Disin-tegration of the World Economy 1919-39, World Bank Policy Research Working Paper 1941, The World Bank, Development Research Group, Washington/DC, January 2003.
Aaditya Mattoo / Devesh Roy / Arvind Subramanian (2002), The Africa Growth and Opportunity Act: Rules of Origin and the Impact on Market Access, IMF Working Paper WP/02, Wash-ington/D.C., May 2002.
Douglass C. North (1990), Institutions, Institutional Change and Economic Performance, New York (Cambridge University Press) 1990.
OECD (1997), Indicators of Tariff and Non-Tariff Trade Barriers, Paris (Organization for Economic Co-operation and Develop-ment) 1997.
OECD (2003), Agricultural Policies in OECD Countries – Moni-toring and Evaluation, Paris (Organization for Economic Co-op-eration and Development) 2003.
OECD (2004), Development Co-operation 2003 Report, in: The DAC Journal 5 (2004), No. 1, i-237.
Caglar Ozden / Eric Reinhardt (2002), The Perversity of Prefer-ences: GSP and Developing Country Trade Policy, 1976-2000, Emory University, Atlanta/GA 2002 (mimeo).
Kevin H. O’Rourke (2000), Tariffs and Growth in the Late 19th Century, in: The Economic Journal, 110 (2000), Issue 463, 456-483.
Arvind Panagariya (2002), Formula Approaches to Reciprocal Tariff Liberalization, in: Bernard Hoekman / Aaditya Mattoo / Philip English (Eds.), Development, Trade, and the WTO. A Handbook, Washington/D.C. (The World Bank) 2002, 535-539.
Roberto Perotti (1993), Political Equilibrium, Income Distribution and Growth, in: Review of Economic Studies 60 (1993), 755-776.
Does the ‘Development Round’ Foster Development?
18.07.2005, 80/83
Roberto Perotti (1996), Growth, Income Distribution and Democ-racy: What the Data Say, in: Journal of Economic Growth 1 (1996), 149-187.
Torsten Persson / Guido Tabellini (1994), Is Inequality Harmful for Growth?, in: The American Economic Review 84 (1994), 600-621.
Martin Ravallion (2003), The Debate on Globalization, Poverty, and Inequality: Why Measurement Matters, The World Bank Policy Research Working Paper, No. 3038, Policy Research Group, The World Bank, Washington DC, April 21, 2003.
Jeffrey J. Reimer (2002), Estimating the Poverty Impacts of Trade Liberalization, GTAP Working Paper No. 20, Purdue Univer-sity, 2002.
Francisco Rodríguez / Dani Rodrik (2001), Trade Policy and Eco-nomic Growth: A Sceptic’s Guide to Cross-National Literature, in: Ben S. Bernanke / Kenneth S. Rogoff (Eds.), NBER Macro Annual 2000, Cambridge/MA 2001.
Dani Rodrik (2003a), Growth Strategies, Harvard University, John F. Kennedy School of Government, Cambridge/MA, September 2003.
Dani Rodrik (2003b), Institutions, Integration, and Geography: In Search of the Deep Determinants of Economic Growth, in: Dani Rodrik (Ed.), In Search of Prosperity: Analytic Country Studies on Growth, Princeton/NJ (Princeton University Press) 2003.
Dani Rodrik / Aarvind Subramanian / Francesco Trebbi (2002), Institutions Rule: The Primacy of Institutions over Geography and Integration in Economic Development, unpublished paper, Harvard University, Cambridge/MA, October 2002.
Andrew K. Rose (2003), Which International Institutions Promote International Trade?, CEPR Discussion Paper Series, No. 3764, London, January 2003.
Adrew K. Rose (2004), Do We Really Know that the WTO In-creases Trade?, in: The American Economic Review 94 (2004), No. 1, 98-114.
Jeffrey D. Sachs (2001), Tropical Underdevelopment, NBER Working Paper, No. W8119, February 2001.
Fritz Breuss
18.07.2005, 81/83
Jeffrey D. Sachs / Andrew Warner (1995), Economic Reform and the Process of Global Integration, Brookings Papers on Eco-nomic Activity 1995:1, 1-118.
UNCTAD (2001), Duty and Quota Free Market Access for LDCs, UNCTAD and the Commonwealth Secretariat, Geneva 2001.
UNCTAD (2003), Back to the Basics: Market Access Issues in the Doha Agenda, United Nations Conference on Trade and Devel-opment, New York / Geneva (United Nations) 2003.
Athanasios Vamvakidis (1998), Regional Integration and Economic Growth, in: The World Bank Economic Review 12 (1998), No. 2, 251-270.
John Whalley (1985), Trade Liberalization among Major World Trading Areas, Cambridge/MA / London (The MIT Press) 1985.
World Bank (1993), Report on Structural Adjustment Lending III, Washington/D.C. (The World Bank) 1993.
World Bank (2001), Global Economic Prospects and the Develop-ing Countries, Washington/D.C. (The World Bank) 2001.
World Bank (2002), Globalization, Growth and Poverty: Building an Inclusive World Economy, A World Bank Policy Research Report, Washington/D.C. / Oxford (The World Bank and Oxford University Press) 2002.
WTO (2001), Ministerial Declaration, Ministerial Conference, Fourth Session, Doha, 9-14 November 2001, WT/MIN(01)/ DEC/W/1, 14 November 2001.
WTO (2002), Market Access: Unfinished Business – Post-Uruguay Round Inventory and Issues, Special Studies No. 6, Geneva (World Trade Organization) 2002.
WTO (2003), World Trade Report 2003, Geneva (World Trade Organization) 2003.
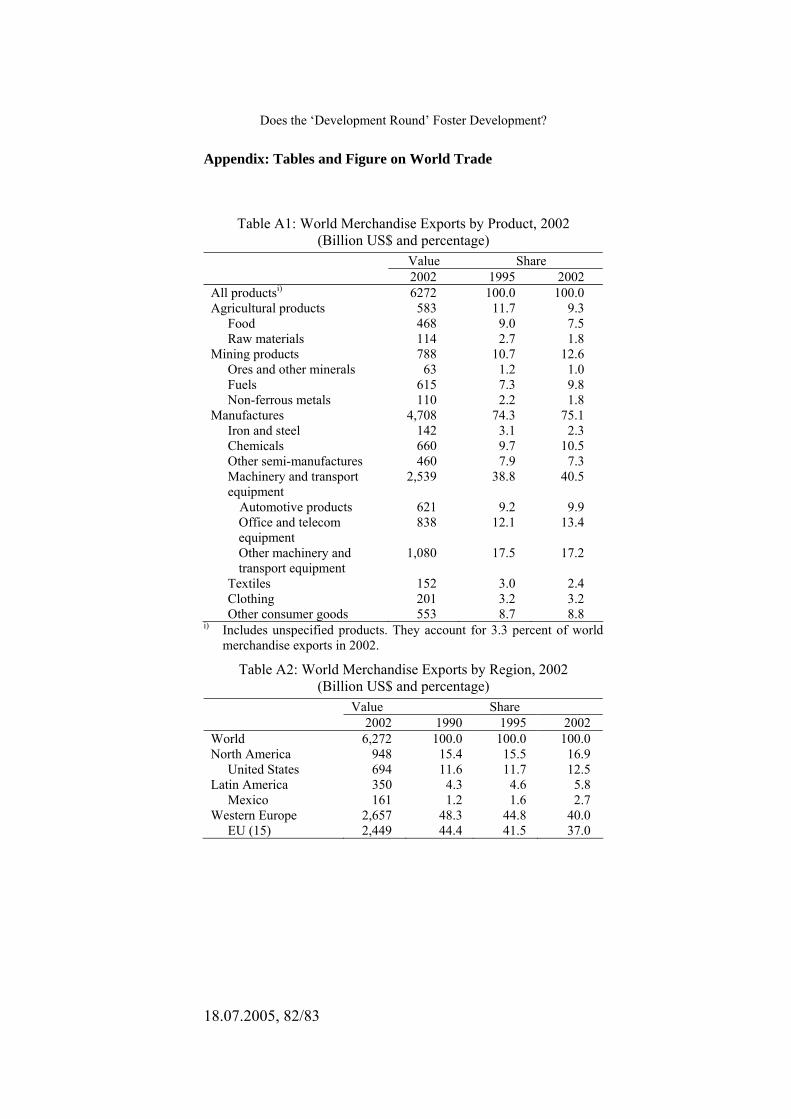
Does the ‘Development Round’ Foster Development?
18.07.2005, 82/83
Appendix: Tables and Figure on World Trade
Table A1: World Merchandise Exports by Product, 2002 (Billion US$ and percentage)
Value Share 2002 1995 2002 All productsi) 6272 100.0 100.0 Agricultural products 583 11.7 9.3 Food 468 9.0 7.5 Raw materials 114 2.7 1.8 Mining products 788 10.7 12.6 Ores and other minerals 63 1.2 1.0 Fuels 615 7.3 9.8 Non-ferrous metals 110 2.2 1.8 Manufactures 4,708 74.3 75.1 Iron and steel 142 3.1 2.3 Chemicals 660 9.7 10.5 Other semi-manufactures 460 7.9 7.3 Machinery and transport equipment
2,539 38.8 40.5
Automotive products 621 9.2 9.9 Office and telecom equipment
838 12.1 13.4
Other machinery and transport equipment
1,080 17.5 17.2
Textiles 152 3.0 2.4 Clothing 201 3.2 3.2 Other consumer goods 553 8.7 8.8
i) Includes unspecified products. They account for 3.3 percent of world merchandise exports in 2002.
Table A2: World Merchandise Exports by Region, 2002 (Billion US$ and percentage)
Value Share 2002 1990 1995 2002 World 6,272 100.0 100.0 100.0 North America 948 15.4 15.5 16.9 United States 694 11.6 11.7 12.5 Latin America 350 4.3 4.6 5.8 Mexico 161 1.2 1.6 2.7 Western Europe 2,657 48.3 44.8 40.0 EU (15) 2,449 44.4 41.5 37.0
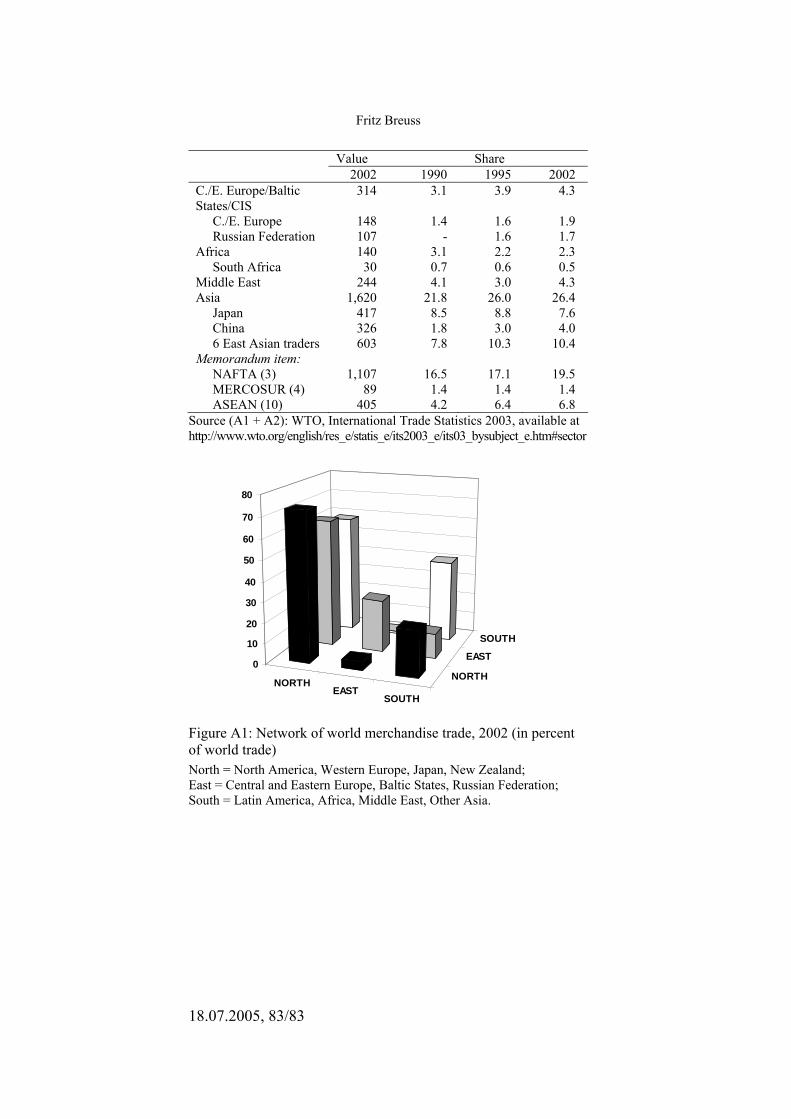
Fritz Breuss
18.07.2005, 83/83
Value Share 2002 1990 1995 2002 C./E. Europe/Baltic States/CIS
314 3.1 3.9 4.3
C./E. Europe 148 1.4 1.6 1.9 Russian Federation 107 - 1.6 1.7 Africa 140 3.1 2.2 2.3 South Africa 30 0.7 0.6 0.5 Middle East 244 4.1 3.0 4.3 Asia 1,620 21.8 26.0 26.4 Japan 417 8.5 8.8 7.6 China 326 1.8 3.0 4.0 6 East Asian traders 603 7.8 10.3 10.4 Memorandum item: NAFTA (3) 1,107 16.5 17.1 19.5 MERCOSUR (4) 89 1.4 1.4 1.4 ASEAN (10) 405 4.2 6.4 6.8
Source (A1 + A2): WTO, International Trade Statistics 2003, available at http://www.wto.org/english/res_e/statis_e/its2003_e/its03_bysubject_e.htm#sector
NORTHEAST
SOUTH
NORTH
EAST
SOUTH
0
10
20
30
40
50
60
70
80
Figure A1: Network of world merchandise trade, 2002 (in percent of world trade) North = North America, Western Europe, Japan, New Zealand; East = Central and Eastern Europe, Baltic States, Russian Federation; South = Latin America, Africa, Middle East, Other Asia.