Embed Size (px)
Citation preview
Thanks go to the National Energy Technology Laboratory for supporting this work, and to Andrea McNemar in particular for her guidance.
Thanks also go to Tom Dewers, Karen Gutierrez and Dave Borns. 32nd USAEE/IAEE North American Conference, Working Results.
Sandia National Laboratories is a multi-program laboratory managed and operated by Sandia Corporation, a wholly owned subsidiary of
Lockheed Martin Corporation, for the U.S. Department of Energy's National Nuclear Security Administration under
contract DE-AC04-94AL85000. SAND2013-4538C.
Abstract
Over the last decade, a substantial amount of economic, engineering, and geoscience research has focused on storing
CO2 in geological formations. Amongst the options for geological storage of CO2 to mitigate atmospheric emissions
from power plants, which include depleted oil and gas formations, unminable coal seams, and other geological
systems, saline formation storage represents the largest storage potential (Litynski et al., 2008). Fossil fuel-based
power plants in the U.S. (coal and natural gas) represented approximately 40% of all CO2 emissions in 2008 and
therefore represent an important factor to address atmospheric CO2 emissions.
The purpose of the analysis presented here is to broadly demonstrate the sensitivity of CO2 capture and storage
(CCS) costs in saline formations to changes in the water demands associated with implementation of CCS across the
power plant fleet (coal and natural gas) due to parasitic energy requirements, and also discuss the effects of
competition for sink space. This paper also highlights the sensitivities of the levelized cost of electricity (LCOE) to
parameters in the Water, Energy and Carbon Sequestration Simulation Model (WECSsim©). This lays the
groundwork for future parametric statistics-based reporting using distributions regarding the type and scale of
uncertainty bounds for both performance and cost characteristics of the complete system. The national-scale version
of WECSsim© developed collaboratively at Sandia National Laboratories (SNL) with the National Energy
Technology Laboratory (NETL) presents the cost uncertainties involved with scaling up CCS at the national level
while accounting for the substantial uncertainty associated with specific geological parameters, efficiencies of
capturing CO2, and treating extracted saline water for potential cooling at power plants. The initial findings indicate
under certain conditions, the majority of added cooling water demands for CCS can be met by extracting and treating
saline formation waters. Additionally, the capture and compression of CO2 remains the largest share of the added
costs to CCS systems as reported in Kobos et al. 2011, and that, competition for geologically-favorable storage sites
will increase the costs to store CO2 due to a mild scarcity effect for these sites relative to less favorable ones with
more challenging water treatment and geological characteristics (Roach et al., 2010, 2012; Kobos et al., 2012).
Methods
The WECSsim© model builds upon the Environmental Protection Agency’s (EPA) national power plant database and
a saline water-bearing formations database developed by the National Energy Technology Laboratory (EPA, 2007;
NatCarb, 2008). WECSsim© is a national-scale integrated assessment model, which includes interconnected
modules specific to Power Plants, CO2 capture technologies, CO2 Storage in Saline Formations, Extracted and
Treated Water, and Power Costs. WECSsim© can be used to evaluate a single hypothetical power plant specified by
the user, a single existing power plant in the U.S., or the entire 2005 U.S. fleet of coal- and gas-fired power plants.
Extracting saline water from the target saline storage formation may be an important strategy to make more efficient
use of the pore space and manage pressure build up in the reservoir. A parametric scenario analysis framework
identifies the key variables that may enhance the viability from a performance and cost perspective across the U.S.
The St. Peter Sandstone formation (St. Peter SS), for example, could store a sizable amount of the nation’s CO2
emissions due to its large size and strategic location.
The overarching scheme of the WECSsim© model’s framework develops in a progressive manner. As described in
several previous reports (Kobos, et al., 2011, 2012, Heath et al., 2012, Klise et al., 2013), each topical component
receives its own module for direct connection to the literature-based assumptions, as well as customizable options.
PARAMETRIC ANALYSIS OF TECHNOLOGY AND SYSTEMS TRADEOFFS FOR
CO2 STORAGE IN SALINE FORMATIONS Peter H. Kobos, Sandia National Laboratories, [email protected]
Geoffrey T. Klise, Sandia National Laboratories, [email protected]
Jesse D. Roach, Sandia National Laboratories, [email protected]
Jason E. Heath, Sandia National Laboratories, [email protected]

Figure 1 illustrates how the model develops for a single power plant and can be extracted to the full coal and natural
gas-fired power generating fleet (Klise et al., 2013).
Figure 1. Illustration of the WECSsim© interrelated modules that include CO2 capture, injection, and water
extraction and reverse osmosis (RO) treatment systems. While only a single power plant, CO2 injection and water
extraction well are shown, there may be many wells associated with a single plant depending upon the scale of the
power plant and mass of CO2 to be stored. (Adapted from Klise et al., 2013).
One of the core challenges to develop and refine a model such as this is capturing the salient technology-based
‘bottom-up’ components while maintaining a model with high-level results to address future infrastructure evolution
questions. These questions include, ‘What are the primary cost drivers at the power plant level? Are these factors
region-specific? If region-specific constraints affect the performance and economic performance of CCS systems, to
what level might these technologies scale up at the national level to reduce CO2 emissions?’
Figure 2 illustrates the current WECSsim© model’s components that capture this salient technology-specific detail
(power plants, specific geological formation parameters, water treatment and well technologies, etc.) while also
developing the national-level results.
Representative
Basin

Figure 2. WECSsim©
modular structure illustrating the ‘bottom-up’, technology-rich modules. The results also
develop national-level power plant, geological formation performance and cost results, as well as results for CO2
captured, CO2 avoided, and water treatment volumes and costs.
Cost and Performance Drivers
Extracting saline waters while storing CO2 in these geologic saline formations serves two purposes. First, it
decreases the water requirement loads on surface water supplies to cool the make-up power plant, and second it
develops a vastly larger storage resource for the CO2 by managing pressure and space within the formation(s).
Within this combined CCS and water extraction system are a few key cost and performance drivers. Developing a
sensitivity analysis for a single power plant to storage sink site illustrates these drivers. The San Juan Generating
Station (SJGS) acts as a case study power plant in part because of the use of this plant in previous regional analysis
(Kobos et al., 2011). The cost of CCS on coal-fired power plants largely is a function of the plant’s technology, size,
and percent CO2 reduction goals. The capture, transportation and storage capital costs are dominated by the capture
component. This is due to the substantial amount of energy required to power the capture technologies, in many
cases an amine-based solvent. Figure 3 illustrates the power cost results for the SJGS base case for both CO2
captured and avoided. The latter results also include the parasitic power and its additional CO2 make up
requirements to capture, compress and transport the CO2 from the SJGS to the saline formation (in this case the San
Juan - Entrada formation).1
1 Additional results include: four CO2 injection wells required, spaced 5.5 miles apart; four saline formation water
extraction wells with an average of 20 ppt TDS; total treated water cost of $25.32 per 1000 gallons; less than one
mile distance between the San Juan Generating Station and the formation site; formation depth of 6,097 ft., 420 ft.
thickness, and formation longevity that may last for 13,790 years if only storing CO2 from this power plant.

a.
b.
Figure 3. Power, CO2 and component-specific costs for the San Juan Generating Station to the San Juan - Entrada
formation for both CO2 captured (a) and avoided (reduced) (b). Note the substantial difference between the CO2
Capture and Compression (CCC) costs for CO2 captured vs. avoided. These correspond to a CCS cost of $61/tonne
CO2 for (a.) and $80/tonne CO2 for (b.). ($US 2013).
Building from this representative case, three central cost and performance drivers were adjusted to illustrate the
WECSsim© model’s parameter sensitivities to the overarching results.
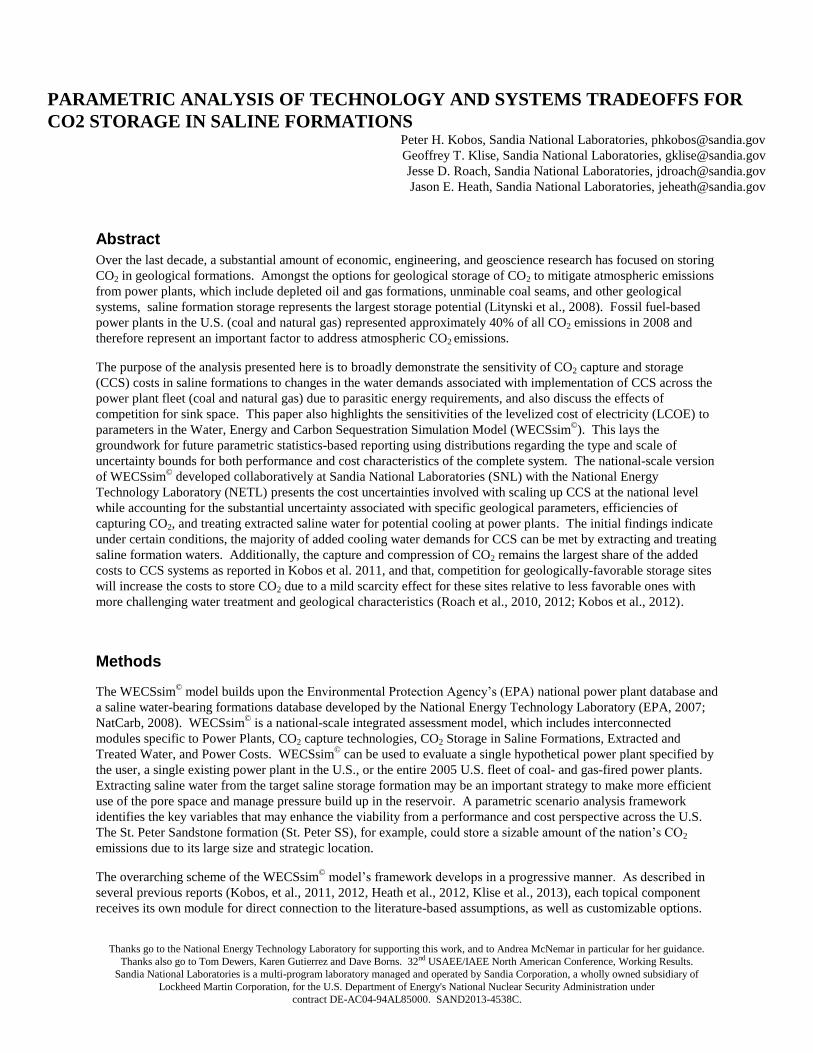
First, the base case for 90% CO2 captured from the base plant (SJGS in this instance) was adjusted to 70% and 50%.
The resulting effects on the top 15 metrics from the model are given in Figures 4 and 5. Figure 5 is an expansion of
those results reported in cents/kWh in $US 2013 to more directly address how system performance characteristics
affect costs on several system sub components.
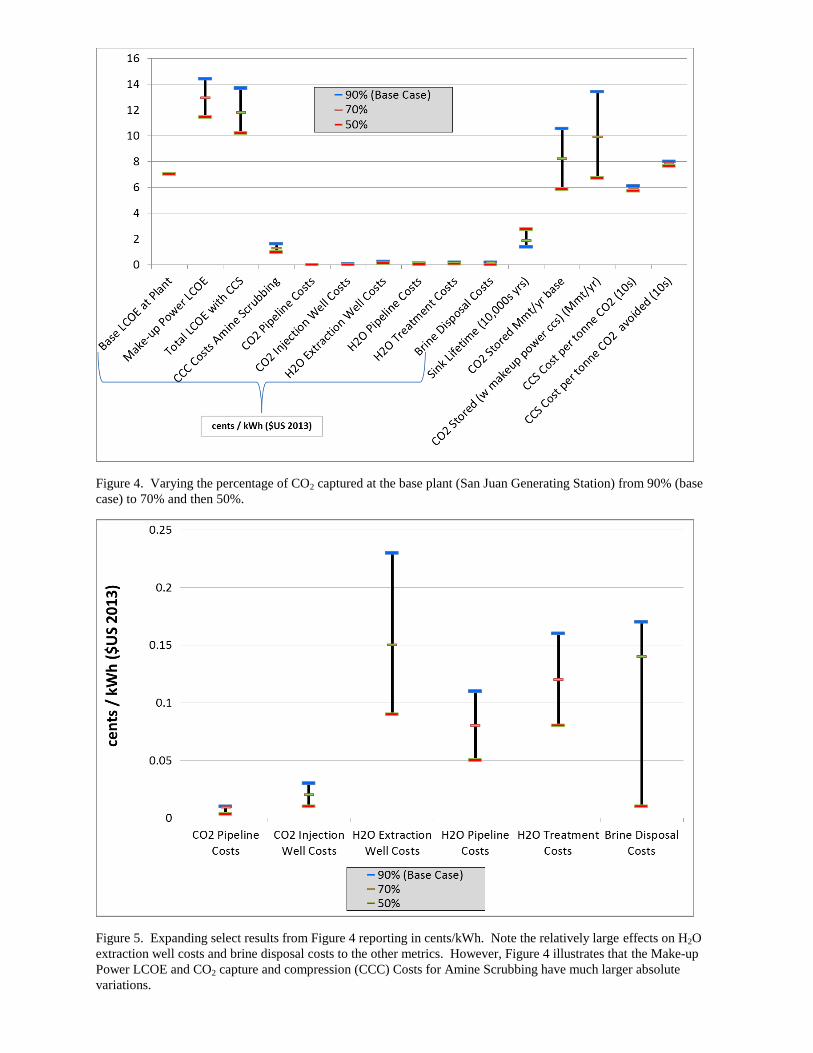
Figure 4. Varying the percentage of CO2 captured at the base plant (San Juan Generating Station) from 90% (base
case) to 70% and then 50%.
Figure 5. Expanding select results from Figure 4 reporting in cents/kWh. Note the relatively large effects on H2O
extraction well costs and brine disposal costs to the other metrics. However, Figure 4 illustrates that the Make-up
Power LCOE and CO2 capture and compression (CCC) Costs for Amine Scrubbing have much larger absolute
variations.

Second, the parasitic energy required to capture, compress, and inject CO2 from the base power plant was adjusted to
represent increasing technological efficiency. The base case is a 30% parasitic energy load for the base power plant.
Two subsequent runs were developed to illustrate a lower 20% and 10% overall parasitic energy load. A key driver
of new CO2 capture systems will be an increased energy efficiency of capture.. Figure 6 and 7 illustrate these
parameter scenarios.
Figure 6. Varying the parasitic energy load at the base plant (San Juan Generating Station) from 30% (base case) to
20% and then 10%.

Figure 7. Expanding select results from Figure 6 reporting in cents/kWh. Note the relatively small effects on the
majority of the metrics. However, Figure 6 illustrates that cost per tonne of CO2 (base and avoided) vary the most.
Third, the efficiency of the reverse osmosis system was adjusted to reflect both an improvement in the technology
and a representative decrease in efficiency for other reasons (e.g., if local water quality chemistry results in
decreased efficiency – this bounds the analysis to a high, low, and medium range to assess the sensitivity of the
metrics to this key technology). Figures 8 and 9 illustrate the parameter adjustments and resulting findings.

Figure 8. Varying the ROSA Efficiency from 64% (base case) to 54% and then 74%.
Figure 9. Expanding select results from Figure 8 reporting in cents/kWh. Note the relatively (and absolutely) small
effects on the majority of the metrics in both figures except for the brine disposal costs. These costs, however,
represent a small fraction of the overall systems’ costs.

A key finding from this sensitivity analysis is that the LCOE is most sensitive to adjusting the percentage of CO2
captured from the base plant, less sensitive to the parasitic energy required for the CCS systems, and least sensitive
to the water treatment technology efficiency. Thus, if one were to look to reduce the overall system’s costs the most
with limited research, development and demonstration (RD&D) funds, it would be advised to first determine the
target percent CO2 capture level desired, and then work to reduce the CO2 capture, compression and transportation
costs the most via reducing parasitic energy loads.
These findings also highlight the functionality of the WECSsim©
model to address single power plant parametric
scenarios, as well as the key technological performance and cost sensitivities to changes in technological efficiency.
National-Scale CO2 and H2O Results
Complementing the power-plant level sensitivity analyses are the WECSsim©
-based national-level CO2, water and
formation use results. As Kobos et al. 2012 showed, a large number of scenario analyses can lead to a robust
portfolio of parametric analyses to find out what the key drivers are when looking to minimize CO2 emissions, water
use, costs, and other salient parameters. Figure 10 illustrates a screenshot from WECSsim©
for the base case where
all coal and natural gas-fired power plants capture 90% of their initial CO2 emissions while competing for the
highest-performing geological saline formations available to them.
Figure 10. The national cost curve for CO2 capture and storage (CCS).
Many of the larger formations that are relatively close to the power plants with favorable geological parameters (e.g.,
high permeability, depths that are favorable to reduce drilling costs, water salinities that are within the higher
performing range of the reverse osmosis water treatment systems, etc.) comprise a large portion of the preferred low-
cost CO2 storage volumes required for the power plants under consideration. These represent the bulk of the targets
implicit in the supply curves shown in Figure 10 matched with coal-fired power plants (generally far lower cost per
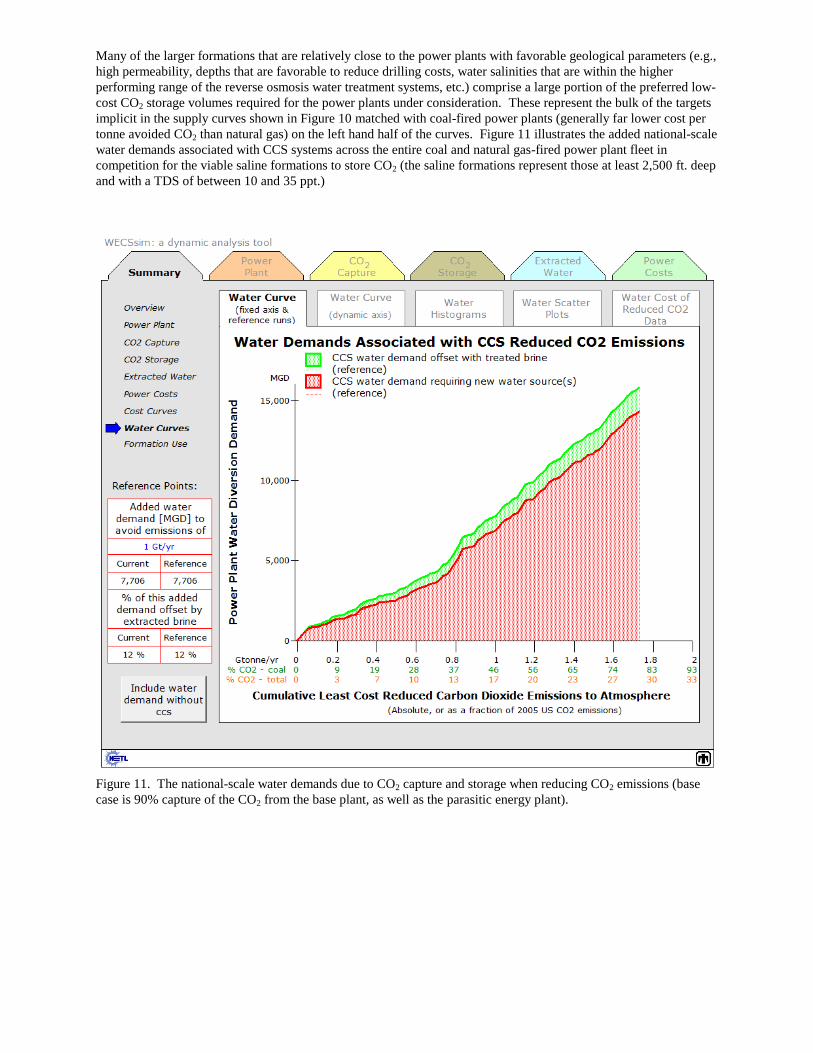
tonne avoided CO2 than natural gas) on the left hand half of the curves. Figure 11 illustrates the added national-scale
water demands associated with CCS systems across the entire coal and natural gas-fired power plant fleet in
competition for the viable saline formations to store CO2 (the saline formations represent those at least 2,500 ft. deep
and with a TDS of between 10 and 35 ppt.)
Figure 11. The national-scale water demands due to CO2 capture and storage when reducing CO2 emissions (base
case is 90% capture of the CO2 from the base plant, as well as the parasitic energy plant).

Figure 12 illustrates the general scale of the power plants capturing CO2 and the saline formation storage formations
under consideration.
Figure 12. The national-level results for the base case, assuming competition between power plants for the preferred
storage locations in saline formations for CO2 capture and storage (upper map, 0 – 20+ CO2 capture rate (Mmt/yr);
lower map, 0 – 800+ CO2 storage rates (Mmt/yr)).
Figure 13 illustrates the top five saline formations in terms of their ability to store CO2 from a national network of
power plants looking to store CO2 with the lowest cost. There may be instances where a power plant has other saline
formations closer to it, but the overall systems’ cost may be lower to transport and store CO2 in a formation much
further away with more favorable geological performance characteristics (Kobos et al., 2012).

Figure 13. The top 5 saline formations in the lower U.S. in terms of storage potential.
Discussions
Previous analyses have shown that CO2 capture costs represent the dominant cost in a CCS cost breakdown and how
there is substantial cost variability with changes to geological parameters (Klise, et al., 2013; Roach et al., 2010,
2012; Heath et al., 2012; Kobos et al., 2011, 2012; Tidwell et al., 2011). This paper expands upon the core findings
presented in Klise et al. (2013) and Kobos et al. (2012) by varying the influence of core cost and performance
drivers for power plants to match with the ‘most viable’ storage space in saline formations. An initial analysis of a
few parameters illustrates the relative effects of CCS technology and water extraction and treatment parameters on
the overall system’s costs relative to the effects of competition. An example scenario where a large coal-fired power
plant (San Juan Generating Station) stores its CO2 in a very close formation gives insight into several cost and
performance sensitivities. This is just one example of the different parametric scenario analyses that can be
performed by WECSsim©.
At the national level, CO2 capture and storage technologies may revolutionize the CO2 management portfolio
amongst fuel types – principally coal and natural gas technologies. On the one hand, CCS promises to reduce CO2
emissions from coal-fired power plant dramatically, but at a substantial cost penalty relative to the baseline.
However, when taking into account the infrastructure that may be required to replace many coal-fired power plants
with natural gas plants a more in-depth analysis will be something to explore further. On the other hand, CCS may
provide from an engineering perspective, a manageable solution at the surface from the engineered CCS system (e.g.,
equipment costs are understood reasonably well up to a point, but substantial uncertainty exists in the subsurface
geological formation’s performance characteristics (Herzog, 2011). The Midwest, for example, has a large portion
of the country’s coal-fired power plants as well as attractive (from an economic and performance perspective) set of
saline formations.

Conclusions
These initial findings suggest that a sizable portion of the performance and cost characteristics are not as sensitive as
is the percentage of CO2 that each power plant could capture to store in a given formation. Substantial effort has
been expended to enhance the geological database presented in NATCARB to assure a reasonable set of assumptions
underlie the geological parameters used throughout the WECSsim© analysis. This, combined with WECSsim
©’s
unique ability to incorporate competition by the U.S. fleet of coal and natural gas power plants for the national set of
potential saline storage formations allow the analysis to dynamically develop CCS scenarios at both the single plant
and national levels. The overarching impact of such a model is to allow interested parties to evaluate both their site-
specific potential pilot cases of CCS, and to understand how their case fits within the nation’s infrastructure.
Additionally, WECSsim© allows users to scale CCS up within a given region due to favorable geology, and across
the grid for potential medium to large-scale deployment of these technologies. Understanding which site may
compete well given their power plant and geologic sink characteristics will also be key to more accurately identify
potential ‘winners’ and ‘losers’ from an engineering performance and system’s cost perspective before committing
additional resources to these novel, yet relatively costly pilot and technology demonstration projects.
References
Environmental Protection Agency (EPA), 2007, Emissions & Generation Resource Integrated Database (eGRID),
Version 1.0.
Heath, J.E., Kobos, P.H., Roach, J.D., Dewers, T.A. and S.A. McKenna, 2012, Geologic Heterogeneity and
Economic Uncertainty of Subsurface Carbon Dioxide Storage, SPE Economics & Management Journal,
January 32–41.
Herzog, H.J., 2011, Scaling up carbon dioxide capture and storage: From megatons to gigatons, Energy Economics,
Vol. 33 (4), July, pp. 597–604.
Klise, G.T., Roach, J.D., Kobos, P.H., Heath, J.E. and K.A. Gutierrez, 2013, The cost of meeting increased cooling-
water demands for CO2 capture and storage utilizing non-traditional waters from geologic saline formations,
Hydrogeology Journal, 21, pp. 587–604, DOI 10.1007/s10040-012-0951-2.
Kobos, P.H., Cappelle, M.A., Krumhansl, J.L., Dewers, T.A., McNeamar, A. and D.J. Borns, 2011, Combining
power plant water needs and carbon dioxide storage using saline formations: Implications for carbon
dioxide and water management policies, International Journal of Greenhouse Gas Control, 5, 899-910.
Kobos, P.H., Roach, J.D., Heath, J.E. and G.T. Klise, 2012, A CO2 Storage Supply Curve for the United States:
Addressing Cost, Scale Up and Geologic Uncertainties, 31st USAEE/IAEE North American Conference,
Austin, TX.
Litynski, J.T., 2008, The United States Department of Energy’s Regional Carbon Sequestration Partnerships
Program Validation Phase, Environment International, 34, pp. 127–138.
NATCARB, 2008, Carbon Sequestration Atlas of the United States and Canada – 2nd Edition, National Energy
Technology Laboratory http://www.netl.doe.gov/technologies/carbon_seq/refshelf/atlasII/index.html
accessed 12/3/2010 and http://geoportal.kgs.ku.edu/natcarb/atlas08/gsinks.cfm accessed 12/3/2010.
Roach, J.D., Kobos, P., Klise, G.T., Krumhansl, J.L. and A. McNemar, 2010, New Demands, New Supplies: A
National Look at the Water Balance of Carbon Dioxide Capture and Sequestration, American Geophysical
Union, Poster SAND2010-8624C, December 13 – 16, San Francisco, CA.
Roach, J.D., Kobos, P.H., Heath, J.H., Klise, G.T., Dewers, T.A., McKenna, S.A., Gutierrez, K., Borns, D.J. and A.
McNemar, 2012, Building a National Carbon Dioxide Storage Supply Curve: A Systems Approach
Incorporating Geologic Uncertainty, The Eleventh Annual Carbon Capture, Utilization & Sequestration
Conference, May 1, Pittsburgh, PA.
Tidwell, V.C., Kobos, P.H., Malczynski, L.A., Klise, G. and C.R. Castillo, 2011, Exploring the Water-
Thermoelectric Power Nexus, Journal of Water Resources Planning and Management, December, 138 (5),
pp. 491–501.