Embed Size (px)
Citation preview

Title: Clarifying the PSA Grey Zone: The Management of Patients with a Borderline PSA
Authors:
Talisa Ross, 5th year medical student, Guy’s Hospital, King’s College London, Great Maze Pond, London SE1 9RT, [email protected], 07825 637 913
Kamran Ahmed, NIHR Academic Clinical Lecturer, Urology Specialist Registrar, Guy’s Hospital, King’s College London, Great Maze Pond, London SE1 9RT, [email protected]
Nicholas Raison, Clinical Research Fellow, Urology registrar, Guy’s Hospital, King’s College London, Great Maze Pond, London SE1 9RT, [email protected]
Ben Challacombe, Consultant Urological and Robotic Surgeon, Guy’s Hospital, King’s College London, Great Maze Pond, London SE1 9RT, [email protected]
Prokar Dasgupta, Professor of Robotic Surgery and Urological Innovation, Consultant Urological Surgeon, Guy’s Hospital, King’s College London, Great Maze Pond, London SE1 9RT, [email protected]
Idea for article: Kamran Ahmed, literature search: Talisa Ross, wrote article: Talisa Ross, critical revision of article: Kamran Ahmed, Nicholas Raison, Prokar Dasgupta, Ben Challacombe
Name of corresponding author:
Talisa Ross, as above
Key words:
PSA, prostate cancer, management, borderline, prostate, prostate specific antigen
Word count:
20191852
Disclosures:
None
1 | P a g e
Abstract
Introduction
Prostate specific antigen is a marker for prostate cancer and a key diagnostic tool, yet when to refer patients with a borderline PSA is currently unclear. This review describes how to assess a patient with borderline PSA and provides an algorithm for management.
Methods
Current literature on reference values, factors affecting PSA, indications for referral, non-invasive investigations and the role of MRI were reviewed. Medline and EMBASE were searched using MeSH terms.
Results
The literature suggests that a PSA of over 1.51.5 ng/mL should be used as a cut-off to consider further testing for all age groups. There is strong evidence to show that adjuncts are useful when interpreting PSA results, most notably percentage free PSA and proPSA. Considerable weighting should also be given to the ERSPC risk calculator when deciding when to refer. Multi-parametric MRI is valuable in closely examining suspicious lesions to reduce the number of negative biopsies. MRI fusion biopsy (TRUS or transperineal) should be considered over standard TRUS biopsy to detect more clinically significant disease.
Conclusions
Management of borderline PSA is not straightforward. A cut-off of 1.51.5 ng/mL should be used in conjunction with DRE, risk calculation and PSA adjuncts. Imaging and biopsy should utilise mpMRI in order to achieve improved diagnosis of clinically significant prostate cancer, with fewer unnecessary investigations.
Methods
Medline and EMBASE were searched for papers published until 04/01/16. Searches were conducted according to subheading titles, using MeSH terms. Systematic reviews were included and otherwise large individual studies were discussed. Guidelines by the European Urology Association (EUA) and NICE were also used. Aside from a few smaller studies mentioned, the overall quality of evidence was level two, according to Oxford Centre for Evidence Based Medicine Levels of Evidence.
Message for the Clinic
1. Due to the poor sensitivity and specificity of the test, the management of borderline PSA is not straightforward
2. Use threshold of 1.51.5 ng/mL for all age groups
3. The ERSPC risk calculator is a useful tool in quantifying risk
4. Adjuncts such as PSA density, %fPSA and pPSA ([-2]pPSA, PHI, 4K) should be considered to further evaluate risk of cancer
2 | P a g e
5. mpMRI imaging is a new technique to rule out suspicious lesions and hence avoid biopsy in some patients
6. MRI-TRUS fusion biopsy is also valuable in precisely targeting suspicious lesions for biopsy following imaging
3 | P a g e
Clarifying the PSA Grey Zone: The Management of Patients with a Borderline PSA
Introduction
Prostate specific antigen (PSA) is commonly used to detect prostate cancer [1]. Urgent urology referral is indicated when PSA is clearly above the reference range. The management of patients in the “grey zone” is less evident. Only 26% of patients with a PSA within the grey zone of 4.1 – 9.9 mg/mL have prostate cancer [2]. A major shortfall of PSA is its poor specificity therefore results must be interpreted with caution. If there is uncertainty, almost two thirds of GPs refer to an urologist when in fact, they may further evaluate the patient themselves [3]. This review aims to evaluate the evidence for assessing patients with a borderline PSA and provide a management algorithm.
What are the Reference Values for PSA?
Historically PSA has had a cut-off value of 4.0 ng/mL [4]. Catalona et al. were the first to argue, in their large trial of 472 men without prior prostate cancer, that a PSA of >4.0 mg/mL should be used as a threshold for prostate biopsy.
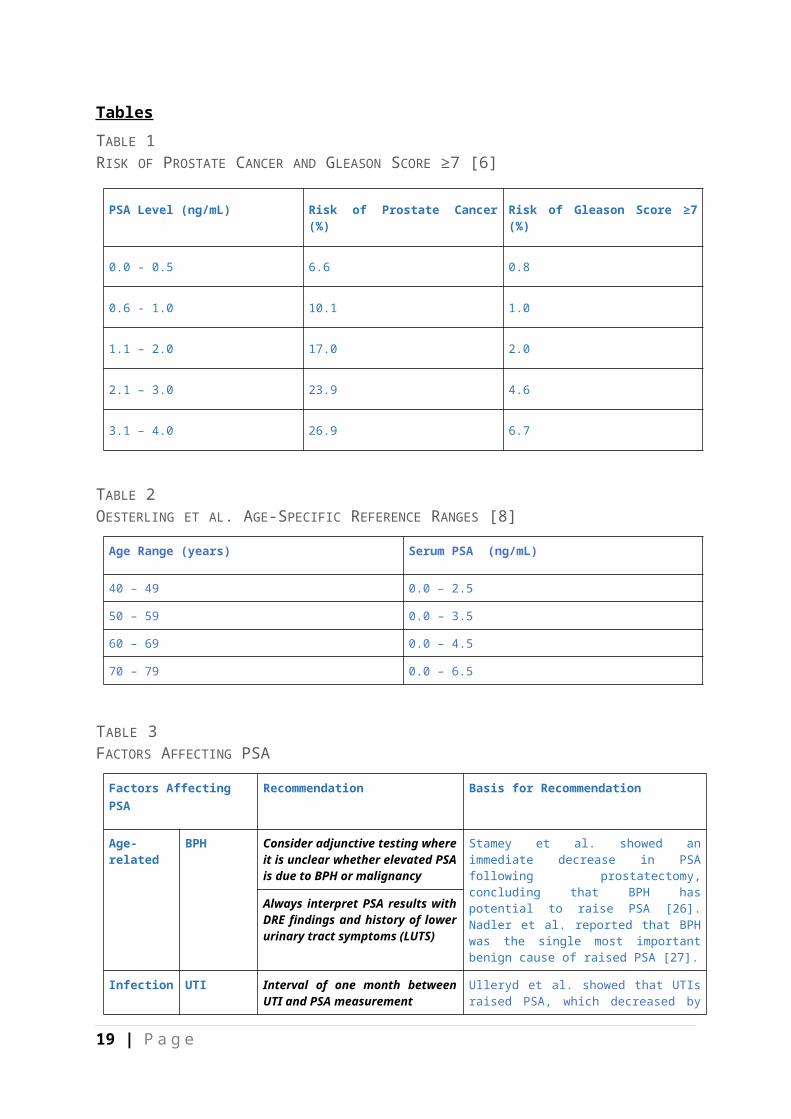
Despite this, it is not uncommon for cancer to be present with a PSA <4.0 ng/mL. Catalona et al. found in a cohort of 332 men with unremarkable DRE and PSA between 2.6-4.0 ng/mL that 22% had malignancy detected on biopsy, 10% of which were low volume and low grade tumours [5]. A large prospective study by Thompson et al. found biopsy-detectable prostate cancer in 15% of participants whose PSA was <4.0 ng/mL over a seven year period [6]. Due to the low risk of detecting cancer with Gleason score >7, however, there is a danger of over-treating clinically insignificant cancer if the standard reference range were to be lowered to <4.0 ng/mL, as only 14.9% of participants had clinically significant cancer in Thompson’s cohort.
TABLE 1RISK OF PROSTATE CANCER AND GLEASON SCORE ≥7 [6]
Prostate volume increases with age, due to BPH, which in turn affects PSA. As a result, PSA values can be stratified according to age [7]. Oesterling et al. first established age-specific reference ranges based on a prospective study of a few hundred men [8]. They were found to improve the sensitivity of PSA and enable the early detection of localised cancers in younger patients, who would be amenable to radical prostatectomy (RP) [9]. Additionally, low-grade tumours in older patients would not be detected, resulting in less overtreatment of clinically insignificant cancers in older patients and improved specificity.
TABLE 2OESTERLING ET AL. AGE-SPECIFIC REFERENCE RANGES [8]
Age-specific reference ranges increase detection of prostate cancer in younger men by 18% and decrease it in older men by 22% [10]. Partin et al. recommended in a cohort study on over 4,500 men that using age-specific reference ranges for younger men would detect greater numbers of operable tumours. They suggest that the standard reference range should be used for men over 60 to avoid missing tumours [10].
4 | P a g e

Public Health England (PHE) has recently released guidance on when to refer patients following PSA testing. Due to the concerns of low sensitivity and specificity for age-specific reference ranges, PHE recommends abolishing these, in favour of a standard reference range of >3.0 ng/mL for men aged between 50-69. This recommendation draws upon evidence from the Prostate, Lung, Colorectal and Ovarian Cancer (PLCO)[11] and European Randomised Study of Screening for Prostate Cancer (ERSPC)[12] trials; the largest PSA publications to date, which both endorse a cut-off of 3.0 ng/mL.
A review on 21,502 men by Crawford et al. rebuked this recommendation [13]. The authors found that in men with PSA >1.5 ng/mL, there was a 10 times greater rate of prostate cancer in Caucasians and 17 times greater rate of prostate cancer in African-Americans, when compared to those with PSA <1.5 ng/mL, over a four year period. They proposed establishing 1.5-4.0 ng/mL as the “Early Warning Zone” as a predictor of future risk of malignancy for men undergoing their first PSA test. A further paper outlining the role of the primary care physician in prostate cancer by Rosenberg et al. also advocates this threshold [14]. Some would be apprehensive that lowering the threshold to this level would diagnose more clinically insignificant cancers. A study by Krumholtz et al. found that the same number of clinically significant cancers were identified using a range of 2.6-4.0 ng/mL as with using the standard cut-off of 4.0 ng/mL, suggesting that lowering the threshold would not over-diagnose prostate cancer [15]. Their participants also had a greater proportion of smaller, organ-confined tumours within the lowered range; a disease status most amenable to surgery. Thus overall, a threshold of 1.5 ng/mL acts as a strong predictor of current or future disease and should trigger further investigation.Thus overall, a threshold of 1.5 ng/mL acts as a strong predictor of current or future disease and should trigger further investigation.
[13][14]It should be noted, however, that the exact cut-off value to be used remains a controversial issue, due to a lack of consensus within recently published evidence.
RECOMMENDATION
The use of a cut-off of 1.51.5 ng/mL will identify those at risk of clinically significant prostate cancer and should prompt further non-invasive investigation.
What factors affect PSA?
ETHNICITY AND PSA
Initial studies examining PSA reference ranges were carried out predominantly on white populations. It has since become established that considerable ethnic variation exists in PSA [16, 17]. Oesterling et al. found in their study of a small Japanese fishing village that serum PSA values were lower [18]. Following this study, J.H Ku found further variation amongst Asian populations in different geographical areas [19]. Moul et al. found in a cohort study on 133 Afro-Caribbean men that black patients with prostate cancer have a higher PSA upon
5 | P a g e
diagnosis than white men, due to their larger tumour volume [20]. A large review of nearly 80,000 medical records by DeAntoni et al. corroborated the findings that mean PSA varies by race, and emphasised the necessity to consider ethnicity when interpreting PSA results [21].
Calculating a race-specific range has been deliberated but the process of calculating one is challenging. Over 40% of biopsy-detectable cancers in African-Americans would not have been further investigated in a large study by Morgan et al. if the race and age-specific reference ranges generated by 95th percentile readings were used [22]. This is particularly alarming because this population are at higher overall risk of prostate cancer [23]. Due to their low sensitivity, race-specific reference ranges themselves should not be used but the variation of mean PSA by race should contextualise PSA results for individual patients.
OTHER FACTORS
Before measuring PSA, there are certain criteria that men must fulfil according to Burford et al., which form the foundation for current National Institute for Health and Care Excellence (NICE) guidelines [24]. Men must not have exercised intensely or ejaculated in the past two days, had a DRE in the past week, prostate biopsy in the preceding six weeks or currently have a UTI. This is also consistent with European Urology Association (EUA) guidelines. Recommendations are based upon PSA having a half-life of 2.5 days [25].
TABLE 3FACTORS AFFECTING PSA [25-35]
Can patients be risk assessed for further investigation?
To improve the prognostic value of a PSA threshold for further investigation, it is vital that PSA results are interpreted in their clinical context. To do this, clinicians should be guided by risk calculators [36]. Although extremely straightforward to use, their uptake amongst primary care physicians has been less than desirable.
The Prostate Cancer Prevention Trial (PCPT) Risk Calculator 2.0 [37] is a useful tool which analyses further factors that may affect an individual’s risk of prostate malignancy; ethnicity, age, family history, DRE result and previous biopsies. Generating a percentage risk for high-grade cancer, low-grade cancer and negative biopsy, it assesses the clinical significance of a potential biopsy result to help the clinician in deciding whether the risk is high enough to warrant further investigation.
The European Randomised Study of Screening for Prostate Cancer (ERSPC) calculator was developed from a large European cohort of 162,000 men aged 55-69 [38]. It is applicable to a primary care setting as the original ERSPC trial took men de novo to be screened from the community. The iPhone app “Rotterdam Prostate Cancer Risk Calculator” is a quick and helpful tool derived from the ERSPC which enables GPs to rapidly assess risk for men with a recorded PSA and DRE result. It generates two calculations; a percentage risk for detectable or clinically significant cancer. A meta-analysis by Louie et al. validated its use to improve
6 | P a g e
the predictive accuracy of PSA [39]. The calculator is an efficient way for GPs to decide whether to evaluate the patient’s risk further.
Detecting a clinically insignificant tumour, defined by the Epstein criteria, as <0.2cm, localised to the prostate and with Gleason score <7, is relatively common [40]. The use of a calculator helps to avoid invasive testing for patients with clinically insignificant cancer and makes counselling the patient on the risks versus benefits of biopsy considerably easier.
In validation studies, the ERSPC calculator has consistently outperformed the PCPT 2.0 calculator, both for detecting prostate cancer in general and also for identifying clinically significant cancer [41-44] thus the ERSPC calculator favourably minimises the number of unnecessary biopsies.
Using the ERSPC calculator for PSA results above 1.51.5 ng/mL is a good guide. Results below this will inevitably yield low risk calculations. Notable risk of malignancy using the ERSPC calculator should prompt further investigation.
What non-invasive investigations can be done to support diagnosis?
Since there is such variation in sensitivity amongst studies, the upper limit of normal is still difficult to define, as Hernandez and Thompson consider in their review on PSA validity. Accordingly, they recommend that further markers of prostate cancer are required to reflect disease severity [45].
DRE
DRE should always be performed in conjunction with PSA. In 1994, Catalona et al. showed in a large study that DRE had a PPV of 21% but when interpreted with PSA results, detection of cancer increased by 78% compared to DRE alone [46]. DRE becomes less sensitive however as PSA falls, with sensitivity reported at 20% for PSA <3.0 ng/mL [47]. As positive DRE is associated with higher Gleason score, it is recommended that DRE is still carried out for all patients and interpreted alongside PSA result [48].
TABLE 4BIOCHEMICAL MARKERS [33, 49-62]
When should invasive testing be considered?
The current gold standard for invasive testing is ultrasound-guided biopsy, with transrectal or transperineal approaches. There are a number of indications for referral.
FIGURE 1INDICATIONS FOR REFERRAL
Role of MRI
TRUS-guided biopsy is not without its faults. Sensitivity is reported at 80% [63], with up to 20% risk of up-staging of disease after RP [64] due to under-sampling particularly in the anterior and apical regions [65]. MRI is rapidly gaining recognition for its role in the
7 | P a g e
diagnosis of cancer either as an imaging modality (multi-parametric MRI (mpMRI)) and/ or for MRI-guided biopsy.
IMAGING
FIGURE 2COMPONENTS OF MPMRI IMAGING
A large review anticipated that mpMRI can exclude the presence of clinically significant cancers with 90-95% specificity and negative predictive value (NPV), and has a sensitivity of 93% for detecting cancers Gleason score ≥7 [63]. In a man with PSA >1.5 ng/mL, normal DRE and no family history, mpMRI is useful for ruling out clinically significant cancer and hence avoid biopsy altogether.
The PI-RADS 2.0 scale can also be used to rate lesions on mpMRI from 1-5 [66]. It recommends biopsy for lesions scored three of above.
TABLE 5CANCER DETECTION RATE BY MPMRI TUMOUR VOLUME AND GRADING [67]
BIOPSY
TABLE 6COMPARISON OF BIOPSY METHODS [63, 68-80]
TABLE 7COMPARISON OF IMAGING AND BIOPSY TECHNIQUES WITH MRI
RECOMMENDATIONS
MRI is certainly valuable in high risk populations with a borderline PSA. We recommend using the ERSPC risk calculator to identify those at high risk of prostate cancer, considering adjuncts and subsequently refer the patient for mpMRI imaging for further evaluation, as the high NPV of mpMRI reduces the number of unnecessary biopsies considerably. Referral to an experienced clinician ensures that limitations involving learning curves are overcome. If imaging does highlight a suspicious lesion, MRI-TRUS fusion biopsy is indicated and is the preferred method of MRI-guided biopsy.
Management in Primary Healthcare and Recommendations
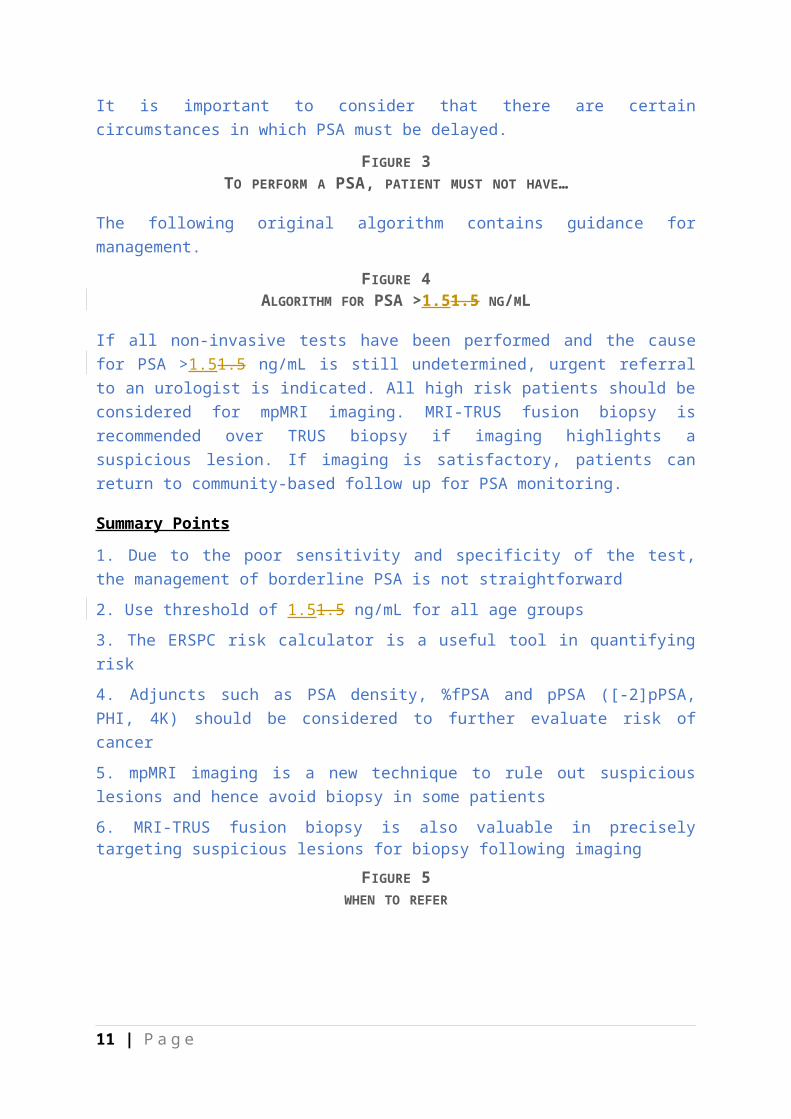
It is important to consider that there are certain circumstances in which PSA must be delayed.
FIGURE 3TO PERFORM A PSA, PATIENT MUST NOT HAVE…
The following original algorithm contains guidance for management.
FIGURE 4ALGORITHM FOR PSA >1.5 1.5 NG/ML
8 | P a g e
If all non-invasive tests have been performed and the cause for PSA >1.51.5 ng/mL is still undetermined, urgent referral to an urologist is indicated. All high risk patients should be considered for mpMRI imaging. MRI-TRUS fusion biopsy is recommended over TRUS biopsy if imaging highlights a suspicious lesion. If imaging is satisfactory, patients can return to community-based follow up for PSA monitoring.
Summary Points
1. Due to the poor sensitivity and specificity of the test, the management of borderline PSA is not straightforward
2. Use threshold of 1.51.5 ng/mL for all age groups
3. The ERSPC risk calculator is a useful tool in quantifying risk
4. Adjuncts such as PSA density, %fPSA and pPSA ([-2]pPSA, PHI, 4K) should be considered to further evaluate risk of cancer
5. mpMRI imaging is a new technique to rule out suspicious lesions and hence avoid biopsy in some patients
6. MRI-TRUS fusion biopsy is also valuable in precisely targeting suspicious lesions for biopsy following imaging
FIGURE 5WHEN TO REFER
9 | P a g e

Appendix
ONGOING RESEARCH
There is current research further evaluating the negative predictive value of mpMRI and how it reduces unnecessary biopsies in two large multicentre studies; “PROstate MRI Imaging Study: Evaluation of Multi-parametric Magnetic Imaging in the Diagnosis and Characterisation of Prostate Cancer” (PROMIS) [81] and “Prostate Imaging Compared to Transperineal Ultrasound Guided Biopsy for Significant Prostate Cancer Risk Evaluation” (PICTURE) [82].
Funding and Acknowledgements
No funding required
Author Contributions
Idea for article: Kamran Ahmed
Literature search: Talisa Ross
Wrote article: Talisa Ross
Critical revision of article: Kamran Ahmed, Nicholas Raison, Prokar Dasgupta, Ben Challacombe
10 | P a g e
References
1. Oesterling JE. Prostate specific antigen: a critical assessment of the most useful tumor marker for adenocarcinoma of the prostate. J Urol 1991; 145: 907-23.
2. Stamey TA. Second Stanford conference on international standardization of prostate-specific antigen immunoassays. Urology 1995; 45: 173-84.
3. Ranasinghe WK, Kim SP, Papa NP et al. Prostate cancer screening in Primary Health Care: the current state of affairs. Springerplus 2015; 4: 78.
4. Catalona WJ, Hudson MA, Scardino PT et al. Selection of optimal prostate specific antigen cutoffs for early detection of prostate cancer: receiver operating characteristic curves. J Urol 1994; 152: 2037-42.
5. Catalona WJ, Smith DS, Ornstein DK. Prostate Cancer Detection in Men With Serum PSA Concentrations of 2.6 to 4.0 ng/mL and Benign Prostate Examination: Enhancement of Specificity With Free PSA Measurements. JAMA 1997; 177: 1452-5.
6. Thompson IM, Pauler DK, Goodman PJ et al. Prevalence of prostate cancer among men with a prostate-specific antigen level < or =4.0 ng per milliliter. N Engl J Med 2004; 350: 2239-46.
7. Partin AW, Oesterling JE. The clinical usefulness of prostate specific antigen: update 1994. J Urol 1994; 152: 1358-68.
8. Oesterling JE, Jacobsen SJ, Chute CG et al. Serum prostate-specific antigen in a community-based population of healthy men. Establishment of age-specific reference ranges. Jama 1993; 270: 860-4.
9. Catalona WJ, Smith DS, Ratliff TL, Basler JW. Detection of organ-confined prostate cancer is increased through prostate-specific antigen-based screening. Jama 1993; 270: 948-54.
10. Partin AW, Criley SR, Subong EN et al. Standard versus age-specific prostate specific antigen reference ranges among men with clinically localized prostate cancer: A pathological analysis. J Urol 1996; 155: 1336-9.
11. Andriole GL, Crawford ED, Grubb RL, 3rd et al. Prostate cancer screening in the randomized Prostate, Lung, Colorectal, and Ovarian Cancer Screening Trial: mortality results after 13 years of follow-up. Journal of the National Cancer Institute 2012; 104: 125-32.
12. Schröder FH, Hugosson J, Roobol MJ et al. Screening and prostate cancer mortality: results of the European Randomised Study of Screening for Prostate Cancer (ERSPC) at 13 years of follow-up. The Lancet 2014; 384: 2027-35.
13. Crawford ED, Moul JW, Rove KO et al. Prostate-specific antigen 1.5–4.0 ng/mL: a diagnostic challenge and danger zone. BJU International 2011; 108: 1743-9.
14. Rosenberg MT, Spring AC, David Crawford E. Prostate cancer and the PCP: the screening dilemma. Int J Clin Pract 2015; 69: 1438-47.
15. Krumholtz JS, Carvalhal GF, Ramos CG et al. Prostate-specific antigen cutoff of 2.6 ng/mL for prostate cancer screening is associated with favorable pathologic tumor features. Urology 2002; 60: 469-73; discussion 73-4.
16. Eastham JA, May RA, Whatley T et al. Clinical characteristics and biopsy specimen features in African-American and white men without prostate cancer. Journal of the National Cancer Institute 1998; 90: 756-60.
17. Abdalla I, Ray P, Vaida F, Vijayakumar S. Racial differences in prostate-specific antigen levels and prostate-specific antigen densities in patients with prostate cancer. American journal of clinical oncology 1999; 22: 537-41.
18. Oesterling JE, Kumamoto Y, Tsukamoto T et al. Serum prostate-specific antigen in a community-based population of healthy Japanese men: lower values than for similarly aged white men. Br J Urol 1995; 75: 347-53.
19. Ku JH. Race-specific reference ranges of serum prostate-specific antigen levels in countries with a low incidence of prostate cancer. BJU Int 2006; 97: 69-72.
20. Moul JW, Sesterhenn IA, Connelly RR et al. Prostate-Specific Antigen Values at the Time of Prostate Cancer Diagnosis in African-American Men. JAMA 1995; 274: 1277-81.
21. DeAntoni EP, Crawford ED, Oesterling JE et al. Age- and race-specific reference ranges for prostate-specific antigen from a large community-based study. Urology 1996; 48: 234-9.
22. Morgan TO, Jacobsen SJ, McCarthy WF et al. Age-specific reference ranges for serum prostate-specific antigen in black men. NEJM 1996; 335: 304-10.
23. Morton Jr RA. Racial differences in adenocarcinoma of the prostate in North American men. Urology 1994; 44: 637-45.
11 | P a g e
24. Burford DC, Kirby M, Austoker J. PSA testing in asymptomatic men. Evidence document. Prostate Cancer Risk Management Programme Information for Primary Care. 2010.
25. Price CP, Allard J, Davies G et al. Pre- and post-analytical factors that may influence use of serum prostate specific antigen and its isoforms in a screening programme for prostate cancer. Ann Clin Biochem 2001; 38: 188-216.
26. Stamey TA, Yang N, Hay AR et al. Prostate-Specific Antigen as a Serum Marker for Adenocarcinoma of the Prostate. N Engl J Med 1987; 317: 909-16.
27. Nadler RB, Humphrey PA, Smith DS et al. Effect of Inflammation and Benign Prostatic Hyperplasia on Elevated Serum Prostate Specific Antigen Levels. J Urol 1995; 154: 407-13.
28. Ulleryd P, Zackrisson B, Aus G et al. Prostatic involvement in men with febrile urinary tract infection as measured by serum prostate-specific antigen and transrectal ultrasonography. BJU Int 1999; 84: 470-4.
29. Potts JM. Prospective identification of national institutes of health category iv prostatitis in men with elevated prostate specific antigen. J Urol 2000; 164: 1550-3.
30. Bozeman CB, Carver BS, Eastham JA, Venable DD. Treatment of chronic prostatitis lowers serum prostate specific antigen. J Urol 2002; 167: 1723-6.
31. Oesterling JE, Rice DC, Glenski WJ, Bergstralh EJ. Effect of cystoscopy, prostate biopsy, and transurethral resection of prostate on serum prostate-specific antigen concentration. Urology 1993; 42: 276-82.
32. Jiandani D, Randhawa A, Brown RE et al. The effect of bicycling on PSA levels: a systematic review and meta-analysis. Prostate Cancer and Prostatic Disease 2015; 18: 208-12.
33. Bañez LL, Hamilton RJ, Partin AW et al. Obesity-Related Plasma Hemodilution and PSA Concentration Among Men With Prostate Cancer. JAMA 2007; 298: 2275-80.
34. Etzioni RD, Howlader N, Shaw PA et al. Long-term effects of finasteride on prostate specific antigen levels: results from the prostate cancer prevention trial. J Urol 2005; 174: 877-81.
35. Tchetgen M, Song J, Strawderman M et al. Ejaculation increases the serum prostate specific antigen concentration. Urology 1996; 47: 511-6.
36. Zhu X, Albertsen PC, Andriole GL et al. Risk-based prostate cancer screening. European urology 2012; 61: 652-61.
37. Thompson IM, Ankerst DP, Chi C et al. Assessing Prostate Cancer Risk: Results from the Prostate Cancer Prevention Trial. JNCI J Natl Cancer Inst 2006; 98: 529-34.
38. Roobol MJ, Zhu X, Schroder FH et al. A Calculator for Prostate Cancer Risk 4 Years After an Initially Negative Screen: Findings from ERSPC Rotterdam. European urology 2013; 63: 627-33.
39. Louie KS, Seigneurin A, Cathcart P, Sasieni P. Do prostate cancer risk models improve the predictive accuracy of PSA screening? A meta-analysis. Ann Oncol 2015; 26: 848-64.
40. Epstein JI, Walsh PC, Carmichael M, Brendler CB. Pathologic and Clinical Findings to Predict Tumor Extent of Nonpalpable (Stage T1 c) Prostate Cancer. JAMA 1994; 271: 368-74.
41. Poyet C, Nieboer D, Bhindi B et al. Prostate cancer risk prediction using the novel versions of the European Randomised Study for Screening of Prostate Cancer (ERSPC) and Prostate Cancer Prevention Trial (PCPT) risk calculators: independent validation and comparison in a contemporary European cohort. BJU Int 2016; 117: 401-8.
42. Oliveira M, Marques V, Carvalho AP, Santos A. Head-to-head comparison of two online nomograms for prostate biopsy outcome prediction. BJU Int 2011; 107: 1780-3.
43. Foley RW, Maweni RM, Gorman L et al. The ERSPC Risk Calculators Significantly Outperform The PCPT 2.0 In The Prediction Of Prostate Cancer; A Multi-Institutional Study. BJU Int 2016.
44. Trottier G, Roobol MJ, Lawrentschuk N et al. Comparison of risk calculators from the Prostate Cancer Prevention Trial and the European Randomized Study of Screening for Prostate Cancer in a contemporary Canadian cohort. BJU Int 2011; 108: E237-44.
45. Hernández J, Thompson IM. Prostate-specific antigen: A review of the validation of the most commonly used cancer biomarker. Cancer 2004; 101: 894-904.
46. Catalona WJ, Richie JP, Ahmann FR et al. Comparison of digital rectal examination and serum prostate specific antigen in the early detection of prostate cancer: results of a multicenter clinical trial of 6,630 men. J Urol 1994; 151: 1283-90.
47. Schröder FH, Kruger AB, Rietbergen J, Kranse R. Evaluation of the Digital Rectal Examination as a Screening Test for Prostate Cancer. Journal of the National Cancer Institute 1998; 90: 1817-23.
48. Okotie OT, Roehl KA, Han M et al. Characteristics of prostate cancer detected by digital rectal examination only. Urology 2007; 70: 1117-20.
12 | P a g e
49. Vickers AJ, Till C, Tangen CM et al. An Empirical Evaluation of Guidelines on Prostate-specific Antigen Velocity in Prostate Cancer Detection. Journal of the National Cancer Institute 2011; 103: 462-9.
50. Vickers AJ, Savage C, O'Brien MF, Lilja H. Systematic review of pretreatment prostate-specific antigen velocity and doubling time as predictors for prostate cancer. J Clin Oncol 2009; 27: 398-403.
51. Verma A, St. Onge J, Dhillon K, Chorneyko A. PSA density improves prediction of prostate cancer. Can J Urol 2014; 21: 7312-21.
52. Lin Y-R, Wei X-H, Uhlman M et al. PSA density improves the rate of prostate cancer detection in Chinese men with a PSA between 2.5–10.0 ng ml-1 and 10.1–20.0 ng ml-1: a multicenter study. Asian J Androl 2015; 17: 503-7.
53. Kim JH, Doo SW, Yang WJ et al. Impact of obesity on the predictive accuracy of prostate-specific antigen density and prostate-specific antigen in native Korean men undergoing prostate biopsy. Int J Urol 2014; 21: 987-90.
54. Andrew W. Roddam AW, Duffy MJ, Hamdy FC et al. Use of Prostate-Specific Antigen (PSA) Isoforms for the Detection of Prostate Cancer in Men with a PSA Level of 2–10 ng/ml: Systematic Review and Meta-Analysis. European urology 2005; 48: 386-99.
55. Partin AW, Catalona WJ, Southwick PC et al. Analysis of percent free prostate-specific antigen (PSA) for prostate cancer detection: Influence of total PSA, prostate volume, and age. Urology 1996; 48: 55-61.
56. Catalona WJ, Bartsch G, Rittenhouse HG et al. Serum pro-prostate specific antigen preferentially detects aggressive prostate cancers in men with 2 to 4 ng/ml prostate specific antigen. J Urol 2004; 171: 2239-44.
57. Hori S, Blanchet J-S, McLoughlin J. From prostate-specific antigen (PSA) to precursor PSA (proPSA) isoforms: a review of the emerging role of proPSAs in the detection and management of early prostate cancer. BJU International 2013; 112: 717-28.
58. Boegemann M, Stephan C, Cammann H et al. The percentage of prostate-specific antigen (PSA) isoform [–2]proPSA and the Prostate Health Index improve the diagnostic accuracy for clinically relevant prostate cancer at initial and repeat biopsy compared with total PSA and percentage free PSA in men aged ≤65 years. BJU Int 2016; 117: 72-9.
59. Ito K, Miyakubo M, Sekine Y et al. Diagnostic significance of [22]pro-PSA and prostate dimension-adjusted PSA-related indices in men with total PSA in the 2.0–10.0 ng/mL range. World J Urol 2013; 31: 305-11.
60. Auprich M, Bjartell A, Chun FK et al. Contemporary role of prostate cancer antigen 3 in the management of prostate cancer. European urology 2011; 60: 1045-54.
61. Nicholson A, Mahon J, Boland A et al. The clinical effectiveness and cost-effectiveness of the PROGENSA(R) prostate cancer antigen 3 assay and the Prostate Health Index in the diagnosis of prostate cancer: a systematic review and economic evaluation. Health technology assessment (Winchester, England) 2015; 19: i-xxxi, 1-191.
62. Bryant RJ, Sjoberg DD, Vickers AJ et al. Predicting high-grade cancer at ten-core prostate biopsy using four kallikrein markers measured in blood in the ProtecT study. Journal of the National Cancer Institute 2015; 107.
63. Thompson J, Lawrentschuk N, Frydenberg M et al. The role of magnetic resonance imaging in the diagnosis and management of prostate cancer. BJU Int 2013; 112: 6-20.
64. King CR, McNeal JE, Gill H, Presti JC, Jr. Extended prostate biopsy scheme improves reliability of Gleason grading: implications for radiotherapy patients. Int J Radiat Oncol Biol Phys 2004; 59: 386-91.
65. Vyas L, Acher P, Kinsella J et al. Indications, results and safety profile of transperineal sector biopsies (TPSB) of the prostate: a single centre experience of 634 cases. BJU International 2014; 114: 32-7.
66. Turkbey B, Brown AM, Sankineni S et al. Multiparametric prostate magnetic resonance imaging in the evaluation of prostate cancer. 2015:04/1/2016.
67. Bratan F, Niaf E, Melodelima C et al. Influence of imaging and histological factors on prostate cancer detection and localisation on multiparametric MRI: a prospective study. Eur Radiol 2013; 23: 2019-29.
68. Takenaka A, Hara R, Ishimura T et al. A prospective randomized comparison of diagnostic efficacy between transperineal and transrectal 12-core prostate biopsy. Prostate Cancer Prostatic Dis 2007; 11: 134-8.
69. Abdi H, Zargar H, Goldenberg SL et al. Multiparametric magnetic resonance imaging-targeted biopsy for the detection of prostate cancer in patients with prior negative biopsy results. 2015:04/1/2016-165:e1-7.
13 | P a g e
70. Kim EH, Vemana G, Johnson MH et al. Magnetic resonance imaging-targeted vs. conventional transrectal ultrasound-guided prostate biopsy: single-institution, matched cohort comparison. 2015:04/1/2016-109: e1-6.
71. Javali TD, Dwivedi DK, Kumar R et al. Magnetic resonance spectroscopy imaging-directed transrectal ultrasound biopsy increases prostate cancer detection in men with prostate-specific antigen between 4-10 ng/mL and normal digital rectal examination. Int J Urol 2014; 21: 257-62.
72. Puech P, Rouviere O, Renard-Penna R et al. Prostate cancer diagnosis: multiparametric MR-targeted biopsy with cognitive and transrectal US-MR fusion guidance versus systematic biopsy: prospective multicenter study. Radiology 2013; 268: 461-9.
73. Siddiqui MM, Rais-Bahrami S, Turkbey B et al. Comparison of MR/ultrasound fusion-guided biopsy with ultrasound-guided biopsy for the diagnosis of prostate cancer. JAMA 2015; 313: 390-7.
74. Mozer P, Roupret M, Le Cossec C et al. First round of targeted biopsies using magnetic resonance imaging/ultrasonography fusion compared with conventional transrectal ultrasonography-guided biopsies for the diagnosis of localised prostate cancer. BJU Int 2015; 115: 50-7.
75. Rastinehad AR, Turkbey B, Salami SS et al. Improving detection of clinically significant prostate cancer: magnetic resonance imaging/transrectal ultrasound fusion guided prostate biopsy. J Urol 2014; 191: 1749-54.
76. Sonn GA, Chang E, Natarajan S et al. Value of targeted prostate biopsy using magnetic resonance-ultrasound fusion in men with prior negative biopsy and elevated prostate-specific antigen. European urology 2014; 65: 809-15.
77. Ukimura O, Marien A, Palmer S et al. Trans-rectal ultrasound visibility of prostate lesions identified by magnetic resonance imaging increases accuracy of image-fusion targeted biopsies. World J Urol 2015; 33: 1669-76.
78. Quentin M, Blondin D, Arsov C et al. Prospective evaluation of magnetic resonance imaging guided in-bore prostate biopsy versus systematic transrectal ultrasound guided prostate biopsy in biopsy naïve men with elevated prostate specific antigen. J Urol 2014; 192: 1374-9.
79. Pokorny MR, de Rooij M, Duncan E et al. Prospective study of diagnostic accuracy comparing prostate cancer detection by transrectal ultra-sound guided biopsy versus magnetic resonance (MR) imaging with subsequent MR-guided biopsy in men without previous prostate biopsies. European urology 2014; 66: 22-9.
80. Gaziev G, Wadhwa K, Barrett T et al. Defining the learning curve for multiparametric magnetic resonance imaging (MRI) of the prostate using MRI-transrectal ultrasonography (TRUS) fusion-guided transperineal prostate biopsies as a validation tool. BJU Int 2016; 117: 80-6.
81. Emberton M. PROstate MRI imaging study. Medical Research Council: clinical trials unit.82. Simmons LA, Ahmed HU, Moore CM et al. The PICTURE study—prostate imaging (multi-parametric
MRI and Prostate HistoScanning™) compared to transperineal ultrasound guided biopsy for significant prostate cancer risk evaluation. Contemp Clin Trials 2014; 37: 69-83.
83. Yoo S, Kim JK, Jeong IG. Multiparametric magnetic resonance imaging for prostate cancer: A review and update for urologists. Korean J Urol 2015; 56: 487-97.
14 | P a g e

Tables
TABLE 1RISK OF PROSTATE CANCER AND GLEASON SCORE ≥7 [6]
PSA Level (ng/mL) Risk of Prostate Cancer (%) Risk of Gleason Score ≥7 (%)
0.0 - 0.5 6.6 0.8
0.6 - 1.0 10.1 1.0
1.1 – 2.0 17.0 2.0
2.1 – 3.0 23.9 4.6
3.1 – 4.0 26.9 6.7
TABLE 2OESTERLING ET AL. AGE-SPECIFIC REFERENCE RANGES [8]
Age Range (years) Serum PSA (ng/mL)
40 – 49 0.0 – 2.5
50 – 59 0.0 – 3.5
60 – 69 0.0 – 4.5
70 – 79 0.0 – 6.5
TABLE 3FACTORS AFFECTING PSA
Factors Affecting PSA Recommendation Basis for Recommendation
Age-related BPH Consider adjunctive testing where it is unclear whether elevated PSA is due to BPH or malignancy
Stamey et al. showed an immediate decrease in PSA following prostatectomy, concluding that BPH has potential to raise PSA [26]. Nadler et al. reported that BPH was the single most important benign cause of raised PSA [27].Always interpret PSA results with DRE
findings and history of lower urinary tract symptoms (LUTS)
Infection UTI Interval of one month between UTI and PSA measurement
Ulleryd et al. showed that UTIs raised PSA, which decreased by 25% after treatment of infection [28]. An interval of one month was sufficient for PSA to return to baseline, following infection.
Ensure careful history taking to screen for UTI symptoms prior to PSA measurement
Prostatitis Interval of six weeks between initiation of treatment for prostatitis and PSA measurement
Potts found an association between raised PSA and prostatitis [29]. Half of the participants’
15 | P a g e
PSA returned to within reference range following antibiotic administration. Of those whose PSA was raised post-treatment, one third had prostate cancer. Antibiotic treatment has been shown to lower PSA by 36.4% [30].
Ensure careful history taking to screen for prostatitis prior to PSA measurement
Intervention TURP Interval of six weeks between TURP and PSA measurement
Price et al. reviewed effects of TURP on PSA and found it leads to acute and significant rise in PSA of 6-50 times baseline [25]. The effect lasted for a mean of 18 days (range 12-30 days).
DRE Measure PSA prior to DRE Price et al. found in review [25] that most studies reported statistically significant, albeit small, increase in PSA after DRE. The increase was not clinically significant in most patients but it may have tipped PSA to above standard reference range for some. Levels returned to baseline after three days.
Rigid Cystoscopy
Interval of one week between rigid cystoscopy and PSA measurement
Price et al. found no effect on PSA from flexible cystoscopy but an increase in PSA associated with rigid cystoscopy (median 0.15 ng/mL) [25], which persisted for three days.
Prostate Biopsy
Interval of six weeks between prostate biopsy and PSA measurement
Price et al. found a 2-50 fold increase in PSA after prostate biopsy [25]. Oesterling et al. found this increase persisted for three weeks in most patients but still remained high in some after four weeks [31].
Exercise Cycling Avoid cycling before PSA test Systematic review and meta-analysis found no significant increase in PSA following cycling activity [32]. Despite this, authors recognise that limited array of trials and small sample sizes of studies included restricted utility of results and additional high-quality studies are necessary to investigate effects further.
Habitus BMI Consider effect of haemodilution in men with large body habitus
Bañez et al. evaluated association between BMI and PSA in large multicentre cohort of men [33]. They found increased BMI was related to increased plasma volume and resultant decreased PSA concentration. Men with BMI >35 had 11-21% lower PSA.
Medication Finasteride/ Dustasteride
Consider effect of finasteride As part of Prostate Cancer Prevention Trial (PCPT), men were assessed for effect of finasteride on PSA [34]. There was an overall finding that finasteride decreased PSA in those without prostate cancer. Price et al. reported that finasteride decreases PSA by a median of 50% after six months [25].
Sexual Ejaculation 48 hour interval between ejaculation and PSA measurement
Tchetgen et al. reported in a prospective study that PSA was raised in 87% of participants post-ejaculation, peaking after one hour (mean increase of 41%) [35]. After 48 hours, 97% of participants had PSA return to baseline.
16 | P a g e
TABLE 4BIOCHEMICAL MARKERS
Biochemical Marker
How is it calculated?
Evidence Recommendation
PSA Velocity (PSAV)
Annual increase in serum PSA (ng/mL/year)
Vickers et al. found in over 5,500 men that using PSAV >0.35 ng/mL/year would detect 115 additional cancers but with 433 unnecessary biopsies [49]. In comparison, a total PSA (tPSA) cut-off of 2.5 ng/mL would have resulted in similar numbers of unnecessary biopsies but would have picked up 139 cancers. A systematic review by Vickers et al. concluded that PSAV added no additional information to tPSA alone [50].
PSAV is not recommended
PSA Density (PSAD)
Ratio of serum PSA to prostate volume, as measured by transrectal ultrasound (TRUS)
Verma et al. found in their study on over 500 men that PSA density had strong predictive value for diagnosing cancer and correlated with disease aggressiveness [51]. Lin et al. found specificity of 65% in their multicentre study on 461 Chinese men with a grey zone PSA and consequently recommended its use [52]. In a large study on Korean men, the ability of PSA density to predict cancer improved in participants with BMI >25 kg/m2 [53]; important because these men are known to have a lower serum PSA due to haemodilution, leading to a detection bias within this population [33].
PSAD correlates to clinical significance of prostate cancer by reducing the impact of BPH on PSA alone, and is useful in men with large body habitus
Percentage Free PSA (%fPSA)
Percentage of free (unbound) PSA to total (tPSA)
A systematic review and meta-analysis by Roddam et al. evaluated the role of %fPSA in men with borderline tPSA [54]. %fPSA had 95% sensitivity in men with PSA between 4-19 ng/mL. The authors concluded that %fPSA helped to reduce unnecessary biopsies without affecting the detection of cancer. %fPSA also has a role in distinguishing between benign and malignant conditions. Partin et al. found that 29% of unnecessary biopsies could have been avoided using %fPSA, with <10% correlating with higher risk of cancer [55].
%fPSA is useful to differentiate prostate cancer from BPH and has a particular role with negative DRE
Complexed PSA (cPSA)
Amount of PSA bound to α1-antichymotrypsin
Roddam et al. evaluated the role of cPSA in a systematic review and meta-analysis, which was inconclusive [54]. It was comparable, however, to %fPSA for reducing the number of unnecessary biopsies. Further studies are required to determine its role.
cPSA is not recommended unless %fPSA is unavailable
Pro-PSA (pPSA)
[-2] pPSA
Precursor of PSA
Catalona et al. reported that percentage [-2] pPSA was particularly useful in detecting aggressive cancers i.e. those with Gleason score >7 [56]. The test would have allowed 31% of unnecessary biopsies to be avoided in the 4-10 ng/mL range.
PHI is useful to detect aggressive disease and reduce the number of unnecessary biopsies
PHI Index combining tPSA, %fPSA and [-2]pPSA
A review by Hori et al. found PHI to be superior in predicting malignancy over tPSA and fPSA [57]. Boegemann et al. found that PHI was also superior to DRE, prostate volume in a large multicentre cohort [58]. PHI avoided 54% of unnecessary biopsies
in a study by Ito et al. [59].
4K Index combining tPSA, %fPSA, intact PSA and kallikrein-like peptidase 2 (hk2)
Bryant et al. measured the predictive value of 4K in 6,129 men and found that using this marker would reduce the number of unnecessary biopsies by 43% [62].
4K is useful to reduce the number of unnecessary biopsies
PCA3 Non-coding PCA3 can be found on urinalysis after DRE. It has been found to be Evidence is
17 | P a g e
mRNA superior to %fPSA and tPSA but its use in the detection of clinical significant disease is limited [60]. A systematic review by Nicholson et al. was inconclusive about the clinical utility of PCA3 [61].
inconclusive about the use of PCA3
TABLE 5CANCER DETECTION RATE BY MPMRI TUMOUR VOLUME AND GRADING [67]
Gleason Score Tumour Volume (mL)
<0.5 0.5-2 >2
6 21-29% 43-54% 67-75%
7 63% 82-88% 97%
>7 80% 93% 100%
TABLE 6COMPARISON OF BIOPSY METHODS
Biopsy method Advantages Disadvantages
Trans-rectal biopsy
Current standardWell establishedOnly local anaesthesia requiredCost effective
Poor sensitivityRisk of up/ down staging of disease [63]Significant complications including infection, retention and bleeding [68]
Trans-perineal biopsy
More cores positive over TRUS with grey zone PSA if cancer is present [68]Very low risk of infectionTargeting of MRI lesions possibleSampling of anterior and apical prostate
Technically more difficult than TRUSRequires spinal or general anaesthesia ± catheter ± hospital stayHigh costHigh risk of urinary retention
MRI-guided biopsy [83]
Improved detection of clinically significant disease [69-71]Decreased number of cores required [72-79]
High costLearning curve [80]
TABLE 7COMPARISON OF IMAGING AND BIOPSY TECHNIQUES WITH MRI
Technique Advantages Disadvantages
Imaging T2W-MRI Defines prostate anatomy with malignancy appearing as low signal
High resolution and most simple
Low signal is not specific for prostate cancer
MRIS Evaluates metabolic activity in prostate tissue
Superior sensitivity and specificity to T2W-MRI
DW-MRI Measures water diffusion through tissue
Superior sensitivity and specificity to T2W-MRI and MRIS
Must be combined with T2W-MRI to improve resolution
DCE-MRI Maps perfusion of prostate tissue using IV gadolinium
Best sensitivity and specificity of imaging techniques
Reduced sensitivity in BPH and prostatitis
Biopsy MRI-informed cognitive TRUS biopsy
Technician relates MRI images to real-time TRUS images for biopsy
No additional specialised equipment needed
Suspicious region on MRI could be missed
18 | P a g e
Real-time MRI biopsy
Position of biopsy confirmed with live MRI imaging
Lesion can be targeted with great accuracy
Uncomfortable for patient, resources are costly and procedure is time consuming
MRI-TRUS fusion biopsy
MRI images fused with real-time TRUS images
Incorporates both speed and accuracyIncreases detection of high risk cancer
Reduced accuracy compared to real-time MRI biopsy
19 | P a g e

Figures
FIGURE 1INDICATIONS FOR REFERRAL
FIGURE 2COMPONENTS OF MPMRI IMAGING
FIGURE 3TO PERFORM A PSA, PATIENT MUST NOT HAVE…
FIGURE 4ALGORITHM FOR PSA >1.5 1.5 NG/ML
20 | P a g e
PSA >1.5 ng/mL and ERSPC calculator puts patient at significant risk of malignancy
Ambiguity whether PSA >1.5 ng/mL is due to BPH or malignancy, after measuring %fPSA
Patient with PSA >1.5 ng/mL with PSA density outside cut-off value
Patient with unremitting PSA >1.5 ng/mL after failed antibiotic treatment for suspected prostatitis
Patient with PSA >1.5ng/mL and high [-2]pPSA, PHI or 4K value
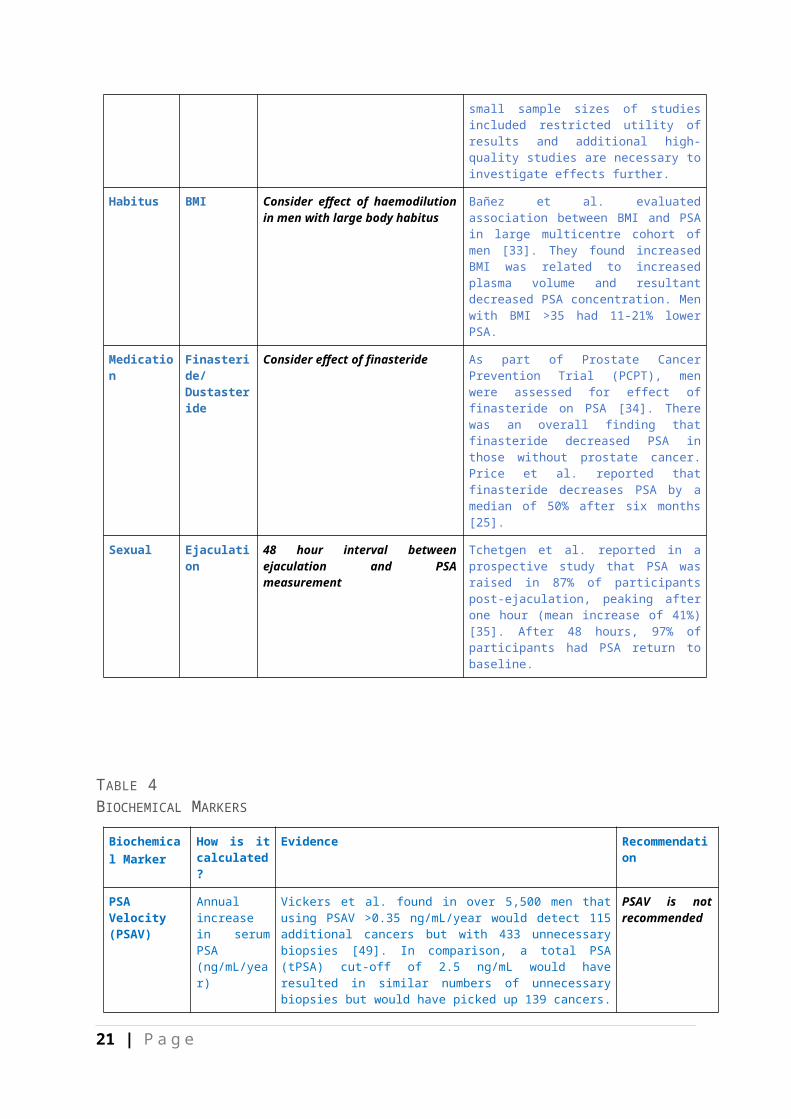
FIGURE 5WHEN TO REFER
21 | P a g e