Embed Size (px)
Citation preview

MSU Solar Racing Battery Management System
Michigan State University
Senior Design – ECE 480 – Team 7Spring 2014
Project Sponsor:MSU Solar
Project Facilitator:
Binseng Wang
Team Members:Matthew Gilbert-Eyres
Albert WareGerald SaumierAuez Ryskhanov
Michael Burch
1

Executive Summary
The Solar Car Team is a relatively new racing team at Michigan State University. The student run club created an electric vehicle powered by solar cells and batteries. The Solar Car Team has participated in two races in the last four years. In the upcoming summer of 2014, the team will compete in the American Solar Challenge. The goal of the Michigan State Solar Car team is to win competitions, enhance the knowledge of its members, and provide a great learning experience. This is accomplished by students creating components and systems for the solar car, and the battery management system is an example.
The battery management system (BMS) is an electronically controlled system that manages rechargeable battery cells which power the solar car. The Solar Car Team wishes to develop a student created BMS. The goal of the project was to create a working prototype which could be expanded for use in the solar car later on. An important aspect of our project was to document our findings so that future members of the solar car team could reproduce and expand upon our design.
There are three main functions to the battery management system. The first is to detect over voltage and under voltage, over current and over temperature. The second function is to provide an interface for the user. The third is to take preventative action to protect the battery pack. The goal of this project is to have a basic small-scale BMS that will demonstrate these basic functions.
2

Acknowledgement
The following individuals deserve special recognition for their contributions that provided us with the information and help to successfully complete our project.
Binseng Wang: His patience and knowledge made the team overcome numerous hurdles in the battery management system. The team very thankful for all of his guidance and all the ideas he helped us cultivate to help develop our project.
Steve Zajac: Without his knowledge and guidance, we would likely still be troubleshooting in the lab. We are grateful for his patience and great explanations to our problems and questions.
Solar Car Team: The team provided great resources and background knowledge to overcome our design problems, and were always there to answer questions about the solar car and how best to build a product for them.
Greg Mulder and Brian Wright: The team can dedicate a significant amount of our success to these gentlemen. They helped the team make the PCBs and pointed out issues that could have caused problems. The quick turnaround time from sending them our schematics to having a PCB was extremely beneficial.
Nick Palazzola: He helped us with the mechanical parts of our project. He assisted the team by fabricating our battery holders based on the dimension we gave him. He also assisted the team by cutting the wood panels that make up our control hub.
Roxanne Peacock: She helped us get our parts from suppliers in very short time.
3

Table of ContentsChapter 1: Intro/Background………………………………………………………………5Chapter 2: Decompose Problem…………………………………………………………11Chapter 3: Technical Description………………………………………………………..18Chapter 4: Test Data………………………………………………………………………..47Chapter 5: Summary………………………………………………………………………..53Appendix 1: Technical Roles……………………………………………………………...59Appendix 2: References…………………………………………………………………....64Appendix 3: Arduino, NX Designs, Schematics………………………………………..66
Chapter 1 - Intro / Background
4

A battery management system (BMS) is an electronically controlled system that manages rechargeable battery cells. The most important attribute battery management systems provide is safety. When poorly managed, batteries especially lithium ion batteries can catch fire and even explode. With the increase in popularity of electric vehicles and the use of lithium ion batteries, battery management systems are extremely important in the world today.
A BMS consists of five functions. The first function is called Cell Protection. Cell protection is one of the most important features of the BMS. This system protects the battery cells by monitoring the voltage, the current, and the temperature of the individual battery cells. When any of these measurements fall outside the specified design limits, the BMS will take corrective actions to ensure system stability and safety. Such actions include emergency shutdown or simply turning on a cooling system.
The next function is charge control. This system keeps the battery cells charged to ensure operation. A related function is called state of charge (SOC) determination. This function measures the individual battery cell’s voltage. SOC is critical for operation of charge control and cell balancing. The state of charge can be found using voltage sensors interfaced with a microcontroller.
Cell balancing is a practice used in multi-cell battery systems. In a solar car, cells are usually made of at least four individual batteries. Since individual battery characteristics can vary due to production tolerances, not all cells in a system are equal. The differences can be very problematic when the cells are connected in series. During charging, weaker cells reach their maximum voltage before normal cells in the pack. This causes the weaker cells to be over charged thus degrading the cell further. During discharge, the cell is limited to the charge of the weakest battery. Cell balancing protects the system from this fault by balancing the cells to compensate for the weaker battery in cell. There are two methods pertaining to cell balancing; passive and active.
Passive balancing equalizes the cell’s voltages by discharging higher voltage cells using resistors. Figure 1.1 shows the circuit design of such a system. There are four main components to this system; resistors, voltage sensors, relays and a microcontroller. Voltage sensors continuously monitor the individual voltages of the cells. When the voltage sensors detect a higher voltage battery compared to the others, the microcontroller will take actions to fix this. The microcontroller then triggers a relay creating a parallel connection from the high voltage battery to a resistor.
5

Figure 1.1
Instead of burning the excess energy as heat through a resistor, active balancing moves the extra energy around the system to compensate for lower voltage battery cells. This method uses a high level of complexity but is very efficient. For more information regarding battery balancing methods please refer to the link in Appendix 2.
The last major component of the BMS is communication. Communication between all of the sensors, relays, and LCD screen is accomplished by using an Arduino microcontroller, which is critical for the operation of the system. By using this microcontroller, it is possible to connect all of the required input devices, read the data that they provide, and control the required response of the output devices. Communication is crucial to the BMS because it provides feedback to the driver of the car to make sure that they are aware of the state of the system, and if there are any problems with any of the batteries that need to be fixed.
In the beginning of the semester, the team defined objectives and goals for the project. The main goal of the project was to create a small-scale battery management system prototype. This system would perform basic function of a battery management system and provide information to the user. In addition to a working prototype, the team wanted to collect data and knowledge for the Michigan State Solar Car team. The hope is in the future, the Solar Car team will be able to create a BMS for the car by using the research and information that we have provided them with. Since senior members are graduating and won’t be able to help, it is critical that we document our findings so our design can be replicated and expanded upon further.
These two objectives are not only important to ECE 480 but also the Michigan State Solar Car team. In the past, the solar car has used lead-acid batteries. These
6

batteries used simple battery management solutions. For the competition this year, the Solar Car Team switched to Lithium-ion batteries. These batteries have a better power to weight ratio compared to lead-acid making them ideal for racing. The switch from lead-acid to Lithium-ion posed a problem for the Solar Car Team. Lithium-ion batteries require a complex battery management system. The knowledge and understanding of such a system was unknown to the Solar Car Team. Our project will provide a development platform that can be used to test different methods before implementation on the main car.
Designing our own battery management system allows the Solar Car Team to obtain better knowledge of the system and decrease the cost. Professional BMS can cost well over $1,200. Our design is significantly under $500. In addition to saving money, full knowledge of the system will allow the team to fix problems with the system if they arise. This knowledge will prove beneficial during competition should the system fail.
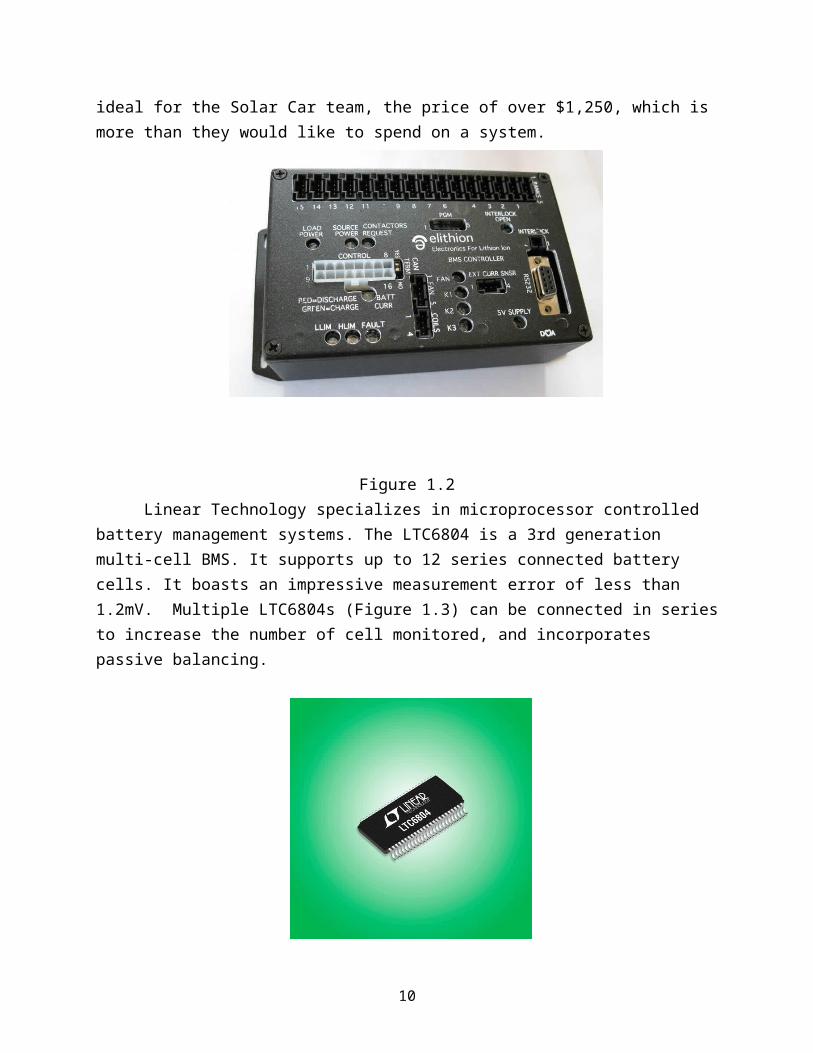
There are several battery management systems available to the public. Elithion is a leading manufacturer of Lithium-ion battery management systems. The Lithiumate Pro (Figure 1.2) is an off the shelf, plug-and-play BMS system designed for professional applications. It uses a cell board which is mounted on each battery cell. It measures the voltage, temperature and balances the cell. The system supports up to 256 cells (~900V). The Lithiumate Pro uses dissipative (passive) balancing. It supports both CAN and RS232 communication systems. It is also compatible with many chargers and motor drivers. Although this system is ideal for the Solar Car team, the price of over $1,250, which is more than they would like to spend on a system.
Figure 1.2
7

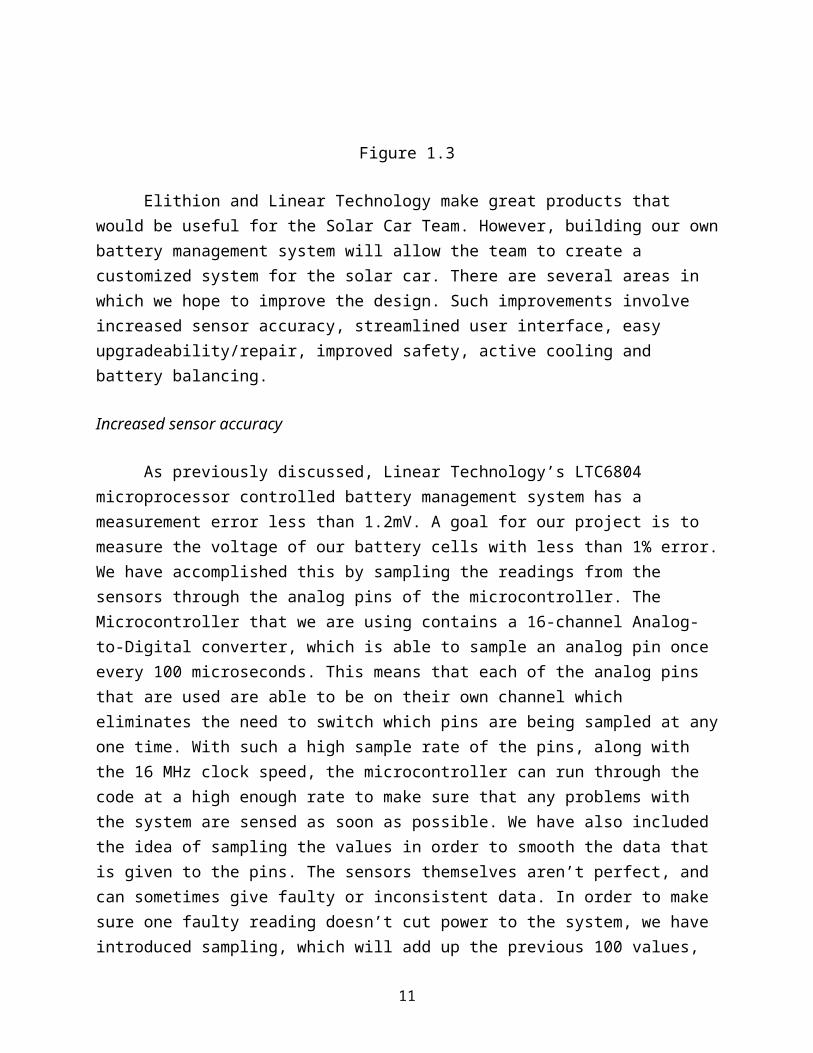
Linear Technology specializes in microprocessor controlled battery management systems. The LTC6804 is a 3rd generation multi-cell BMS. It supports up to 12 series connected battery cells. It boasts an impressive measurement error of less than 1.2mV. Multiple LTC6804s (Figure 1.3) can be connected in series to increase the number of cell monitored, and incorporates passive balancing.
Figure 1.3
Elithion and Linear Technology make great products that would be useful for the Solar Car Team. However, building our own battery management system will allow the team to create a customized system for the solar car. There are several areas in which we hope to improve the design. Such improvements involve increased sensor accuracy, streamlined user interface, easy upgradeability/repair, improved safety, active cooling and battery balancing.
Increased sensor accuracy
As previously discussed, Linear Technology’s LTC6804 microprocessor controlled battery management system has a measurement error less than 1.2mV. A goal for our project is to measure the voltage of our battery cells with less than 1% error. We have accomplished this by sampling the readings from the sensors through the analog pins of the microcontroller. The Microcontroller that we are using contains a 16-channel Analog-to-Digital converter, which is able to sample an analog pin once every 100 microseconds. This means that each of the analog pins that are used are able to be on their own channel which eliminates the need to switch which pins are being sampled at any one time. With such a high sample rate of the pins, along with the 16 MHz clock speed, the microcontroller can run through the code at a high enough rate to make sure that any problems with the system are sensed as soon as possible. We have also included the idea of sampling the values in order to smooth the data that is given to the
8

pins. The sensors themselves aren’t perfect, and can sometimes give faulty or inconsistent data. In order to make sure one faulty reading doesn’t cut power to the system, we have introduced sampling, which will add up the previous 100 values, and divide that value by 100. This will ensure that we have smooth readings instead of values that jump around and trip the system.
Streamlined User Interface
During operation of the Solar Car, the driver requires real-time information regarding voltage, current and temperature of the battery cells. This allows the team to carefully monitor the car for issues. To provide this information to the driver, a LCD display shows the voltage, current, and temperatures of the battery cells and system. This feature is not provided by other products available on the market.
Upgradeability/ Repair
The ability to upgrade our design and be able to quickly repair it is another important feature we want to implement. The microcontroller board that we have chosen has enough analog inputs for the design that we have chosen. The board does have enough analog inputs to allow for expansion to the system, should the need arise for more sensors. This will ensure that if the system ever has the need to grow, that it can be upgraded without too much work or addition to the code of the system.
The battery box uses a hinged top panel to allow for easy access to the batteries and sensors. This feature is important if a sensor breaks or if modifications to the pack are required. Another feature used to help with repair is the use of color coding every wire harness. This allows the team to quickly know which wire harness to use and where it goes.
Improved Safety
The system design will include fusing, a cutoff switch, appropriately gauged wiring, and a system shutoff to protect the system from harm. The fuses will make sure that if there is too much current going through the system that the battery packs will be cut off from the motor to make sure there is no damage to it. There is also going to be a cutoff switch that the driver can use to turn off power to the motor. The wiring that we chose to use with the system is the right size for the distance and current that will be passing through it. This will ensure that the wiring of the system will not fail due to the heavy current load.
9
Improve Cooling System
The system contains a custom designed cooling tunnel using two fans providing active cooling. These fans are powered by an external power supply that is not connected to the system. When the temperature is too high in the battery packs, the communication board will send a signal to a relay which then activates the fan system.
Battery Balancing
The voltage balancing system will allow for improved performance of the battery management system along with increased life of the individual battery cells. Passive balancing will be implemented as the first step towards this goal. Implementation of passive balancing will also provide the Solar Car team with important data about control algorithms and battery discharge information.
10
Chapter 2 - Decompose Problem
The fast diagram below describes how and why we are going to make our battery management system. On the left is our main goal, which is to protect the system. As the diagram goes to the right, it describes how we are going to accomplish these tasks. There are three primary functions which are evaluate batteries, prevent overheating, and balance batteries. To ensure proper operation of evaluating batteries, there are three secondary functions. Measure, transmit, and output the voltage of each battery cell, current of the system, and temperature of each cell. To prevent overheating which is the second primary function, the controller needs to sense the temperature of the pack and enable fans to lower the temperature. The third primary feature is battery balancing. Figure 2.1 is the battery management FAST diagram for our system.
Figure 2.1
There are three main categories to our design: mechanical, electrical and programming. For the mechanical side, a battery box and housing for the screen and electrical components is required. The electrical design is composed of several parts. Two power supply boards will be used to supply voltage to our sensor and controller.
11

Voltage sensors will be used to measure the voltages of the individual cells. A current sensor will monitor the overall system’s current to protect against over current. Temperature sensors will monitor each cell’s temperature. Programing is used to control the whole system and provide user interface.
Using House of Quality techniques, the needs of the customer can be defined. Our diagram for our House of Quality can be found in Appendix 3.The Michigan State Solar Car Team has set requirements for our design project. These requirements are listed below.
● Detect the following events○ Over voltage○ Under voltage○ Over current○ Over temperature
● Interface with a GUI that will display the following○ Individual battery cell voltage○ Battery pack current and temperature
● Take action to prevent any damage to the battery pack
In addition to these requirements, the team came up with additional features we wanted to implement if time and budget allowed. These features would enhance the project and provide additional data for the Solar Car team. The additional features are listed below.
● Active cooling system to prevent overheating ● Visual warning screen to indicate system failure● Audio warning to indicate system failure● Dashboard for LCD and switch● Battery balancing system
These customer requirements were then related back to the House of Quality design. This process measures the requirements critical to the customer and ranks them in order of importance. This process is essential to ensure the customer is satisfied and that the project runs correctly. In order to meet these design requirements, along with the additional features, the team created seven design stages. These design stages acted as our guide for the project, and are listed below.
12
Small Scale Design To ensure the programing and communication network is fully functional, this
design stage will implement only three battery cells and three temperature sensors. The most basic functions of the programing will be tested regarding temperature sensing and emergency shutdown protocols.
Medium Scale Design To ensure safety and project requirements, voltage and current sensors
are introduced into the design. These sensors will be fully integrated into the software providing the operator access to up-to-date measurements of the system.
Full Scale Design To verify the project meets requirements and expectations, extensive
testing will be completed regarding voltage, current, and temperature measurements. Control and safety protocols will be fully functional. Operator interface will be easy to use and control.
Full Scale Extra Features Design To improve the functionality of the product, this design stage introduces
additional features to the product. Such features include an active cooling system controlled by the temperature of the battery cells, alarm system to notify the operator of issues, and a custom dashboard to house the touch screen display.
Implementation of Battery Balancing (Passive)To improve the efficiency and life of the battery management system,
passive battery balancing is introduced into the design.
Implementation of Battery Balancing (Active)To vastly improve the performance of the system, active battery balancing
is introduced into the design.
A design matrix was created to better understand the complexity and feasibility of each stage. The design matrix rates the six design stages previously discussed. The categories ranked are cost, complexity, and implementation time. A ranking system of 1-5 in which 5 is the best for each category was implemented. Table 2.2 shows this matrix.
13

Design # Description Cost(5-great 1-
poor)
Complexity(5-simple 1-
difficult)
Time(5-best 1-
worst)
Average Feasibility
Rank
1 Small Scale 5 5 5 5
2 Medium Scale 5 5 4 4.67
3 Full Scale 4 4 4 4
4 Full Scale Extra Features
3 4 4 3.67
5 Implementation of Battery Balancing
(passive)
3 2 3 2.33
6 Implementation of Battery Balancing
(Active)
3 1 2 2
Table 2.2
The team chose design stage four as our goal for the project. If time permitted, we would move on to the next stage. The team surpassed the goal and successfully reached design stage five. This stage involved the implementation of a passive battery balancing system.
Initial Estimated Total Cost:
From the beginning our team has been funded with a budget of $500. Therefore, our team had to be very careful choosing the proper parts in order to meet the budget limits. Our final design was under the given budget, and cost us $237.68. The most expensive parts that we had to order were the Arduino Mega 2560 R3 board and the touchscreen 3.2" LCD monitor. Unfortunately, because of the shipping delay of the voltage and temperature sensors, the team had to order some extra sensors in order to start prototyping the design on time. However, some of the parts we have received for free. Therefore, the real cost of our design is $237.68. The fact, that the cost of the
14

design is way below the budget cap, which provides an opportunity for the future improvements and expansions. Table 2.3 shows the initial team budget.
ComponentQuantit
y Cost Tax TotalMediabridge 2.0 USB A Male to B Male Cable 1 $5.49 $0.00 $5.493.2\" TFT LCD Touch Shield for Arduino 1 $31.34 $9.93 $41.2750A Current Sensor(AC/DC) 1 $14.50 $12.00 $26.50TMP36 - Temperature Sensor 3 $1.50 $2.68 $7.18Arduino Mega 2560 R3 1 $51.91 $3.84 $55.75Voltage Sensor Module -Arduino Compatible 3 $5.58 $0.00 $16.74Temperature Sensor-1 -Arduino Compatible 3 $3.58 $0.00 $10.74Phidgets Precision Voltage Sensor 1 $18.55 $3.99 $22.54SainSmart 4-Channel Relay Module 1 $13.50 $0.00 $13.50Transistors 2 $1.00 $0.00 $1.00Switch 1 $5.00 $0.00 $5.00Fuse 1 $0.65 $0.00 $0.65Fan 3 $3.00 $0.00 $9.00MOSFET 1 $0.99 $0.00 $0.99Bussmann BP/HHM 30 Amp Mini Fuse Holder 1 $3.99 $0.00 $3.99RELAY AUTOMOTIVE SPST 30A 12V 2 $15.08 $0.00 $15.08SOCKET RELAY PC MNT FOR VF4 SER 1 $2.26 $0.00 $2.26
Total:$237.6
8Table 2.3
Project Timeline
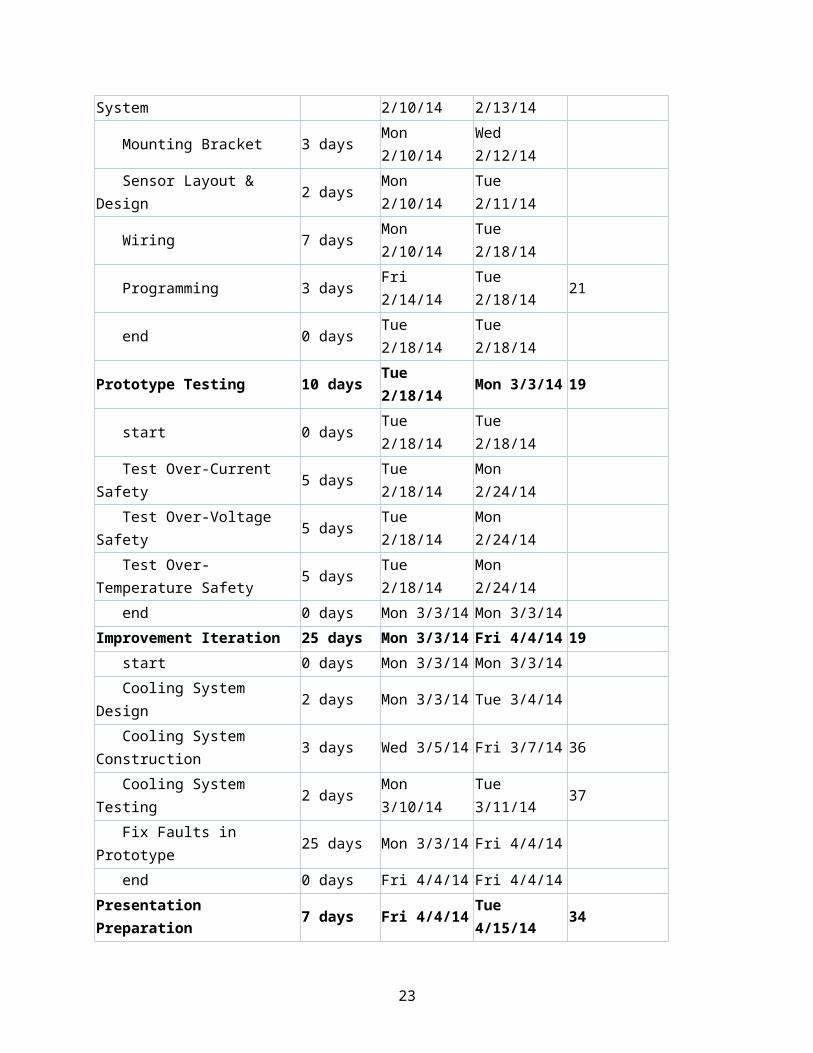
This project was split into five sections and multiple sub-sections. The main sections included research, individual design, prototype construction, prototype testing, and the improvement iterations. It was expected that research would progress through the project, but the initial research was important to allow us to start as soon as possible on the individual design. The individual design phase laid out each aspect of the project into manageable pieces. The prototype construction and testing was more intertwined than previously thought. It was intended that the improvement iteration phase of the project would allow for reserve time to complete aspects that took more time to complete than others. Some phases took longer than others, such as ordering the parts since shipping became a hassle for some of the sensors. The Gantt chart provided us a guideline to follow to keep the team on track and meet deadlines. Since the Gantt chart was created at the start of the design process, this was not the exact schedule the team
15

followed. It did however help us prioritize certain tasks over others allowing us to focus on the most important part of the project at a specific time. Key dates such as presentations were also included on the Gantt chart to inform us of relevant due dates. Table 2.4 shows the team’s Gantt chart.
Task Name Duration Start Finish Predecessors
Research 15 days Mon 1/13/14 Fri 1/31/14 start 0 days Mon 1/13/14 Mon 1/13/14 Research Problem 6 days Mon 1/13/14 Mon 1/20/14 Research Designs 5 days Tue 1/21/14 Mon 1/27/14 3 Research Components 7 days Tue 1/21/14 Wed 1/29/14 3 Compile Research 2 days Thu 1/30/14 Fri 1/31/14 5 end 0 days Fri 1/31/14 Fri 1/31/14Individual Design 7 days Fri 1/31/14 Mon 2/10/14 1 start 0 days Fri 1/31/14 Fri 1/31/14 Circuit Design 4 days Fri 1/31/14 Wed 2/5/14 Layout Design 4 days Fri 1/31/14 Wed 2/5/14 Programming Map 4 days Fri 1/31/14 Wed 2/5/14 Voltage Balancing Design 4 days Fri 1/31/14 Wed 2/5/14 Prototype(s) Design 3 days Thu 2/6/14 Mon 2/10/14 10,11,12,13 end 0 days Mon 2/10/14 Mon 2/10/14Order Parts 21 days Mon 1/13/14 Mon 2/10/14 start 0 days Mon 1/13/14 Mon 1/13/14 end 0 days Mon 2/10/14 Mon 2/10/14Prototype Construction 7 days Mon 2/10/14 Tue 2/18/14 16,8 start 0 days Mon 2/10/14 Mon 2/10/14 Communication Board 4 days Mon 2/10/14 Thu 2/13/14 Voltage Balancing System 4 days Mon 2/10/14 Thu 2/13/14 Mounting Bracket 3 days Mon 2/10/14 Wed 2/12/14 Sensor Layout & Design 2 days Mon 2/10/14 Tue 2/11/14 Wiring 7 days Mon 2/10/14 Tue 2/18/14 Programming 3 days Fri 2/14/14 Tue 2/18/14 21 end 0 days Tue 2/18/14 Tue 2/18/14Prototype Testing 10 days Tue 2/18/14 Mon 3/3/14 19 start 0 days Tue 2/18/14 Tue 2/18/14 Test Over-Current Safety 5 days Tue 2/18/14 Mon 2/24/14 Test Over-Voltage Safety 5 days Tue 2/18/14 Mon 2/24/14
16

Test Over-Temperature Safety 5 days Tue 2/18/14 Mon 2/24/14 end 0 days Mon 3/3/14 Mon 3/3/14Improvement Iteration 25 days Mon 3/3/14 Fri 4/4/14 19 start 0 days Mon 3/3/14 Mon 3/3/14 Cooling System Design 2 days Mon 3/3/14 Tue 3/4/14 Cooling System Construction 3 days Wed 3/5/14 Fri 3/7/14 36 Cooling System Testing 2 days Mon 3/10/14 Tue 3/11/14 37 Fix Faults in Prototype 25 days Mon 3/3/14 Fri 4/4/14 end 0 days Fri 4/4/14 Fri 4/4/14Presentation Preparation 7 days Fri 4/4/14 Tue 4/15/14 34 start 0 days Fri 4/4/14 Fri 4/4/14 Power Point Presentation 2 days Fri 4/4/14 Tue 4/8/14 Practice 5 days Wed 4/9/14 Tue 4/15/14 43 end 0 days Tue 4/15/14 Tue 4/15/14Gantt Chart Due 0 days Mon 1/27/14 Mon 1/27/141st Prototype Demonstration 0 days Mon 3/17/14 Mon 3/17/14Team Technical Lecture 0 days Mon 3/31/14 Mon 3/31/14Final Report Due 0 days Fri 4/11/14 Fri 4/11/14Design Day 0 days Fri 4/25/14 Fri 4/25/14
Table 2.4
17

Chapter 3 - Technical Description
There are three main categories to our design, mechanical, electrical and programming/microcontroller. These categories will be discussed in this chapter.
Electrical:
The electrical design of the battery management system consists of many subcategories. These categories include pack configuration, sensors, the battery balancing system, wiring and PCBs.
Pack Configuration:
Our design consists of three battery cells. The battery cells are connected to each other in series. Each cell contains four individual batteries wired in a parallel connection. This configure produces 11.4 volts and up to 26 amps. We used LG 18650 Lithium-ion batteries in our design. These batteries have an operating voltage of 3.7 volts and run at 3400 mAh. Figure 3.1 shows the individual lithium ion battery. Figure 3.2 shows the battery cell
Figure 3.1 Figure 3.2
Sensors:
A sensor is a hardware component that measures a physical quantity and converts it into a signal which can be read or observed by an electronic device. Later the output, which is generally a signal, can be converted and transmitted to an LCD display. The information that is provided by the sensors allows the user to take action accordingly.
18

Nowadays, some electric vehicles can contain hundreds of individual battery cells wired together and connected to the main microcontroller. Most of the batteries are large, very heavy, and in addition, have a limited amount of stored energy. As a result, the accurate estimation SOC, SOH, and operating mode of the batteries is very important for appropriate operation of the vehicle. The sensors play a very important role in proper operation of these batteries. For example, in our project, our team has used three types of sensors: voltage, current, and temperature. These sensors measure the voltage, current, and temperature of each battery pack and relay the crucial information to the main display through the microcontroller.
Because our team has used a battery pack which consists of three cells, three voltage sensors were used in the design. Each voltage sensor was installed across each individual cell, and constantly transmits the values to the main display through the microcontroller. The information that is provided by voltage sensors is very important because it can help to prevent over and under voltage in the whole battery pack.
Over-voltage occurs when some batteries reach their highest state of charge at a faster rate than others in the pack. If a battery is continually charged after reaching their 100% voltage, it can negatively affect the battery’s life and performance. On other hand, under voltage will cause a deep discharge, and if the battery is discharged below the recommended end-of-discharge voltage, overall battery performance degrades, the life cycle is shortened, and the battery may die prematurely.
The battery cells that we have used in our design consist of four Lithium-ion batteries connected in parallel. Each battery can be charged up to 3.7-3.8 volts. As a result, the total voltage of the one cell is around 3.7-3.8 volts. Therefore, we needed voltage sensors that could sense that amount of voltage across each battery cell. Moreover, because team has decided to use an Arduino microcontroller, the sensors had to be Arduino compatible. This means that they were required to operate at five volts, because that is the maximum tolerance for the Arduino I/O pins.
Considering all the criteria for the voltage sensors, the team has decided to use a
voltage sensor that could detect the voltage between 0.02445 -25 V and has 0-5V as an input to the microcontroller. Figure 3.3 shows the voltage sensors that the team is using for the design is provided below.
19
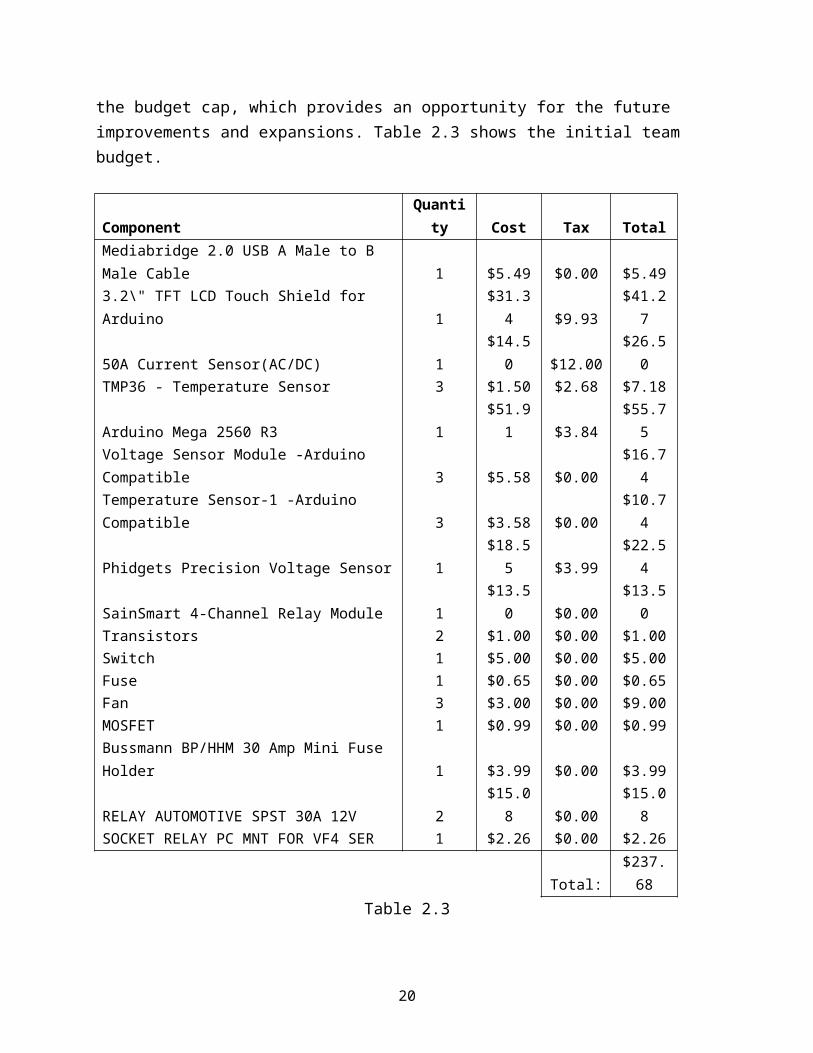
Figure 3.3
Pin 1 is connected to the positive terminal of the power supply. Pin 2 is connected to the negative terminal of the power supply. Pin 3 is connected to the microcontroller. Pin 4 and Pin 5 are connected to the cell whose voltage is being measured. Table 3.4 shows the features of the voltage sensor.
Voltage input range DC 0-25 V
Voltage detection range DC 0.02445 V-25 V
Voltage analog resolution 0.00489 V
DC input interface Red terminal positive with VCC, negative with GND
Table 3.4
This module can make the input voltage of red terminal reduced to 5 times of original voltage. The max Arduino analog input voltage is 5 V, so the input voltage of this module should be not more than 5V X 5 = 25V. Because the Arduino AVR chip has a 10 bit ADC, this module’s simulation resolution is 0.00489 V (5 V / 1023).
When our team first tried to install the voltage sensors into the system, there were some problems that we ran into. At first, our team thought that the sensors should have been placed in such a way that the positive pin of the sensor was connected to the positive terminal of the cell and the negative pin was connected to the negative terminal of the cell. Unfortunately, this connection caused a huge amount of current in the wires, and as a result, the wires caught on fire.
After doing some research online as to how to fix the problem, a solution was found. The problem with the connection of the voltage sensors was solved by using a mutual ground. In other words, we had to connect the positive pins of the voltage sensors to the positive terminals of the cells, while all the negative pins of the sensors were sharing the same node, the ground terminal of the first cell. This method of connecting the voltage sensors decreased the amount of the current flowing through the
20

wires, and made the system much safer. As a result, the code had to change because the first voltage sensor was measuring the voltage of all three cells, while the second sensor was reading the last two cells, and the third was reading only the final cell. To take care of this problem, we had to subtract the second value from the first, and the third value from the second to get our 3.7 volts readings.
In the case when measuring the current of the battery, only one current sensor was used. Because the current through the whole battery pack is the same throughout the system, one sensor was enough to provide the information about the current through all the battery packs. The current sensor is connected to the microcontroller in order to display the information on the main display. This information is very important because the over current condition can cause damage not only to the whole system, but also to the user.
The over current in the battery pack may lead to excessive generation of heat, and the risk of fire or damage to equipment. In other words, the excess of current can damage the lithium-ion batteries or even cause an explosion. Also, the excess of current will produce a lot of heat. As a result, this can lead to the wires melting and the possibility of them catching on fire.
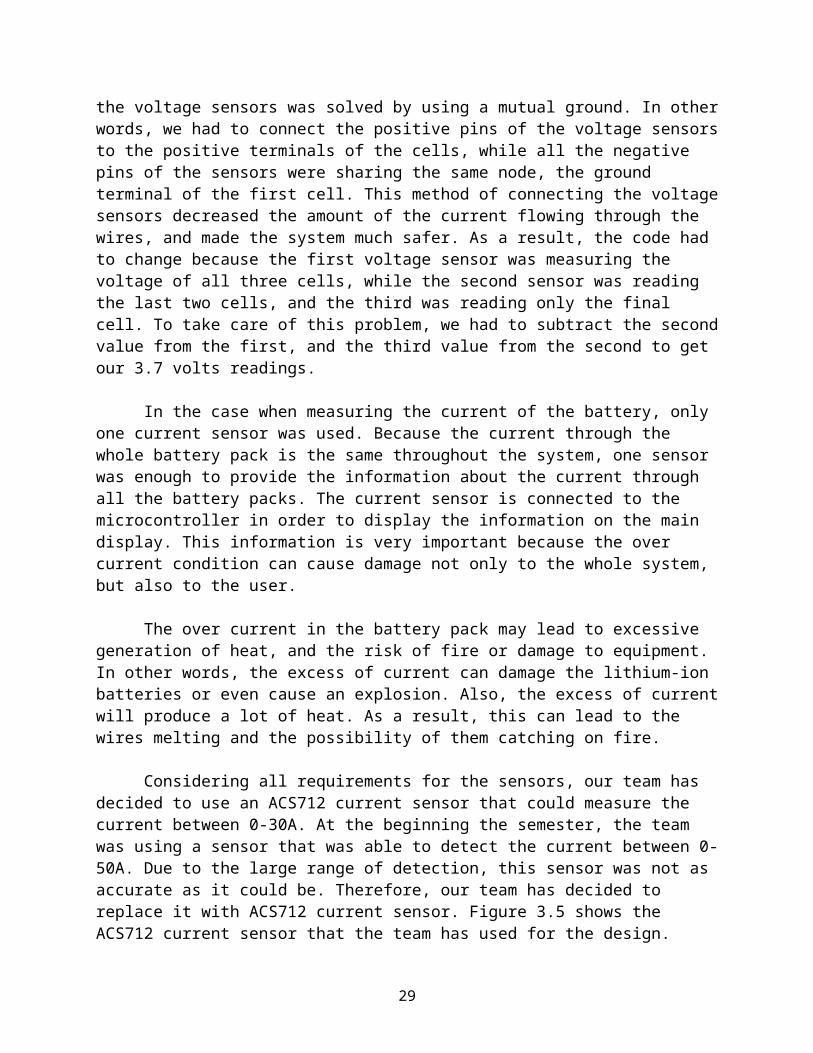
Considering all requirements for the sensors, our team has decided to use an ACS712 current sensor that could measure the current between 0-30A. At the beginning the semester, the team was using a sensor that was able to detect the current between 0-50A. Due to the large range of detection, this sensor was not as accurate as it could be. Therefore, our team has decided to replace it with ACS712 current sensor. Figure 3.5 shows the ACS712 current sensor that the team has used for the design.
Figure 3.5
Pin 1 is connected to the positive terminal of the power supply. Pin 3 is connected to the negative terminal of the power supply. Pin 2 is connected to the
21

microcontroller. Pins 4 and 5 are connected to the positive and negative terminals of the battery pack. Table 3.6 shows the features of the current sensor.
Product Name Current Sensor Module; Model : ACS712
Range Current 30A; Size : 31 x 13mm/ 1.2" x 0.5" (L*W)
Material Plastic, Electronic Part
Net Weight 3g
Table 3.6
Because of the fact that the temperature in each cell is different, our team has decided to use three independent temperature sensors. These sensors were installed as close as possible to the battery cells and transfer the temperature information to the main display through the microcontroller. The information about the temperature of the cells is very important because it can negatively affect the performance of the battery pack. The higher the temperature, the faster chemical reactions will occur within the batteries. As a result, a high temperature can increase performance of the batteries. However, high temperature will also increase the rate of undesired reactions and it will result in the loss of battery life. On the other hand, if the temperature of the batteries is very low, it will slow down the charge speed. Therefore, maintaining a consistent temperature of the battery will help to increase its performance and life cycle.
Considering all criteria for the sensors, the team has decided to use TMP36 - temperature sensor. We have decided to use this type of sensor because it was accurate enough, has a large range of sensing the temperature, a small size, and minimal cost. Figure 3.7 shows the temperature sensors that the team has used for the design is provided below.
Figure 3.7
Pin 1 is connected to the positive terminal of the power supply. Pin 3 is connected to the negative terminal of the power supply. Pin 2 is connected to the microcontroller.
22
Voltage Input: 2.7 V to 5.5 VDC
Scale factor 10 mV/°C
Accuracy over temperature ±2°C
Linearity ±0.5°C
Operating Range −40°C to +125°C
Table 3.8
Battery Balancing:
As discussed earlier, cell balancing is a practice used in multi-cell battery systems. This process compensates for the differences amongst the batteries by equalizing the voltage of each cell during the charge and discharge cycles. There are two main methods regarding battery balancing, passive and active.
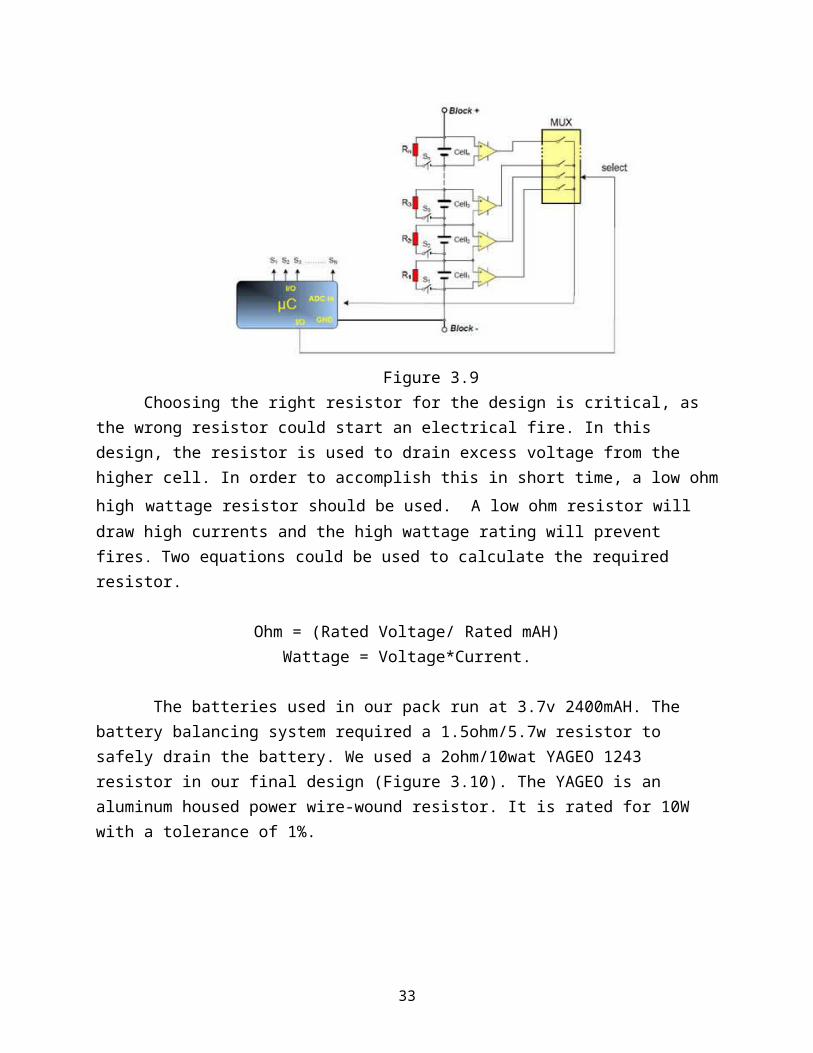
The team decided to implement passive balancing. Passive balancing equalizes the cell’s voltages by discharging higher voltage cells using resistors. This method prevents over voltage during the charging cycle of the batteries.
There are four main components to this system; resistors, voltage sensors, switches and controller. Figure 3.9 shows the fundamental diagram for such a system. When the Arduino detects an abnormally high voltage cell, it sends a signal which triggers a relay to create a connection with the battery pack and a resistor in parallel. This connection drains the battery until its voltage is equivalent to the other cells in the system.
Figure 3.9
23

Choosing the right resistor for the design is critical, as the wrong resistor could start an electrical fire. In this design, the resistor is used to drain excess voltage from the higher cell. In order to accomplish this in short time, a low ohm high wattage resistor should be used. A low ohm resistor will draw high currents and the high wattage rating will prevent fires. Two equations could be used to calculate the required resistor.
Ohm = (Rated Voltage/ Rated mAH)Wattage = Voltage*Current.
The batteries used in our pack run at 3.7v 2400mAH. The battery balancing system required a 1.5ohm/5.7w resistor to safely drain the battery. We used a 2ohm/10wat YAGEO 1243 resistor in our final design (Figure 3.10). The YAGEO is an aluminum housed power wire-wound resistor. It is rated for 10W with a tolerance of 1%.
Figure 3.10 Figure 3.11
The switching function of our design used three Spartan 9007 reed relays. These relays were perfect for our design due to the low turn on voltage of 3.75v and high current rating of 2amps. The turn on voltage was low enough for the Arduino to directly trigger the relay and the current rating was enough to safely handle the battery discharge. Unfortunately, this did not work the way we hoped. When the screen is connected to the Arduino, the output current and voltage is lower than spec. It was not enough to trigger the relays. To resolve this problem, a separate “triggering” circuit was created. This circuit consisted of 3 TIP31A transistors. Figure 3.11 shows the relays used in this design. The transistors required only 1.2v to trigger allowing the Arduino to successfully trigger them. A 5v source was used to power the reed relays. When the TIP31A transistors are triggered, a connection from the relay to ground is formed. This turns on the relay thus connecting the resistor and battery.
24

An additional feature of this circuit introduced a switch. Since passive balancing is only useful during the charging cycle, a switch allows the using to control when the balancing system is on.
After prototyping, our design went onto a PCB. Since this system is running high currents, larger traces were used in the PCB. Figure 3.12 shows the completed PCB battery balancing system. Figure 3.13 shows the proto-type and the completed circuit used to trigger the balancing system. Since the resistors are “burning off” the excess energy, they can obtain high temperatures. Ample amount of space between each resistor and other components was given to prevent issues.
Figure 3.12
Figure 3.13
25

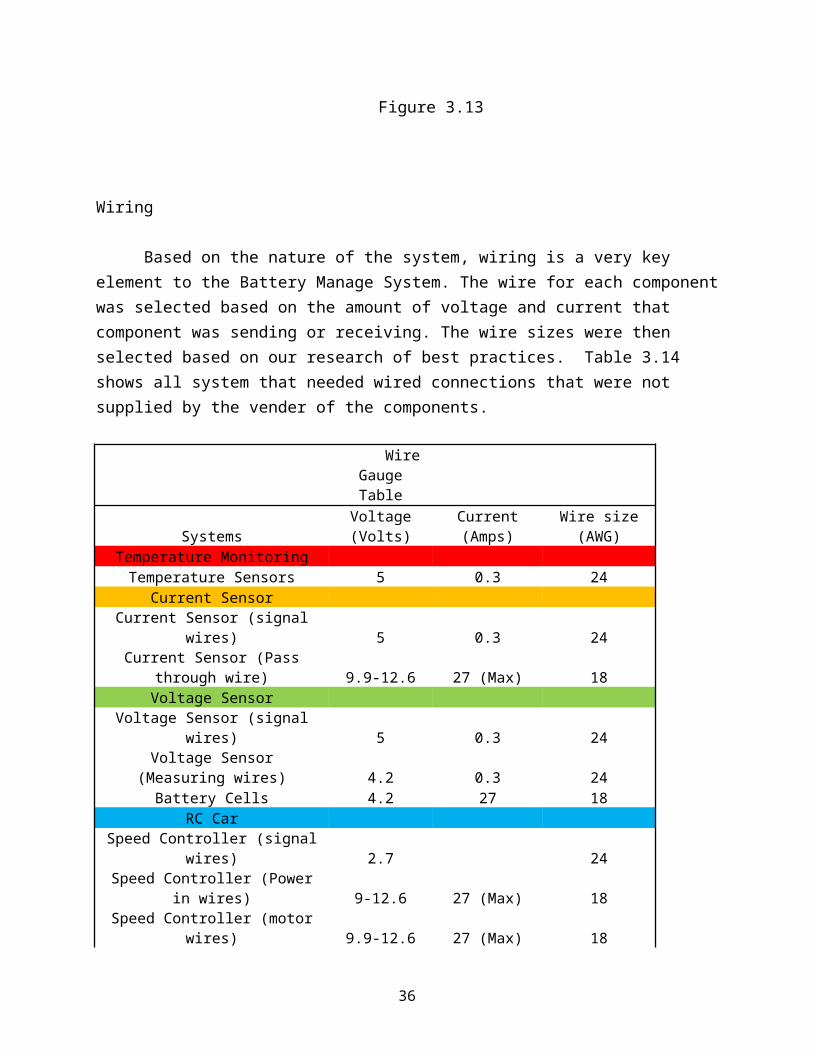
Wiring
Based on the nature of the system, wiring is a very key element to the Battery Manage System. The wire for each component was selected based on the amount of voltage and current that component was sending or receiving. The wire sizes were then selected based on our research of best practices. Table 3.14 shows all system that needed wired connections that were not supplied by the vender of the components.
Wire Gauge Table
Systems Voltage (Volts) Current (Amps) Wire size (AWG)Temperature Monitoring
Temperature Sensors 5 0.3 24Current Sensor
Current Sensor (signal wires) 5 0.3 24Current Sensor (Pass through wire) 9.9-12.6 27 (Max) 18
Voltage SensorVoltage Sensor (signal wires) 5 0.3 24
Voltage Sensor (Measuring wires) 4.2 0.3 24Battery Cells 4.2 27 18
RC CarSpeed Controller (signal wires) 2.7 24
Speed Controller (Power in wires) 9-12.6 27 (Max) 18Speed Controller (motor wires) 9.9-12.6 27 (Max) 18
Cooling SystemFans 12 0.04 24
System ProtectionRelay (Coil side wires) 12 0.3 24Relay (Switch wires) 9.9-12.6 27 (Max) 18
Transistor 12 0.3 24Emergency Switch 9.9-12.6 27 (Max) 18
Table 3.14
To ensure the wire’s protection and to keep order within the battery box, each component’s set of wire were bundled together. A sleeve of heat shrink was then applied to ensure bundle security and as another level of heat protect from the batteries or any environment that may be in. Figure 3.15 shows the wire harnesses sealed in the 3M heat shrink.
26

Figure 3.15: Harnesses and samples heat shrink
Power Board:
Electronic circuits are normally manufactured through the use of Printed Circuit Boards (PCB). Usually the boards are made of glass reinforced plastic, and copper tracks are used instead of the wires. In order to place the components on the board, holes are drilled through the boards. As a result, the components can be mounted and soldered to the holes and the copper tracks link them together forming the circuit.
Any circuit can be drawn by using a software program such as EAGLE (Easily Applicable Graphical Layout Editor). This software allows any individual components such as resistors, capacitors, transistors, and etc. to be dragged onto the screen and to be connected together, forming a complete circuit. All the user needs to know is the type of the component and the manufacturing number. Later, the completed circuit can be simulated on the computer. In case of any mistakes, such as an incorrectly built circuit, the software will provide feedback to the user and the user will be asked to fix the problem. The message will be displayed on the screen until the circuit works in the desired way. Because of this feature, the circuit can be tested on the computer and corrected or improved before manufacturing it. This saves time as there is no need to build the circuit with real components.
For our design, our team had to make a few separate PCBs. In order to do that, the team used EAGLE 6.4.0 software. First we had to come up with a circuit that could convert the 12 V of the wall wart into 5 V for the sensor power. As a result, we have decided to use a power supply circuit that we had to build in the first lab of ECE 480 (Figure 3.16).
27
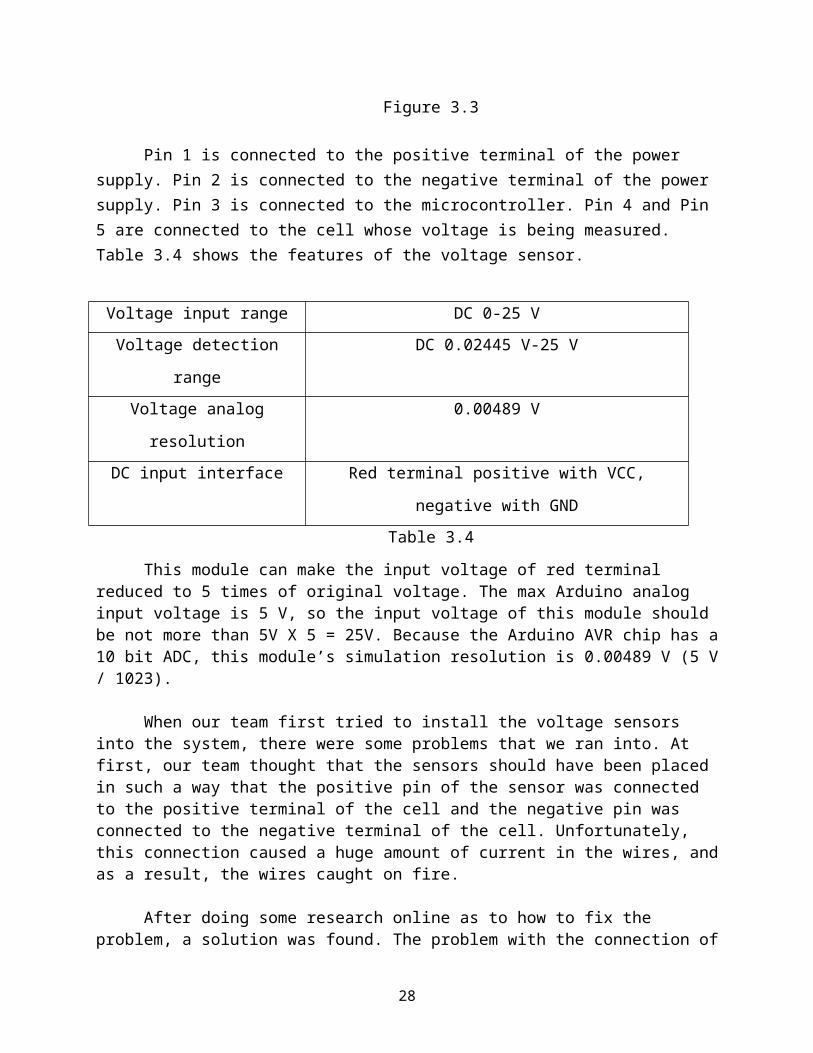
Figure 3.16: Power Supply
Before sending the design to the shop, the team decided to build the circuit on the breadboard in order to make sure that the circuit was working in the proper way. After all the testing was done, the circuit was built on the EAGLE software (Figure 3.17). Later, when the program checked that the circuit was built in the proper way, the team was able to create a layout (Figure 3.18).
Figure 3.17: Power Supply Circuit. EAGLE
Figure 3.18: Circuit Layout. RAGLE
28
From figure 3.18, we can see that the circuit was modified a little bit. Instead of one 5 V output, we had to use ten 5 V outputs. It was made that way in order to have enough outputs that could feed the sensors for the system.
Moreover, our team needed 12V outputs in order to start the fans in case of the system overheating and another 9V output for powering the Arduino. It was necessary to provide a stable voltage to the microcontroller because the wall wart has a tendency to provide more than 12 volts. If this happens, over time it can damage the voltage regulator of the microcontroller, and the microcontroller itself. Once the voltage from the wall wart was passed through the voltage regulators, it was a much safer voltage to operate the Arduino at. As a result, our team has decided to use the same circuit from the first lab of ECE 480. However, Pin 2 on the figure 3.16 was not outputting 9V. The output voltage was varying between 12V and 9V. Therefore, the voltage regulators were changed to 12V and 9V regulators.
The main relay for our project requires a 12v trigger. This is controlled by a TIP31A transistor. The Arduino outputs 5 volts to the transistor which then turns on the transistor and completes the path to ground for the relay, which turns the relay on. Figures 3.19 and 3.20 are the circuit diagrams for this circuit.
Figure 3.19: Relay Circuit
29
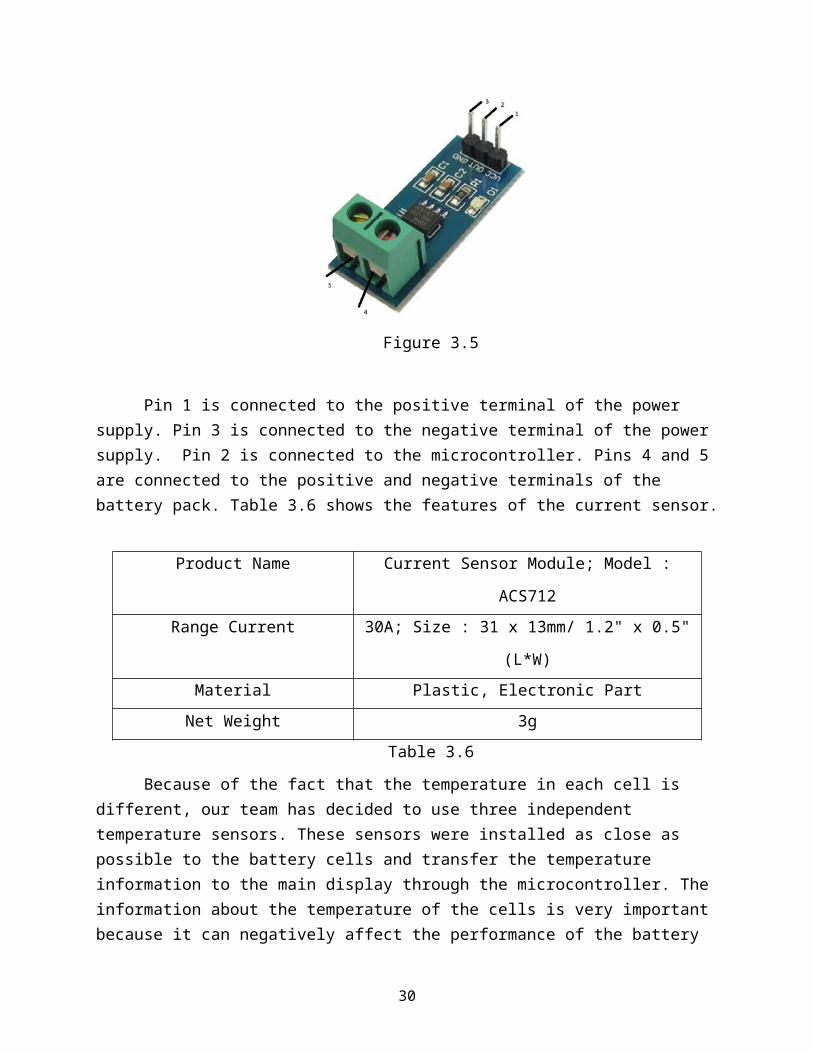
Figure 3.20: Relay Circuit Layout
Relay Printed Circuit Board
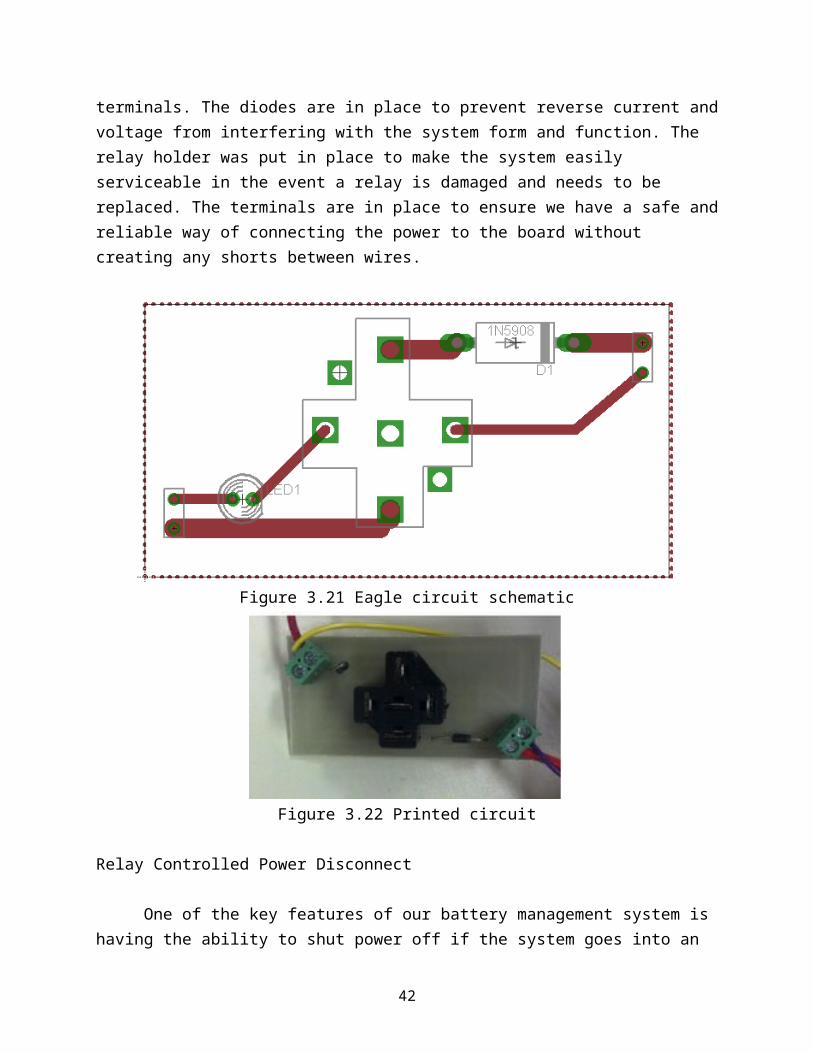
After testing our relay-controlled power disconnect system, we transferred the components to a printed circuit board. Figures 3.21 and 3.22 below are the schematic of the circuit and the printed board. The components that occupy the board are two 1N5908 diodes, a 12 Volt relay, relay holder, and two wire terminals. The diodes are in place to prevent reverse current and voltage from interfering with the system form and function. The relay holder was put in place to make the system easily serviceable in the event a relay is damaged and needs to be replaced. The terminals are in place to ensure we have a safe and reliable way of connecting the power to the board without creating any shorts between wires.
Figure 3.21 Eagle circuit schematic
30

Figure 3.22 Printed circuit
Relay Controlled Power Disconnect
One of the key features of our battery management system is having the ability to shut power off if the system goes into an unstable state. The system consists of two key items, a transistor and a 12 volt automotive relay. The transistor is used to trigger the 12 volt relay. This was the method of choice because of the voltage and current output supplied by the Arduino. The Arduino triggers the transistor to turn on, allowing a 12 volt 300 milliamp power source to trigger the 12 volt relay. The relay then acts as the switch between our batteries and the system load. When the system detects a system fault, the transistor is turned off, which results in the loss of power to the relay's coil, releasing the relay and shutting down the system. Figures 3.23 and 3.24 show the connected circuits involved for the relay system. For more information related to relays and how they work please reference our application notes online.
Figure 3.23: Top and bottom view of
the transistor board Figure 3.24: Top and bottom view of the
relay board
31

12V Fans
Our system is designed to respond to changes in the environmental conditions located by the battery cells. One of the most important parts of keeping the batteries safe and making sure they last as long as possible is how hot they get when they are powering the system. When the batteries are powering the load, they will generate excess heat, which if not taken care of, can lower the lifespan of the batteries. In order to combat this problem we have included an air ventilation system in our battery box. This cooling system consists of two fans, one of which pulls cool air into the box, and the other which pushes hot air out of the box. These fans in figure 3.25 will provide a safer working condition for the battery cells in escalated temperature conditions.
Figure 3.25: 12V Fan
Along with the fans that are located on either side of the battery box, there is also a fan inside of the box that is housing the microcontroller and relays. While there is not a lot of heat generated by the board or the relays, it is always good practice to make sure that the microcontroller does not get overheated, which will lower the life of the microcontroller.
32
Relay Board
In order to safely control the power to the 12V fans that are used in the system, we decided to use relays to turn the fans on and off. Due to the limitations of the voltage and current available at the output pins of the microcontroller, it was necessary to use relays in this case. The microcontroller can only supply 5V at the pins, which wasn’t enough to run the fans. The device that was chosen was one that was compatible with the Arduino microcontroller, and would be able to take the signal of the analog output pins to turn on power to the fan system. The device that was chosen is pictured below in figure 3.26, and provided four relays for us to use throughout the system.
Figure 3.26: SainSmart 4-channel Relay Board
This relay board is a logically low-triggered relay board. This means that an input of ~0 volts to the signal pins will cause the relay to close. As shown in figure 3.26, the board is powered by 5V at the Vdd pin, and is grounded to the microcontroller via the ground pin. The four pins in-between these two pins are the signal pins, which are used to control whether the relay is open or closed. The board also shows whether or not the relay is closed by using the four LEDs at the bottom of the board. These LEDs will illuminate whenever the relay is closed so that we know that power is being applied to the device.
Another useful feature of this relay board is that it includes normally open and normally closed terminals. What this means is that when power is applied to the middle terminal, you can decide whether you want power applied to the load when the relay is
Ground Pin
Vdd Pin
33

closed, or if power is applied when the relay is open. If the device is connected to a normally closed relay, this means that power will be sent to the device when the relay isn’t powered. However, if a device is connected to a normally open relay, then power will not be sent to the device until power is supplied to the relay to close it.
In practice, this device is being used to power the 12V fans that are being used to cool down the system. The fans are powered by the 12 volts from the power supplies on the printed circuit boards. The 12 volts is fed into the middle terminal of the relay, and the Vdd wire of the fan is connected to the normally open terminal on the board. This way, when a logical low (0 volts) is passed to the signal pin of the relay, the relay will close, and power will be sent to the fan to turn it on. The ground wire of each fan will be connected to the common ground of the system in order to complete the circuit.
LCD Screen
In order to be able to send feedback to the driver, the design uses an LCD screen to display the information provided by the sensors. The screen that was chosen has a resolution of 240 x 320 pixels, and is a 3.2” screen. This particular screen can operate at 3.3 volts or 5 volts, which meant it was perfect for our microcontroller. This particular screen is designed to simply fit on top of the entire microcontroller board, but because of the interfacing required with our sensors, this isn’t possible. This meant that the screen needed to be connected by using jumper wires to make the connections instead of laying the screen on top, which allows us to still access all of the other pins that the screen doesn’t use. The screen itself uses 24 of the digital I/O pins as well as five of the analog PWM outputs to display the information on the screen. This takes up a lot of the available I/O, but because this system doesn’t use digital devices, this screen works perfectly for our needs. The screen is shown below in figure 3.27.
Figure 3.27: 3.2” TFT LCD Screen
34

This screen is used to display the temperatures of the three battery packs, the voltage of the three battery backs, and the current of the entire system. This allows the driver to monitor the system, and if something is wrong with one of the cell packs, the driver can cut power to the system via the cutoff switch which has been wired into the system as a safety feature. If any of the sensors detect something wrong with the system, the screen then flashes red and reports that there is a fatal error with the system, and that power has been cut to the system. This blinking red screen will not go away until everything is back to normal and the reset button has been pressed.
Piezo Buzzer
In addition to the basic requirements that we had been given for the project, we decided that it would be a good idea to include an audible indication that something is wrong. In order to do this, we have included a Piezo buzzer to alert the driver that something is wrong with the system. If any of the sensors notice a value is out of range, along with the screen flashing red as described earlier, the buzzer will emit a warning sound that something is wrong. This buzzer uses an analog signal that must be a sine wave, which means it makes use of the PWM outputs on the microcontroller. The buzzer used in this project is shown below in figure 3.28.
Figure 3.28 Piezo Buzzer
35
Mechanical:
Enclosures
To build all components incorporated with the battery management system, the team came up with two separate enclosures. One of the enclosures houses the Arduino, LCD screen, and other various circuitries incorporated in our system. The second houses the batteries and all of the systems sensors.
Control Hub
The control hub design consists of a spacious box that allows for all of circuitry to fit within it while still leaving space for a cooling system to be added. The team used NX to help model and visualize how the box should look and how items with will be placed on it. Figure 3.29 show the first proto-type of the control hub.
Figure 3.29: NX Proto-type
Once all of the system components were selected, the team came up with the final design for the box design. Figure 3.30 is the final design and constructed control hub. It can be notice that minor changes were made, such as the angle of the screen setting and the depth of the box. All improvements were made to ensure a better fit for components, and improve viewing angles of the LCD. One item that stayed the same from the original design was the LCD cover. The LCD cover the team designed was 3D printed and screwed to the front cover to ensure the security of the LCD.
36

Figure 3.30: Final design
Battery Box
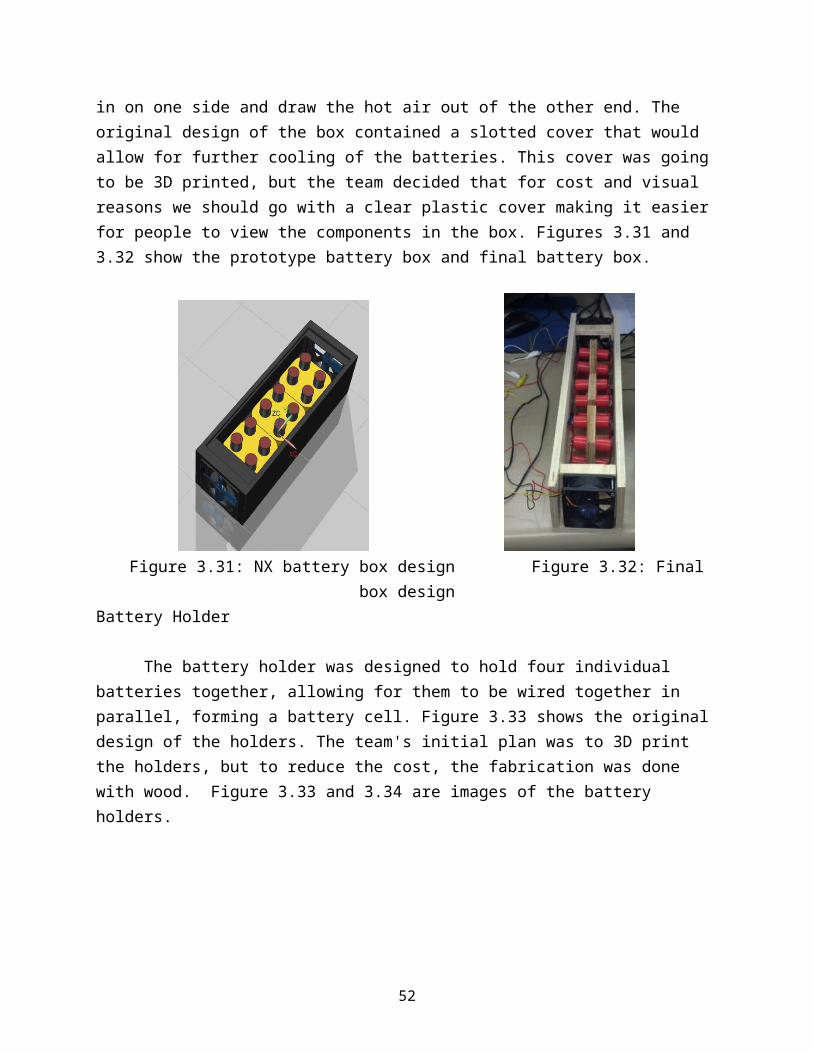
The battery box was designed to hold three battery cell, the temperature sensors, and voltage sensor. Another important function that the box has is safely housing the wire harnesses. Similar to the control hub, the proto-type had to undergo some adjustments to accommodate all of the components. Because the battery management system communicates with all of the sensors in the box, a clear path had to be made for the wires harness to be traced out of the box back to the control hub. This battery box has a passive ventilation system allowing fans to draw cool air in on one side and draw the hot air out of the other end. The original design of the box contained a slotted cover that would allow for further cooling of the batteries. This cover was going to be 3D printed, but the team decided that for cost and visual reasons we should go with a clear plastic cover making it easier for people to view the components in the box. Figures 3.31 and 3.32 show the prototype battery box and final battery box.
Figure 3.31: NX battery box design Figure 3.32: Final box design
37

Battery Holder
The battery holder was designed to hold four individual batteries together, allowing for them to be wired together in parallel, forming a battery cell. Figure 3.33 shows the original design of the holders. The team's initial plan was to 3D print the holders, but to reduce the cost, the fabrication was done with wood. Figure 3.33 and 3.34 are images of the battery holders.
Figure 3.33 NX battery holder design Figure 3.34: Final battery holder Design
Remote Controlled Car
To demonstrate system functionality of the battery management system the team built up a remote controlled car. The car will be connected to the batteries of the system and from the control hub, the team can monitor the cell charges and the current being drawn by the car. Figures 3.35 and 3.36 show the remote controlled car and it components.
Figure 3.35 Figure 3.36
38

To ensure the remote control car worked with our system, testing had to be done. When the team received the car many of the components were disassembled. Once everything was reassembled, we realized the radio control unit was missing. In order to control the speed of the motors, a sinusoidal wave must be fed to the speed controller. With a little bit of testing, we were able to figure out that the lab function generators could adjust the speed of the motors. The function generator must be set to amplitude of 2.7 volts, and the frequency must set to 264 hertz for the motors to remain off. Figures 3.37 and 3.38 show the speed controller in the neutral position at 264 Hertz.
Figure 3.37 Oscilloscope reading 264 Hertz at the speed controller
Figure 3.38 The function generator output and multimeter reading of the motor voltages
39
When the frequency is adjusted higher than 264 Hertz the speed controller will drive the wheels forward. The max frequency is around 330 Hertz and it draws around 5 amps. If the frequency is adjusted below 264 Hertz the speed controller will drive the car in the reverse direction. The minimum frequency is around 200 Hertz and it also draws around 5 Amps. Figures 3.39 and 3.40 show the speed controller in a non neutral position at 270 Hertz.
Figure 3.39 Oscilloscope reading 270 Hertz at the speed controller and the voltage output
Figure 3.40 The function generator output and multimeter reading of the motor voltages
40

Programing and Microcontroller:
Microcontroller
The central component that was the most important to this project was the microcontroller that would communicate with all of the devices of the system. There were a few basic requirements that we had to make sure the device met to make sure that is was the right microcontroller for us. Most importantly, we required:
7 analog inputs (with the possibility of adding more in the future) Digital outputs for an LCD screen PWM for analog outputs A fast enough clock speed to sample the input sensors 5 volt pins to operate inputs/outputs
After much research, the microcontroller that was chosen was the Arduino Mega 2560R3. The reason that this board was chosen was that it was a very versatile product that fulfilled all of the requirements listed above, and is pictured in figure 3.41 below.
Figure 3.41 Arduino Mega 2560R3 Microcontroller
Among some of the most useful features of this board is the fact that the pins operate at 5 volts, and that there are 16 analog input pins. Originally, it was only required that the board had 7 analog input pins, but we felt that it was important that the board is able to be upgraded by the Solar Car Team if they wish to use this product in the future. For now, our system consists of only 3 battery cells that we have to monitor, but the solar car team may need to monitor more cells in their implementation. This will allow for them to add the necessary voltage and temperature sensors without requiring them to buy a new microcontroller to fit their needs.
Another important feature of this board is that it has the pulse-width-modulation option for the analog output pins. This will allow us to send signals to the piezo buzzer
Reset
41
as well as the devices that do not require this feature such as the relays that control various parts of the system.
Pulse-width-modulation is a simple concept that is used by a wide range of microcontroller to allow the use of digital signals to replicate an analog signal as an output. What the microcontroller will do is generate many different square waves of different amplitudes and periods, which can be used to generate something that resembles a sine wave. This can be used to power something such as an AC motor drive, or something as simple as the piezo buzzer that is used in our project.
Another requirement for the microcontroller was that it had a fast enough clock speed. This is a very important part of a project which deals with safety, as ours does. The reason that the clock speed is so important is because we need to be able to sample the inputs, check their values against the code, and output to the devices as fast as possible. With our system, there is the possibility of current and voltage spikes, which can be very dangerous especially when working with something with as much power as the batteries that we are using. If there is a spike in voltage or current of any of the cells, our system needs to be able to respond quickly enough to make sure that they system isn’t damaged, or that the driver isn’t injured. There were microcontrollers with faster clock speeds, but the Mega 2560 provided a clock that was fast enough to respond to any of these problems quickly enough.
A final advantage to this microcontroller includes the reset button located on the board itself. As seen in figure 3.41, this is the red button on the right side located in the center of the board. This is useful especially when the code cuts power to the system because it requires the driver to make the fix to the system before power can be restored to the load. This is a very important safety feature which will ensure that the system is safe before it is powered again. Once the problem has been fixed by the driver or crew, they simply need to press this reset button, and if everything is good to go, the system will supply power once again.
Programming
Once all of the devices are hooked up to the Arduino microcontroller, we needed to program them to interface with each other, and output the correct state to each device to provide a safe system for the solar car team.
Arduino provides their own coding design environment, which includes many useful functions to interface with the microcontroller. There are functions to read values from the pins, write values to the pins, and other than that, it operates very similar to other programming languages such as C or C++. The code that was written for this
42
project also utilizes an imported library to be able to interface with the LCD screen. This is a library that was provided by the developers of the screen, and provides custom functions to use when writing data to the screen.
At the top of the code that will be provided to the solar car team is a list of variables that can be changed according to how the solar car is required to perform. For our demo, we have used custom numbers to demonstrate the effectiveness of the system, but these values can be changed for the real world scenario that the team will require of the device. These values include the minimum and maximum voltage, maximum current, and maximum temperature allowed for the system to be operating properly. Once these variables are changed at the top of the code, the values will be used throughout the code.
Arduino provides a simple layout for the code that is written. At the beginning of the code, the global variables can be declared and given values, which will be used throughout the code as previously described. They then utilize a setup loop in which the programmer will initialize all of the pins, variables, LCD screen, etc. that is required to interface with the board and to read or write values to it.
After all of the setup has been completed, the programmer then uses the loop that is utilized in all Arduino code. This loop will continually run until reset it pressed, or the board loses power. This is very important to know when it comes to our system because we want to make sure that if something is wrong the code essentially “stops” running until reset has been hit.
At the beginning of this loop, our code uses the analogRead() function in order to read the values that are being provided to the pin specified in the parenthesis. This value will be on a scale from 0 to 1023. This range of values is what determines the resolution of the microcontroller and the sensors. If you are using a sensor that only measures a small range of values, these values will be divided evenly amongst the values in this range, and you will have greater accuracy with your sensors. However, if you are using a sensor that is measuring a vast range of values, i.e. 0 to 50 amps, then each value from 0 to 1023 represents a larger range of values, and you can lose precision. Fortunately, 1024 values is a large range, and the sensors that are being used aren’t covering a large range of values, so this works well in our system.
Once we have our value from the analogRead() function, we can use this value along with some equations to determine what value this represents. The equation required to convert this value to something we can use for our temperature sensors would be:
43

Temperature (℃ )=(( pinReading∗5.01024.0
)−0.5)∗100
Convert Reading to Celsius
Temperature (℉ )=(Temperature (℃ )∗9.05.0 )+32.0
Convert Celsius to Fahrenheit
The Celsius equation was an equation provided in the user manual for the temperature sensors that we have used for the project. The equation for Fahrenheit is from the known equation to convert from Celsius.
Similarly, the equations for voltage and current are as follows:
Voltage (Volts )=
pinReadin g4.15510100
Convert Reading to Voltage
Current (Milliamps )=
(521.5−pinReading )∗75.761024100
Convert Reading to Current
The derivation for the current equation comes from the output sensitivity of the current sensor itself, and the sensitivity (mV/A) that is has. In the case of our sensor, it has a sensitivity of 66 mV/A. This can be used to determine the amperage based on the value that is presented by the pin in the following way.
5VxA
=0.066V1 A
x=75.75
This value is then inserted into the equation as the value to multiply the input value by. The reason we subtract the pin reading from 521.5 is because that is the
44

value required to get the sensor to read zero amps, which is the baseline. Once we have this value, anything greater than zero will be multiplied by this value, divided by the resolution, and converted into mA
To calculate the voltage value, we used the voltage code that was given with the sensor that was ordered. However, the equation would break down to something similar to what was described above to get the current equation.
In the case of all of the sensors, the values that we used in the equations were different between each sensor, which is due to inconsistencies when these devices are manufactured. Making sure the sensors are accurate is an important step to making sure that the system behaves correctly and responds how it should when there is a problem.
Another way in which the code was written to provide accuracy was to include sampling. This is accomplished by taking the previous 100 values that the sensor has read, adding them all together and dividing by 100. This is an important measure to take to make sure that any faulty readings from the sensor don’t cut power to the system when there isn’t really a problem. This is a sensitive step however because we do want the system to respond to spikes in current and voltage, which is why it is important not to sample too much to get rid of the readings that should be taken into account.
Once all of the values have been calculated, it is time to check their values against what is allowed by the limits we have set previously. At this point, all of the values we have calculated are checked to see if they are beyond the limits we have placed. If they are, we will cut power to the relay of the system, and the system will lose power. According to the datasheet for the relay that we are using, the particular relay has a 13 millisecond release time (excluding bounce). It can also be assumed that because the microcontroller runs the code at such a fast rate, that the time between sensing the current and the time to send the signal to the relay to turn off is negligible. This means that the approximate time to cut power to the system is 13 milliseconds. This is fast enough to cut power before any excess current or voltage will do any significant damage, and will be able to keep the driver and the system safe. All of this is accomplished by putting the code in an infinite loop that will run until a reset.
If there are no problems with the values, they will pass through all of the if-statements, and all of the values will be written to the LCD screen for the driver to see and monitor for his or herself. These values are also updated every time that the microcontroller gets to the end of the loop.
45

We have also included the idea of battery balancing to our code and our project. In order to accomplish this, we had to make sure our code turns on the correct relays to complete the circuit for the burn off resistors. To do this, we check to see which battery voltage is the highest. That battery’s relay is then turned on for 10 seconds to burn off the excess voltage. The values are then checked again to see which is the highest, and the process is repeated. This will only happened in the charging mode, which will be determined by a switch which had been wired to the microcontroller to tell it which state it is in. The screen has also been programmed to tell the user which battery’s resistor is currently in use.
As far as writing values to the screen, the library that is included provides a user-friendly way of displaying data on the screen. The screen allows the user to use a small or large font, set the color of the screen, and write strings of words as well as calculated values to the screen by using the print, printNumI, and printNumF. Print is used to print strings of words, printNumI will print integers, and printNumF will print floating points. There are many other different functions in the library that comes with the screen that can be found online
Chapter 4 - Test Data
46

The project consisted of many individual components and processes. To ensure the features functioned correctly, each one was individually tested. Once they were tested individually, overall system tests were completed.
Temperature Sensors:
To make sure that the temperature sensors were functioning properly and giving good values to our microcontroller, we needed a baseline to compare our sensor readings to. To do this, we used a thermometer that we know will report good values, and we were able to compare the values shown in the table below
Thermometer Temp. (F)
Sensor 1 Temp. (F)
Sensor 1 Error
Sensor 2 Temp. (F)
Sensor 2Error
Sensor 3 Temp. (F)
Sensor 3 Error
71.0° 70.55° 0.63% 70.55° 0.63% 71.01° 0.014%78.0° 78.70° 0.897% 78.70° 0.897% 79.36° 1.74%83.0° 85.22° 2.67% 85.22° 2.67% 85.38° 2.87%
Table 4.1
As is seen in the table above (Table 4.1), the temperature values read from the sensors are very close to the baseline thermometer. Even though the values aren’t perfect and are a few percentage points off, they will still be able to provide the basic need of sensing the surrounding temperature, and they do not need to be perfectly precise for the job they are required to do.
Voltage Sensors:
To ensure the accuracy of our voltage sensors, the sensors’ readings were compared to the readings of a Hewlett Packard 34401A multimeter. The multimeter was connected to each battery cell and the values were then compared. The table 4.2 shows the first round of data collected
Battery Cell Voltage Sensor Voltage Multimeter Voltage % Error1 3.84 3.779 1.62 3.88 3.781 2.63 3.80 3.782 .476
Table 4.2
The percent error was higher than what would be acceptable for our final product. Due to the differences in how each sensor is manufactured, it is necessary to take these differences into account. The easiest way to do this is to strip away any excess equations that are operating on the data that is being input to the
47

microcontroller. Once this is done, we find out which value we can subtract the input reading from to make the value zero. Once we have a value of zero as an input when there are zero volts, we can add back in all of the equations we had taken out previously. This will ensure that the value is as close to the real value as we can make it. Once we did this to our code, our percent error was greatly reduced as shown in the table below (Table 4.3).
Battery Cell Voltage Sensor Voltage Multimeter Voltage % Error1 3.779 3.780 .0262 3.782 3.786 .133 3.782 3.781 .026
Table 4.3
The results from testing were above expectations. The highest error from our voltage sensors was .13%. With this data the team could safely say our voltages sensors were very accurate. Figure 4.4 and 4.5 show the testing of the voltage sensors.
Figure 4.4 Figure 4.5
Current Sensor:
In order to test our current sensor, we needed a device that was able to measure the current passing through our system that we could compare the sensor to. One of the team members had a device on hand that would to just that. Pictured below is a Valhalla Scientific Power Analyzer 2100 (Figure 4.6).
48
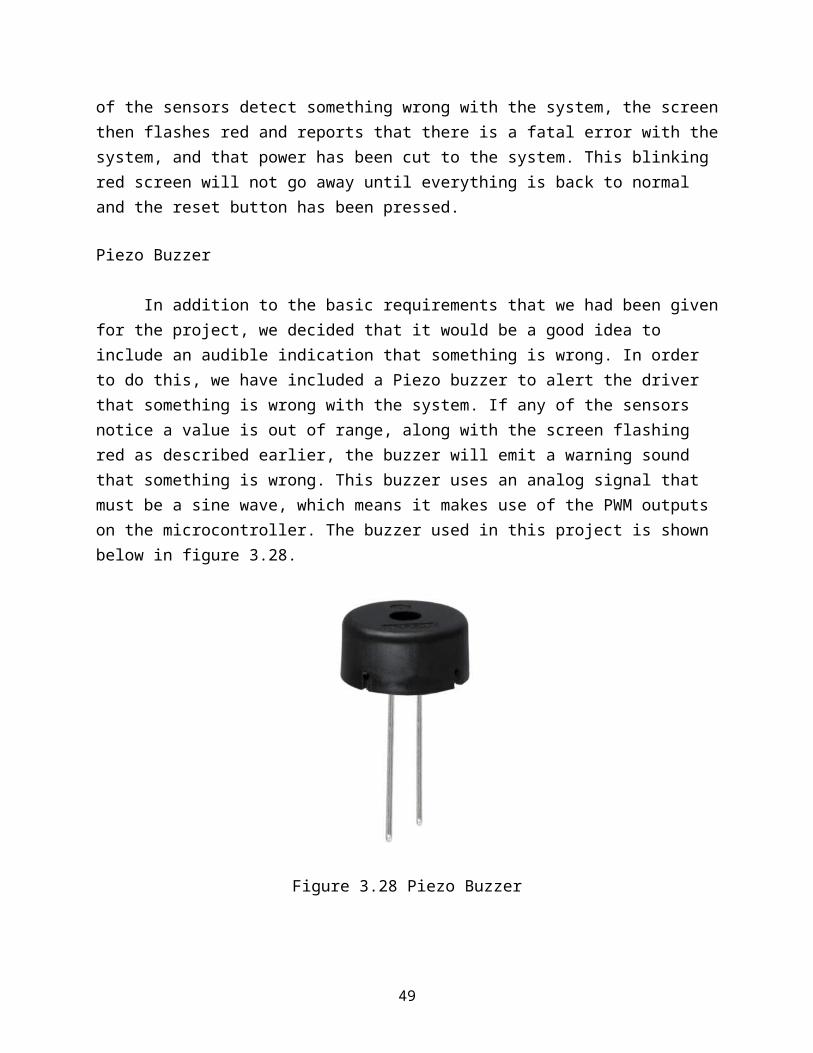
Figure 4.6 Valhalla Scientific Power Analyzer
This device allowed us to hook up our load to the inputs on the back of it, and we were able to measure the power that was passing through it. The system appeared to have some error due to age, and would naturally settle at a value of 3 milliamps. However, if this amount was subtracted from the value that was shown when running the load though it, it was reading the similar values that the current sensor was. The error is due to the limitations of the resolution that our current sensor has. Below is a table of values the power analyzer read compared to our current sensor (Table 4.7).
Input current Power Analyzer Reading
Current Sensor Reading
% Error
0 A 0 A 0 A 0%10 mA 10 mA 10.05 mA .5%50 mA 50 mA 50.12 mA .24%
1 A 1.003 A 1.009 A .598%1.5 A 1.506 A 1.511 A .332%
Table 4.7
Emergency Shut Down Procedure:
To demonstrate system functionality of the battery management system the team built a remote controlled car on a stand. The car will be connected to the batteries of the system and from the control hub the team can monitor the cell charges and the current being drawn by the car. The ways that the system will cut power is if there is too much current drawn by the car from the batteries, if the voltage of the batteries drops too low or goes too high, or if the battery cells get too hot.
Figure 4.8
49

In order to test how our system operates and to ensure that our system will cut the power to the system, the speed of the remote control car will be changed. This will cause the car to draw more current from the batteries, and will therefore be able to test our condition of over current. We have set a value of 2.0 amps for testing purposes to check that the system will cut power.
In order to test the battery voltage dropping too low to cut off the system, we will change the values that the voltage is allowed to drop to, and because as the remote control car lowers the battery voltage when it is running, it will cut the power to the system when this happens.
In order to test the temperature of the batteries being too high, there are a few ways we can test this. We can open the top of the box and touch the sensors to have them read the temperature of our fingertips, and once it senses the temperature is too high, it will cut the power. We could also use a hair dryer, or any other sort of heat source.
In the case of any of these conditions happening, the microcontroller will also flash the screen red with a warning message on it, as well as sound our buzzer to warn the driver that there is a fatal error with the system. The flashing red screen is shown in figure 4.9 below.
Figure 4.9
Battery Balancing System:
The battery balancing system consisted of many components working together. To ensure each part worked properly, testing was completed in steps.
Step one:- Testing of the PCB Board
Test the PCB balancing board. Once the batteries were connected to the board, a power supply was used to trigger the relays. A multimeter was then used to make sure the batteries were draining properly.
50

Step two:- Testing of the Arduino output function
To test the Arduino code and make sure the output function was working, a multimeter was connected to the output pin of the board. The measured voltage was 4.78 volts. This voltage was enough to trigger the relays on the PCB board.
Step three:- Testing of Arduino and PCB board
The Arduino output pins were connected to the reed relays. Testing was done to make sure the Arduino could trigger the relays. This step is where one of our design problems previously discussed was found. Even though prior testing showed the Arduino could output the necessary voltage, it lacked the current to drive the relays.
Step four:- Testing of Arduino, trigger circuit and balancing board
The Arduino output pins were connected to our TIP31A transistors. The Arduino was successfully able to turn on the transistors which then triggered the relays. This completed the hardware testing of the battery balancing system.
Step five:
- Testing of the control switching logic
When connected to the resistive load, the voltage of the battery cell drops. When disconnected, the voltage will jump to up. This effect had to be tested and accounted for in the programing. The table below shows test results regarding voltage drops and jumps.
Battery Voltage in volts Connection on/off Change in volts3.793 Off .0493.744 On3.795 Off .053.745 On3.793 Off .0493.744 On3.792 Off .053.742 On
Table 4.10
51
The average voltage drop was around 50mV. The average time it took for the battery to drop was less than a second. With this information, the switching control logic uses delays to ensure the reading are not corrupted by the initial drops and jumps of the batteries.
Step six:- Testing of battery discharge
To test the average voltage drained from the battery, a cell was connected to the load. Voltage measurements were taken before and after the battery was connected to the resistor. The battery was connected to the load for 10 seconds. After disconnecting from the load, time was given for the voltage to jump back up. Table 4.11 below shows the collected discharge information.
Starting Voltage (v) End Voltage in (v) Voltage Drained (mV)3.7916 3.7901 1.53.7910 3.7900 13.7905 3.7894 1.13.7902 3.7890 1.23.7896 3.7884 1.23.7895 3.7884 1.1
Table 4.11
The average voltage discharge in 10 seconds when the battery was connected to the load is 1.18mV. This data provided us the information for our controller delays and is useful knowledge for the Solar Car team. Step seven:
- Testing of the on/off feature
The on/off feature of the battery system was tested by simply switching the switch. The screen indicates whether the battery balancing system is on and what battery is being drained.
Chapter 5 -
52

Summary
Overall, the project was very successful. The battery management system met all of the requirements. It measured the voltage, current, and temperature of the cells. To protect the system, emergency shutdown protocols are run when appropriate. In addition to the main requirements, the team was able to complete the additional features discussed earlier. The system uses active cooling to keep the batteries at a safe temperature. A visual and audio warning is given to the user when an error occurs. Housing for the LCD screen was 3D printed. The team was also able to develop a battery balancing system.
The team was successful with our goals to improve the system. The system has very accurate sensors. The voltage and current sensors had an error rating of less than .5%, with the temperature sensors only slightly worse. The LCD screen provides a streamlined user interface critical for the driver of the solar car. The mechanical design such as the hinged battery top allows for easy repairs and upgrades. With the use of fusing and switching, the system has improved safety. The two fans located in the battery box provide the BMS with an efficient cooling system. The battery balancing system increases the efficiency of our design and the life of the battery cells.
With this project, the team encountered many problems. From burning wires to non-responsive sensors, every issue provided a learning experience. Not only did we learn from these problems but so did the Solar Car Team. The issues we encountered with this project can now be avoided when developing a large scaled battery management system for the solar car in the future.
Final Product
Lessons Learned:
53

Add connectors to the harness wiring so the components can easily be disconnected and moved around. One of the problems we have with our project is easily moving the items around because the battery box and control hub are always connected by the harness.
Check circuit grounding lines to make sure they all share a common ground. When we were implementing the voltage sensors into the system we did not have a common ground amongst all of the sensors. This resulted in the burning of some of the wires.
When making a PCB make sure wire terminals are added to ensure best possible connection. Soldering large wire to PCB traces will result in the damaging of the trace. For the relay circuit, the original board had 16 gauge wire soldered to the trace on the board. After having problems with it falling off and continuously having to solder the line back on, the trace melted away from the printed circuit making the board unusable. The next one we printed had terminals on it, making it much easier to connect the wires and making the system much more reliable.
Checking solder joints before installing circuits into a system. If the trace is connected to the ground pin along with another wire it will result in a malfunctioning circuit. For our balancing system we checked one of the balancing circuits and it tested fine, but the other two circuits had shorts. We learned this after we installed the board into the system and ended up have to pull it all back out and re-test every trace. This cost the team extra time to test, correct, and assemble the system.
When ordering parts, check to see where they are coming from, and check the calendar for known holidays. This can result in a huge delay in project progress. At the beginning of our assembly stages we ordered voltage sensors that were being shipped from China. At the time we ordered them it fell on a holiday, and it took over a month for the sensors to arrive.
Improvements
One idea that would be very useful to implement if given more time would be to include an app for iPhone or Android that would be able to interface with the microcontroller and a smartphone. This would be especially useful for the crew of the car that cannot see that state of the car other than what the driver can see and relay back to them. The crew would be able to see any issues with the car so that they could preemptively be ready for what the problem is should the system fail. This design improvement would simply require a Bluetooth module that can interact with the Arduino and also has a large enough range to reach the phones in the area.
54

Another idea that we have for an improvement to the system is to use more accurate temperature sensors. As seen in the previous section, the temperature sensors were accurate, but not as accurate as we would have liked them to be. If we had more time, we would have tried to fix this problem by using better quality sensors, but lack of time wouldn’t allow this.
Another area of improvement would be to clean up how the inside of the box looks. Right now there is a lot of loose wiring and it doesn’t look as nice as it could. We also would like to have a single PCB for all of the circuits that we have in the box at this point. The circuit boards we have right now take care of the basic needs we have, but we would like to be able to condense all of the PCBs into one single one to make it look better. Along with the reorganizing of the inside of the box, we would like to be able to re-wire everything and make it look a little more professional. The product works, but it doesn’t look the best, and there are a lot of solder joints that could mess up the system, and would make it hard to find the problem down the road. We would also like to make a better housing for both the batteries and the microcontroller. We did our best with the materials that we have at this point, and due to the limitation of what we could spend, this was the cheapest way we could think of to house the system. It would be better if we had the money to fabricate something more professional looking than wood, but it wasn’t possible at this time.
Lastly, we would have liked to attempt to do an active balancing system instead of a passive balancing, but because of the restriction in time, we wanted to make sure that we fulfilled the basic requirements for the project before we started to do anything extra. We did a lot of research on possible balancing techniques, and there were a few that would have been possible, but we sacrificed that in order to make the performance of the system we currently have as good as we could.
To recreate the exact product, the total budget is listed below.
Component Quantity Cost Shipping TotalArduino Mega 2560 R3 1 $51.91 $3.84 $55.753.2\" TFT LCD Touch Shield for Arduino 1 $31.34 $9.93 $41.27Mediabridge 2.0 USB A Male to B Male Cable 1 $5.49 $0.00 $5.49Voltage Sensor Module -Arduino Compatible 3 $16.74 $5.98 $33.46SainSmart 4-Channel Relay Module 1 $13.50 $0.00 $13.50TMP36 - Temperature Sensor 3 $4.50 $2.68 $7.18Bussmann BP/HHM 30 Amp Mini Fuse Holder w/ Protective Cap 1 $1.98 $2.01 $3.99RELAY AUTOMOTIVE SPST 30A 12V 2 $7.40 $1.92 $9.32
55
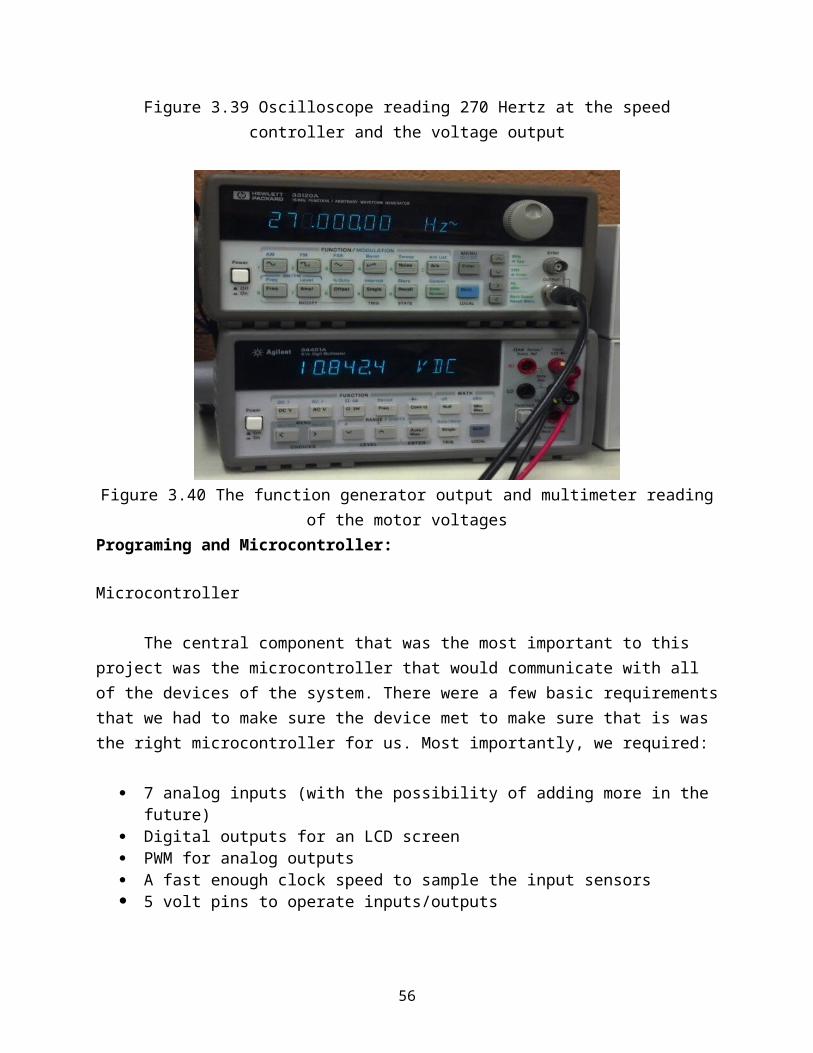
SOCKET RELAY PC MNT FOR VF4 SER 1 $2.26 $0.00 $2.26200mm Male-Female Jumper Wires - 20 Pack 2 $8.98 $6.95 $15.93BUZZER PIEZO 4KHZ 12.2MM PC MNT 1 $0.73 $0.00 $0.73RELAY REED SPST 500MA 5V 3 $3.30 $0.00 $3.3030A range Current Sensor Module ACS712 Module 1 $11.23 $0.00 $11.23RES CHAS MNT 2 OHM 1% 10W 3 $7.86 $1.38 $9.24HD and DECS 1 $22.91 $0.00 $22.91IC REG LDO 9V 2A TO220AB 1 $0.90 $5.66 $6.56Blue Snap Conn16-14 5ML/5FML 1 $3.94 $0.24 $4.18Fans 3 $3.00 $0.00 $9.00Wood 1 $9.00 $0.00 $9.00Heat Shrink (Pack) 1 $60.00 $0.00 $60.00Plexiglass 1 $10.00 $0.00 $10.00TIP31A 4 $2.24 $0.00 $2.24Resistors 8 $0.01 $0.00 $0.08Capacitors 10 $0.04 $0.00 $0.40LM2940 Voltage Regulator 1 $1.65 $0.00 $1.65LM3940 Voltage Regulator 1 $2.09 $0.00 $2.09LM340T12 Voltage Regulator 1 $1.66 $0.00 $1.66Switches 3 $1.74 $0.00 $1.74Diode 1N5819 4 $2.80 $0.00 $2.80DC Barrel Power Jack/Connector 2 $3.00 $0.00 $3.00Sceptre 12 V power supply 2 $20.00 $0.00 $20.00
Total cost with donation $246.30Total cost without donation $369.96
Final Budget:This budget table is everything the team spent on the design for this project. This
includes sensors that were replaced and other parts
Component Quantity CostShippin
g TotalArduino Mega 2560 R3 1 $51.91 $3.84 $55.753.2\" TFT LCD Touch Shield for Arduino 1 $31.34 $9.93 $41.27 Mediabridge 2.0 USB A Male to B Male Cable 1 $5.49 $0.00 $5.49Voltage Sensor Module -Arduino Compatible 3 $16.74 $0.00 $16.74Temperature Sensor-1 -Arduino Compatible 3 $10.74 $5.98 $16.7250A Current Sensor(AC/DC) 1 $14.50 $12.00 $26.50Phidgets Precision Voltage Sensor 1 $18.55 $3.99 $22.54SainSmart 4-Channel Relay Module 1 $13.50 $0.00 $13.50TMP36 - Temperature Sensor 3 $8.10 $2.68 $10.78Bussmann BP/HHM 30 Amp Mini Fuse Holder 1 $1.98 $2.01 $3.99
56

RELAY AUTOMOTIVE SPST 30A 12V 2 $7.40 $0.00 $7.40SOCKET RELAY PC MNT FOR VF4 SER 1 $2.26 $1.92 $4.18200mm Male-Female Jumper Wires - 20 Pack 2 $8.98 $6.95 $15.93BUZZER PIEZO 4KHZ 12.2MM PC MNT 1 $0.73 $0.00 $0.73RELAY REED SPST 500MA 5V 4 $4.40 $0.00 $4.4030A range Current Sensor Module ACS712 Module 1 $11.23 $0.00 $11.23RES CHAS MNT 2 OHM 1% 10W 4 $10.48 $1.38 $11.86HD and DECS 1 $22.91 $0.00 $22.91IC REG LDO 9V 2A TO220AB 2 $1.80 $5.66 $7.46Blue Snap Conn16-14 5ML/5FML 1 $3.94 $0.24 $4.18
Total $303.56
Due to changes in the schedule, the Gantt chart was modified. There were two major factors for the change in Gantt chart. The first factor was the delay in components due to shipping. Some of the sensors that were ordered did not arrive until weeks after they were expected. This delayed the testing and construction of the prototype. The second major delay that was experienced was due to the troubleshooting the team dealt with. Some of the PCBs did not work correctly on the first design and printing which caused some of the PCBs to be redesigned with larger traces and new designs altogether. Other problems the team overcame were the errors with the sensor accuracy and integration into the battery cells. Some sensors did not work as the team expected so a work around was found to compensate.
Final ScheduleTask Name Duration Start Finish Predecessors
Research 15 days Mon 1/13/14 Fri 1/31/14 start 0 days Mon 1/13/14 Mon 1/13/14 Research Problem 6 days Mon 1/13/14 Mon 1/20/14 Research Designs 5 days Tue 1/21/14 Mon 1/27/14 3 Research Components 7 days Tue 1/21/14 Wed 1/29/14 3 Compile Research 2 days Thu 1/30/14 Fri 1/31/14 5 end 0 days Fri 1/31/14 Fri 1/31/14Individual Design 7 days Fri 1/31/14 Mon 2/10/14 1 start 0 days Fri 1/31/14 Fri 1/31/14 Circuit Design 4 days Fri 1/31/14 Wed 2/5/14 Layout Design 4 days Fri 1/31/14 Wed 2/5/14 Programming Map 4 days Fri 1/31/14 Wed 2/5/14 Voltage Balancing Design 4 days Fri 1/31/14 Wed 2/5/14 Prototype(s) Design 3 days Thu 2/6/14 Mon 2/10/14 10,11,12,13
57

end 0 days Mon 2/10/14 Mon 2/10/14Order Parts 21 days Mon 1/13/14 Mon 2/10/14 start 0 days Mon 1/13/14 Mon 1/13/14 end 0 days Mon 2/10/14 Mon 2/10/14Prototype Construction 16 days Mon 2/10/14 Mon 3/3/14 16,8 start 0 days Mon 2/10/14 Mon 2/10/14 Communication Board 4 days Mon 2/10/14 Thu 2/13/14 Voltage Balancing System 16 days Mon 2/10/14 Mon 3/3/14 Mounting Bracket 3 days Mon 2/10/14 Wed 2/12/14 Sensor Layout & Design 2 days Mon 2/10/14 Tue 2/11/14 Wiring 16 days Mon 2/10/14 Mon 3/3/14 Programming 12 days Fri 2/14/14 Mon 3/3/14 21 end 0 days Tue 2/18/14 Tue 2/18/14Prototype Testing 16 days Mon 3/10/14 Mon 3/31/14 19 start 0 days Mon 3/10/14 Mon 3/10/14 Test Over-Current Safety 5 days Mon 3/10/14 Fri 3/14/14 Test Over-Voltage Safety 16 days Mon 3/10/14 Mon 3/31/14 Test Over-Temperature Safety 5 days Mon 3/10/14 Fri 3/14/14 end 0 days Mon 3/3/14 Mon 3/3/14Improvement Iteration 18 days Mon 3/31/14 Wed 4/23/14 28 start 0 days Mon 3/31/14 Mon 3/31/14 Cooling System Design 11 days Mon 3/31/14 Sun 4/13/14 Cooling System Construction 5 days Mon 4/14/14 Fri 4/18/14 36 Cooling System Testing 0 days Wed 4/23/14 Wed 4/23/14 37 Fix Faults in Prototype 18 days Mon 3/31/14 Wed 4/23/14 end 13 days Fri 4/4/14 Wed 4/23/14Presentation Preperation 2 days Wed 4/23/14 Thu 4/24/14 34 start 0 days Wed 4/23/14 Wed 4/23/14 Power Point Presentation 1 day Wed 4/23/14 Wed 4/23/14 Practice 1 day Thu 4/24/14 Thu 4/24/14 43 end 0 days Thu 4/24/14 Thu 4/24/14Gantt Chart Due 0 days Mon 1/27/14 Mon 1/27/141st Prototype Demonstration 0 days Mon 3/17/14 Mon 3/17/14Team Technical Lecture 0 days Mon 3/31/14 Mon 3/31/14Final Report Due 0 days Wed 4/23/14 Wed 4/23/14Design Day 0 days Fri 4/25/14 Fri 4/25/14
Appendix 1
58

Technical Roles
Matt Gilbert-Eyres – The technical role I took on for the project was designing the battery balancing system. My first step was to understand how battery balancing worked and research the different type of methods used today. Once I compiled a list of methods, I assessed each one and figured out which method was the most appropriate for our project regarding time and budget. Next, I used equations to
calculate the resistance and wattage of a resistor required for the balancing system. Once the appropriate components were selected and acquired, I then made a prototype of the system.
This involved a test battery cell pack, resistors, relays and protoboard. The prototype allowed me to gather critical data for the control algorithm regarding voltage drops and jumps along with battery discharge times.
After some troubleshooting, the prototype worked with our system. My next step was to increase the quality and robustness of the product. I accomplished this by creating the circuit on EAGLE and having it printed. After soldering all the components to the PCB, I tested the design. The battery balancing system is fully functional and is used in our final design.
Another technical role I assisted with involved troubleshooting the voltage sensors. Our initial setup of the voltage sensors caused high currents to be drawn from the battery packs. I researched voltage sensor connections and found the solution to our team’s problem. With a few wiring modifications, the voltage sensors worked properly with our battery module.
In addition to trouble shooting the voltage sensors, I was able to assist the team with troubleshooting of the main relay. It was found that the smaller relay used to trigger the main relay had an unknown error. To fix this problem, I designed a circuit using a transistor to allow for the main relay to be triggered on and off from the Arduino. This circuit was then printed and I soldered the components to it.
Gerald Saumier – The technical role that I was given for this project consisted of programming all of the sensors and external devices of the system to interface with the Arduino microcontroller. This role required a lot of research into how to write the code
59

for the sensors, relays, and LCD screen. My first task was to research which microcontroller to use for this particular project. Along with choosing the microcontroller, I aided in the research of which sensors to use due to the system requirements of the microcontroller as to what voltages the particular pins can handle. Once we received the microcontroller and all the external devices including sensors, relays, fans, and an LCD screen, my job was to begin to interface all of these components with each other as well as the other parts of the system.
There were various problems along the way with the wiring and coding of the sensors, but with enough time, I was able to figure out how to program them to put out values that were within a few decimal points of what they should be. This requires a lot of precision due to the minute differences between all of the sensors. This meant a lot of fine tuning to all of the elements of the product once they were up and running.
Once the sensors were giving the correct values, I wrote the code to output them to the LCD screen so that they would update approximately every second, which gives the user a good idea of how the system is operating. Once we knew these values, I could also program the microcontroller to output signals to the other devices such as the relays for the fans as well as the relay for the system power. This required a lot of debugging to make sure that the system shut off and would stay off until the user knows that the problem with the system is fixed.
I was also the person to write the code for the battery balancing once we acquired all of the parts for that particular system. I was able to write code that would only operate in a particular “charging” mode that the system can be in. This way the balancing will only take place when the user is charging the batteries.
Albert Ware - The technical role I took in the project was the system design and layout. Part of this role was figuring out they system components that would be needed to complete the given task, and then how to package it all together to make it presentable. To do the design the battery box and the control hub I used the NX to model the proto-type. From there I made the adjustment need to so I could get the parts made and assemble the final product. Another portion of the design
60

layout I worked on was the system wiring. This involves sizing the wire gauge for each component in the system to ensure we did not over tasking a wire and cause a fire. This was done using various North American automotive wiring specs. Once I had all of the wire sizing done, I fabricated harnesses for them to be routed from the battery box the battery management control hub. These harnesses were bundles using heat shrink which provides them with an extra layer of heat and damage protection.
Another role I took on was the design of the circuit for the relay power disconnect system. Part of this role was figuring out the type of components need to be incorporated in to the circuit to ensure the function and protecting of the relay when it is being trigger on or off by the system. Once I had an Ideal and a design I used Eagle to design the relay board. In order to trigger my relay board from our system we had to come up with a lower powered trigger method, this in which I was assisted with by other teammates.
I also design the remote control car load that we are using to drain power from our battery management system. This task involved fix a gear box, wiring up a speed controller, and figuring out how to control the speed controller without a radio receive. What I ended up figuring out was in order to control the speed controller a sinusoidal waveform must be inputted to the signal terminal and from that the speed could be adjusted by the change in frequency.
Like many of the other group members I assisted other team members various issues that popped up during the duration of this project.
Auez Ryskhanov – The technical role that I played on this project was developing a system that was responsible for proper operation of the sensors. First, I had to understand how the sensors work. Because of the fact that our project required three different types of the sensors, I had to make sure that I could be able to work with all of them. For example, the battery pack that we have used in our design was producing around 15V. Therefore, I had to find and order the voltage sensors that could sense that amount of voltage and be more accurate as possible. Moreover, because of the fact
61

that our team used Arduino microcontroller, all sensors had to be Arduino compatible. The other thing that I had to learn about the sensors is how to properly install them in battery pack. In order to do that I just had to read the description of the sensors and understand the pins functions.
Another thing that I was responsible for in our team is designing circuits that could regulate the voltage that was coming out from the wall wart power supply and make a printed circuit boards. For our project the Arduino microcontroller needed 5V power supply. Therefore, I had to design a circuit that could transfer 12V from wall wart into 5V as an input for our microcontroller. This circuit helped us to protect our Arduino board from burning. Moreover, I also had to design a circuit that could trigger the relays and turn on the emergency cooling system. The relays required 9v for triggering, therefore; I had to come up with a circuit that could convert 12V from wall wart into 9V. When I have designed the circuits, I had to send them to the ECE Shop for printing. In addition, I was responsible for printing most of the circuits that our team used for the design.
In addition, I played a small role in designing a battery pack box and a display holder box. Particularly, I had to cut cover from Plexiglas in Mechanical Engineering Shop. Also, during the whole semester I helped my team to write the reports
Mike Burch- My role in the team was document preparer. This included creating templates for every report that the team made and templates for presentations. This allowed each team member to create portions of the report and I would compile them all to make a coherent document. I also was in charge of creating the poster template and design. The templates allowed the team to quickly write reports and focus more on the construction and testing of the prototype. Since meeting the deadline was important, the more time we
62

could save the better. I researched components and concepts the team needed in the beginning. I studied the lithium-ion batteries used in the project so we could determine the operating features and safety points of the batteries.
Next I created the FAST diagrams to understand the functions of our project, and the Gantt chart which created a schedule that the team could follow so we would work on the most pertinent aspects of the design project. I was also in charge of keeping track of the cost of parts and compiling a budget of expenditures for the preliminary budget.
Next I helped trouble shooting problems that we ran into. An example would be the sensors not working correctly and the voltage regulator. I helped Matt and Gerald with the sensors and Auez and Albert with the power supply voltage regulators. With the help of Auez, I generated a PCB to trigger the relay that would supply power to the load. The relay protected the circuit from damage. The PCB needed to handle higher current than the Arduino Mega was capable of creating. The PCB was created in Eagle and was sent to the ECE shop to be built. There are four PCBs that are similar to the one that was designed by myself and Matt in the project currently.
Appendix 2References of all data
http://www.egr.msu.edu/classes/ece480/capstone/spring14/group07/ - Team Website
http://www.lapptannehill.com/suppliers/spec/prestolite/PSA-212006r1_PrimaryWire.pdf
http://www.assemblymag.com/articles/87885-wire-processing-auto-industry-goes-metric
https://www.eol.ucar.edu/rtf/facilities/isff/LOCAL_access_only/Wire_Size.htm
63

http://www.all-spec.com/products/290-038.html?gclid=CKnloOj_8L0CFbQWMgodNwkAfA
http://en.wikipedia.org/wiki/American_wire_gauge - Wiring Information
http://elithion.com/lithiumate_pro.php - Lithiumate Pro
http://www.linearnews.com/press/LTC6804-20/LTC6804-20.html - Linear Technology
http://arduino.cc/en/Main/arduinoBoardMega2560 -Arduino Board Link
http://www.sainsmart.com/4-channel-5v-relay-module-for-pic-arm-avr-dsp-arduino-msp430-ttl-logic.html - Relay Board Link
http://4.bp.blogspot.com/-kE48JDdmKYI/TgClaSDgHdI/AAAAAAAAACI/ZKcYmT528QI/s1600/cpu+fan.jpg – 12v Fan Picture
http://media.digikey.com/photos/Murata%20Photos/PKM13EPYH4002-B0.jpg - Piezo Buzzer Picture
http://www.robotshop.com/en/3-2-tft-lcd-touch-shield-arduino.html - Screen Link
http://www.weiku.com/products/18823352/LG_18650_3000mAh_Li_ion_Battery_Cell_3_7V_ICR18650D1.html - Battery picture
http://www.arduino.cc/ - Arduino Site for Information
http://whatis.techtarget.com/definition/sensor - Sensor information
http://windows.microsoft.com/en-us/windows7/what-is-a-sensor - Sensor information
http://www.em.avnetasia.com/Products/DesignSolutionShow.aspx?pagesId=27&MasterPageId=17&ID=149 – Battery Managments Sysytem
http://www.robotshop.com/en/dfrobot-50a-current-sensor-ac-dc.html - Current Sesnsor
http://www.batteryspace.com/batteryknowledge.aspx#8 – Battery information
http://www.mpoweruk.com/life.htm - Battery information
http://www.lapptannehill.com/suppliers/spec/prestolite/PSA-212006r1_PrimaryWire.pdf - wiring information
http://www.assemblymag.com/articles/87885-wire-processing-auto-industry-goes-metric - wiring information
64
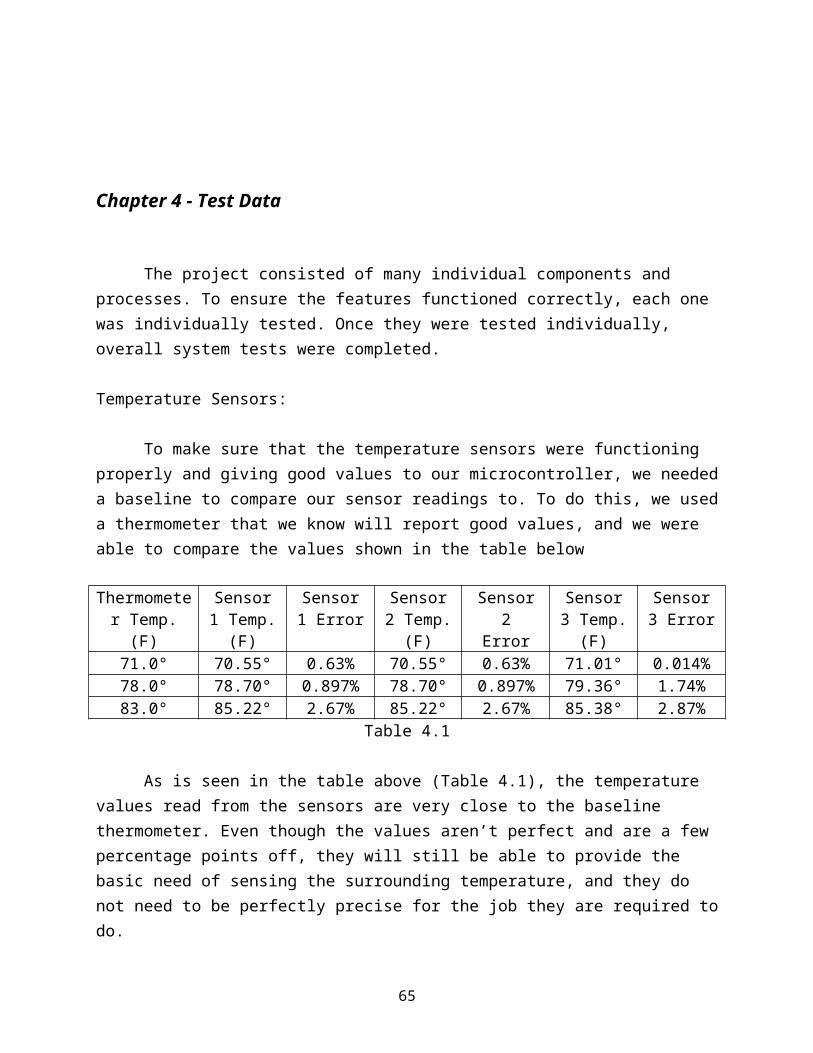
https://www.eol.ucar.edu/rtf/facilities/isff/LOCAL_access_only/Wire_Size.htm - wiring information
http://en.wikipedia.org/wiki/American_wire_gauge - wiring information http://www.all-spec.com/products/290-038.html?gclid=CKnloOj_8L0CFbQWMgodNwkAfA - wiring information
http://electronics.howstuffworks.com/relay1.htm -relay system information http://www.digikey.com/ - relay system information
http://en.wikipedia.org/wiki/Relay - relay system information
http://www.biopatent.com/ - relay system information
http://www.roboteq.com/ - relay system information
http://www.instructables.com/id/How-Electronic-Switches-Work-For-Noobs-Relays-and/step5/How-a-Does-a-Transistor-Work/ - relay system information
http://www.egr.msu.edu/~wierzba/index_Page422.htm - images and power supply circuit
Appendix 3Battery Management System Layout
65

Figure A3.1House of quality:
Figure A3.2PCB Schematics:
66

Figure A3.3: Trigger for Balancing Circuit
Figure A3.4: Layout of the Trigger for Balancing Circuit
67

Figure A3.5: Power Supply Circuit
Figure A3.6: Power Supply Circuit Layout
68
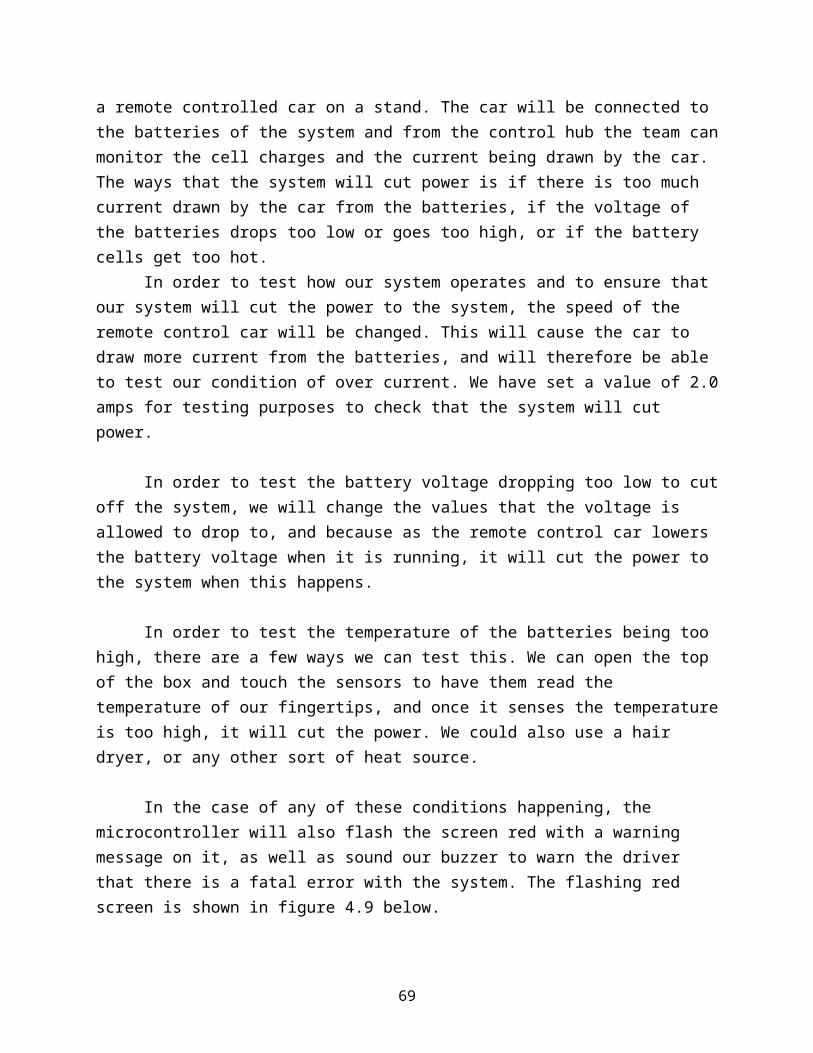
Figure A3.7: Circuit for triggering the main relay
Figure A3.8: Layout of the circuit for triggering the main relay
69
Arduino Code
#include <UTFT.h>extern uint8_t SmallFont[];extern uint8_t BigFont[];UTFT myGLCD(ITDB32S,38,39,40,41);
//TMP36 Pin Variablesint sensorPin0 = 0; //Temperature Sensor 1 Pinint sensorPin1 = 1; //Temperature Sensor 2 Pinint sensorPin2 = 2; //Temperature Sensor 3 Pinint relayPin1 = 8; //IN1 connected to digital pin 8int relayPin2 = 9; //IN2 connected to digital pin 9int relayPin3 = 10; //IN3 connected to digital pin 10int relayPin4 = 11; //IN4 connected to digital pin 11int buzzerPin = 7; //Buzzer Output Pinint currentPin = 6; //Current Sensor Pinint balancePin1 = 10; //Balancing Relay Pin 1int balancePin2 = 12; //Balancing Relay Pin 2int balancePin3 = 13; //Balancing Relay Pin 3float volt1;float volt2;float volt3; float totalVolt;float current = 0.0;float criticalTemp = 95.0;float firstTemp = 75.0;float offTemp = 72.0;float maxVoltage = 4.2;float minVoltage = 3.3;float maxCurrent = 2.0;float minCurrent = 0.00;boolean systemFault= false;boolean proceed = true;int onResistor;bool chargingMode = false;int reading, reading2, reading3, tempreading, tempreading2, tempreading3;float temperatureF0, temperatureF1, temperatureF2;
void setup(){ Serial.begin(9600); //Start the serial connection with the computer //to view the result open the serial monitor // Setup the LCD myGLCD.InitLCD();
70

myGLCD.setFont(SmallFont); pinMode(relayPin1, OUTPUT); // sets the digital pin as output pinMode(relayPin2, OUTPUT); // sets the digital pin as output pinMode(relayPin3, OUTPUT); // sets the digital pin as output pinMode(relayPin4, OUTPUT); // sets the digital pin as output pinMode(buzzerPin, OUTPUT); pinMode(balancePin1, OUTPUT); pinMode(balancePin2, OUTPUT); pinMode(balancePin3, OUTPUT); digitalWrite(relayPin1, HIGH); // Prevents relays from starting up engaged digitalWrite(relayPin2, HIGH); // Prevents relays from starting up engaged digitalWrite(relayPin3, HIGH); // Prevents relays from starting up engaged digitalWrite(relayPin4, HIGH); // Prevents relays from starting up engaged pinMode(balancePin1, LOW); pinMode(balancePin2, LOW); pinMode(balancePin3, LOW); } void loop() // run over and over again{ digitalWrite(relayPin2, HIGH); myGLCD.clrScr(); for(;;) { digitalWrite(balancePin1, HIGH); float average2 = 0; float average3 = 0; float average4 = 0; tempreading = 0; tempreading2 = 0; tempreading3 = 0; for(int i = 0; i < 100; i++) { average2 = average2 + ((analogRead(3)/4.055)/10)/100; average3 = average3 + ((analogRead(4)/4.031)/10)/100; average4 = average4 + ((analogRead(5)/3.980)/10)/100; reading = analogRead(sensorPin0); reading2 = analogRead(sensorPin1); reading3 = analogRead(sensorPin2); float voltage0 = reading * 5.15; voltage0 /= 1024.0; float voltage1 = reading2 *5.15; voltage1 /= 1024.0; float voltage2 = reading3 *5.28;
71
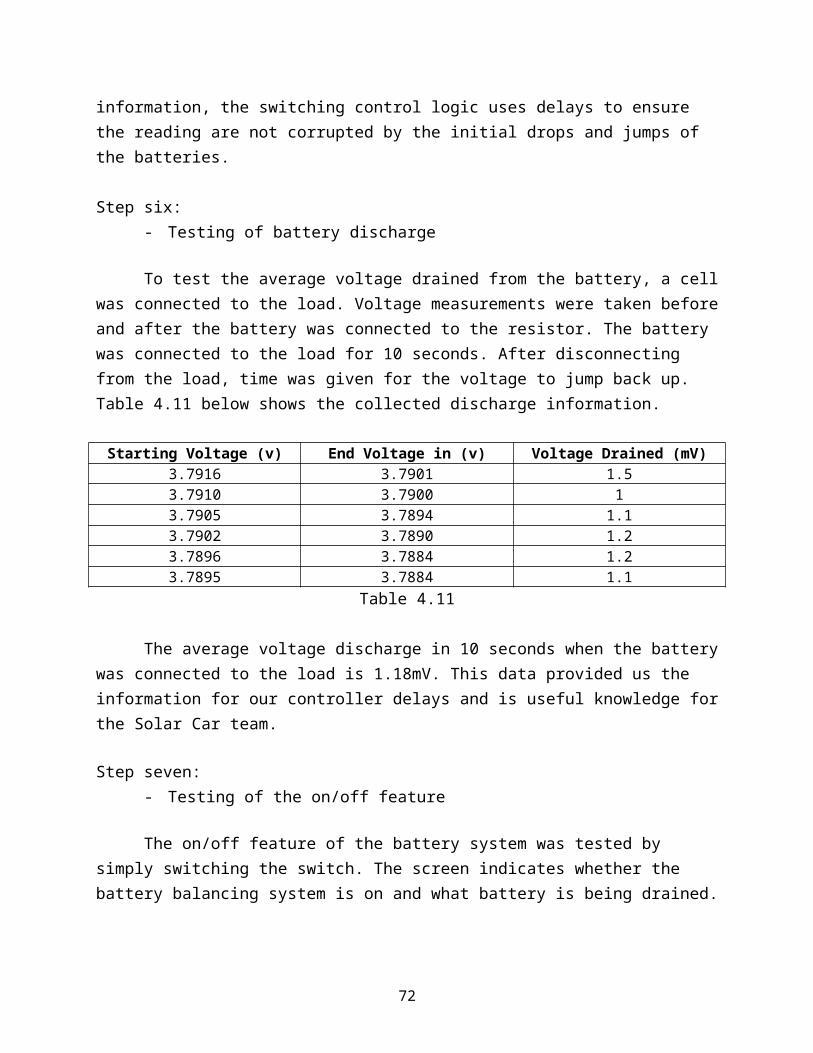
voltage2 /= 1024.0; // now print out the temperature float temperatureC0 = (voltage0 - 0.5) * 100 ; float temperatureC1 = (voltage1 - 0.5) * 100 ; float temperatureC2 = (voltage2 - 0.5) * 100 ; // now convert to Fahrenheit temperatureF0 = (temperatureC0 * 9.0 / 5.0) + 32.0; temperatureF1 = (temperatureC1 * 9.0 / 5.0) + 32.0; temperatureF2 = (temperatureC2 * 9.0 / 5.0) + 32.0; } float v1 = average2-average3; float v2 = average3-average4; float v3 = average4; if(temperatureF1 < offTemp & temperatureF2 < offTemp & temperatureF0 < offTemp) { digitalWrite(relayPin4, HIGH); // energizes the relay and lights the LED digitalWrite(relayPin1, HIGH); // energizes the relay and lights the LED } else if(temperatureF1 > firstTemp | temperatureF2 > firstTemp | temperatureF0 > firstTemp) { digitalWrite(relayPin4, LOW); // de-energizes the relay and LED is off digitalWrite(relayPin1, LOW); // de-energizes the relay and LED is off } float average = 0; for(int i = 0; i < 100; i++) { average = average + ((506.2-analogRead(currentPin))*75.76/1023)/100; } if(analogRead(7) > 100) { chargingMode = true; } else { chargingMode = false; } if(chargingMode) { if(v1 > v2 & v1 > v3)
72

{ digitalWrite(balancePin1, HIGH); digitalWrite(balancePin2, LOW); digitalWrite(balancePin3, LOW); onResistor = 1; myGLCD.setFont(SmallFont); myGLCD.fillRect(0, 226, 319, 239); myGLCD.setColor(255, 255, 255); myGLCD.print("Voltage Sensor 1: ", LEFT, 43); myGLCD.printNumF(v1, 3, 175, 44); myGLCD.print("Voltage Sensor 2: ", LEFT, 57); myGLCD.printNumF(v2, 3, 175, 58); myGLCD.print("Voltage Sensor 3: ", LEFT, 71); myGLCD.printNumF(v3, 3, 175, 72); myGLCD.setFont(BigFont); myGLCD.print("Battery ", CENTER, 130); myGLCD.printNumI(onResistor, 220, 130); myGLCD.print(" Resistor ON", CENTER, 150); myGLCD.setFont(SmallFont); delay(10000); myGLCD.clrScr(); } else if(v2 > v1 & v2 > v3) { digitalWrite(balancePin1, LOW); digitalWrite(balancePin2, HIGH); digitalWrite(balancePin3, LOW); onResistor = 2; myGLCD.setFont(SmallFont); myGLCD.fillRect(0, 226, 319, 239); myGLCD.setColor(255, 255, 255); myGLCD.print("Voltage Sensor 1: ", LEFT, 43); myGLCD.printNumF(v1, 3, 175, 44); myGLCD.print("Voltage Sensor 2: ", LEFT, 57); myGLCD.printNumF(v2, 3, 175, 58); myGLCD.print("Voltage Sensor 3: ", LEFT, 71); myGLCD.printNumF(v3, 3, 175, 72); myGLCD.setFont(BigFont); myGLCD.print("Battery ", CENTER, 130); myGLCD.printNumI(onResistor, 220, 130); myGLCD.print(" Resistor ON", CENTER, 150); myGLCD.setFont(SmallFont); delay(10000); myGLCD.clrScr(); }
73

else if(v3 > v2 & v3 > v1) { digitalWrite(balancePin1, LOW); digitalWrite(balancePin2, LOW); digitalWrite(balancePin3, HIGH); onResistor = 3; myGLCD.setFont(SmallFont); myGLCD.fillRect(0, 226, 319, 239); myGLCD.setColor(255, 255, 255); myGLCD.print("Voltage Sensor 1: ", LEFT, 43); myGLCD.printNumF(v1, 3, 175, 44); myGLCD.print("Voltage Sensor 2: ", LEFT, 57); myGLCD.printNumF(v2, 3, 175, 58); myGLCD.print("Voltage Sensor 3: ", LEFT, 71); myGLCD.printNumF(v3, 3, 175, 72); myGLCD.setFont(BigFont); myGLCD.print("Battery ", CENTER, 130); myGLCD.printNumI(onResistor, 220, 130); myGLCD.print(" Resistor ON", CENTER, 150); myGLCD.setFont(SmallFont); delay(10000); myGLCD.clrScr(); } } totalVolt = v1 + v2 + average4; if(temperatureF0 > criticalTemp) { systemFault = true; } if(temperatureF1 > criticalTemp) { systemFault = true; } if(temperatureF2 > criticalTemp) { systemFault = true; } if(v1 > maxVoltage) { systemFault = true; } if(v2 > maxVoltage) { systemFault = true; }
74

if(average4 > maxVoltage) { systemFault = true; } if(v1 < minVoltage) { systemFault = true; } if(v2 < minVoltage) { systemFault = true; } if(average4 < minVoltage) { systemFault = true; } if(average > maxCurrent) { systemFault = true; } Serial.println(temperatureF0); Serial.println(temperatureF1); Serial.println(temperatureF2);
if(systemFault) { for(;;) { digitalWrite(relayPin2, LOW); // de-energizes the relay and LED is on tone(7, 4000, 1000); myGLCD.clrScr(); myGLCD.fillScr(VGA_RED); myGLCD.setFont(BigFont); myGLCD.print("SYSTEM FAILURE!!!", CENTER, 100); myGLCD.print("TURN OFF SYSTEM!!!", CENTER, 120); } }
myGLCD.setFont(SmallFont); myGLCD.fillRect(0, 226, 319, 239); myGLCD.setColor(255, 255, 255); myGLCD.print("Temperature Sensor 1: ", LEFT, 1); myGLCD.printNumF(temperatureF0, 2, 175, 2); myGLCD.print("Temperature Sensor 2: ", LEFT, 15); myGLCD.printNumF(temperatureF1, 2, 175, 16);
75
myGLCD.print("Temperature Sensor 3: ", LEFT, 29); myGLCD.printNumF(temperatureF2, 2, 175, 30); myGLCD.print("Voltage Sensor 1: ", LEFT, 43); myGLCD.printNumF(v1, 3, 175, 44); myGLCD.print("Voltage Sensor 2: ", LEFT, 57); myGLCD.printNumF(v2, 3, 175, 58); myGLCD.print("Voltage Sensor 3: ", LEFT, 71); myGLCD.printNumF(v3, 3, 175, 72); myGLCD.print("System Voltage: ", LEFT, 85); myGLCD.printNumF(totalVolt, 2, 175, 86); myGLCD.print("System Current: ", LEFT, 99); myGLCD.printNumF(average, 2, 175, 100); }
NX design
Figure A3.9 Battery Box Design
Figure A3.10 Battery Management Control Hub
76