Embed Size (px)
Citation preview

36
Internet Sites The Internet sites for each of the Utilities also proved helpful in communications
with customers. In an effort to keep customers updated, each utility’s web site included
information from its press releases issued before, during, and after the Ice Storm.
In response to inquires from the Public Staff and the Commission in connection
with this investigation, Duke reported that its web site recorded 1,267 inquiries related to
the Ice Storm, of which “approximately 69% were general in nature, 19% were
compliments, and the remaining 12% were complaints and claims.”7
Progress Energy reported that its Customer Service Center received 368 e-mails
related to the December 2002 Ice Storm, 27 of which were complaints, 100 were
compliments, one was a claim, 11 related to tree trimming, and 229 related to outages
(reporting, requesting information, and the like).8
Dominion advised the Public Staff and the Commission that it provided updates
to the public by means of an outage map on its web site. Dominion received several
complimentary e-mails and does not recall receiving any complaints or restoration
inquiries.
VII. Restoration Costs
The costs of restoring power following the Ice Storm were substantial for Duke
and Progress Energy, totaling approximately $87 million and approximately $39 million,
7 Response of February 3, 2003 by Duke Power to Public Staff – NCUC data request, Question
No. 40. 8 E-mail from B. Mitchell Williams, Progress Energy Carolinas, dated March 17, 2003.

37
respectively. The total restoration cost to Dominion was approximately $2.4 million.
These costs are summarized in Table 2.
Table 2: Costs of the Ice Storm
Dominion
Duke
Progress
Materials
$58,662
$5,400,000
$4,208,439
Company Labor
$1,018,694
$17,700,000
$8,291,911
Outside Labor
$634,965
$56,500,000
$19,994,908
Transportation
$187,164
$700,000
$491,039
Other
$537,819
$6,900,000
$6,013,703
Total
$2,437,304
$87,200,000
$39,000,000
Some storm related costs are expensed on the Utilities’ books of account in the period
when they are incurred, and others are capitalized and depreciated over the life of the
plant. For extraordinary, non-capital costs of the magnitude incurred by Duke and
Progress Energy in connection with the December 2002 Ice Storm, a utility may request
that the Commission authorize deferral accounting. This allows the utility to amortize
such costs over a specified period, typically three years from when the costs are
incurred, instead of expensing all of the costs in the current period. If a utility seeks a
rate increase during the amortization period, the storm related costs will generally be
included in the utility’s cost of service in setting rates, a portion in test year expenses

38
and the unamortized balance in rate base. Under N.C. Session Law 2002-4, House Bill
1078, the Clean Smokestacks legislation, the base rates of Duke and Progress Energy
are frozen through December 31, 2007. The Commission is authorized, however, to
allow adjustments to base rates or cost deferrals during the rate freeze period for
“[m]ajor expenditures to restore or replace property damaged or destroyed by force
majeure.” G.S. 62-133.6(e). Both Duke and Progress Energy stated publicly that they
would not seek to recover the costs of the December 2002 Ice Storm through increased
rates, and neither has requested deferral accounting for these costs. (Deferral
accounting would not permit recovery through increased rates, since the expenses
would be fully amortized by the time the rate freeze ends.) Thus, all of the Utilities have
recovered their Ice Storm costs through current rates.
VIII. Comparison with Other Major Storms
To place the Ice Storm in some perspective, the Utilities Commission and the
Public Staff compiled data regarding several major storms that affected the Utilities in
the past. However, this list of storms is not exhaustive, and the geographic areas
impacted by particular storms and the characteristics of the storms themselves may
vary greatly from one utility to the next, as well as within a utility’s service territory. In
the discussions below, the number of “customers impacted,” for Duke and Progress
Energy, represents the maximum number of customers (i.e., electric service accounts)
out of service at any one time during a storm. For Dominion, it represents the total
number of customers (defined as unique metered service points) interrupted for more
than two minutes at any time during the storm. All storm numbers are system-wide
numbers, not North Carolina-specific.

39
Duke
Prior to December 2002, the storms that had the greatest impact on Duke’s
service area were Hurricane Hugo in 1989, the 1996 Ice Storm, and Hurricane Fran in
1996.
As Table 3 indicates, the December 2002 Ice Storm had a much greater impact
on Duke’s customers than the other three storms. The number of customers who lost
power in this storm was more than twice the number impacted by the 1996 Ice Storm
and three times the number affected by Hurricane Fran. However, the time it took Duke
to restore service to all customers after the most recent storm was comparable to the
1996 storms and half that of Hurricane Hugo. Additionally, the average number of
customers restored per day for the December 2002 Ice Storm far exceeds the same
measure for the other three storms.

40
Table 3: Duke Historical System-Wide Storm Data
Event
Customers Impacted
Restoration Personnel
Outage Duration in Days
Average Rate of
Restoration (Customers
per Day)
Costs
in 2002 Dollars
(Millions)
1989
Hurricane Hugo
696,000
Duke Not Available Non-Duke
2500
18
38,667
94
1996
Ice Storm
650,000
Not
Available
8
81,250
16
1996
Hurricane Fran
450,000
Duke Not Available Non-Duke
996
9
50,000
17
2002 Ice Storm
1,375,000
Duke 3660 Non-Duke
5087
9
152,777
87
Progress Energy
Prior to December 2002, Progress Energy had experienced greater damage than
the other utilities as a result of major storms. Information relating to these storms is
shown on Table 4.
In 1996, Hurricane Fran (a Category 3 hurricane with winds of 115 mph, affecting
Progress Energy’s Raleigh area as well as its Eastern Region) left 790,000 Progress
Energy customers, including 98% of its Eastern Region, without power for as much as

41
ten days. In 1999 Hurricane Floyd, another Category 3 hurricane, left much of eastern
North Carolina under water and 537,000 Progress Energy customers without power for
up to six days.
During the December 2002 Ice Storm, Progress Energy restored power to
customers at an average rate of 70,083 customers per day, compared to 34,620
customers per day following the 2000 Snowstorm and 15,250 customers per day
following the 1996 Ice Storm. Thus, Progress Energy’s average number of customers
restored per day has improved for similar types of storms.
Table 4: Progress Energy Historical System-Wide Storm Data
Event
Customers Impacted
Restoration Personnel
Outage
Duration in Days
Average Rate of Restoration
(Customers per Day)
Costs
in 2002 Dollars
(Millions)
1996
Ice Storm
61,000
1130
4
15,250
7
1996
Hurricane Fran
790,000
8250
10
79,000
115
1999
Hurricane Floyd
537,000
6300
6
89,500
70
2000
Snowstorm
173,100
2265
5
34,620
28
2002
Ice Storm
560,660
3947
8
70,083
39
42
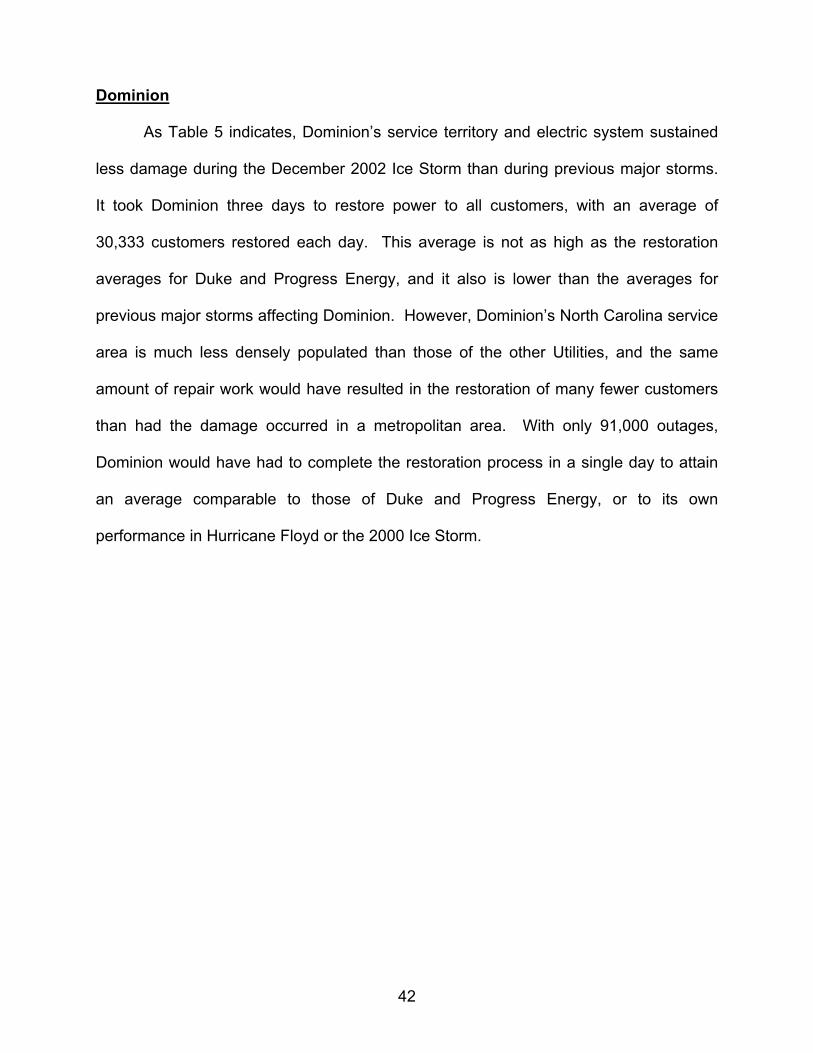
Dominion
As Table 5 indicates, Dominion’s service territory and electric system sustained
less damage during the December 2002 Ice Storm than during previous major storms.
It took Dominion three days to restore power to all customers, with an average of
30,333 customers restored each day. This average is not as high as the restoration
averages for Duke and Progress Energy, and it also is lower than the averages for
previous major storms affecting Dominion. However, Dominion’s North Carolina service
area is much less densely populated than those of the other Utilities, and the same
amount of repair work would have resulted in the restoration of many fewer customers
than had the damage occurred in a metropolitan area. With only 91,000 outages,
Dominion would have had to complete the restoration process in a single day to attain
an average comparable to those of Duke and Progress Energy, or to its own
performance in Hurricane Floyd or the 2000 Ice Storm.

43
Table 5: Dominion Historical System-Wide Storm Data
Event
Customers Impacted
Outage
Duration in Days
Average Rate of Restoration
(Customers per Day)
Costs
in 2002 Dollars
(Millions)
1996
Hurricane Fran
415,000
6
69,167
14
1998
Ice Storm
401,000
10
40,100
16
1999
Hurricane Floyd
800,000
5
160,000
18
2000
Ice Storm
285,000
3
95,000
6
2002
Ice Storm
91,000
3
30,333
3
Based on the above data, the Utilities Commission and Public Staff find no
discernible increase in outage duration following a major storm. In fact, the data show
that restoration rates for Duke and Progress Energy were significantly higher for the
December 2002 Ice Storm than for the 1996 Ice Storm. Duke restored an average of
152,777 customers per day after the 2002 storm compared to 81,250 customers per
day after the 1996 storm, while Progress Energy restored an average of 70,083
customers per day after the 2002 storm compared to 15,250 customers per day after
the 1996 storm. Overall, the variations in the number of customers with service

44
interruptions and the average restoration times associated with the storms suggest that
the impact on service depends on the type and severity of the storm, as well as the
location of the storm relative to customer density and system infrastructure. Many
factors affect a utility’s storm response. Localized heavy damage in a densely
populated area may be repaired more quickly than similar damage in a rural area, and
one circuit in an urban area may serve hundreds of customers, while one circuit in a
rural area may serve as few as two customers. Thus, while comparative outage
durations and service restoration averages are informative, they should not be used
uncritically.
IX. Preparedness for the Storm
The Utilities maintain comprehensive response plans to provide for pre-event
preparation and an organizational shift to a structure and operational mode designed to
respond safely to major outages when they occur.9 When a storm threatens to impact a
utility’s service territory significantly, the utility undertakes measures to prepare for post-
storm restoration efforts. Such efforts include the strategic positioning of materials and
coordinating with suppliers to ensure timely availability of potential additional material
needs; securing line and tree contractor commitments; discussing with neighboring
utilities the availability of mutual aid assistance; placing company crews on standby; and
advising the public of the potential for extended storm-related power outages. Each
utility’s storm response plan provides a reasonable organizational structure, general
guidelines, and a safety-conscious approach that accommodates the flexibility needed
to address such events.
9 Progress Energy Distribution Storm Plan; Duke Power Region Emergency Manual; and Dominion Electric Distribution Response Plan.
45
Forecasting and Tracking
The Utilities receive daily reports from local meteorologists or contracted weather
forecasting services. Typically they begin assessing potential risks to their electric
systems and the magnitude of electric service interruptions several days prior to an
expected weather event.10 Progress Energy has contracted with Weather Services
International (“WSI”) for weather-forecasting services. WSI provides very detailed
forecasts on all aspects of weather that may specifically impact each company’s service
territory, such as temperature, speed of the weather system, and time that localized
impacts might begin occurring in various parts of a company’s service area. Duke and
Dominion utilize in-house meteorological services to obtain similar weather-related
information.
Duke’s meteorologists began monitoring weather forecasts the weekend prior to
the December 2002 Ice Storm, and at 5:50 p.m. on December 1 they issued their first
special weather statement noting a potential for significant icing. From then through the
end of the storm, they issued updated forecasts discussing the amount of ice
accumulation expected and the probable number of customer outages. Duke’s
meteorologists consulted with National Weather Service (“NWS”) personnel and local
media weather forecasters to confirm their predictions. Progress Energy received
updates from WSI several times a day and also monitored weather forecasts on local
television stations. Progress Energy confirmed that WSI’s forecasts were in line with
the forecasts of other utilities in the region and local media outlets. Dominion’s
meteorology staff began monitoring the storm on December 3, relying primarily on their
own analysis and NWS postings, and supplementing these with reports from WSI,
10 Tornadoes, which are localized weather events, often do not provide early warning signs and are an exception to this rule.

46
AccuWeather, and the Weather Channel, as well as anecdotal information from
neighboring utilities.
Pre-positioning
As the magnitude of the impending storm became more apparent, the Utilities
implemented internal communication plans to notify company personnel of the severe
weather forecast and to pre-position line crews in expected high impact areas in
anticipation of widespread electric outages. The Utilities checked critical inventory
levels and communicated with suppliers as early as December 2, to ensure that
adequate materials were available, including transformers, poles, insulators, fuses, and
electrical wire. On December 3, vehicles were fueled and stocked with materials so that
restoration efforts could begin as soon as crews could work safely.
On December 3, Duke employee and contractor “travel teams,” consisting of
construction crews, tree and line contractors, and support personnel, were identified
and instructed to report to work prepared to travel on December 4. The predicted
amount of ice accumulation in Progress Energy’s service area was within the range that
the company normally expects to be able to handle with its own resources. As
previously noted, Progress Energy moved 350 employees and contract personnel to the
central part of the state on December 4.
As members of the Southeastern Electric Exchange (the “SEE”), the Utilities
participate in a mutual aid agreement to assist other SEE members with service
restorations when there is severe system damage due to adverse weather events or
other natural disasters. On December 4, the Utilities participated in a 2 p.m. conference
call among SEE members, and during this call Duke and Progress Energy requested
outside crews to assist with their restoration efforts. Because a relatively smaller

47
portion of its service territory was expected to be affected by the storm, Dominion
believed it could handle its restoration effort itself utilizing internal service crews, along
with contractor tree crews that normally assist Dominion in its North Carolina and
Virginia service territories.
Public Information
During the pre-storm preparation period, the Utilities provided information to local
television, radio, and newspaper media. This information typically took the form of
press releases containing information on the approaching storm and issues related
thereto, including potential storm impact to utility facilities, the utility’s mobilization of
manpower and equipment in advance of the storm, electrical and health safety tips, how
to report a power outage, and an alert for customers with medical concerns or in-home
medical equipment regarding the need to make alternative arrangements due to the
possibility of power outages. Duke also hosted the media at its Emergency Operating
Facility and other sites to deliver this message.
Contact with Customers with Special Needs
Each of the Utilities maintains a list of customers who are handicapped or have
serious medical conditions that could make power outages especially hazardous to
them. In the past, when adding customers’ names to these lists, Duke and Progress
Energy have alerted them of the need to take special precautions for their safety in the
event of a major storm. Duke and Progress Energy did not call customers on these lists
prior to the December 2002 Ice Storm, but did make an effort to provide them with
relevant information, such as the location of shelters, if they called the company during
the service restoration period. Dominion, on the other hand, did contact customers with

48
medical conditions prior to the Ice Storm to notify them that there was a possibility of
lengthy power outages.
After the Ice Storm, both Duke and Progress Energy adopted a policy of making
calls to customers on the medical needs list shortly after a major storm and informing
these customers of the location of nearby shelters, telephone numbers where help can
be obtained, the importance of making appropriate outage plans, the progress of
service restoration efforts, and other information relevant to the customer’s situation.
Progress Energy’s policy provides for these calls to be made within 24 to 48 hours after
the storm stops. Progress Energy has expressed a strong preference for contacting
customers after the storm when more accurate information about the impact of the
storm is available. These new policies were in effect during an ice storm that affected
North Carolina at the end of February 2003.
The Commission and Public Staff commend the Utilities for increasing their
assistance to customers with medical needs. As storms approach, the Utilities should
contact medical alert customers at the earliest time the impact and extent of a major
storm become known to the Utilities and encourage them to make alternative shelter
arrangements. The Utilities should continue to evaluate each storm on its merits, seek
customer feedback, and determine the most effective means of contacting medical alert
customers.
X. Questions Raised: Condition of Systems
Infrastructure
Questions were raised at the Public Meetings as to whether the Utilities’
distribution systems are properly designed and adequately maintained to withstand
storms such as the December 2002 Ice Storm.

49
In addressing this question, it will be helpful to begin with a general discussion of
the electric transmission and distribution network. The electric power infrastructure is a
complex and highly technical system. Its components must be compatible with the
environment and must operate in normal and abnormal weather conditions. The system
must be sufficiently hardened to absorb damage in severe storms and return to service
without excessive delay; at the same time, it must not be so costly that customers’ rates
become burdensome. In addition, the system must be maintained as equipment ages,
breaks down, and is impacted by growth of trees near overhead power lines.
Transmission lines are the high-voltage lines that deliver electricity from
generating facilities to the distribution system. They can be analogized to interstate
highways, while distribution lines are comparable to local roads and city streets. Since
transmission line outages impact massive numbers of customers, utilities are quite
aggressive in the maintenance of transmission ROWs, and they regularly cut down or
trim trees that could fall into transmission lines even if the trees are located outside the
ROW. In addition, transmission lines are located above the height of most trees. For
these reasons, transmission lines are generally not damaged by ice storms; they are
vulnerable, however, to damage from the high winds caused by hurricanes and
tornadoes.
The distribution system connects to the transmission system at substations,
which serve as starting points to route power lines in different directions. Transformers
at a substation reduce transmission voltages to distribution level voltages. The
substation is equipped with protective devices and switches that allow it to be
disconnected completely from the transmission grid or to disconnect individual
distribution lines when needed. Typical distribution line voltages are approximately 7.2
50
kilovolts (“kV”), 12 kV, or 23 kV. The distribution system includes main lines that run
through neighborhoods and “tap” lines that take power from these main lines down side
streets and roads. Once the wires reach a customer’s house, another transformer
reduces the voltage to 120/240 volts, which provides the customer with the 240 volts
necessary for operating large appliances and the 120 volts required for lighting and
electrical outlets.
The distribution system is the most weather-vulnerable portion of the electric
system, primarily because trees are much closer to the power lines comprising the
distribution system. The December 2002 Ice Storm was primarily a distribution system
event; there was little or no damage to transmission facilities.
The National Electrical Safety Code classifies North Carolina as a medium ice
load district.11 In districts within this category, the Utilities must design conductors and
poles to withstand ¼ inch of ice loading.12 As a result, accumulations of ¼ inch of ice or
less should not cause significant outages. While the Utilities use this standard as a
minimum design criterion, their distribution systems are actually constructed to
withstand significantly greater ice buildup, as the December 2002 Ice Storm
demonstrated. Lines that were not impacted by falling trees and limbs generally
continued to function even in areas that experienced ¾ to 1 inch of ice accumulation.
Typically, the vast majority of outages associated with ¼ inch or less of ice
accumulation are widely scattered and are usually caused by evergreen tree limbs and
leaning evergreen trees. Once ice accumulation reaches the ½ inch level, the number
of outages climbs rapidly due to breaking limbs and trees. Ice accumulation of ¾ to 1
11 Institute of Electrical and Electronics Engineers, National Electrical Safety Code, 2002 Edition. 12 Id.

51
inch or more causes much more structural damage to trees, including breaking tree
limbs and damage to hardwood treetops. Trees growing outside of trimmed ROWs fall
onto lines. Ice accumulations of one inch or more are also likely to cause some
insulated service drops to detach from weak building attachments and some long spans
of distribution conductors to break.13
Statements by participants at the Public Meetings indicated that some small
areas may have experienced damage and subsequent power outages due to the failure
of a weakened pole or cross arm during the Ice Storm, and others may have chronic
service problems for other reasons that were exacerbated by the storm. However, the
Utilities Commission and the Public Staff find no reason to believe that significant
outages during the storm were attributable to either the age or the design of the Utilities’
electric distribution systems or to pre-existing conditions on the systems.
The System Average Interruption Duration Index (“SAIDI”), a nationally
recognized electric system reliability index, is the best overall measure of the condition
of a utility’s distribution system. It represents the average number of minutes per year
that a customer was out of power, excluding major storms, during a given year. A
SAIDI can be converted to a system reliability percentage using the following formula:
1.00 minus SAIDI/number of minutes per year, times 100 percent. According to data
provided annually to the Public Staff, the North Carolina system reliability for all three of
the Utilities consistently exceeds 99.9%. These data indicate that the Utilities’ electric
distribution systems are not improperly designed or inadequately maintained.
13 Response of January 15, 2003 by Progress Energy Carolinas to Public Staff – NCUC data
request, Question No. 28.

52
Tree-Trimming Practices
A number of participants at the Public Meetings suggested that the Utilities’ tree-
trimming and ROW maintenance practices contributed to the outages that resulted from
the Ice Storm.
Effective tree-trimming and ROW maintenance programs are the most cost-
effective methods to prevent widespread power outages caused by all natural disasters,
including ice storms. All of the Utilities have established tree-trimming policies and have
increased ROW tree-trimming budgets in recent years to reduce the number of tree-
related outages.
ROW clearing and tree-trimming practices vary depending on whether the line in
question is a distribution line or transmission line. The standard tree-trimming width for
the typical distribution voltages utilized by the Utilities is 30 feet, 15 feet on either side of
the distribution centerline. The 15 feet on either side actually amounts to a minimum of
11 feet of clearance from the outermost conductor of the distribution line to the trees.
Limitations to the standard 30-foot tree-trimming width have been imposed by a number
of municipalities, as discussed below. All the Utilities trim trees within 15 feet of either
side of their distribution lines, except that in some circumstances Dominion trims to
achieve ten feet of clearance.
Transmission ROWs are generally maintained more aggressively by the Utilities
than distribution ROWs, because a failure of these lines will impact more customers.
The transmission programs typically integrate tree pruning, cutting danger trees (trees
outside the ROW that are in danger of falling onto the lines, including dead, dying,
diseased or leaning trees), ROW mowing, and herbicides to control vegetation.

53
Helicopters are also employed on a regular basis to fly over the transmission lines to
identify danger trees or other potential problems.
Progress Energy generally trims trees outside of urban and metro areas on a
four-year cycle. Tree trimming in major urban and metro areas is performed on a two-
year cycle as municipal or other restrictions contribute to the need for more frequent
trimming. In 1996, Progress Energy implemented a significant change to its tree-
trimming policy by utilizing mechanized tree-trimming equipment in rural areas, which
increased both productivity and safety by reducing the need to climb many trees.
Duke’s ROW maintenance cycles vary depending on the lines and location.
Rather than using a fixed trimming cycle, Duke monitors reliability reports to determine
the tree-trimming schedule that will have the greatest impact on increasing reliability,
and some ROWs are maintained on a more frequent basis than others. In 2000, Duke
undertook a major initiative to reduce the number of tree-related system outages. Duke
is also working with its contractors to use mechanized equipment and herbicides to
maintain its ROWs more efficiently and effectively.
Dominion trims trees on a three-year cycle, with supplemental hot spot trimming
performed as needed in small areas where trees are causing outages. Dominion has a
limited number of lower voltage distribution circuits that use a 20-foot ROW (ten feet on
either side of the distribution centerline) because lower voltage circuits typically can
effectively operate with a narrower ROW. In addition to routine scheduled trimming,
Dominion has initiated a ground to sky trimming policy within the ROW on selected main
distribution lines to enhance reliability by removing tree canopy that could fall in ice
storms.
54
Limitations to the 30-foot tree-trimming width of standard utility ROWs have been
imposed on Progress Energy by various municipalities in its service area and on Duke
by one municipality. Progress Energy has reported to the Public Staff that “restrictions
in our right of way pruning width did have a negative impact on the number and severity
of certain outages in the recent ice storm.”14 Duke and Progress report that some
municipalities have only general ordinances with no specific trimming limitations, while
others are very specific and limiting. For example, the city of Durham has placed
limitations on Duke’s tree-trimming clearances, requiring that trees not be trimmed more
than five feet from the side of the outside conductor, five feet under the conductor, or
eight feet above the conductor. However, Duke reports that Durham has been working
with the company since the Ice Storm to relieve some of the restrictions placed on Duke
by the city’s tree-trimming limitations.
Duke and Progress Energy report that some municipalities have been fairly
lenient in enforcing their ordinances and have recognized that there must be some
tradeoff between aesthetics and reliability. However, others have been much more
aggressive in interpreting and enforcing tree-trimming practices.
Dominion has no limitations placed on its ability to trim trees in its ROWs.
The Ice Storm outage data supplied by the Utilities reveal that the municipalities
with the most restrictive tree-trimming ordinances (Charlotte, Durham, Chapel Hill, and
Raleigh) were among the hardest hit areas in terms of damage and customer outages.
It is clear that there is a direct correlation between the proximity of overhanging tree
limbs and distribution line damage during an ice storm. Thus all municipalities should
14 Response of January 15, 2003 by Progress Energy Carolinas to Public Staff – NCUC data
request, Question No. 4.

55
reexamine their tree-trimming ordinances, in consultation with utility providers, to make
sure that the need to protect trees and foliage is properly balanced against the need for
citizens to receive reliable electricity. This reexamination should focus on the
municipalities’ ordinances and the interpretation as well as enforcement of those
ordinances.
A recurring issue at the Public Meetings was whether any of the Utilities were too
lax in keeping trees trimmed on transmission and distribution ROWs. The transmission
systems were not the cause of system outages following the Ice Storm. Trees that fell
from outside the Utilities’ ROWs, as well as trees that the Utilities were restricted from
cutting within their ROWs, caused a majority of the damage to distribution systems and
resulting power outages. Generally, prior to the Ice Storm, the Utilities had trimmed the
ROWs on their distribution and transmission systems to the extent allowed by their
ROW agreements and the limits set by various municipalities.
System reliability is the best evidence of whether a utility is properly maintaining
its ROWs. As previously stated, the data show that the Utilities’ system reliability
exceeded 99.9% in 2002. These data do not indicate that the Utilities were lax in their
ROW maintenance prior to the December 2002 Ice Storm. However, the Utilities
Commission and the Public Staff recommend that the Utilities give further attention to
ROW maintenance enhancements to determine whether changes can be made to
improve system reliability.
Undergrounding
Questions were raised at the Public Meetings as to whether electrical facilities
should be placed underground as a means to avoid widespread outages during major
storms. Reasonable answers to these questions require a studied comparison of costs

56
to benefits. The Public Staff is currently investigating that issue in detail and will release
a separate report later this year.
Use of Alternate Feeds
One method used to reduce the duration of outages caused by electric line
failures is to provide for alternate feeds, which are sometimes referred to as
interconnections, loop feeds, dual feeds or back-up feeds. These alternate feeds or
interconnections are accomplished by building circuits that have a loop-type
construction with an open point. Each side of the loop is energized from a source line
and ends at the open point. In the event of a failure in one side of the loop, the electric
failure point can be isolated and the open point connected to provide electric power to
the points on the loop between the failure point and the normal open point. This system
of interconnection is normally most beneficial in concentrated areas of electric load
where there are multiple source lines delivering electricity from different directions. It is
generally more expensive to construct interconnections or alternate feed distribution
electric lines (either overhead or underground) than the more traditional single-feed
distribution line, also known as a radial feed.
Some individuals suggested at the Public Meetings that the Utilities could reduce
the number of outages in ice storms by increasing the use of alternate feeds. However,
in a major storm or other natural disaster, the benefits of alternate feeds are greatly
limited simply because both feeds and line sources are subjected to the same types of
damage. In the areas hardest hit by the December 2002 Ice Storm, almost all the
Utilities’ distribution lines were damaged. An alternate feed provides no benefit if both
the primary power source and the alternate source have been damaged by falling trees
57
and are out of service. For this reason, the Utilities Commission and the Public Staff do
not recommend wider use of alternate feeds as a means of reducing ice storm outages.
Distributed Generation
One of the participants in the Public Meetings suggested that the Utilities could
reduce the severity of outages due to storms by making greater use of distributed
generation. Distributed generation is the use of small-scale generating facilities located
close to the places where power is consumed, rather than large centrally located
generating facilities. Distributed generation could reduce storm-related outages when a
generating facility is built on the site of a large customer (e.g., an industrial plant) that
uses the power as it is generated. However, when distributed generation is used to
serve small users such as residential customers, distribution lines are still needed to
deliver the power from the generating facility to the customers, and those lines are
vulnerable to storm damage. Consequently, the reduction in weather-related outages
that can be obtained from the use of distributed generation is limited. In addition,
extended outages on the utility system may result in distributed generation being
operated outside its design capabilities, resulting in outages of these facilities, additional
maintenance, or early replacement of the distributed generation.
XI. Questions Raised: Management of Outage
Assignment of Restoration Crews
During and after the Ice Storm, many customers expressed concern as to
whether Duke had shown favoritism to certain areas of its service territory with regard to
assignment of repair crews. Customers expressed specific concern as to whether
Durham and Chapel Hill received unfavorable treatment during Duke’s restoration

58
efforts. The Utilities Commission and the Public Staff requested detailed information
from Duke to investigate these allegations.
In response to the data requests, Duke provided the number of customer
outages and the number of repair workers by city for each day throughout the
December 5-13 storm restoration period. This information is shown in Table 6, along
with the ratio of customer outages to repair personnel in each city for each day of the
restoration period.

59

60
In Durham (Northern Region), the ratio of 790 on December 5, the first day of
storm restoration, was 41% higher than the 560 ratio for Gastonia (Central Region),
which was the next highest ratio for a large city on that day. This situation is explained,
at least in part, by the fact that the Ice Storm began in Duke’s Southern Region on
December 4 and did not fully impact the Northern Region until late in the day on
December 5. Thus, Duke’s restoration crews began working in its Southern Region
sooner than in the Central and Northern Regions. Until service had been restored in the
Southern Region, the crews working in that area could not be moved to other locations.
By December 6, the ratio for Durham dropped to 251, which was lower than
those of four other cities in North Carolina. During the remainder of the restoration
period, Durham was never the city with the highest ratio of outages to repair personnel
and the Durham ratio remained close to those for other cities in Duke’s Central and
Northern Regions.
In Chapel Hill (Northern Region), the ratio of 359 on December 5 was below
those of eleven other large cities in North Carolina. Throughout the restoration period,
the Chapel Hill ratio remained in line with those for other cities in Duke’s Central and
Northern Regions, exceeding the ratio for all other cities in North Carolina only on
December 11.
With the exception of December 5, the first full day of storm restoration work, the
ratios for Durham and Chapel Hill were at or below the ratio for Charlotte, the largest
city in Duke’s service territory, and very close to those of other cities in Duke’s Central
and Northern Regions. These cities had some of the highest percentages of total
customers without power on Duke’s entire system – 93% in Durham, 95% in Chapel

61
Hill, and 94% in Burlington – and Duke had not anticipated that such a large percentage
of customers would lose power anywhere in its service area.
As discussed in detail in Section IX, Preparedness for the Storm, Duke undertook
measures to prepare for post-storm restoration efforts. With the widespread outages
across Duke’s entire service territory, decisions about the number of repair crews to
place in each area and when to move them were difficult at best. After review of the
information provided by Duke, the Utilities Commission and the Public Staff have
concluded that Duke acted reasonably and impartially in assigning repair crews during
the restoration period.
Restoration Priorities
Questions were raised at the Public Meetings as to whether the Utilities’
restoration priorities were appropriate, particularly where customers with special needs
are concerned.
Restoration work logically begins at the foundation of each circuit, which is its
distribution substation, and then proceeds sequentially towards the end of the circuit.
Thus, in general, primary feeders are repaired first, then sub-feeders, tap lines, and
finally individual services. Figure 8, the diagram on the next page, entitled “The Steps
to Restoring Power,” illustrates this process. The North Carolina Association of Electric
Cooperatives created this diagram for its members, and it gives a good explanation of
how power is restored, not just by the Cooperatives, but also by all electric utilities in
North Carolina.

62

63
While the general procedure shown in the diagram is common to all utilities, each
company establishes its own specific priorities for service restoration. The Utilities give
restoration priority to:
• Public safety-related situations (downed power lines, 911 emergency calls
involving power lines or equipment, accidents involving power lines or
poles, etc.);
• Emergency services (hospitals, shelters, fire and rescue facilities, police
stations, etc.); and
• Critical infrastructure (water and sewer facilities and other services
needed for the welfare of the general public, including major traffic and
thoroughfare traffic signals).
Beyond this group, priority is determined by an attempt to restore service to the
largest number of customers in the shortest period of time, as illustrated in Figure 8.
The Utilities maintain lists of special needs customers, and they make every effort to
accommodate such customers when possible; however, these lists were created to
prevent the disconnection of service for non-payment, not for priority restoration of
service. During a widespread outage, it is impossible to focus individually on restoring
power to each of the thousands of special needs customers spread throughout each
company’s system and also to maintain the policy of systematic service restoration,
which impacts the greatest number of customers first. Given this reality, it is
recommended (as more fully discussed in Section IX above) that the Utilities
communicate with customers with special needs, or the caretakers of these customers,
and make sure that they understand the imperative need for alternate arrangements in
the event of major storms.

64
Hours Worked by Restoration Crews
At the Public Meetings, questions were raised as to the number of hours worked
by restoration crews. There was a widespread perception that while Progress Energy’s
crews worked 16-hour days, Duke inappropriately limited its crews to 12-hour days.
The Public Staff’s investigation indicates that both Duke and Progress Energy
worked their crews approximately the same number of hours per day. Duke’s line repair
employees and off-system workers worked 15- to 16-hour schedules, including travel,
briefings, and meal times. Crews typically spent between 12 and 14 hours per day
actually restoring service, beginning at approximately 7 a.m. and continuing until after
nightfall. These working hours were consistent with the work practices prescribed in
Duke’s “Region Emergency Manual” for use during service restoration for a regional
outage. Similarly, Progress Energy’s crews began the workday with breakfast at the
staging center between 6 and 7 a.m. and left the staging center several hours after
sunset, in some cases as late as 11:15 p.m. The Commission and the Public Staff
conclude that the perceived differences in workday length between Duke and Progress
Energy were based on mistaken impressions. There are no established industry
standards governing the workday length for power restoration crews; but given the
expected length of the restoration period and the very cold weather, on the one hand,
and the need for rapid restoration of electric service on the other, a workday of 15 to 16
hours appears reasonable.
Effect of Company Layoffs and Closure of Local Offices
Questions were raised at the Public Meetings as to whether some of the delays
in service restoration might be attributable to recent layoffs of line maintenance and
tree-trimming employees by the Utilities, or to the recent closure of a number of the

65
Utilities’ local offices. Both Duke and Progress Energy have slightly reduced the total
number of contractor and company distribution line repair employees from 1998 to
2002. These employees include line technicians, meter technicians, field service
representatives and distribution service technicians. Notwithstanding these slight
workforce reductions, both Duke and Progress Energy have been able to improve
productivity and maintain service restoration capabilities through the use of outage-
management systems, work and design management systems, and specialized
equipment such as on-board laptop computers and state-of-the-art bucket trucks. Thus,
the Utilities Commission and the Public Staff find no reason to believe that Progress
Energy or Duke delayed the restoration work because of reductions in their workforces.
As for the local offices that have recently been closed by the Utilities, these offices were
operated primarily for bill payment and customer service purposes, rather than for line
maintenance and tree trimming. Consequently, the decision to close some local offices
almost certainly did not have any significant adverse impact on service restoration.
Restoration Estimates
During and after the Ice Storm, several persons questioned the accuracy and
timeliness of information provided by the Utilities concerning their restoration efforts.
The issue of estimated restoration times given to customers was an area of intense
interest, a common complaint being that the Utilities gave overly optimistic estimates as
to when a customer’s power would be restored.
The Utilities have remotely monitored terminals in place at substations
throughout their systems, which automatically report interruption data back to a central
computer. The computers use this input, in concert with customer calls, to analyze
problems in the distribution system and predict the probable location of problems and

66
the number of customers affected. This information is not only valuable in pinpointing
the location and likely causes of outages, but can also be useful in communicating with
customers. However, these systems are less useful in determining estimated
restoration times following a major storm and resulting widespread damage.
As the December 2002 Ice Storm advanced during the first several hours, the
Utilities advised customers that outages would likely last multiple days, and that
estimates would be available after the extent of damage was determined. It was the
policy of each utility to give estimated restoration times to customers, but not during the
first few days of the Ice Storm while damage assessments were still being made. The
extensive damage associated with this storm made it difficult for the Utilities to provide
accurate restoration estimates during the first few days following the storm.
By December 6, the second full day of restoration, the Utilities had a good
estimate of the damage to their facilities, and they were able to begin giving out
estimates for restoration times within communities via their customer call centers. The
majority of these estimates appear to have been accurate. However, there were still
situations where the main circuits were repaired and pockets of customers remained in
the dark because of damage below the main circuit level. In a storm of this magnitude,
because of the many variables involved in restoring electrical service, it is very difficult
to give restoration times, and it is not practical to provide individual customers more
detailed information about the restoration of their individual service line than the Utilities
currently provide.
Another public criticism was that the Utilities gave customer callbacks that
indicated that power had been restored, when in fact it had not. Based on a review of
the scripts used by the customer service automated callback systems at all three

67
utilities, the Public Staff has found that each system calls the customer back (using a
recorded message) and asks whether or not the power has been restored. The
customer is then asked to indicate whether or not this is accurate by pressing the
appropriate number. For example, Duke’s recorded message was, “This is Duke
Power. Based on work completed in your area, we believe power has been restored to
your location. If you are using a touch-tone phone and power has been restored,
please press 1. If power has not been restored, please press 2 . . . .”15 Duke indicated
it believes that the portion of this message that said, “[W]e believe power had been
restored,” could have led to some customer confusion, and has, therefore, changed the
callback script to “Duke Power crews have been working in your area. We are calling to
determine if power has been restored to your location. If your power is on, press 1. If
your power has not been restored, press 2.”16
A related issue discussed at the Public Meetings was whether any of the Utilities
were at fault with respect to the accuracy of their restoration information when pockets
of customers without service existed within more general areas where power had been
restored. The Utilities can remedy this problem, as they did in the Ice Storm, by having
the recorded callback message reference their work in the general outage area, with a
statement that power is expected to return within a certain period of time. The message
should ask the customer to call the utility if power has not returned in that period of time.
Another issue was whether the Utilities should provide customers with maps
showing where service is expected to be restored each day. Since the restoration of
service due to storm damage is a fluid and dynamic operation, maps given out in
15 Response of January 15, 2003 by Duke Power to Public Staff – NCUC data request, Question
No. 7. 16 Id.

68
morning briefings can be soon rendered inaccurate due to unforeseen circumstances in
restoring damaged facilities. The information provided to customers would be viewed
as a promise by many of those customers who received it, as opposed to the hopeful,
best guess of the utility made sometime the prior evening. This would result in
dissatisfaction if the estimated restoration times shown on the maps could not in fact be
achieved. Moreover, customers whose areas were not shown to be in a particular day’s
restoration plan might well complain because of their area’s exclusion. The maps would
also be very difficult for the Utilities to monitor and maintain, thus consuming large
amounts of valuable manpower. For all these reasons, the Utilities Commission and the
Public Staff believe that the use of service restoration maps, as proposed at the Public
Meetings, would not be practical. Dominion, however, does provide its customers with
a service territory map on its web site that identifies broad geographic areas with
service outages, but not restoration information.
Secondary Damage
Several customers have complained to the Utilities Commission and the Public
Staff about damage to their homes and personal property resulting from excessive
electric voltage following the restoration of service by the Utilities. Often during service
outages caused by adverse weather, power lines are struck by falling trees or tree
limbs, and on occasion one of the three electrical wires that supply electrical service to
a customer may be broken. If the wire that is broken happens to be the neutral wire,
electric voltage will still be provided to the customer’s meter; however, the voltage can
vary greatly from the designed 120/240 volts on the typical residential service. This
condition is generally referred to as an “open neutral” condition. In a secondary line (the
line that leads from the transformer serving a customer to the customer’s premises), the
69
neutral wire is largely concealed by the energized wires that wrap around it, and breaks
in the neutral wire are difficult to observe. In the other lines that compose the
distribution system (“primary lines”), the neutral wire is separated from the energized
wires, and open neutral conditions can be detected more easily.
The circuit protection device (panel box and circuit breakers) installed in most
customer premises will not detect or protect against an open neutral condition. The
most common problem that occurs with an open neutral condition arises when a 120-
volt electrical circuit has a stray voltage that can go up to approximately 170 volts. A
voltage above the designed 120 volts for the circuit can cause damage to electrical
equipment connected to the circuit with an open neutral. In the most severe case, a fire
could result. Damage resulting from an open neutral condition may occur either at the
time the neutral wire breaks or at the time power is restored after an outage. The higher
the voltage above 120 volts on the open neutral circuit, the greater is the possibility that
damage will result to electrical equipment connected to the circuit.
The Utilities contend that they cannot devote the time and manpower necessary
during a major storm restoration to check the voltage at each customer’s meter and
ensure that an open neutral condition does not exist, as doing so would significantly
extend the restoration period. Although the Utilities’ service regulations protect them
from liability for damages that are caused by an “act of God,” all the Utilities have stated
that if the open neutral is caused by negligence on the company’s part, they will assume
responsibility for the resulting damages.17
There is no device currently available on the market that consumers can install to
detect and protect against open neutral conditions. When open neutral conditions
17 The Utilities also point out that open neutrals are rare. In Duke’s case, less than 0.02% of the customers affected by the Ice Storm suffered damage caused by open neutral conditions.
70
occur, appliance and equipment damage almost always results, and fires occasionally
start. Although the likelihood that an open neutral condition will occur is relatively low,
the severity of the potential damage and the danger of fires merit the Utilities’ efforts to
detect and eliminate the problem of an open neutral whenever possible. In particular,
the Commission and Public Staff recommend that the Utilities inspect primary lines for
open neutral conditions as a part of the restoration process. The Commission and the
Public Staff will continue to study this issue with the Utilities.
XII. Recommendations and Implemented Changes
This section of the report summarizes the recommendations of the Commission
and Public Staff for changes in practice with respect to ice storms and other major
storms. It also summarizes the changes in practice that the Utilities have already
implemented as a result of the December 2002 Ice Storm.
Recommendations for Change: Utilities
1. As discussed on page 26 of this report, the Commission and Public Staff
recommend that Duke take whatever steps are necessary to ensure that elected
officials in all areas of its service territory have direct access to information regarding
storm preparedness and restoration.
2. As discussed on page 30, in planning for future storms, the Utilities should
make every effort to ensure that the number of telephone lines available to customers at
their outage-reporting numbers – as well as internal system parameters such as
maximum queue size – is sufficient to meet the demands imposed by a major storm.
The number of customers is steadily increasing, and the Utilities cannot appropriately
assume that the December 2002 Ice Storm is the worst storm they will ever face; thus,

71
even a telephone system adequate to meet the requirements of the December 2002 Ice
Storm may not be sufficient for future planning purposes.
3. As discussed on pages 48 and 63, the Utilities should continue their policy
of providing increased assistance to customers with medical needs. As storms
approach, the Utilities should contact medical alert customers, or their caretakers, at the
earliest time the impact and extent of a major storm become known to the Utilities and
encourage them to make alternative shelter arrangements. The Utilities should
continue to evaluate each storm on its merits, seek customer feedback, and determine
the most effective means of contacting medical alert customers.
4. As discussed on page 55, the Utilities should give further attention to right-
of-way maintenance enhancements to determine whether changes can be made to
improve system reliability.
5. As discussed on page 70, the Utilities should make an effort to detect and
eliminate open neutral conditions whenever practicable during the power restoration
process. In particular, the Utilities should inspect primary lines for open neutral
conditions as power is restored.
Recommendation for Change: Municipalities
Although the Commission and Public Staff have no jurisdiction over
municipalities, they nevertheless recommend, as discussed on pages 54-55 of this
report, that all municipalities reexamine their tree-trimming ordinances, in consultation
with utility providers, to make sure that the need to protect trees and foliage is properly
balanced against the need for citizens to receive reliable electricity. This reexamination
should focus on the municipalities’ ordinances and the interpretation as well as
enforcement of those ordinances.

72
Changes Implemented by the Utilities
The Utilities have made an intensive effort to identify lessons learned from the
December 2002 Ice Storm and have already implemented numerous changes in their
storm response procedures. Some of these changes were implemented while recovery
from the Ice Storm was still in progress, while others have been put in place in the
months since the storm. Unless otherwise indicated, the Commission and Public Staff
endorse these changes and recommend that they continue in effect.
1. As discussed on page 26 of this report, the Utilities have made plans to
designate specific employees to serve as liaisons with particular counties and
emergency operations centers in future storms.
2. As discussed on page 26, Duke is developing a new outage database,
which will enable it to determine the number of outages and the number of customer
calls received by county, city, and ZIP code. Duke also plans to communicate with key
emergency personnel before the winter and summer storm seasons, and it intends to
work with county officials to identify critical facilities that are remote from substations or
main feeder lines and thus are especially vulnerable to lengthy outages.
3. As discussed on page 27, Progress Energy has made plans to enhance
its media communications in adverse weather periods by positioning media
spokespersons in affected areas, proactively generating news updates on the
restoration process, and adding local radio outlets and towers to its restoration priority
lists.
4. As discussed on page 29, Duke increased the Maximum Queue Size
parameter for the Voice Response Unit (VRU) at its outage-reporting number from 255

73
to 2048 during the Ice Storm, so that callers would not be directed back into the VRU
while waiting to talk to a live operator.
5. As discussed on page 31, Progress Energy has enhanced the VRU at its
outage-reporting number so as to provide the following information to callers: (1) areas
most impacted by the storm; (2) a schedule for providing restoration estimates, even
while damage assessment is under way; (3) number of customer outages and number
of repair crews working in the field; (4) areas for which no restoration estimates are
available; (5) an option for customers with meter damage requiring an inspection before
system connection can occur; and (6) a full Spanish outage-reporting menu.
6. As discussed on page 31, Progress Energy plans to distribute glow-in-the-
dark magnets with outage-reporting numbers.
7. As discussed on page 33, during the Ice Storm Duke added messages to
its VRU for Spanish-speaking customers; established a unique toll-free number for
these customers, thus enabling them to hear the same storm informational messages
that English-speaking customers heard; promoted the new toll-free number on radio
stations targeted to Spanish-speaking customers; used Duke employee volunteers who
speak Spanish to staff the line after regular Spanish-speaking specialists completed
their 12-hour shifts; and utilized two Spanish-speaking Duke employees to provide
translations, information, and interviews to major Latino news outlets.
8. As discussed on pages 33-34, Duke has requested PR Newswire to
translate its storm restoration news releases into Spanish and distribute them to
Spanish-language media outlets. In addition, Duke is designing and building a fully
automated Spanish Outage Reporting application, enabling Spanish-speaking
customers to report their outages through a special toll-free number.

74
9. As discussed on pages 34-35, Progress Energy has made enhancements
to its automated outage reporting system, enabling Spanish-speaking customers to
have the exact outage reporting functionality that is provided to English-speaking
callers. In addition, Progress Energy has identified nearly 50 Spanish-language media
outlets in its service area, and news releases have been translated into Spanish and
distributed directly to these media outlets.
10. As discussed on page 48, Duke and Progress Energy have adopted a
policy of making calls to customers on their medical needs lists shortly after a major
storm and informing these customers of the location of nearby shelters, telephone
numbers where help can be obtained, the importance of making appropriate outage
plans, the progress of service restoration efforts, and other information relevant to the
customer’s situation.
11. As discussed on page 54, Duke has begun working with the city of
Durham to relieve some of the restrictions imposed by the city’s tree-trimming
ordinance.
12. As discussed on page 67, Duke has modified the text of its recorded and
automatically dialed telephone messages to customers concerning power restoration, in
order to avoid customer misunderstanding.
XIII. Conclusions
The Utilities Commission and the Public Staff conclude that the Utilities were
adequately prepared for the December 2002 Ice Storm and that the Utilities’ restoration
efforts were diligent, effective, and well managed on the whole. Given the extraordinary
scope and intensity of the storm, the Utilities’ performance, though not flawless, was

75
commendable. The Utilities have recognized the need for improvements and have
identified and acted upon twelve primary lessons learned from this storm. Further, the
Commission expects the Utilities to adopt three additional recommendations for change
which have been made by the Commission and the Public Staff in this report.
The Utilities Commission and the Public Staff also commend the Utilities for their
cooperation with this investigation and their assistance in gathering the data that went
into this report. While the focus of the investigation was largely retrospective, the
findings and conclusions in this report are intended to be forward-looking as well.
Each major storm is a unique event and presents its own challenges to providers
of electric service. The type of damage incurred and the density of the affected
population can have a significant effect on the number of customers restored per day.
Thus, quantitative comparisons of restoration times and ratios between storms, or even
between the Utilities, are of limited value in assessing how well a provider responded to
a specific event. It is clear, however, that the Utilities incorporated lessons learned
from prior storm events into the planning and execution of their responses to the
December 2002 Ice Storm and are continuing to refine and enhance aspects of the
outage prevention and restoration process.
Finally, the Utilities Commission and the Public Staff believe that the Utilities’ line
workers and field personnel deserve special recognition for their part in the restoration
effort. These men and women spent long hours performing dangerous tasks under
difficult conditions in order to restore power to hundreds of thousands of North
Carolinians. They can be proud of their achievements and assured of the public’s
gratitude.

76