Embed Size (px)
Citation preview
20142015VIN INC ANNUAL REPORT
VIN INC ANNUAL REPORT 2014/2015
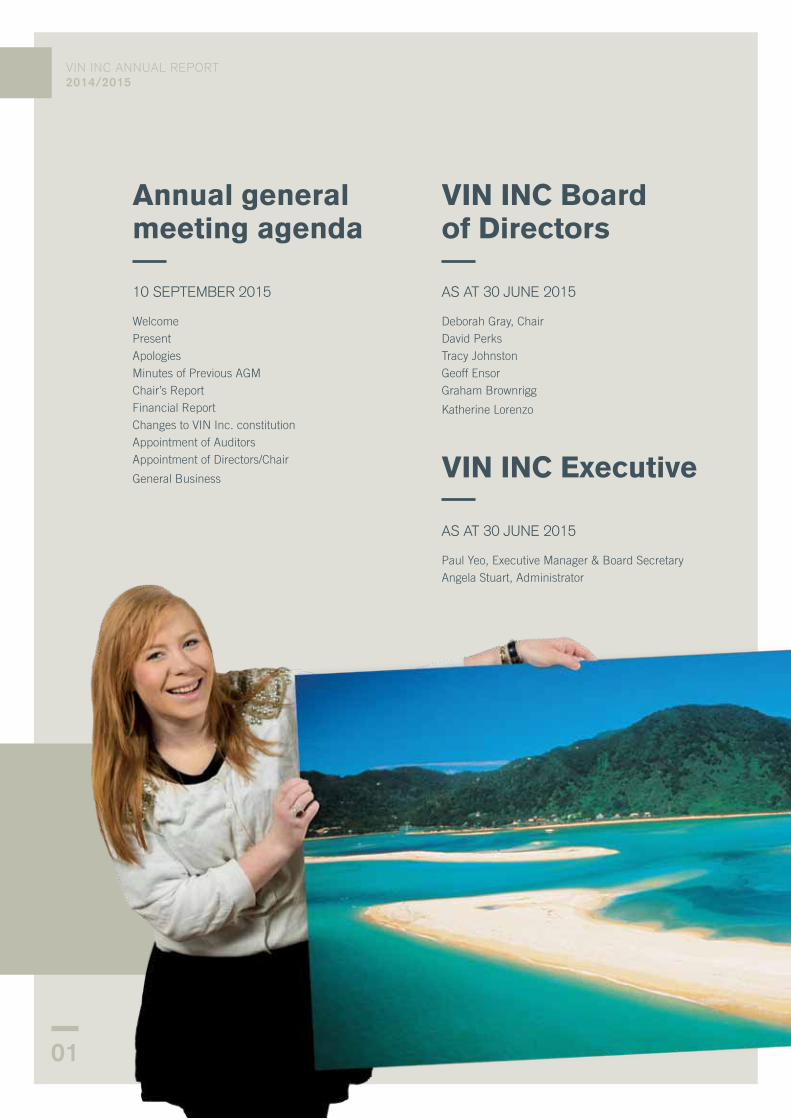
Annual general meeting agenda
10 SEPTEMBER 2015
WelcomePresentApologiesMinutes of Previous AGMChair’s ReportFinancial ReportChanges to VIN Inc. constitutionAppointment of AuditorsAppointment of Directors/Chair
General Business
VIN INC Board of Directors
AS AT 30 JUNE 2015
Deborah Gray, Chair David Perks Tracy Johnston Geoff Ensor Graham Brownrigg
Katherine Lorenzo
VIN INC Executive
AS AT 30 JUNE 2015
Paul Yeo, Executive Manager & Board Secretary Angela Stuart, Administrator
01
VIN INC ANNUAL REPORT 2014/2015
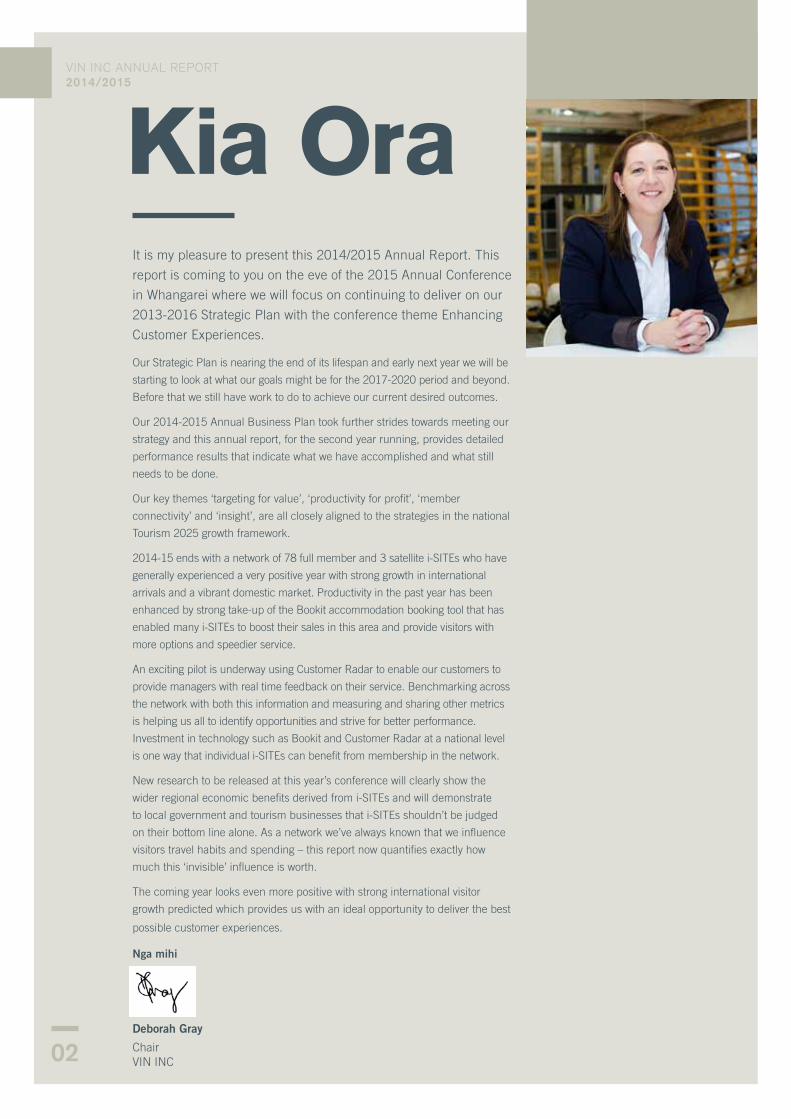
Kia Ora
Our Strategic Plan is nearing the end of its lifespan and early next year we will be
starting to look at what our goals might be for the 2017-2020 period and beyond.
Before that we still have work to do to achieve our current desired outcomes.
Our 2014-2015 Annual Business Plan took further strides towards meeting our
strategy and this annual report, for the second year running, provides detailed
performance results that indicate what we have accomplished and what still
needs to be done.
Our key themes ‘targeting for value’, ‘productivity for profit’, ‘member
connectivity’ and ‘insight’, are all closely aligned to the strategies in the national
Tourism 2025 growth framework.
2014-15 ends with a network of 78 full member and 3 satellite i-SITEs who have
generally experienced a very positive year with strong growth in international
arrivals and a vibrant domestic market. Productivity in the past year has been
enhanced by strong take-up of the Bookit accommodation booking tool that has
enabled many i-SITEs to boost their sales in this area and provide visitors with
more options and speedier service.
An exciting pilot is underway using Customer Radar to enable our customers to
provide managers with real time feedback on their service. Benchmarking across
the network with both this information and measuring and sharing other metrics
is helping us all to identify opportunities and strive for better performance.
Investment in technology such as Bookit and Customer Radar at a national level
is one way that individual i-SITEs can benefit from membership in the network.
New research to be released at this year’s conference will clearly show the
wider regional economic benefits derived from i-SITEs and will demonstrate
to local government and tourism businesses that i-SITEs shouldn’t be judged
on their bottom line alone. As a network we’ve always known that we influence
visitors travel habits and spending – this report now quantifies exactly how
much this ‘invisible’ influence is worth.
The coming year looks even more positive with strong international visitor
growth predicted which provides us with an ideal opportunity to deliver the best
possible customer experiences.
Nga mihi
Deborah Gray
Chair VIN INC
It is my pleasure to present this 2014/2015 Annual Report. This
report is coming to you on the eve of the 2015 Annual Conference
in Whangarei where we will focus on continuing to deliver on our
2013-2016 Strategic Plan with the conference theme Enhancing
Customer Experiences.
02
VIN INC ANNUAL REPORT 2014/2015
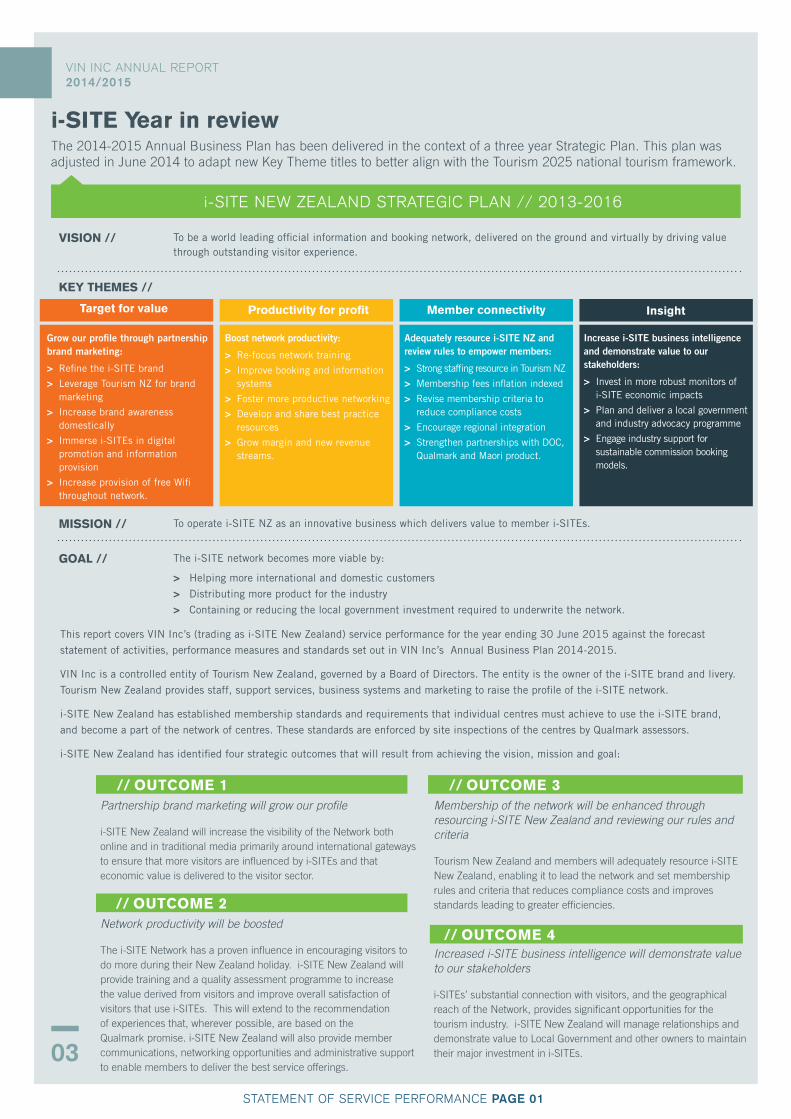
The 2014-2015 Annual Business Plan has been delivered in the context of a three year Strategic Plan. This plan was adjusted in June 2014 to adapt new Key Theme titles to better align with the Tourism 2025 national tourism framework.
i-SITE Year in review
Productivity for profit Member connectivityTarget for value Insight
i-SITE NEw ZEALANd STRATEgIC PLAN // 2013-2016
VISION // To be a world leading official information and booking network, delivered on the ground and virtually by driving value through outstanding visitor experience.
MISSION // To operate i-SITE NZ as an innovative business which delivers value to member i-SITEs.
GOAL // The i-SITE network becomes more viable by:
> Helping more international and domestic customers
> Distributing more product for the industry
> Containing or reducing the local government investment required to underwrite the network.
KEY THEMES //
Grow our profile through partnership brand marketing:
> Refine the i-SITE brand
> Leverage Tourism NZ for brand marketing
> Increase brand awareness domestically
> Immerse i-SITEs in digital promotion and information provision
> Increase provision of free Wifi throughout network.
Boost network productivity:
> Re-focus network training
> Improve booking and information systems
> Foster more productive networking
> Develop and share best practice resources
> Grow margin and new revenue streams.
Adequately resource i-SITE NZ and review rules to empower members:
> Strong staffing resource in Tourism NZ
> Membership fees inflation indexed
> Revise membership criteria to reduce compliance costs
> Encourage regional integration
> Strengthen partnerships with DOC, Qualmark and Maori product.
Increase i-SITE business intelligence and demonstrate value to our stakeholders:
> Invest in more robust monitors of i-SITE economic impacts
> Plan and deliver a local government and industry advocacy programme
> Engage industry support for sustainable commission booking models.
03
This report covers VIN Inc’s (trading as i-SITE New Zealand) service performance for the year ending 30 June 2015 against the forecast
statement of activities, performance measures and standards set out in VIN Inc’s Annual Business Plan 2014-2015.
VIN Inc is a controlled entity of Tourism New Zealand, governed by a Board of Directors. The entity is the owner of the i-SITE brand and livery.
Tourism New Zealand provides staff, support services, business systems and marketing to raise the profile of the i-SITE network.
i-SITE New Zealand has established membership standards and requirements that individual centres must achieve to use the i-SITE brand,
and become a part of the network of centres. These standards are enforced by site inspections of the centres by Qualmark assessors.
i-SITE New Zealand has identified four strategic outcomes that will result from achieving the vision, mission and goal:
Partnership brand marketing will grow our profile
i-SITE New Zealand will increase the visibility of the Network both online and in traditional media primarily around international gateways to ensure that more visitors are influenced by i-SITEs and that economic value is delivered to the visitor sector.
Network productivity will be boosted
The i-SITE Network has a proven influence in encouraging visitors to do more during their New Zealand holiday. i-SITE New Zealand will provide training and a quality assessment programme to increase the value derived from visitors and improve overall satisfaction of visitors that use i-SITEs. This will extend to the recommendation of experiences that, wherever possible, are based on the Qualmark promise. i-SITE New Zealand will also provide member communications, networking opportunities and administrative support to enable members to deliver the best service offerings.
Membership of the network will be enhanced through resourcing i-SITE New Zealand and reviewing our rules and criteria
Tourism New Zealand and members will adequately resource i-SITE New Zealand, enabling it to lead the network and set membership rules and criteria that reduces compliance costs and improves standards leading to greater efficiencies.
Increased i-SITE business intelligence will demonstrate value to our stakeholders
i-SITEs’ substantial connection with visitors, and the geographical reach of the Network, provides significant opportunities for the tourism industry. i-SITE New Zealand will manage relationships and demonstrate value to Local Government and other owners to maintain their major investment in i-SITEs.
// OUTCOME 1 // OUTCOME 3
// OUTCOME 2
// OUTCOME 4
STATEMENT Of SERVICE PERfORMANCE PAGE 01
VIN INC ANNUAL REPORT 2014/2015
04
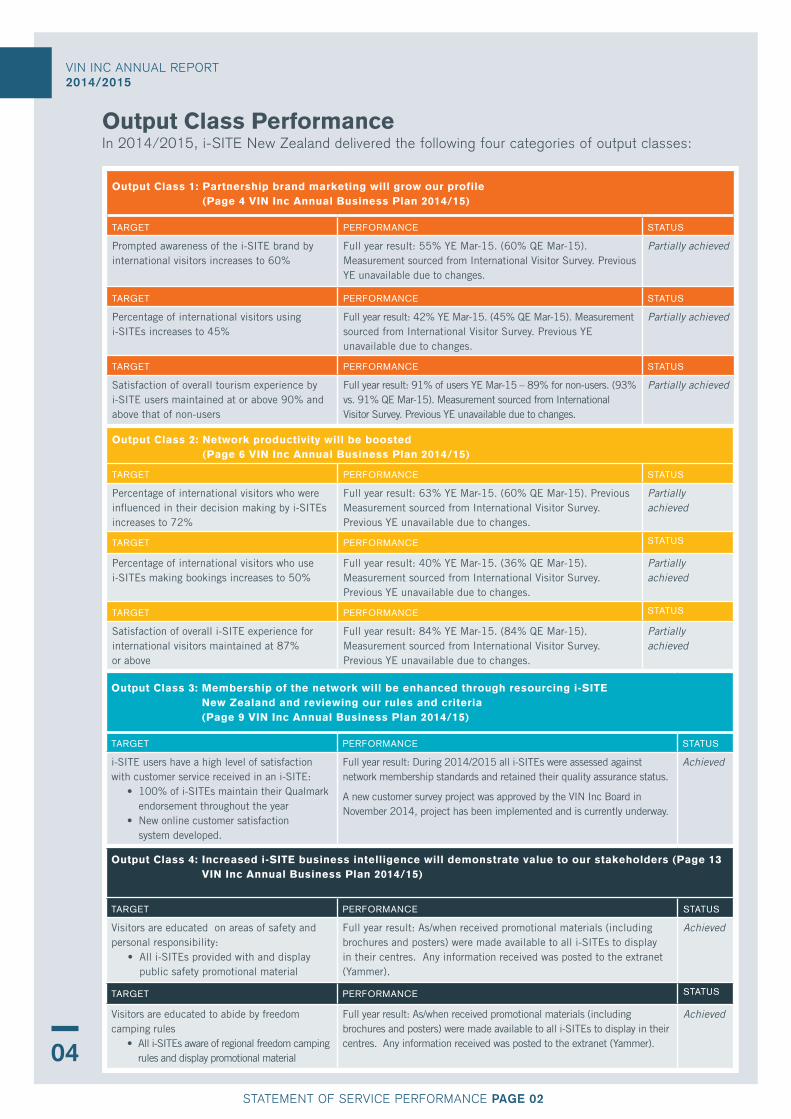
Output Class 3: Membership of the network will be enhanced through resourcing i-SITE New Zealand and reviewing our rules and criteria (Page 9 VIN Inc Annual Business Plan 2014/15)
TargeT Performance STaTUS
i-SITE users have a high level of satisfaction with customer service received in an i-SITE: • 100% of i-SITEs maintain their Qualmark
endorsement throughout the year • New online customer satisfaction
system developed.
Full year result: During 2014/2015 all i-SITEs were assessed against network membership standards and retained their quality assurance status.
A new customer survey project was approved by the VIN Inc Board in November 2014, project has been implemented and is currently underway.
Achieved
Output Class 4: Increased i-SITE business intelligence will demonstrate value to our stakeholders (Page 13 VIN Inc Annual Business Plan 2014/15)
TargeT Performance STaTUS
Visitors are educated on areas of safety and personal responsibility: • All i-SITEs provided with and display
public safety promotional material
Full year result: As/when received promotional materials (including brochures and posters) were made available to all i-SITEs to display in their centres. Any information received was posted to the extranet (Yammer).
Achieved
TargeT Performance STaTUS
Visitors are educated to abide by freedom camping rules • All i-SITEs aware of regional freedom camping
rules and display promotional material
Full year result: As/when received promotional materials (including brochures and posters) were made available to all i-SITEs to display in their centres. Any information received was posted to the extranet (Yammer).
Achieved
Output Class 1: Partnership brand marketing will grow our profile (Page 4 VIN Inc Annual Business Plan 2014/15)
TargeT Performance STaTUS
Prompted awareness of the i-SITE brand by international visitors increases to 60%
Full year result: 55% YE Mar-15. (60% QE Mar-15).Measurement sourced from International Visitor Survey. Previous YE unavailable due to changes.
Partially achieved
TargeT Performance STaTUS
Percentage of international visitors using i-SITEs increases to 45%
Full year result: 42% YE Mar-15. (45% QE Mar-15). Measurement sourced from International Visitor Survey. Previous YE unavailable due to changes.
Partially achieved
TargeT Performance STaTUS
Satisfaction of overall tourism experience by i-SITE users maintained at or above 90% and above that of non-users
Full year result: 91% of users YE Mar-15 – 89% for non-users. (93% vs. 91% QE Mar-15). Measurement sourced from International Visitor Survey. Previous YE unavailable due to changes.
Partially achieved
Output Class 2: Network productivity will be boosted (Page 6 VIN Inc Annual Business Plan 2014/15)
TargeT Performance STaTUS
Percentage of international visitors who were influenced in their decision making by i-SITEs increases to 72%
Full year result: 63% YE Mar-15. (60% QE Mar-15). Previous Measurement sourced from International Visitor Survey. Previous YE unavailable due to changes.
Partially achieved
TargeT Performance STaTUS
Percentage of international visitors who use i-SITEs making bookings increases to 50%
Full year result: 40% YE Mar-15. (36% QE Mar-15). Measurement sourced from International Visitor Survey. Previous YE unavailable due to changes.
Partially achieved
TargeT Performance STaTUS
Satisfaction of overall i-SITE experience for international visitors maintained at 87% or above
Full year result: 84% YE Mar-15. (84% QE Mar-15). Measurement sourced from International Visitor Survey. Previous YE unavailable due to changes.
Partially achieved
Output Class PerformanceIn 2014/2015, i-SITE New Zealand delivered the following four categories of output classes:
STATEMENT Of SERVICE PERfORMANCE PAGE 02
VIN INC ANNUAL REPORT 2014/2015
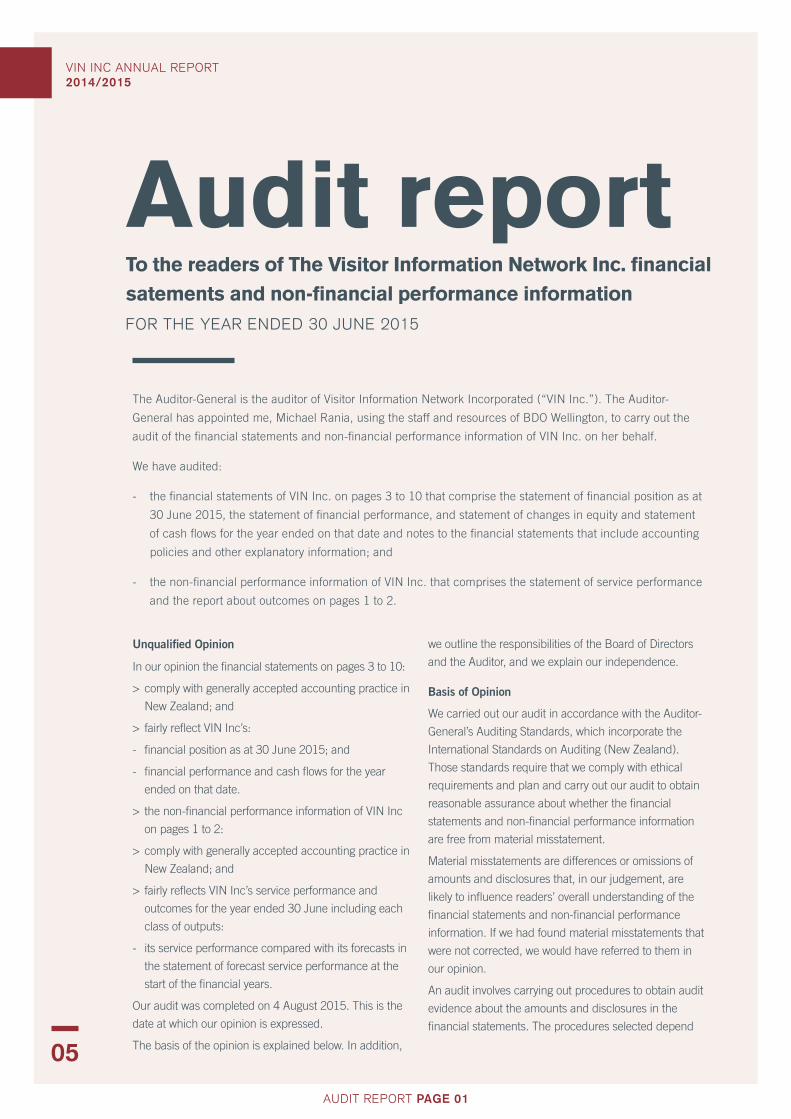
Audit reportTo the readers of The Visitor Information Network Inc. financial satements and non-financial performance informationfOR ThE yEAR ENdEd 30 JUNE 2015
05
Unqualified Opinion
In our opinion the financial statements on pages 3 to 10:
> comply with generally accepted accounting practice in
New Zealand; and
> fairly reflect VIN Inc’s:
- financial position as at 30 June 2015; and
- financial performance and cash flows for the year
ended on that date.
> the non-financial performance information of VIN Inc
on pages 1 to 2:
> comply with generally accepted accounting practice in
New Zealand; and
> fairly reflects VIN Inc’s service performance and
outcomes for the year ended 30 June including each
class of outputs:
- its service performance compared with its forecasts in
the statement of forecast service performance at the
start of the financial years.
Our audit was completed on 4 August 2015. This is the
date at which our opinion is expressed.
The basis of the opinion is explained below. In addition,
we outline the responsibilities of the Board of Directors
and the Auditor, and we explain our independence.
Basis of Opinion
We carried out our audit in accordance with the Auditor-
General’s Auditing Standards, which incorporate the
International Standards on Auditing (New Zealand).
Those standards require that we comply with ethical
requirements and plan and carry out our audit to obtain
reasonable assurance about whether the financial
statements and non-financial performance information
are free from material misstatement.
Material misstatements are differences or omissions of
amounts and disclosures that, in our judgement, are
likely to influence readers’ overall understanding of the
financial statements and non-financial performance
information. If we had found material misstatements that
were not corrected, we would have referred to them in
our opinion.
An audit involves carrying out procedures to obtain audit
evidence about the amounts and disclosures in the
financial statements. The procedures selected depend
The Auditor-General is the auditor of Visitor Information Network Incorporated (“VIN Inc.”). The Auditor-
General has appointed me, Michael Rania, using the staff and resources of BDO Wellington, to carry out the
audit of the financial statements and non-financial performance information of VIN Inc. on her behalf.
We have audited:
- the financial statements of VIN Inc. on pages 3 to 10 that comprise the statement of financial position as at
30 June 2015, the statement of financial performance, and statement of changes in equity and statement
of cash flows for the year ended on that date and notes to the financial statements that include accounting
policies and other explanatory information; and
- the non-financial performance information of VIN Inc. that comprises the statement of service performance
and the report about outcomes on pages 1 to 2.
AUdIT REPORT PAGE 01
VIN INC ANNUAL REPORT 2014/2015
06
on our judgement, including our assessment of risks
of material misstatement of the financial statements
whether due to fraud or error. In making those risk
assessments, we consider internal control relevant to
VIN Inc’s preparation of the financial statements and
non-financial performance information that fairly reflect
the matters to which they relate. We consider internal
control in order to design audit procedures that are
appropriate in the circumstances but not for the purpose
of expressing an opinion on the effectiveness of VIN Inc’s
internal control.
An audit involves evaluating:
> the appropriateness of accounting policies used and
whether they have been consistently applied;
> the reasonableness of the significant accounting
estimates and judgements made by the Board;
> The appropriateness of the reported non-financial
performance information within VIN’s framework for
reporting performance;
> the adequacy of all disclosures in the financial
statements and non-financial performance
information; and
> the overall presentation of the financial statements and
non-financial performance information.
We did not examine every transaction, nor do we
guarantee complete accuracy of the financial statements
and non-financial performance information.
We have obtained all the information and explanations
we have required. We believe we have obtained sufficient
and appropriate audit evidence to provide a basis for our
audit opinion.
RESpONSIBIlITIES Of ThE BOARD Of DIREcTOR’S
AND ThE AUDITOR
Responsibilities of the Board
The Board is responsible for preparing financial
statements that:
> comply with generally accepted accounting practice in
New Zealand;
> fairly reflect VIN Inc’s financial position and financial
performance and cash flows; and
> fairly reflect its service performance and outcomes.
The Board is also responsible for such internal control
as it determines is necessary to enable the preparation
of financial statements and non-financial performance
information that are free from material misstatement,
whether due to fraud or error. The board is also
responsible for the publication of the financial statements
and non-financial performance information, whether in
printed or electronic form.
The Board’s responsibilities arise from the Incorporated
Societies Act 1908.
Responsibilities of the Auditor
We are responsible for expressing an independent
opinion on the financial statements and non-financial
performance information and reporting that opinion to
you based on our audit. Our responsibility arises from
section 15 of the Public Audit Act 2001 and the Crown
Entities Act 2004.
Independence
When carrying out the audit, we followed the
independence requirements of the Auditor- General,
which incorporate the independence requirements of the
External Reporting Board.
Other than in our capacity as auditor, our firm carries out
annual tax compliance services for VIN Inc. We have no
other relationship with or interests in VIN Inc.
Michael Rania
BDO Wellington
On behalf of the Auditor-General
Wellington, New Zealand
AUdIT REPORT PAGE 02
VIN INC ANNUAL REPORT 2014/2015
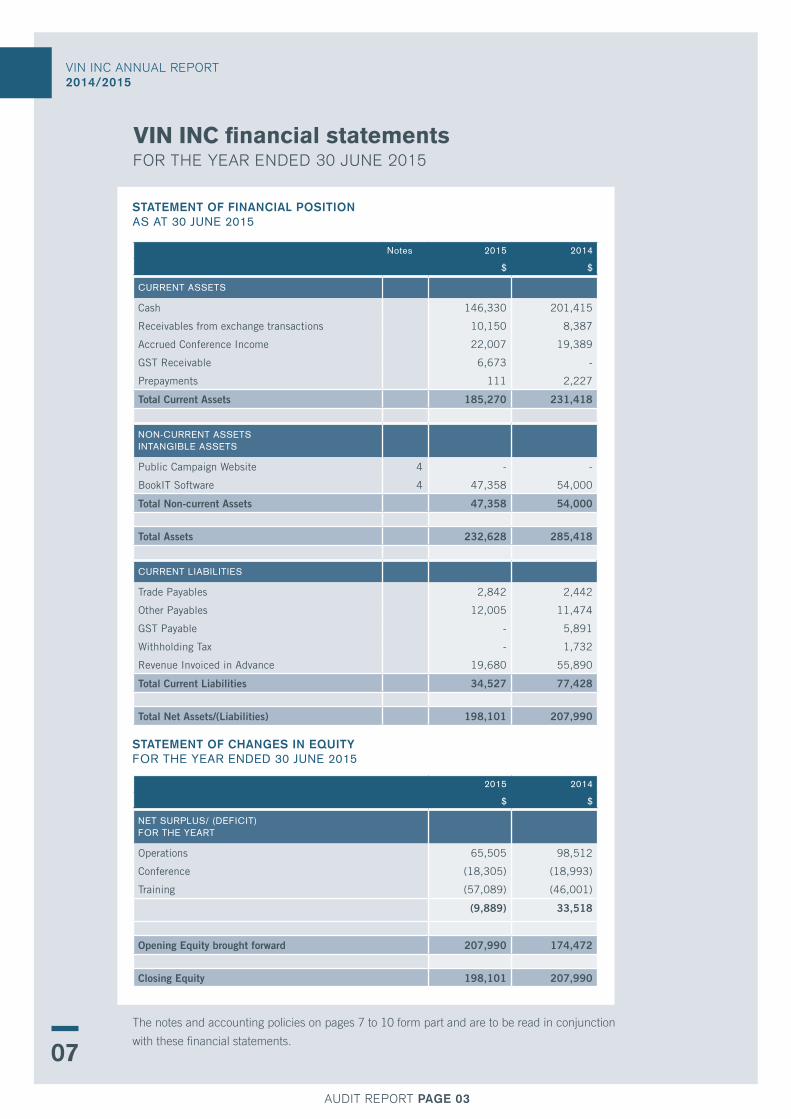
VIN INC financial statementsfOR ThE yEAR ENdEd 30 JUNE 2015
07
notes 2015 2014
$ $
cUrrenT aSSeTS
Cash 146,330 201,415
Receivables from exchange transactions 10,150 8,387
Accrued Conference Income 22,007 19,389
GST Receivable 6,673 -
Prepayments 111 2,227
Total current Assets 185,270 231,418
non-cUrrenT aSSeTS InTangIBLe aSSeTS
Public Campaign Website 4 - -
BookIT Software 4 47,358 54,000
Total Non-current Assets 47,358 54,000
Total Assets 232,628 285,418
cUrrenT LIaBILITIeS
Trade Payables 2,842 2,442
Other Payables 12,005 11,474
GST Payable - 5,891
Withholding Tax - 1,732
Revenue Invoiced in Advance 19,680 55,890
Total current liabilities 34,527 77,428
Total Net Assets/(liabilities) 198,101 207,990
StAtEmEnt of finAnciAl PoSitionaS aT 30 JUne 2015
2015 2014
$ $
neT SUrPLUS/ (DefIcIT) for The yearT
Operations 65,505 98,512
Conference (18,305) (18,993)
Training (57,089) (46,001)
(9,889) 33,518
Opening Equity brought forward 207,990 174,472
closing Equity 198,101 207,990
StAtEmEnt of chAnGES in Equityfor The year enDeD 30 JUne 2015
The notes and accounting policies on pages 7 to 10 form part and are to be read in conjunction
with these financial statements.
AUdIT REPORT PAGE 03
VIN INC ANNUAL REPORT 2014/2015
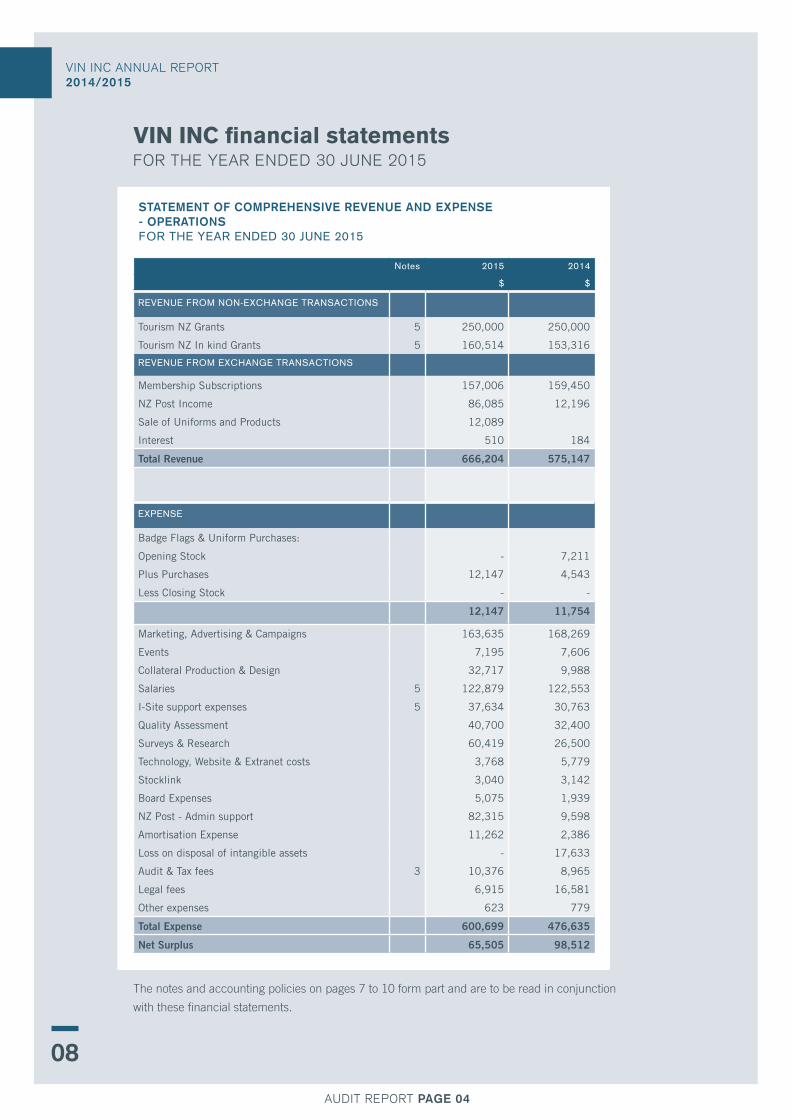
VIN INC financial statementsfOR ThE yEAR ENdEd 30 JUNE 2015
08
StAtEmEnt of comPREhEnSiVE REVEnuE AnD EXPEnSE - oPERAtionSfor The year enDeD 30 JUne 2015
The notes and accounting policies on pages 7 to 10 form part and are to be read in conjunction
with these financial statements.
AUdIT REPORT PAGE 04
notes 2015 2014
$ $
reVenUe from non-eXchange TranSacTIonS
Tourism NZ Grants 5 250,000 250,000
Tourism NZ In kind Grants 5 160,514 153,316
reVenUe from eXchange TranSacTIonS
Membership Subscriptions 157,006 159,450
NZ Post Income 86,085 12,196
Sale of Uniforms and Products 12,089
Interest 510 184
Total Revenue 666,204 575,147
eXPenSe
Badge Flags & Uniform Purchases:
Opening Stock - 7,211
Plus Purchases 12,147 4,543
Less Closing Stock - -
12,147 11,754
Marketing, Advertising & Campaigns 163,635 168,269
Events 7,195 7,606
Collateral Production & Design 32,717 9,988
Salaries 5 122,879 122,553
I-Site support expenses 5 37,634 30,763
Quality Assessment 40,700 32,400
Surveys & Research 60,419 26,500
Technology, Website & Extranet costs 3,768 5,779
Stocklink 3,040 3,142
Board Expenses 5,075 1,939
NZ Post - Admin support 82,315 9,598
Amortisation Expense 11,262 2,386
Loss on disposal of intangible assets - 17,633
Audit & Tax fees 3 10,376 8,965
Legal fees 6,915 16,581
Other expenses 623 779
Total Expense 600,699 476,635
Net Surplus 65,505 98,512
VIN INC ANNUAL REPORT 2014/2015
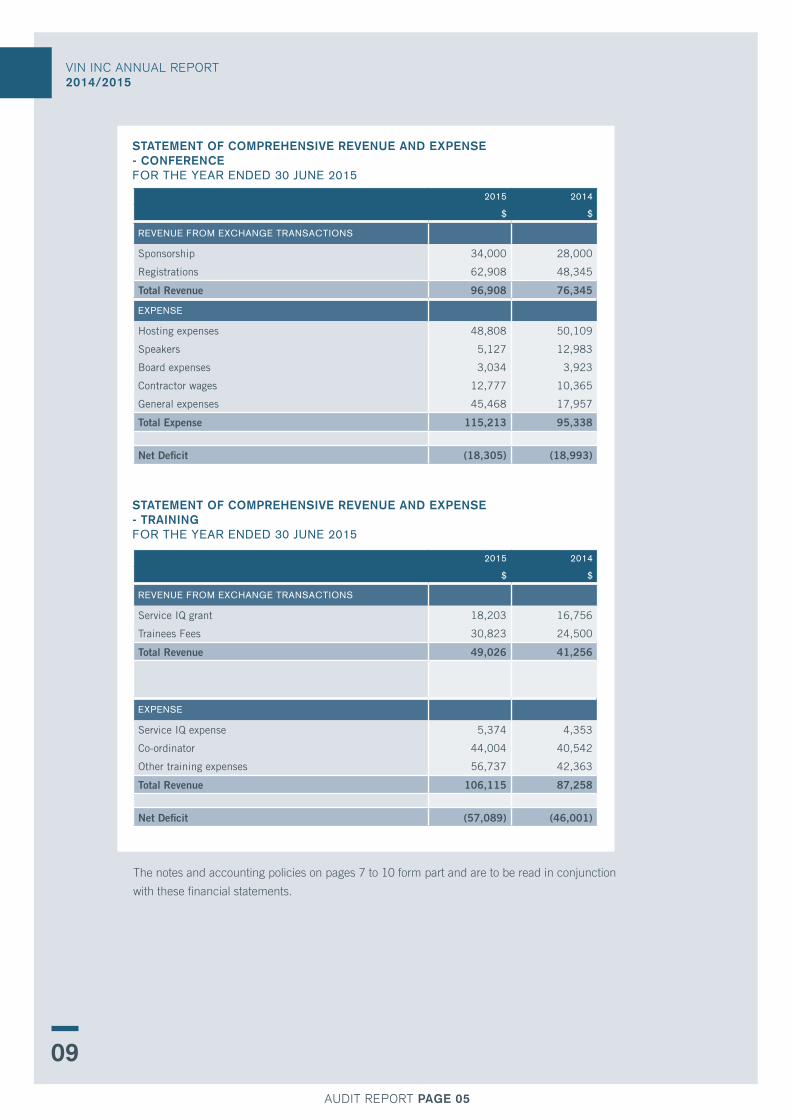
StAtEmEnt of comPREhEnSiVE REVEnuE AnD EXPEnSE - confEREncEfor The year enDeD 30 JUne 2015
2015 2014
$ $
reVenUe from eXchange TranSacTIonS
Service IQ grant 18,203 16,756
Trainees Fees 30,823 24,500
Total Revenue 49,026 41,256
eXPenSe
Service IQ expense 5,374 4,353
Co-ordinator 44,004 40,542
Other training expenses 56,737 42,363
Total Revenue 106,115 87,258
Net Deficit (57,089) (46,001)
StAtEmEnt of comPREhEnSiVE REVEnuE AnD EXPEnSE - tRAininGfor The year enDeD 30 JUne 2015
09
The notes and accounting policies on pages 7 to 10 form part and are to be read in conjunction
with these financial statements.
AUdIT REPORT PAGE 05
2015 2014
$ $
reVenUe from eXchange TranSacTIonS
Sponsorship 34,000 28,000
Registrations 62,908 48,345
Total Revenue 96,908 76,345
eXPenSe
Hosting expenses 48,808 50,109
Speakers 5,127 12,983
Board expenses 3,034 3,923
Contractor wages 12,777 10,365
General expenses 45,468 17,957
Total Expense 115,213 95,338
Net Deficit (18,305) (18,993)
VIN INC ANNUAL REPORT 2014/2015
10
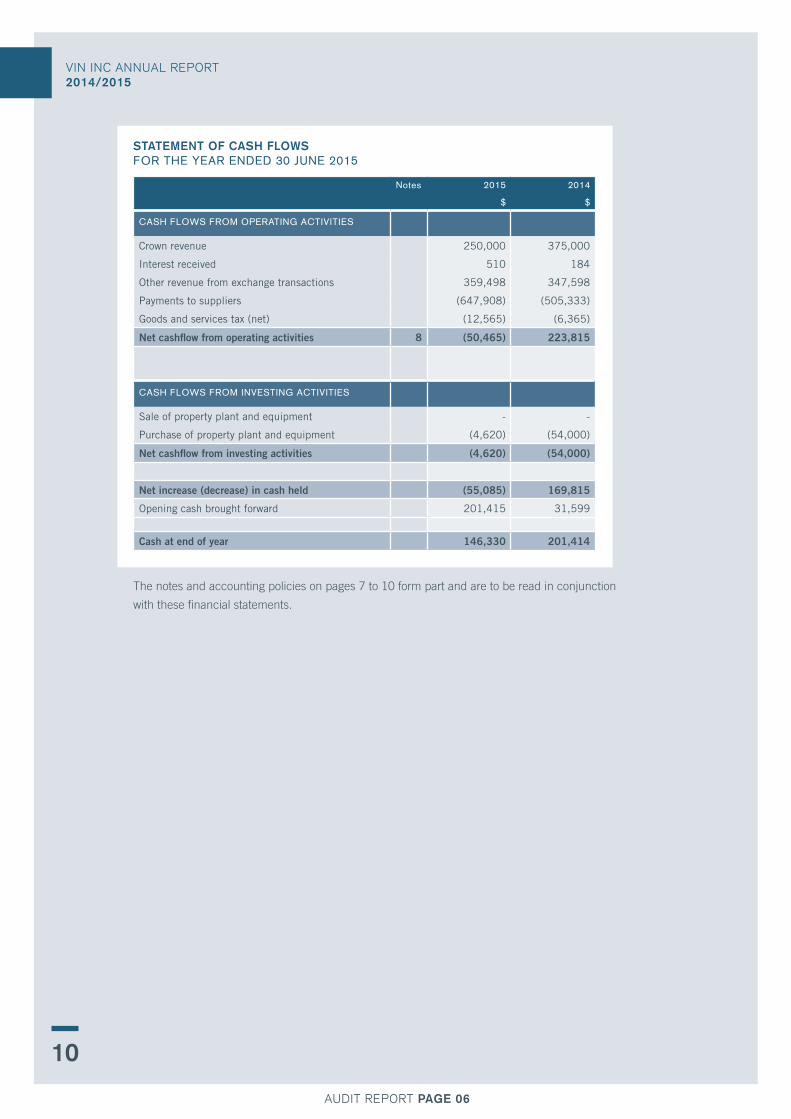
StAtEmEnt of cASh floWSfor The year enDeD 30 JUne 2015
The notes and accounting policies on pages 7 to 10 form part and are to be read in conjunction
with these financial statements.
AUdIT REPORT PAGE 06
notes 2015 2014
$ $
caSh fLoWS from oPeraTIng acTIVITIeS
Crown revenue 250,000 375,000
Interest received 510 184
Other revenue from exchange transactions 359,498 347,598
Payments to suppliers (647,908) (505,333)
Goods and services tax (net) (12,565) (6,365)
Net cashflow from operating activities 8 (50,465) 223,815
caSh fLoWS from InVeSTIng acTIVITIeS
Sale of property plant and equipment - -
Purchase of property plant and equipment (4,620) (54,000)
Net cashflow from investing activities (4,620) (54,000)
Net increase (decrease) in cash held (55,085) 169,815
Opening cash brought forward 201,415 31,599
cash at end of year 146,330 201,414
VIN INC ANNUAL REPORT 2014/2015
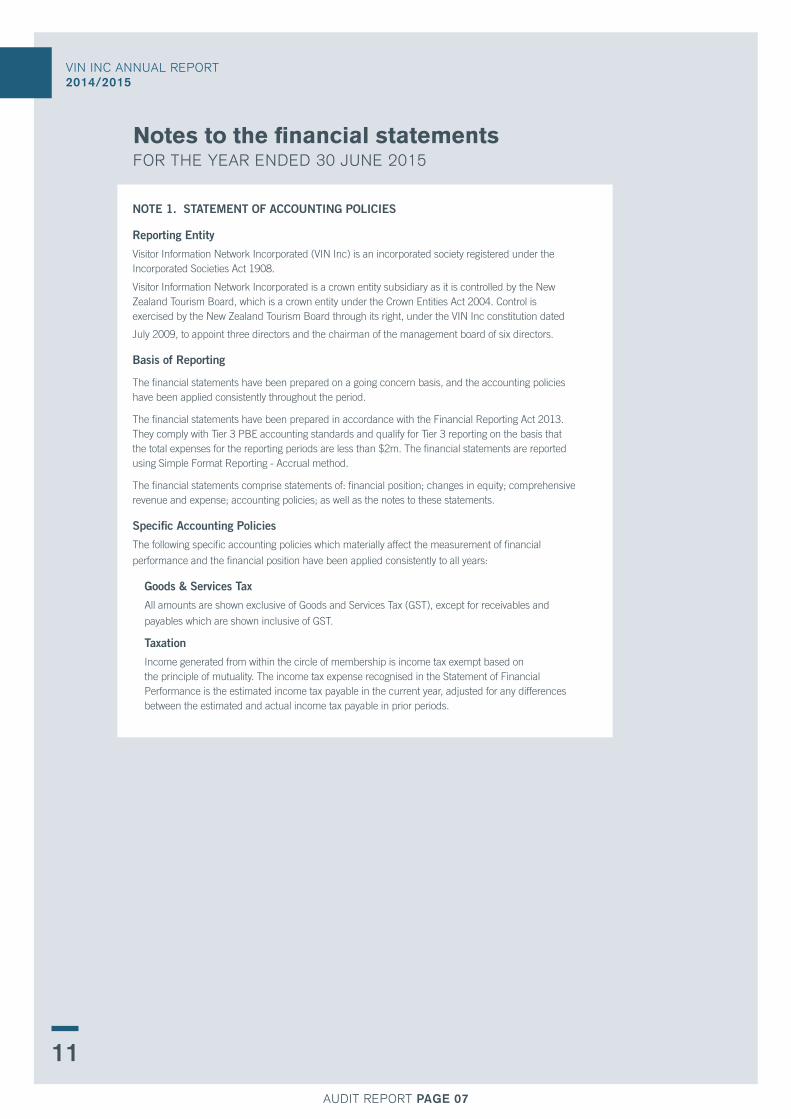
NOTE 1. STATEMENT Of AccOUNTING pOlIcIES
Reporting Entity
Visitor Information Network Incorporated (VIN Inc) is an incorporated society registered under the Incorporated Societies Act 1908.
Visitor Information Network Incorporated is a crown entity subsidiary as it is controlled by the New Zealand Tourism Board, which is a crown entity under the Crown Entities Act 2004. Control is exercised by the New Zealand Tourism Board through its right, under the VIN Inc constitution dated
July 2009, to appoint three directors and the chairman of the management board of six directors.
Basis of Reporting
The financial statements have been prepared on a going concern basis, and the accounting policies have been applied consistently throughout the period.
The financial statements have been prepared in accordance with the Financial Reporting Act 2013. They comply with Tier 3 PBE accounting standards and qualify for Tier 3 reporting on the basis that the total expenses for the reporting periods are less than $2m. The financial statements are reported using Simple Format Reporting - Accrual method.
The financial statements comprise statements of: financial position; changes in equity; comprehensive revenue and expense; accounting policies; as well as the notes to these statements.
Specific Accounting policies
The following specific accounting policies which materially affect the measurement of financial
performance and the financial position have been applied consistently to all years:
Goods & Services Tax
All amounts are shown exclusive of Goods and Services Tax (GST), except for receivables and
payables which are shown inclusive of GST.
Taxation
Income generated from within the circle of membership is income tax exempt based on the principle of mutuality. The income tax expense recognised in the Statement of Financial Performance is the estimated income tax payable in the current year, adjusted for any differences between the estimated and actual income tax payable in prior periods.
Notes to the financial statementsfOR ThE yEAR ENdEd 30 JUNE 2015
11
AUdIT REPORT PAGE 07
VIN INC ANNUAL REPORT 2014/2015
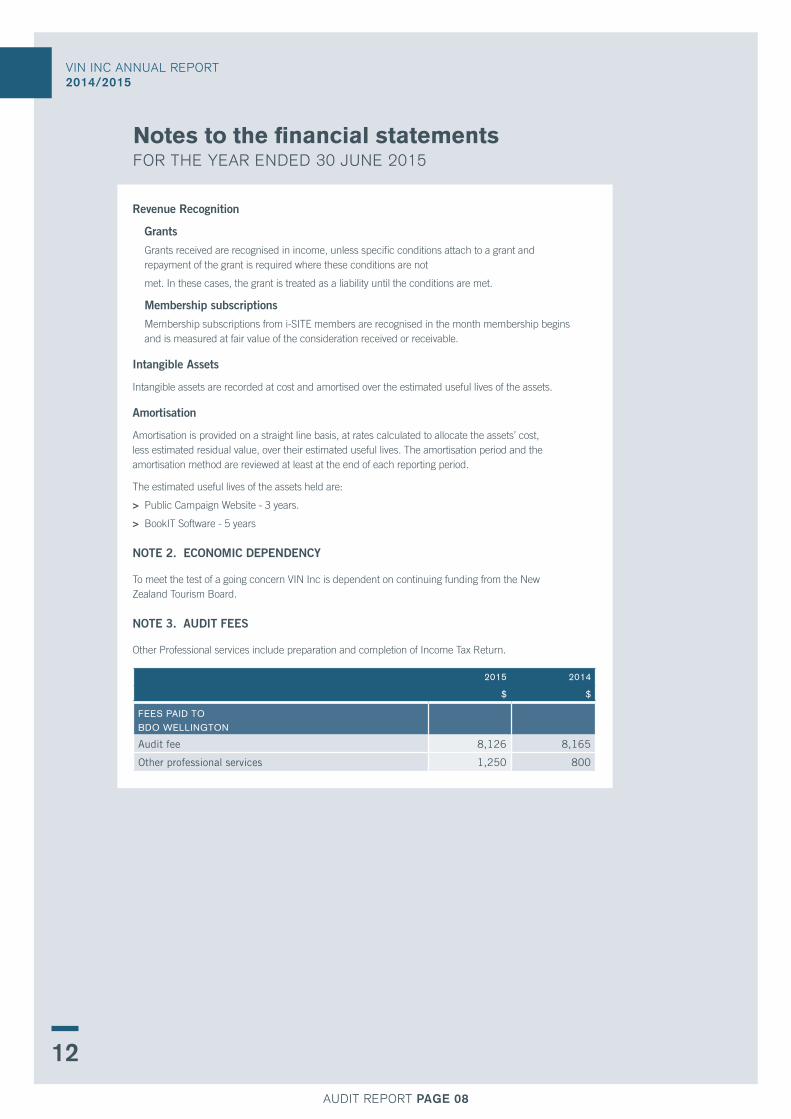
Revenue Recognition
Grants
Grants received are recognised in income, unless specific conditions attach to a grant and repayment of the grant is required where these conditions are not
met. In these cases, the grant is treated as a liability until the conditions are met.
Membership subscriptions
Membership subscriptions from i-SITE members are recognised in the month membership begins and is measured at fair value of the consideration received or receivable.
Intangible Assets
Intangible assets are recorded at cost and amortised over the estimated useful lives of the assets.
Amortisation
Amortisation is provided on a straight line basis, at rates calculated to allocate the assets’ cost, less estimated residual value, over their estimated useful lives. The amortisation period and the amortisation method are reviewed at least at the end of each reporting period.
The estimated useful lives of the assets held are:
> Public Campaign Website - 3 years.
> BookIT Software - 5 years
NOTE 2. EcONOMIc DEpENDENcY
To meet the test of a going concern VIN Inc is dependent on continuing funding from the New Zealand Tourism Board.
NOTE 3. AUDIT fEES
Other Professional services include preparation and completion of Income Tax Return.
Notes to the financial statementsfOR ThE yEAR ENdEd 30 JUNE 2015
2015 2014
$ $
feeS PaID To
BDo WeLLIngTon
Audit fee 8,126 8,165
Other professional services 1,250 800
12
AUdIT REPORT PAGE 08
VIN INC ANNUAL REPORT 2014/2015
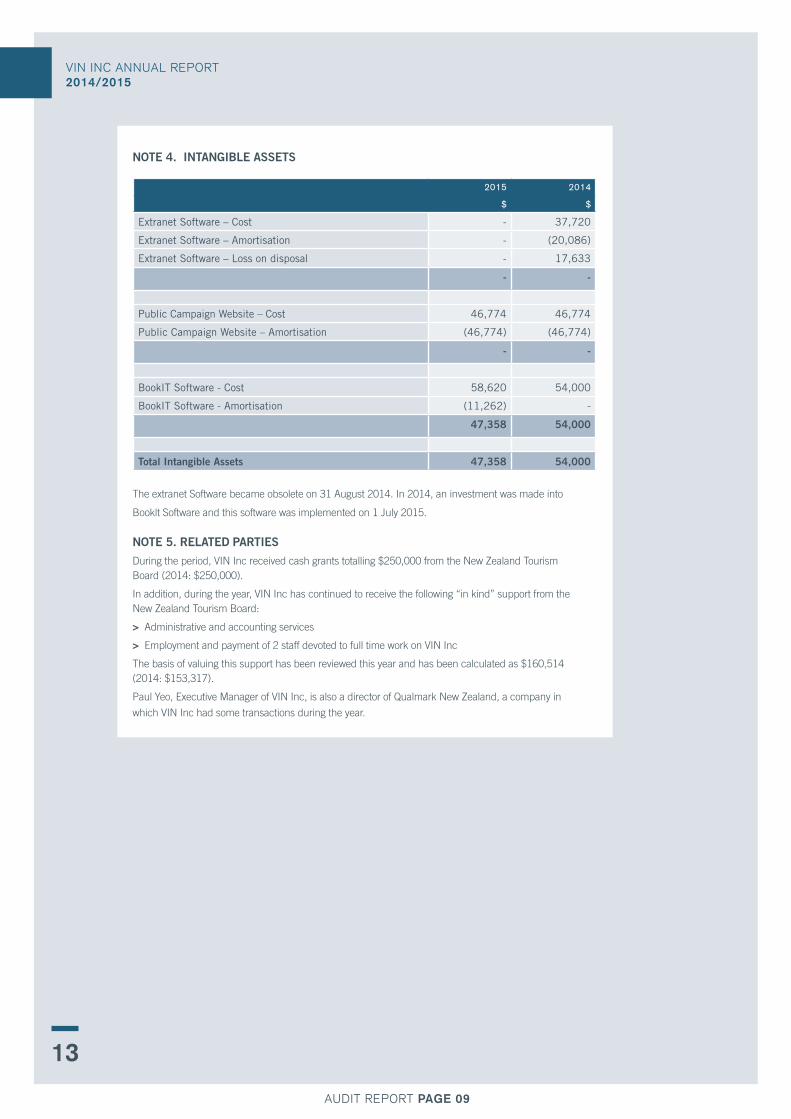
NOTE 4. INTANGIBlE ASSETS
NOTE 4. INTANGIBlE ASSETS
The extranet Software became obsolete on 31 August 2014. In 2014, an investment was made into
Booklt Software and this software was implemented on 1 July 2015.
NOTE 5. RElATED pARTIES
During the period, VIN Inc received cash grants totalling $250,000 from the New Zealand Tourism Board (2014: $250,000).
In addition, during the year, VIN Inc has continued to receive the following “in kind” support from the New Zealand Tourism Board:
> Administrative and accounting services
> Employment and payment of 2 staff devoted to full time work on VIN Inc
The basis of valuing this support has been reviewed this year and has been calculated as $160,514 (2014: $153,317).
Paul Yeo, Executive Manager of VIN Inc, is also a director of Qualmark New Zealand, a company in
which VIN Inc had some transactions during the year.
2015 2014
$ $
Extranet Software – Cost - 37,720
Extranet Software – Amortisation - (20,086)
Extranet Software – Loss on disposal - 17,633
- -
Public Campaign Website – Cost 46,774 46,774
Public Campaign Website – Amortisation (46,774) (46,774)
- -
BookIT Software - Cost 58,620 54,000
BookIT Software - Amortisation (11,262) -
47,358 54,000
Total Intangible Assets 47,358 54,000
13
AUdIT REPORT PAGE 09
VIN INC ANNUAL REPORT 2014/2015
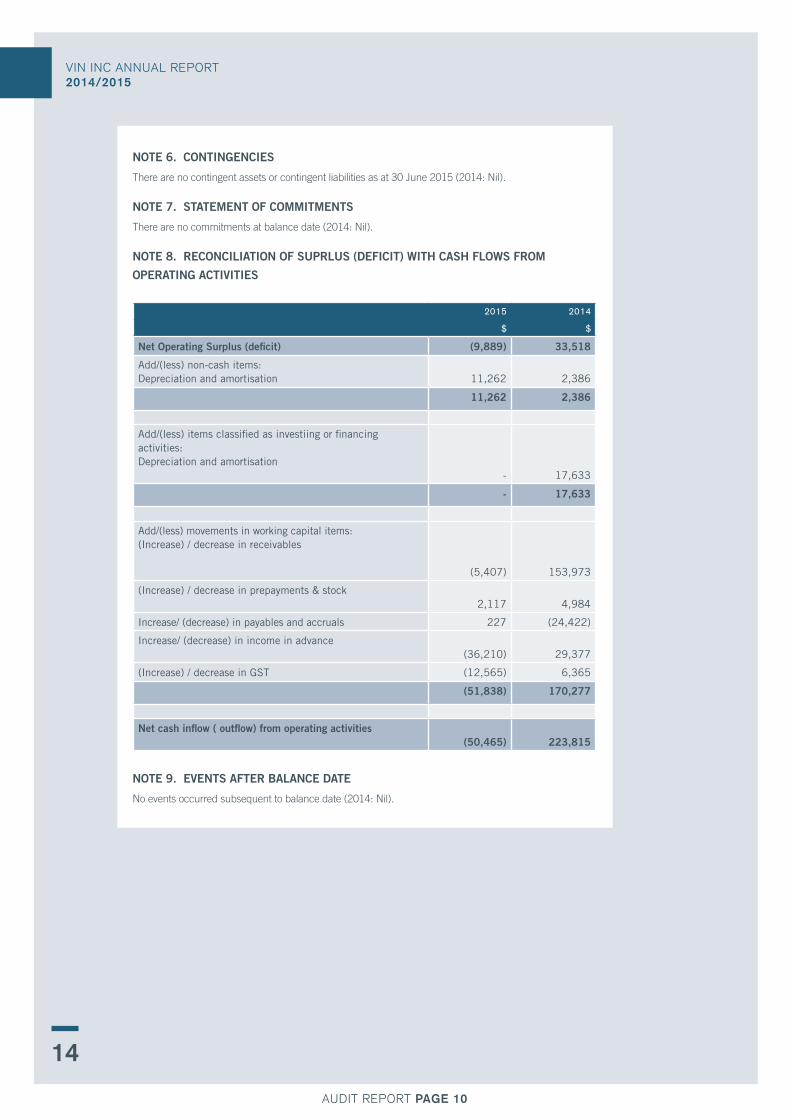
NOTE 6. cONTINGENcIES
There are no contingent assets or contingent liabilities as at 30 June 2015 (2014: Nil).
NOTE 7. STATEMENT Of cOMMITMENTS
There are no commitments at balance date (2014: Nil).
NOTE 8. REcONcIlIATION Of SUpRlUS (DEfIcIT) WITh cASh flOWS fROM
OpERATING AcTIVITIES
NOTE 9. EVENTS AfTER BAlANcE DATE
No events occurred subsequent to balance date (2014: Nil).
2015 2014
$ $
Net Operating Surplus (deficit) (9,889) 33,518
Add/(less) non-cash items:Depreciation and amortisation 11,262
2,386
11,262 2,386
Add/(less) items classified as investiing or financing activities:Depreciation and amortisation
-
17,633
- 17,633
Add/(less) movements in working capital items:(Increase) / decrease in receivables
(5,407) 153,973
(Increase) / decrease in prepayments & stock2,117 4,984
Increase/ (decrease) in payables and accruals 227 (24,422)
Increase/ (decrease) in income in advance (36,210) 29,377
(Increase) / decrease in GST (12,565) 6,365
(51,838) 170,277
Net cash inflow ( outflow) from operating activities (50,465)
223,815
14
AUdIT REPORT PAGE 10