Embed Size (px)
Citation preview

Windpower in cold climates VindforskWindpower in cold climates – Vindforsk project V313
presented at
Winterwind 2011 Umeå 9 10 febWinterwind 2011, Umeå 9‐10 feb.
Hans Bergström & Petra Thorsson, Uppsala UniversityPer Undén, Esbjörn Olsson & Ulf Andrae, SMHI Stefan Söderberg, Weathertech Scandinavia
SMHIUppsala University Weathertech Scandinavia

Project goalsProject goals
• Generally increase the knowledge on how wind power plants produce in areas with icing.
M h d f d i i i li l i h 1 k 2• Methods for producing an icing climatology with 1 km2
over Sweden.
Th li t l h ld i l d i f ti• The climatology should include information on frequency and duration of icing.
SMHIUppsala University Weathertech Scandinavia

Tools Models:• ECMWF ERA‐interim
– ~ 80 km, 60 levels
• AROME (ECMWF/HIRLAM)• AROME (ECMWF/HIRLAM)– 1‐2.5 km, 65 levels
• COAMPS (GFS)1 3 k 40 l l– 1‐3 km, 40 levels
• WRF (GFS)– 1‐3 km, 40 levels
• Makkonen ice model
SMHIUppsala University Weathertech Scandinavia

Tools
Observations:
• Measurements in telecommunication masts and on wind power plants.
• Wind, temperature, humidity, pressure, visibility, cloud base and ice load.
• 3 places last winter, will be 11 this winter.
Saab Combitech and Holoopticsice measuring devices
SMHIUppsala University Weathertech Scandinavia

ECMWF ERA‐interim re‐analysisGlobal dataset 1989‐today
• Will be used as lateral boundaries and initial conditions for high resolution model runs.
• Weather classification methods will be applied to find• Weather classification methods will be applied to find representative icing seasons or months.
• What can ERA‐interim data as it is combined with the ice model show us ?
SMHIUppsala University Weathertech Scandinavia

ERA‐interim: number of NOVEMBER ice days, mean temperature and wind speed
100 m agl. Gridpoint in the middle of Västerbotten
SMHIUppsala University Weathertech Scandinavia

Results from last winter:Hours with icing (>10g/hour) according to AROME 2.5 km
Okt 2009 M 2010
Nov 2009
Okt 2009-Mar 2010
Feb 2010
SMHIUppsala University Weathertech Scandinavia
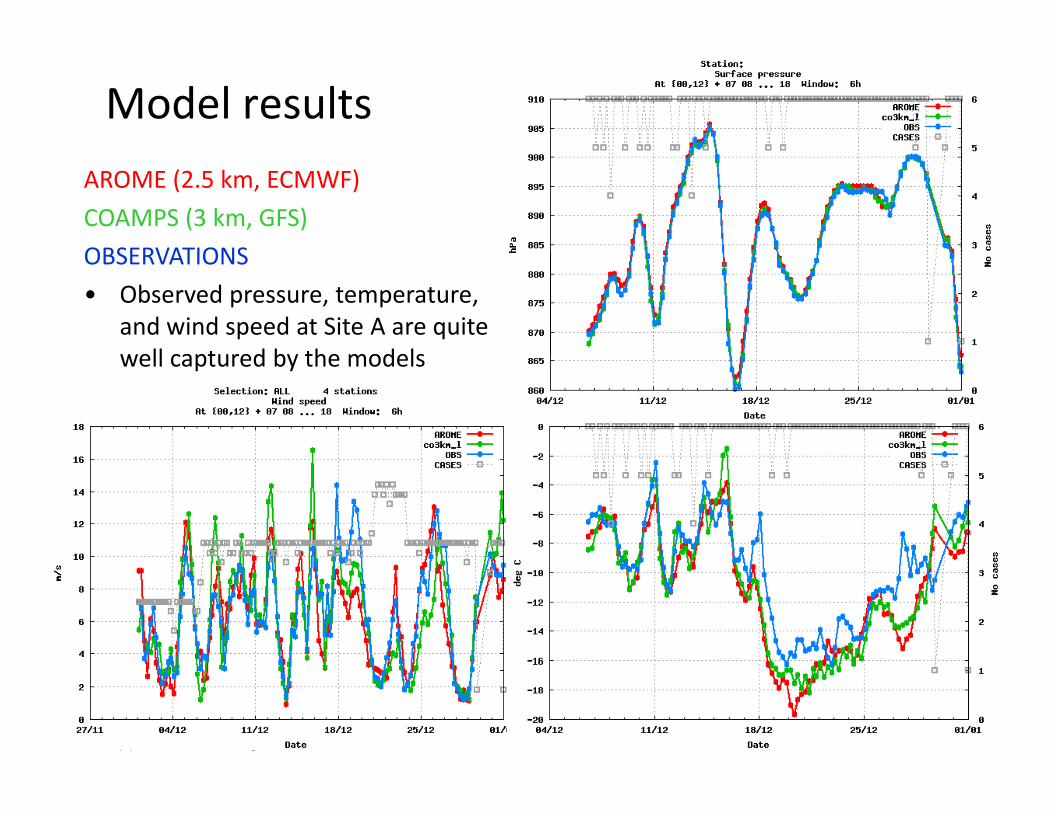
Model results
AROME (2.5 km, ECMWF)
COAMPS (3 km, GFS)
OBSERVATIONSOBSERVATIONS
• Observed pressure, temperature, and wind speed at Site A are quitewell captured by the models Pressurewell captured by the models Pressure
WindWind
Temperature
SMHIUppsala University Weathertech Scandinavia
p
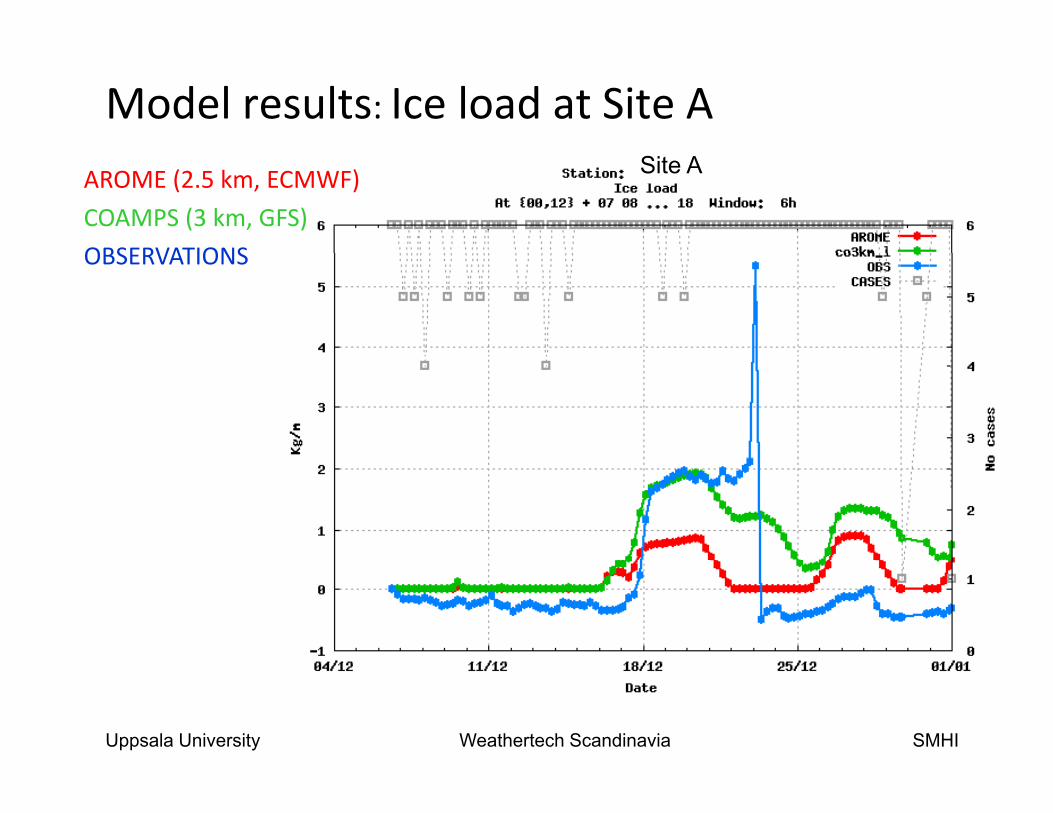
Model results: Ice load at Site ASite AAROME (2.5 km, ECMWF)
COAMPS (3 km, GFS)
OBSERVATIONSOBSERVATIONS
SMHIUppsala University Weathertech Scandinavia

Model results: Ice load at Site BSite BAROME (2.5 km, ECMWF)
COAMPS (3 km, GFS)
OBSERVATIONSOBSERVATIONS
SMHIUppsala University Weathertech Scandinavia
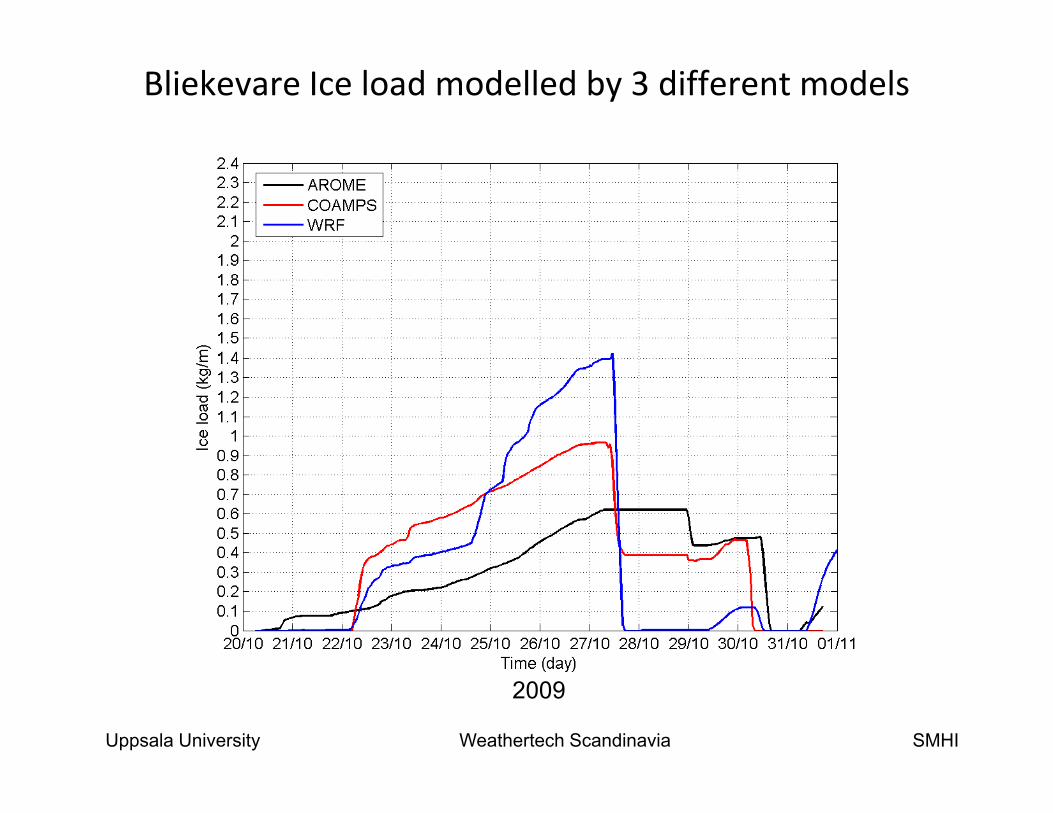
Bliekevare Ice load modelled by 3 different models
SMHIUppsala University Weathertech Scandinavia
2009

WRF: Ice load with 3 different microphysics schemes
SMHIUppsala University Weathertech Scandinavia
2009

WRF: Ice load with 3 different turbulence schemes
SMHIUppsala University Weathertech Scandinavia
2009

Ice load: 3 models, 1 model with different physics options
SMHIUppsala University Weathertech Scandinavia
2009

Where do we stand?
• COAMPS (GFS), WRF(GFS), and AROME(ECMWF)COAMPS (GFS), WRF(GFS), and AROME(ECMWF) capture observed pressure temperature, and wind
• Different models give different iceloadsg
• Altering PBL‐schemes in WRF can result in larger differences in iceload than using different modelsg
• We capture the events, however, we still have some issues with the magnitude of the iceload
• New methods to model icegrowth?
SMHIUppsala University Weathertech Scandinavia

Validation of icing measurements
• Compare theCompare the measurements with modelled ice loads
• Could modelled ice loads be used as a complement to icing measurements?
SMHIUppsala University Weathertech Scandinavia

Calculating the ice load from measurements
• Ice load is modelled withIce load is modelled with
• A simple estimation of w was used
• Some parameters were measured T WS• Some parameters were measured, T, WS
• Some parameters were assumed, Nc
SMHIUppsala University Weathertech Scandinavia
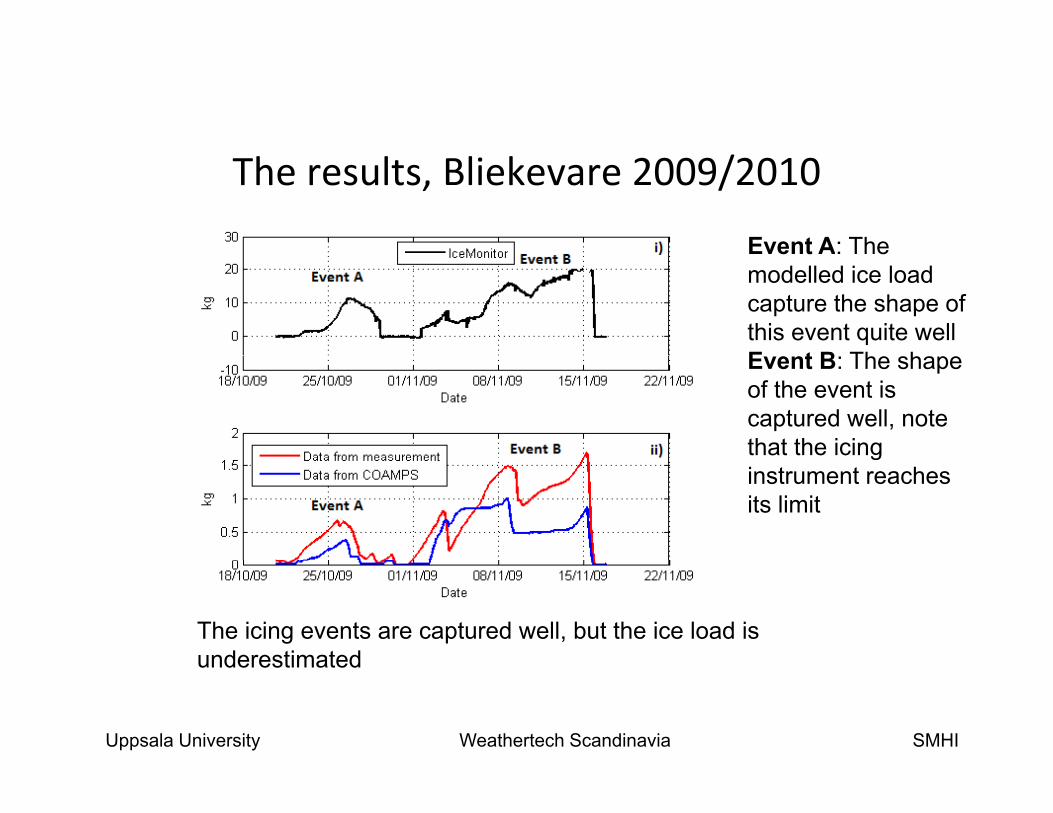
The results, Bliekevare 2009/2010
Event A: TheEvent A: The modelled ice load capture the shape of this event quite wellE t B Th hEvent B: The shape of the event is captured well, note that the icing ginstrument reaches its limit
The icing events are captured well, but the ice load is underestimated
SMHIUppsala University Weathertech Scandinavia
underestimated

The results, Bliekevare 2010/2011
Event A: The model
Event C
Event BEvent A: The model captures some of the eventEvent B: The ice
Event A
melts/falls off about the same time as the measured ice loadEvent C: The gap inEvent C: The gap in the measured ice load could be a fall off of the ice, the modelled ice l d f
Ice load not as severely underestimated, but accretion
load seems to perform rather well
SMHIUppsala University Weathertech Scandinavia
y ,shape not captured as well

Conclusions
• Modelling icing from meteorological measurementsModelling icing from meteorological measurements needs to be evaluated more
• Could be used as a compliment to ice load pmeasurements
SMHIUppsala University Weathertech Scandinavia