Embed Size (px)
Citation preview
American Economic Review 2014, 104(1): 1–28 http://dx.doi.org/10.1257/aer.104.1.1
1
Violence and Risk Preference: Experimental Evidence from Afghanistan†
By Michael Callen, Mohammad Isaqzadeh, James D. Long, and Charles Sprenger*
We investigate the relationship between violence and economic risk preferences in Afghanistan combining: (i) a two-part experimental procedure identifying risk preferences, violations of Expected Utility, and specific preferences for certainty; (ii) controlled recollection of fear based on established methods from psychology; and (iii) admin-istrative violence data from precisely geocoded military records. We document a specific preference for certainty in violation of Expected Utility. The preference for certainty, which we term a Certainty Premium, is exacerbated by the combination of violent exposure and controlled fearful recollections. The results have implications for risk taking and are potentially actionable for policymakers and marketers. (JEL A12, C91, D12, D74, D81, O12, O17)
Documenting and understanding the effects of trauma lie primarily in the medi-cal and psychiatric fields. Clinicians recognize that exposure to trauma can have complex and lasting effects on mental and physical health (Boscarino 2006; Yehuda 2002; Kessler et al. 1995), with additional consequences for socioeconomic out-comes (Brunello et al. 2001).1 Given the volume of trauma-affected individuals, there is reason to study the economic effects of trauma both for the design of policy and for delivering greater insight into decision making.
1 Post-Traumatic Stress Disorder (PTSD) is estimated to affect 5–6 percent of men and 10–14 percent of women in the United States at some point during their lives (Kessler et al. 1995; Yehuda 2002). Estimates from the National Vietnam Veterans Readjustment Survey indicate that the lifetime PTSD prevalence for veterans is much higher, 30.9 percent for males and 26.9 percent for females (Schlenger et al. 1992). The disorder is linked to depression, gen-eralized anxiety disorder, panic disorder, substance abuse, and health conditions including hypertension, asthma, and chronic pain syndrome (Kessler et al. 1995; Yehuda 2002). Comorbidity studies suggest that trauma leads to severe economic consequences related to psychiatric, psychosocial, and occupational impairments (Brunello et al. 2001).
AQ 1
* Callen: Department of Economics, University of California at San Diego, 9500 Gilman Drive, La Jolla, CA 92093 (e-mail: [email protected]); Isaqadeh: Department of Political Science, American University of Afghanistan, Darulaman Road, Kabul, Afghanistan; Long: Department of Political Science, University of California at San Diego, 9500 Gilman Drive, La Jolla, CA 92093 (e-mail: [email protected]); Sprenger: Department of Economics, Stanford University, Landau Economics Building, 579 Serra Mall, Stanford, CA 94305 (e-mail: [email protected]). We are grateful for the insightful comments of many colleagues, including James Andreoni, Doug Bernheim, Eli Berman, Gordon Dahl, Colonel Joseph Felter, Radha Iyengar, Uri Gneezy, David Lake, Craig McIntosh, Christopher Woodruff, and participants of the Stanford Institute for Theoretical Economics. We also acknowledge the generous support of the National Science Foundation grant #SES-1024683 (Sprenger) and grant #FA9550-09-1-0314 from the Air Force Office of Scientific Research (Callen). James Long was employed by Democracy International during the implementation of this project. IRB Approval for the collection of human subjects data was approved by the University of California San Diego.
† Go to http://dx.doi.org/10.1257/aer.104.1.1 to visit the article page for additional materials and author disclosure statement(s).
05_A20120294_1041.indd 1 10/23/13 10:46 AM
2 THE AMERICAN ECONOMIC REVIEW JANUARY 2014
Research in economics and psychology points to a potential relationship between trauma and the economic risk preferences central to decision making. Early life financial experiences such as the Great Depression are linked to more conservative later life investing behavior (Malmendier and Nagel 2011), potentially suggesting an increase in risk aversion.2 Artefactual field experiments from zones of natural disaster or conflict also suggest that exposed individuals’ risk preferences are altered (Eckel, Gamal, and Wilson 2009; Voors et al. 2012; Cameron and Shah 2010; Cassar, Healy, and von Kessler 2011).3 Though causality is difficult to establish—issues of mobility and selective migration present natural confounds—and a central stylized fact has yet to appear, such studies compellingly suggest that exposed individuals have their risk preferences lastingly changed.4
Psychology has taken a laboratory approach to investigating the relationship between trauma and risk. Though trauma cannot be experimentally adminis-tered, it can be experimentally recalled. Fitting into a broader agenda linking induced positive and negative affect to decision making (Isen and Geva 1987; Johnson and Tversky 1983; Lerner, Small, and Loewenstein 2004; Slovic and Peters 2006), one priming mechanism employed in the literature has been the controlled recollection of the fear associated with potentially traumatic episodes (Lerner and Keitner 2001; Lerner et al. 2003).5 These recollections induce fear in self-reports (Lerner and Keitner 2001; Lerner et al. 2003) and have startling effects on decision making under uncertainty. Fearful recollections induce more pessimistic likelihood judgements, and, in related studies, self-reported fear cor-relates with risk-averse choices in famous decisions such as the “Asian disease problem” (Lerner and Keitner 2001, Study 1).
In this paper, we combine three tools from psychology and economics to analyze the relationship between potentially traumatic experiences and risk preferences. First, we introduce an experimental procedure based on the uncertainty equivalents of Andreoni and Sprenger (2011), hypothetically eliciting risk preferences both at and away from certainty.6 Second, we conduct our experiments in Afghanistan, a nation with widespread exposure to violence, on a sample of 1,127 Afghan
2 A clear alternative, however, is that such experiences change beliefs about the process of returns. See Malmendier and Nagel (2011) for further discussion. Such evidence relates closely to genetic evidence indicating that though some heritability in risk preferences and financial behavior is observed, much of the variation remains unexplained (Cesarini et al. 2009, 2010; Kuhnen, Samanez-Larkin, and Knutson 2011).
3 While Eckel, Gamal, and Wilson (2009) and Voors et al. (2012) demonstrate increased risk tolerance after Hurricane Katrina and civil conflict in Burundi, Cameron and Shah (2010) and Cassar, Healy, and von Kessler (2011) demonstrate increased risk aversion after exposure to natural disasters.
4 Eckel, Gamal, and Wilson (2009) note that changed risk preferences appear to attenuate within one year, while Cameron and Shah (2010) document effects up to nine years after exposure. Sustained change in fundamental economic decision making carries the implication that economic consequences of broad-based exposure to trauma may be extremely large.
5 For example, after September 11th, 2001, Lerner et al. (2003) ask “The terrorist attacks evoked a lot of emotion in Americans. We are particularly interested in what makes you most AFRAID about the attacks. Please describe in detail the one thing that makes you most AFRAID about the attacks. Write as detailed a description of that thing as possible. If you can, write your description so that someone reading it might even get AFRAID from learning about the situation.”
6 Methods like the uncertainty equivalent were discussed in Farquhar’s (1984) excellent survey of utility assess-ment methods and were implemented experimentally in one study of nine subjects using hypothetical monetary rewards (McCord and de Neufville 1986), and a number of medical questionnaires (Magat, Viscusi, and Huber 1996; Oliver 2005, 2007; Bleichrodt et al. 2007).
05_A20120294_1041.indd 2 10/23/13 10:46 AM
3CALLEN ET AL.: VIOLENCE AND RISK PREFERENCEVOL. 104 NO. 1
civilians.7 We have access to detailed data on Afghanistan’s violent incidents from the International Security Assistance Force, with precise geocoded locations and timestamps of both successful and failed insurgent attacks. Third, we deploy in the field psychological methods that randomize the controlled recollection of fearful episodes. The design allows administrative and experimental data to be combined so that violence-affected and unaffected individuals can be compared with and without experimental primes. This may provide the necessary machinery to speak to the permanence of the effects of trauma on risk preferences and the potential triggering of specific risk-taking behaviors.
We document substantial differences between utility elicited under uncertainty and utility elicited under certainty. Individuals are systematically more risk averse under certainty compared to uncertainty. This baseline finding is in contradiction to Expected Utility, indicating a specific preference for certainty, which we term a Certainty Premium. Interestingly, the Certainty Premium is exacerbated by recol-lection of fearful events. A similar investigation of our administrative data indicates limited correlation between experimentally elicited preferences and administrative violence records. When exploring the interaction between violence and fear, we find the effects of fearful recollections are localized to those who have experienced vio-lence. Fearful recollections trigger changes in risk and certainty preferences specifi-cally for those individuals exposed to violence. The results are robust to a variety of alternate specifications exploiting only within-location variation, using self-reports of victimization and exploring issues of selective migration, social cohesion, and changing definitions and vintages of violence.
We point to two central implications of these findings. First, our data speak to the permanence of traumatic exposure’s influence on risk preference. Violence-exposed individuals may be altered, but it is the susceptibility of their behavior to priming triggers that is altered, not their risk preferences, per se. Second, if a specific pat-tern of behavior can be triggered for violence-exposed individuals, then this infor-mation is potentially actionable by both marketers and policymakers in product design and policy intervention.
The paper proceeds as follows: Section I presents our design combining utility elicitation procedures, priming mechanisms borrowed from psychology, and objec-tive violence data. Section II presents results, and Section III provides a discussion and conclusion.
I. Research Design
We describe our research design exploring exposure to violence and risk prefer-ences in three subsections. First, we present our utility elicitation device. Second, we discuss priming methods borrowed from psychology, manipulating trau-matic recollections. Third, we present our violence data obtained from objective military records.
7 In 2007, 1,523 civilian deaths were recorded in Afghanistan (UNAMA 2008). This number increased to 2,118 in 2008, 2,415 in 2009 and 2,777 in 2010 (UNAMA 2010). During this period, instability has spread from the south to the northern, eastern, and western regions of the country such that Afghans throughout the country have become exposed to violence.
AQ 2
05_A20120294_1041.indd 3 10/23/13 10:46 AM
4 THE AMERICAN ECONOMIC REVIEW JANUARY 2014
A. Utility Elicitation
Researchers have long been interested in eliciting utility and measuring risk aversion. A key contribution from experimental economics is the risk preference elicitation of Holt and Laury (2002). Subjects make a series of decisions between Option A, a safe binary gamble, and Option B, a risky binary gamble with more variable outcomes. As subjects proceed, the probability of the high outcome in each gamble moves from zero to one, such that the difference in expected value, EV(A) − EV(B), moves from positive to negative. Where a subject switches from preferring Option A to Option B carries interval information on his risk aversion. Resulting choices are often used to infer a parametric measure of risk aversion. That is, Expected Utility (EU) is imposed, a functional form for utility is assumed, and the shape of the utility function is calculated or estimated at either the group or individual level. Harrison and RutstrÖm (2008) provide a detailed summary of the estimation exercises associated with the Holt and Laury (2002) and similar tasks, such as those employed in the study of trauma (Voors et al. 2012; Eckel, Gamal, and Wilson 2009; Cameron and Shah 2010; Cassar, Healy, and von Kessler 2011).8
A potential difficulty in parametrically identifying utility values lies in the validity of the underlying EU assumptions. Particular attention should be given to the inde-pendence axiom and its implication of linearity-in-probabilities. Beginning with the Allais (1953) common-ratio and common-consequence paradoxes, research consis-tently demonstrates failures of linearity-in-probabilities (Kahneman and Tversky 1979; Tversky and Kahneman 1992; Tversky and Fox 1995), particularly in deci-sions involving certainty (Conlisk 1989; Camerer 1992; Harless and Camerer 1994; Starmer 2000). Behavioral decision theories accounting for these so-called “cer-tainty effects” have arisen, including Cumulative Prospect Theory (Kahneman and Tversky 1979; Tversky and Kahneman 1992), Disappointment Aversion (Bell 1985; Loomes and Sugden 1986; Gul 1991), and u–v preferences (Neilson 1992; Schmidt 1998; Diecidue, Schmidt, and Wakker 2004). Under these models, behavior in Holt and Laury (2002) tasks as well as those employed by Voors et al. (2012), Eckel, Gamal, and Wilson (2009), and Cameron and Shah (2010) is not attributable to util-ity function curvature alone. Hence, one cannot make unconfounded inference with respect to the relationship between trauma and risk preferences.
We introduce experimental methodology designed to elicit risk preferences, and to test the predictions of EU and competing behavioral models designed to accom-modate certainty effects. The task is a field-ready, two-question modification of the uncertainty equivalent presented in Andreoni and Sprenger (2011). Similar to the Holt and Laury (2002) task, subjects make a series of choices between a rela-tively safe Option A and a relatively risky Option B. However, in our task Option A is always a ( p, 1 − p) gamble over X and Y > X, ( p; X, Y ). The uncertainty
8 Cassar, Healy, and von Kessler (2011) implement four Holt and Laury (2002) tasks. Distinctions exist between the other implemented methods and the Holt and Laury (2002) task. Certainty does not play a role in the Holt and Laury (2002) task as individuals, with the exception of the last row, are always choosing between positive variance gambles. In Eckel, Gamal, and Wilson (2009) and Cameron and Shah (2010) individuals make a choice between six binary gambles, one of which pays the same in both states. Voors et al. (2012) implement a variant of a task implemented in Harbaugh, Krause, and Vesterlund (2010) where individuals make six choices between a changing certain amount and a 30 percent–70 percent gamble over a high outcome and zero.
05_A20120294_1041.indd 4 10/23/13 10:46 AM

5CALLEN ET AL.: VIOLENCE AND RISK PREFERENCEVOL. 104 NO. 1
equivalent identifies the (q, 1 − q) gamble over Y and 0, (q; Y, 0), that generates indifference by having Option B be a series of gambles, increasing in expected value, over Y and 0. Where a subject switches from preferring Option A to Option B carries interval information on his uncertainty equivalent, q. The method draws its motivation from the textbook treatment of expected utility, where the cardinal index for a gamble is derived as the probability mixture over the best and worst options in the space of gambles.9 The elicited q in (q; Y, 0) can be interpreted as a utility index for ( p; X, Y ) and can be used as a measure of risk aversion.
Task 1: Eliciting Utility under Uncertainty.—In Task 1, we fix p = 0.5. Under the EU framework, the uncertainty equivalent establishes the indifference condition
0.5 · v(X ) + 0.5 · v(Y ) = q · v(Y ) + (1 − q) · v(0).As EU is unique up to an affine transformation, we fix the values v(0) = 0 and v(Y ) = 1 and rearrange to obtain the utility of X,
(1) v(X ) U ≡ q − 0.5 _
0.5 ,
where the U subscript refers to the utility being elicited under uncertainty. Note that v(X ) U can be compared to a risk-neutral level, X/Y. A risk-neutral individual will exhibit v(X ) U = X/Y, a risk-averse individual will exhibit v(X ) U > X/Y, and a risk-loving individual will exhibit v(X ) U < X/Y. This is a nonparametric measure of risk aversion as v(X ) U values can be compared across individuals, but no assumptions are necessary for utility’s functional form.
Task 2: Eliciting Utility under Certainty.—In Task 2, we fix p = 1. Again, under the EU framework the uncertainty equivalent establishes the indifference condition
v(X ) = q′ · v(Y ) + (1 − q′ ) · v(0).We make the EU substitutions v(0) = 0 and v(Y ) = 1 to obtain
(2) v(X ) C ≡ q′ ,where the C subscript refers to the utility being elicited under certainty. This utility value again acts as a nonparametric measure of risk aversion.
Importantly, EU’s prediction of linearity-in-probabilities implies the equality
v(X ) U = v(X ) C
will hold. This is a critical prediction of EU’s independence axiom testable in the uncertainty equivalent environment.
9 See, e.g., Varian (1992).
05_A20120294_1041.indd 5 10/23/13 10:46 AM
6 THE AMERICAN ECONOMIC REVIEW JANUARY 2014
Alternative Preference Models.—Alternative preference models such as Cumulative Prospect Theory, Disappointment Aversion, and u–v preferences make differing predictions in uncertainty equivalents (Andreoni and Sprenger 2011). In our environment, these arguments reduce to sign predictions for the inequality between v(X ) U and v(X ) C . We define the signed distance between the two as
(3) Certaint y Premium ≡ v(X ) C − v(X ) U .
Note that the Certainty Premium, v(X ) C − v(X ) U , is defined in probability units of the high outcome, Y, such that one can refer to certainty of X being worth a specific percent chance of Y relative to its uncertain value. Of course, EU predicts Certainty Premium = 0. To preview the results, we present the following predictions:
(i) Cumulative Prospect Theory predicts v(X ) C < v(X ) U or Certainty Premium < 0 ;
(ii) Disappointment Aversion and u–v preferences predict v(X ) C > v(X ) U or Certainty Premium > 0.
To clarify the first prediction, we note that Cumulative Prospect Theory attributes violations of EU to a nonlinear probability weighting scheme.10 In the popularized version of the model considered here, it is argued that individuals “edit” probabili-ties, up-weighting low probabilities and down-weighting high probabilities, giving rise to an inverted S-shaped transformation, π( p). In Cumulative Prospect Theory, decision weights are applied to the higher outcome of a binary gamble and prob-abilities zero and one are unweighted. Identifying the S-shape of the weighting func-tion and determining its parameter values has received significant attention (Wu and Gonzalez 1996; Prelec 1998; Gonzalez and Wu 1999; Abdellaoui 2000).
As the literature has followed a primarily parametric path, we consider one form for Cumulative Prospect Theory popularized by Tversky and Kahneman (1992), π( p) = p γ /( p γ + (1 − p ) γ ) 1/γ , 0 < γ < 1, where γ represents the intensity of probability weighting. For ease of exposition and to foreshadow our implementa-tion, we assume linear utility, X = 1, and Y = 3, and the Tversky and Kahneman (1992) estimate of ̂ γ = 0.61 such that the Cumulative Prospect Theory indifference condition in Task 1 is written
(1 − π (0.5)) · 1 + π (0.5) · 3 = π (q) · 3 + (1 − π(q)) · 0.
We solve for v(X ) U as
v(X ) U = π −1 ( (1 − π (0.5)) · 1 + π (0.5) · 3 __ 3 ) − 0.5 ___
0.5 = 0.81 − 0.5 _
0.5 = 0.62,
10 We abstract away from loss aversion around a fixed reference point that is part of the Cumulative Prospect Theory formulation. Further, we consider only one formulation of the nonlinear probability weighting, S-shaped probability distortions. Cumulative Prospect Theory can accommodate other versions of nonlinearity in probability including globally convex and globally concave distortions. Note these alternative formulations will not yield the same predictions as those developed here.
05_A20120294_1041.indd 6 10/23/13 10:46 AM
7CALLEN ET AL.: VIOLENCE AND RISK PREFERENCEVOL. 104 NO. 1
which can be compared to the risk-neutral level X/Y = 1/3 such that Cumulative Prospect Theory predicts risk aversion, v(X ) U > X/Y, under uncertainty.11
Interestingly, the risk-aversion prediction above is not maintained under certainty. Note that in Task 2 under our assumed forms, the Cumulative Prospect Theory indif-ference condition is written
1 = π( q′ ) · 3.
Hence,
v(X ) C = π −1 ( 1 _ 3 ) .
Importantly, under most functional forms for π( · ) considered in the literature, probabilities are neither up-weighted nor down-weighted for probabilities around 1/3. Hence, near risk neutrality should be expected. Indeed, under the Tversky and Kahneman (1992) weights, we predict v(X ) C = 0.33 such that under common func-tional forms and parameter values for Cumulative Prospect Theory
v(X ) C < v(X ) U ; Certaint y Premium < 0.
The prediction from Cumulative Prospect Theory is in contrast to the predic-tion for Disappointment Aversion and u–v preferences. These models both feature specific preferences for certainty in order to accommodate certainty effects. Under disappointment-averse preferences, the prospect of losses is eliminated at certainty, leading certainty to be preferred. Under u–v preferences, certainty per se yields a utility boost. Though in a richer environment such as that presented in Andreoni and Sprenger (2011) the two models can be distinguished, in the present environment they both generate the prediction that utility under certainty is greater than utility under uncertainty,
v(X ) C > v(X ) U ; Certaint y Pr emium > 0.
With our modified two-task uncertainty equivalent, we are able to provide mea-sures of risk aversion as well as test for violations of EU, provide some separation between competing non-EU decision theories, and generate a measure of the prefer-ence for certainty, Certainty Premium.
Implementation and Protocol.—Two uncertainty equivalent tasks were designed. These experimental tasks were placed in fixed order, Task 2 then Task 1, in a broad survey of household experiences, attitudes, and beliefs, administered to 2,027 respon-dents in 12 of Afghanistan’s 34 provincial centers from December 18–27, 2010.
In each task, subjects made a series of ten decisions between Option A, a fixed ( p; X, Y ) gamble, and Option B, a changing (q; Y, 0) gamble. The probability, q, increased from 0.1 to 1 through a task. The values of X and Y were chosen to be 150
11 Indeed, for all γ < 1 this relationship is maintained. Andreoni and Sprenger (2011) provide more detailed discussion as well as model predictions without appeal to specific functional forms and parameter values.
05_A20120294_1041.indd 7 10/23/13 10:46 AM
8 THE AMERICAN ECONOMIC REVIEW JANUARY 2014
and 450 Afghanis, respectively, corresponding to around one and three days’ wages in provincial centers (National Risk and Vulnerability Assessment 2005, 2007).
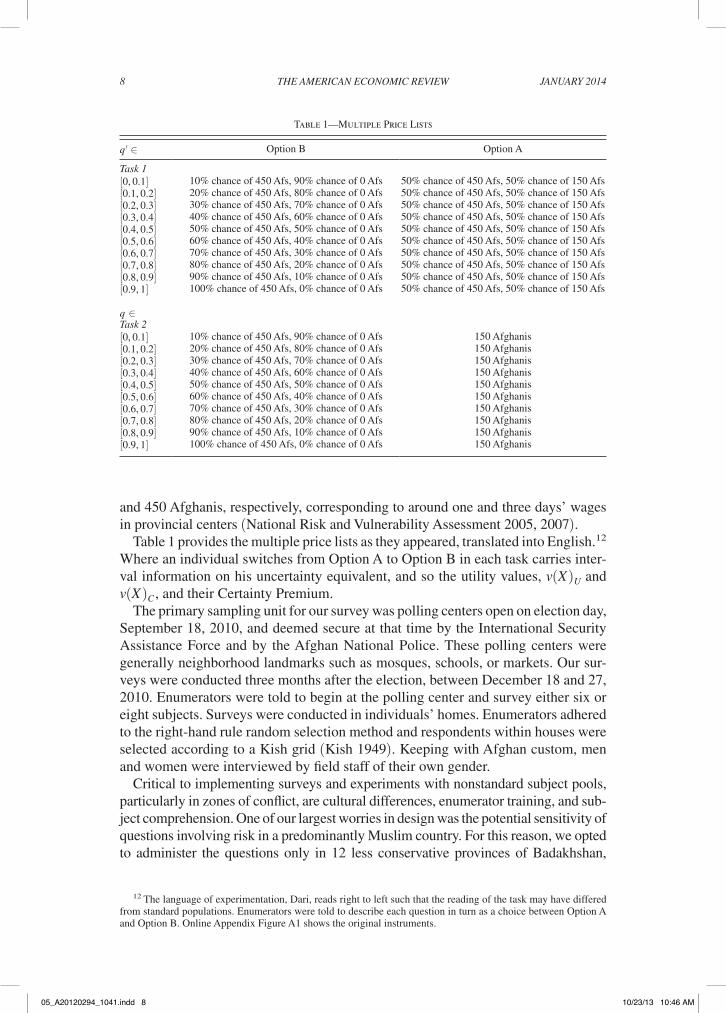
Table 1 provides the multiple price lists as they appeared, translated into English.12 Where an individual switches from Option A to Option B in each task carries inter-val information on his uncertainty equivalent, and so the utility values, v(X ) U and v(X ) C , and their Certainty Premium.
The primary sampling unit for our survey was polling centers open on election day, September 18, 2010, and deemed secure at that time by the International Security Assistance Force and by the Afghan National Police. These polling centers were generally neighborhood landmarks such as mosques, schools, or markets. Our sur-veys were conducted three months after the election, between December 18 and 27, 2010. Enumerators were told to begin at the polling center and survey either six or eight subjects. Surveys were conducted in individuals’ homes. Enumerators adhered to the right-hand rule random selection method and respondents within houses were selected according to a Kish grid (Kish 1949). Keeping with Afghan custom, men and women were interviewed by field staff of their own gender.
Critical to implementing surveys and experiments with nonstandard subject pools, particularly in zones of conflict, are cultural differences, enumerator training, and sub-ject comprehension. One of our largest worries in design was the potential sensitivity of questions involving risk in a predominantly Muslim country. For this reason, we opted to administer the questions only in 12 less conservative provinces of Badakhshan,
12 The language of experimentation, Dari, reads right to left such that the reading of the task may have differed from standard populations. Enumerators were told to describe each question in turn as a choice between Option A and Option B. Online Appendix Figure A1 shows the original instruments.
Table 1—Multiple Price Lists
q′ ∈ Option B Option A
Task 1[0, 0.1] 10% chance of 450 Afs, 90% chance of 0 Afs 50% chance of 450 Afs, 50% chance of 150 Afs[0.1, 0.2] 20% chance of 450 Afs, 80% chance of 0 Afs 50% chance of 450 Afs, 50% chance of 150 Afs[0.2, 0.3] 30% chance of 450 Afs, 70% chance of 0 Afs 50% chance of 450 Afs, 50% chance of 150 Afs[0.3, 0.4] 40% chance of 450 Afs, 60% chance of 0 Afs 50% chance of 450 Afs, 50% chance of 150 Afs[0.4, 0.5] 50% chance of 450 Afs, 50% chance of 0 Afs 50% chance of 450 Afs, 50% chance of 150 Afs[0.5, 0.6] 60% chance of 450 Afs, 40% chance of 0 Afs 50% chance of 450 Afs, 50% chance of 150 Afs[0.6, 0.7] 70% chance of 450 Afs, 30% chance of 0 Afs 50% chance of 450 Afs, 50% chance of 150 Afs[0.7, 0.8] 80% chance of 450 Afs, 20% chance of 0 Afs 50% chance of 450 Afs, 50% chance of 150 Afs[0.8, 0.9] 90% chance of 450 Afs, 10% chance of 0 Afs 50% chance of 450 Afs, 50% chance of 150 Afs[0.9, 1] 100% chance of 450 Afs, 0% chance of 0 Afs 50% chance of 450 Afs, 50% chance of 150 Afs
q ∈Task 2[0, 0.1] 10% chance of 450 Afs, 90% chance of 0 Afs 150 Afghanis[0.1, 0.2] 20% chance of 450 Afs, 80% chance of 0 Afs 150 Afghanis[0.2, 0.3] 30% chance of 450 Afs, 70% chance of 0 Afs 150 Afghanis[0.3, 0.4] 40% chance of 450 Afs, 60% chance of 0 Afs 150 Afghanis[0.4, 0.5] 50% chance of 450 Afs, 50% chance of 0 Afs 150 Afghanis[0.5, 0.6] 60% chance of 450 Afs, 40% chance of 0 Afs 150 Afghanis[0.6, 0.7] 70% chance of 450 Afs, 30% chance of 0 Afs 150 Afghanis[0.7, 0.8] 80% chance of 450 Afs, 20% chance of 0 Afs 150 Afghanis[0.8, 0.9] 90% chance of 450 Afs, 10% chance of 0 Afs 150 Afghanis[0.9, 1] 100% chance of 450 Afs, 0% chance of 0 Afs 150 Afghanis
05_A20120294_1041.indd 8 10/23/13 10:46 AM
9CALLEN ET AL.: VIOLENCE AND RISK PREFERENCEVOL. 104 NO. 1
Balkh, Bamyan, Daikondi, Faryab, Herat, Juzjan, Kabul, Kapisa, Panjshir, Parwan, and Samangan. Additionally, we had our interviewers read a fixed informed con-sent script, asking individuals if they were willing to answer a few questions about uncertain outcomes.13 Of the 2,027 respondents contacted, only 1,127 respondents consented to participate in the experimental component of the survey. Respondents therefore are from 278 polling center precincts. Of these 1,127 respondents 977 com-pleted both Task 1 and Task 2. Attrition from the experiment is discussed in detail in Subsection IIC. As in most consented experiments where respondents are allowed to select out, we naturally cannot claim that our sample is representative even of the nonrepresentatively selected neighborhoods where the survey took place. Hence, the treatment effects presented here should be thought of as those for the sample at hand and care should be taken when extrapolating to other environments.
A second major concern was the use of incentivized methods and safety. We chose to use hypothetical tasks as we determined, in collaboration with our field staff, that it was too dangerous for our survey enumerators to carry substantial sums on the street and were particularly worried about the potential for conflicts between respondents in the same neighborhood receiving different amounts. Though we can-not be sure of any potential bias induced by this choice, it clearly suggests the need for further research with incentivized payments. Importantly, we can compare the hypothetical responses of our subjects with the incentivized responses of Andreoni and Sprenger (2011) for qualitative differences in behavior.
A total of 247 enumerators were trained in the experimental methods in a series of four training sessions. These sessions provided enumerators with a script for explaining the tasks and a mechanism for visualizing the gambles for subjects.14
Additionally, the 38 survey supervisors for the project trained for two days with the authors, receiving both translated instruction from the US authors and direct instruc-tion in Dari from the Afghan author. Before deploying to the field, both supervisors and enumerators also carried out group mock elicitations to ensure proper explanation.
One potential way of measuring miscomprehension is to measure the proportion of individuals who switch from Option A to Option B more than once in a given price list. Such multiple switching is difficult to rationalize using standard theory and may indicate subject confusion. About 9.7 percent of our subjects switched more than once in Task 1, and 12.7 percent switched more than once in Task 2, while Holt and Laury (2002) document around 10 percent multiple switching from a standard subject pool. Another way of identifying miscomprehension is identify-ing individuals with nonmonotonic utility functions. That is, individuals for whom
13 The script read “We are interested in understanding how Afghans make decisions involving uncertain out-comes and some normal risks that people face every day. We would like to ask you some hypothetical questions that will help us understand these decisions. There is no real money involved and you will not receive any money for answering these questions. Are you willing to answer these questions?”
14 For example, when describing a gamble, enumerators were told to rip ten small pieces of paper, number them one to ten and place them in a bag. “When discussing the (1; 150, 450) gamble against the (q; 450, 0) gam-ble, they would describe it as follows: First we will ask you a hypothetical question over an amount for certain, or an amount that will be awarded depending on which of ten numbers you draw from a bag. We have deposited 10 cards numbered 1 through 10 into a bag. You have an even chance of drawing any of the 10 numbers. The numbers in parentheses indicate the winning numbers. For each Option No., please indicate whether you would prefer Choice A or Choice B. For each Option No. there will be 10 numbers in the bag and you are only able to draw one. This is not for real money and we are not asking you to make a gamble, we just want to understand how you would respond to naturally occurring risk.”
05_A20120294_1041.indd 9 10/23/13 10:46 AM
10 THE AMERICAN ECONOMIC REVIEW JANUARY 2014
v(X ) U = (q − 0.5)/0.5 < 0. Such behavior is exhibited by 12.9 percent of our subjects.15 87 respondents (8.9 percent of the sample completing the tasks) have both nonmonotonic utility functions and exhibit multiple switching on both tasks, consistent with miscomprehension. As these two behaviors both suggest failure to understand the experimental paradigm, our main analysis focuses on the 816 of 977 individuals who completed both tasks and did not multiply switch or exhibit non-monotonic utility. In Section IIC, we show that attrition from the sample of 977 is not associated with treatment.
B. Psychological Primes
Psychology has developed a series of methodologies for priming, the objective of which is to cue an emotional state or identification.
In a representative survey of 973 US individuals in the aftermath of September 11 conducted by Lerner et al. (2003), one-third of subjects were randomly asked to recall and write down the one thing about the event that made them the most fear-ful or anxious, one-third were asked what made them most angry, and one-third were asked what made them most sad. The evidence suggested that those primed with fear and anxiety in this way became more fearful in self-reports than the other groups and believed that terrorist attacks were substantially more likely.16 Given the documented effects and validation of the fearful recollections of trauma in both Lerner et al. (2003) and Lerner and Keitner (2001), we implemented small modifi-cations of these priming mechanisms.
Just prior to completing the utility elicitation tasks one-third of subjects at ran-dom were asked: “We are interested in understanding your daily experiences that may make you fearful or anxious. This could be anything, for example getting sick, experiencing violence, losing a job, etc. Could you describe one event in the past year that caused you fear or anxiety?” (FEAR)
Another third were asked: “We are interested in understanding your daily experi-ences that make you happy or joyous. This could be anything, for example birth of child, marriage of a relative, or success in your job. Could you describe an event in the past year that caused you happiness?” (HAPPY)
And another third were asked: “We are interested in understanding your general daily experiences. This could be anything. Could you describe an event from the past year.” (NEUTRAL)
15 This classification recognizes the interval nature of the uncertainty equivalent data. As individuals are not allowed to express indifference, we classify utility as monotonic if an individual switches at the fifth row, q′ ∈ [0.4, 0.5], or higher in Task 1. Importantly, in robustness tests we document that nonmonotonicities are uncor-related with either exposure to violence or priming. Further, the central results of Table 4 are maintained if we admit nonmonotonic individuals.
16 Using this method of priming, experimentally induced anger has also been validated and linked to more opti-mistic probability judgments and risk-tolerant choices (Lerner and Keitner 2001; Lerner et al. 2003). Though prior validation gives some measure of confidence in the use of recollection to prime a target emotion, much more work is needed in this vein before firm conclusions can be drawn either about the reliability of such priming mechanisms or their consequent effects on decision making. For recent discussion on the need for replication in psychological priming studies see Yong (2012).
05_A20120294_1041.indd 10 10/23/13 10:46 AM
11CALLEN ET AL.: VIOLENCE AND RISK PREFERENCEVOL. 104 NO. 1
Priming Protocol.—Primes were given to all individuals who agreed to the con-sent discussed above asking individuals if they were willing to answer questions on their daily experiences and on risky decisions.
In order to implement the randomized psychological primes, several baseline steps were taken to ensure randomness and maximize statistical power. First, following procedures from the field experimental literature (Bruhn and McKenzie 2009), we stratified our assignment of primes at the polling center level. Hence, we are able to provide within–polling center estimates, limiting the set of plausible alternatives for our interacted results to those operating on a small, and precise, geographic scale. Second, we implemented this stratified randomization by setting a random seed for each polling center. That is, the prime of the first survey was randomly set, and then a fixed order was followed such that HAPPY followed FEAR, NEUTRAL followed HAPPY, and FEAR followed NEUTRAL. This fixed pattern and random seeding helps to alleviate potential concerns about enumerators selectively altering the order of primes. Additionally, interviews were time stamped with an enumerator self-report. Of course, this does not fully remove threats to the randomization, so we added a standard random monitoring campaign with supervisors present for around 16 percent of all surveys and personally back-checking an additional 11 percent.
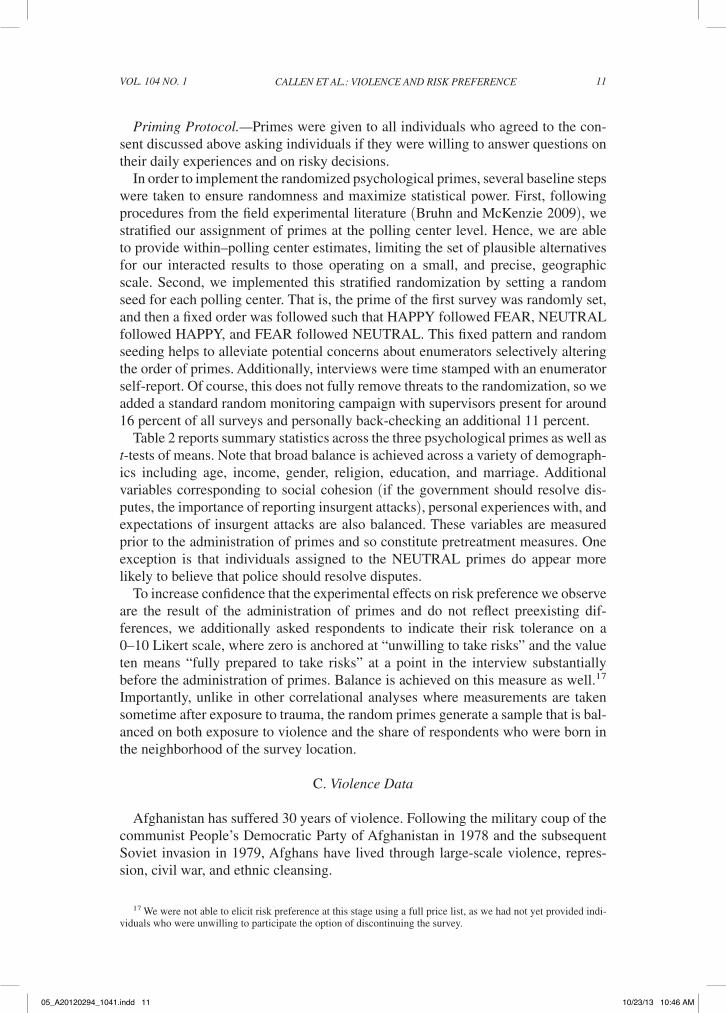
Table 2 reports summary statistics across the three psychological primes as well as t-tests of means. Note that broad balance is achieved across a variety of demograph-ics including age, income, gender, religion, education, and marriage. Additional variables corresponding to social cohesion (if the government should resolve dis-putes, the importance of reporting insurgent attacks), personal experiences with, and expectations of insurgent attacks are also balanced. These variables are measured prior to the administration of primes and so constitute pretreatment measures. One exception is that individuals assigned to the NEUTRAL primes do appear more likely to believe that police should resolve disputes.
To increase confidence that the experimental effects on risk preference we observe are the result of the administration of primes and do not reflect preexisting dif-ferences, we additionally asked respondents to indicate their risk tolerance on a 0–10 Likert scale, where zero is anchored at “unwilling to take risks” and the value ten means “fully prepared to take risks” at a point in the interview substantially before the administration of primes. Balance is achieved on this measure as well.17 Importantly, unlike in other correlational analyses where measurements are taken sometime after exposure to trauma, the random primes generate a sample that is bal-anced on both exposure to violence and the share of respondents who were born in the neighborhood of the survey location.
C. Violence Data
Afghanistan has suffered 30 years of violence. Following the military coup of the communist People’s Democratic Party of Afghanistan in 1978 and the subsequent Soviet invasion in 1979, Afghans have lived through large-scale violence, repres-sion, civil war, and ethnic cleansing.
17 We were not able to elicit risk preference at this stage using a full price list, as we had not yet provided indi-viduals who were unwilling to participate the option of discontinuing the survey.
05_A20120294_1041.indd 11 10/23/13 10:46 AM
12 THE AMERICAN ECONOMIC REVIEW JANUARY 2014
We focus our analysis on April 2002 to February 2010, a period for which we have precisely geocoded and timestamped data on violence. These data come from inci-dent records of the International Security Assistance Force, a multilateral military body present since December 2001, obtained through the Combined Information Data Network Exchange.
In addition to geocodes at five–decimal digit precision (accurate to within one meter at the equator), these data provide the time and type of the incident. In effect, these data capture all types of violence reported to the International Security
Table 2—Summary Statistics
NEUTRAL FEAR HAPPY t-test of:prime prime prime ( p-value)(1) (2) (3) (2)–(1) (3)–(1)
SociodemographicsAge 29.520 29.592 28.926 0.937 0.495
(0.648) (0.648) (0.576)Income (1,000 AFs) 12.994 12.303 12.395 0.409 0.445
(0.536) (0.648) (0.573)Female (= 1) 0.370 0.438 0.407 0.108 0.370
(0.029) (0.031) (0.030)Shia (= 1) 0.157 0.140 0.130 0.578 0.368
(0.022) (0.021) (0.020)Education (years) 9.719 9.796 10.004 0.834 0.442
(0.259) (0.261) (0.264)Married (= 1) 0.626 0.619 0.593 0.858 0.418
(0.029) (0.030) (0.030)Social cohesion and mobilityReporting insurgent activity important 0.496 0.525 0.474 0.521 0.637
(0.032) (0.032) (0.033)Police resolve disputes 0.249 0.189 0.189 0.089 0.088
(0.026) (0.024) (0.024)Courts resolve disputes 0.135 0.174 0.178 0.215 0.170
(0.020) (0.023) (0.023)Respondent born locally 0.786 0.781 0.800 0.880 0.696
(0.024) (0.025) (0.024)Administrative violenceViolence (= 1) 0.473 0.464 0.485 0.689 0.656
(0.030) (0.030) (0.030)Failed violence (= 1) 0.363 0.355 0.344 0.841 0.650
(0.029) (0.029) (0.029)Self-reported violenceSelf-reported attack (last five years) 0.242 0.223 0.233 0.594 0.812
(0.026) (0.026) (0.026)Expectations of future insurgent attack (0 –10) 3.491 3.438 3.544 0.818 0.820
(0.157) (0.172) (0.176)Baseline riskBaseline risk (0–10) 2.246 2.015 2.296 0.263 0.810
(0.142) (0.149) (0.158)Observations 281 265 270
Note: Standard errors reported in parentheses.
05_A20120294_1041.indd 12 10/23/13 10:46 AM
13CALLEN ET AL.: VIOLENCE AND RISK PREFERENCEVOL. 104 NO. 1
Assistance Force, including incidents in which the force was not directly engaged. These data identify eight types of incidents: direct fire, improvised explosive device explosions, indirect fire, mine strikes, suicide attacks, improvised explosive devices found and cleared, improvised explosive device hoaxes, and mines found and cleared. A total of 55,063 incidents are identified during our observation window.
We separate incidents into two groups. First, we define a Successful Attack as: direct fire, improvised explosive device explosions, indirect fire, mine strikes, and suicide attacks. Second, we define an Unsuccessful Attack as: improvised explosive devices found and cleared, improvised explosive device hoaxes, and mines found and cleared. Our data contain 45,463 Successful and 9,600 Unsuccessful Attacks.
As noted above, our experimental procedures were localized around specific poll-ing centers. Hence, we attach each incident to its nearest polling center with a one-kilometer halo. That is, if an incident is farther than one kilometer from any polling center it will not be used in the analysis, and if an incident lies within one kilometer of two polling centers, it will be attached to the nearer of the two. For our 278 polling centers, we are able to attach a total of 507 incidents, of which 363 were Successful Attacks and the remaining 144 were Unsuccessful Attacks.18 We discuss robustness to alternative assignment protocols in Section IIC.
As our primary measure of exposure to violence we define the indicator Violence, which takes the value one if there are one or more Successful Attacks attached to the polling center in the window of observation and zero otherwise. Roughly 47.5 percent of our sample has Violence = 1, indicating their polling center experi-enced a successful attack in our observation window.19
Unsuccessful Attacks provide the possibility to perform placebo tests. Under the assumption that the success or failure of an attack is random, then Unsuccessful Attacks can inform researchers as to whether it is the intention of violence or its realization that correlates with experimental behavior. We define the indicator Failed Violence, which takes the value one if there was one or more Unsuccessful Attacks attached to the polling center in the window of observation and zero otherwise. Roughly 35.4 percent of our sample has Failed Violence = 1.20
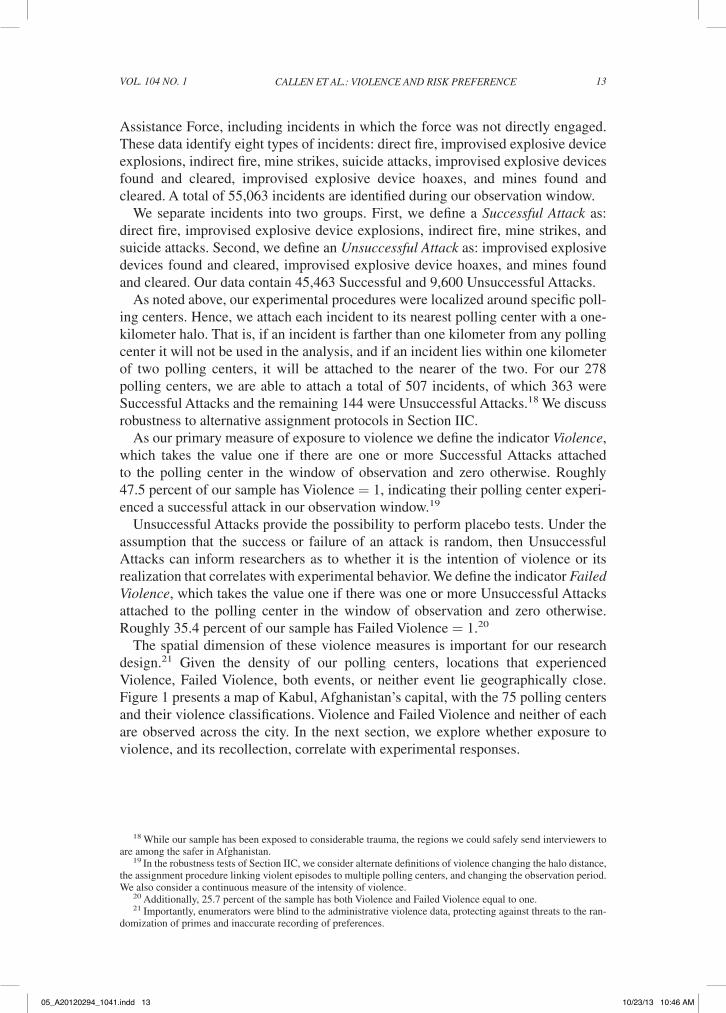
The spatial dimension of these violence measures is important for our research design.21 Given the density of our polling centers, locations that experienced Violence, Failed Violence, both events, or neither event lie geographically close. Figure 1 presents a map of Kabul, Afghanistan’s capital, with the 75 polling centers and their violence classifications. Violence and Failed Violence and neither of each are observed across the city. In the next section, we explore whether exposure to violence, and its recollection, correlate with experimental responses.
18 While our sample has been exposed to considerable trauma, the regions we could safely send interviewers to are among the safer in Afghanistan.
19 In the robustness tests of Section IIC, we consider alternate definitions of violence changing the halo distance, the assignment procedure linking violent episodes to multiple polling centers, and changing the observation period. We also consider a continuous measure of the intensity of violence.
20 Additionally, 25.7 percent of the sample has both Violence and Failed Violence equal to one.21 Importantly, enumerators were blind to the administrative violence data, protecting against threats to the ran-
domization of primes and inaccurate recording of preferences.
05_A20120294_1041.indd 13 10/23/13 10:46 AM
14 THE AMERICAN ECONOMIC REVIEW JANUARY 2014
II. Results
We present results in three subsections. We begin by documenting the levels of v(X ) U , v(X ) C , and Certainty Premium and explore their relationship with experimen-tal priming manipulations, objective measures of violence, and their combination. Second, we explore alternate explanations for our obtained results. Third, we provide more standard robustness tests related to decision error and definitions of violence.
A. Main Results
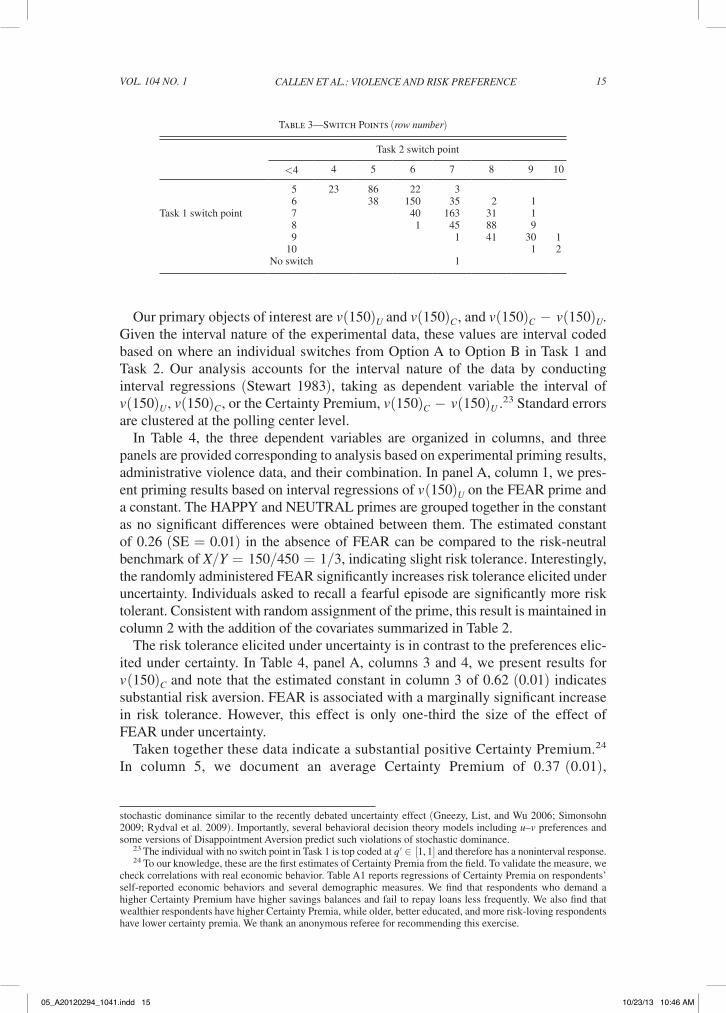
Table 3 presents the location of switch points for the sample of 816 individuals with monotonic utility and unique switch points in Task 1 and Task 2. Potentially due to the 10 percentage point intervals used, 63 percent of subjects switch at the same point in both Task 1 and Task 2.22
22 This behavior is similar to that observed in the risk-preference measures employed by Tanaka, Camerer, and Nguyen (2010) to identify probability weighting and utility function curvature where a large number of subjects switched at the same point in the two tasks from which inference was made. See Tanaka, Camerer, and Nguyen (2010) Figure 1 for detail. Here, as there, we attribute such behavior to preferences. Given the interval size, we hesitate to term such behavior an error. Importantly, neither primes nor exposure to violence predicts this behavior, and the results obtained in Table 4 are maintained if we examine only individuals with differing switch points. Note, as well, that we also don’t consider an error the behavior of having a higher switch point in Task 1 than Task 2. This behavior indicates a preference for a higher probability of a lower prize and so entails a violation of first-order
Figure 1. Successful Attacks and Unsuccessful Attacks in Kabul
05_A20120294_1041.indd 14 10/23/13 10:46 AM
15CALLEN ET AL.: VIOLENCE AND RISK PREFERENCEVOL. 104 NO. 1
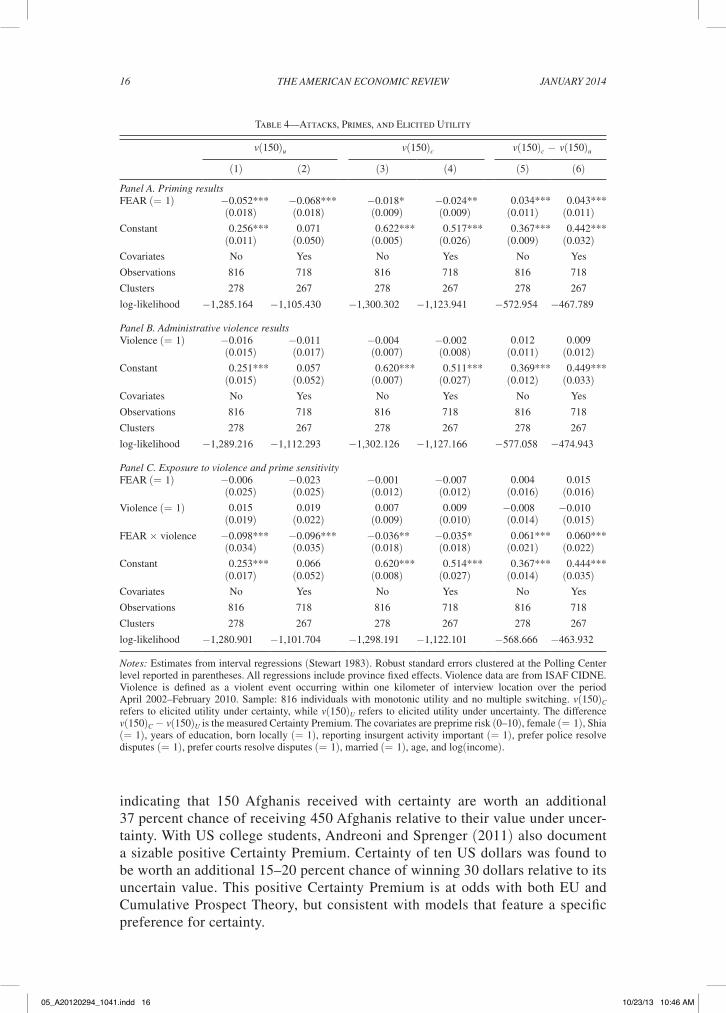
Our primary objects of interest are v (150 ) U and v (150 ) C , and v (150 ) C − v (150 ) U . Given the interval nature of the experimental data, these values are interval coded based on where an individual switches from Option A to Option B in Task 1 and Task 2. Our analysis accounts for the interval nature of the data by conducting interval regressions (Stewart 1983), taking as dependent variable the interval of v (150 ) U , v (150 ) C , or the Certainty Premium, v (150 ) C − v (150 ) U .23 Standard errors are clustered at the polling center level.
In Table 4, the three dependent variables are organized in columns, and three panels are provided corresponding to analysis based on experimental priming results, administrative violence data, and their combination. In panel A, column 1, we pres-ent priming results based on interval regressions of v (150 ) U on the FEAR prime and a constant. The HAPPY and NEUTRAL primes are grouped together in the constant as no significant differences were obtained between them. The estimated constant of 0.26 (SE = 0.01) in the absence of FEAR can be compared to the risk-neutral benchmark of X/Y = 150/450 = 1/3, indicating slight risk tolerance. Interestingly, the randomly administered FEAR significantly increases risk tolerance elicited under uncertainty. Individuals asked to recall a fearful episode are significantly more risk tolerant. Consistent with random assignment of the prime, this result is maintained in column 2 with the addition of the covariates summarized in Table 2.
The risk tolerance elicited under uncertainty is in contrast to the preferences elic-ited under certainty. In Table 4, panel A, columns 3 and 4, we present results for v (150 ) C and note that the estimated constant in column 3 of 0.62 (0.01) indicates substantial risk aversion. FEAR is associated with a marginally significant increase in risk tolerance. However, this effect is only one-third the size of the effect of FEAR under uncertainty.
Taken together these data indicate a substantial positive Certainty Premium.24 In column 5, we document an average Certainty Premium of 0.37 (0.01),
stochastic dominance similar to the recently debated uncertainty effect (Gneezy, List, and Wu 2006; Simonsohn 2009; Rydval et al. 2009). Importantly, several behavioral decision theory models including u–v preferences and some versions of Disappointment Aversion predict such violations of stochastic dominance.
23 The individual with no switch point in Task 1 is top coded at q′ ∈ [1, 1] and therefore has a noninterval response.24 To our knowledge, these are the first estimates of Certainty Premia from the field. To validate the measure, we
check correlations with real economic behavior. Table A1 reports regressions of Certainty Premia on respondents’ self-reported economic behaviors and several demographic measures. We find that respondents who demand a higher Certainty Premium have higher savings balances and fail to repay loans less frequently. We also find that wealthier respondents have higher Certainty Premia, while older, better educated, and more risk-loving respondents have lower certainty premia. We thank an anonymous referee for recommending this exercise.
Table 3—Switch Points (row number)Task 2 switch point
<4 4 5 6 7 8 9 10
5 23 86 22 3 6 38 150 35 2 1
Task 1 switch point 7 40 163 31 1 8 1 45 88 9 9 1 41 30 110 1 2
No switch 1
05_A20120294_1041.indd 15 10/23/13 10:46 AM
16 THE AMERICAN ECONOMIC REVIEW JANUARY 2014
indicating that 150 Afghanis received with certainty are worth an additional 37 percent chance of receiving 450 Afghanis relative to their value under uncer-tainty. With US college students, Andreoni and Sprenger (2011) also document a sizable positive Certainty Premium. Certainty of ten US dollars was found to be worth an additional 15–20 percent chance of winning 30 dollars relative to its uncertain value. This positive Certainty Premium is at odds with both EU and Cumulative Prospect Theory, but consistent with models that feature a specific preference for certainty.
Table 4—Attacks, Primes, and Elicited Utility
v(150 ) u v(150 ) c v(150 ) c − v(150 ) u (1) (2) (3) (4) (5) (6)
Panel A. Priming resultsFEAR (= 1) −0.052*** −0.068*** −0.018* −0.024** 0.034*** 0.043***
(0.018) (0.018) (0.009) (0.009) (0.011) (0.011)Constant 0.256*** 0.071 0.622*** 0.517*** 0.367*** 0.442***
(0.011) (0.050) (0.005) (0.026) (0.009) (0.032)Covariates No Yes No Yes No Yes
Observations 816 718 816 718 816 718
Clusters 278 267 278 267 278 267
log-likelihood −1,285.164 −1,105.430 −1,300.302 −1,123.941 −572.954 −467.789
Panel B. Administrative violence resultsViolence (= 1) −0.016 −0.011 −0.004 −0.002 0.012 0.009
(0.015) (0.017) (0.007) (0.008) (0.011) (0.012)Constant 0.251*** 0.057 0.620*** 0.511*** 0.369*** 0.449***
(0.015) (0.052) (0.007) (0.027) (0.012) (0.033)Covariates No Yes No Yes No Yes
Observations 816 718 816 718 816 718
Clusters 278 267 278 267 278 267
log-likelihood −1,289.216 −1,112.293 −1,302.126 −1,127.166 −577.058 −474.943
Panel C. Exposure to violence and prime sensitivityFEAR (= 1) −0.006 −0.023 −0.001 −0.007 0.004 0.015
(0.025) (0.025) (0.012) (0.012) (0.016) (0.016)Violence (= 1) 0.015 0.019 0.007 0.009 −0.008 −0.010(0.019) (0.022) (0.009) (0.010) (0.014) (0.015)FEAR × violence −0.098*** −0.096*** −0.036** −0.035* 0.061*** 0.060***
(0.034) (0.035) (0.018) (0.018) (0.021) (0.022)Constant 0.253*** 0.066 0.620*** 0.514*** 0.367*** 0.444***
(0.017) (0.052) (0.008) (0.027) (0.014) (0.035)Covariates No Yes No Yes No Yes
Observations 816 718 816 718 816 718
Clusters 278 267 278 267 278 267
log-likelihood −1,280.901 −1,101.704 −1,298.191 −1,122.101 −568.666 −463.932
Notes: Estimates from interval regressions (Stewart 1983). Robust standard errors clustered at the Polling Center level reported in parentheses. All regressions include province fixed effects. Violence data are from ISAF CIDNE. Violence is defined as a violent event occurring within one kilometer of interview location over the period April 2002–February 2010. Sample: 816 individuals with monotonic utility and no multiple switching. v(150)C refers to elicited utility under certainty, while v(150)U refers to elicited utility under uncertainty. The difference v(150)C − v(150)U is the measured Certainty Premium. The covariates are preprime risk (0–10), female (= 1), Shia (= 1), years of education, born locally (= 1), reporting insurgent activity important (= 1), prefer police resolve disputes (= 1), prefer courts resolve disputes (= 1), married (= 1), age, and log(income).
05_A20120294_1041.indd 16 10/23/13 10:46 AM
17CALLEN ET AL.: VIOLENCE AND RISK PREFERENCEVOL. 104 NO. 1
Table 4, panel B repeats the above analysis with the key independent variable being the presence of violent activity at the polling center level, Violence (= 1). Different results are obtained. No significant relationship between administratively measured violence and experimentally elicited risk preferences is observed.
In panel C of Table 4, we combine our data sources, examining the interacted effect of exposure to violence and being asked to recall fear-inducing episodes. Panel C indicates that FEAR without Violence and Violence without FEAR have limited effect on behavior. Individuals exposed to violence who are asked to recall these episodes drive the observed effects. These respondents are more risk toler-ant under uncertainty have significantly higher Certainty Premia. Violence exposed individuals, primed to recall fearful episodes, have Certainty Premia six percentage points larger than unexposed, unprimed individuals, indicating a 16 percent greater willingness-to-pay (in probability units of 450 Afs) for certainty.25
While we can interpret the coefficients of FEAR and FEAR × Violence as causal effects on two different subsamples, we cannot argue that violence is causing the difference in responses to priming. Violent incidents may be correlated with some other critical characteristic of the polling center, such as migration flows or local willingness to trust military personnel. In the presence of such confounds, it is still the case that the causal effect of priming on risk behavior is larger for violence-exposed individuals, but exposure may not be the reason why it is larger. We provide a battery of tests exploring alternative explanations for the difference in responses to priming in the next subsection.
B. Testing Alternative Explanations
This section reports further tests of whether the effect of violence on experimental behavior is mediated through recall. To begin, we exploit the stratification of experi-mental primes at the polling center precinct level to test the sensitivity of the results to estimation using only within-polling center variation. Any omitted correlate of violence causing individuals in violent neighborhoods to exhibit more sensitivity to FEAR, if it is not closely spatially correlated with patterns of violence, should cause our estimates to be sensitive to the inclusion of polling center fixed effects. Next, we exploit a feature of our data which allows us to identify unsuccessful attacks in order to perform placebo tests. Last, we directly examine a remaining set of plau-sible omitted correlates, such as migration, willingness to report attacks to military forces, and willingness to use the Afghan government to adjudicate disputes. These results add further support to the findings above.
Within–Polling Center Variation.—As a first consistency test, we present Table 5, which corresponds to panels A and C of Table 4.26 All regressions in Table 4 were
25 Further, we find that primed, exposed individuals have Certainty Premia that are 5.7 percentage points ( χ 2 = 20.83, p < 0.01) larger than primed, unexposed individuals and 6.9 percentage points larger ( χ 2 = 10.21, p < 0.01) than unprimed, exposed individuals. χ 2 values correspond to tests of the null hypothesis that the coef-ficients of FEAR and FEAR × Violence (= 1) are equal in panel C, column 5, and that the coefficients of Violence and FEAR × Violence (= 1) are equal in panel C, column 5, respectively.
26 As Violence is measured at the polling center precinct level, we cannot repeat the analysis in panel B of Table 4 as the fixed effects are perfectly collinear with Violence. Additionally, when estimating the relation between
05_A20120294_1041.indd 17 10/23/13 10:46 AM
18 THE AMERICAN ECONOMIC REVIEW JANUARY 2014
estimated using within-province variation. As described in Section IB, we strati-fied the assignment of primes at the polling center level, which permits estimation of experimental effects using only within–polling center variation. Table 5 repeats specifications from panels A and C of Table 4 adding polling center fixed effects.27 If potential confounds that prevent interpreting the interaction terms as causal are not perfectly spatially correlated with violent incidents, then they should be sensitive to estimation using variation at a finer degree of spatial granularity. The results are robust to exploiting only within–polling center variation and, in places, the results grow more significant consistent with spatial stratification permitting the detection of smaller effects.
Placebo Tests of Failed Violence.—Our data allow us to identify unsuccessful attacks. These data serve two purposes. First, under the assumption that conditional on intent success is random, this provides a placebo test indicating whether it is the intention of
Violence × FEAR on Certainty Preference, Violence would be collinear with the polling center fixed effects and so is removed from regression.
27 As argued by Bruhn and McKenzie (2009), this approach is likely to provide a high-powered test of the effect of the prime because it relies on comparisons between individuals living in the same neighborhood. Because of this, it is also less likely that the result is due to chance.
Table 5—Attacks, Primes, and Elicited Utility
v(150 ) u v(150 ) c v(150 ) c − v(150 ) u (1) (2) (3) (4) (5) (6)
Panel A. Priming resultsFEAR (= 1) −0.059*** −0.077*** −0.020** −0.030*** 0.037*** 0.047***
(0.018) (0.018) (0.009) (0.009) (0.011) (0.010)Constant 0.320*** 0.029 0.624*** 0.507*** 0.305*** 0.463***
(0.084) (0.111) (0.043) (0.057) (0.051) (0.066)Covariates No Yes No Yes No Yes
Observations 816 718 816 718 816 718
log-likelihood −1,173.515 −985.089 −1,193.460 −1,005.554 −423.597 −317.696
Panel B. Exposure to violence and prime sensitivityFEAR (= 1) −0.017 −0.037 −0.007 −0.016 0.012 0.023
(0.025) (0.026) (0.013) (0.013) (0.015) (0.015)FEAR × Violence −0.083** −0.079** −0.027 −0.026 0.050** 0.047**
(0.035) (0.036) (0.018) (0.019) (0.021) (0.021)Constant 0.333*** 0.051 0.628*** 0.514*** 0.298*** 0.450***
(0.084) (0.111) (0.043) (0.057) (0.052) (0.066)Covariates No Yes No Yes No Yes
Observations 816 718 816 718 816 718
log-likelihood −1,170.730 −982.717 −1,192.323 −1,004.462 −420.812 −315.263
Notes: Estimates from interval regressions (Stewart 1983). Standard errors reported in parentheses. All regressions include Polling Center fixed effects. There are 278 polling centers in our sample. We do not include Violence in panel B as it is measured at the polling center level and so is perfectly collinear with the polling center fixed effects. Violence data are from ISAF CIDNE. Violence is defined as a violent event occurring within one kilometer of interview location over the period April 2002–February 2010. Sample: 816 individuals with monotonic utility and no multiple switching. v(150)C refers to elicited utility under certainty, while v(150)U refers to elicited utility under uncertainty. The differ-ence v(150)C − v(150)U is the measured Certainty Premium. The covariates are preprime risk (0–10), female (= 1), Shia (= 1), years of education, born locally (= 1), reporting insurgent activity important (= 1), prefer police resolve disputes (= 1), prefer courts resolve disputes (= 1), married (= 1), age, and log(income).
05_A20120294_1041.indd 18 10/23/13 10:46 AM
19CALLEN ET AL.: VIOLENCE AND RISK PREFERENCEVOL. 104 NO. 1
violence or its realization that has an impact on observed behavior. Second, these data allow for a restriction of plausible confounds. If the omitted correlate of violence which is driving vulnerability to primes is also correlated with the intention to attack, then we should find differential vulnerability to primes based on unsuccessful attacks as well.
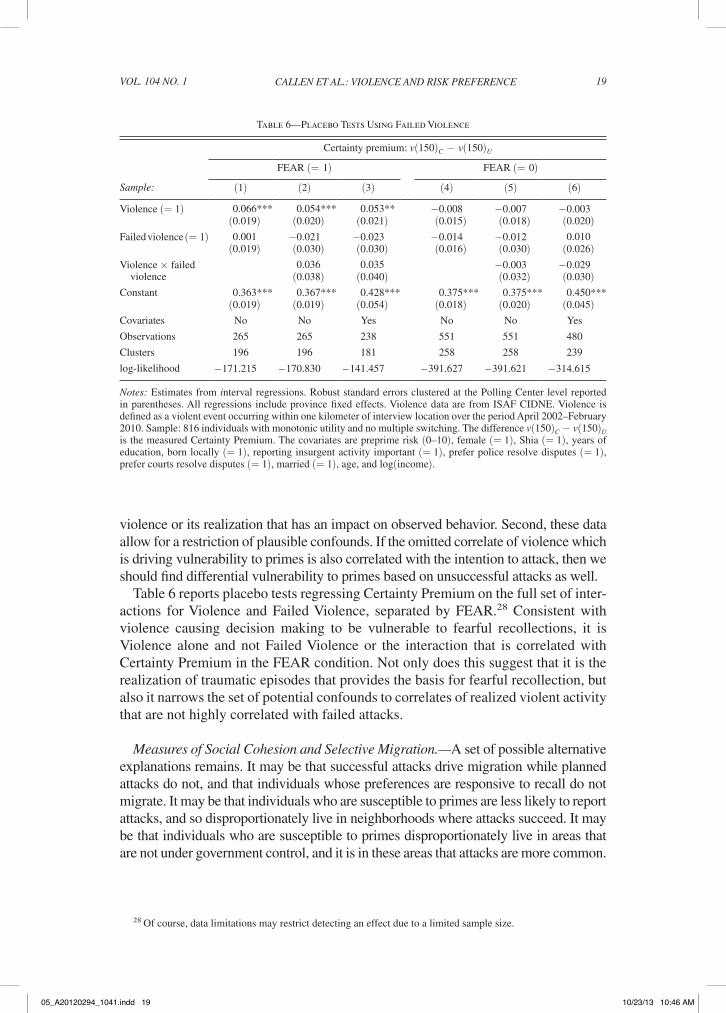
Table 6 reports placebo tests regressing Certainty Premium on the full set of inter-actions for Violence and Failed Violence, separated by FEAR.28 Consistent with violence causing decision making to be vulnerable to fearful recollections, it is Violence alone and not Failed Violence or the interaction that is correlated with Certainty Premium in the FEAR condition. Not only does this suggest that it is the realization of traumatic episodes that provides the basis for fearful recollection, but also it narrows the set of potential confounds to correlates of realized violent activity that are not highly correlated with failed attacks.
Measures of Social Cohesion and Selective Migration.—A set of possible alternative explanations remains. It may be that successful attacks drive migration while planned attacks do not, and that individuals whose preferences are responsive to recall do not migrate. It may be that individuals who are susceptible to primes are less likely to report attacks, and so disproportionately live in neighborhoods where attacks succeed. It may be that individuals who are susceptible to primes disproportionately live in areas that are not under government control, and it is in these areas that attacks are more common.
28 Of course, data limitations may restrict detecting an effect due to a limited sample size.
Table 6—Placebo Tests Using Failed Violence
Certainty premium: v(150 ) C − v(150 ) U
FEAR (= 1) FEAR (= 0)Sample: (1) (2) (3) (4) (5) (6)Violence (= 1) 0.066*** 0.054*** 0.053** −0.008 −0.007 −0.003(0.019) (0.020) (0.021) (0.015) (0.018) (0.020)Failed violence (= 1) 0.001 −0.021 −0.023 −0.014 −0.012 0.010
(0.019) (0.030) (0.030) (0.016) (0.030) (0.026)Violence × failed 0.036 0.035 −0.003 −0.029 violence (0.038) (0.040) (0.032) (0.030)Constant 0.363*** 0.367*** 0.428*** 0.375*** 0.375*** 0.450***
(0.019) (0.019) (0.054) (0.018) (0.020) (0.045)Covariates No No Yes No No Yes
Observations 265 265 238 551 551 480
Clusters 196 196 181 258 258 239
log-likelihood −171.215 −170.830 −141.457 −391.627 −391.621 −314.615
Notes: Estimates from interval regressions. Robust standard errors clustered at the Polling Center level reported in parentheses. All regressions include province fixed effects. Violence data are from ISAF CIDNE. Violence is defined as a violent event occurring within one kilometer of interview location over the period April 2002–February 2010. Sample: 816 individuals with monotonic utility and no multiple switching. The difference v(150 ) C − v(150 ) U is the measured Certainty Premium. The covariates are preprime risk (0–10), female (= 1), Shia (= 1), years of education, born locally (= 1), reporting insurgent activity important (= 1), prefer police resolve disputes (= 1), prefer courts resolve disputes (= 1), married (= 1), age, and log(income).
05_A20120294_1041.indd 19 10/23/13 10:46 AM
20 THE AMERICAN ECONOMIC REVIEW JANUARY 2014
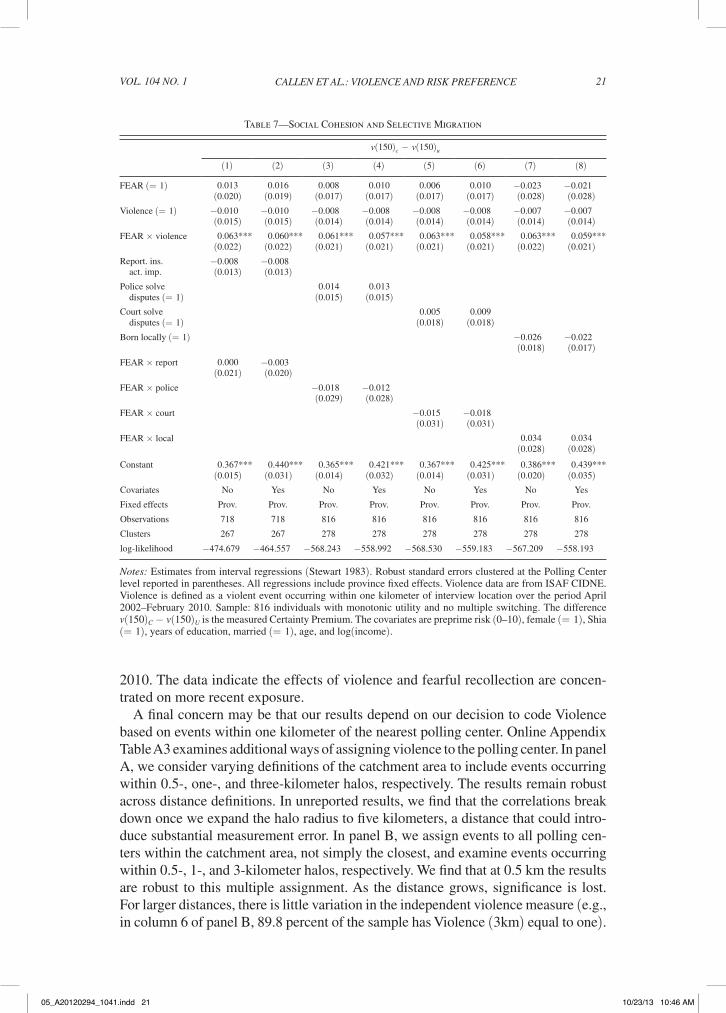
All three potential confounds share the feature that individuals selectively migrate or settle depending on violence, so the insensitivity of the results to the inclusion of polling center fixed effects reported in Table 5 already provides some evidence against their relevance. Importantly, our data provide additional opportunities to test these hypotheses as we are able to measure social cohesion, the importance of reporting attacks, and migration.
In Table 7, we provide tests of these competing accounts. In regressions of Certainty Premium, we sequentially interact FEAR both with Violence and can-didate omitted variables including whether individuals feel that reporting a terror attack is important, whether they use the formal police or court system to resolve disputes, and whether they were born in the neighborhood of the survey.29 The coef-ficient on the interaction between Violence and FEAR remains strongly significant, and the magnitude is virtually unchanged, suggesting that the effect of FEAR is different according to exposure to violence and not according to these confounds.
The tests to here remain consistent with the conclusion that violent exposure cre-ates a triggerability in decision making of traumatic recollections. The results are retained when relying on within–polling center variation, find support in placebo tests employing Failed Violence, and are robust to potential alternative stories rely-ing on selective migration and settlement. In the following section, we consider more traditional robustness tests.
C. Robustness Tests
This section addresses three additional concerns for the main results reported in Table 4. First, it may be that results hinge on this particular definition of Violence. We test the robustness of our results to measuring the intensity of violence, chang-ing the catchment area halo from 0.5 km to 3 km, allowing violent episodes to be linked to multiple polling centers, and changing vintages of violence. Second, the recollection of fearful episodes may be mentally taxing and so cause respondents to respond erratically in the experiment. Third, it may be that, because the FEAR prime raises a sensitive and uncomfortable issue, more risk-averse respondents select to discontinue participation, driving the result. We test each of these concerns in turn.
Definition and Vintage of Violence.—So far, we have measured violence as whether or not an attack occurred in our observation window. To investigate the importance of violence intensity, we construct a normalized violence intensity measure as the number of local attacks divided by 56, which is the maximum number of attacks in any polling center in our sample. Online Appendix Table A2, panel A repeats the estimations of Table 4 replacing the Violence dummy with our violence intensity measure. As in Table 4, for more severely exposed individuals fearful recollections increase Certainty Premia.
Online Appendix Table A2, panel B separates violence by time period, April 2002 to September 2005, October 2005 to December 2007, and January 2008 to February
29 Note that one of these questions, whether reporting insurgent activity is important, appeared to be particularly sensitive as 98 of 816 subjects declined to answer. Unlike the other tables of results where the covariate list is com-plete, Table 7 omits the other social cohesion variables when estimating.
05_A20120294_1041.indd 20 10/23/13 10:46 AM
21CALLEN ET AL.: VIOLENCE AND RISK PREFERENCEVOL. 104 NO. 1
2010. The data indicate the effects of violence and fearful recollection are concen-trated on more recent exposure.
A final concern may be that our results depend on our decision to code Violence based on events within one kilometer of the nearest polling center. Online Appendix Table A3 examines additional ways of assigning violence to the polling center. In panel A, we consider varying definitions of the catchment area to include events occurring within 0.5-, one-, and three-kilometer halos, respectively. The results remain robust across distance definitions. In unreported results, we find that the correlations break down once we expand the halo radius to five kilometers, a distance that could intro-duce substantial measurement error. In panel B, we assign events to all polling cen-ters within the catchment area, not simply the closest, and examine events occurring within 0.5-, 1-, and 3-kilometer halos, respectively. We find that at 0.5 km the results are robust to this multiple assignment. As the distance grows, significance is lost. For larger distances, there is little variation in the independent violence measure (e.g., in column 6 of panel B, 89.8 percent of the sample has Violence (3km) equal to one).
Table 7—Social Cohesion and Selective Migration
v(150 ) c − v(150 ) u (1) (2) (3) (4) (5) (6) (7) (8)
FEAR (= 1) 0.013 0.016 0.008 0.010 0.006 0.010 −0.023 −0.021(0.020) (0.019) (0.017) (0.017) (0.017) (0.017) (0.028) (0.028)
Violence (= 1) −0.010 −0.010 −0.008 −0.008 −0.008 −0.008 −0.007 −0.007(0.015) (0.015) (0.014) (0.014) (0.014) (0.014) (0.014) (0.014)
FEAR × violence 0.063*** 0.060*** 0.061*** 0.057*** 0.063*** 0.058*** 0.063*** 0.059***(0.022) (0.022) (0.021) (0.021) (0.021) (0.021) (0.022) (0.021)
Report. ins. −0.008 −0.008 act. imp. (0.013) (0.013)Police solve 0.014 0.013 disputes (= 1) (0.015) (0.015)Court solve 0.005 0.009 disputes (= 1) (0.018) (0.018)Born locally (= 1) −0.026 −0.022
(0.018) (0.017)FEAR × report 0.000 −0.003
(0.021) (0.020)FEAR × police −0.018 −0.012
(0.029) (0.028)FEAR × court −0.015 −0.018
(0.031) (0.031)FEAR × local 0.034 0.034
(0.028) (0.028)Constant 0.367*** 0.440*** 0.365*** 0.421*** 0.367*** 0.425*** 0.386*** 0.439***
(0.015) (0.031) (0.014) (0.032) (0.014) (0.031) (0.020) (0.035)Covariates No Yes No Yes No Yes No Yes
Fixed effects Prov. Prov. Prov. Prov. Prov. Prov. Prov. Prov.
Observations 718 718 816 816 816 816 816 816
Clusters 267 267 278 278 278 278 278 278
log-likelihood −474.679 −464.557 −568.243 −558.992 −568.530 −559.183 −567.209 −558.193
Notes: Estimates from interval regressions (Stewart 1983). Robust standard errors clustered at the Polling Center level reported in parentheses. All regressions include province fixed effects. Violence data are from ISAF CIDNE. Violence is defined as a violent event occurring within one kilometer of interview location over the period April 2002–February 2010. Sample: 816 individuals with monotonic utility and no multiple switching. The difference v(150)C − v(150)U is the measured Certainty Premium. The covariates are preprime risk (0–10), female (= 1), Shia (= 1), years of education, married (= 1), age, and log(income).
05_A20120294_1041.indd 21 10/23/13 10:46 AM
22 THE AMERICAN ECONOMIC REVIEW JANUARY 2014
Decision Error.—Recalling a violent episode may be cognitively difficult and so drive respondents to systematically misunderstand the choice tasks used to elicit risk preferences. This problem may be particularly salient in Afghanistan, where literacy, especially for women, is among the lowest in the world.30 We analyze two possible indicators for miscomprehension, multiple switching and exhibiting nonmonotonic utility. Columns 1– 4 of online Appendix Table A4 report results from regressions of an indicator variable equal to one for respondents switching multiple times in either choice Task 1 or 2 on FEAR and FEAR interacted with Violence. Columns 5–8 repeat columns 1–4 replacing the dependent variable with an indicator variable equal to 1 for respondents exhibiting nonmonotonic utility. We find no significant differences in deci-sion error according to treatment status in any specification. However, with only about 10 percent of respondents exhibiting such errors, these tests may be underpowered.
Attrition.—Of the 1,127 respondents who consented to questioning about risk, 144 (12.7 percent) did not complete the first task in the protocol and an additional six respondents failed to complete the second task. This poses a problem for our result if the attrition is systematically linked to the prime since we would be measur-ing different portions of the primed and unprimed sample. Table A5 demonstrates that attrition is not systematically linked to priming by regressing an indicator for attrition on FEAR, Violence, and their interaction.
III. Discussion and Conclusion
Our results demonstrate that individuals exposed to violence, when primed to recall fear, exhibit an increased preference for certainty. Understanding the channels by which these effects manifest is a key challenge. Though a full understanding of mechanisms lies beyond our data, we discuss three sets of results which may high-light potential avenues of operation and spur future research.
First, our robustness tests already suggest an operative role for the intensity and vintage of violence. More intense and more recent exposure to violence are more likely to generate a triggerability in risk preference. Beyond these disaggrega-tions, we can also separate the data by the type of violent episode. Such analysis shows that plausibly more impactful episodes, such as improvised explosive device explosions and mine strikes, lead to greater priming effects than small arms fire.31 If the intensity, recency and impact of exposure all yield greater effects of priming, then researchers may be able to forecast based on these channels who will and will not be susceptible.
Second, our findings to here have revolved around administrative records mea-suring violence at the neighborhood level. Though administrative records such as ours are valuable for their precision, they cannot speak to specifically personal
30 According to year 2000 estimates the CIA World Factbook, 43.1 percent of males, 12.6 percent of females, and 28.1 percent of the total population over 15 can read and write. An earlier survey in our sample of polling cen-ters indicate that 30.3 percent of male respondents and 23.21 of female respondents are literate.
31 See Table A6 for detail. One critical drawback of our data is we do not have access to casualty statistics, which would allow for a direct measure of the potential impact of a given attack. Improvised explosive device strikes tend to result in higher civilian casualties than direct fire attacks because they do not target government forces precisely (Berman et al. 2011).
05_A20120294_1041.indd 22 10/23/13 10:46 AM
23CALLEN ET AL.: VIOLENCE AND RISK PREFERENCEVOL. 104 NO. 1
experience. In our survey individuals were asked whether they had experienced an insurgent attack. Twenty-three percent of our 816 subjects, balanced across primes, report positively regarding the last five years.32 When conducting our core anal-ysis based on these self-reported measures, broadly similar, though less precise, results are obtained.33 Though comparisons of effect sizes across measures with different degrees of error would be imprudent, these results indicate that personal self-reported experience, per se, does not yield larger effects than administratively measured neighborhood violence.
Third, one potential avenue of operation is expectations of violence. Individuals’ expectations may change due to recollection, potentially leading to increased cer-tainty premia. As we measure expectations of violence prior to the prime, we can only indirectly test this avenue. Consistent with this channel, we find that respon-dents living in violent neighborhoods believe that violence is more likely.34 However expectations have only limited correlation with measured certainty premia. Further, when we examine our core treatment effects separated by levels of expectation, we find insignificant results.35 A more convincing test of expectations as the operative channel requires measuring the response of both expectations and risk preferences to primes among violence-affected populations.
Our findings on intensity and recency of experience suggest operative channels based on the salience of events. However, a clear gap between the present research and a full understanding of mechanisms is why fearful recollections should lead to increased cer-tainty premia in the first place. An intuition generated from psychology is provided by Lerner and Keitner (2001), who note “the sense of uncertainty and lack of control asso-ciated with fear should lead fearful individuals to make risk-averse (certainty enhanc-ing) choices.” Fear-induced individuals may exhibit a preference for certainty to exert control. Focusing on control seems an important avenue for understanding violence, risk, and certainty preferences. In addition to the apparent links between fear, control, and risk attitudes (Lerner and Keitner 2001; Lerner et al. 2003), evidence from trauma-affected individuals such as combat veterans indicate key relationships between experi-enced violence, perceived loci of control and stress disorders (Casella and Motta 1990; Frye and Stockton 1982; Hyer et al. 1987; Solomon, Mikulincer, and Benbenishty 1989; Solomon and Mikulincer 1990; Solomon, Mikulincer, and Avitzur 1988).
We note two implications of our results. First, prior correlational studies carry with them the implication that individual risk preferences are potentially lastingly altered. Our work demonstrates the importance of both recency of violence and of recollections. Individuals with violent exposure may be changed for a period of time, but what changes is not necessarily their risk preferences, but rather the sus-ceptibility of their behavior to fearful recollections.
32 Self-reports of violence show some signs of underreporting, consistent with clinical view of reluctance to discuss violent episodes as a symptom of PTSD (Yehuda 2002). To provide a sense, 34 percent of respondents liv-ing in neighborhoods with an ISAF record of violence report no attack, while only 9 percent of respondents with no ISAF record of violence report an attack. While underreporting is only one potential explanation for this difference, it is statistically significant ( p < 0.01).
33 See online Appendix Table A7 for detail.34 Respondents living in violent neighborhoods have forecasts which are 0.28 standard deviations higher than
those in non-violent neighborhoods ( p < 0.05).35 Given our small sample size, we have limited power to test for effects by subgroups within the violence-
affected sample.
05_A20120294_1041.indd 23 10/23/13 10:46 AM
24 THE AMERICAN ECONOMIC REVIEW JANUARY 2014
Second, if fearful recollections trigger a specific profile of behavior, then our results point to the actionability of recall mechanisms. Marketers, policymakers, and others interacting with trauma-affected individuals may be able to trigger spe-cific behaviors. As our observed behavior indicates individuals being willing to pay incrementally more for certainty when triggered, one can imagine close analogs in financial decision making such as insurance purchasing and portfolio choice. Trauma-affected individuals are known to have broadly worse economic outcomes, and so future research should explore triggering mechanisms that may generate such phenomena and policy interventions that may reduce negative outcomes.
REFERENCES
Abdellaoui, Mohammed. 2000. “Parameter-Free Elicitation of Utility and Probability Weighting Func-tions.” Management Science 46 (11): 1497–1512.
Allais, Maurice. 1953. “Le Comportement de l’Homme Rationnel devant le Risque: Critique des Pos-tulats et Axiomes de l’Ecole Americaine.” Econometrica 21 (4): 503–46.
Andreoni, James, and Charles Sprenger. 2011. “Uncertainty Equivalents: Testing the Limits of the Independence Axiom.” Unpublished.
Bell, David E. 1985. “Disappointment in Decision Making under Uncertainty.” Operations Research 33 (1): 1–27.
Berman, Eli, Michael Callen, Joseph H. Felter, and Jacob N. Shapiro. 2011. “Do Working Men Rebel? Insurgency and Unemployment in Afghanistan, Iraq, and the Philippines.” Journal of Conflict Uncertainty 55 (4): 496–528.
Bleichrodt, Han, Jose Maria Abellan-Perpiñan, Jose Luis Pinto-Prades, and Ildefonso Mendez-Marti-nez. 2007. “Resolving Inconsistencies in Utility Measurement Under Risk: Tests of Generalizations of Expected Utility.” Management Science 53 (3): 469–82.
Boscarino, Joseph A. 2006. “Posttraumatic Stress Disorder and Mortality among US Army Veterans 30 Years after Military Service.” Annals of Epidemiology 16 (4): 248–56.
Bruhn, Miriam, and David McKenzie. 2009. “In Pursuit of Balance: Randomization in Practice in Devel-opment Field Experiments.” American Economic Journal: Applied Economics 1 (4): 200–232.
Brunello, Nicoletta, Johnathan R. T. Davidson, Martin Deahl, Ron C. Kessler, Julien Mendlewicz, Giorgio Racagni, Arieh Y. Shalev, and Joseph Zohar. 2001. “Posttraumatic Stress Disorder: Diag-nosis and Epidemiology, Comorbidity and Social Consequences, Biology and Treatment.” Neuro-psychobiology 43 (3): 150–162.
Callen, Michael, Mohammad Isaqzadeh, James D. Long, and Charles Spenger. 2014. “Violence and Risk Preference: Experimental Evidence from Afghanistan: Dataset.” American Economic Review. http://dx.doi.org/10.1257/aer.104.1.XX.
Camerer, Colin F. 1992. “Recent Tests of Generalizations of Expected Utility Theory.” In Utility The-ories: Measurement and Applications, edited by Ward Edwards, 207–51. Norwell, MA: Kluwer.
Cameron, Lisa, and Manisha Shah. 2010. “Risk-Taking Behavior in the Wake of Natural Disasters.” Unpublished.
Casella, Lauraine, and Robert W. Motta. 1990. “Comparison of Characteristics of Vietnam Veterans with and without Posttraumatic Stress Disorder.” Psychological Reports 67 (2): 595–605.
Cassar, Alessandra, Andrew Healy, and Carl von Kessler. 2011. “Trust, Risk, and Time Preferences after a Natural Disaster: Experimental Evidence from Thailand.” Unpublished.
Cesarini, David, Christopher T. Dawes, Magnus Johannesson, Paul Lichtenstein, and Bjorn Wallace. 2009. “Genetic Variation in Preferences for Giving and Risk Taking.” Quarterly Journal of Econom-ics 124 (2): 809–42.
Cesarini, David, Magnus Johannesson, Paul Lichtenstein, Orjan Sandewall, and Bjorn Wallace. 2010. “Genetic Variation in Financial Decision-Making.” Journal of Finance 65 (5): 1725–54.
Conlisk, John. 1989. “Three Variants on the Allais Example.” American Economic Review 79 (3): 392–407.
Diecidue, Enrico, Ulrich Schmidt, and Peter P. Wakker. 2004. “The Utility of Gambling Reconsid-ered.” Journal of Risk and Uncertainty 29 (3): 241–59.
Eckel, Catherine C., Mahmoud A. El-Gamal, and Rick K. Wilson. 2009. “Risk Loving after the Storm: A Bayesian-Network Study of Hurricane Katrina Evacuees.” Journal of Economic Behavior and Organization 69 (2): 110–24.
05_A20120294_1041.indd 24 10/23/13 10:46 AM
25CALLEN ET AL.: VIOLENCE AND RISK PREFERENCEVOL. 104 NO. 1
Farquhar, Peter H. 1984. “Utility Assessment Methods.” Management Science 30 (11): 1283–1300.Frye, J. Stephen, and Rex A. Stockton. 1982. “Discriminant Analysis of Posttraumatic Stress Disorder
among a Group of Vietnam Veterans.” American Journal of Psychiatry 139 (1): 52–56.Gneezy, Uri, John A. List, and George Wu. 2006. “The Uncertainty Effect: When a Risky Pros-
pect Is Valued Less Than Its Worst Possible Outcome.” Quarterly Journal of Economics 121 (4): 1283–1309.
Gonzalez, Richard, and George Wu. 1999. “On the Shape of the Probability Weighting Function.” Cognitive Psychology 38 (1): 129–66.
Gul, Faruk. 1991. “A Theory of Disappointment Aversion.” Econometrica 59 (3): 667–86.Harbaugh, William T., Kate Krause, and Lise Vesterlund. 2010. “The Fourfold Pattern of Risk Atti-
tudes in Choice and Pricing Tasks.” Economic Journal 120 (545): 595–611.Harless, David W., and Colin F. Camerer. 1994. “The Predictive Utility of Generalized Expected Util-
ity Theories.” Econometrica 62 (6): 1251–89.Harrison, Glenn W., and E. Elisabet Rutström. 2008. “Risk Aversion in the Laboratory.” In Research
in Experimental Economics, Volume 12: Risk Aversion in Experiments, edited by James C. Cox and Glenn W. Harrison, 41–196. Bingley: Emerald.
Holt, Charles A., and Susan K. Laury. 2002. “Risk Aversion and Incentive Effects.” American Eco-nomic Review 92 (5): 1644–55.
Hyer, Lee, Patrick A. Boudewyns, William C. O’Leary, and William R. Harrison. 1987. “Key Deter-minants of the MMPI-PTSD Subscale: Treatment Considerations.” Journal of Clinical Psychology 43 (3): 337–40.
Isen, Alice M., and Nehemia Geva. 1987. “The Influence of Positive Affect on Acceptable Level of Risk: The Person with a Large Canoe has a Large Worry.” Organizational Behavior and Human Decision Processes 39 (2): 145–54.
Johnson, Eric J., and Amos Tversky. 1983. “Affect, Generalization, and the Perception of Risk.” Jour-nal of Personality and Social Psychology 45 (1): 20–31.
Kahneman, Daniel, and Amos Tversky. 1979. “Prospect Theory: An Analysis of Decision under Risk.” Econometrica 47 (2): 263–91.
Kessler, Ronald C., Amanda Sonnega, Evelyn Bromet, Michael Hughes, and Christopher B. Nelson. 1995. “Posttraumatic Stress Disorder in the National Comorbidity Survey.” Arch Gen Psychiatry 52 (12): 1048–60.
Kish, Leslie. 1949. “A Procedure for Objective Respondent Selection within the Household.” Journal of the American Statistical Association 44 (247): 380–87.
Kuhnen, Camelia M., Gregory Samanez-Larkin, and Brian Knutson. 2011. “Serotonin and Risk Tak-ing: How Do Genes Change Financial Choices?” Unpublished.
Lerner, Jennifer S., Roxana M. Gonzalez, Deborah A. Small, and Baruch Fischoff. 2003. “Effects of Fear and Anger on Perceived Risks of Terrorism.” Psychological Science 14 (2): 144–50.
Lerner, Jennifer S., and Dacher Keitner. 2001. “Fear, Anger and Risk.” Journal of Personality and Social Psychology 81 (1): 146–59.
Lerner, Jennifer S., and Deborah Small, and George Loewenstein. 2004. “Heart Strings and Purse Strings: Carryover Effects of Emotions on Economic Decision.” Psychological Science 15 (5): 337–41.
Loomes, Graham, and Robert Sugden. 1986. “Disappointment and Dynamic Consistency in Choice under Uncertainty.” Review of Economic Studies 53 (2): 271–82.
Magat, Wesley, A., W. Kip Viscusi, and Joel Huber. 1996. “A Reference Lottery Metric for Valuing Health.” Management Science 42 (8): 1118–30.
Malmendier, Ulrike, and Stefan Nagel. 2011. “Depression Babies: Do Macroeconomic Experiences Affect Risk Taking?” Quarterly Journal of Economics 126 (1): 373–416.
McCord, Mark, and Richard de Neufville. 1986. “‘Lottery Equivalents’: Reduction of the Certainty Effect Problem in Utility Assessment.” Management Science 32 (1): 56–60.
National Risk and Vulnerability Assessment. 2005. National Survey, Ministry of Rural Rehabilitation and Development.
National Risk and Vulnerability Assessment. 2007. National Survey, Ministry of Rural Rehabilitation and Development and Central Statistics Office.
Neilson, William S. 1992. “Some Mixed Results on Boundary Effects.” Economics Letters 39 (3): 275–78.
Oliver, Adam. 2005. “Testing the Internal Consistency of the Lottery Equivalents Method Using Health Outcomes.” Health Economics 14 (2): 149–59.
Oliver, Adam. 2007. “A Qualitative Analysis of the Lottery Equivalents Method.” Economics and Phi-losophy 23 (2): 185–204.
Prelec, Drazen. 1998. “The Probability Weighting Function.” Econometrica 66 (3): 497–527.
05_A20120294_1041.indd 25 10/23/13 10:46 AM
26 THE AMERICAN ECONOMIC REVIEW JANUARY 2014
Rydval, Ondrej, Andreas Ortmann, Sasha Prokosheva, and Ralph Hertwig. 2009. “How Certain Is the Uncertainty Effect?” Experimental Economics 12 (4): 473–87.
Schlenger, William E., Richard A. Kulka, John A. Fairbank, Richard L. Hough, B. Kathleen Jordan, Charles R. Marmar, and Daniel S. Weiss. 1992. “The Prevalence of Post-Traumatic Stress Disorder in the Vietnam Generation: A Multimethod, Multisource Assessment of Psychiatric Disorder.” Jour-nal of Traumatic Stress 5 (3): 333–63.
Schmidt, Ulrich. 1998. “A Measurement of the Certainty Effect.” Journal of Mathematical Psychol-ogy 42 (1): 32–47.
Simonsohn, Uri. 2009. “Direct Risk Aversion: Evidence from Risky Prospects Valued below Their Worst Outcome.” Psychological Science 20 (6): 686–92.
Slovic, Paul, and Ellen Peters. 2006. “Risk Perception and Affect.” Current Directions in Psychologi-cal Science 15 (6): 686–92.
Solomon, Zahava, and Mario Mikulincer. 1990. “Life Events and Combat-Related Posttraumatic Stress Disorder: The Intervening Role of Locus of Control and Social Support.” Military Psychol-ogy 2 (4): 241–56.
Solomon, Zahava, Mario Mikulincer, and Ehud Avitzur. 1988. “Coping, Locus of Control, Social Sup-port, and Combat-Related Posttraumatic Stress Disorder: A Prospective Study.” Journal of Person-ality and Social Psychology 55 (2): 279–85.
Solomon, Zahava, Mario Mikulincer, and Rami Benbenishty. 1989. “Locus of Control and Combat-Related Post-Traumatic Stress Disorder: The Intervening Role of Battle Intensity, Threat Appraisal and Coping.” British Journal of Clinical Psychology 28 (2): 131–44.
Starmer, Chris. 2000. “Developments in Non-expected Utility Theory: The Hunt for a Descriptive Theory of Choice under Risk.” Journal of Economic Literature 38 (2): 332–82.
Stewart, Mark B. 1983. “On Least Squares Estimation When the Dependent Variable Is Grouped.” Review of Economic Studies 50 (4): 737–53.
Tanaka, Tomomi, Colin F. Camerer, and Quang Nguyen. 2010. “Risk and Time Preferences: Linking Experimental and Household Survey Data from Vietnam.” American Economic Review 100 (1): 557–71.
Tversky, Amos, and Craig R. Fox. 1995. “Weighing Risk and Uncertainty.” Psychological Review 102 (2): 269–83.Tversky, Amos, and Daniel Kahneman. 1992. “Advances in Prospect Theory: Cumulative Representa-
tion of Uncertainty.” Journal of Risk and Uncertainty 5 (4): 297–323.UNAMA. 2008. Afghanistan Annual Report on Protection of Civilians in Armed Conflict. Report,
United Nations Missions in Afghanistan.UNAMA. 2010. Afghanistan Annual Report on Protection of Civilians in Armed Conflict. Report,
United Nations Mission in Afghanistan.Varian, Hal R. 1992. Microeconomic Analysis. 3rd ed. New York: Norton.Voors, Maarten J., Eleonora E. M. Nillesen, Philip Verwimp, Erwin H. Bulte, Robert Lensink, and
Daan P. Van Soest. 2012. “Violent Conflict and Behavior: A Field Experiment in Burundi.” Ameri-can Economic Review 102 (2): 941–64.
Wu, George, and Richard Gonzalez. 1996. “Curvature of the Probability Weighting Function.” Man-agement Science 42 (12): 1676–90.
Yehuda, Rachel. 2002. “Post-Traumatic Stress Disorder.” New England Journal of Medicine 346 (2): 108–14.
Yong, Ed. 2012. “Replication Studies: Bad Copy.” Nature 485 (7398): 298–300.
05_A20120294_1041.indd 26 10/23/13 10:46 AM
AUTHOR QUERIES 27
PLEASE ANSWER ALL AUTHOR QUERIES (numbered with “AQ” in the margin of the page). Please disregard all Editor Queries (numbered with “EQ” in the margins). They are reminders for the editorial staff.AQ# Question Response
1. Please ensure that all variables (word and letter) are italizied throughout manuscript.
2. The data used in your research must be documented in your reference list. Please use the attached examples for formatting. When you return your corrected proof, please also send a word .doc containing your complete data references.
05_A20120294_1041.indd 27 10/23/13 10:46 AM
Datasets
When referencing datasets, please include the author name or the name of the provider hosting the data, the year the data were collected or posted, the name or title of the dataset, the name of the database if applicable, and any other information necessary for one to retrieve the data. Please include the date accessed in parentheses at the end.
Example 1: Bureau of Labor Statistics. 2000–2010. “Current Employment Statistics: Colorado, Total Nonfarm, Seasonally adjusted - SMS08000000000000001.” United States Department of Labor. http://data.bls.gov/cgi-bin/surveymost?sm+08 (accessed February 9, 2011).
Example 2: Leiss, Amelia. 1999. “Arms Transfers to Developing Countries, 1945–1968.” Inter-University Consortium for Political and Social Research, Ann Arbor, MI. ICPSR05404-v1. doi:10.3886/ICPSR05404 (accessed February 8, 2011). For references to data specifically associated with a published paper, please include the author Name(s). Year. “Paper title: Dataset.” Journal Name. Location of the data. Example 3: Romer, Christina D., and David H. Romer. 2010. “The Macroeconomic Effects of Tax Changes: Estimates Based on a New Measure of Fiscal Shocks: Dataset.” American Economic Review. http://www.aeaweb.org/articles.php?doi=10.1257/aer.100.3.763 (accessed February 9, 2011). �
05_A20120294_1041.indd 28 10/23/13 10:46 AM