Embed Size (px)
Citation preview
University of Pennsylvania University of Pennsylvania
ScholarlyCommons ScholarlyCommons
Departmental Papers (ASC) Annenberg School for Communication
6-17-2014
Violence in Popular U.S. Prime Time TV Dramas and the Violence in Popular U.S. Prime Time TV Dramas and the
Cultivation of Fear: A Time Series Analysis Cultivation of Fear: A Time Series Analysis
Patrick E. Jamieson University of Pennsylvania, [email protected]
Daniel Romer University of Pennsylvania, [email protected]
Follow this and additional works at: https://repository.upenn.edu/asc_papers
Part of the Broadcast and Video Studies Commons
Recommended Citation Recommended Citation Jamieson, P. E., & Romer, D. (2014). Violence in Popular U.S. Prime Time TV Dramas and the Cultivation of Fear: A Time Series Analysis. Media and Communication, 2 (2), 31-41. Retrieved from https://repository.upenn.edu/asc_papers/349
This paper is posted at ScholarlyCommons. https://repository.upenn.edu/asc_papers/349 For more information, please contact [email protected].

Violence in Popular U.S. Prime Time TV Dramas and the Cultivation of Fear: A Violence in Popular U.S. Prime Time TV Dramas and the Cultivation of Fear: A Time Series Analysis Time Series Analysis
Abstract Abstract Gerbner and Gross’s cultivation theory predicts that prolonged exposure to TV violence creates fear of crime, symptomatic of a mean world syndrome. We tested the theory’s prediction in a time series model with annual changes in violence portrayal on popular US TV shows from 1972 to 2010 as a predictor of changes in public perceptions of local crime rates and fear of crime. We found that contrary to the prediction that TV violence would affect perceptions of crime rates, TV violence directly predicted fear of crime holding constant national crime rates and perceptions of crime rates. National crime rates predicted fear of crime but only as mediated by perceptions of local crime rates. The findings support an interpretation of cultivation theory that TV drama transports viewers into a fictive world that creates fear of crime but without changing perceptions of a mean world.
Keywords Keywords content analysis, crime, cultivation theory, fear, transportation theory, TV violence
Disciplines Disciplines Broadcast and Video Studies | Communication | Social and Behavioral Sciences
This journal article is available at ScholarlyCommons: https://repository.upenn.edu/asc_papers/349
Media and Communication, 2014, Volume 2, Issue 2, Pages 31-41 31
Media and Communication (ISSN: 2183-2439) 2014, Volume 2, Issue 2, Pages 31-41
Article
Violence in Popular U.S. Prime Time TV Dramas and the Cultivation of Fear: A Time Series Analysis
Patrick E. Jamieson and Daniel Romer *
Annenberg Public Policy Center, University of Pennsylvania, 202 S. 36th St., Philadelphia, PA 19104, USA; E-Mails: [email protected] (P.E.J.), [email protected] (D.R.); Tel.: +1-215-898-6776 (D.R.); Fax: +1-215-573-7116 (D.R.)
* Corresponding author
Submitted: 22 November 2013 | In Revised Form: 27 February 2014 | Accepted: 28 April 2014 | Published: 17 June 2014
Abstract Gerbner and Gross’s cultivation theory predicts that prolonged exposure to TV violence creates fear of crime, symptomatic of a mean world syndrome. We tested the theory’s prediction in a time series model with annual changes in violence portrayal on popular US TV shows from 1972 to 2010 as a predictor of changes in public perceptions of local crime rates and fear of crime. We found that contrary to the prediction that TV violence would affect perceptions of crime rates, TV violence directly predicted fear of crime holding constant national crime rates and perceptions of crime rates. National crime rates predicted fear of crime but only as mediated by perceptions of local crime rates. The findings support an interpretation of cultivation theory that TV drama transports viewers into a fictive world that creates fear of crime but without changing perceptions of a mean world.
Keywords content analysis; crime; cultivation theory; fear; transportation theory; TV violence
Issue This article is part of a regular issue of Media and Communication, edited by Professor Bradley Greenberg (Michigan State University, USA) and Professor Elisabeth Klaus (University of Salzburg, Austria).
© 2014 by the authors; licensee Cogitatio (Lisbon, Portugal). This article is licensed under a Creative Commons Attribu-tion 4.0 International License (CC BY).
1. Introduction
“Fearful people are more dependent, more easily manipulated and controlled, more susceptible to deceptively simple, strong, tough measures and hard-line postures—both political and religious. They may accept and even welcome repression if it promises to relieve their insecurities. That is the deeper problem of violence-laden television.”
George Gerbner, Ph.D, testimony before a U.S. House of Representatives Sub Committee, October 21, 1981 (Gerbner, 1981a, p. 7).
Cultivaton theory, developed by Gerbner and Gross
(1976) and colleagues (Gerbner, Gross, Morgan, Signor-ielli, & Shanahan, 2002), is among the three most cited theories in communication research (Bryant & Miron, 2004). Gerbner et al. argued that television (TV), as the dominant cultural medium, cultivated a social reality that was often at odds with objective reality. They were particularly interested in the effects of violent TV content, which they predicted would create fear of others in audiences. Indeed, “[F]ear—that historic instrument of social control—may be an even more critical residue of a show of violence than aggression” (Gerbner & Gross, 1976, p. 178). Gerbner et al. supported this contention with their pioneering Cultural Indicators Project’s (CIP), which content analyzed TV programming and found extensive violent
Media and Communication, 2014, Volume 2, Issue 2, Pages 31-41 32
content (Morgan, Shanahan, & Signorielli, 2008). They proposed that long-term heavy exposure to such TV content would gradually cultivate unrealistic fear and heightened mistrust of others.
Analysis of national surveys revealed that heavy TV viewers overestimated the prevalence of violence and the presence of police (Gerbner, Gross, Signorielli, Morgan, & Jackson‐Beeck, 1979). When heavy viewers were asked whether they would be ‘afraid to walk alone at night in their neighborhood,’ they were more likely to answer yes than light viewers. Gerbner and colleagues named this phenomenon the ‘mean world syndrome,’ which consisted of viewing the world as a dangerous and violent place, where people ‘just looked out for themselves,’ and ‘could not be trusted’ (Gerb‐ner, Gross, Morgan, Signorielli, 1980).
Despite its influence on media research, cultivation theory met with considerable criticism. For example, Doob and Macdonald (1979) challenged it with the finding that heavy TV viewing by survey respondents no longer predicted fear of their environment after controlling for the amount of crime in their Toronto, Canada neighborhoods. Further criticism of cultivation theory came from Hughes (1980) and Hirsch (1980, 1981), who reanalyzed the surveys analyzed by Gerbner and colleagues and found that cultivation effects were no longer present after demographic controls were added. They argued instead that evidence of cultivation could be explained by patterns of TV viewing by various demographic groups (e.g., those of low income or low education) that were also more likely to mistrust others.
Gerbner and colleagues responded to these criticisms (Gerbner, 1981b; Gerbner, Gross, Morgan, & Signorielli, 1981) by emphasizing the concepts of resonance and mainstreaming to correct for the effects of potential demographic differences (Gerbner, Gross, Morgan, & Signorielli, 1980). However, the field continued to identify limitations in the cultivation approach. Whereas the theory initially proposed that cultivation effects were attributable to the entire body of TV content, subsequent research suggested that it might only apply to specific types of programming. For example, in a survey of Florida adults, Chiricos, Eschholz, and Gertz (1997) found that watching TV news and listening to radio news predicted fear of crime. Romer, Jamieson and Aday (2003) found that fear of crime was cultivated by local and national TV news reporting rather than overall TV viewing. In addition, Dowler (2003) analyzed a 1995 national sample of adults and found a weak relation between watching crime shows and fear of crime but no prediction for the amount of TV hours watched per week. Thus, it became clearer that the type of programming watched could be an important factor predicting cultivation effects (Romer et al, 2014).
Despite the critiques, a 1997 meta-analysis by Morgan (1996) of a comprehensive published bibliography of cultivation studies since 1976 found a small but significant
overall cultivation effect, r = 0.091. Nevertheless, nearly all of the research included in the analysis was cross-sectional. Therefore it remains an open question whether the effects of TV viewing on fear of crime are attributable to TV content or are the result of confounds from subsets of the population more inclined to watch shows that feature crime (e.g., police dramas or local news) and more likely to be fearful apart from TV exposure.
Previous research has also not tested a striking feature of cultivation theory, that heavy viewing of fictional TV programming can change perceptions of the world, so that those perceptions become more consistent with fictional TV than with the reality that viewers confront on a daily basis in their lives. It is not difficult to imagine that news programming might influence viewers’ perceptions of crime rates (Lowry, Nio, & Leitner, 2003; Romer, Ja-mieson, & Aday, 2003) but such a prediction regarding fictional TV is more controversial.
The present research was designed to help evaluate the theory’s prediction regarding fictional TV pro‐gramming. Rather than studying a cross-section of the population, our study examined changes over time in national exposure to violent TV content sampled from the Coding of Health and Media Project (CHAMP, see www.YouthMediaRisk.org). This project conducted a content analysis of TV programming from 1950 to the present that focused on one type of programming that should produce cultivation effects on fear of crime, namely popular prime-time dramas featuring stories with police, legal, medical, and western themes. By examining annual deviations from trend in violent TV content, this time series analysis (Diebold, 2007) can evaluate the relationship between the public’s perceptions of crime prevalence and its fears of crime as reported in Gallup’s national opinion surveys. This eliminates the problem of confounds due to demographic and viewing pattern differences because these characteristics would not be expected to change from year to year. In addition, annual changes in violent TV content can be distinguished from changes in police reports of violent crime, thereby providing a relatively clean prediction of the effects of TV fictional content on the public’s reported fear.
We also tested a model that could determine whether the relationship between fictional TV violence and fear of crime was mediated by changes in perceptions of real-world crime prevalence, as cultivation theory would predict. According to cultivation theory, fictional TV creates an impression of a mean world that should mediate the experience of fear. However, an alternative explanation suggests that violent programs, by dramatizing the effects of violence, can influence fear without affecting perceptions of real-world crime.
Suspending disbelief in dramas is a powerful mechanism that allows viewers to identify with the characters and experience their emotions vicariously,
Media and Communication, 2014, Volume 2, Issue 2, Pages 31-41 33
in a sense “transporting” them into the world of the drama (Green & Dill, 2013). For example, in an early study of the effects of transportation in TV ads, Deighton, Romer and McQueen (1989) found that TV ads classified as dramas, rather than persuasive arguments, were processed emotionally more than cognitively and persuaded consumers by engaging them empathically. Dramas were just as successful in persuading consumers as factual appeals, but the mechanism was different, relying instead on the audience’s ability to place (i.e., “transport”) itself into the actors’ world and experience the actor’s use of the product. Similarly, this process could explain an emotional fear reaction in an audience viewing violent TV dramas. In other words, drama can transport the audience without necessarily affecting perceptions of the prevalance of crime in their daily environment.
Repeated TV show exposure can also encourage par-asocial relations between the audience and the show’s characters (Schiappa, Allen, & Gregg, 2007), an effect that can heighten the empathic experience elicited by identification with TV characters. Green & Brock built transportation theory on these mechanisms, which can explain audiences’ affect-based involvement with fic-tional characters (Green & Dill, 2013). Oatley (1999) also argued that identification and sympathy with the pro-tagonists goals or the re-experience of emotions trig-gered by the drama could enhance the impact of fiction-al depictions. Thus, we proposed that transportation mechanisms may explain changes over time in the culti-vation of fear of crime predicted by violence in fictional TV dramas and could do so apart from changes in per-ceptions of real world crime prevalence.
2. Research Questions
Given our ability to evaluate changes in violent TV content over time, we posed two research questions:
RQ1: Do changes in this programming from year to year correlate with corresponding changes in national levels of fear of crime apart from official national crime rates? and RQ2: if the violence rate in TV programming correlates with fear, is this relation mediated by changes in perceptions of real world crime rates or by other processes, such as by transporting audiences into experiencing fear apart from levels of violence reflected in those rates?
3. Method
3.1. TV Sample Selection
For the purposes of this study, we used the Coding of Health and Media Project (CHAMP) content analysis of the top 30 prime-time drama network television epi-
sodes from 1972 to 2010 that were available for pur-chase as identified by Brooks and Marsh (Brooks & Marsh, 2009) and Nielsen’s website http://www. nielsen.com/us/en.html. We began the study series in 1972 because it was the year when national survey da-ta regarding crime issues became more regular on an annual basis. Sampled TV shows across the decades in-cluded crime, detective, and medical genres, such as Kojak and Hawaii Five-O from the 1970’s, Hill Street Blues and Trapper John M.D. from the 1980’s, Law and Order and ER from the 1990’s, and CSI: Crime Scene In-vestigation and House M.D. from 2000–2010. The shows we sampled remained popular over time, mak-ing it likely that we could capture the same audiences from year to year. For a list of sampled TV shows by year, see www.YouthMediaRisk.org. Because TV sea-sons cover two calendar years, the study examined TV episodes that ran in the spring and fall of the same year so that they could be compared with annual measures of fear of crime, perceptions of violent crime prevalence, and FBI reports of crime.
When available, every other episode was coded per season, or if fewer than six episodes were available for purchase, all available episodes were coded. We coded fall and spring seasons separately to enable a match between TV content changes and the most closely cor-responding Gallup survey from the spring or fall of the 25 available years of the fear of crime data. The sample totaled 475.4 hours of commercial-free programming from 1972 to 2010 with a mean of 19.0 hours per year (standard deviation = 11.2). The study did not seek I.R.B. approval because it did not involve human subjects.
The dramas in our sample reflected a popular part of the prime-time TV landscape based on examination of Nielsen household viewership shares, which estimate the percentage of TV households tuned to a program (Local Media Market Solutions, 2012). Because house-hold TV penetration is available for every fifth year (Lo-cal Media Market Solutions, 2012), we calculated shares for those years from 1975–2005 as follows: (sum of Niel-sen shares for TV shows in year) × (% of households with TV in the same year). These scores, estimated every 10 years, show the total household shares annually ex-posed to the sampled shows. The show values were 43.0 in 1975, 63.5 in 1985, 58.4 in 1995, and 106.0 in 2005. Shares increased since 1975 because in later years more shows were available for coding and the proportion of households with TV increased. These share totals indi-cate that sizeable proportions of households were ex-posed each week to the TV shows during the fall and spring seasons (excluding reruns).
3.2. Coding of TV Violence Sequences
Twenty undergraduate students were trained to mas-ter a codebook of rules for the identification of violent and other content (see http://youthmediarisk.org for
Media and Communication, 2014, Volume 2, Issue 2, Pages 31-41 34
the codebook). Training was based on about 21 hours of TV content. Coders were required to exhibit a high level of reliability using Krippendorff’s alpha formula (Krippendorff, 2012) (Kα > 0.80), which controls for chance agreement across coders. The typical coding unit was either a 4- or 4.5-minute segment based on di-viding half-hour episodes without commercials (20 mins) into 5 equal segments and dividing hour long episodes with no commercials (45 mins) into 10 segments. Hence, the coding unit was made as close as possible to the 4-minute length of half-hour episodes, which were the dominant episode length. Because this could produce more violent segments for shorter episodes, we con-verted violence rates to a time-based based metric (i.e., instances per commercial free episode hour).
The definition of violence was adapted from previous research (Yokota & Thompson, 2000) as fol-lows, “Physical acts where the aggressor makes or at‐tempts to make some physical contact with the inten-tion of causing injury or death” and “intentional acts where the aggressor makes or attempts to make some physical contact that has potential to inflict injury or harm.” We excluded natural disasters; accidents, ob‐jects not attributed to a character, and expected physi-cal acts in sport games that are not intended to seri-ously injure (tackling, checking, boxing, stunts). The violence measure did not differentiate violence that may produce more or less fear such as between stranger versus family violence or violence committed in self defense. We assumed these features would not change dramatically from year to year and thus would not explain any relations we found with fear of crime.
Violent acts were counted as “sequences of vio‐lence” (Bushman, Jamieson, Weitz, & Romer, 2013). A sequence of violence was defined as an uninterrupted display of a character or a group of characters engaged in acts of violence. Violence was coded as uninterrupt-ed if the character used one weapon or method con-tinuously, regardless of the number of victims. Vio-lence counts of 25 or more sequences per 5 minute segment were recoded to a value of 25. The sum of violent sequences per coding segment was the meas-ure of violence in a segment. Reliability for identifying TV violent sequences was high (Kα = 0.87).
We coded fall and spring episodes separately so that we could match TV violence rates more closely to the time of year when the Gallup survey was taken. In some of the years (24%), Gallup surveyed fear closer to the spring TV schedule. For each time period, we calculated the mean of the log transformed violence rates across episodes and converted the scores back into the actual rate per episode hour. The fall and spring violence rates were highly correlated (r = 0.61).
3.3. Assessment of Fear and Prevalence of Crime
Survey data collected by the Gallup Poll from 1972 to
2010 were used to assess national rates of the US pub-lic’s fear of crime and perceptions of crime prevalence. The Gallup Poll is a demographically weighted random-digit-dialed national telephone survey that asks the fol-lowing question of respondents ages 18+: “Is there any‐where near where you live that is, within a mile, where you would be afraid to walk alone at night?” (Gallup, 2010a). The annual percent of yes responses was used to measure fear of crime. There were years in which the question was not asked, leaving us with 25 time points between 1972 and 2010.
The Gallup survey was used rather than results for the same question in the National Opinion Reseach Council’s General Social Survey (GSS) because Gallup covered a longer time period and was a nationally rep-resentative telephone sample rather than the GSS, which uses in-person home-based interviews that may have introduced a sample bias by only including re-spondents who were not fearful of strangers (i.e., be-ing interviewed in their homes).
The perception of crime prevalence was assessed using the same Gallup national telephone survey ques-tion for ages 18+: “Is there more crime in your area than there was a year ago, or less?” (Gallup, 2010b). The percent that responded ‘more’ was used as the measure of perceived prevalence. There were years in which the question was not asked, leaving us with 22 time points between 1972 and 2010 for this item.
3.4. National Violent Crime Rate
The annual national violent crime rate was taken from the FBI uniform crime reports (Bureau of Justice Staistics, 2013), which had data for every year since 1972. It measures the rate per 100,000 persons of violent crimes reported to the police in the U.S. This index includes murder, non-negligent manslaughter, forcible rape, robbery, and aggravated assault.
3.5. Data Analysis
Curve fitting for identifying best fitting trends was conducted using SPSS 20.0. The study variables were detrended by identifying the best fitting polynomial function for non-missing cases as measured by adjusted R2
. Residuals from the best fitting polynomial function served as the measure of annual deviations from trend (Diebold, 2007). These residuals were also evaluated graphically to confim stationarity (i.e., that the overall level and deviations from the mean of the series did not change over time after removing the underlying time trend), an important prerequisite for analyzing relations between time series (Diebold, 2007). The program MPlus version 7.1 (Muthén & Muthén, 2013) was used to fit a structural equation model (SEM) to test the model in Figure 1, including tests of mediation (MacKinnon, 2008). Robust standard errors

Media and Communication, 2014, Volume 2, Issue 2, Pages 31-41 35
were applied to protect against violations of normality, correlated errors, and heteroscedasticity. The program only included non-missing cases (N = 25) for reported fear, the dependent variable. Missing data for percep-tion of crime (16%) were handled using full information maximum likelihood (FIML) procedures. Model fit was good after dropping the nonsignificant path from TV vio-
lence rate to perception of crime using multiple indices of global fit and residual diagnostics. The indices includ-ed a low χ2(1) = 0.029, p = 0.866 and root-mean-square-error-of-approximation (RMSEA) value = 0.000; high val-ues of the comparative fit index (CFI) = 1.00 and the Tucker-Lewis Index (TLI) = 1.14. All tests were two tailed, and 95% confidence intervals (CI) are reported.
Figure 1. Standardized solution for the structural equation model of predictors of fear of crime (all variables detrended). Dashed paths are nonsignificant.
Figure 2. TV violence rate (left) and percentage of population reporting fear of crime (right) with best fitting trends and upper (UCI) and lower (LCI) 95% confidence intervals, 1972-2010.
Media and Communication, 2014, Volume 2, Issue 2, Pages 31-41 36
4. Results
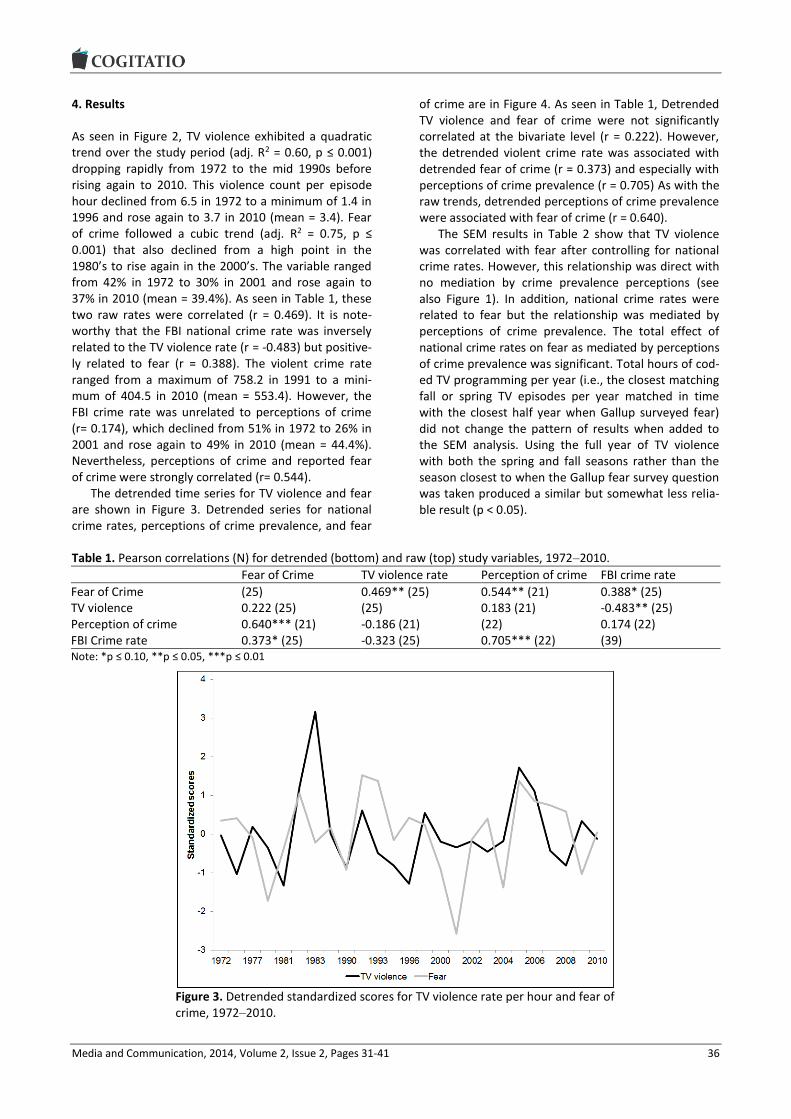
As seen in Figure 2, TV violence exhibited a quadratic trend over the study period (adj. R2 = 0.60, p ≤ 0.001) dropping rapidly from 1972 to the mid 1990s before rising again to 2010. This violence count per episode hour declined from 6.5 in 1972 to a minimum of 1.4 in 1996 and rose again to 3.7 in 2010 (mean = 3.4). Fear of crime followed a cubic trend (adj. R2 = 0.75, p ≤ 0.001) that also declined from a high point in the 1980’s to rise again in the 2000’s. The variable ranged from 42% in 1972 to 30% in 2001 and rose again to 37% in 2010 (mean = 39.4%). As seen in Table 1, these two raw rates were correlated (r = 0.469). It is note-worthy that the FBI national crime rate was inversely related to the TV violence rate (r = -0.483) but positive-ly related to fear (r = 0.388). The violent crime rate ranged from a maximum of 758.2 in 1991 to a mini-mum of 404.5 in 2010 (mean = 553.4). However, the FBI crime rate was unrelated to perceptions of crime (r= 0.174), which declined from 51% in 1972 to 26% in 2001 and rose again to 49% in 2010 (mean = 44.4%). Nevertheless, perceptions of crime and reported fear of crime were strongly correlated (r= 0.544).
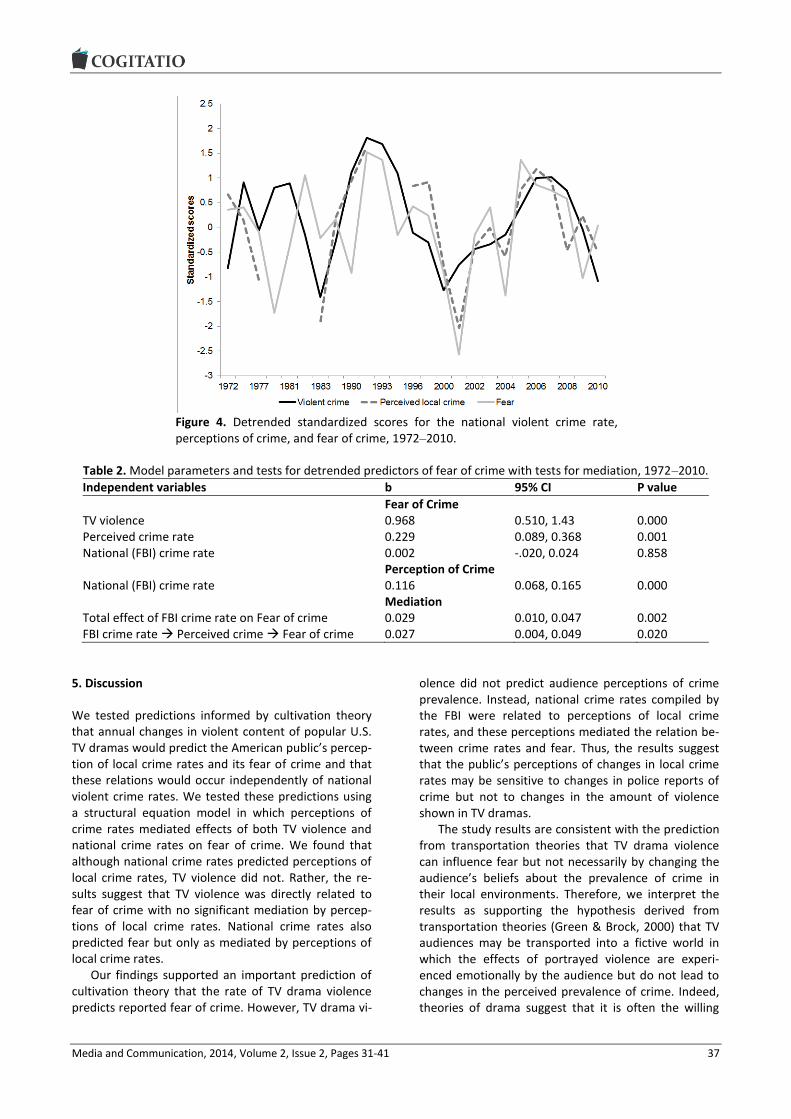
The detrended time series for TV violence and fear are shown in Figure 3. Detrended series for national crime rates, perceptions of crime prevalence, and fear
of crime are in Figure 4. As seen in Table 1, Detrended TV violence and fear of crime were not significantly correlated at the bivariate level (r = 0.222). However, the detrended violent crime rate was associated with detrended fear of crime (r = 0.373) and especially with perceptions of crime prevalence (r = 0.705) As with the raw trends, detrended perceptions of crime prevalence were associated with fear of crime (r = 0.640).
The SEM results in Table 2 show that TV violence was correlated with fear after controlling for national crime rates. However, this relationship was direct with no mediation by crime prevalence perceptions (see also Figure 1). In addition, national crime rates were related to fear but the relationship was mediated by perceptions of crime prevalence. The total effect of national crime rates on fear as mediated by perceptions of crime prevalence was significant. Total hours of cod-ed TV programming per year (i.e., the closest matching fall or spring TV episodes per year matched in time with the closest half year when Gallup surveyed fear) did not change the pattern of results when added to the SEM analysis. Using the full year of TV violence with both the spring and fall seasons rather than the season closest to when the Gallup fear survey question was taken produced a similar but somewhat less relia-ble result (p < 0.05).
Table 1. Pearson correlations (N) for detrended (bottom) and raw (top) study variables, 1972–2010.
Fear of Crime TV violence rate Perception of crime FBI crime rate
Fear of Crime (25) 0.469** (25) 0.544** (21) 0.388* (25) TV violence 0.222 (25) (25) 0.183 (21) -0.483** (25) Perception of crime 0.640*** (21) -0.186 (21) (22) 0.174 (22) FBI Crime rate 0.373* (25) -0.323 (25) 0.705*** (22) (39) Note: *p ≤ 0.10, **p ≤ 0.05, ***p ≤ 0.01
Figure 3. Detrended standardized scores for TV violence rate per hour and fear of crime, 1972–2010.
Media and Communication, 2014, Volume 2, Issue 2, Pages 31-41 37
Figure 4. Detrended standardized scores for the national violent crime rate, perceptions of crime, and fear of crime, 1972–2010.
Table 2. Model parameters and tests for detrended predictors of fear of crime with tests for mediation, 1972–2010.
Independent variables b 95% CI P value
Fear of Crime TV violence 0.968 0.510, 1.43 0.000 Perceived crime rate 0.229 0.089, 0.368 0.001 National (FBI) crime rate 0.002 -.020, 0.024 0.858 Perception of Crime National (FBI) crime rate 0.116 0.068, 0.165 0.000 Mediation Total effect of FBI crime rate on Fear of crime 0.029 0.010, 0.047 0.002 FBI crime rate Perceived crime Fear of crime 0.027 0.004, 0.049 0.020
5. Discussion
We tested predictions informed by cultivation theory that annual changes in violent content of popular U.S. TV dramas would predict the American public’s percep‐tion of local crime rates and its fear of crime and that these relations would occur independently of national violent crime rates. We tested these predictions using a structural equation model in which perceptions of crime rates mediated effects of both TV violence and national crime rates on fear of crime. We found that although national crime rates predicted perceptions of local crime rates, TV violence did not. Rather, the re-sults suggest that TV violence was directly related to fear of crime with no significant mediation by percep-tions of local crime rates. National crime rates also predicted fear but only as mediated by perceptions of local crime rates.
Our findings supported an important prediction of cultivation theory that the rate of TV drama violence predicts reported fear of crime. However, TV drama vi-
olence did not predict audience perceptions of crime prevalence. Instead, national crime rates compiled by the FBI were related to perceptions of local crime rates, and these perceptions mediated the relation be-tween crime rates and fear. Thus, the results suggest that the public’s perceptions of changes in local crime rates may be sensitive to changes in police reports of crime but not to changes in the amount of violence shown in TV dramas.
The study results are consistent with the prediction from transportation theories that TV drama violence can influence fear but not necessarily by changing the audience’s beliefs about the prevalence of crime in their local environments. Therefore, we interpret the results as supporting the hypothesis derived from transportation theories (Green & Brock, 2000) that TV audiences may be transported into a fictive world in which the effects of portrayed violence are experi-enced emotionally by the audience but do not lead to changes in the perceived prevalence of crime. Indeed, theories of drama suggest that it is often the willing
Media and Communication, 2014, Volume 2, Issue 2, Pages 31-41 38
suspension of disbelief that enables audiences to em-pathize with characters and thereby to experience their emotions (Green & Brock, 2000). And although this experience can be quite powerful, these results suggest it does not necessarily require changes in per-ceptions of the prevalence of the dramatized experi-ence in the real world.
There is evidence that non-fiction media exposure, such as in TV and radio news (Chiricos, Eschholz, & Gertz, 1997) and police reality shows (Holbert, Shah, & Kwak, 2004), perhaps because they are perceived as real, generate fear in the public. For example, Lowry, Nio, and Leitner (2003) used agenda setting as the the-oretical explanation for the finding that national net-work news predicted crime as the nation’s ‘most im‐portant problem.’ Consistent with cultivation theory, Romer, Jamieson, and Aday (2003) found that local TV news in cities with high coverage of crime predicted fear of crime and crime perceptions. Holbert, Shah, and Kwak (2004) analyzed a two-year national probability sample and reported that while viewing crime dramas did not predict fear of crime, exposure to television news and police reality programs did. They attributed this difference to police reality programs being per-ceived as more real. We find it noteworthy that both TV violence and fear of crime have changed in tandem over time in recent years even though the actual vio-lent crime rate has declined over this period (not shown) (Gallup, 2010a). Therefore, this pattern sug-gests that TV dramatic portrayals have increased fears of crime despite the decline in the actual violent crime rate. We do not have measures of TV news progam-ming that could tell us whether the reporting of crime has declined over this period. However, it is likely that TV news trends have captured at least some of the na-tional violent crime rate trend. In addition, by holding constant perceived prevalence of crime, we have con-trolled some of the potential influence of TV news, which would be expected to affect this perception.
Consistent with Gerbner’s cultivation theory predic‐tion that TV programming promotes fear and political positions that favor control of crime, Rosenberger and Callanan (2011) found that hours of TV watched pre-dicted more severe attitudes toward the treatment of criminals. At the same time, it is possible that viewers of fictional TV dramas are also more likely to be ex-posed to TV news or other TV content that carries fear arousing messages disseminated by political actors. In-deed, Beckett (1999) found that politicians often play on fear of crime as a way to gain support for punitive policies. Although we could not control for these ef-fects, it is unlikely that these news effects would be correlated with annual changes in fictional program-ming. Furthermore, our controls for changes in percep-tions of crime suggest that news or other sources are channeled through that path rather than through changes in fictional TV programming.
Because we use a time series approach that allows us to control for demographics but at the same time observe large changes in levels of violent program-ming, our findings eliminate a common problem with cultivation studies, that they rely on cross-sectional re-lations between TV exposure and audience outcomes. In our time series analysis, annual changes in TV con-tent over time were unlikely to be related to fear of crime due to demographic shifts. Thus, the associations we observed between changes in TV content and pub-lic fears of crime are more likely attributable to TV vio-lent content than to demographic shifts or changes in viewing habits in the population. We cannot rule out the potential influence of third variables, but the study model controlled for national crime rates that were al-so linked with fear as mediated by perceptions of local crime prevalence. Furthermore, the study provides a stronger test than many cross-sectional studies that have controlled demographic differences. If fear of crime is more strongly elicited by TV dramas in certain demographic groups, then holding those differences constant may also remove the effects of violent TV programming on those groups. The present study held demographic differences constant while violent pro-gramming varied. As a result, cultivation effects may have been more observable.
Our national time series findings may help to re-solve some of the debate surrounding cultivation theo-ry started by Doob and Macdonald (1979); Hughes (1980); and Hirsch (1980, 1981). We have been unable to find either a published long term time series analysis of fear of crime predicted by TV violence or a media-tion model of national violent crime rate and the per-ception of crime prevalence. Thus, this study employs a novel method to test predictions from cultivation theo-ry and finds support for one of its basic proposals. It al-so suggests a mechanism that can explain its effects without relying on the creation of a mean world.
5.1. Strengths and Limitations
The study’s strengths reside on its use of a large con-tent analysis of popular TV programming with 475 hours of commercial free TV episodes since the early 1970’s. The surveys conducted by Gallup represent in‐terviews with over 27,000 persons. Our ability to align TV programming with nationally representative survey data enabled us to evaluate changes in national expo-sure to violent TV content after controlling for national violent crime rates (Gallup, 2010a). Thus, despite only being able to study 25 years of Gallup surveys, the da-tabase represents a considerable body of survey and programming information.
This study has limitations as well. It did not sample TV shows less popular than the Nielsen ranked top 30, non-dramatic genres, cable TV, or YouTube. The sample was also limited to shows that were available for pur-
Media and Communication, 2014, Volume 2, Issue 2, Pages 31-41 39
chase. Nevertheless, because these shows were availa-ble years or decades later, they were likely very popular programs when they originally aired. In addition, be-cause many of the shows remained popular over time, the same audiences likely saw them year after year.
TV violence in this analysis was based on the aver-age annual rate of TV violent sequence counts per epi-sode hour and did not differentiate between violence that was initiated or received, or was in self-defense or not justified. It also did not control for trends in na-tional and local news reporting of crime that may have influenced reports of fear.
Our analysis assumed that annual changes in TV violence were not affected by public fear of crime, since it seemed unlikely that changes in population fear influenced contemporaneous changes in the amount of violent TV programming. Nevertheless, our analysis is still dependent on contemporaneous corre-lations that are not as conclusive for drawing causal conclusions as lagged effects that provide evidence of temporal precedence. Indeed, only carefully controlled experiments with long-term exposure to variation in violent TV content could clearly test the causal relation between exposure to violent TV drama and fear of crime. It is also necessary to note that the ecological fallacy warns against generalizing from group to indi-vidual behavior. There could be segments of the popu-lation that were not affected by violent TV program-ming or that responded in other ways. For example, a large gap has been found using the survey item regard-ing fear, with U.S. women much more fearful than men (Toch & Maguire, 2014). Finally, we were limited to us-ing the longest available measure of fear that was available for the four decades of the study. Future re-search should address how audiences respond to fic-tive TV violence using multiple measures of fear evalu-ated among different audiences across age, gender, education, racial-ethnic identity, and socioeconomic status, while controlling for their reported media con-sumption and political attitudes and behaviors.
6. Conclusion
The study result that annual change in TV violence, af-ter controlling for the violent crime rate and percep-tions of crime prevalence, was significantly related to change in national fear of crime from 1972 to 2010 is consistent with Gerbner’s explanation of the central tenet of cultivation theory. Indeed, he argued that the most important problem resulting from frequent expo-sure to TV violence is not the direct imitation of vio-lence by viewers, but the gradual increase in fear and mistrust that promotes authoritarian governance. A challenge for communication scholarship is to better understand cultivation processes in the 21st century’s rapidly changing technology-driven multiple media en-vironments.
Acknowledgements
The authors thank Ilana Weitz and the study coders for their work on the CHAMP project (see www.Youth MediaRisk.org).
Funding
The authors thank the Robert Wood Johnson Founda-tion and the Annenberg Public Policy Center for fun-ding the CHAMP project.
Conflict of Interests
The authors declare no conflict of interest.
References
Beckett, K. (1999). Making crime pay: Law and order in contemporary American politics. New York: Oxford University Press.
Brooks, T., & Marsh, E. F. (2009). The complete directo-ry to prime time network and cable TV shows, 1946-present. New York: Random House LLC.
Bureau of Justice Statistics (2013). FBI Uniform Crime Reporting Statistics: National crime estimates by years, 1960-2010. Retrieved from http://www.ucr datatool.gov/index.cfm
Bushman, B. J., Jamieson, P. E., Weitz, I., & Romer, D. (2013). Gun violence trends in movies. Pediatrics, 132(6), 1014-1018.
Bryant, J., & Miron, D. (2004). Theory and research in mass communication. Journal of communication, 54(4), 662-704.
Chiricos, T., Eschholz, S., & Gertz, M. (1997). Crime, news and fear of crime: Toward an identification of audience effects. Social Problems, 44, 342-357.
Deighton, J., Romer, D., & McQueen, J. (1989). Using drama to persuade. Journal of Consumer Research, 16(3), 335-343.
Diebold, F. X. (2007). Elements of Forecasting 4th ed. Mason, OH: Cengage Learning.
Doob, A. N., & Macdonald, G. E. (1979). Television viewing and fear of victimization: Is the relationship causal? Journal of Personality and Social Psycholo-gy, 37(2), 170.
Dowler, K. (2003). Media consumption and public atti-tudes toward crime and justice: The relationship between fear of crime, punitive attitudes, and per-ceived police effectiveness. Journal of Criminal Jus-tice and Popular Culture, 10(2), 109-126.
Gallup (2010a). Nearly 4 in 10 Americans Still Fear Walking Alone at Night. Retrieved from http:// www.gallup.com/poll/144272/nearly-americans-fea r-walking-alone-night.aspx
Gallup (2010b). Americans Still Perceive Crime as on the Rise. Retrieved from http://www.gallup.com/

Media and Communication, 2014, Volume 2, Issue 2, Pages 31-41 40
poll/144827/americans-perceive-crime-rise.aspx Gerbner, G. (1981a). Testimony of George Gerbner be-
fore the subcommittee on telecommunications, consumer protection, and finance of the committee on energy and commerce, US House of Representa-tives. Washington D.C., 10/21/81, 1-19.
Gerbner, G. (1981b). A Curious journey into the scary world of Paul Hirsch. Communication Research—An International Quarterly, 8(1), 39-72.
Gerbner, G., & Gross, L. (1976). Living with television: The violence profile. Journal of Communication, 26(2), 172-194.
Gerbner, G., Gross, L., Morgan, M., & Signorielli, N. (1980). The “mainstreaming” of America: Violence profile no. 11. Journal of Communication, 30(3), 10-29.
Gerbner, G., Gross, L., Morgan, M., & Signorielli, N. (1981). Final reply to Hirsch. Communication Re-search, 8(3), 259-280.
Gerbner, G., Gross, L., Morgan, M., Signorielli, N., & Shanahan, J. (2002). Growing up with television: Cultivation processes. In J. Bryant, D. Zillman (Eds.), Media effects: Advances in theory and research, 2nd edition (pp. 43-68). Mahwah NJ: Lawrence Erlbaum.
Gerbner, G., Gross, L., Signorielli, N., Morgan, M., & Jackson‐Beeck, M. (1979). The demonstration of power: Violence profile no. 10. Journal of Commu-nication, 29(3), 177-196.
Green, M. C., & Brock, T. C. (2000). The role of trans-portation in the persuasiveness of public narratives. Journal of Personality and Social Psychology, 79(5), 701.
Green, M. C., & Dill, K. E. (2013). Engaging with stories and characters: Learning, persuasion, and transpor-tation into narrative worlds. In K. E. Dill (Ed.), The Oxford handbook of media psychology (pp. 449-461). New York: Oxford University Press.
Hirsch, P. M. (1980). The “Scary World” of the nonviewer and other anomalies A reanalysis of Gerbner et al.'s findings on cultivation analysis, Part I. Communication research, 7(4), 403-456.
Hirsch, P. M. (1981). On not learning from one's own mistakes: A reanalysis of Gerbner et ally's findings on cultivation analysis, Part II. Communication Re-search, 8(1), 3-37.
Holbert, R. L., Shah, D. V., & Kwak, N. (2004). Fear, au-thority, and justice: Crime-related TV viewing and endorsements of capital punishment and gun own-ership. Journalism & Mass Communication Quarter-ly, 81(2), 343-363.
Hughes, M. (1980). The fruits of cultivation analysis: A reexamination of some effects of television watch-ing. Public Opinion Quarterly, 44(3), 287-302.
Krippendorff, K. (2012). Content analysis: An introduc-tion to its methodology 3rd ed. Thousand Oaks, CA: Sage.
Local Media Market Solutions. (2012). TVB TV basics: a report on the growth and scope of television. Retreived from http://www.tvb.org/media/file/TV_ Basics.pdf
Lowry, D. T., Nio, T. C. J., & Leitner, D. W. (2003). Set-ting the public fear agenda: A longitudinal analysis of network TV crime reporting, public perceptions of crime, and FBI crime statistics. Journal of Com-munication, 53(1), 61-73.
Mackinnon, D. (2008). Introduction to statistical media-tion analysis. New York: Taylor & Francis.
Morgan, M., (1996). Two Decades of Cultivation Re-search: An Appraisal and a Meta-Analysis. In Com-munication yearbook 20 (pp. 1-45). Thousand Oaks, CA: Sage Publishers, 1996.
Morgan, M., Shanahan, J., & Signorielli, N. (2008). Growing up with television: Cultivation processes. In J. Bryant, & M. B. Oliver (Eds.), Media effects: Ad-vances in theory and research (pp. 34-49). New York: Routledge.
Muthén, L. K., & Muthén B. O. (2013). Mplus user’s guide. 1998–2012. Los Angeles, CA.
Oatley, K. (1999). Why fiction may be twice as true as fact: Fiction as cognitive and emotional simulation. Review of General Psychology, 3(2), 101-117.
Romer, D., Jamieson, K. H., & Aday, S. (2003). Televi-sion news and the cultivation of fear of crime. Jour-nal of Communication, 53(1), 88-104.
Romer, D., Jamieson, P.E., Bleakley, A., & Jamieson, K.H. (2014). Cultivation theory: Its history, current status, and future directions. In R. Fortner & M. Fackler (Eds.), The international handbook of media and mass communication theory (pp. 115-136). Malden, MA: Wiley Blackwell.
Rosenberger, J. S., & Callanan, V. J. (2011). The influ-ence of media on penal attitudes. Criminal Justice Review, 36(4), 435-455.
Schiappa, E., Allen, M., & Gregg, P. (2007). Parasocial relationships and television: A meta-analysis of ef-fects. In R. Preiss, B. Gayle, N. Burrell, M. Allen, & J. Bryant (Eds.), Mass media effects research: Advanc-es through meta-analysis (pp. 301-314). Mahwah, NJ: Lawrence Erlbaum.
Toch, H., & Maguire, K. (2014). Public Opinion Regard-ing Crime, Criminal Justice, and Related Topics: A Retrospect. Journal of Research in Crime and Delin-quency, 1-21.
Yokota, F., & Thompson, K. M. (2000). Violence in G-rated animated films. JAMA: The Journal of the American Medical Association, 283(20), 2716-2720.
Media and Communication, 2014, Volume 2, Issue 2, Pages 31-41 41
About the Authors
Dr. Patrick E. Jamieson Patrick Jamieson is director of the Adolescent Risk Communication Institute of the Annenberg Public Policy Center at the University of Pennsylvania. His research interests focus on the role of media in ado-lescent health risk, including the portrayal of violence, gun use, smoking, alcohol, drugs, sex, as well as media suicide contagion.
Dr. Dan Romer Dan Romer is the director of the Adolescent and Health Communication Institutes of the Annenberg Public Policy Center at the University of Pennsylvania. His research focuses on policy relevant effects of the media and other social influences on mental and behavioral health with particular attention to adolescents.