Embed Size (px)
Citation preview
1
V entilation
I nformation
P aper
n° 41
March 2021
Air Infiltration and Ventilation Centre
Impact of wind on the airtightness test
results
Nolwenn Hurel, PLEIAQ, France Valérie Leprince, INIVE, France
Nomenclature
Roman symbols
C Air leakage coefficient m3/(sPan)
Cp Pressure coefficient -
E Error -
n Flow exponent -
p Pressure Pa
q Volumetric airflow rate m3/s
U Wind velocity m/s
Greek symbols
Δp Pressure difference Pa
ρ Air density kg/m3
Subscripts
av Averaged (pressurization –
depressurization results)
BD Induced by the pressurization
measurement device (Blower door)
down Downstream (leeward façade)
est Estimated value
ext Exterior
i Interior of building
j Index of leakage – external side
nowind No wind condition
p+ Pressurization test
p- Depressurization test
ref Reference pressure
t Total (up + down)
up Upstream (windward façade)
0 Zero-flow pressure measurement
As a convention, to simplify notations in this paper
for n<1 we assume that Xn=sign(X)*|X|n
1 Introduction Building airtightness tests have become very
common in several countries, either to comply
with minimum requirements of regulations or
programmes, or to justify input values in
calculation methods. With more widespread use
it has become increasingly important to
understand and quantify the reliability of these
tests.
There are four key sources of uncertainty in
airtightness testing: measurement devices
(accuracy and precision); calculation
assumptions (e.g., reference pressure,
regression analysis method); external
conditions (impact of wind and stack effect);
and human factors, such as consistent test
apparatus installation.
While competent tester schemes and
independent checking procedures show
potential to contain errors due to human factors,
there have been extensive yet inconclusive
debates about how the building pressurisation
test standard ISO 9972 should address other
sources of uncertainties. As a result, no change
has been made to address uncertainty since the
last version of the standard which was published
in September 2015.
Another issue is with limitations on allowable
test conditions. With the present ISO standard,
© INIVE EEIG Operating Agent
and Management Boulevard Poincaré 79
B-1060 Brussels – Belgium [email protected] - www.inive.org
International Energy Agency’s
Energy in Buildings and Communities Programme
Air Infiltration and Ventilation Centre 2 www.aivc.org
the zero-flow pressure shall not exceed 5 Pa for
the test to be valid. Consequently, in moderately
windy conditions, it may be impossible to
perform a pressurisation test in accordance with
the standard, even if an uncertainty analysis
would show small test errors. On the contrary,
the complexity of the wind impact during a test
might lead to situations for which the 5 Pa
requirements will be met, whereas the wind will
induce an important error on the result [1].
This paper aims at:
− Presenting and discussing the calculation
method of standard ISO 9972 regarding the
uncertainty induced by wind.
− Gathering published knowledge and
determining what further research is needed
on the quantification of the wind impact on
airtightness tests results. This includes
numerical simulations, laboratory and on-
site measurements studies.
− Giving guidance for minimizing and better
estimating the wind impact on airtightness
tests results.
2 Existing measurement standards
The international standard ISO 9972:2015,
ASTM 779-19, and CGSB 149.10-2019 provide
guidance for the determination of air
permeability of buildings through the fan
pressurization method. In those standards, the
impact of the wind on the airtightness results is
considered as follows:
Wind conditions
In ISO 9972, the wind speed must be recorded.
A visual assessment with the Beaufort scale is
considered sufficient. It is specified that a test is
unlikely to meet zero-flow pressure
requirements in case of a “ground wind speed”
above 3 m/s, a “meteorological wind speed”
above 6 m/s or if the wind reaches 3 on the
Beaufort scale.
ASTM 779-19 states that strong winds shall be
avoided.
Zero-flow pressure difference
The zero-flow pressure difference is the
pressure difference between inside and outside
when the building is not artificially pressurized,
and is supposed to be an estimate of the
magnitude of actual wind and stack effects.
The term “zero-flow pressure difference” is
used in ISO 9972, but there is sometimes
confusion about its actual meaning:
− pressure difference across the building
envelope;
− or equilibrium internal pressure.
Theoretically, the zero-flow pressure difference
across the envelope should be used to fix the
lowest induced pressure difference. But
monitoring and controlling the induced pressure
during the test should be done by measuring the
internal equilibrium pressure which is less
sensitive to wind fluctuations than the pressure
differences across the envelope [2].
In ISO 9972, the zero-flow pressure can be
measured by temporarily covering the opening
of the blower door and must be recorded over a
period of at least 30 seconds with a minimum of
10 values. The following values are then
calculated (see ISO 9972):
− the average of the positive values of zero-
flow pressure difference, Δp01+,
− the average of the negative values of zero-
flow pressure difference, Δp01-, and
− the average of all values of zero-flow
pressure difference, Δp01.
The same measurements must be done at the
end of the test (to obtain Δp02+, Δp02-, and Δp02).
If the absolute value of any one of these
pressure differences is higher than 5 Pa the test
is considered as not valid.
In ASTM 779-19, the zero-flow pressure is
measured before and after the flow
measurements, it is averaged on at least a 10s
interval.
CGSB 149.10-2019 has an appendix of options
for wind-pressure dampening for reducing test
uncertainty. For time averaging, this standard
recommends taking ten 10-second baseline
pressure readings and increasing the required
sampling time based on the variability between
the ten measurements as follows:
− If the largest variation is ≤ 1 Pa the default
10 second time averaging is sufficient.
V. I. P. n°41 3 March 2021
− For 1 Pa < variation ≤ 2 Pa use 20 second
time averaging.
− For a variation >2 Pa use 30 second time
averaging.
Pressure difference sequence
In ISO 9972, at least five approximately equally
spaced data points are measured starting from
approximately 10 Pa of indoor-outdoor pressure
difference (Δpi), with increments of at most 10
Pa and with a high-pressure point of at least 50
Pa. It is recommended to carry out two sets of
measurements, for pressurization and
depressurization.
In ASTM 779-19, induced pressure from 10 to
60 Pa with increments of 5 to 10 Pa are
measured. Values are averaged over at least 10s.
If this not possible, a partial range can be
measured with at least 5 data points.
Pressure tap location
In ISO 9972, The pressure difference is usually
measured at the ground level. It is required to
ensure that the interior and exterior pressure
taps are not influenced by the fan. It is
recommended to protect the exterior tap from
the sun and from the effects of air impinging on
the open end (by using a T-pipe for example). It
is good practice to place the end of the tap some
distance away from the building and other
obstacles. This suggests that ISO 9972 aims at
testing equilibrium internal pressure.
On the contrary, the ASTM E 779 method
suggests a pressure tap on each face of the
building that is then averaged using a manifold.
ASTM recommends when possible to collate
the pressure tap at the bottom of the leeward
wall. Both the American standard ASTM E
779-03 (§8.8) and Canadian standard
CAN/CGSB-149.10-2019 (§6.2.2) are clear on
the fact that the zero-flow pressure difference
refers to the pressure difference across the
building envelope.
CGSB 149.10-2019 also recommends using
longer tubing (up to 30 m), the use of capillary
tube and protecting the pressure tap using a drop
cloth and avoiding practices that could increase
the influence of wind, such as placing the
outdoor pressure tap in a container or cavity.
Calculation of the air leakage rate
The average zero flow pressure difference Δp0
(average between Δp01 and Δp02) is subtracted
from each of the internal pressure
measurements (Δpi). This would theoretically
cancel the wind effect if:
1) the wind was steady in direction and
velocity
2) and the flow was a linear function of
pressure (n=1 in equation (1))
In real conditions, while imperfect, it reduces
the impact of the wind on test results but does
not eliminate it.
The ordinary least square technique is used to
determine the air flow coefficient C and the air
flow exponent n:
qBD = C(Δ𝑝𝑖 − 𝛥𝑝0)𝑛 (1)
ISO 9972 claims that the overall uncertainty for
tests in accordance with this standard can be
calculated and is estimated to be under 10% for
calm conditions and to reach 20% in windy
conditions. Nevertheless, it may not take into
account every source of uncertainty as
discussed in [3].
The airtightness indicator is calculated from the
determined C and n coefficients at a reference
pressure which is usually 50 Pa but can also be
4 Pa, 10 Pa or 75 Pa.
3 Quantification of the impact of wind on the airtightness tests in literature
3.1 Simulation
3.1.1 Impact of steady wind
The impact of a steady wind on the airtightness
test has been studied numerically. Although real
winds are fluctuating in time and space, this is a
first step to evaluate the impact of wind.
Bailly et al. [4] have studied with the software
CONTAM the impact of wind depending on the
airtightness levels with variable wind speeds
(up to 9 m/s) and pressure (up to 70 Pa and -70
Pa) on three geometric models with different
Air Infiltration and Ventilation Centre 4 www.aivc.org
leakage distributions. They have concluded
that:
− The wind could be responsible for
significant errors on the estimation of
Q4Pa_surf, reaching more than 35% in some
cases for an individual measurement of
pressurization or depressurization with
pressure conditions within the limits of the
standard.
− Carrying out both pressurization and
depressurization tests could reduce this
deviation in a very important way.
− The pressure differences subtraction
imposed by the protocol might not be the
best one to reduce the measurement error.
Not long after, Carrié and Leprince presented a
mathematical model to calculate the error due to
steady wind in building pressurization tests [5].
It was applied to a simplified one-zone building
model with one leak on the windward side and
one leak on the leeward side, and a range of
input parameters including a leakage
distribution ratio ranging from 0.1 to 160 and a
wind speed ranging from 0 to 10 m/s. The
maximum errors were identified, and the main
results are (with criteria of ISO 9972 fulfilled):
− At 50 Pa (high pressure point), the error on
the estimated airflow rate due to wind is
relatively small: within 12% for wind
speeds up to 10 m/s;
− At 10 Pa, the error can reach 60% for wind
speeds up to 10 m/s and is therefore very
significant at the low pressure point;
− The results are very sensitive to the leakage
distribution for the low pressure point. In
detached buildings, the surface of leeward
walls and roof is usually around 4 times
greater than the surface of windward walls.
In case of rather evenly distributed air
leakages, characterized by a ratio between
leeward and windward walls from 3 to 8,
the error drops below 3% at 10 Pa.
The uncertainty due to wind is compared to
other sources of error, namely bias, precision
and deviation of the flow exponent in [6] and
[7]. It is found as additional results that:
− At the high pressure point, the uncertainty
due to wind up to 6 m/s remains smaller
than that due to other sources of
uncertainties, whereas when a two-point
pressurization test is performed to calculate
flowrate at 4 Pa, the impact of wind may
become dominant at 4 m/s;
− For single-sided dwellings or zones, to
estimate flowrate at 4 Pa, it is better to
perform:
o up to 5 m/s, a 2-pressure point test
and extrapolate with a calculated
flow exponent;
o above 5 m/s, a test at 50 Pa and
extrapolate to 4 Pa with a default
flow exponent;
− The low pressure point is more sensitive to
bias and precision errors;
− Having a constraint either on the zero-flow
pressure or on wind speed seems effective
to control uncertainty (provided these
quantities can be adequately measured);
− Averaging results between pressurization
and depressurization is mostly beneficial at
intermediate wind speed (around 4 m/s)
when a reference pressure of 4 Pa is used;
− The error due to steady wind depends on the
leakage distribution and is mostly critical
for single-sided dwellings.
3.1.2 Impact of unsteady wind
Wind has not only a potential impact on
airtightness tests because of its mean intensity
but also because of its fluctuations in speed and
direction.
In [8], Carrié and Mélois model pressurization
tests with periodic wind applying quasi-steady
compressible and isothermal models of a
pressurization test. Their analyses show that the
wind fluctuations can yield much larger
uncertainties than the average wind alone. In
addition, they have shown the significant impact
of the wind frequency on the results and have
confirmed that ignoring the zero-flow pressure
uncertainty is inappropriate because of its
significant contribution to the uncertainty of the
leakage airflow rate error. They estimate the
uncertainty on the air leakage coefficient for
one-point pressurization tests at a given
pressure station, but their models can be
extended to multi-point tests.
In addition, the impact of unsteady wind on the
air infiltration was recognized and studied
experimentally from the start of air infiltration
studies [9] [10], even if mean values are until
V. I. P. n°41 5 March 2021
now usually considered to facilitate
calculations.
Wind frequencies and the induced pressure on
buildings was studied first for wind load
calculations [11].
Cockroft and Robertson [12] looked at the
effects of turbulence-induced ventilation on
single openings and Crommelin and Vrins [13]
expanded this for different window opening
types.
In 1991 Haghighat also used this knowledge
and presented a power spectrum analysis
approach to model pulsating air flows due to
turbulent wind-induced pressures with an
application for a single-opening and a two-
opening cases [14]. He used the empirical
formula of Davenport to describe the wind
velocity spectrum resulting from a study of
about 70 spectra of the horizontal components
of gustiness in strong winds [15]. The peak of
the wind spectrum was found within
approximately 2 minutes, a measurement of
unsteady wind should therefore last longer to
capture this peak. One conclusion was that for
the single-opening case the turbulence in the
airflow rate is concentrated in the higher
frequency range (around 0.1 Hz) whereas for
the two-opening case it is around the same
frequency range of the wind pressure (around
0.008 Hz), which means multi-openings
configurations are also necessary for
experiments.
In UK, Etheridge studied the effect of
fluctuating winds in natural ventilation design,
inducing unsteady flow effects, with a specific
focus on the instantaneous flow rates [16] and
the mean flow rates [17]. Even if the
conclusions are not directly linked to the
airtightness tests issue, the wind fluctuation
models can be drawn upon:
− Real pressure data using full-scale wind
pressure measurements on a test building
with a pitched roof [18]
− Hypothetical gust in low wind speed
conditions with smooth transition to the
gust with time to avoid discontinuities.
More recently, in a CFD study, Kraniotis [19]
simulated the impact of wind gustiness on
infiltration rates with two levels of gust
frequency expressed as a sinusoidal factor in the
wind profile formula, and various cases of
internal and external leakage distributions. It
was shown that the ACH increases from about
100% during a windy day (mean velocity of 5
m/s) characterized by high-frequent gusts of 0.5
Hz compared to low-frequent gusts of 0.1 Hz.
In this case, wind gusts can create high pressure
differences of the same magnitude as an
airtightness pressurization test at 50 Pa. Gusts
are therefore marked out as potential critical
factors under unsteady winds, as well as the
internal leakages since a relatively tight
partition element could result in lower ACH. It
is also pointed out that wind gusts have a more
significant impact for evenly distributed air
leakages between the windward and the leeward
sides.
In [20] and [21], Kraniotis suggests a multiple
linear regression based on a limited number of
samples for the ACH prediction that takes into
account the gust frequency, the gust normalized
cumulative strength, the wind direction, as well
as the mean velocity. When tested with various
time intervals (1s, 2s, 1 min and 10 min) for
depicting the wind gust phenomena, it was
shown that the ACH is more accurately
predicted for 1s and 2s time intervals, when
high-frequency wind gusts are taken into
account, the most gust the wind has the more the
interval matters.
3.1.3 Limits and further research needed
Including stack effect and multizone buildings
for steady wind simulations
On the simulation of the steady wind impact on
airtightness tests, it would be good to carry out
further research to combine the impact of the
wind and stack effect, which was also
highlighted by [6] [14]. Information is also
missing on the interdependency of different
zones, for example a crawl space attached to a
building, concerning internal pressures and air
movements at different wind and temperature
conditions.
A better characterization of unsteady winds
With regard to the impact of unsteady wind, one
critical point for accurate simulations is a good
wind description, as shown by Haghighat et al.
[14]. A large number of experimental
Air Infiltration and Ventilation Centre 6 www.aivc.org
measurements of the wind behaviour at high
frequency (with various turbulence, roughness,
intensity) would be helpful both to calculate
wind spectra and to identify relevant-for-
infiltration indicators for characterizing
dynamic winds and wind gusts. It is, however,
not easy to determine where exactly these
measurements should be made:
− At a height of about 10 m, the wind can be
measured without the influence of the
surrounding obstacles, but differs from the
wind impacting the façades of a real
building in their specific environments.
− On the other hand, around a given building
the wind is different at each point in its
surrounding and such specific
measurements, despite their value for
understanding the local phenomena and
explaining the deviations from the
generally predicted results, may not be
helpful for generalisation attempts.
Detailed wind spectra measurements were made
in various locations for other fields of research
such as wind energy assessment with tower
measurement in Western Nevada, USA [22];
estimation of the wind load impact on structures
such as the ALMA antenna in Chile [23] or the
comprehension of meteorological phenomena
such as the cold-air pools in Salt Lake City [24].
These spectra may be partially helpful for
studies on the wind impact on airtightness tests
but one should note that each of them are
specific and appropriate to the purpose of the
study, for example in terms of the measurement
height, frequency and the intensity of the wind
recorded.
It is also needed to quantify the variability of air
flow rates driven by wind. The wind pressure
coefficients used to convert mean wind speeds
and air leakage test results into air flows already
include turbulent effects, but only for a “typical
atmospheric boundary layer”. The effects of
windward obstacles, such as neighbouring
buildings, trees etc. on both mean windspeeds
and wind pressures have been investigated in
wind tunnel studies (e.g. [25] and [26]), flow
visualization experiments ([27], [28] and [26])
and development of simplified estimates of
surface pressures [29]. The flow fields in most
urban environments tend to be complex and
highly dependent on the specific building
geometries being studied. This makes it
impractical to provide guidance or calculation
procedures that would account for these effects
in air leakage testing.
Additionally, even with the same mean velocity
and low turbulence wind direction fluctuations
changes the wind pressures. It could be argued
that short term wind direction fluctuations are
“turbulence”. Panofsky and Dutton (1986)
estimated crosswind RMS velocities of about
20% independent of longer scale wind direction
changes [30].
Simulations on pressurized buildings
There is a need for directly modelling the
impact of unsteady winds on airtightness
pressurization tests results, with cases of over
and under-pressurized volumes. This would
also allow to identify characteristics and
indicators of unsteady wind that are most
critical for this specific issue and value
thresholds associated with estimated induced
errors. As an alternative, the impact of the
unsteady wind numerically studied in terms of
additional infiltration rates can be translated
into additional external pressure field (positive
or negative) on the envelope and compared to
the internal pressure induced during an
airtightness test. This was done by Kraniotis
[20] but could be applied to the other studies
focused on the infiltration rates.
A better knowledge of leakages behaviour
according to wind variations
Finally, real air leakages do not all have the
same behaviour under wind gusts. One can
assume that when facing high frequency wind
gusts, because of fluid inertia in cracks and
boundary layer development, small undirect air
paths induce a reduced and delayed response in
flowrates compared to large and direct holes. In
order to have accurate numerical simulations,
there is a need for first monitoring differential
pressures variations across a large range of air
leakages and for various types of wind gusts.
3.2 Laboratory measurements
3.2.1 Review of studies
Zheng et al. [31] have tested the airtightness of
a chamber with both the blower door and the
pulse method under various leakage and wind
conditions. The measurements were made
V. I. P. n°41 7 March 2021
outdoors, but a steady wind with various
velocities was artificially produced by a fan,
which resemble laboratory conditions. They
found out that for airtightness tests at 4 Pa, high
wind speeds (4 m/s – 9.5 m/s) in one direction
induce 16% to 24% lower results of air
permeability, whereas it becomes mostly
insignificant under 3.5 m/s.
In [32], Mélois has developed an experimental
set-up to estimate the impact of wind on the
result of airtightness test (Figure 1). Part of the
work performed aimed at reaching a realistic
representation on a reduced-scale model. First
measurements focused on the comparison of
one-point, two-point and multi-points (ISO
9972) measurements. According to her result,
under steady wind conditions, the ISO 9972
analysis is more appropriate than a 1-point
method and a 2-point method for an airtightness
indicator at 50 Pa. For an indicator at 4 Pa, the
following results have been obtained:
− When leakage is mostly on the leeward
side, the ISO 9972 measurement method is
more reliable than a 1-point method and a
2-point method, for all wind speeds;
− When leakage is mostly on the windward
side, a 1-point analysis with a pressure
station at 50 Pa or 100 Pa gives lower error
when the wind is above 4 m s-1.
Until now, to the best of our knowledge, there
is no other laboratory measurements results
published on the impact of wind on airtightness
tests, but related studies have been published in
the past decades.
One closely related field of research is the
determination of the external pressure
coefficients Cp on buildings. A large number of
studies have been carried out in wind tunnels,
mostly with reduced-scale measurements under
steady wind conditions, to characterize the
pressure on the envelope of typical geometries
or specific constructions [33]. Most studies
reproduce the vertical mean and turbulent wind
profiles found in atmospheric boundary layers
when measuring wind pressure coefficients
suitable for ventilation calculations (as opposed
to structural loads).
Akins et al. [34] measured surface pressures on
a cube rather than a model house but their
values of Cp are within the range of values
presented elsewhere (1989 ASHRAE
Handbook of Fundamentals [35], Liddament
[36] and Wiren [25]) for isolated buildings.
Akins et al. also covered the most
comprehensive set of wind directions and thus
their data is most useful in developing
correlations of pressure coefficients with wind
angles. Wiren also included tests of houses in
rows (typical of most residential
neighbourhoods) and for pitched roof surfaces
[25]. Sheng at al. [37] have carried out reduced-
scale wind tunnel measurements on a high-rise
building. They managed to reproduce well the
theoretical mean velocity, turbulence intensity
and power spectra of the expected modeled
atmospheric boundary layer (ABL) according to
Eurocode 1 [38] using roughness elements.
However, the lower the building, the more the
environment is impacting the ABL and
theoretical wind characteristics are less
representative of reality.
Jafari et al. noted that if it is possible in wind
tunnels to achieve similarity of the turbulence
spectra, length scale and intensity for large
structures as high-rise buildings, for low-rise
buildings the similarity is often compromised
by technical challenges [39]. As a consequence,
the pressure coefficients measured in wind
tunnels are less accurate. Hölscher and
Niemann noted for example a peak pressure
coefficient varying by 12% when increasing the
building model height from 100 mm to 250 mm
in six studies [40].
Van Beek et al. [41] could match wind tunnel
and field tests results for wind gusts longer that
3s by applying a pressure correction based on
the ABL turbulence. However, they concluded
that for more extreme gusts (<3s) a spectral
scaling of the ABL has to match the model scale
since they interact with the ABL turbulence
structures.
As for simulations, unsteady winds are also
studied in laboratory for their impact on the
natural ventilation. Chiu and Etheridge [42]
have carried out measurements in wind tunnels
to determine the impact of unsteady winds on
the airflow in naturally ventilated buildings
with stacks and detect flow reversal
phenomena. Pressure fluctuations were
generated in the tunnel but with the purpose to
be close to what can occur at full-scale, without
Air Infiltration and Ventilation Centre 8 www.aivc.org
trying to reproduce specific characteristics of
unsteady winds.
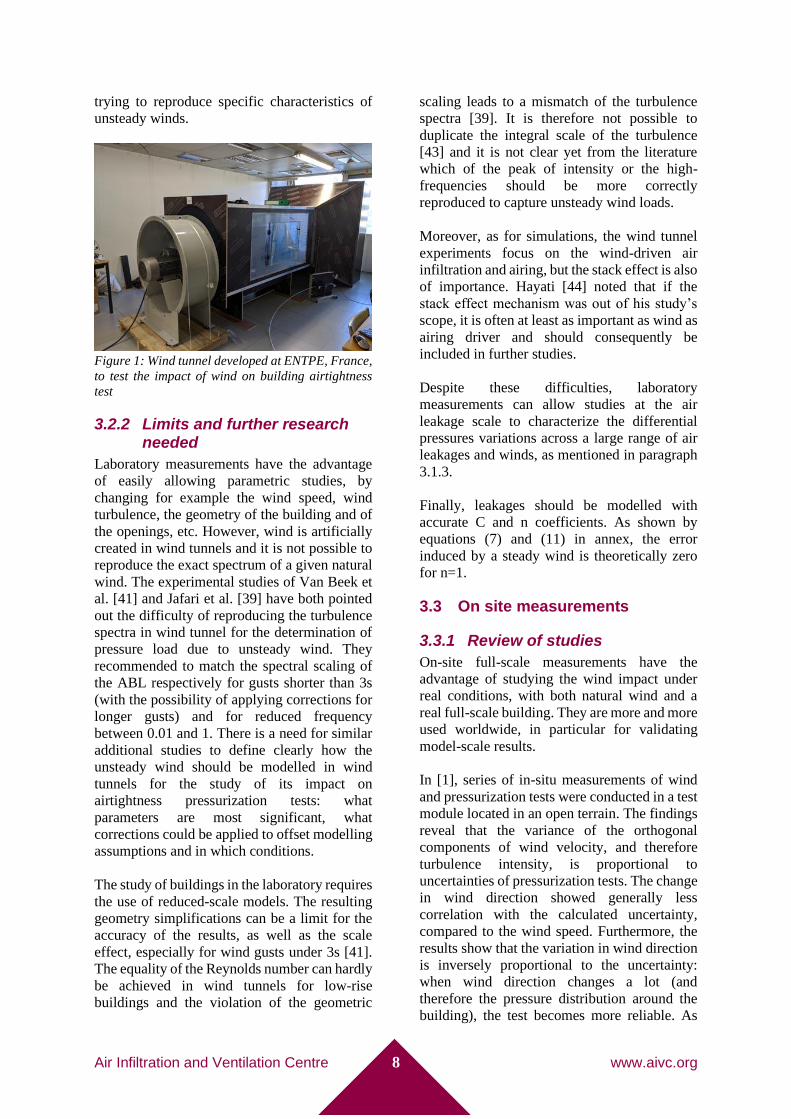
Figure 1: Wind tunnel developed at ENTPE, France,
to test the impact of wind on building airtightness
test
3.2.2 Limits and further research needed
Laboratory measurements have the advantage
of easily allowing parametric studies, by
changing for example the wind speed, wind
turbulence, the geometry of the building and of
the openings, etc. However, wind is artificially
created in wind tunnels and it is not possible to
reproduce the exact spectrum of a given natural
wind. The experimental studies of Van Beek et
al. [41] and Jafari et al. [39] have both pointed
out the difficulty of reproducing the turbulence
spectra in wind tunnel for the determination of
pressure load due to unsteady wind. They
recommended to match the spectral scaling of
the ABL respectively for gusts shorter than 3s
(with the possibility of applying corrections for
longer gusts) and for reduced frequency
between 0.01 and 1. There is a need for similar
additional studies to define clearly how the
unsteady wind should be modelled in wind
tunnels for the study of its impact on
airtightness pressurization tests: what
parameters are most significant, what
corrections could be applied to offset modelling
assumptions and in which conditions.
The study of buildings in the laboratory requires
the use of reduced-scale models. The resulting
geometry simplifications can be a limit for the
accuracy of the results, as well as the scale
effect, especially for wind gusts under 3s [41].
The equality of the Reynolds number can hardly
be achieved in wind tunnels for low-rise
buildings and the violation of the geometric
scaling leads to a mismatch of the turbulence
spectra [39]. It is therefore not possible to
duplicate the integral scale of the turbulence
[43] and it is not clear yet from the literature
which of the peak of intensity or the high-
frequencies should be more correctly
reproduced to capture unsteady wind loads.
Moreover, as for simulations, the wind tunnel
experiments focus on the wind-driven air
infiltration and airing, but the stack effect is also
of importance. Hayati [44] noted that if the
stack effect mechanism was out of his study’s
scope, it is often at least as important as wind as
airing driver and should consequently be
included in further studies.
Despite these difficulties, laboratory
measurements can allow studies at the air
leakage scale to characterize the differential
pressures variations across a large range of air
leakages and winds, as mentioned in paragraph
3.1.3.
Finally, leakages should be modelled with
accurate C and n coefficients. As shown by
equations (7) and (11) in annex, the error
induced by a steady wind is theoretically zero
for n=1.
3.3 On site measurements
3.3.1 Review of studies
On-site full-scale measurements have the
advantage of studying the wind impact under
real conditions, with both natural wind and a
real full-scale building. They are more and more
used worldwide, in particular for validating
model-scale results.
In [1], series of in-situ measurements of wind
and pressurization tests were conducted in a test
module located in an open terrain. The findings
reveal that the variance of the orthogonal
components of wind velocity, and therefore
turbulence intensity, is proportional to
uncertainties of pressurization tests. The change
in wind direction showed generally less
correlation with the calculated uncertainty,
compared to the wind speed. Furthermore, the
results show that the variation in wind direction
is inversely proportional to the uncertainty:
when wind direction changes a lot (and
therefore the pressure distribution around the
building), the test becomes more reliable. As
V. I. P. n°41 9 March 2021
expected, when the wind blows against the fan,
or a big leakage, the main source of error is due
to this direct flow of wind on the fan (or on a
big leakage), it overlaps any other source of
error related to wind.
Walker at al. [45] [46] have analyzed over 6000
blower door measurements from six test houses
tested in various configurations by opening and
closing flues, windows, passive vents to get a
wide range of airtightness levels, leakage
distribution and air flow paths. With up to 100
tests by configurations and using on-site wind
measurement at 10 m they could study the errors
induced by fluctuating wind pressures. They
found out as main conclusions, which are rather
consistent with the more recent simulation
results mentioned above [6], that:
− For low wind speeds below 3 m/s, multi
pressure point testing is recommended and
is about 10% better at estimating the
equivalent leakage area at 4 Pa than single-
point testing, mostly because of the error
due to the fixed exponent assumption.
− For wind speeds above 6 m/s, single point
testing at 50 Pa is recommended, since it is
less subject to wind pressure fluctuations
errors.
− An average of pressurization and
depressurization tests results should be
used, otherwise the additional uncertainty is
estimated at about 12%.
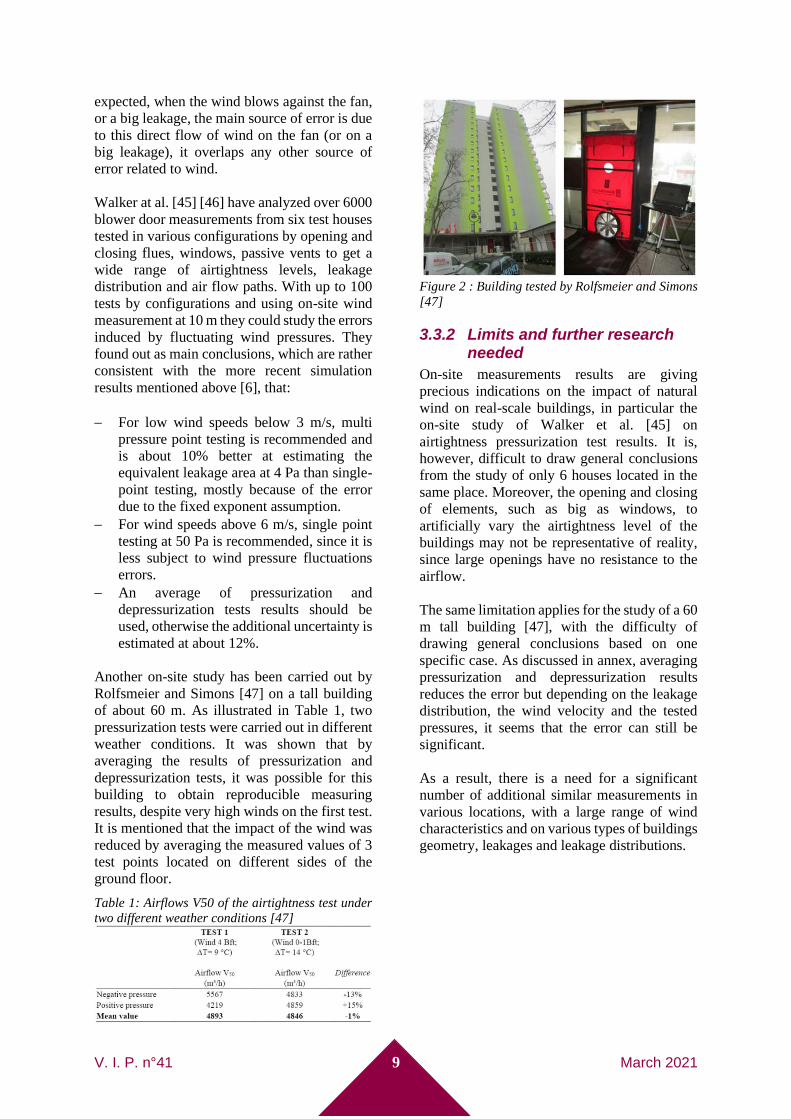
Another on-site study has been carried out by
Rolfsmeier and Simons [47] on a tall building
of about 60 m. As illustrated in Table 1, two
pressurization tests were carried out in different
weather conditions. It was shown that by
averaging the results of pressurization and
depressurization tests, it was possible for this
building to obtain reproducible measuring
results, despite very high winds on the first test.
It is mentioned that the impact of the wind was
reduced by averaging the measured values of 3
test points located on different sides of the
ground floor.
Table 1: Airflows V50 of the airtightness test under
two different weather conditions [47]
Figure 2 : Building tested by Rolfsmeier and Simons
[47]
3.3.2 Limits and further research needed
On-site measurements results are giving
precious indications on the impact of natural
wind on real-scale buildings, in particular the
on-site study of Walker et al. [45] on
airtightness pressurization test results. It is,
however, difficult to draw general conclusions
from the study of only 6 houses located in the
same place. Moreover, the opening and closing
of elements, such as big as windows, to
artificially vary the airtightness level of the
buildings may not be representative of reality,
since large openings have no resistance to the
airflow.
The same limitation applies for the study of a 60
m tall building [47], with the difficulty of
drawing general conclusions based on one
specific case. As discussed in annex, averaging
pressurization and depressurization results
reduces the error but depending on the leakage
distribution, the wind velocity and the tested
pressures, it seems that the error can still be
significant.
As a result, there is a need for a significant
number of additional similar measurements in
various locations, with a large range of wind
characteristics and on various types of buildings
geometry, leakages and leakage distributions.
Air Infiltration and Ventilation Centre 10 www.aivc.org
4 Minimizing and better estimating the wind impact on airtightness tests results
4.1 Pressure difference measurement method
The Δp0 measurements allow both to avoid tests
in case of strong wind and stack effects
(Δp0>5Pa) and to minimize these effects with a
subtraction on each pressure measurement
during the pressurization test. If the interest is
focused on wind, one should note that it gives
information on the average response of the
building rather than the impact on pressure
differences at individual air leakages. This
subtraction would therefore be appropriate for
linear behaviour (n=1) but in reality, because of
the non-linearity and as discussed in annex, it is
possible to measure a Δp0 (induced pressure) of
zero, but still have a significant error due to
wind in the flowrates estimation. Moreover, as
mentioned in §3.1.2 this is optimal for rather
steady winds, but less appropriate to cancel the
effects of wind gusts as detailed below.
Fluctuations during the test:
The monitoring time of the zero-flow pressures
is usually very short compared to the duration
of the pressurization test, and may miss the
peaks of wind intensity and changes in wind
speed and direction.
It could be useful to detect strongly fluctuating
wind which induce higher uncertainties by
quantifying the variability in the Δp0 and each
pressure station measurements. For example, a
standard deviation or a maximum difference
could be calculated on the values used for the
average calculation. A corresponding threshold
value for which the test is not valid could also
be defined.
However, the big errors occur when the wind
speed and direction during the zero-flow
measurement is not the same as during the
actual measurement. These differences get
bigger at higher wind speeds. One could add a
third zero-flow pressure measurement in the
middle of the test, however, since by definition
zero-flow pressure cannot be measured
simultaneously with the pressurization test, it
would lengthen the test duration and therefore
potentially making it worse.
In case of large variations between the
beginning and the end of the measurement an
option could be to estimate the zero flow
pressure at a given moment (for each
measurement points) through a linear regression
instead of only calculating the average of the
two readings.
The only way to detect those fluctuations would
be a monitoring of the wind during the entire
test.
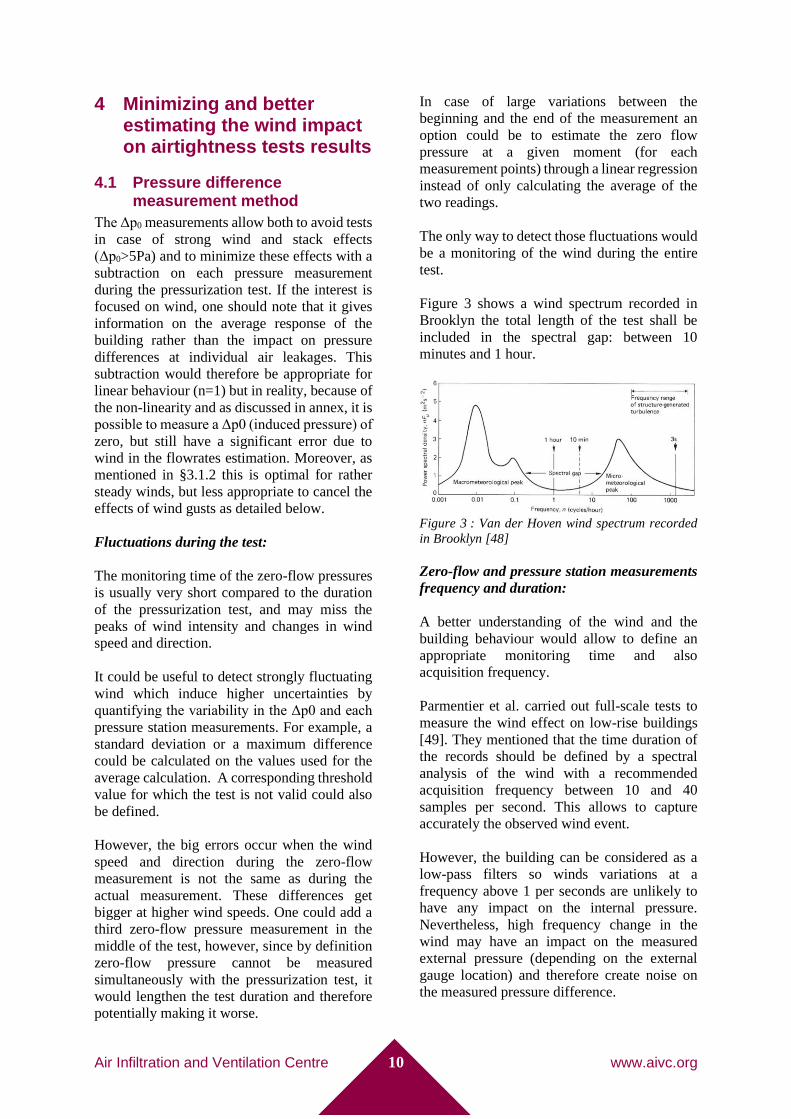
Figure 3 shows a wind spectrum recorded in
Brooklyn the total length of the test shall be
included in the spectral gap: between 10
minutes and 1 hour.
Figure 3 : Van der Hoven wind spectrum recorded
in Brooklyn [48]
Zero-flow and pressure station measurements
frequency and duration:
A better understanding of the wind and the
building behaviour would allow to define an
appropriate monitoring time and also
acquisition frequency.
Parmentier et al. carried out full-scale tests to
measure the wind effect on low-rise buildings
[49]. They mentioned that the time duration of
the records should be defined by a spectral
analysis of the wind with a recommended
acquisition frequency between 10 and 40
samples per second. This allows to capture
accurately the observed wind event.
However, the building can be considered as a
low-pass filters so winds variations at a
frequency above 1 per seconds are unlikely to
have any impact on the internal pressure.
Nevertheless, high frequency change in the
wind may have an impact on the measured
external pressure (depending on the external
gauge location) and therefore create noise on
the measured pressure difference.
V. I. P. n°41 11 March 2021
Regarding the duration of the measurements,
Prignon et al. suggested that the approximation
period should be increased to 60 s on medium-
wind days (to reduce the uncertainty by 11%),
and to 90 s on high-wind days (to reduce the
uncertainty by 9%) [50]. However, this
improvement depends on the duration of the fan
pressurization test itself and, at some point,
increasing the duration of the measurement
would not reduce the uncertainty anymore
because the test would then be measuring
changes in mean wind speed and direction
rather than fluctuations about a mean.
Research is still needed to determine the best
frequency and duration of pressure
measurement, however the following advice
could be given for the data acquisition:
− A duration between 30s and 60s for each
pressure station (including zero-flow
pressure)
− 1 data per second
− Each data being the average of at least 10
points within a second (to flat the noise due
to high frequency wind on outdoor
pressure).
Derived parameters
Estimates of turbulence intensity and peak
pressures may be useful guides to indicate the
magnitude of test uncertainty or whether a test
result is likely to be acceptable within certain
error bounds. Only averages of at least 10
values are considered in the standard for the
Δp0 measurements, which means potential
peaks of wind intensity can be underestimated
in magnitude. For a proper correction purpose,
it seems therefore appropriate to have pressure
measurements during the airtightness test
similar to the zero-flow pressure measurement,
namely an average of the same number of
values over the same time interval. Delmotte
pointed out that the uncertainty calculation in
the standard does not take into account the
effect of averaging the zero flow pressure
measurements and suggested a corrective
formula [3]. Prignon et al. quantified with field
tests that uncertainties in zero-flow pressure
represent more than 75% of the envelope
pressure uncertainties whatever the wind
conditions [50].
4.2 Location of pressure taps
The location of the external pressure probe is of
importance since pext is used as reference for
every relative internal pressure measurement,
including Δp0. Existing standards have different
recommendations for pressure tap location as
discussed in §2.
Novák [51] conducted airtightness
measurements on a single-family house 9 times
and calculated five air flow rates (q50) based on
each of the 4 external pressure taps located on
the different sides of the house (ground level, at
5-8 meters from the façade) and on the averaged
value. The wind conditions were rather similar
the 9 days, with low wind around 2-3 m/s and
he concluded that under these conditions the
location of the external pressure tap was not
impacting the repeatability. He however
stressed out that the use of T-pieces, the longer
periods of record, as well as the distance of the
pressure taps from the façades could also
explain this result.
On the other hand, Delmotte stated that, because
of the wind, the nature and the location of the
pressure taps play a crucial role in the
measurement uncertainty [2]. He tested
numerically the impact of placing the external
tap in free field, on the windward roof and on
the leeward façade for a residential building. If
for light wind of 1 m/s no impact was noted, for
a wind of 4 m/s an error of 13% was found for
the leeward façade compared to 2% for the other
two locations. He confirmed the
recommendations of ISO 9972 (also discussed
in annex) on how to place the pressure taps and
advises to use an exterior pressure tap designed
to measure the static pressure only.
In [52], Modera and Wilson analyzed field
testing results to show:
− a slight negative bias in leakage area
measurement with increasing wind speed,
− that using four pressure taps averaged
together gave less bias than a single
pressure tap.
Recommendation for the location of the
external probe
Pressure measurement device (indoor and
outdoor) shall remain at the same location
Air Infiltration and Ventilation Centre 12 www.aivc.org
during the whole test (including the zero-flow
pressure measurement).
The probe should measure the external static
pressure and be placed some distance away
from the building and other obstacles. Place T-
connectors on the end of the external tubes.
Nevertheless, it is not always possible to find a
location for which the external static pressure is
not influenced by obstacles, in this case it is
better to place multiple pressure taps averaged
together.
4.3 Regression model and method
The quadratic law has been discussed as an
alternative to the commonly used power law
(equation (1)) for the equation linking the flow
rate and the differential pressure [53] [54] and
Okuyama and Onishi recently estimated that the
quadratic law would reduce regression
uncertainties for airtightness tests [55]. The
debate is not yet concluded but to our
knowledge there is no indication in the literature
if one law is better at minimizing the wind
impact on the airtightness test results.
The standard requires to use the least square
method to derive the C and n coefficients from
the experimental measurements, without further
precisions. The ordinary least square (OLS
method) is usually used but there are some
concerns about the validity of this method.
The Canadian standard (CAN CGSB-149.10-
2019) and the German national annex DIN EN
ISO 9972:2018-12 points out that measured
values at low pressure have a higher uncertainty
and a stronger influence on the result than
values at high pressure due to the non-linearity
of the pressure-flow relationship. To counteract
this and to obtain the smallest quadratic
deviation for the actual measured values, the
measured data must be weighted with the square
of the volume flow in the regression. This is the
weighted least squares (WLS) method.
Delmotte noted that the OLS method is
applicable when:
1) all the y (ln(q)) values are equally uncertain.
2) the uncertainties on x ln(Δp) are negligible
[56].
He advises to use weighted method of least-
squares (WLS) when condition 1) is not met and
condition 2) is met. He mentions the possibility
to use the effective variance method (solved by
iteration) when neither condition 1) nor
condition 2) are met. In a later publication [3],
he mentions that in practice both 1) and 2) are
not met and suggests the weighted line of
organic correlation (WLOC) method as an
alternative to the others. He applied both the
OLS and WLOC methods to a sample of 6
measurements and observed a significant
reduction of standard deviation with the WLOC
methods for pressure differences under 40 Pa
(about 30% at 10 Pa) and above 90 Pa.
A recent analysis [57] of almost 7500 blower
door tests have found that WLOC (using the
standard deviation of pressure and flow at each
pressure station as an indicator of uncertainty)
reduced uncertainties in C and n by about 20-
30%.
Okuyama and Onishi have suggested two
methods of weighting for the regression:
weighting by residuals and weighting by
measurement uncertainties. Weighting by
residual (IWLS) is helpful to reduce the impact
of sudden disturbances as wind gusts and seems
to be in general the most appropriate method
[55]. They also derived a method for estimating
the reliability of the C and n coefficients, with
both the calculation of more precise confidence
intervals and the definition of a discrepancy
ratio(β), indicating when measurements and
regression are not valid. This method was tested
on 5 actual buildings and β became larger than
1 in cases of strong wind or stack effects.
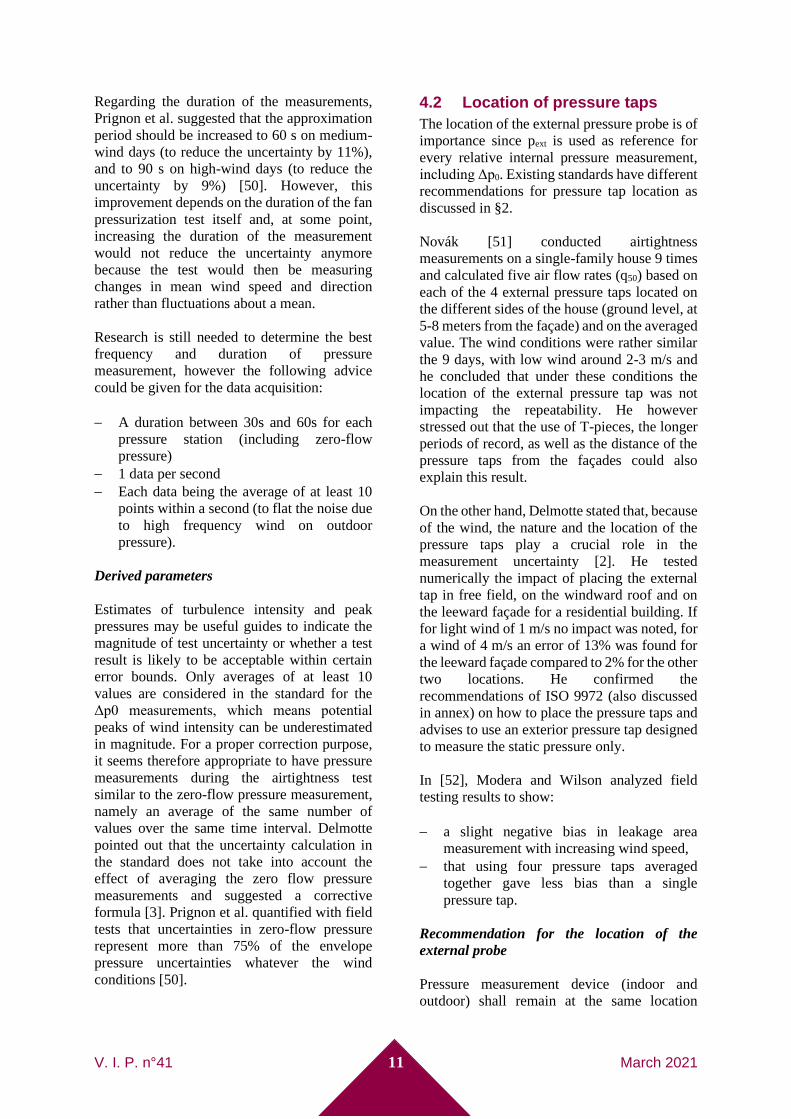
Finally, Prignon et al. [58] have compared the
OLS, IWLS and WLOC methods on a series of
30 tests on an apartment. They found that:
− similar air flow rates at multiple pressure
differences when averaging the 30 tests
results
− standard deviations of the air flow rates for
the 30 tests lower for WLOC and IWLS
than OLS for low and high pressures, but
similar for the 3 methods around 50 – 70 Pa
(Figure 4), which is consistent with [3].
V. I. P. n°41 13 March 2021
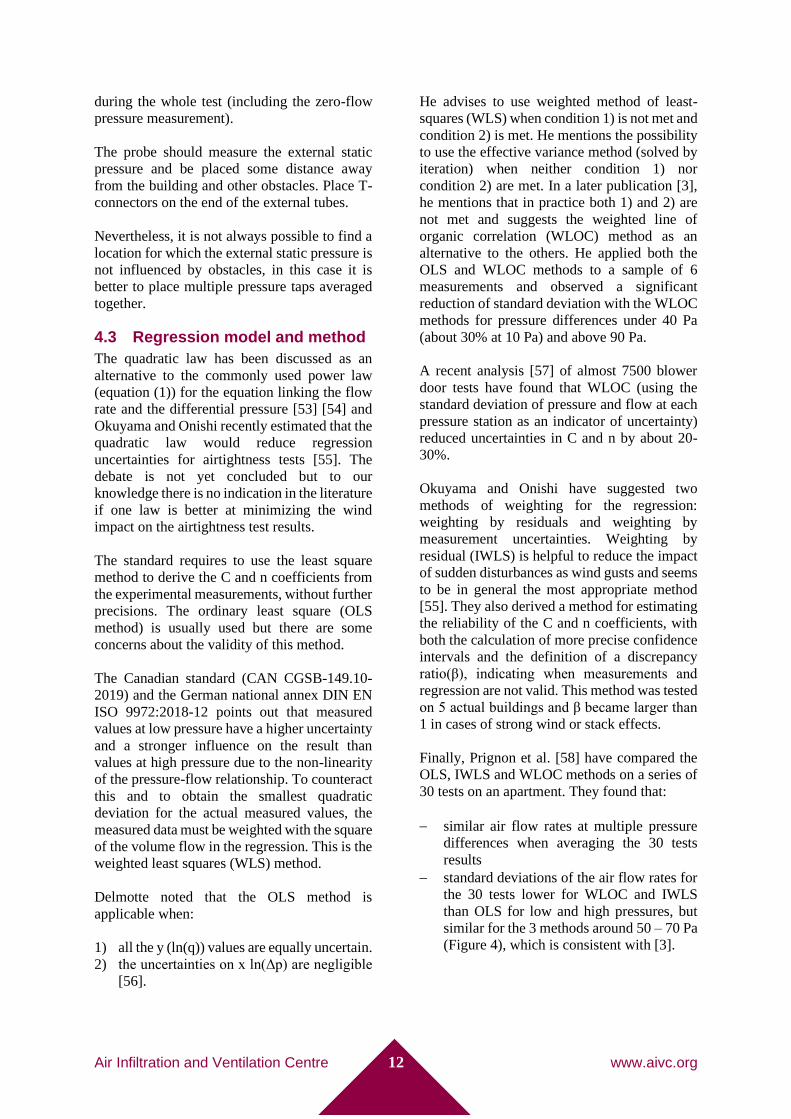
Figure 4 : Standard deviation (in %) of the airflow
rates computed for the 30 tests as a function of the
pressure difference for the OLS, the IWLS and the
WLOC regression methods [58]
4.4 Number of pressure points
One can note from Figure 4 that the standard
deviation is significant for low pressure
differences even with optimized regression
methods (about 4% for IWLS and WLOC and
7% for OLS at 4 Pa). On the other hand, at 50
Pa the 3 methods seem to give the same
deviation of just over 1%. The stronger and the
more unsteady the wind, the higher the standard
deviation is expected for low pressure
differences.
This is questioning the relevance of having low
pressure points. Another method would be to
have only one single point measure (for
example at 50 Pa), the zero-flow pressure and
then the flowrate (at 50 Pa) would be measured
at least 5 times to obtain 5 independent
measurements (each pressure station
subtracting its zero-flow pressure
measurement).
Having only one high measure point have the
following benefits regarding the reduction of
the impact of wind on the airtightness
measurement:
− The high-pressure point allows good
precision on the measurement, especially in
windy conditions (low standard deviation)
− The calculated air leakage would not be
influenced by the low-pressure points
affected by the wind and in general by the
regression error
− It would be easier to implement than
complex regression and/or the calculation
of a discrepancy ratio to minimize the
impact of wind
− The test would be quicker which limits the
chance of strong changes in wind direction
and intensity (compared to the zero-flow
pressure measurement). This gain in time
could encourage conducting both
pressurization and depressurization tests as
well as allowing longer durations of
pressure measurements. According to the
Van des Hoven spectrum the duration
should be between 10 min and 1 h, which
corresponds to the “spectral gap” allowing
to be independent of the macro and micro-
meteorological effects (see Figure 3).
On the other hand, if this alternative method is
appropriate for airtightness measurements with
good reproducibility, it may be less relevant for
infiltration rates estimations under natural
conditions. This is not only due to the fact that
the artificially induced high pressure during the
test may slightly deform the airtightness defects
but also and mostly because having only one
point measured supposes to use a theoretical
fixed n value to extrapolate the flow rate at
lower pressure. As discussed by Walker et al., if
the average value of n is known to be in the
vicinity of 0.65, the variation from home to
home is significant with a standard deviation of
0.057 from about 7000 measurements [45].
They noted that a change of 0.1 in this exponent
could induce an error of 29% in the
extrapolation from 50 to 4 Pa and 48% in the
extrapolation from 50 to 1 Pa. As a result, a
single high-pressure measurement is not
appropriate for detailed infiltration calculations
with known leakages distribution. One should
note however that this error may not be as
significant as the one induced by strong
modelling assumptions on the leakage
distribution.
4.5 Better estimating the impact of wind
ISO 9972: 2015 provides an uncertainty
calculation procedure, however this procedures
as multiple limits that could be improved:
− It does not include the zero-flow pressure
uncertainty on the total uncertainty
− It uses the OLS and, as seen in §4.3, which
assumes that the uncertainty on the pressure
measurement is negligible does not
properly takes into account the uncertainty
on the flowrate measurement

Air Infiltration and Ventilation Centre 14 www.aivc.org
− It does not provide a method to calculate the
coverage interval.
The French standard FD 50-784 (add-in to the
ISO 9972) states that if the uncertainty is above
10% then the test is not valid. This requirement
can prevent performing test in windy condition,
while, in some cases the result of a test with an
uncertainty above 10% can be enough to decide
whether the building has met or not a target
value.
To this end, the standard could first improve the
uncertainty calculation (using a WLOC
regression and including the zero-flow pressure
uncertainty) and secondly include the
calculation of a coverage interval (for example
at 95%) as defined in JCGM 102:2011. If the
confidence interval is below the target value
then the building has passed even if the
measurement uncertainty is above 10%.
Wind has an impact on both the random
measurement error (precision) and systematic
measurement error (bias). Uncertainty
propagation can however only estimate the
random measurement error. Estimation of
systematic measurement error has to be done by
other techniques.
5 Conclusion This paper presented a state of the art of the
numerical, laboratory and on-site studies on the
characterization of the wind impact on the
airtightness tests results. As detailed below, it
allowed to point out further research needed for
this purpose and to give possible guidance to
minimize the wind impact and improve test
standards.
5.1 Further research needed
For numerical simulations there is a need for:
− Including the stack effect and multizone
buildings in the numerical models (at least
for steady winds)
− Defining relevant-for-infiltration indicators
for characterizing dynamic winds and wind
gusts
− Applying models on pressurized buildings
for dynamic winds
− Increasing knowledge on buildings’
leakages behaviour according to wind
variations.
As for laboratory measurements, the need for
the following was pointed out:
− Additional studies to clearly define how the
unsteady wind should be modeled in wind
tunnels for the study of its impact on
airtightness pressurization tests: what
parameters are most significant, what
corrections could be applied to offset
modeling assumptions and in which
conditions
− Research on the impact of the interaction
between wind and stack effects on the result
of the test
− Studies the behavior of real leakage with
various frequency of wind gust to
characterize their response and evaluate
from which frequency wind gusts impact
the air flow rate.
Finally, concerning on-site measurements, there
is a need for a much more significant number of
studies measuring the impact of natural wind on
airtightness tests: in various locations, with a
large range of wind characteristics and on
various types of buildings geometry, leakages
and leakage distributions. There is also a need
to test various duration and frequency of each
pressure station measurement (including zero-
flow pressure). And, it would be interesting to
compare the result and the uncertainty of one-
point and multi-points measurement method
(with different kind of linear regression).
5.2 Recommendations to minimize the wind impact on the airtightness test results
In addition to existing recommendations in
standards, possible ways to reduce the wind
impact on the airtightness tests results were
pointed out:
− Improve pressure measurement
o Use a T-connector or equivalent to
ensure that only the static pressure
is measured
o Place the external pressure gauge
some distance away from the
building and other obstacles, if it is
not possible measure the outside
pressure at different sides of the
building and average the results
▪ In addition, the zero-flow
pressure across the
building envelope can be

V. I. P. n°41 15 March 2021
measured at different place
to determine the value of
the first measurement point
o The location of the pressure gauge
shall remain the same during all the
test
− Improve zero-flow and measurement-point
pressure characterization
o Increase the recorded period for
each pressure measurement from
30 s to 60 s on medium-wind days.
o Have an acquisition of 1 data per
second
o Each data is the average of at least
10 points within a second (to flat
the noise due to high frequency
wind on outdoor pressure)
− Adapt the pressure difference sequence
o Average the results of
pressurization and depressurization
tests
o To estimate a flowrate at 50 Pa,
perform a single-point test
o To estimate a flowrate at 4 Pa, with
a wind up to 5 m/s perform a multi
pressure-point test and extrapolate
with a calculated flow exponent,
and above 5 m/s perform a single-
point test at 50 Pa and extrapolate
with a default flow exponent (for
example n=2/3).
o Carry out similar pressure
measurements during the
airtightness test than during the
zero-flow pressure measurement
and use an average of the same
number of values over the same
time interval
− Improve the calculation method
o Use a WLS or WLOC method for
the regression
o Include the zero-flow pressure
uncertainty in the calculation of the
total uncertainty
o Provide a method to calculate the
coverage interval of the result
together with a decision rule.
By those means, one can reduce the wind
impact and obtain a more accurate a test result.
The improved calculation method allows a
better estimation of the measurement
uncertainty in order to take advantage of more
accurate results when comparing two test
results or checking the compliance with a limit
value.
6 Acknowledgments The authors would like to thank the following
people who contributed to this paper:
Christophe Delmotte (BBRI, BE), Dimitrios
Kraniotis (OsloMet, NO), Adeline Mélois
(CEREMA, FR), Gary Nelson (Energy
Conservatory, USA), Jiri Novak
(CVUT/(A.BD.CZ), CZ), Martin Prignon
(UCLouvain, BE), Paula Wahlgren (Chalmers,
SE), Iain Walker (LBNL, USA), Xiaofeng
Zheng (University of Nottingham, UK).
In addition, the authors are thankful to the
following people from the AIVC Working
Group (WG) on “Integrating uncertainties due
to wind and stack in declared airtightness
results”, who participated in the WG’s
meetings:
Christophe Delmotte (BBRI, BE), Fredrik
Domhagen (Chalmers, SE), Sonia García
Ortega (IETCC-CSIC, ES), Janette Hooper
(Retrotec, USA), Maria Kapsalaki (INIVE,
GR), Dimitrios Kraniotis (OsloMet, NO),
Adeline Melois (CEREMA, FR), Bassam
Moujalled (CEREMA, FR), Sam Myers
(Retrotec, USA), Gary Nelson (Energy
Conservatory, USA), Jiří Novák
(CVUT/(A.BD.CZ), CZ), Collin Olson (Energy
Conservatory, USA), Martin Prignon
(UCLouvain, BE), Stefanie Rolfsmeier
(Blowerdoor, DE), Max Sherman (LBNL,
USA), Ben Walker (Retrotec, USA), Iain
Walker (LBNL, USA), Paula Wahlgren
(Chalmers, SE), Xiaofeng Zheng (University of
Nottingham, UK)
Air Infiltration and Ventilation Centre 16 www.aivc.org
7 Annex: Equilibrium internal pressure meaning (Zero-flow pressure)
The wind has an impact on the airtightness test
result despite the zero-flow pressure
subtraction. To understand this, we need to
examine what the zero-flow pressure is exactly,
and what is the error on the air leakage
estimation induced by wind when using the
standard calculation method.
For this purpose, we will take the example of a
single-zone building with only two leaks: one
windward and one leeward that are assumed to
represent the leakages of respectively the
windward (experiencing positive pressure) and
all leeward façades (experiencing negative
pressure). This simple case allows to model
wind induced ventilation rates as mentioned by
Etheridge et al. [59] and implemented by
Carrié et al. [6].
Of course as stated by Carrié and Mélois [8],
this is a crude representation of the complexity
of real airflow paths. Nevertheless, it has the
advantage of remaining relatively simple while
allowing us to calculate the airflow rates in
leaks subjected to different pressures during a
pressurization test, which is the key problem in
presence of wind.
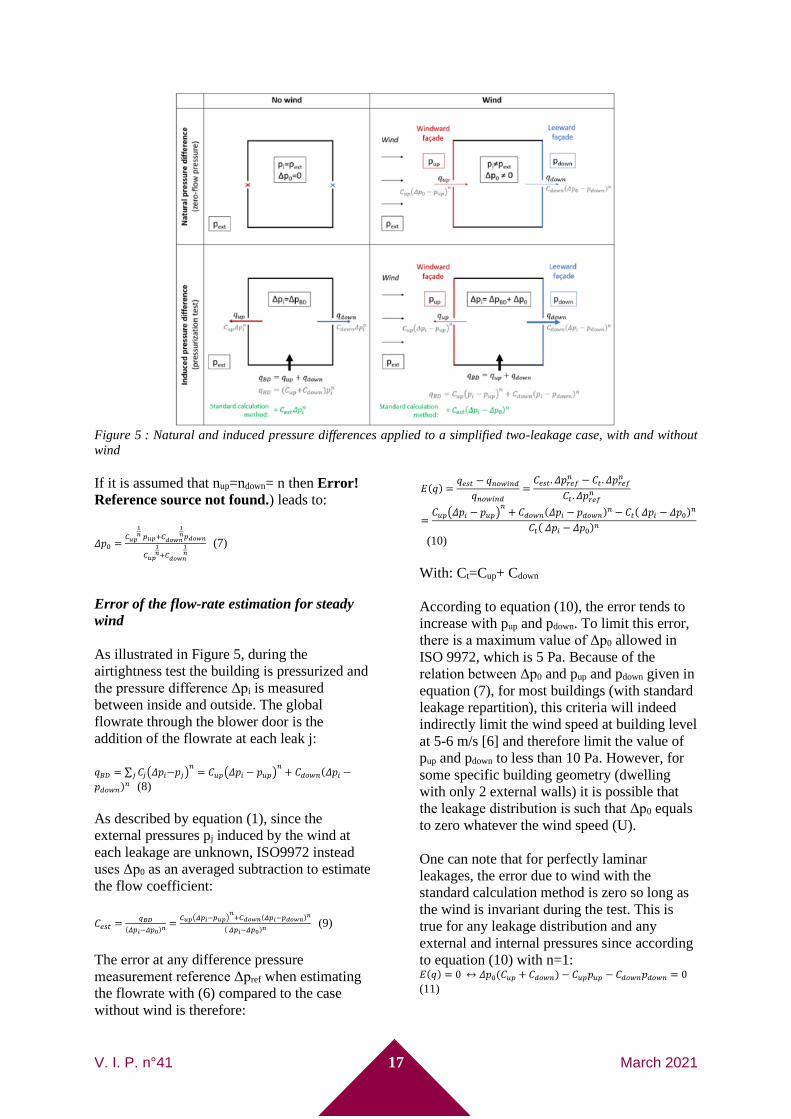
Zero-flow pressure
The zero-flow pressure (Δp0 ) is the difference
in static pressure between inside and outside,
in this annex the zero-flow pressure is
considered to be the equilibrium internal
pressure has defined in §2.
𝛥𝑝0 = 𝑝𝑖 − 𝑝𝑒𝑥𝑡 (2)
ISO 9972 (see §2) recommends to place the
external pressure gauge some distance away
from the building but not close to other
obstacles, the objective is to ensure that this
external pressure is not affected by wind. A T-
connection may also be used make sure that it
is the static and not the dynamic pressure that
is measured. In practice, the external pressure
probe/tubing may be influenced by
surrounding obstacles, in which case the
measured zero-flow pressure becomes:
𝛥𝑝0 = 𝑝𝑖 − (𝑝𝑒𝑥𝑡 +
1
2𝜌𝐶𝑝𝑔𝑎𝑢𝑔𝑒𝑈2) (3)
With Cpgauge the Cp coefficient at the end of
the pressure tube and U is the wind speed at
the end of the pressure tube. This adds an
additional uncertainty that is not taken into
account here as the following assume that the
external pressure sensor is not influenced by
the wind (equation 2 apply). Generally, efforts
are made to shelter the end of the pressure tube
to minimize this uncertainty.
The zero-flow pressure is measured when the
building is not pressurized by the measurement
device, at exactly the same location as where
the pressure difference between inside and
outside will be measured during the whole test.
The zero-flow pressure is due to the impact of
the wind and stack effect. In case of stack-
effect the pressure difference depends on the
height of the measurement, for simplification
purpose only wind is considered in this
paragraph. One should note however that
across each leak there is a pressure difference
that differs from Δp0:
Δpleak,j = 𝛥𝑝0 − 𝑝𝑗 (4)
With pj the external pressure at the leakage j
induced by the wind (Pa).
In our example, with the mass flow rate
conservation, Δp0 is such that: 𝐶𝑢𝑝(𝛥𝑝0 − 𝑝𝑢𝑝)
𝑛𝑢𝑝+ 𝐶𝑑𝑜𝑤𝑛(𝛥𝑝0 − 𝑝𝑑𝑜𝑤𝑛)𝑛𝑑𝑜𝑤𝑛 = 0 (5)
With
𝐶𝑢𝑝, 𝐶𝑑𝑜𝑤𝑛 the flow coefficient of respectively
the windward and leeward leakages
𝑛𝑢𝑝, 𝑛𝑑𝑜𝑤𝑛 the flow exponent of respectively
the windward and leeward leakages, with a
value between 0.5 (turbulent flow) and 1
(laminar flow)
𝑝𝑢𝑝, 𝑝𝑑𝑜𝑤𝑛 are the external pressure induced
by wind respectively at the windward and
leeward leakages (equal to 0 when there is no
wind) and are given by:
𝑝𝑗 =
1
2𝜌𝐶𝑝,𝑗𝑈² (6)
With
𝑈 the wind velocity (m/s)
𝐶𝑝,𝑗 the wind pressure coefficient on the
windward/leeward façade
V. I. P. n°41 17 March 2021
Figure 5 : Natural and induced pressure differences applied to a simplified two-leakage case, with and without
wind
If it is assumed that nup=ndown= n then Error!
Reference source not found.) leads to:
𝛥𝑝0 =𝐶𝑢𝑝
1𝑛 𝑝𝑢𝑝+𝐶𝑑𝑜𝑤𝑛
1𝑛𝑝𝑑𝑜𝑤𝑛
𝐶𝑢𝑝
1𝑛+𝐶𝑑𝑜𝑤𝑛
1𝑛
(7)
Error of the flow-rate estimation for steady
wind
As illustrated in Figure 5, during the
airtightness test the building is pressurized and
the pressure difference Δpi is measured
between inside and outside. The global
flowrate through the blower door is the
addition of the flowrate at each leak j:
𝑞𝐵𝐷 = ∑ 𝐶𝑗(𝛥𝑝𝑖−𝑝𝑗)
𝑛
𝑗 = 𝐶𝑢𝑝(𝛥𝑝𝑖 − 𝑝𝑢𝑝)𝑛
+ 𝐶𝑑𝑜𝑤𝑛(𝛥𝑝𝑖 −
𝑝𝑑𝑜𝑤𝑛)𝑛 (8)
As described by equation (1), since the
external pressures pj induced by the wind at
each leakage are unknown, ISO9972 instead
uses Δp0 as an averaged subtraction to estimate
the flow coefficient:
𝐶𝑒𝑠𝑡 =𝑞𝐵𝐷
(𝛥𝑝𝑖−𝛥𝑝0)𝑛=
𝐶𝑢𝑝(𝛥𝑝𝑖−𝑝𝑢𝑝)𝑛
+𝐶𝑑𝑜𝑤𝑛(𝛥𝑝𝑖−𝑝𝑑𝑜𝑤𝑛)𝑛
( 𝛥𝑝𝑖−𝛥𝑝0)𝑛 (9)
The error at any difference pressure
measurement reference Δpref when estimating
the flowrate with (6) compared to the case
without wind is therefore:
𝐸(𝑞) =𝑞𝑒𝑠𝑡 − 𝑞𝑛𝑜𝑤𝑖𝑛𝑑
𝑞𝑛𝑜𝑤𝑖𝑛𝑑
=𝐶𝑒𝑠𝑡. 𝛥𝑝𝑟𝑒𝑓
𝑛 − 𝐶𝑡. 𝛥𝑝𝑟𝑒𝑓𝑛
𝐶𝑡. 𝛥𝑝𝑟𝑒𝑓𝑛
=𝐶𝑢𝑝(𝛥𝑝𝑖 − 𝑝𝑢𝑝)
𝑛+ 𝐶𝑑𝑜𝑤𝑛(𝛥𝑝𝑖 − 𝑝𝑑𝑜𝑤𝑛)𝑛 − 𝐶𝑡( 𝛥𝑝𝑖 − 𝛥𝑝0)𝑛
𝐶𝑡( 𝛥𝑝𝑖 − 𝛥𝑝0)𝑛
(10)
With: Ct=Cup+ Cdown
According to equation (10), the error tends to
increase with pup and pdown. To limit this error,
there is a maximum value of Δp0 allowed in
ISO 9972, which is 5 Pa. Because of the
relation between Δp0 and pup and pdown given in
equation (7), for most buildings (with standard
leakage repartition), this criteria will indeed
indirectly limit the wind speed at building level
at 5-6 m/s [6] and therefore limit the value of
pup and pdown to less than 10 Pa. However, for
some specific building geometry (dwelling
with only 2 external walls) it is possible that
the leakage distribution is such that Δp0 equals
to zero whatever the wind speed (U).
One can note that for perfectly laminar
leakages, the error due to wind with the
standard calculation method is zero so long as
the wind is invariant during the test. This is
true for any leakage distribution and any
external and internal pressures since according
to equation (10) with n=1: 𝐸(𝑞) = 0 ↔ 𝛥𝑝0(𝐶𝑢𝑝 + 𝐶𝑑𝑜𝑤𝑛) − 𝐶𝑢𝑝𝑝𝑢𝑝 − 𝐶𝑑𝑜𝑤𝑛𝑝𝑑𝑜𝑤𝑛 = 0 (11)
Air Infiltration and Ventilation Centre 18 www.aivc.org
Which is the definition of Δp0 given in
equation (7) for this specific flow exponent.
Example calculation for a simplified two-leak
case
To get a rough estimate of the errors that wind
can introduce due to the ono-linearity of the
pressure-flow relationship, the following
calculations use Equation 10 applied to a two-
leak case. For the example calculation,
following values are assumed; Cp,up= 0.25,
Cp,down = -0.5, and a flow exponent of n= 0.65
(see table A2.5 of [60]). The error induced by
the wind on the air flowrate when using the
standard calculation method is given in Table 2
for a pressurization test (p+), depressurization
test (p-) and the average of both tests (av.). It is
calculated for three wind speeds (3, 5 and 10
m/s), 3 leakage distributions (Cup/Ct=0.25, 0.5
and 0.75) and four target pressure (10, 25, 50
and 100 Pa).
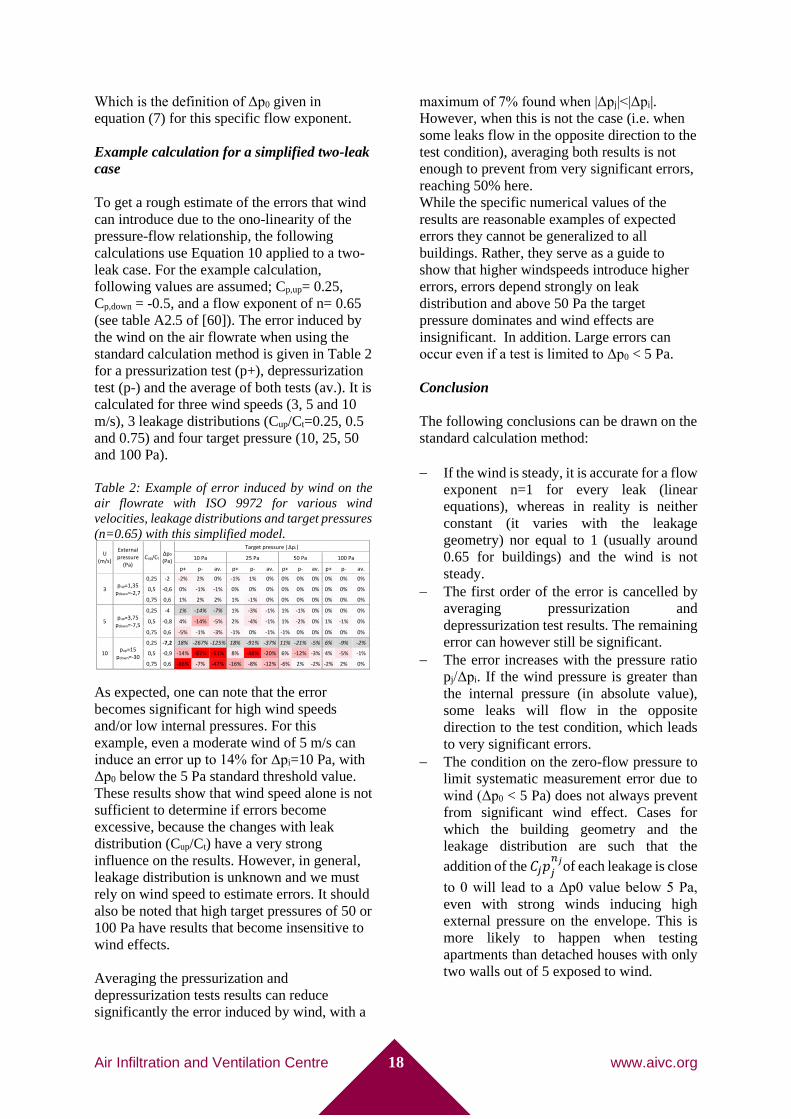
Table 2: Example of error induced by wind on the
air flowrate with ISO 9972 for various wind
velocities, leakage distributions and target pressures
(n=0.65) with this simplified model.
As expected, one can note that the error
becomes significant for high wind speeds
and/or low internal pressures. For this
example, even a moderate wind of 5 m/s can
induce an error up to 14% for Δpi=10 Pa, with
Δp0 below the 5 Pa standard threshold value.
These results show that wind speed alone is not
sufficient to determine if errors become
excessive, because the changes with leak
distribution (Cup/Ct) have a very strong
influence on the results. However, in general,
leakage distribution is unknown and we must
rely on wind speed to estimate errors. It should
also be noted that high target pressures of 50 or
100 Pa have results that become insensitive to
wind effects.
Averaging the pressurization and
depressurization tests results can reduce
significantly the error induced by wind, with a
maximum of 7% found when |Δpj|<|Δpi|.
However, when this is not the case (i.e. when
some leaks flow in the opposite direction to the
test condition), averaging both results is not
enough to prevent from very significant errors,
reaching 50% here.
While the specific numerical values of the
results are reasonable examples of expected
errors they cannot be generalized to all
buildings. Rather, they serve as a guide to
show that higher windspeeds introduce higher
errors, errors depend strongly on leak
distribution and above 50 Pa the target
pressure dominates and wind effects are
insignificant. In addition. Large errors can
occur even if a test is limited to Δp0 < 5 Pa.
Conclusion
The following conclusions can be drawn on the
standard calculation method:
− If the wind is steady, it is accurate for a flow
exponent n=1 for every leak (linear
equations), whereas in reality is neither
constant (it varies with the leakage
geometry) nor equal to 1 (usually around
0.65 for buildings) and the wind is not
steady.
− The first order of the error is cancelled by
averaging pressurization and
depressurization test results. The remaining
error can however still be significant.
− The error increases with the pressure ratio
pj/Δpi. If the wind pressure is greater than
the internal pressure (in absolute value),
some leaks will flow in the opposite
direction to the test condition, which leads
to very significant errors.
− The condition on the zero-flow pressure to
limit systematic measurement error due to
wind (Δp0 < 5 Pa) does not always prevent
from significant wind effect. Cases for
which the building geometry and the
leakage distribution are such that the
addition of the 𝐶𝑗𝑝𝑗
𝑛𝑗of each leakage is close
to 0 will lead to a Δp0 value below 5 Pa,
even with strong winds inducing high
external pressure on the envelope. This is
more likely to happen when testing
apartments than detached houses with only
two walls out of 5 exposed to wind.
U (m/s)
External pressure
(Pa) Cup/Ct
Δp0 (Pa)
Target pressure |Δpi|
10 Pa 25 Pa 50 Pa 100 Pa
p+ p- av. p+ p- av. p+ p- av. p+ p- av.
3 pup=1,35
pdown=-2,7
0,25 -2 -2% 2% 0% -1% 1% 0% 0% 0% 0% 0% 0% 0%
0,5 -0,6 0% -1% -1% 0% 0% 0% 0% 0% 0% 0% 0% 0%
0,75 0,6 1% 2% 2% 1% -1% 0% 0% 0% 0% 0% 0% 0%
5 pup=3,75
pdown=-7,5
0,25 -4 1% -14% -7% 1% -3% -1% 1% -1% 0% 0% 0% 0%
0,5 -0,8 4% -14% -5% 2% -4% -1% 1% -2% 0% 1% -1% 0%
0,75 0,6 -5% -1% -3% -1% 0% -1% -1% 0% 0% 0% 0% 0%
10 pup=15
pdown=-30
0,25 -7,2 18% -267% -125% 18% -91% -37% 11% -21% -5% 6% -9% -2%
0,5 -0,9 -14% -87% -51% 8% -48% -20% 6% -12% -3% 4% -5% -1%
0,75 0,6 -86% -7% -47% -16% -8% -12% -6% 2% -2% -2% 2% 0%
1
V. I. P. n°41 19 March 2021
8 References [1] Kolstad, Feyu Kebede et D. Supervisor:
Kraniotis, “Impact of Dynamic Wind on Fan
Pressurization Method for Determination of
Building Airtightness” Master thesis, Oslo
Metropolitan University – OsloMet, Oslo,
Norway, 2020.
[2] C. Delmotte, “Airtightness of buildings –
Considerations regarding place and nature of
pressure taps”, presented at the 40th AIVC -
8th TightVent - 6th venticool Conference,
Ghent, Belgium, Oct. 2019. [AIRBASE]
[3] C. Delmotte, “Airtightness of Buildings –
Considerations regarding the Zero-Flow
Pressure and the Weighted Line of Organic
Correlation”, presented at the 38th AIVC
Conference “Ventilating healthy low-energy
buildings”, Nottingham, UK, Sept. 2017.
[AIRBASE]
[4] A. Bailly, V. Leprince, G. Guyot, F. R. Carrié,
et M. El Mankibi, “Numerical evaluation of
airtightness measurement protocols”,
presented at the 33rd AIVC Conference
“Optimising Ventilative Cooling and
Airtightness for [Nearly] Zero-Energy
Buildings, IAQ and Comfort”, Copenhagen,
Denmark, Oct. 2012. [AIRBASE]
[5] F. R. Carrié et V. Leprince, “Model error due
to steady wind in building pressurization
tests”, presented at the 35th AIVC Conference
“Ventilation and airtightness in transforming
the building stock to high performance”,
Poznan, Poland, Sept. 2014. [AIRBASE]
[6] F. R. Carrié et V. Leprince, “Uncertainties in
building pressurisation tests due to steady
wind”, Energy and Buildings, vol. 116, p.
656‑665, March 2016, doi:
10.1016/j.enbuild.2016.01.029.
[7] V. Leprince et F. R. Carrié, “On the
contribution of steady wind to uncertainties in
building pressurisation tests”, presented at the
38th AIVC Conference “Ventilating healthy
low-energy buildings”, Nottingham, UK,
Sept. 2017. [AIRBASE]
[8] F. R. Carrié et A. Mélois, “Modelling building
airtightness pressurisation tests with periodic
wind and sharp-edged openings”, Energy and
Buildings, vol. 208, p. 109642, Febr. 2020,
doi: 10.1016/j.enbuild.2019.109642.
[9] D. W. Etheridge et J. A. Nolan, “Ventilation
measurements at model scale in a turbulent
flow”, Building and Environment, vol. 14, p.
53‑64, 1979.
[10] R. Mounajed, J. Riberon, et G. Barnaud,
“Wind turbulence and ventilation”, Toronto,
Canada, July. 1990, vol. 4 "Building and
System Assessments and Solutions", p.
201‑206.
[11] E. Simiu et R. H. Scanlan, “Wind effects on
structures: an introduction to wind
engineering”. New York: Wiley, 1978.
[12] J. P. Cockroft et P. Robertson, “Ventilation
of an enclosure through a single opening”,
Building and Environment, vol. 11, no 1, p.
29‑35, Jan. 1976, doi: 10.1016/0360-
1323(76)90016-0.
[13] R. D. Crommelin et E. M. H. Vrins,
“Ventilation through a single opening in a
scale model”, Air Infiltration Review, vol. 9,
no 3, p. 11‑15, 1988. [AIRBASE]
[14] F. Haghighat, J. Rao, et P. Fazio, “The
influence of turbulent wind on air change
rates—a modelling approach”, 1991, doi:
10.1016/0360-1323(91)90017-6.
[15] A. G. Davenport, “The spectrum of
horizontal gustiness near the ground in high
winds”, Quarterly Journal of the Royal
Meteorological Society, vol. 87, no 372, p.
194‑211, 1961, doi: 10.1002/qj.49708737208.
[16] D. W. Etheridge, “Unsteady flow effects due
to fluctuating wind pressures in natural
ventilation design - instantaneous flow rates”,
Building and Environment, no 35, p. 321‑337,
2000.
[17] D. W. Etheridge, “Unsteady flow effects due
to fluctuating wind pressures in natural
ventilation design—mean flow rates”,
Building and Environment, vol. 35, no 2, p.
111‑133, Febr. 2000, doi: 10.1016/S0360-
1323(99)00007-4.
[18] G. M. Richardson, R. P. Hoxey, A. P.
Robertson, J. L. Short, et Indian Association
for Wind Engineering, “The Silsoe Structures
Building: The Completed Experiment Part 1”,
New Delhi, India, 1994, p. 1103‑1114.
[19] D. Kraniotis, T. K. Thiis, et T. Aurlien, “A
Numerical Study on the Impact of Wind Gust
Frequency on Air Exchanges in Buildings
with Variable External and Internal
Leakages”, Buildings, vol. 4, no 1, p. 27‑42,
mars 2014, doi: 10.3390/buildings4010027.
[20] D. Kraniotis, “The impact of wind gusts on
air infiltration in buildings”, presented at the
38th Air Infiltration and Ventilation Centre
Conference “Ventilating Healthy Low-
Energy Buildings”, Nottingham, UK, Sept.
2017. [AIRBASE]
[21] D. Kraniotis, “Dynamic characteristics of
wind-driven air infiltration in buildings - The
impact of wind gusts under unsteady wind
conditions”. Doctoral thesis, Norwegian
University of Life Sciences (NMBU), 2014.
Air Infiltration and Ventilation Centre 20 www.aivc.org
[22] R. Belu et D. Koracin, “Statistical and
Spectral Analysis of Wind Characteristics
Relevant to Wind Energy Assessment Using
Tower Measurements in Complex Terrain”,
Journal of Wind Energy, vol. 2013, p.
e739162, 2013, doi:
https://doi.org/10.1155/2013/739162.
[23] J. P. P. Beaupuits, A. Otarola, F. T.
Rantakyrö, R. C. Rivera, et L. Nyman,
“ALMA Memo No. 497 Analysis Of Wind
Data Gathered At Chajnantor”, 2004.
[24] N. P. Lareau et al., “The Persistent Cold-Air
Pool Study”, Bull. Amer. Meteor. Soc., vol.
94, no 1, p. 51‑63, Jan. 2013, doi:
10.1175/BAMS-D-11-00255.1.
[25] B. G. Wiren, “Effects of Surrounding
Buildings on Wind Pressure Distributions and
Ventilaton Losses for Single Family Houses:
Parts 1 and 2”. National Swedish Institute for
Building Research Report M85:19., 1985.
[26] J. A. Peterka, R. N. Meroney, et K. M.
Kothari, “Wind Flow Patterns About
Buildings”, 1985.
[27] M. E. Davies, V. G. Quicey, et S. J. Tindall,
“The Near-Wake of a Tall Building Block in
Uniform and Turbulent Flows”, presented at
Proc. 5th Int. Conf. on Wind Engineering, Vol.
1, pp.289-298, 1980.
[28] H. G. C. Woo, J. A. Peterka, et J. E. Cermak,
“Wind Tunnel Measurements in the Wakes of
Structures”, NASA Contractor Report NASA
CR-2806., 1977.
[29] I. S. Walker, D. J. Wilson, et T. W. Forest,
“A Wind Shadow Model for Air Infiltration
Sheltering by Upwind Obstacles “, 1996.
[30] H. A. Panofsky et J. A. Dutton, “Atmospheric
Turbulence: Models and Methods for
Engineering Applications”, 1 edition. New
York: Wiley-Interscience, 1984.
[31] Zheng X.F., Mazzon J., Wallis I., Wood, C.J.,
“Airtightness measurement of an outdoor
chamber using the Pulse and blower door
methods under various wind and leakage
scenarios (2020)”, Building and Environment,
179, 2020.
[32] Mélois, Adeline, “Impact of the wind during
a building air leakage measurement”,
Université de Lyon /ENTPE, Lyon, France,
2020.
[33] A. J. Bowen, A Wind Tunnel Investigation
Using Simple Building Models to Obtain
Mean Surface Wind Pressure Coefficients for
Air Infiltration Estimates. 1976.
[34] R.E. Akins, J.A. Peterka, et J.E. Cermak,
“Averaged pressure coefficients for
rectangular buildings”, in “Wind
Engineering”, Proceedings of the 5th
International Conference, Fort Collins,
Colorado, USA, July. 1979, vol. 1, p.
369‑380.
[35] ASHRAE, 1989 Ashrae Handbook
Fundamentals. Atlanta: American Society of
Heating, Refrigerating and Air Conditioning
Engineers, Inc., 1989.
[36] M. W. Liddament, “CT: Air Infiltration
Calculation Techniques: An Applications
Guide”. AIVC, 1986. [AIRBASE]
[37] R. Sheng, L. Perret, I. Calmet, F. Demouge,
et J. Guilhot, “Wind tunnel study of wind
effects on a high-rise building at a scale of
1:300”, Journal of Wind Engineering and
Industrial Aerodynamics, vol. 174, p.
391‑403, March 2018, doi:
10.1016/j.jweia.2018.01.017.
[38] European Committee for Standardization,
“Eurocode 1: Actions sur les structures -
Partie 1-4.” 2005.
[39] A. Jafari, F. Ghanadi, M. J. Emes, M.
Arjomandi, et B. S. Cazzolato, “Measurement
of unsteady wind loads in a wind tunnel:
Scaling of turbulence spectra”, Journal of
Wind Engineering and Industrial
Aerodynamics, vol. 193, p. 103955, oct. 2019,
doi: 10.1016/j.jweia.2019.103955.
[40] N. Hölscher et H.-J. Niemann, “Towards
quality assurance for wind tunnel tests: A
comparative testing program of the
Windtechnologische Gesellschaft”, Journal of
Wind Engineering and Industrial
Aerodynamics, vol. 74‑76, p. 599‑608, avr.
1998, doi: 10.1016/S0167-6105(98)00054-3.
[41] J. Van Beek, P. Corieri, B. Parmentier, et G.
Dezso, “Full Scale and Wind Tunnel Tests of
Unsteady Pressure on Roof Tiles of Low Rise
Buildings”, 2002.
[42] Y.H. Chiu et D. W. Etheridge, “Experimental
technique to determine unsteady flow in
natural ventilation stacks at model scale”,
Journal of Wind Engineering and Industrial
Aerodynamics, vol. 92, no 3, p. 291‑313, mars
2004, doi: 10.1016/j.jweia.2003.12.002.
[43] H. W. Tieleman, “Wind tunnel simulation of
wind loading on low-rise structures: a
review”, Journal of Wind Engineering and
Industrial Aerodynamics, vol. 91, no 12, p.
1627‑1649, Dec. 2003, doi:
10.1016/j.jweia.2003.09.021.
[44] A. Hayati, “Natural Ventilation and Air
Infiltration in Large Single‑Zone Buildings:
Measurements and Modelling with Reference
to Historical Churches”, Högskolan i Gävle,
2017.
[45] I. S. Walker, M. H. Sherman, J. Joh, et W. R.
Chan, “Applying Large Datasets to

V. I. P. n°41 21 March 2021
Developing a Better Understanding of Air
Leakage Measurement in Homes”, 2013, doi:
10.1080/14733315.2013.11683991.
[46] I. Walker, “Reducing Uncertainty in
Airtightness Measurements”, presented at the
38th AIVC Conference “Ventilating healthy
low-energy buildings”, Nottingham, UK,
Sept. 2017. [AIRBASE]
[47] S. Rolfsmeier et P. Simons, “Measuring
Airtightness in a Tall Multi-Family Passive
House when Exposed to Wind and Thermal
Lift (Stack Effect)”, Prague, Czech Republic,
Jul. 2019, vol. 290.
[48] I. Van der Hoven, “Power spectrum of
horizontal wind speed in the frequency range
from 0.0007 to 900 cycles per hour”, J.
Meteor., vol. 14, no 2, p. 160‑164, avr. 1957,
doi: 10.1175/1520-
0469(1957)014<0160:PSOHWS>2.0.CO;2
[49] B. Parmentier, R. Hoxey, J. M. Buchlin, et P.
Corieri, “The assessment of Full-scale
experimental methods for measuring wind
effects on low rise buildings”, presented at
COST Action C14, Impact of Wind and Storm
on City Life and Built Environment, Nantes,
France, June 2002.
[50] M. Prignon, A. Dawans, S. Altomonte, et G.
Van Moeseke, “A method to quantify
uncertainties in airtightness measurements:
Zero-flow and envelope pressure”, Energy
and Buildings, vol. 188‑189, p. 12‑24, Apr.
2019, doi: 10.1016/j.enbuild.2019.02.006.
[51] Novak, Jiri, “Influence of the external
pressure tap position on the airtightness test
result”, presented at the 40th AIVC - 8th
TightVent - 6th venticool Conference, Ghent,
Belgium, Oct. 2019. [AIRBASE]
[52] M. P. Modera et D. J. Wilson, “The Effects
of Wind on Residential Building Leakage
Measurements”, 1990. American Society for
Testing and Materials, Philadelphia, PA, in
Air Change Rate and Air Tightness in
Buildings, ASTM STP 1067, Philadelphia,
PA: American Society for Testing and
Materials, 1990, p. 132‑145.
[53] D. W. Etheridge, “A note on crack flow
equations for ventilation modelling”, Building
and Environment, vol. 33, no 5, p. 325‑328,
Sept. 1998, doi: 10.1016/S0360-
1323(97)00072-3.
[54] Y. H. Chiu et D. W. Etheridge, “Calculations
and Notes on the Quadratic and Power Law
Equations for Modelling Infiltration”,
International Journal of Ventilation, vol. 1, no
1, p. 65‑77, June 2002, doi:
10.1080/14733315.2002.11683623.
[55] H. Okuyama et Y. Onishi, “Reconsideration
of parameter estimation and reliability
evaluation methods for building airtightness
measurement using fan pressurization”,
Building and Environment, vol. 47, p.
373‑384, Jan. 2012, doi:
10.1016/j.buildenv.2011.06.027.
[56] C. Delmotte, “Airtightness of buildings -
Calculation of combined standard
uncertainty”, presented at the 34th AIVC
Conference “Energy conservation
technologies for mitigation and adaptation in
the built environment: the role of ventilation
strategies and smart materials”, Athens,
Greece, Sept. 2013. [AIRBASE]
[57] Kölsch, Benedikt; Walker, Iain, “Improving
air leakage prediction of buildings using the
fan pressurization method with the Weighted
Line of Organic Correlation”, Building and
Environment, 2020.
[58] M. Prignon, A. Dawans, et G. van Moeseke,
“Uncertainties in airtightness measurements:
regression methods and pressure sequences”,
presented at the 39th AIVC Conference “Smart
Ventilation for Buildings”, Antibes Juan-Les-
Pins, France, Sept. 2018. [AIRBASE]
[59] D. W. Etheridge et M. Sandberg, Building
Ventilation: Theory and Measurement, Wiley.
UK, 1996.
[60] M. W. Liddament, A guide to energy efficient
ventilation. Coventry, UK: AICV, AIC-TN-
VENTGUIDE, 1996. [AIRBASE]

Air Infiltration and Ventilation Centre 22 www.aivc.org
The Air Infiltration and Ventilation Centre was inaugurated through the International Energy Agency and is funded by the following countries: Australia, Belgium, China, Denmark, France, Greece, Italy, Ireland, Japan, Netherlands, New Zealand, Norway, Republic of Korea, Spain, Sweden, United Kingdom and United States of America. The Air Infiltration and Ventilation Centre provides technical support in air infiltration and ventilation research and application. The aim is to promote the understanding of the complex behaviour of the air flow in buildings and to advance the effective application of associated energy saving measures in the design of new buildings and the improvement of the existing building stock.


![Air Infiltration and Ventilation Centre © INIVE EEIG Ductwork ...This paper aims to complement Ventilation Information Paper (VIP)o1 “Airtightness of ventilation ducts” [12]](https://img.pdfslide.net/doc/110x75/6131cb5e1ecc51586944f5ae/air-infiltration-and-ventilation-centre-inive-eeig-ductwork-this-paper-aims.jpg)