Embed Size (px)
Citation preview

1
Healthy, Connected Communities
Strong Start for Children
Preventive ActionsSystem of Health Care
Well-Being
Virginia’s Plan For Well-Being2 0 1 6 - 2 0 2 0

2
3
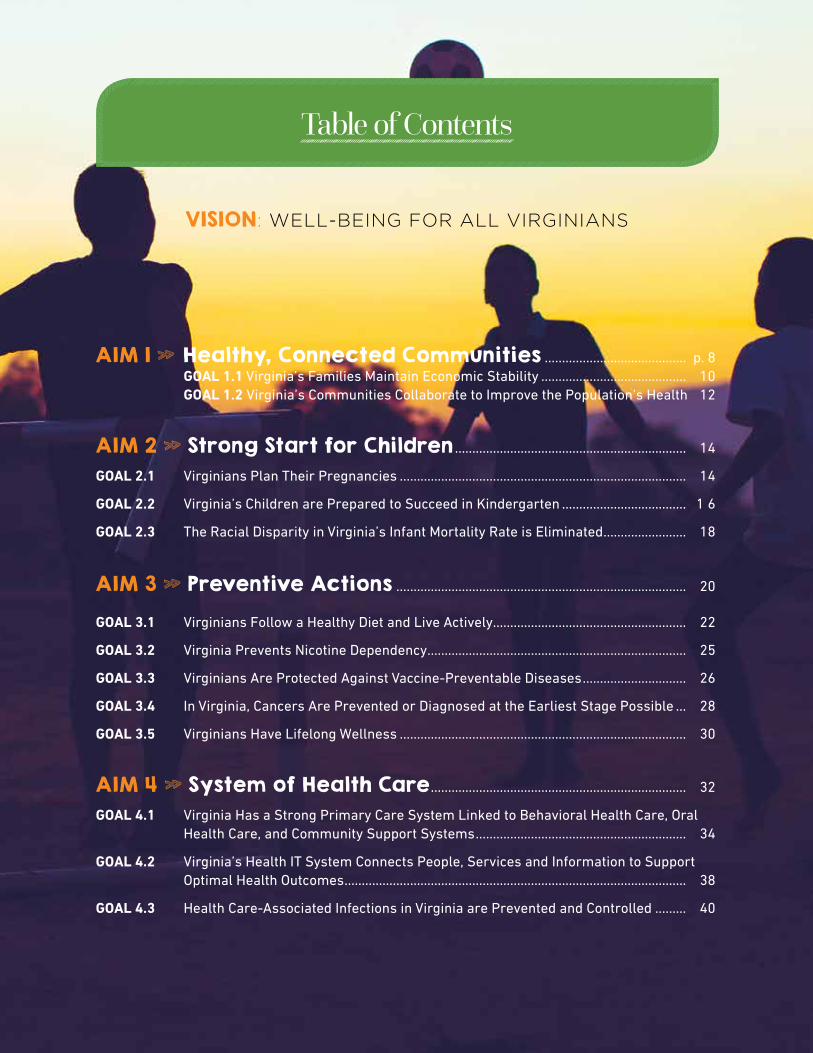
VISION: WELL-BEING FOR ALL VIRGINIANS
AIM 1 » Healthy, Connected Communities ......................................... p. 8 GOAL 1.1 Virginia’s Families Maintain Economic Stability .......................................... 10 GOAL 1.2 Virginia’s Communities Collaborate to Improve the Population’s Health 12
AIM 2 » Strong Start for Children ................................................................... 14
GOAL 2.1 Virginians Plan Their Pregnancies ................................................................................... 14
GOAL 2.2 Virginia’s Children are Prepared to Succeed in Kindergarten .................................... 1 6
GOAL 2.3 The Racial Disparity in Virginia’s Infant Mortality Rate is Eliminated ........................ 18
AIM 3 » Preventive Actions .................................................................................... 20
GOAL 3.1 Virginians Follow a Healthy Diet and Live Actively........................................................ 22
GOAL 3.2 Virginia Prevents Nicotine Dependency ........................................................................... 25
GOAL 3.3 Virginians Are Protected Against Vaccine-Preventable Diseases .............................. 26
GOAL 3.4 In Virginia, Cancers Are Prevented or Diagnosed at the Earliest Stage Possible ... 28
GOAL 3.5 Virginians Have Lifelong Wellness ................................................................................... 30
AIM 4 » System of Health Care .......................................................................... 32
GOAL 4.1 Virginia Has a Strong Primary Care System Linked to Behavioral Health Care, Oral Health Care, and Community Support Systems ............................................................. 34
GOAL 4.2 Virginia’s Health IT System Connects People, Services and Information to Support Optimal Health Outcomes ................................................................................................... 38
GOAL 4.3 Health Care-Associated Infections in Virginia are Prevented and Controlled ......... 40
Table of Contents
4

5
VIRGINIANS LIVE LONGER, HEALTHIER
lives today than ever before. Medical care is
only part of the reason. Health begins where
Virginians live, work, and play. Virginia’s
economy paves the way for its communities
to create conditions for people to be healthy.
Disinfecting drinking water, vaccinating
people, controlling mosquitos and rodents,
and tracking contagious illnesses keep once
common diseases like measles and polio at
bay. Passing laws to make transportation safer
and to protect workers reduces injuries.
The definition of well-being is “a state
characterized by health, happiness, and
prosperity”. It is valuable as a population
outcome measure because it reflects how
Virginians perceive their life is going. Well-
being is dependent on having good physical
and emotional health. Social circumstances,
financial resources, and community factors
also play important roles.
The opportunity for health begins with
our families, neighborhoods, schools and
jobs. There are striking differences in health
within and between communities in Virginia.
Uncovering the root causes of health inequities
in Virginia’s neighborhoods and working
together to improve the conditions
needed for people to be healthy
will improve well-being
for all Virginians.
This begins with
the community
coming together to review local and state level
data that reflect the health of the community.
Examining trends and variation among subsets
of the population can assist the state and
communities in analyzing health outcomes and
identifying priority issues to address.
Virginia’s Plan for Well-Being lays out the
foundation for giving everyone a chance to live
a healthy life: (1) Factoring health into policy
decisions related to education, employment,
housing, transportation, land use, economic
development, and public safety; (2) Investing
in the health, education, and development of
Virginia’s children; (3) Promoting a culture of
health through preventive actions; and
(4) Creating a connected system of health
care. The plan highlights specific goals and
strategies on which communities can focus so
the state can make measureable health im-
provement by 2020. Virginia’s Plan for Well-Be-
ing is a call to action for all Virginians to work
together to make Virginia the healthiest state
in the nation. Improving well-being can lower
health care costs and increase productivity,
ultimately enhancing Virginia’s
competitiveness and resiliency.
Measure of Success
Percent of adults
in Virginia who
report positive
well-being increas-
es (metric under
development)
Healthy, Connected Communities
Strong Start for Children
Preventive ActionsSystem of Health Care
Well-Being
VISION: WELL-BEING FOR ALL VIRGINIANS

6
VIRGINIAN’S PLAN FOR WELL-BEING MEASURES
VISION
By 2020, the percent of adults who report positive
well-being increases (metric under development)
AIM 1 » Healthy, Connected Communities
Goal 1.1: VIRGINIA’S FAMILIES MAINTAIN ECONOMIC STABILITY
By 2020, the percent of Virginia high school
graduates enrolled in an institute of higher education
within 16 months after graduation increases from
70.9% to 75.0%
By 2020, the percent of cost-burdened households in
Virginia (more than 30% of monthly income spent on
housing costs) decreases from 31.4% to 29.0%
By 2020, the Consumer Opportunity Profile score in
Virginia increases from 81.8% to 83.7%
By 2020, the Economic Opportunity Profile Score in
Virginia increases from 70.7% to 73.7%
Goal 1.2: VIRGINIA’S COMMUNITIES COLLABORATE TO IMPROVE THE POPULATION’S HEALTH
By 2020, the percent of Virginia health planning
districts that have established an on-going
collaborative community health planning process
increases from 43% to 100%
AIM 2 » Strong Start for Children
Goal 2.1: VIRGINIANS PLAN THEIR PREGNANCIES
By 2020, Virginia’s teen pregnancy rate decreases
from 27.9 to 25.1 pregnancies per 1,000 females ages
15 to 19 years
Goal 2.2: VIRGINIA’S CHILDREN ARE PREPARED TO SUCCEED IN KINDERGARTEN
By 2020, the percent of children in Virginia who
do not meet the PALS K benchmarks in the fall
of kindergarten and require literacy interventions
decreases from 12.7% to 12.2%
By 2020, the percent of third graders in Virginia who
pass the Standards of Learning third grade reading
assessment increases from 69% to 80%
Goal 2.3: THE RACIAL DISPARITY IN VIRGINIA’S INFANT MORTALITY RATE IS ELIMINATED
By 2020, Virginia’s Black Infant Mortality Rate equals
the White Infant Mortality Rate
AIM 3 » Preventive Actions
Goal 3.1: VIRGINIANS FOLLOW A HEALTHY DIET AND LIVE ACTIVELY
By 2020, the percent of Virginia adults who did not
participate in any physical activity during the past 30
days decreases from 23.5% to 20.0%
By 2020, the percent of Virginia adults who are
overweight or obese decreases from 64.7% to 63.0%
By 2020, the percent of Virginia households that are
food insecure for some part of the year decreases
from 11.9% to 10.0%
Goal 3.2: VIRGINIA PREVENTS NICOTINE DEPENDENCY
By 2020, the percent of adults aged 18 years and
older in Virginia who report using tobacco decreases
from 21.9% to 12.0%

7
(photo?)Goal 3.3: VIRGINIANS ARE PROTECTED AGAINST VACCINE-PREVENTABLE DISEASES
By 2020, the percent of adults in Virginia
who receive an annual influenza vaccine
increases from 48.2% to 70%
By 2020, the percent of girls aged 13-17 in Virginia
who receive three doses of HPV vaccine increases
from 35.9% to 80%
By 2020, the percent of boys aged 13-17 in Virginia
who receive three doses of HPV vaccine increases
from 22.5% to 80%
Goal 3.4: CANCERS ARE PREVENTED OR DIAGNOSED AT THE EARLIEST STAGE POSSIBLE
By 2020, the percent of adults aged 50 to 75
years in Virginia who receive colorectal cancer
screening increases from 69.1% to 85.0%
Goal 3.5: VIRGINIANS HAVE LIFE-LONG WELLNESS
By 2020, the average years of disability-
free life expectancy for Virginians increases
from 66.1 years to 67.3 years
By 2020, the percent of adults in Virginia
who report adverse childhood experiences
decreases (metric under development)
AIM 4 » System of Health Care
Goal 4.1: VIRGINIA HAS A STRONG PRIMARY CARE SYSTEM LINKED TO BEHAVIORAL HEALTH CARE, ORAL HEALTH CARE, AND COMMUNITY SUPPORT SYSTEMS
By 2020, the percent of adults in Virginia
who have a regular health care provider
increases from 69.3% to 85.0%
By 2020, the rate of avoidable hospital stays for
ambulatory care sensitive conditions in Virginia
decreases from 1,294 to 1,100 per 100,000 persons
By 2020, the rate of avoidable deaths from heart
disease, stroke, or hypertensive disease in Virginia
decreases from 50 to 40 per 100,000 persons
By 2020, the rate of adult mental health and
substance use disorder hospitalizations in Virginia
decreases from 668.5 to 635.1 per 100,000 adults
By 2020, the percent of adults in Virginia who report
having one or more days of poor health that kept
them from doing their usual activities decreases from
19.5% to 18.0%
Goal 4.2: VIRGINIA’S HEALTH IT SYSTEM CONNECTS PEOPLE, SERVICES, AND INFORMATION TO SUPPORT OPTIMAL HEALTH OUTCOMES
By 2020, the percent of health-care providers in
Virginia who have implemented a certified electronic
health record increases from 70.6% to 90.0%
By 2020, the number of entities in Virginia connected
through Connect Virginia HIE Inc., the electronic
health information exchange, and the national
e-Health Exchange increases from 3,800 to 7,600
By 2020, the number of Virginia’s local health
districts that have electronic health records and
connect to community providers through Connect
Virginia increases from 0 to 35
Goal 4.3: HEALTH CARE-ASSOCIATED INFECTIONS ARE PREVENTED AND CONTROLLED IN VIRGINIA
By 2020, the percentage of hospitals in
Virginia meeting the state goal for prevention
of hospital-onset Clostridium difficile
infections increases from 38.5% to 100%
VIRGINIAN’S PLAN FOR WELL-BEING MEASURES
8
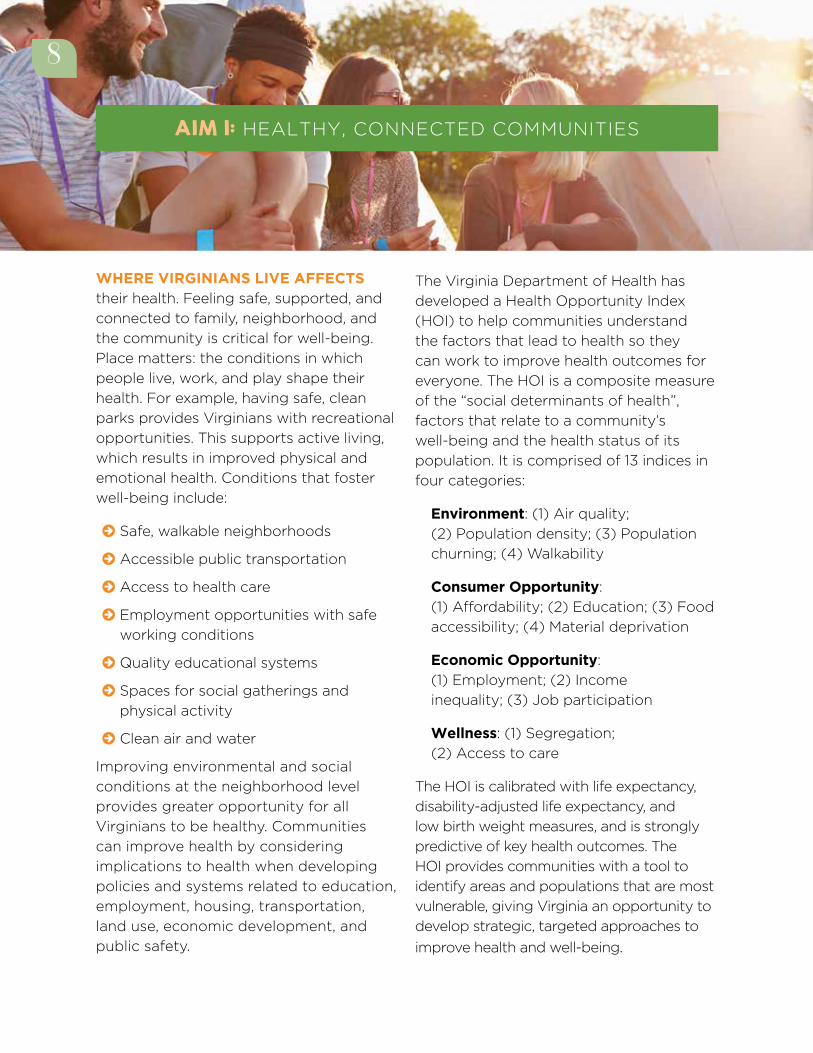
WHERE VIRGINIANS LIVE AFFECTS their health. Feeling safe, supported, and
connected to family, neighborhood, and
the community is critical for well-being.
Place matters: the conditions in which
people live, work, and play shape their
health. For example, having safe, clean
parks provides Virginians with recreational
opportunities. This supports active living,
which results in improved physical and
emotional health. Conditions that foster
well-being include:
© Safe, walkable neighborhoods
© Accessible public transportation
© Access to health care
© Employment opportunities with safe
working conditions
© Quality educational systems
© Spaces for social gatherings and
physical activity
© Clean air and water
Improving environmental and social
conditions at the neighborhood level
provides greater opportunity for all
Virginians to be healthy. Communities
can improve health by considering
implications to health when developing
policies and systems related to education,
employment, housing, transportation,
land use, economic development, and
public safety.
The Virginia Department of Health has
developed a Health Opportunity Index
(HOI) to help communities understand
the factors that lead to health so they
can work to improve health outcomes for
everyone. The HOI is a composite measure
of the “social determinants of health”,
factors that relate to a community’s
well-being and the health status of its
population. It is comprised of 13 indices in
four categories:
Environment: (1) Air quality;
(2) Population density; (3) Population
churning; (4) Walkability
Consumer Opportunity:
(1) Affordability; (2) Education; (3) Food
accessibility; (4) Material deprivation
Economic Opportunity:
(1) Employment; (2) Income
inequality; (3) Job participation
Wellness: (1) Segregation;
(2) Access to care
The HOI is calibrated with life expectancy,
disability-adjusted life expectancy, and
low birth weight measures, and is strongly
predictive of key health outcomes. The
HOI provides communities with a tool to
identify areas and populations that are most
vulnerable, giving Virginia an opportunity to
develop strategic, targeted approaches to
improve health and well-being.
AIM 1: HEALTHY, CONNECTED COMMUNITIES
8
9
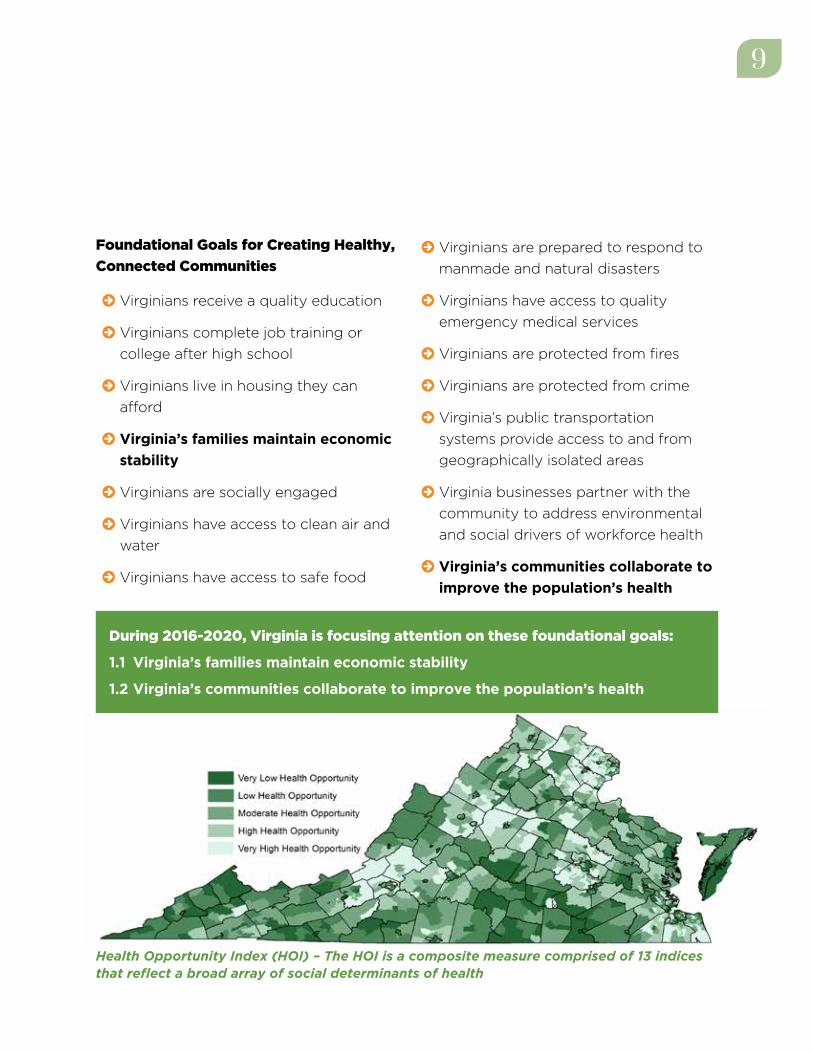
Foundational Goals for Creating Healthy,
Connected Communities
© Virginians receive a quality education
© Virginians complete job training or
college after high school
© Virginians live in housing they can
afford
© Virginia’s families maintain economic
stability
© Virginians are socially engaged
© Virginians have access to clean air and
water
© Virginians have access to safe food
© Virginians are prepared to respond to
manmade and natural disasters
© Virginians have access to quality
emergency medical services
© Virginians are protected from fires
© Virginians are protected from crime
© Virginia’s public transportation
systems provide access to and from
geographically isolated areas
© Virginia businesses partner with the
community to address environmental
and social drivers of workforce health
© Virginia’s communities collaborate to
improve the population’s health
During 2016-2020, Virginia is focusing attention on these foundational goals:
1.1 Virginia’s families maintain economic stability
1.2 Virginia’s communities collaborate to improve the population’s health
Health Opportunity Index (HOI) – The HOI is a composite measure comprised of 13 indices that reflect a broad array of social determinants of health

10
GOAL 1.1: VIRGINIA’S FAMILIES MAINTAIN ECONOMIC STABILITY
Health and poverty are inextricably
linked; ill health not only affects the poor
disproportionately, it is also associated
with lower income.1 Virginia is perennially
one of the wealthiest states in the nation.
Unfortunately, a wealth gap prevents
some Virginians from experiencing
equitable opportunities for optimal health
and longevity. Reducing poverty and
maintaining economic stability are vital to
keeping all Virginians well. An education
that prepares Virginians for today’s job
market provides increased opportunity
for employment, which in turn improves
access to stable housing, healthy food,
transportation, and health care. Strategic
investments in the physical and social
infrastructure as well as investments in
educational resources are important for
sustained economic stability.
Strategies
© Provide alternative pathways to
graduation and post-secondary
training for disconnected youth and
those with special needs
© Develop and use early warning systems
to prevent failure and help at-risk
students
© Develop school policies to assess
and address physical, social, and
environmental health barriers that
impede learning
© Expand training and work-linked
learning opportunities for youth
© Support opportunities for mid-career
retraining
© Build affordable housing, and
rehabilitate existing affordable housing
to accommodate low-income families
AIM 1: HEALTHY, CONNECTED COMMUNITIES
2020 FOCUS GOALS
Key Community PartnersCommunity Organizations
Community Planners
Economic Development Agencies
Educators
Elected Officials
Employers
Families
Justice System

11
Higher Ed2013 70.9%2020 GOAL 75.0%
Cost Burdened HH2013 31.4%2020 GOAL 29.0%
Consumer Opp2009-‐2013 81.82020 GOAL 83.7
Econonic Opp2009-‐2013 70.72020 GOAL 73.7
70.9%75.0%
60.0%
65.0%
70.0%
75.0%
80.0%
2013 2020 GOAL
High School Graduates Enrolled in Higher Education
31.4% 29.0%
20.0%
25.0%
30.0%
35.0%
40.0%
2013 2020 GOAL
Cost-‐Burdened Households
81.8
83.7
80.0
81.0
82.0
83.0
84.0
2013 2020 GOAL
Consumer Opportunity Profile Score
73.0
74.0 Economic Opportunity Profile Score
Higher Ed CHA2013 70.9% 2014 43%2020 GOAL 75.0% 2020 GOAL 100%
Cost Burdened HH2013 31.4%2020 GOAL 29.0%
Consumer Opp2009-‐2013 81.82020 GOAL 83.7
Econonic Opp2009-‐2013 70.72020 GOAL 73.7
70.9%75.0%
60.0%
65.0%
70.0%
75.0%
80.0%
2013 2020 GOAL
High School Graduates Enrolled in Higher Education
31.4% 29.0%
20.0%
25.0%
30.0%
35.0%
40.0%
2013 2020 GOAL
Cost-‐Burdened Households
81.8
83.7
80
81
82
83
84
2009-‐2013 2020 GOAL
Consumer Opportunity Index Score
70.7
73.7
70.0
71.0
72.0
73.0
74.0
2013 2020 GOAL
Economic Opportunity Profile Score
43%
100%
20%
40%
60%
80%
100%
2014 2020 GOAL
Districts with Collaborative Community Health
Improvement Processes
Measures of Success
Higher Ed CHA2013 70.9% 2014 43%2020 GOAL 75.0% 2020 GOAL 100%
Cost Burdened HH2013 31.4%2020 GOAL 29.0%
Consumer Opp2009-‐2013 81.82020 GOAL 83.7
Econonic Opp2009-‐2013 70.72020 GOAL 73.7
70.9%75.0%
60.0%
65.0%
70.0%
75.0%
80.0%
2013 2020 GOAL
High School Graduates Enrolled in Higher Education
31.4% 29.0%
20.0%
25.0%
30.0%
35.0%
40.0%
2013 2020 GOAL
Cost-‐Burdened Households
81.8
83.7
80
81
82
83
84
2009-‐2013 2020 GOAL
Consumer Opportunity Index Score
70.7
73.7
70.0
71.0
72.0
73.0
74.0
2013 2020 GOAL
Economic Opportunity Profile Score
43%
100%
20%
40%
60%
80%
100%
2014 2020 GOAL
Districts with Collaborative Community Health
Improvement Processes
11

12
Goal 1.2: VIRGINIA’S COMMUNITIES COLLABORATE TO IMPROVE THE POPULATION’S HEALTH
Adopting a collaborative community
approach to health assessment and
planning supports population-level health
improvement. Both state and community-
level assessments are valuable to identify
opportunities to achieve and maintain
well-being in the Commonwealth. This
process involves bringing together people
from many sectors of the community to
review data; identify priorities; develop
goals and measurable objectives; and
recommend evidence-based policies,
programs, and actions for the community
to pursue. The assessments include social,
economic, and environmental data, such
as the number of mothers who did not
graduate from high school, in addition to
health outcome data, like the number of
people who have lung cancer.
State and community health improvement
plans can be a catalyst for empowering
community action. They can be shared
with elected officials, the health
care community, governmental and
community-based agencies, and the
public. The information can foster the
allocation of resources to areas that will
maximize benefits to the collective health
of the community.
Strategies
© Establish collaborative health
assessment and strategic health
improvement planning processes
throughout the Commonwealth that
include public health, health care
systems, and community partners
© Align health system community benefit
programs with community health
improvement plans
© Enhance data systems and public
health information technology to
collect, manage, track, analyze, and
report state and county-level data for
use in health assessments
Measure of Success
AIM 1: HEALTHY, CONNECTED COMMUNITIES
2020 FOCUS GOALS
Key Community PartnersCommunity Organizations
EducatorsElected Officials
EmployersFamilies
Health-Care ProvidersHospital Systems
Local Governments Public
Public Health
43%
100%
20%
40%
60%
80%
100%
2015 2020 GOAL
Districts with Collaborative Community Health
Improvement Processes

13
A CHILD’S HEALTH IS AFFECTED BY
biological influences, including nutrition,
illness, and each parent’s health, as well
as environmental influences, including
education and quality health and social
services.2 Compared to children without
chronic health problems, children with
chronic health problems have a greater
risk of having poorer health outcomes
and lower job status as adults.3,4 Health-
related factors affect school performance,
and in turn academic success is associated
with health outcomes during childhood and
later in adulthood.5 Investing in programs
that lead to improved health for Virginia’s
children benefits everyone and reduces
long-term costs to the Commonwealth.6
Foundational Goals for Giving Children a Strong Start
© Virginians plan their pregnancies
© Virginians are as healthy as possible
before becoming pregnant
© Pregnant women in Virginia receive
recommended prenatal care services
© Virginia mothers breastfeed
© Virginia parents practice positive
parenting
© Virginia fathers are engaged in family
planning, health, parenting, and child
development-focused activities
© Virginia infants and children are not
exposed to secondhand smoke
© Virginia’s children are prepared to
succeed in kindergarten
© Virginia’s adolescents choose not to
engage in behaviors that put their well-
being at risk
© The racial disparity in Virginia’s infant
mortality rate is eliminated
AIM 2: STRONG START FOR CHILDREN
During 2016-2020, Virginia is focusing attention on these foundational goals:
2.1 Virginians plan their pregnancies
2.2 Virginia’s children are prepared to succeed in kindergarten
2.3 The racial disparity in Virginia’s infant mortality rate is eliminated
13

14
Goal 2.1: VIRGINIANS PLAN THEIR PREGNANCIES
Comprehensive family planning and
preconception health lead to improved
birth outcomes, which are associated with
better health and cognition as children
mature. Family planning services include
providing education and contraception.
These services help families have children
when they are financially, emotionally, and
physically ready. Publicly-supported family
planning services prevent an estimated
1.3 million unintended pregnancies a year
in the United States. The trend toward
having smaller families and waiting at
least 24 months between pregnancies
has contributed to better health of infants
and children.7 Preconception health
services for females and males include
health screenings, counseling, and clinical
services that enable them to become as
healthy as possible before pregnancy.8
Strategies
© Increase access to quality family
planning services for all women of
child-bearing age
© Expand evidence-based programs that
promote healthy relationships
© Educate women and men about the
effectiveness of contraceptive methods
and increase access to the most
effective methods
© Expand access to and use of
preconception health services
Key Community Partners
Community Organizations
Faith-based Communities
Families
Federally Qualified Health Centers
Health-Care Providers
Health Insurers
Public Health
Schools
Social Services
AIM 2: STRONG START FOR CHILDREN
2020 FOCUS GOALS

15
Teen Preg2013 27.92020 GOAL 25.1
PALS-‐K2014/15 12.7%2020 GOAL 12.2%
3rd Grade SOL2014 69%2020 GOAL 80%
27.925.1
22.0
24.0
26.0
28.0
30.0
2013 2020 GOAL
Teen
Pre
gnan
cies
per 1
,000
15-‐1
9 Ye
ar O
ld F
emal
es
Teen Pregnancy Rate
12.7% 12.2%
6.0%
8.0%
10.0%
12.0%
14.0%
2014/15 2020 GOAL
Kindergartners Not Meeting PALS-‐K Benchmark
69.0%
80.0%
65.0%
70.0%
75.0%
80.0%
85.0%
2014 2020 GOAL
Third Graders Passing Reading SOL
Measure of Success
15
16
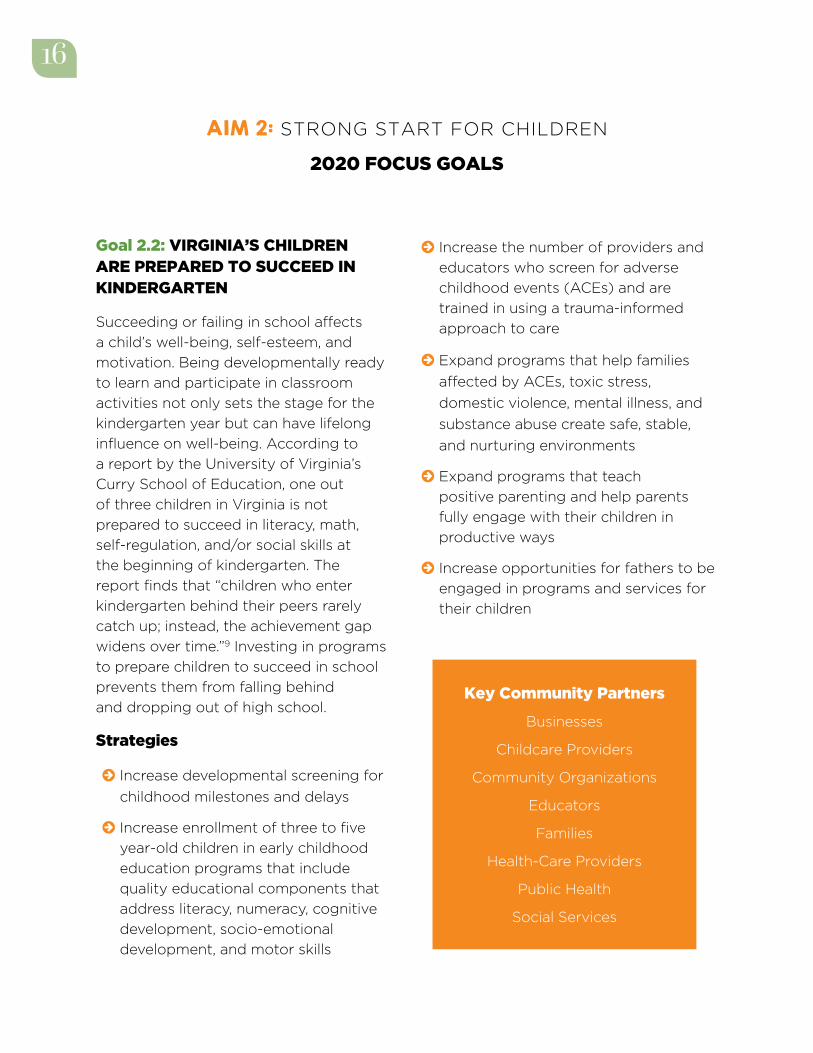
Goal 2.2: VIRGINIA’S CHILDREN ARE PREPARED TO SUCCEED IN KINDERGARTEN
Succeeding or failing in school affects
a child’s well-being, self-esteem, and
motivation. Being developmentally ready
to learn and participate in classroom
activities not only sets the stage for the
kindergarten year but can have lifelong
influence on well-being. According to
a report by the University of Virginia’s
Curry School of Education, one out
of three children in Virginia is not
prepared to succeed in literacy, math,
self-regulation, and/or social skills at
the beginning of kindergarten. The
report finds that “children who enter
kindergarten behind their peers rarely
catch up; instead, the achievement gap
widens over time.”9 Investing in programs
to prepare children to succeed in school
prevents them from falling behind
and dropping out of high school.
Strategies
© Increase developmental screening for
childhood milestones and delays
© Increase enrollment of three to five
year-old children in early childhood
education programs that include
quality educational components that
address literacy, numeracy, cognitive
development, socio-emotional
development, and motor skills
© Increase the number of providers and
educators who screen for adverse
childhood events (ACEs) and are
trained in using a trauma-informed
approach to care
© Expand programs that help families
affected by ACEs, toxic stress,
domestic violence, mental illness, and
substance abuse create safe, stable,
and nurturing environments
© Expand programs that teach
positive parenting and help parents
fully engage with their children in
productive ways
© Increase opportunities for fathers to be
engaged in programs and services for
their children
AIM 2: STRONG START FOR CHILDREN
2020 FOCUS GOALS
Key Community Partners
Businesses
Childcare Providers
Community Organizations
Educators
Families
Health-Care Providers
Public Health
Social Services

17
Teen Preg2013 27.92020 GOAL 25.1
PALS-‐K2014/15 12.7%2020 GOAL 12.2%
3rd Grade SOL2014 69%2020 GOAL 80%
27.925.1
22.0
24.0
26.0
28.0
30.0
2013 2020 GOAL
Teen
Pre
gnan
cies
per 1
,000
15-‐1
9 Ye
ar O
ld F
emal
es
Teen Pregnancy Rate
12.7% 12.2%
6.0%
8.0%
10.0%
12.0%
14.0%
2014/15 2020 GOAL
Kindergartners Not Meeting PALS-‐K Benchmark
69.0%
80.0%
65.0%
70.0%
75.0%
80.0%
85.0%
2014 2020 GOAL
Third Graders Passing Reading SOL
Measures of Success
17

18
AIM 2: STRONG START FOR CHILDREN
2020 FOCUS GOALS
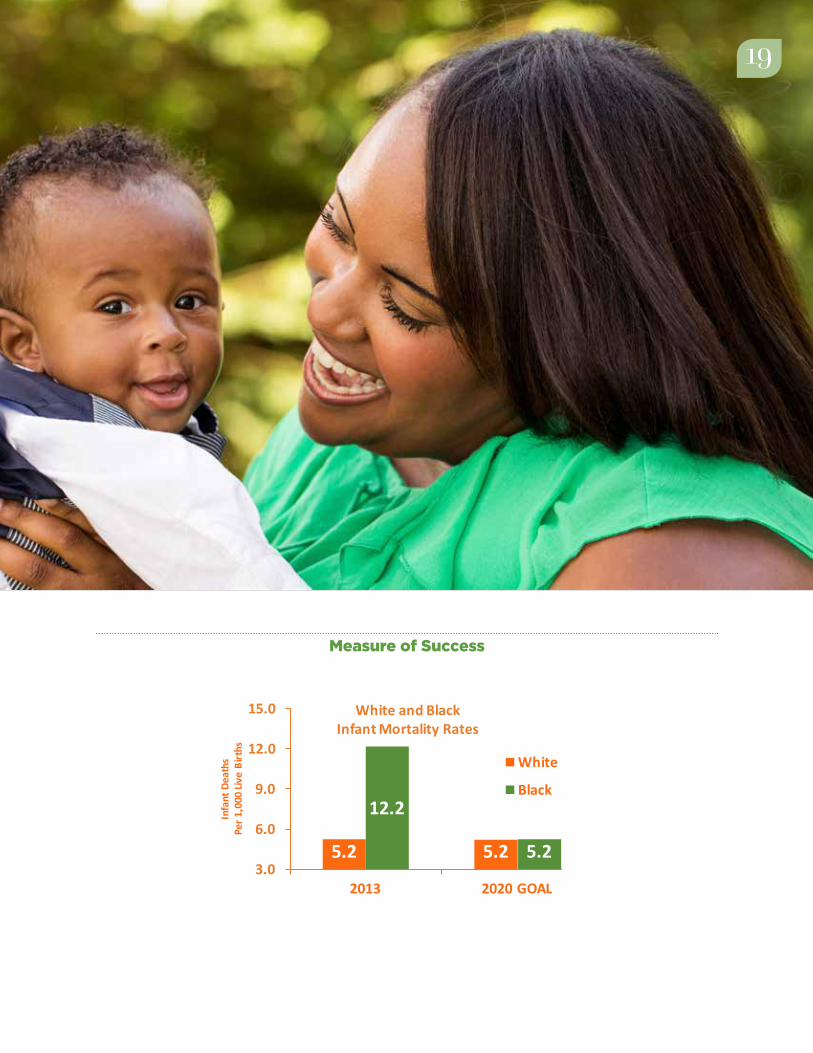
Goal 2.3: THE RACIAL DISPARITY IN VIRGINIA’S INFANT MORTALITY RATE IS ELIMINATED
The Commonwealth has made significant
progress in helping its infants thrive;
however, some communities have worse
outcomes than others. If the rate at which
black infants and white infants died were
equal, Virginia would have the lowest
infant mortality rate in the country. Giving
everyone a chance to live a healthy
life benefits not only those currently
disadvantaged but the whole community.
Closing this gap requires addressing the
root causes of disparities throughout
life. To achieve equity, all sectors of the
community—from policy makers to
grassroots community organizations to
community members—must work together.
Strategies
© Form neighborhood collaboratives co-
led by community members in under-
resourced communities to identify
obstacles and develop plans to address
the root causes of health inequities
© Increase the number of providers
who screen postpartum women for
depression and provide or refer for
treatment
© Eliminate early elective deliveries
© Expand outreach to pregnant women
and increase the number of group
prenatal care classes
© Implement policies that support
women and their families in
breastfeeding for at least six months
© Expand home visiting and family
support programs
Key Community Partners
Community Organizations
Educators
Elected Officials
Families
Federally Qualified Health Centers
Health-Care Providers
Health Insurers
Hospital Association
Medical Societies
Mental Health Providers
Public Health
Social Services
19
Measure of Success
IMR
White Black2013 5.2 12.22020 GOAL 5.2 5.2
5.2 5.2
12.2
5.23.0
6.0
9.0
12.0
15.0
2013 2020 GOAL
Infa
nt D
eath
sPe
r 1,0
00 Li
ve B
irths
White and Black Infant Mortality Rates
White
Black
19

20
A CULTURE OF HEALTH AND
WELLNESS is built on preventive actions.
Virginia can substantially decrease the
burden of disease and reduce health care
spending by creating conditions that
lead to health. Communities, health care
systems, and individuals all have a role
to play. For example, reversing Virginia’s
high prevalence of obesity will require
(1) community design and policies that
promote healthy eating and active living;
(2) clinical interventions and education;
and (3) individual behavior modification.
Policy makers can create the conditions
that support the healthy choice becoming
the easy choice. Fluoridating drinking
water, developing walkable communities,
and prohibiting smoking in public
buildings are actions that prevent disease.
Clinical interventions that promote health
include vaccination, cancer screenings,
treatment for high blood pressure,
dental cleanings, and early identification
and treatment of persons addicted to
substances. According to the Centers for
Disease Control and Prevention (CDC),
Americans receive preventive health
services “at about half the recommended
rate”.10 This results in complex, advanced
disease that is more costly to treat.
Personal behaviors that prevent disease
include not using tobacco; eating appropri-
ately-sized portions; daily dental flossing;
practicing safe sex; exercising regularly;
and taking medicines as prescribed.
Foundational Goals for Preventive Actions
© Virginians follow a healthy diet and
live actively
© Virginia prevents nicotine
dependency
© Virginia conducts comprehensive
surveillance and investigation of
diseases
© Virginians are protected against
vaccine-preventable diseases
© Virginians are free from sexually
transmitted infections
© Virginia prevents and controls animal
diseases from spreading to people (for
example, rabies and bird flu)
AIM 3: PREVENTIVE ACTIONS
20

21
During 2016-2020, Virginia is focusing attention on these foundational goals:
3.1 Virginians follow a healthy diet and live actively
3.2 Virginia prevents nicotine dependency
3.3 Virginians are protected against vaccine-preventable diseases
3.4 In Virginia, cancers are prevented or diagnosed at the earliest stage possible
3.5 Virginians have lifelong wellness
© In Virginia, injuries are prevented
© Virginians have good oral health
© Virginians have access to, can afford,
and receive preventive clinical services
© In Virginia, cancers are prevented
or diagnosed at the earliest stage
possible
© Virginians have lifelong wellness
21
22
AIM 3: PREVENTIVE ACTIONS
2020 FOCUS GOALS
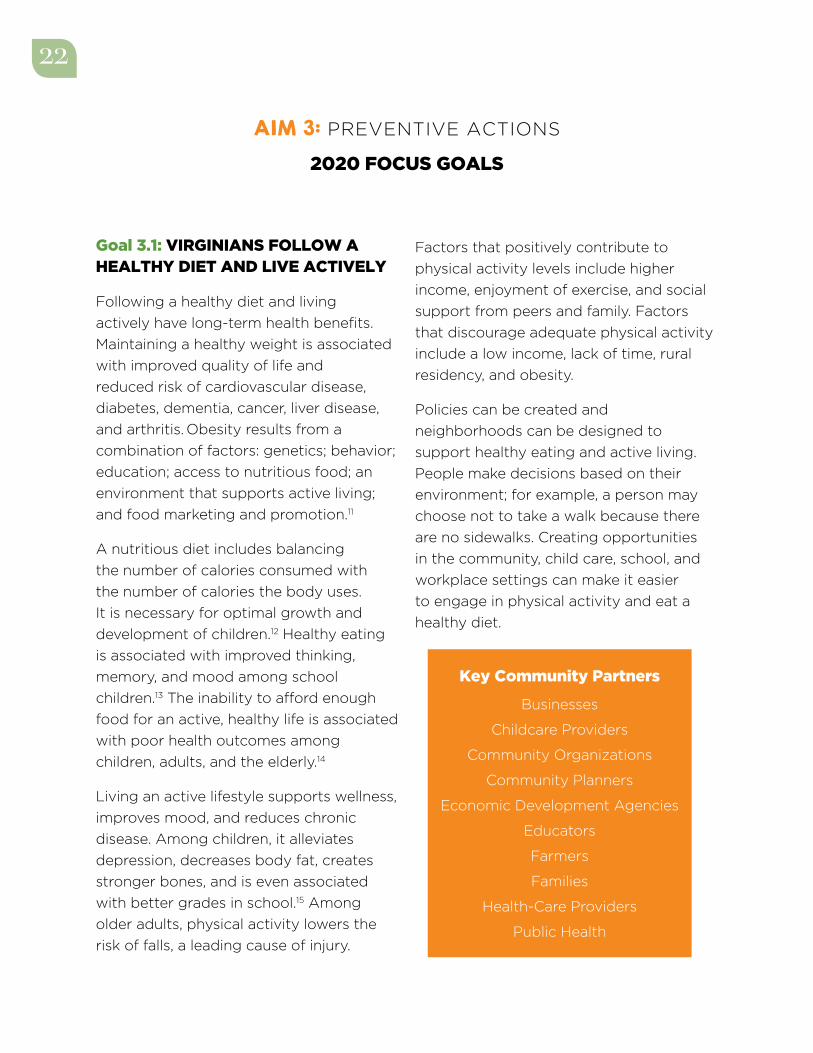
Goal 3.1: VIRGINIANS FOLLOW A HEALTHY DIET AND LIVE ACTIVELY
Following a healthy diet and living
actively have long-term health benefits.
Maintaining a healthy weight is associated
with improved quality of life and
reduced risk of cardiovascular disease,
diabetes, dementia, cancer, liver disease,
and arthritis. Obesity results from a
combination of factors: genetics; behavior;
education; access to nutritious food; an
environment that supports active living;
and food marketing and promotion.11
A nutritious diet includes balancing
the number of calories consumed with
the number of calories the body uses.
It is necessary for optimal growth and
development of children.12 Healthy eating
is associated with improved thinking,
memory, and mood among school
children.13 The inability to afford enough
food for an active, healthy life is associated
with poor health outcomes among
children, adults, and the elderly.14
Living an active lifestyle supports wellness,
improves mood, and reduces chronic
disease. Among children, it alleviates
depression, decreases body fat, creates
stronger bones, and is even associated
with better grades in school.15 Among
older adults, physical activity lowers the
risk of falls, a leading cause of injury.
Factors that positively contribute to
physical activity levels include higher
income, enjoyment of exercise, and social
support from peers and family. Factors
that discourage adequate physical activity
include a low income, lack of time, rural
residency, and obesity.
Policies can be created and
neighborhoods can be designed to
support healthy eating and active living.
People make decisions based on their
environment; for example, a person may
choose not to take a walk because there
are no sidewalks. Creating opportunities
in the community, child care, school, and
workplace settings can make it easier
to engage in physical activity and eat a
healthy diet.
Key Community Partners
Businesses
Childcare Providers
Community Organizations
Community Planners
Economic Development Agencies
Educators
Farmers
Families
Health-Care Providers
Public Health

23
Strategies
© Integrate health planning into local and
regional comprehensive planning
© Adopt community designs that
support active living, including
concentrated mixed use development
and bicycle- and pedestrian-friendly
communities
© Expand opportunities during and after
school for children to get healthy meals
and the recommended amount of daily
physical activity
© Create parks, recreation facilities or
open space in all neighborhoods
© Increase access to healthy and
affordable foods in all neighborhoods
© Implement organizational and
programmatic nutrition standards and
policies
© Expand programs and services to
eliminate childhood hunger
© Help people recognize and make
healthy food and beverage choices
© Increase the number of evidence-based
employee wellness programs
23
24
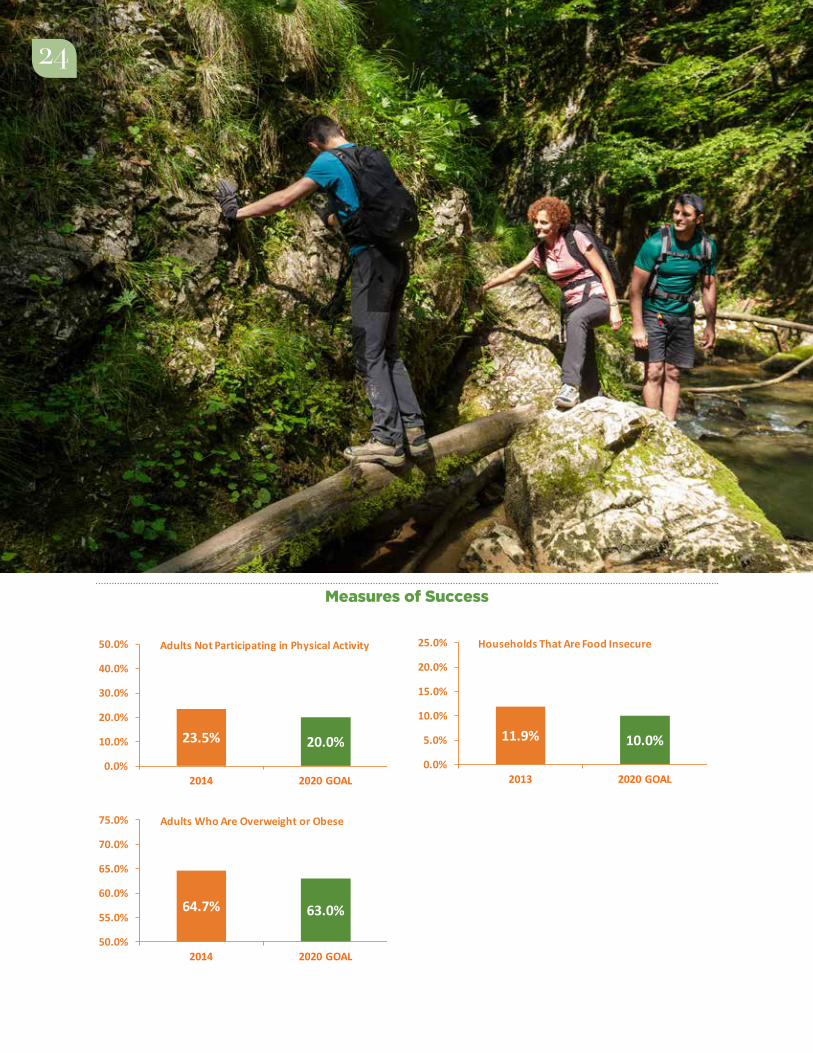
Measures of Success
Phys Act2014 23.50%2020 GOAL 20.00%
Obesity2014 64.70%2020 GOAL 63%
Food Insecurity2013 11.90%2020 GOAL 10%
23.5% 20.0%0.0%
10.0%
20.0%
30.0%
40.0%
50.0%
2014 2020 GOAL
Adults Not Participating in Physical Activity
64.7% 63.0%
50.0%
55.0%
60.0%
65.0%
70.0%
75.0%
2014 2020 GOAL
Adults Who Are Overweight or Obese
11.9% 10.0%0.0%
5.0%
10.0%
15.0%
20.0%
25.0%
2013 2020 GOAL
Households That Are Food Insecure
24

25
Goal 3.2: VIRGINIA PREVENTS NICOTINE DEPENDENCY
According to the CDC, “tobacco use is the
single most preventable cause of death
and disease in the United States.”16 The
Campaign for Tobacco Free Kids reports
that health care costs in Virginia directly
caused by smoking are $3.11 billion a year.17
Smoking is associated with heart disease,
stroke, chronic lung disease, diabetes,
bone disease, and many types of cancer.
Tobacco accounts for 30% of all cancer
deaths. Secondhand smoke causes heart
disease, stroke, and lung cancer. It affects
the health of infants and children by
increasing the risk for asthma attacks,
respiratory and ear infections, and Sudden
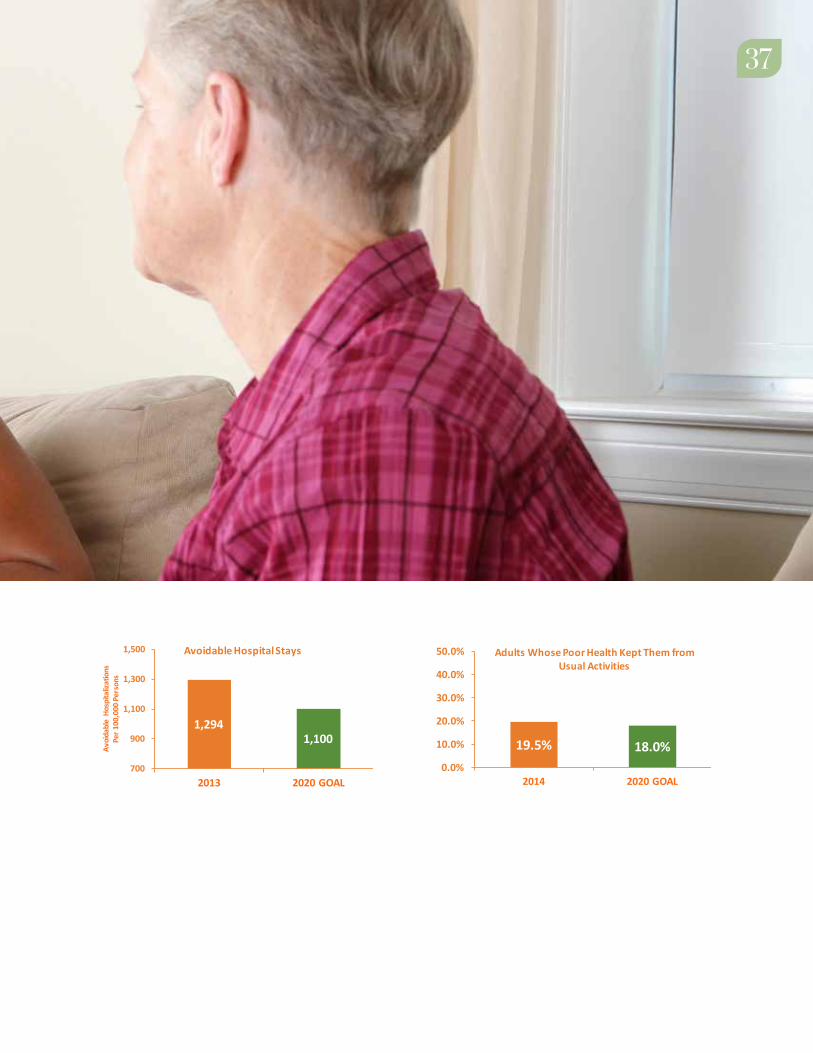
Infant Death Syndrome.18, 19
Strategies
© Establish smoke-free policies and social
norms
© Promote tobacco cessation and
support tobacco users in quitting
© Prevent initiation of tobacco use
AIM 3: PREVENTIVE ACTIONS
2020 FOCUS GOALS
Key Community Partners
Academic Partners
Businesses
Elected Officials
Faith-based Communities
Health-Care Providers
Health Insurers
Public Health
School Districts
Tobacco Flu Vaccine CRC2014 21.9% 2014-‐15 48.20% 2014 69.1%2020 GOAL 12% 2020 GOAL 70% 2020 GOAL 85%
HPV -‐ Adol DFLE2014 35.90% 22.5% 2013 66.12020 GOAL 80% 80% 2020 GOAL 67.3
21.9%
12.0%2.0%
8.0%
14.0%
20.0%
26.0%
2014 2020 GOAL
Adults Using Tobacco
35.9%
80.0%
22.5%
80.0%
0.0%
20.0%
40.0%
60.0%
80.0%
2014 2020 GOAL
Adolescents Vaccinated Against HPV
Girls
Boys
48.2%70.0%
0.0%
20.0%
40.0%
60.0%
80.0%
2014-‐15 2020 GOAL
Adults Vaccinated Against Influenza
69.1%85.0%
20.0%
40.0%
60.0%
80.0%
100.0%
2014 2020 GOAL
Adults Screened for Colorectal Cancer
66.167.3
65
66
67
68
69
2013 2020 GOAL
Age (Yea
rs)
Disability-‐Free Life Expectancy
Measure of Success
26
Goal 3.3: VIRGINIANS ARE PROTECTED AGAINST VACCINE-PREVENTABLE DISEASES
Virginians who receive their recommended
vaccines protect themselves from illness
and protect others by decreasing the
spread of disease. Virginia benefits from
high childhood immunization rates.
However, in two other areas, it lags behind.
While the percent of adults receiving
an annual flu vaccine has increased, it
is still below the national goal. The area
of most concern, however, is a low rate
of adolescent vaccinations that prevent
meningococcal meningitis and cancers
caused by the Human Papillomavirus
(HPV).
Strategies
© Use patient registries to identify
patients due for vaccination and send
them reminders
© Evaluate data from the Vaccines for
Children program and target outreach
to providers who have the opportunity
to improve vaccination rates
© Evaluate data from the Virginia
Immunization Information System to
assess immunization coverage and
develop targeted interventions to
address gaps
© Educate Virginians about the
effectiveness of HPV vaccination in
preventing HPV-associated cancers
© Increase the number of adolescents
who receive well visits in patient-
centered medical homes
© Establish policies to ensure health-
care providers receive annual influenza
vaccine
AIM 3: PREVENTIVE ACTIONS
2020 FOCUS GOALS
Key Community Partners
Families
Federally Qualified Health Centers
Health-Care Providers
Hospital Systems
Health Insurers
Medical Societies
Public Health

27
Measures of Success
22.5%80%
35.9%
80.0%
22.5%
80.0%
0.0%
20.0%
40.0%
60.0%
80.0%
2014 2020 GOAL
Adolescents Vaccinated Against HPV
Girls
Boys
48.2%70.0%
0.0%
20.0%
40.0%
60.0%
80.0%
2014-2015 2020 GOAL
Adults Vaccinated Against Influenza
Tobacco Flu Vaccine CRC2014 21.9% 2014-‐15 48.20% 2014 69.1%2020 GOAL 12% 2020 GOAL 70% 2020 GOAL 85%
HPV -‐ Adol DFLE2014 35.90% 22.5% 2013 66.12020 GOAL 80% 80% 2020 GOAL 67.3
21.9%
12.0%2.0%
8.0%
14.0%
20.0%
26.0%
2014 2020 GOAL
Adults Using Tobacco
35.9%
80.0%
22.5%
80.0%
0.0%
20.0%
40.0%
60.0%
80.0%
2014 2020 GOAL
Adolescents Vaccinated Against HPV
Girls
Boys
48.2%70.0%
0.0%
20.0%
40.0%
60.0%
80.0%
2014-‐15 2020 GOAL
Adults Vaccinated Against Influenza
69.1%85.0%
20.0%
40.0%
60.0%
80.0%
100.0%
2014 2020 GOAL
Adults Screened for Colorectal Cancer
66.167.3
65
66
67
68
69
2013 2020 GOALAg
e (Yea
rs)
Disability-‐Free Life Expectancy
27

28
Goal 3.4: CANCERS ARE PREVENTED OR DIAGNOSED AT THE EARLIEST STAGE POSSIBLE
Cancer is the leading cause of death for
Virginians. It is caused by changes to
the genes that lead to the uncontrolled
growth of specific cells in the body. There
are many types of cancer, and the risks
associated with each type vary. Preventive
actions can keep some cancers from
developing. These include not using
tobacco, minimizing alcohol consumption,
and vaccination against HPV and Hepatitis
B. In some cases, when cancer does form,
it can be identified early through evidence-
based screenings, resulting in better
treatment options and outcomes.
Strategies
© Increase tobacco prevention and
cessation programs
© Increase percent of medical practices
that implement evidence-based
client reminder systems to increase
recommended cancer screenings for
patients
© Increase the number of providers,
lay health advisors, and volunteers
trained in health literacy to provide
one-on-one education in medical,
community, worksite, and household
settings to support people in seeking
recommended cancer screenings
© Implement evidence-based strategies
to reduce structural barriers to cancer
screenings
© Implement provider assessment and
feedback interventions to increase
cancer screenings
AIM 3: PREVENTIVE ACTIONS
2020 FOCUS GOALS
Key Community Partners
Community Organizations
Employers
Families
Federally Qualified Health Centers
Health Care Providers
Health Insurers
Hospital Systems
Lay Health Workers
Medical Societies
Public Health

29
Measure of Success
Tobacco Flu Vaccine CRC2014 21.9% 2014-‐15 48.20% 2014 69.1%2020 GOAL 12% 2020 GOAL 70% 2020 GOAL 85%
HPV -‐ Adol DFLE2014 35.90% 22.5% 2013 66.12020 GOAL 80% 80% 2020 GOAL 67.3
21.9%
12.0%2.0%
8.0%
14.0%
20.0%
26.0%
2014 2020 GOAL
Adults Using Tobacco
35.9%
80.0%
22.5%
80.0%
0.0%
20.0%
40.0%
60.0%
80.0%
2014 2020 GOAL
Adolescents Vaccinated Against HPV
Girls
Boys
48.2%70.0%
0.0%
20.0%
40.0%
60.0%
80.0%
2014-‐15 2020 GOAL
Adults Vaccinated Against Influenza
69.1%85.0%
20.0%
40.0%
60.0%
80.0%
100.0%
2014 2020 GOAL
Adults Screened for Colorectal Cancer
66.167.3
65
66
67
68
69
2013 2020 GOAL
Age (Yea
rs)
Disability-‐Free Life Expectancy
29

30
Goal 3.5: VIRGINIANS HAVE LIFE-LONG WELLNESS
Nearly one out of every eight Virginians
today is 65 or older. In two decades,
almost one in every five will be. Preventive
actions and support systems can result
in people living in their own home and
community safely, independently, and
comfortably, regardless of age, income, or
ability level.
Strategies
© Encourage construction of safe,
congregate and retirement housing for
the aging population
© Increase access to internet usage for
aging Virginians
© Increase the number of fitness and
physical therapy facilities that promote
senior fitness
© Develop a statewide senior falls
prevention program
© Implement community-wide value-
neutral programs to support Virginians
in planning in advance for future
healthcare choices
AIM 3: PREVENTIVE ACTIONS
2020 FOCUS GOALS
Key Community Partners
Academic Partners
Adult Daycare Providers
Area Agencies on Aging
Faith-based Communities
Businesses
Families
Health-Care Providers
Hospital Systems
Nursing Homes
Public Health
Senior Centers

31
Measure of Success
Tobacco Flu Vaccine CRC2014 21.9% 2014-‐15 48.20% 2014 69.1%2020 GOAL 12% 2020 GOAL 70% 2020 GOAL 85%
HPV -‐ Adol DFLE2014 35.90% 22.5% 2013 66.12020 GOAL 80% 80% 2020 GOAL 67.3
21.9%
12.0%2.0%
8.0%
14.0%
20.0%
26.0%
2014 2020 GOAL
Adults Using Tobacco
35.9%
80.0%
22.5%
80.0%
0.0%
20.0%
40.0%
60.0%
80.0%
2014 2020 GOAL
Adolescents Vaccinated Against HPV
Girls
Boys
48.2%70.0%
0.0%
20.0%
40.0%
60.0%
80.0%
2014-‐15 2020 GOAL
Adults Vaccinated Against Influenza
69.1%85.0%
20.0%
40.0%
60.0%
80.0%
100.0%
2014 2020 GOAL
Adults Screened for Colorectal Cancer
66.167.3
65
66
67
68
69
2013 2020 GOAL
Age (Yea
rs)
Disability-‐Free Life Expectancy
31
32
VIRGINIA IS HOME TO EXCELLENT
providers and hospitals that deliver state-
of-the-art health care services. However,
like the rest of the United States, many
health measures, including patient
outcomes and quality, lag behind other
developed countries. Health care spending
in the United States is the highest in the
world and continues to increase. Increased
longevity and chronic health problems
place new demands on the utilization of
medical services and medical technology
and contribute to higher spending.
The leading category of health care
spending in Virginia is hospitalization.
Many hospital stays can be avoided
through prevention and primary care. In
Virginia in 2013, there were 1,294 avoidable
hospital stays for every 100,000 people.
The rate ranges significantly across
Virginia, from 233 to 6,934 per 100,000. A
Kaiser Family Foundation poll found that
40% of Americans were “very worried”
about “having to pay more for their
health care or health insurance”.20 The
challenge for Virginia is to improve health
care quality by providing care that is safe,
effective, patient-centered, timely, efficient,
and equitable while controlling health care
spending.
Meeting this challenge is difficult because
health care is delivered across many
disparate and independent settings and
by many providers. The average Medicare
beneficiary with chronic illness in the U.S.
sees an average of 13 physicians a year.21
The Commonwealth Fund Commission
challenged health care systems to improve
performance by 2020. Strategies include
making patient’s clinical information
available at the point of care through
shared electronic health records and
actively coordinating care across providers
and settings.22
32
AIM 4: SYSTEM OF HEALTH CARE
33
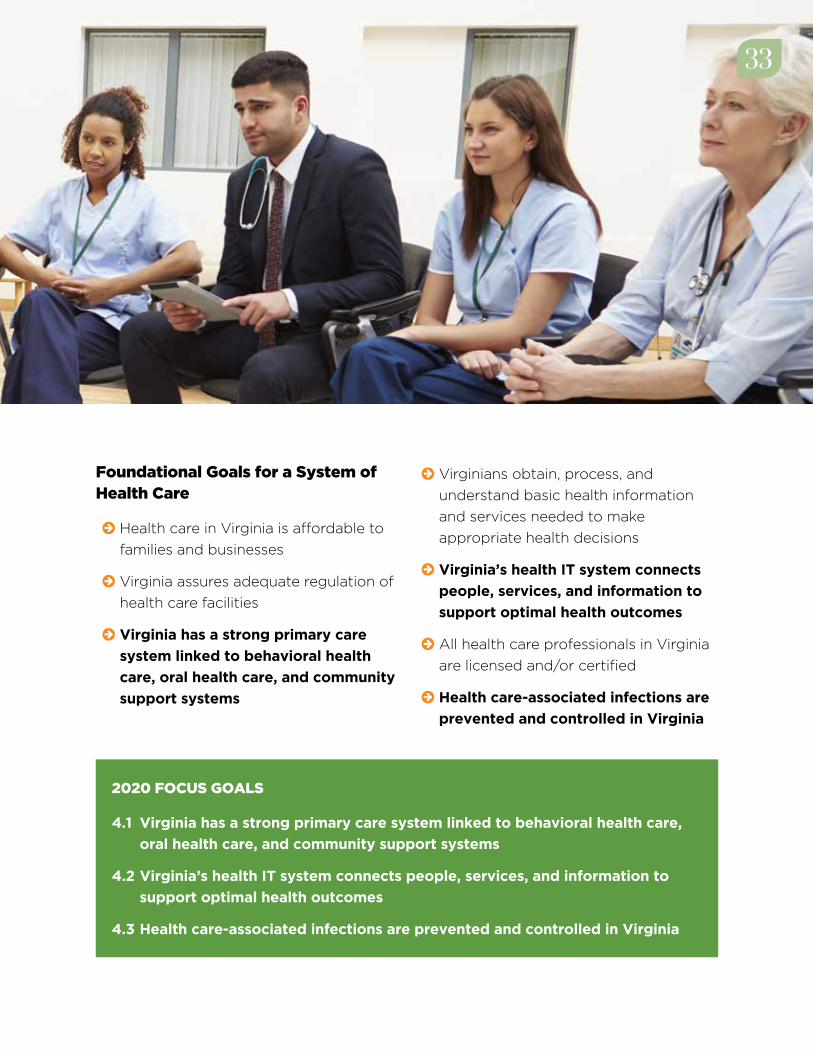
2020 FOCUS GOALS
4.1 Virginia has a strong primary care system linked to behavioral health care,
oral health care, and community support systems
4.2 Virginia’s health IT system connects people, services, and information to
support optimal health outcomes
4.3 Health care-associated infections are prevented and controlled in Virginia
33
Foundational Goals for a System of Health Care
© Health care in Virginia is affordable to
families and businesses
© Virginia assures adequate regulation of
health care facilities
© Virginia has a strong primary care
system linked to behavioral health
care, oral health care, and community
support systems
© Virginians obtain, process, and
understand basic health information
and services needed to make
appropriate health decisions
© Virginia’s health IT system connects
people, services, and information to
support optimal health outcomes
© All health care professionals in Virginia
are licensed and/or certified
© Health care-associated infections are
prevented and controlled in Virginia

34
Goal 4.1: VIRGINIA HAS A STRONG PRIMARY CARE SYSTEM LINKED TO BEHAVIORAL HEALTH CARE, ORAL HEALTH CARE, AND COMMUNITY SUPPORT SYSTEMS
A primary care provider is an important
point of entry into the complex health
care delivery system. This is especially
important for people living with chronic
conditions like diabetes. As the number of
Virginians with chronic disease increases,
the need for patient-centered care
coordination and programs to help them
manage their medications and monitor
their illness increases.
Untreated mental health disorders
and substance misuse and abuse have
serious impact on physical health and
are associated with the prevalence,
progression, and outcome of some of
today’s most pressing chronic diseases,
including diabetes, heart disease, and
cancer. Integrating behavioral health care,
substance abuse prevention and treatment
services, and primary care services
produces the best outcomes and proves
the most effective approach to caring for
people with complex health care needs.23
Bringing together hospital systems, health
care providers, insurers and community
partners to develop shared strategies to
improve population health can lead to
improved delivery systems and better
coordination of care across settings.
Strategies
© Create Accountable Care Communities
throughout Virginia, groups of health-
care providers and community partners
that voluntarily coordinate high quality
care to ensure patients get the right
care at the right time; avoid duplication
of services; and prevent medical errors
© Incentivize payment for healthcare that
leads to prevention and management
of health and wellness rather than
episodic treatment of disease
© Improve access to comprehensive
primary care in patient-centered
medical homes
© For patients with complex conditions,
integrate primary care with behavioral
health care, substance abuse services,
and oral health care
© Increase the number of Virginia-
certified community behavioral health
clinics
© Expand telemedicine services in rural
areas of Virginia
AIM 4: SYSTEM OF HEALTH CARE
2020 FOCUS GOALS

35
© Increase care coordination across
providers and settings
© Expand adoption of the community
health worker model by health care
organizations
© Develop patient-centered health
communications that have a positive
impact on health, health care, and
health equity
© Increase the number of providers
who screen for nicotine use,
including smokeless tobacco
and e-cigarettes, and provide or
refer for cessation services
© Expand access to and use of
community-based programs for
treatment of mental health disorders
© Promote drug-prescribing protocols in
health care settings
© In primary care and other settings,
increase use of the Screening,
Brief Intervention, Referral and
Treatment tool (an evidence-
based practice used to identify,
reduce, and prevent problematic
use, abuse, and dependence
on alcohol and illicit drugs)
© Increase the number of providers
who screen for domestic violence
and refer victims to organizations
that can assist them
© Educate Virginians about how to avoid
wasteful or unnecessary medical tests,
treatments and procedures
Key Community Partners
Businesses
Community Organizations
Faith-based Communities
Federally Qualified Health Centers
Health-Care Providers
Hospital Systems
Public Health
35

3636
Measures of Success
HCP HCP MH Hospitalizations C diff2014 69.3% 2013 884 2013 36%2020 GOAL 85.0% 2020 GOAL 825 2020 GOAL 100%
Avoidable Hospital Stays2013 1,294 Elec HR2020 GOAL 1,100 2015 70.6%
2020 GOAL 90.0%
HIEAvoidable Heart Disease Deaths 2015 3,800 2013 46.8 2020 GOAL 7,600 2020 GOAL 40.0
69.3%85.0%
20.0%
40.0%
60.0%
80.0%
100.0%
2014 2020 GOAL
Adults with a Regular Healthcare Providers
1,2941,100
700
900
1,100
1,300
1,500
2013 2020 GOAL
Avoi
dabl
e Ho
spita
lizat
ions
Pe
r 100
,000
Per
sons
Avoidable Hospital Stays
46.840.0
30
35
40
45
50
2013 2020 GOAL
Avoi
dabl
e De
aths
from
Hea
rt D
z,
Stro
ke a
nd H
yper
tens
ive
Dz
Per 1
00,0
00 P
erso
ns
Avoidable Heart Disease Deaths
884 825
600
700
800
900
1,000
2013 2020 GOAL
Men
tal H
ealth
and
Sub
stan
ce
Use
Diso
rder
Hos
pita
lizat
ions
Pe
r 100
,000
Per
sons
Mental Health and Substance Abuse Hospitalizations
70.6%90.0%
20.0%
40.0%
60.0%
80.0%
100.0%
2014 2020 GOAL
Providers with Electronic Health Records
3,800
7,600
2,000
4,000
6,000
8,000
10,000
2015 2020 GOAL
Entities Connected to Health Information Exchange
38.5%
100%
0%
20%
40%
60%
80%
100%
2013 2020 GOAL
Hospitals Meeting State Goal for Prevention of C. difficile Infections
668.5635.1
600
640
680
720
760
2013 2020 GOAL
Men
tal H
ealth
and
Sub
stan
ce
Use
Diso
rder
Hos
pita
lizat
ions
Pe
r 100
,000
Adu
lts
Adult Mental Health and Substance Abuse Hospitalizations
70.6%90.0%
20.0%
40.0%
60.0%
80.0%
100.0%
2015 2020 GOAL
Providers with Electronic Health Records
3,800
7,600
2,000
4,000
6,000
8,000
10,000
2015 2020 GOAL
Entities Connected to Health Information Exchange
HCP HCP2014 69.3%2020 GOAL 85.0%
Avoidable Hospital Stays2013 1,294 2020 GOAL 1,100
Avoidable Cardiovascular Dz Deaths2013 46.8 2020 GOAL 40.0
69.3%85.0%
20.0%
40.0%
60.0%
80.0%
100.0%
2014 2020 GOAL
Adults with a Regular Healthcare Providers
1,2941,100
700
900
1,100
1,300
1,500
2013 2020 GOAL
Avoida
ble
Hosp
italiz
ations
Pe
r 100
,000
Per
sons
Avoidable Hospital Stays
50.040.0
30
35
40
45
50
2013 2020 GOAL
Avoida
ble
Deat
hs fr
om H
eart D
z,
Stro
ke and
Hyp
erte
nsive
Dz
Per 1
00,0
00 Per
sons
Avoidable CardiovascularDisease Deaths
37
HCP HCP MH Hospitalizations C diff2014 69.3% 2013 884 2013 36%2020 GOAL 85.0% 2020 GOAL 825 2020 GOAL 100%
Avoidable Hospital Stays2013 1,294 Elec HR2020 GOAL 1,100 2015 70.6%
2020 GOAL 90.0%
HIEAvoidable Heart Disease Deaths 2015 3,800 2013 46.8 2020 GOAL 7,600 2020 GOAL 40.0
69.3%85.0%
20.0%
40.0%
60.0%
80.0%
100.0%
2014 2020 GOAL
Adults with a Regular Healthcare Providers
1,2941,100
700
900
1,100
1,300
1,500
2013 2020 GOAL
Avoi
dabl
e Ho
spita
lizat
ions
Pe
r 100
,000
Per
sons
Avoidable Hospital Stays
46.840.0
30
35
40
45
50
2013 2020 GOAL
Avoi
dabl
e De
aths
from
Hea
rt D
z,
Stro
ke a
nd H
yper
tens
ive
Dz
Per 1
00,0
00 P
erso
ns
Avoidable Heart Disease Deaths
884 825
600
700
800
900
1,000
2013 2020 GOAL
Men
tal H
ealth
and
Sub
stan
ce
Use
Diso
rder
Hos
pita
lizat
ions
Pe
r 100
,000
Per
sons
Mental Health and Substance Abuse Hospitalizations
70.6%90.0%
20.0%
40.0%
60.0%
80.0%
100.0%
2014 2020 GOAL
Providers with Electronic Health Records
3,800
7,600
2,000
4,000
6,000
8,000
10,000
2015 2020 GOAL
Entities Connected to Health Information Exchange
38.5%
100%
0%
20%
40%
60%
80%
100%
2013 2020 GOAL
Hospitals Meeting State Goal for Prevention of C. difficile Infections
Poor Health2014 19.50%2020 GOAL 18.00%
VDH ElecHR2015 02020 GOAL 35
19.5% 18.0%0.0%
10.0%
20.0%
30.0%
40.0%
50.0%
2014 2020 GOAL
Adults Whose Poor Health Kept Them from Usual Activities
0
35
0
7
14
21
28
35
2015 2020 GOAL
Health Districts with Electronic Health Records
37

38
Goal 4.2: VIRGINIA’S HEALTH IT SYSTEM CONNECTS PEOPLE, SERVICES, AND INFORMATION TO SUPPORT OPTIMAL HEALTH OUTCOMES
Virginians and their health-care providers
benefit from access to comprehensive,
secure, easily accessible health information
that can inform better decision making.
Connect Virginia HIE, Inc. is the
Commonwealth’s health-information
exchange designed to promote
collaboration and information sharing
between consumers, health-care providers,
and purchasers of health care services.
Developing the capacity to collect,
analyze, and share population health
information provides the opportunity for
Virginia to create policies and systems
to bring about meaningful health
improvement for all Virginians.
Strategies
© Adopt electronic health records in all
clinical and care coordination settings
© Expand the use of specific disease
registries and reports (for example,
patients with hypertension) by medical
practices and hospital systems to
evaluate and track patient outcomes
and develop targeted interventions to
improve patient outcomes
© Connect providers, hospitals, and
community partners through Connect
Virginia HIE, Inc. to allow for statewide
health information exchange
© Develop the capacity to create
aggregated data reports through
Connect Virginia HIE, Inc. that can be
used to analyze and track population
health measures
© Enhance public and private
data systems and public health
information technology to collect,
manage, track, analyze, and
report population health data
© Support Health Information
Technology training opportunities
and jobs
AIM 4: SYSTEM OF HEALTH CARE
2020 FOCUS GOALS
Key Community Partners
Businesses
Elected Officials
Federally Qualified Health Centers
Free Clinics
Health-Care Providers
Health Insurers
Hospital Systems
Public Health

39
Measures of Success
HCP HCP MH Hospitalizations C diff2014 69.3% 2013 884 2013 36%2020 GOAL 85.0% 2020 GOAL 825 2020 GOAL 100%
Avoidable Hospital Stays2013 1,294 Elec HR2020 GOAL 1,100 2015 70.6%
2020 GOAL 90.0%
HIEAvoidable Heart Disease Deaths 2015 3,800 2013 46.8 2020 GOAL 7,600 2020 GOAL 40.0
69.3%85.0%
20.0%
40.0%
60.0%
80.0%
100.0%
2014 2020 GOAL
Adults with a Regular Healthcare Providers
1,2941,100
700
900
1,100
1,300
1,500
2013 2020 GOAL
Avoi
dabl
e Ho
spita
lizat
ions
Pe
r 100
,000
Per
sons
Avoidable Hospital Stays
46.840.0
30
35
40
45
50
2013 2020 GOAL
Avoi
dabl
e De
aths
from
Hea
rt D
z,
Stro
ke a
nd H
yper
tens
ive
Dz
Per 1
00,0
00 P
erso
ns
Avoidable Heart Disease Deaths
884 825
600
700
800
900
1,000
2013 2020 GOAL
Men
tal H
ealth
and
Sub
stan
ce
Use
Diso
rder
Hos
pita
lizat
ions
Pe
r 100
,000
Per
sons
Mental Health and Substance Abuse Hospitalizations
70.6%90.0%
20.0%
40.0%
60.0%
80.0%
100.0%
2014 2020 GOAL
Providers with Electronic Health Records
3,800
7,600
2,000
4,000
6,000
8,000
10,000
2015 2020 GOAL
Entities Connected to Health Information Exchange
38.5%
100%
0%
20%
40%
60%
80%
100%
2013 2020 GOAL
Hospitals Meeting State Goal for Prevention of C. difficile Infections
Poor Health2014 19.50%2020 GOAL 18.00%
VDH ElecHR2015 02020 GOAL 35
19.5% 18.0%0.0%
10.0%
20.0%
30.0%
40.0%
50.0%
2014 2020 GOAL
Adults Whose Poor Health Kept Them from Usual Activities
0
35
0
7
14
21
28
35
2015 2020 GOAL
Health Districts with Electronic Health Records
HCP HCP MH Hospitalizations C diff2014 69.3% 2013 884 2013 36%2020 GOAL 85.0% 2020 GOAL 825 2020 GOAL 100%
Avoidable Hospital Stays2013 1,294 Elec HR2020 GOAL 1,100 2015 70.6%
2020 GOAL 90.0%
HIEAvoidable Heart Disease Deaths 2015 3,800 2013 46.8 2020 GOAL 7,600 2020 GOAL 40.0
69.3%85.0%
20.0%
40.0%
60.0%
80.0%
100.0%
2014 2020 GOAL
Adults with a Regular Healthcare Providers
1,2941,100
700
900
1,100
1,300
1,500
2013 2020 GOAL
Avoi
dabl
e Ho
spita
lizat
ions
Pe
r 100
,000
Per
sons
Avoidable Hospital Stays
46.840.0
30
35
40
45
50
2013 2020 GOAL
Avoi
dabl
e De
aths
from
Hea
rt D
z,
Stro
ke a
nd H
yper
tens
ive
Dz
Per 1
00,0
00 P
erso
ns
Avoidable Heart Disease Deaths
884 825
600
700
800
900
1,000
2013 2020 GOAL
Men
tal H
ealth
and
Sub
stan
ce
Use
Diso
rder
Hos
pita
lizat
ions
Pe
r 100
,000
Per
sons
Mental Health and Substance Abuse Hospitalizations
70.6%90.0%
20.0%
40.0%
60.0%
80.0%
100.0%
2014 2020 GOAL
Providers with Electronic Health Records
3,800
7,600
2,000
4,000
6,000
8,000
10,000
2015 2020 GOAL
Entities Connected to Health Information Exchange
38.5%
100%
0%
20%
40%
60%
80%
100%
2013 2020 GOAL
Hospitals Meeting State Goal for Prevention of C. difficile Infections
39

40
Goal 4.3: HEALTH CARE-ASSOCIATED INFECTIONS ARE PREVENTED AND CONTROLLED IN VIRGINIA
Developing systems to assure patient
safety has improved but remains an
important goal in providing quality
care. Health care-associated infections
(HAIs), those resulting from the receipt
of medical care in health care settings,
are estimated to account for $28 to
$45 billion in direct health care costs
in the United States annually.24 When
health care facilities employ evidence-
based prevention strategies, HAIs
can be prevented and controlled. For
example, Clostridium difficile, a type of
bacteria that causes gastrointestinal
illness, accounts for 12% of HAIs in
hospitals.25 Strategies to prevent spread
include complying with hand hygiene
guidelines, ensuring adequate cleaning
and disinfection of the environment, and
prescribing antibiotics appropriately.
Strategies
© Create a culture of safety in health
care facilities that encourages
effective communication between
health-care providers, patients,
and family members
© Perform hand hygiene frequently
© Use antibiotics wisely to prevent
bacteria from developing resistance to
the drugs that are used to treat them
© Implement standard precautions in the
care of all patients in all health care
settings all of the time
© Use evidence-based methods to clean
medical equipment and the health care
environment
© Collect, analyze, and use data to
engage healthcare providers in quality
improvement activities
© Increase knowledge and practice
of key prevention strategies for
the various HAIs across and within
healthcare settings
© Use health information systems to
reinforce clinical practices that improve
patient safety
AIM 4: SYSTEM OF HEALTH CARE
2020 FOCUS GOALS
Key Community Partners
Academic Partners
Businesses
Health-Care Providers
Hospital Systems
Insurers
Public Health

41
Measure of Success
HCP HCP MH Hospitalizations C diff2014 69.3% 2013 884 2013 36%2020 GOAL 85.0% 2020 GOAL 825 2020 GOAL 100%
Avoidable Hospital Stays2013 1,294 Elec HR2020 GOAL 1,100 2015 70.6%
2020 GOAL 90.0%
HIEAvoidable Heart Disease Deaths 2015 3,800 2013 46.8 2020 GOAL 7,600 2020 GOAL 40.0
69.3%85.0%
20.0%
40.0%
60.0%
80.0%
100.0%
2014 2020 GOAL
Adults with a Regular Healthcare Providers
1,2941,100
700
900
1,100
1,300
1,500
2013 2020 GOAL
Avoi
dabl
e Ho
spita
lizat
ions
Pe
r 100
,000
Per
sons
Avoidable Hospital Stays
46.840.0
30
35
40
45
50
2013 2020 GOAL
Avoi
dabl
e De
aths
from
Hea
rt D
z,
Stro
ke a
nd H
yper
tens
ive
Dz
Per 1
00,0
00 P
erso
ns
Avoidable Heart Disease Deaths
884 825
600
700
800
900
1,000
2013 2020 GOAL
Men
tal H
ealth
and
Sub
stan
ce
Use
Diso
rder
Hos
pita
lizat
ions
Pe
r 100
,000
Per
sons
Mental Health and Substance Abuse Hospitalizations
70.6%90.0%
20.0%
40.0%
60.0%
80.0%
100.0%
2014 2020 GOAL
Providers with Electronic Health Records
3,800
7,600
2,000
4,000
6,000
8,000
10,000
2015 2020 GOAL
Entities Connected to Health Information Exchange
38.5%
100%
0%
20%
40%
60%
80%
100%
2013 2020 GOAL
Hospitals Meeting State Goal for Prevention of C. difficile Infections
41

42
REFERENCES
1. Organization, World Health (2002). Health, Economic Growth and Poverty Reduction: Prevalence Trends. Geneva: World Health Organization.
2. Council, National Research (2004). Children’s Health, the Nation’s Wealth: Assessing and Improving Child Health. Washington DC: National Academies Press.
3. Case, A. F. (2005). The Lasting Impact of Childhood Health and Circumstance. Journal of Health Econom-ics , 365-389.
4. Bhutta, A. C. (2002). Cognitive and Behavioral Outcomes of School-Aged Children Who Were Born Pre-term: a Meta-Analysis. Journal of the American Medical Association, 728-737.
5. Health & Academics. (2015, September 1). Retrieved October 1, 2015, from Adolescent and School Health: http://www.cdc.gov/HealthyYouth/health_and_ac-ademics/
6. Early Childhood Mental Health. (n.d.). Retrieved Oc-tober 16, 2015, from Center on the Developing Child: http://developingchild.harvard.edu/science/deep-dives/mental-health/
7. Div. of Reproductive Health, N. C. (1999, December 3). Achievements in Public Health, 1900-1999: Family Planning. Morbidity and Mortality Weekly Report, pp. 1073-1080.
8. Information for Health Professionals Recommen-dations. (2014, September 2). Retrieved October 3, 2015, from Preconception Health and Health Care: http://www.cdc.gov/preconception/hcp/recom-mendations.html
9. Education, Curry School. (2014). The Virginia Kin-dergarten Readiness Project Executive Summary & Legislative Report Fall 2014. Charlottesville: Universi-ty of Virginia.
10. Preventive Health Care. (2013, June 12). Retrieved November 5, 2015, from Gateway to Health Commu-nication & Social Marketing Practice: http://www.cdc.gov/healthcommunication/toolstemplates/en-tertainmented/tips/preventivehealth.html
11. America’s Health Rankings. (2015). Retrieved Novem-ber 10, 2015, from United Health Foundation: http://www.americashealthrankings.org/
12. United States Department of Agriculture. (2010). Di-etary Guidelines Advisory Committee on the Dietary Guidelines for Americans, 2010. Washington DC: United States Department of Agriculture.
13. Hoyland, A. D. (2009). A Systematic Review of the Effect of Breakfast on the Cognitive Performance of Children and Adolescents. Nutrition Research Reviews , 220-243.
14. Gunderson, C. Z. (2015). Food Insecurity and Health Outcomes. Health Affairs, 1830-1839.
15. MacLellan, D. D. (2098). Food Intake and Academic Performance Among Adolescents. Canadian Journal of Dietetic Practice and Research, 141-144.
16. Fellows, J. T. (2002). Annual Smoking-Attributable Mortality, Years of Potential Life Lost, and Economic Costs-United States, 1995-1999. Morbidity and Mor-tality Weekly Report, 300-303.
17. Kids, Foundation for Tobacco Free (2015, September 25). The Toll of Tobacco in Virginia. Retrieved Novem-ber 19, 2015, from Tobacco Free Kids: http://www.tobaccofreekids.org/facts_issues/toll_us/virginia
18. Prevention, Centers for Disease Control and (2015, October 1). Health Effects of Cigarette Smoking. Re-trieved November 19, 2015, from Smoking & Tobacco Use : http://www.cdc.gov/tobacco/data_statistics/fact_sheets/health_effects/effects_cig_smoking/
19. Prevention, Centers for Disease Control and (2014, November 24). Health Effects of Secondhand Smoke. Retrieved November 15, 2015, from Smoking & Tobac-co Use : http://www.cdc.gov/tobacco/data_sta-tistics/fact_sheets/secondhand_smoke/health_ef-fects/
20. Foundation, K. F. (2012, May 1). How Much Does the U.S. Spend on Health and How Has It Changed? Re-trieved November 15, 2015, from Health Care Costs: A Primer: http://kff.org/report-section/health-care-costs-a-primer-2012-report/
21. Elhauge, E. (2010). The Fragmentation of US Health Care. Cambridge: Oxford University Press.
22. Fund, The Commonwealth (2009). The Path to a High Performance U.S. Health System. Common-wealth Fund Commission on a High Performance Health System.
23. Administration, Substance Abuse and Mental Health Services (2015, July 2). Wellness Strategies. Retrieved November 19, 2015, from Wellness: http://www.sam-hsa.gov/wellness/strategies
24. Scott, R. (2009). The Direct Medical Costs of Health-care-Associated Infections in US Hospitals and the Benefits of Prevention. Atlanta: Centers for Disease Control and Prevention.
25. Lessa, F. (2015). Burden of Clostridium difficile in-fection in the United States. New England Journal of Medicine, 825-834.

43
44
Virginia Department of Health
109 Governor Street
Richmond, VA 23219
804-864-7002
www.vdh.virginia.gov