Embed Size (px)
Citation preview

Virtual Investor Day
November 10, 2020

Hanon Systems – Confidential
Nurdal KücükkayaPresident and
Representative Executive Officer

2019 Global Thermal Management
Market Share
28%
13%12%
11%
4%4%
28%
12.1%10.7%9.6% 12.0% 11.8%
Revenue EBITDA EBITDA % of revenue
533 609 670 701864
2016A2015A 2017A 2018A 2019A
5,938
5,5585,704 5,586
Global Leader in Automotive Thermal Market
3
7,154
Strong Market Presence Diversified Customer Base Proven Financial Track Record
Others
BC
D
E
(KRW in billions)
Company
A
Hanon Systems Customer Base
Emerging
EV Makers
Traditional
Volume Leaders
Technology
Leaders
Source: IHS Markit, Hanon Systems

4
Emerging Automotive Thermal Market Trends
EV driving range and cost competitiveness
Global propagation of battery electric vehicles
Introduction of alternative refrigerants (R744, R290)
Enhanced performance and lower global warming potential
Growing attentions on fuel cell electric vehicles
Accelerated by government support on infrastructure
Increasing passenger interests in cabin air quality
Disinfection beyond heating, ventilation and air conditioning

R7
44
Te
ch
no
log
yHistory of Hanon Systems EV Thermal Business
5
Pioneer in EV Thermal Management Solutions with ~20 Years of Engineering and Manufacturing
e-C
om
pre
ss
or
He
at
Pu
mp
Sys
tem
Leak Free A/C Line Fitting
Technology Patent (‘02)
First R744 e-Comp Design and
Vehicle Testing with
European OEMs (’05-’07)
Mass Production of
R744 Heat Pump Components
for a German OEM (’20)
PACE Award Winning
Metal Seal Fitting for
Leak Free A/C System (‘13)
Heat Pump Pre-Development
Projects with German OEMs (’09-’11)
First Heat Pump System
with PE Chiller +
Battery Cooling (‘18)
First UHV Large e-Comp Based
Heat Pump System (‘21)First Heat Pump System
with PE Chiller (‘14)
R134a e-Comp[1]
Design (’07)
Gen 1 e-Comp Production
for Early Stage xEVs
of Multiple OEMs (‘10)
Mass Production of
Gen 3 e-Comp with
New Scroll Design (’13)
Mass Production of
Gen 4 e-Comp with
New Inverter/Motor (’19)
Mass Production of
First Ultra-High Voltage (UHV)
and Large e-Comp (’21)
Heat Pump System
Design Development (’02)
Note:
[1] e-Comp or e-Compressor refers to electric compressors
Early 2000s Late 2000s Early 2010s Late 2010s and 2020s
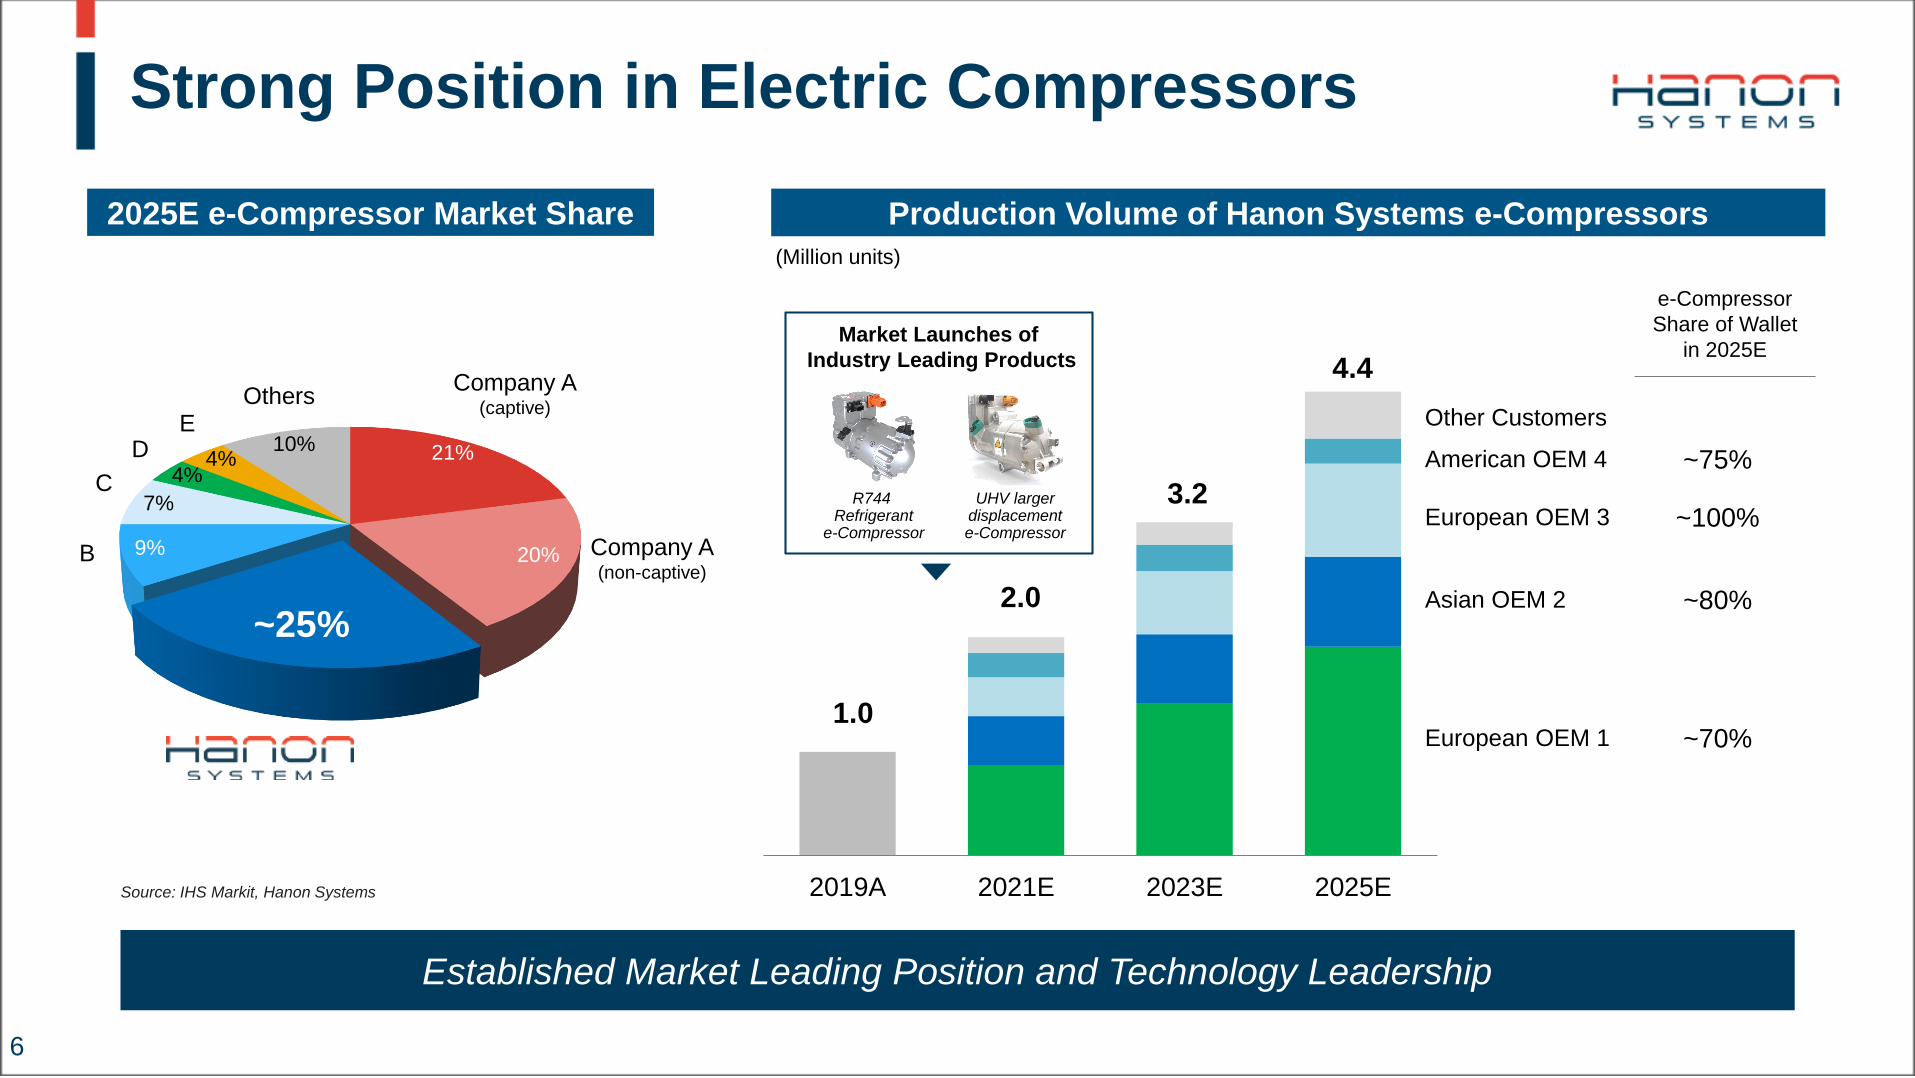
Strong Position in Electric Compressors
6
Established Market Leading Position and Technology Leadership
2019A 2021E 2023E 2025E
1.0
2.0
3.2
4.4
European OEM 1
Asian OEM 2
European OEM 3
American OEM 4
Other Customers
e-Compressor
Share of Wallet
in 2025E
~70%
~80%
~100%
~75%
2025E e-Compressor Market Share Production Volume of Hanon Systems e-Compressors
Company A(captive)
Company A(non-captive)
B
C
DE
Others
~25%
21%
20%9%
7%
4%
10%4%
(Million units)
Market Launches of
Industry Leading Products
R744 Refrigerant
e-Compressor
UHV largerdisplacemente-Compressor
Source: IHS Markit, Hanon Systems

EV Models with Products from Hanon Systems
7
Volkswagen – ID.3 Volkswagen – ID.4 Audi – Q4 e-tron
Skoda – Enyaq Porsche – Taycan Mercedes – EQC
Note:
Selected example(s) only
(1/2)
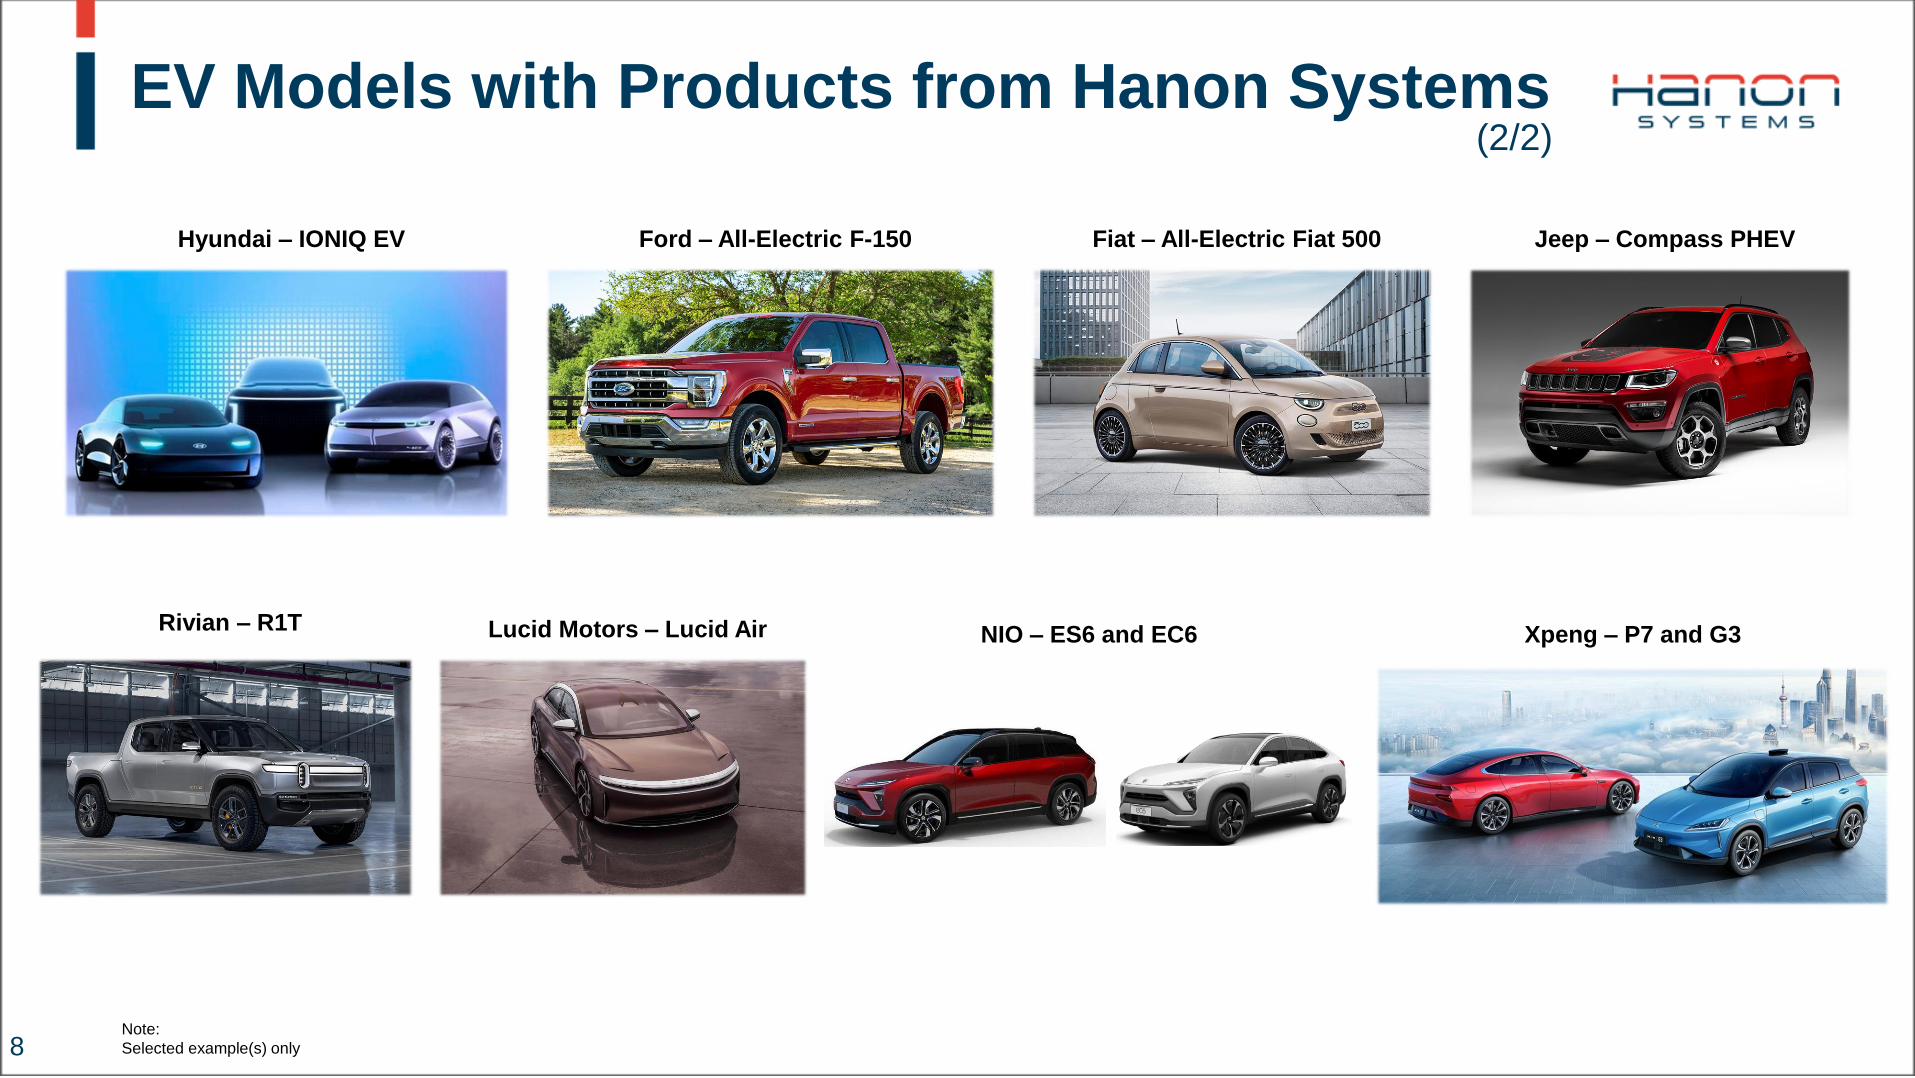
Lucid Motors – Lucid AirRivian – R1T
Hyundai – IONIQ EV Ford – All-Electric F-150
EV Models with Products from Hanon Systems
8
Xpeng – P7 and G3NIO – ES6 and EC6
Note:
Selected example(s) only
Fiat – All-Electric Fiat 500 Jeep – Compass PHEV
(2/2)
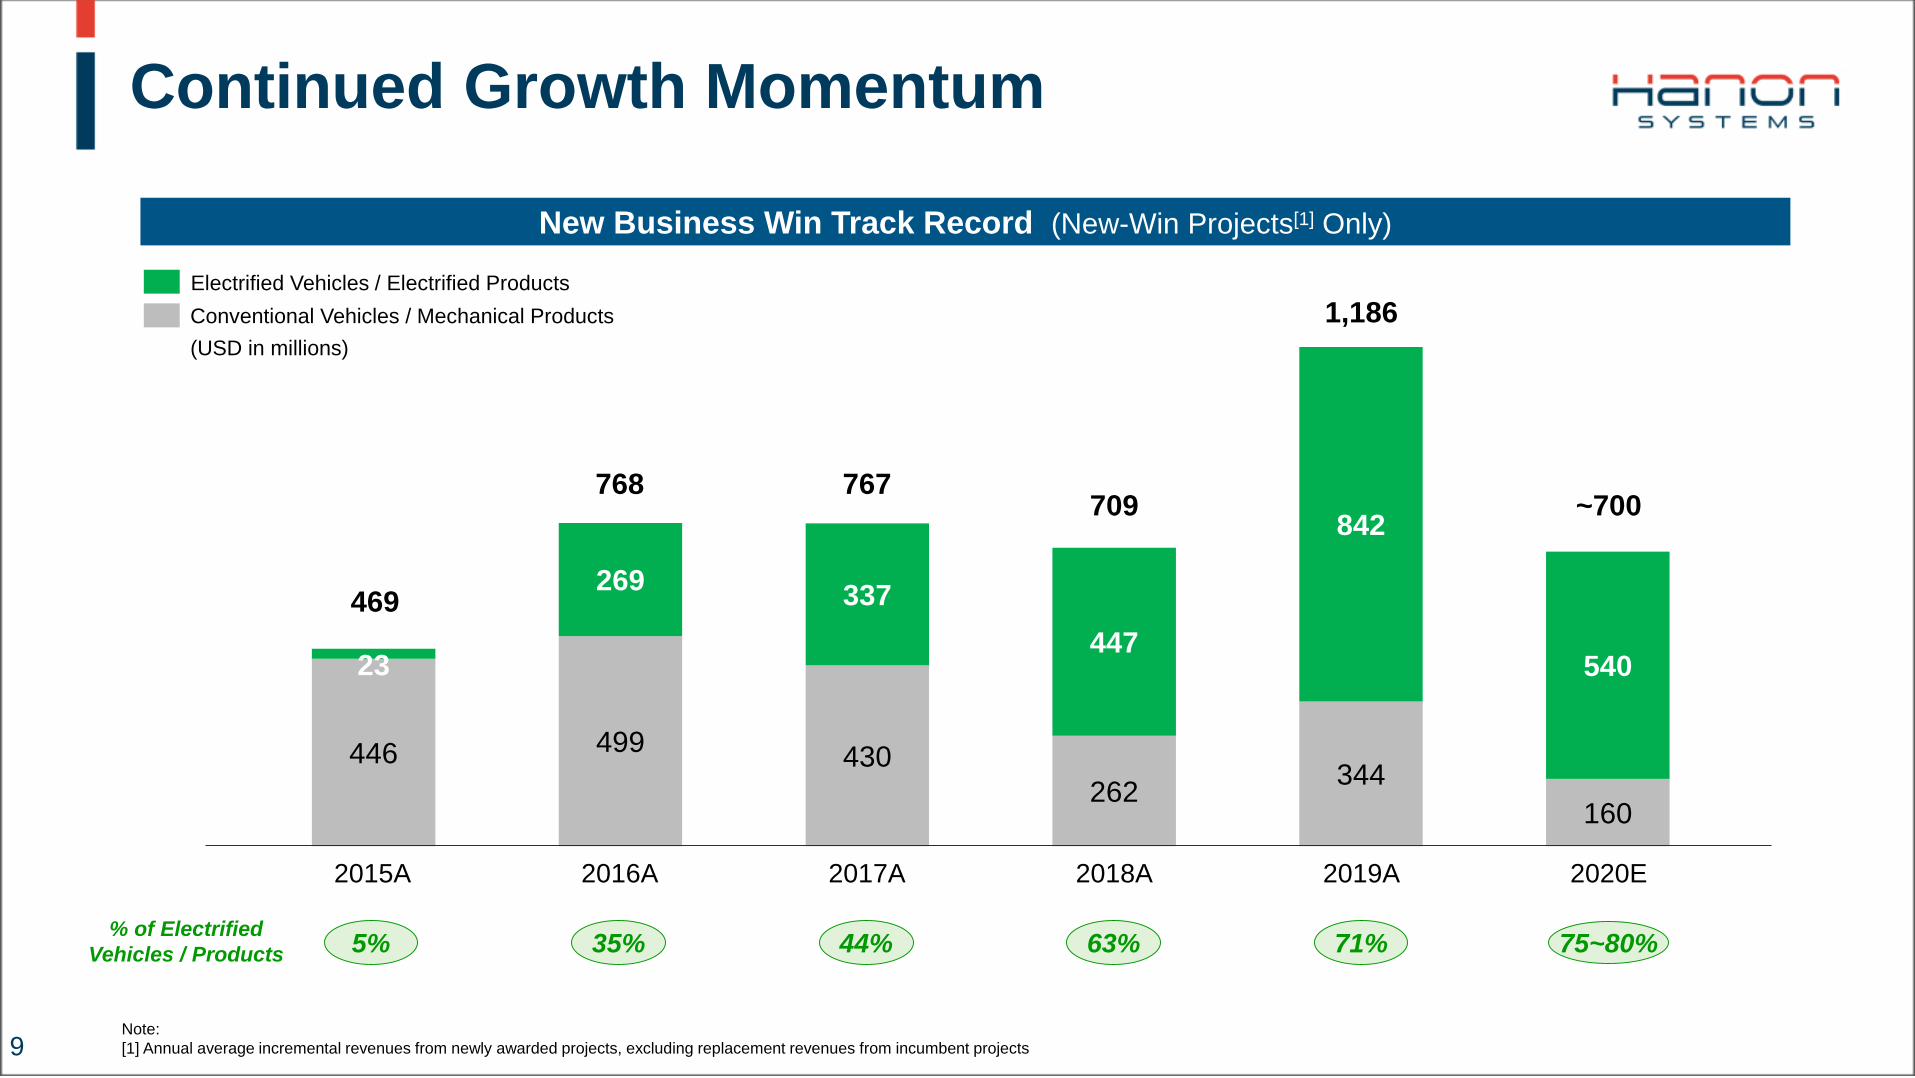
Continued Growth Momentum
9
446 499 430
262 344
160
23
269 337
447
842
540
2015A
Conventional Vehicles / Mechanical Products
Electrified Vehicles / Electrified Products
New Business Win Track Record (New-Win Projects[1] Only)
2016A 2017A 2018A 2019A 2020E
Note:
[1] Annual average incremental revenues from newly awarded projects, excluding replacement revenues from incumbent projects
469
768 767709 ~700
1,186(USD in millions)
5% 35% 44% 63% 71% 75~80%% of Electrified
Vehicles / Products

Accelerating Growth in Electric Vehicles
10
12.1%
40%
2019A 2023E 2025E
30%
15%
~14%~14%
7.2
0.86
~9
~1.2
~10
~1.4
Revenue from Electrified Vehicles / Products
EBITDA (KRW in trillions)
EBITDA Margin
Revenue from Non-Electrified
Long-Term Financial Projection
Outperforming Market in Business Growth and Transformation to Electrified Vehicles

Steven ClarkeVice President and
Chief Technology Officer

Global Engineering Network
12
Novi, U.S.
Thailand
Hungary
Portugal
Czech
Daejeon,Korea
China
Kerpen,Germany
France
Japan
India
Canada
Mexico
Europe Innovation Center Asia Pacific Innovation Center Americas Innovation Center
Italy Bulgaria
Bad Homburg(Germany)
Changzhou(China)
Concord (Canada)Asan(Korea)
Six New Engineering Sites Added in 2019; Accelerated xEV Thermal Technology Development
UK

Engineering Focus on EV Projects
13
R&D Spending R&D Resource Allocation
60%55%
44%
40%45%
56%
2017A 2018A 2019A
xEV
Projects
2017A 2018A 2019A
ICE
Projects
Continued R&D Investment in 2020 Downturn; >60% Resources Allocated to xEV Projects
259
297
361
4.6% 5.0% 5.0%% of
Revenue
Annual
Spending

Hanon Systems Product Portfolio
14
Mech
an
ical
Hybrid Electric Battery ElectricInternal Combustion Engine
Slim & Compact HVAC
Fluid Transport
Mechanical
Compressors
DC Cooling Fan
m-Water Pump
m-Transmission
Oil Pump
Exhaust Gas Recirculation
Cooler
Ele
ctr
ifie
d
20/27/33/45cc
e-Compressor
Water-cooled
Heat ExchangersBattery Chiller
Battery Cooler
Inverter Cooler
e-Refrigerant Valve
e-Coolant Valve
Integrated
Mgmt. SystemVertical Air HVAC
+Air PTC Heater Coolant Heater
Hybrid & Battery Electric Vehicle Products
Waste Heat
Recovery
High Performance Heat Exchangers
- Heater Core, Evaporator, Condenser,
Radiator
Intelligent Air Quality System
- VR LED Photocatalyst
Co
mm
on
Brushless DC Cooling Fan
e-Water Pump
e-Transmission Oil Pump
New xEV Electronics and Fluid Pressure Products
Full Portfolio of Thermal and Energy Management Solutions for Electrified Vehicles
Air
Compressor

15
Comprehensive Heat Pump System Solutions
First Generation iTEMSTM R744 (CO2) Vapor Injection R290 (Propane)
Additional
performance boost
to heat pump systems
Increase cooling
and heating capacity
at same size
Secondary loop
heat pump system
for safety
Compact refrigerant
and coolant
modules system
Climate-neutral
refrigerant
(GWP[2]: 1)
Superior driving
range especially in
heating mode
Waste heat
recovery from
motor, inverter
and battery
Mass production
for Hyundai/Kia
electric vehicles
Module system
(refrigerant, coolant)
Simple 1-way circuit
heat pump system
for fewer components
Note:
[1] Intelligent Thermal Energy Management System; [2] Global Warming Potential
[1]

16
Heat Pump System Technology
Source: Korea Ministry of Environment (Korea fuel economy test cycle base[1])
Heat Pump System is Essential to Improve Driving Range of Electric Vehicles
Vehicle Range Performance Comparisonin heating model at -7℃
91%88%85%
76%68% 68%66%
61%
TeslaModel 3
ChevroletBolt
NissanLeaf
JaguarI-PACE
Renault-Samsung
ZOE
TeslaModel S
BenzEQC 400
KiaNiro EV
Note:
[1] Combination of FTP-75 (Federal Test Procedure) and HWFET (Highway Fuel Economy Test)
(%: Driving range at -7℃ / driving range at 25℃ x 100%)
Driving Range Increasein heating model at -7℃
100%
Base A/CSystem +Air-based
Electric Heater
R1234yfHeat Pump
System
+ VaporInjectionFeature
R744Heat Pump
System
~135%~140%
~150%
Source: Hanon Systems Europe Innovation Center test
(%: Relative driving range to base A/S system performance)

R744 (CO2) Heat Pump System
17
Climate-neutral refrigerant (GWP: 1)
All key R744 components in mass production
50%↑
-30
CO2 e-Compressor Accumulator with
Internal Heat Exchanger
Electronic
Expansion Valve
Connecting Technology
(Metal Seal)
Offers efficient and full operation to -30°C
Enhances EV driving range especially in winter
Improves noise and vibration performance
New Technology Description
Key Benefits
Source: Hanon Systems Europe Innovation Center test

Full Suite of Electric Compressors
18
Larger displacement
e-Compressor
30+cc
e-Compressor
Key Benefits
Developed on a common global architecture
Larger displacement compressor with new inverter
for ultra-high voltage
New Technology Description
Reduces weight/cost with high efficiency
Lowers noise, vibration and harshness (NVH)
Applies to various voltage levels (48V, 400V, 800V)
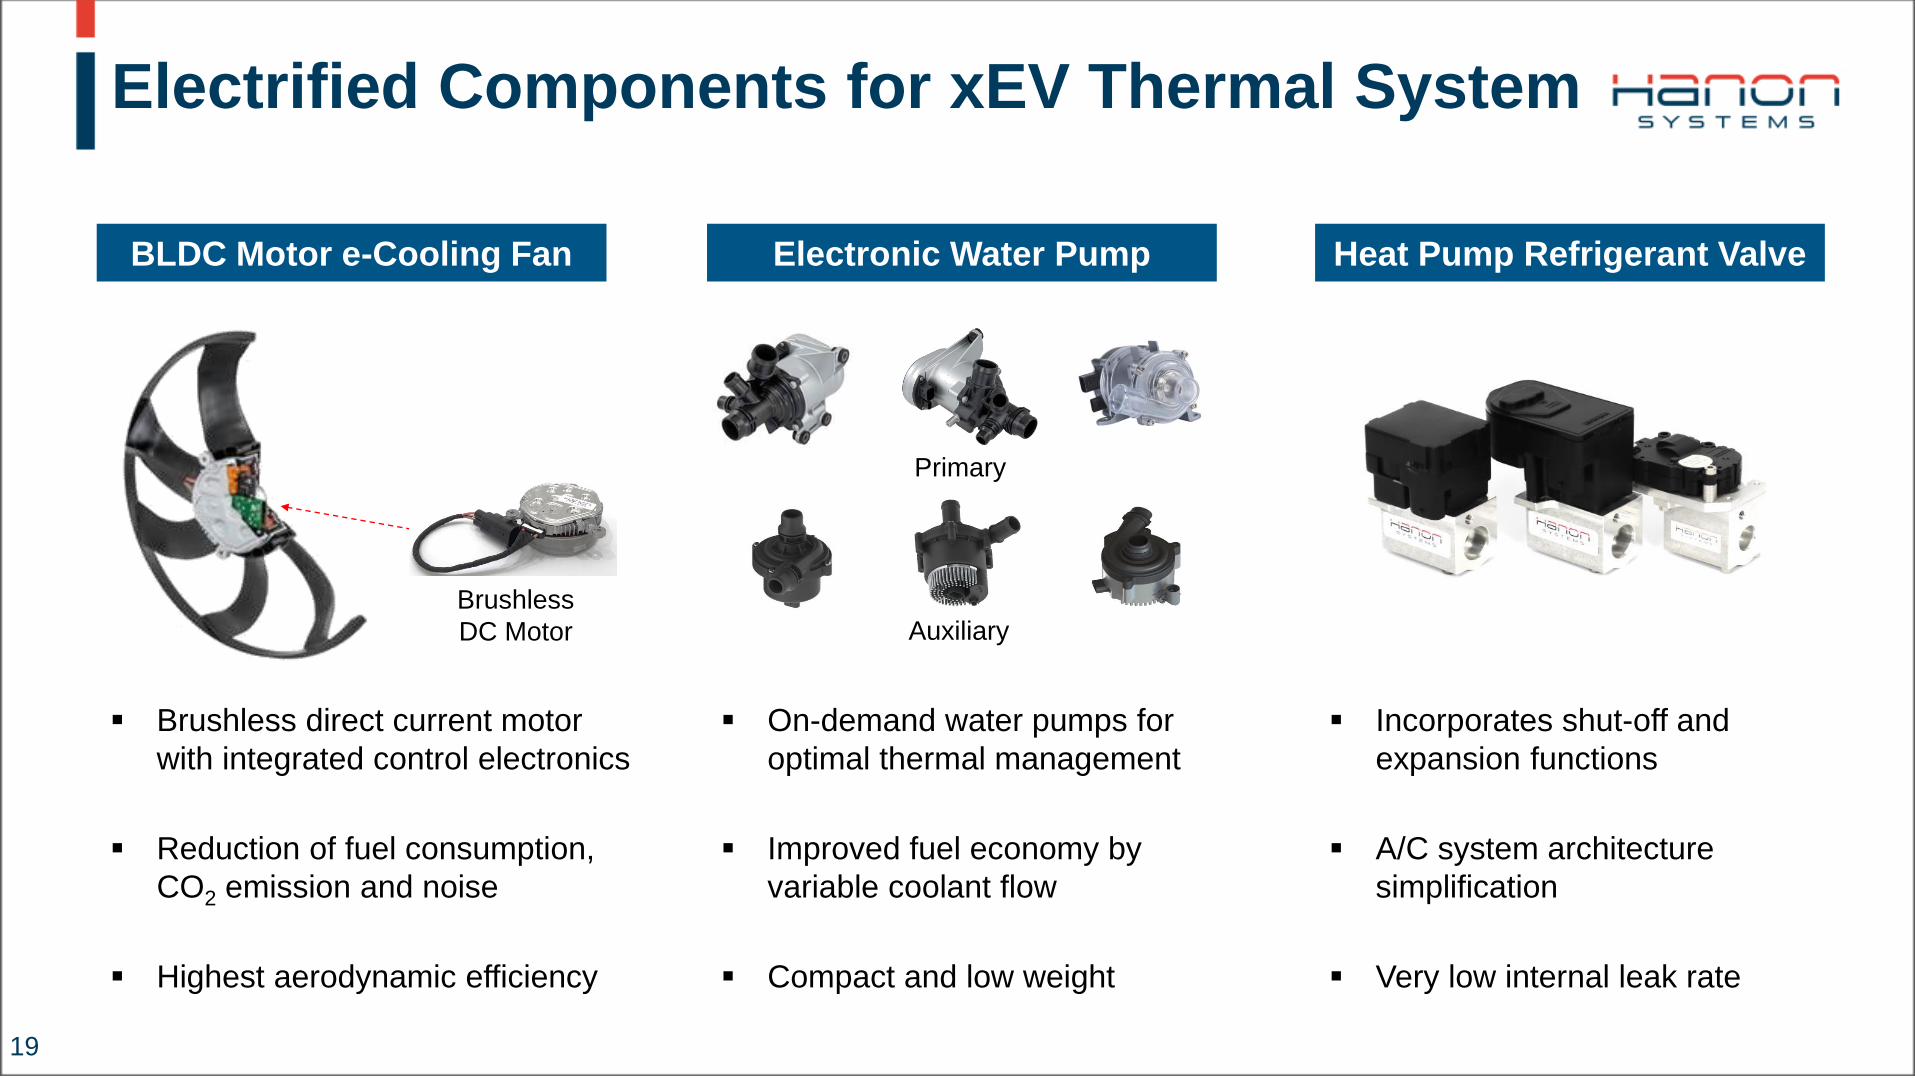
Electrified Components for xEV Thermal System
19
BLDC Motor e-Cooling Fan Electronic Water Pump Heat Pump Refrigerant Valve
Brushless direct current motor
with integrated control electronics
Reduction of fuel consumption,
CO2 emission and noise
Highest aerodynamic efficiency
Brushless
DC Motor
On-demand water pumps for
optimal thermal management
Improved fuel economy by
variable coolant flow
Compact and low weight
Incorporates shut-off and
expansion functions
A/C system architecture
simplification
Very low internal leak rate
Primary
Auxiliary

Intelligent Air Quality System
20
Visual Ray (VR) LED
Photocatalyst
PM2.5 Sensor
Semi HEPA Filter
VR LED photocatalyst for air quality improvement
Fine dust: semi HEPA Filter & PM2.5 sensor controlling
New Technology Description
Disinfects, deodorizes and reduces fine particles
VR LED: Disinfection (%) Deodorization (ppm)
Key Benefits
Source: Hanon Systems Asia Pacific Innovation Center test

Air Compressor for Fuel Cell Electric Vehicles
21
Key Benefits
Gen 2.5 controller integrated air comp with air foil bearing
New Technology Description
Increases air compressor power: 10 15kW
Enables compact and cost competitive product design
Power (kW) Weight (kg)
Gen 2 Air Compressor
without Controller
Source: Hanon Systems Asia Pacific Innovation Center test

22
Technologies Leading Thermal Market Trends
Electrical Expansion /
Shutoff Valvefor EV heat pump systems
Metal Seal Fittingfor leak tight high-pressure
refrigerant systems
(help OEMs earn CO2 credit)
Centrifugal Air Compressorfor fuel cell electric vehicles
2017 FINALIST
2013 WINNER
2015 FINALIST
2012 2013 2015 2017 2020
Simple One-way Circuit
Heat Pump Systemwith improved cost efficiency
Water-Cooled Condenser
with Integrated Receiver Drierfor EV heat pump systems
High Voltage BLDC
Fuel Stack Cooling Fanfor fuel cell electric vehicles
2018
Centrifugal Air Compressor
Gen 2 Technologywith a patented oil-free air foil
bearing design for higher RPM
EV Driving Range & Cost Competitiveness Eco-friendly Alternative Refrigerant Fuel Cell Electric Vehicle Application Cabin Air Quality
Air Conditioner
Deodorizationwith UV photocatalyst
technology
2015 FINALIST
High Efficiency
Heat Pump Systemwith improved driving range
on EV heating mode
Heat Pump System
Utilizing Waste Heatto further improve energy
efficiency and driving range
Min SungExecutive Vice President and
Representative Executive Officer

Global Manufacturing Operation Strategy
24
AmericasCanada
• Belleville, Ontario
• Concord, Ontario
U.S.
• Carey, Ohio
• Shorter, Alabama
Mexico
• Juarez (4 sites)
• Monterrey (2 sites)
• Queretaro
• Salamanca
Brazil
• Atibaia
Korea & Japan Korea
• Asan
• Daejeon
• Pyeongtaek
• Ulsan
Japan
• Hiroshima
• Yamaguchi
South AsiaIndia
• Bangalore
• Bhiwadi
• Chennai
• Gurajat
• Pune
Thailand
• Rayong
EuropeGermany
• Bad Homburg
Czech Republic
• Hluk
• Novy Jicin
Slovakia
• Ilava
Hungary
• Alba
France
• Charleville
Italy
• Benevento
• Campiglione
Portugal
• Palmela
Bulgaria
• Plovdiv
Turkey
• Gebze
China• Beijing
• Changchun
• Changzhou
• Chongqing (3 sites)
• Dalian
• Nanchang
• Nanjing
• Yancheng
• Beijing
• Changchun
• Chengdu
• Foshan
• Wuhu
Note:
Grey-colored manufacturing locations of non-consolidated joint ventures which are not marked on the map
New Site
Establishment
Restructuring
& Rightsizing
EV Product
Expansion
Product Focus
Transformation
EV Product
Expansion
Product Focus
Transformation

Electric Compressors
25
Palmela, Portugal Dalian, China
2021 2025
1.0
2.6
150%growth
2021 2025
0.3
1.1
300%growth
Product innovations and established global footprints widen gap against followers
Recent expansions for Gen 4 e-Compressor production lines in both major EV markets
Production facilities for R744 e-Compressors and larger-displacement e-Compressors
World-class product testing and validation equipment
Manufacturing Hub of Industry Leading Solutions Low-cost Base for Fast Growing EV Market
Note:
Selected example(s) only
Production volume (million units)Production volume (million units)

Electronic Cooling Fan with Brushless DC Motor
26
Campiglione, Italy
Changzhou, China
2021 2025
3.4
5.2
50%growth
2021 2025
0.1
0.4
300%growth
Growth opportunities maximize business synergies in manufacturing footprint
Optimized investment by utilizing exiting production lines from acquisition
Continuous new business awards supported by cost structure improvements
In-house design and manufacturing capabilities on most of the sub-components
Global Center of BLDC Motor Engineering & Manufacturing Low-cost Base for Fast Growing EV Market
Note:
Selected example(s) only
Production volume (million units)Production volume (million units)

Heat Pump Electronic Refrigerant Valve
27
Alba, Hungary
Changchun, China
2021 2025
1.2
2.0
70%growth
Production volume (million units)
2021 2025
1.0
400%growth
0.2
Regional footprint strategy addresses increasing demand from multiple OEMs
End-to-end heat pump system solution with in-house valve capabilities
Eastern European footprint re-arranged to best support growing demand of EV products
Joint venture investment to penetrate local customers and optimize resources
In-house Manufacturing Site for Innovative Solutions Joint Venture Production Site for China Market
Note:
Selected example(s) only
Production volume (million units)

Electric Vehicle Battery Coolers
28
Ilava, Slovakia
Capacity increase serves growing needs of OEMs for EV battery cooling
Product quality and solid cost structure ensured by highly-automated process
Utilization of heat exchanger production expertise
Continuous innovations of manufacturing engineering technologies
Automated Production Site with Less Manual Process
Note:
Selected example(s) only

Product Focus Transformation Cases
29
Monterrey,
Mexico
Charleville,
France
HVAC Module EV Battery Cooler
Transformed a labor-intensive
product plant into a highly-automated
EV product oriented plant
Optimized resources to support
new business for EVs
To double battery cooler production
volume in 3 years
Mechanical Pump Electronic Pump
Consolidated Mexico electronic
water pump production sites
Invested to scale-up facility into
a regional manufacturing hub
Electronic water pump production
expected to increase 200% in 3 years
Note:
Selected example(s) only

Subu NagasubramonyVice President and
Chief Financial Officer

Top-line and Bottom-line Improvements
31
Historical Quarterly Financials – Revenue and Profit Margin Trend
11.6% 11.2% 11.3%14.1%
10.2%
5.8%
13.7%
0.0%
20.0%
0
200
400
600
800
1,000
1,200
1,400
1,600
1,800
2,000
Q1 2019 Q2 2019 Q3 2019 Q4 2019 Q1 2020 Q2 2020 Q3 2020
1,429
1,904 1,8601,961
1,195
1,675
1,901
9%
14% 15%
16%
19%
19%13%
Non-Electrified
Electrified Vehicles / Products
Normalized EBITDA Margin[1]
Normalized
EBIT Margin[1]
Business scaled up and synergy materialized with acquisition of Electronics & Fluid Pressure business
Revenue from electrified business has increased with new business awards entering production
Proactive cost structure improvement actions have improved profitability with volume rebound
Note:
[1] EBITDA and EBIT margin with normalization of one-time impact in Q2 2020 and Q3 2020
6.5% 5.9% 5.8% 8.7% 3.6% -3.7% 7.4%

3Q 2020: Key Financial Metrics
3Q Volume Increased and EBITDA Margin Improved Accordingly with Proactive Cost Actions
3Q20 3Q19 YoY % 2Q20 QoQ %
Revenue 1,901 1,860 1,195
COGS 1,650 1,611 1,121
% of Sales 86.8% 86.6% 93.7%
SG&A (Incl. R&D) 132 141 133
% of Sales 6.9% 7.6% 11.1%
EBITDA 239 210 56
Margin (%) 12.6% 11.3% 4.7%
Operating Profit 120 107 -58
Margin (%) 6.3% 5.8% -4.8%
Net Income 51 76 -60
Margin (%) 2.7% 4.1% -5.1%
(KRW in Billions)
32Note:
EBITDA and Operating Profit has reflected one-time impact in Q2 2020 and Q3 2020
2.2% 59.1%
1.3%p 7.9%p
0.5%p 11.1%p
1.4%p 7.7%p
3Q 2020 Highlights
Profitability Improvement Progress
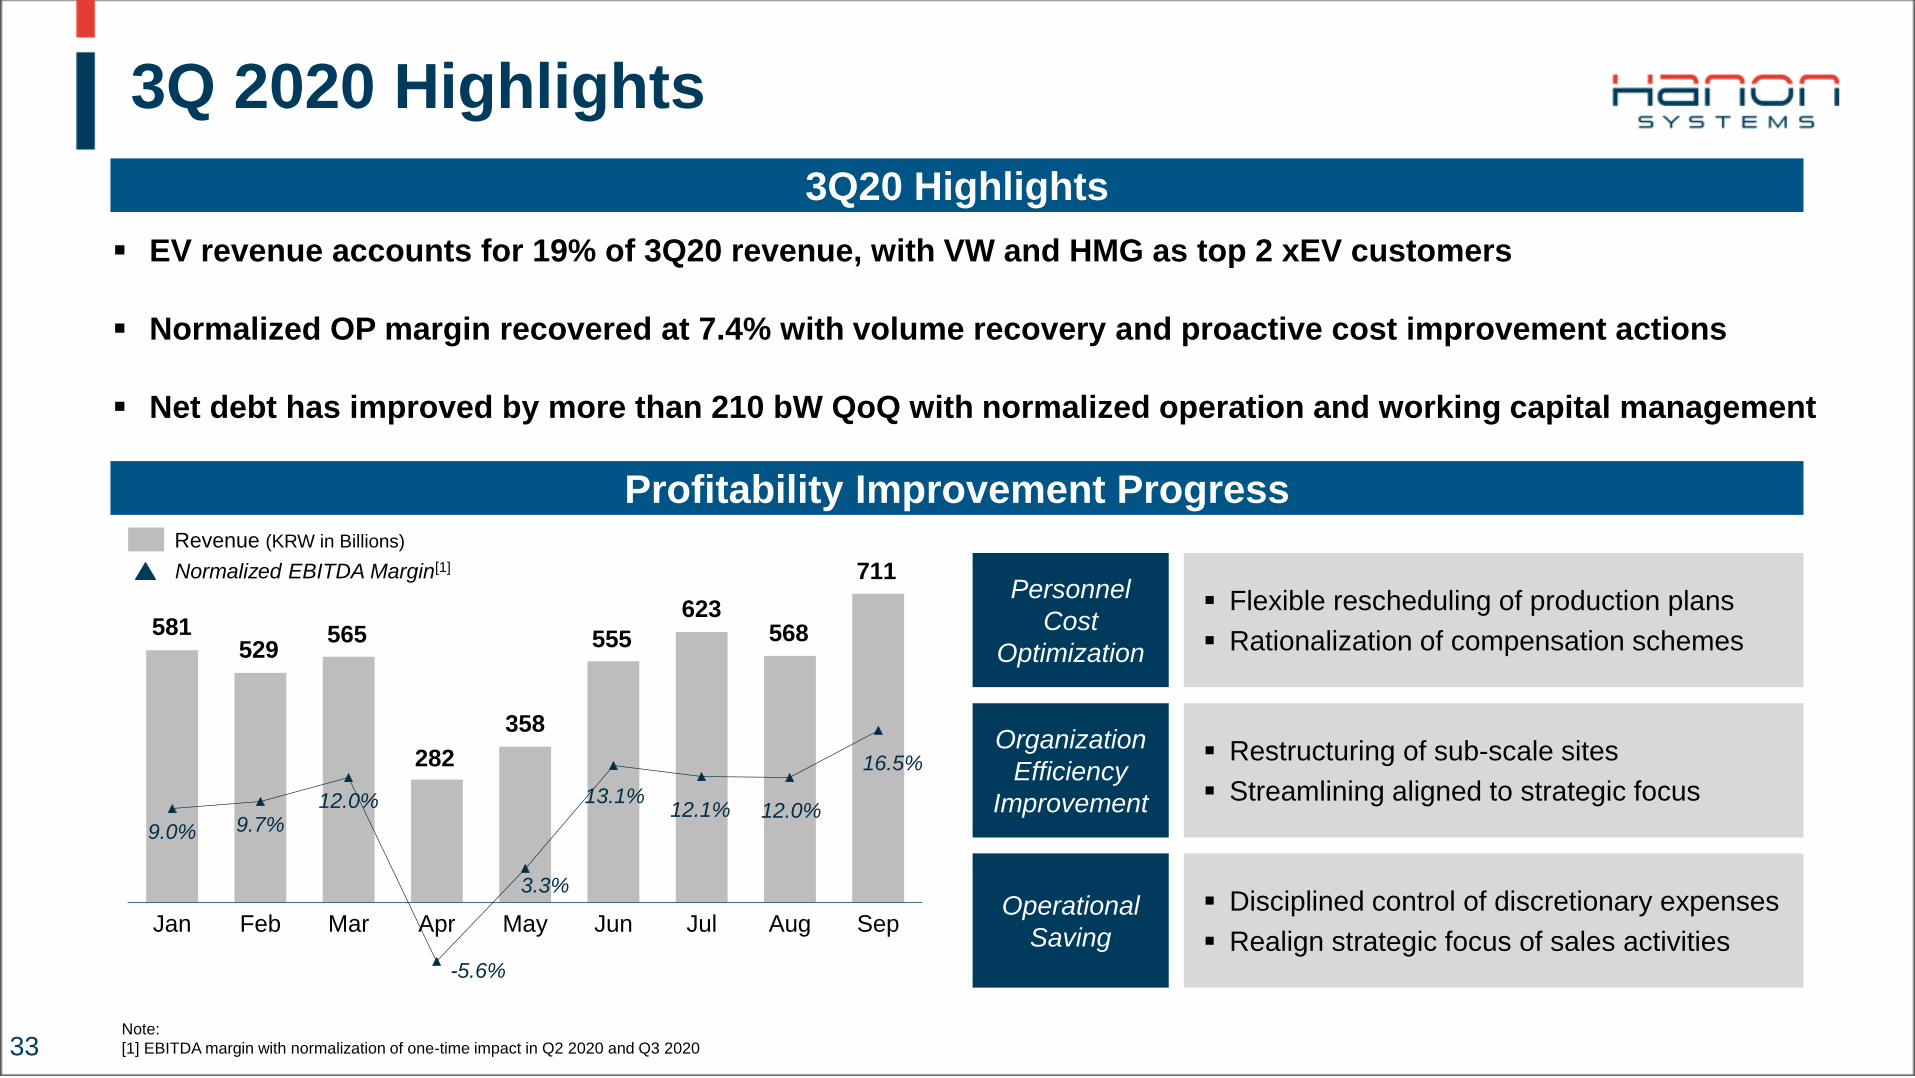
3Q20 Highlights
EV revenue accounts for 19% of 3Q20 revenue, with VW and HMG as top 2 xEV customers
Normalized OP margin recovered at 7.4% with volume recovery and proactive cost improvement actions
Net debt has improved by more than 210 bW QoQ with normalized operation and working capital management
33Note:
[1] EBITDA margin with normalization of one-time impact in Q2 2020 and Q3 2020
Personnel
Cost
Optimization
Organization
Efficiency
Improvement
Operational
Saving
Flexible rescheduling of production plans
Rationalization of compensation schemes
Restructuring of sub-scale sites
Streamlining aligned to strategic focus
Disciplined control of discretionary expenses
Realign strategic focus of sales activities
9.0% 9.7%12.0%
-5.6%
3.3%
13.1%12.1% 12.0%
16.5%
-7.0%
13.0%
(170)
(70)
30
130
230
330
430
530
630
Jan Feb Mar Apr May Jun Jul Aug Sep
Revenue (KRW in Billions)
Normalized EBITDA Margin[1]
581529
565
282
358
555
623568
711
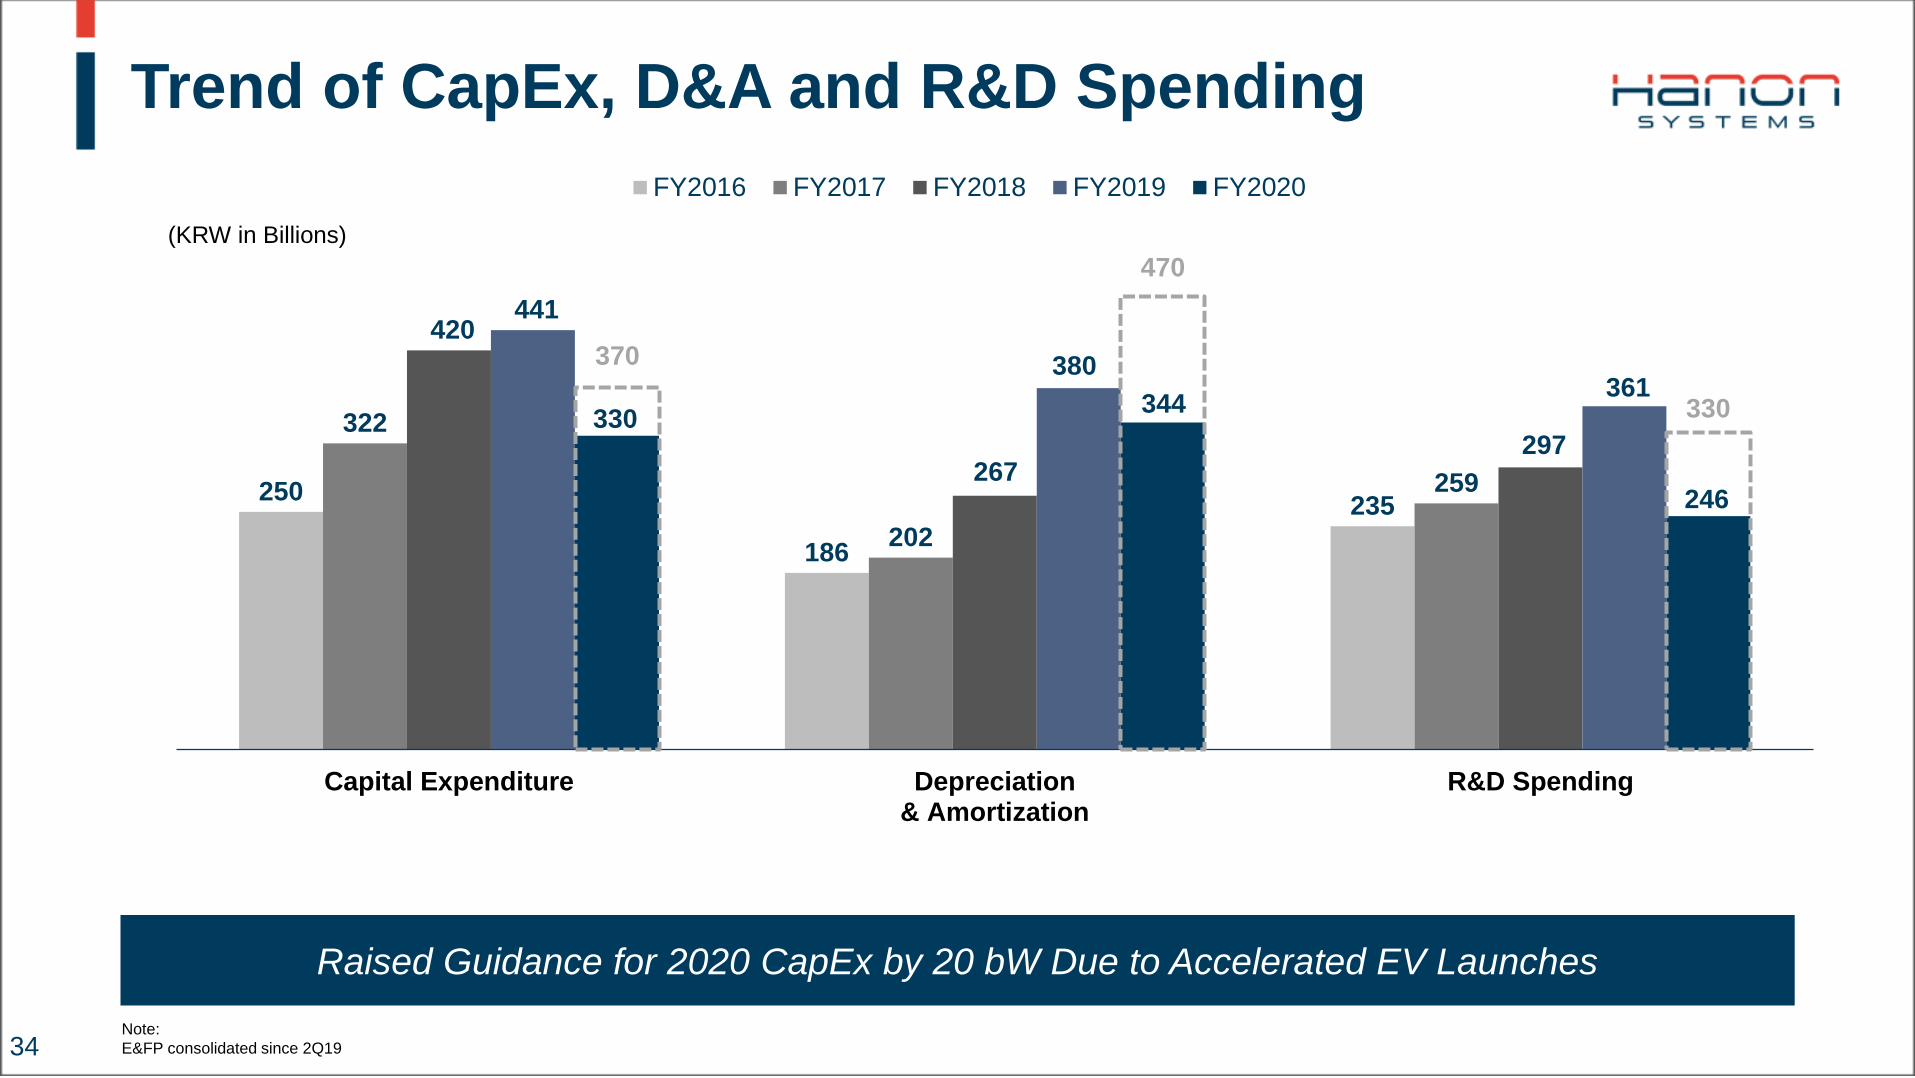
Trend of CapEx, D&A and R&D Spending
34
250
186
235
322
202
259
420
267 297
441
380 361
330 344
246
Capital Expenditure Depreciation& Amortization
R&D Spending
FY2016 FY2017 FY2018 FY2019 FY2020
370
470
330
(KRW in Billions)
Raised Guidance for 2020 CapEx by 20 bW Due to Accelerated EV Launches
Note:
E&FP consolidated since 2Q19

3Q 2020 Balance Sheet
35
(K-IFRS / KRW in Billions, x times)
Balance Sheet Cash and Debt
Sep 2020 Dec 2019 Dec 2018
Cash and cash equivalent 991 687 1,018
Account receivable 1,225 1,254 1,021
Inventories 693 613 506
Property and equipment 2,208 2,130 1,551
Intangible assets 1,685 1,593 564
Lease assets 216 205 181
Other assets 670 601 515
Total assets 7,688 7,082 5,356
Account payable 1,358 1,459 1,215
Debt 3,474 2,734 1,672
Other liabilities 590 552 337
Shareholder’s equity 2,143 2,217 2,037
Non-controlling 122 121 95
Total liabilities
& shareholders’ equity7,688 7,082 5,356
Cash Balance Sep 2020 Dec 2019 Dec 2018
Net Debt 2,484 2,047 654
Net Debt Ratio 1.1 0.9 0.3
Debt to Equity 1.5 1.2 0.8
Leverage 2019 2018
EBITDA 864 701
Debt / EBITDA* 3.0 2.4
Net Debt / EBITDA* 2.2 0.9
EBITDA*/ Net Interest Expenses 14.7 39.7
Annualized EBITDA including Q1 performance of E&FP business
‘Debt’ and ‘Net Debt’ includes Lease Debt since YE2018 due to the
change of KIFRS 1116.
Net Debt Significantly Improved by 210 bW QoQ and Back on Track to Reduce Down to Ordinary Level

Dividend
36
3Q20 Quarterly Dividend: 68 KRW per share
225
305320 320
204
41.1%
56.4% 59.8%
49.8%
FY 2016 FY 2017 FY 2018 FY 2019 3Q YTD 2020
Dividend per Share Payout Ratio
Note:
[1] Based on adjusted net income per share of FY2019
[1]

Backlog Status Update
37
3Q20 Backlog (New Wins Only)
Backlog: Defined as
cumulative revenue for
expected lifecycle of awards
before start of production
Orders from customers other
than HMG and Ford account
for 60% of current backlog
Eco-friendly orders account
for 69% of current backlog
7,591 8,032 8,098
8,966
9,793
10,453
12,707 12,412
11,816 11,791 11,706
61%
69%65% 65% 66% 67%
63% 64% 65%60% 60%
30%
40% 41%45%
55%60%
64%67% 68% 69% 69%
1Q18 2Q18 3Q18 4Q18 1Q19 2Q19 3Q19 4Q19 1Q20 2Q20 3Q20
Backlog Diversified Customers Eco-friendly
(USD in Millions)

Continuing Profitable Growth
38
12.1%
40%
2019A 2023E 2025E
30%
15%
~14%~14%
7.2
0.86
~9
~1.2
~10
~1.4
Long-Term Financial Projection
Economies of scale with EV volume
increase to pass critical mass
Technology and market leadership
in EV thermal business
Cost improvement roadmap in place
and under execution
Revenue from Electrified Vehicles / Products
EBITDA (KRW in Trillions)
EBITDA Margin
Revenue from Non-Electrified