Embed Size (px)
Citation preview

Anu
ario
201
0 y
Est
adís
ticas
de
Ope
raci
ón
CDEC-SING
Center for eConomiC Load dispatCh of northern interConneCted system
Avenida Apoquindo 4501, Office 603-604, Las Condes, Santiago Chile, Phone: 56 (2) 367 2400, Fax: 378 9296Visit us: www.cdec-sing.cl
CE
NTR
O D
E D
ES
PAC
HO
EC
ON
ÓM
ICO
DE
CA
RG
A D
EL
SIS
TEM
A IN
TER
CO
NE
CTA
DO
DE
L N
OR
TE G
RA
ND
E
CDEC-SING
CDEC-SING
Annual Report
OperationStatistics and
Chapter 1. ................................................. 4
Chapter 2. ................................................ 6
Chapter 3. ................................................. 9
Chapter 4. .............................................. 13
Chapter 5. ............................................... 19
Chapter 6. ............................................... 21
Chapter 7. ................................................ 27
Chapter 8. .............................................. 31
Chapter 9. ............................................... 39
Letter from the president of the Board of directors
Letter from the executive director
2010 energy environment
Who are We?
Board of Directors .......................................15
CDEC-SING Departments ............................16
CdeC-sinG: mission, Vision and Values
management operation CdeC-sinG 2010
sinG projects: 2010 finished projects 2011 future projects
Major Projects in 2010 .......................28
2011 Sing Planned Projects . ............29
sinG facilities and Clients
Simplified Sing Line Diagram .............32
SING 2010 Generation Units ...............33
SING 2010 Transmission Lines ...........34
Major SING customers in 2010 ........... 37
2010 operation statistics
I. SING: Generation Installed Capacity ........40
II. SING: Energy Generation ........................41
III. Fuel: Consumption and Prices SING 2001-2010 ................................................ 46
IV. Energy and power prices. ........................49
V. Sing Energy Annual Sales 2001-2010 .. . . . .53
VI. Energy and Power Transfers SING 2001-2010 ...................................................55
VII. Tolls: Payments for use of transmission systems SING ........................................ 57
VIII. Energy and Power Demand SING 2001-2010 ............................................ 59
IX. Non-Conventional Renewable Energy (NCRE) .....................................................63
X. CDEC-SING Budget ....................................64
Contents
Design & Production LEADERS S.A.

Annual Report
OperationStatistics and

CD
EC
-SIN
G
2

AES Gener S.A.Atacama Agua y Tecnología Ltda.Atacama Minerals Chile S.C.M.Cavancha S.A.Codelco ChileCompañía Eléctrica Tarapacá S.A.Compañía Minera Cerro Colorado Ltda.Compañía Minera Doña Inés de Collahuasi SCM.Compañía Minera Teck Quebrada Blanca S.A.Compañía Minera Xstrata Lomas BayasCompañía Minera Zaldívar S.A. E-CL S.A.Edelnor Transmisión S.A.Electroandina S.A.Empresa de Transmisión Eléctrica Transemel S.A.Empresa Eléctrica Angamos S.A.Enaex S.A.Enorchile S.A.Gasatacama Chile S.A.Grace S.A.
Haldeman Mining Company S.A.INACAL S.A.Minera El TesoroMinera Escondida Ltda.Minera EsperanzaMinera Gaby S.A.Minera Meridian Ltda.Minera Michilla S.A.Minera Rayrock Ltda.Minera Spence S.A.Moly-Cop Chile S.A.Norgener S.A.Sociedad Anglo American Norte S.A.Sociedad Contractual Minera El AbraSociedad GNL Mejillones S.A.Sociedad Química y Minera de Chile S.A.Transelec Norte S.A.Xstrata Copper - AltonorteCentral Termoeléctrica Andina S.A.Inversiones Hornitos S.A.
CDEC-SING Affiliated Companies
Ann
ual R
epor
t Sta
tistic
s an
d O
per
atio
n
3

Letter from the President of the Board of Directors
In 2010, SING has conquered the doubts of the operation from years ago because of the natural gas product shortages from Argentina.”
1.C
DE
C-S
ING
4

On behalf of the Board of CDEC-SING and with great pleasure, I have the honor to present the Annual Operating Statistics of
the CDEC-SING for the year 2010. This publication illustrates the operational results and statistics for the period 2001 -2010.
In 2010 SING was able to overcome the uncertainty of previous years because of the product shortage of natural gas from
Argentina. This was accomplished thanks to the continued supply of liquid natural gas and the opening of Mejillones regasification
Plant in April of 2010. This has allowed significant displacement of Diesel fuel consumption that was being used in the previous
production facility. On the other hand, the operation was marked by normal supply conditions and adequate margin reserves.
Regarding the organization in November 2010, the CDEC-SING, elected its new Board, which will remain until November 9,
2012. On the occasion of this new election, all the companies belonging to the Northern Interconnected del System reaffirmed
our commitment to human and technical capital of the CDEC and expressed our strong support for the work plan that aims to:
(a) comply with the functions of the Act, the regulations in force and the Rules established by the CDEC, and (b) the safe and
efficient operation of the SING.
The objective for the year 2011 is to materialize the production projects that together bring more than 800 MW of installation
capacity in the SING, as well as works and transmission infrastructure. All of which helps to ensure a safe and reliable supply of
demand in the coming years. With this, the SING is ready to face the challenge of meeting demand with sales increasing from
the 8,900 GWh in 2001 to 13,790 GWh in 2010.
We hope that this 2010 publication represents a contribution in the field of information for all those involved in the SING and for
those who observe and analyze their development, and for all investors interested in learning more deeply the electrical market
in the northern part of the country.
Enzo Quezada Zapata
CDEC-SING Board of Directors President
Ann
ual R
epor
t Sta
tistic
s an
d O
per
atio
n
5

Letter from the Executive Director
“2011 is projected as the year of physical adaptation or regular supply. Also new challenges emerged concerning safety and to seek higher efficiently levels in the operation”
2.C
DE
C-S
ING
6

I have the pleasure to introduce the Annual Publication of the Centre for Economic Load Dispatch Interconnected System
Norte Grande, CDEC-SING. This publication includes statistics, indicators and most relevant elements of the operation of
the SING (Spanish Acronym for Center for Economic Load Dispatch of Northern Interconnected System) for the period
2001-2010.
In 2010, SING will be remembered as the last year the system experienced supply crisis. This restriction of natural gas
supply began in 2004 and was enforced by Argentina. This achievement was possible thanks to the opening of the Mejillones
regasification plant and the availability of liquid natural gas or LNG.
The influx of Liquid Natural Gas(LNG) was allowed to have 450 MW base of uninterrupted input which reduced the intensive
use of diesel generation. In addition, the set up of the test units based on coal that is under construction, has allowed a
projection to substantially improve the supply in 2011.
As a symbol of our ongoing commitment to the industry and the population we have supplied since 2010, CDEC-SING has
an alternative backup site to the main site Dispatch and Control Center, which adds to the simulation of Service Recovery
Plan, which has improved the capabilities and resources for emergencies.
In the organizational area, CDEC-SING has been qualified as a strategic enterprise. This denomination is an important
recognition of the crucial task of the organization for the normal functioning of the economy, and security industry and
large population north of the country. The strategic plan of the organization has been launched and is differentiated by the
vision, mission and values that guide the CDEC-SING business.
Also in 2010, more resources were added to address transmission planning. In this context, a tracking process of recovery
and transmission expansion led by the National Energy was performed. A proposal expansion for the transmission system
was also presented.
For all the above mentioned at the operational level, 2011 is projected as the year of the physical adaptation or supply
normalization with new challenges related to the search for greater security and levels of efficiency in the operation. In the
organizational area, 2011 will have a strong emphasis on improving and strengthening our capabilities through the review
and certification of skills and critical processes.
Along with making available to you the Annual CDEC-SING, I express my public appreciation for the cooperation and
commitment of the companies represented in the CDEC-SING, as well as for the dedication and professionalism of the
members of our team, which I’m sure will successfully address the challenges ahead.
Daniel Salazar Jaque
Executive Director / Director of Operations and Tolls
CDEC-SING
Ann
ual R
epor
t Sta
tistic
s an
d O
per
atio
n
7

CD
EC
-SIN
G
8
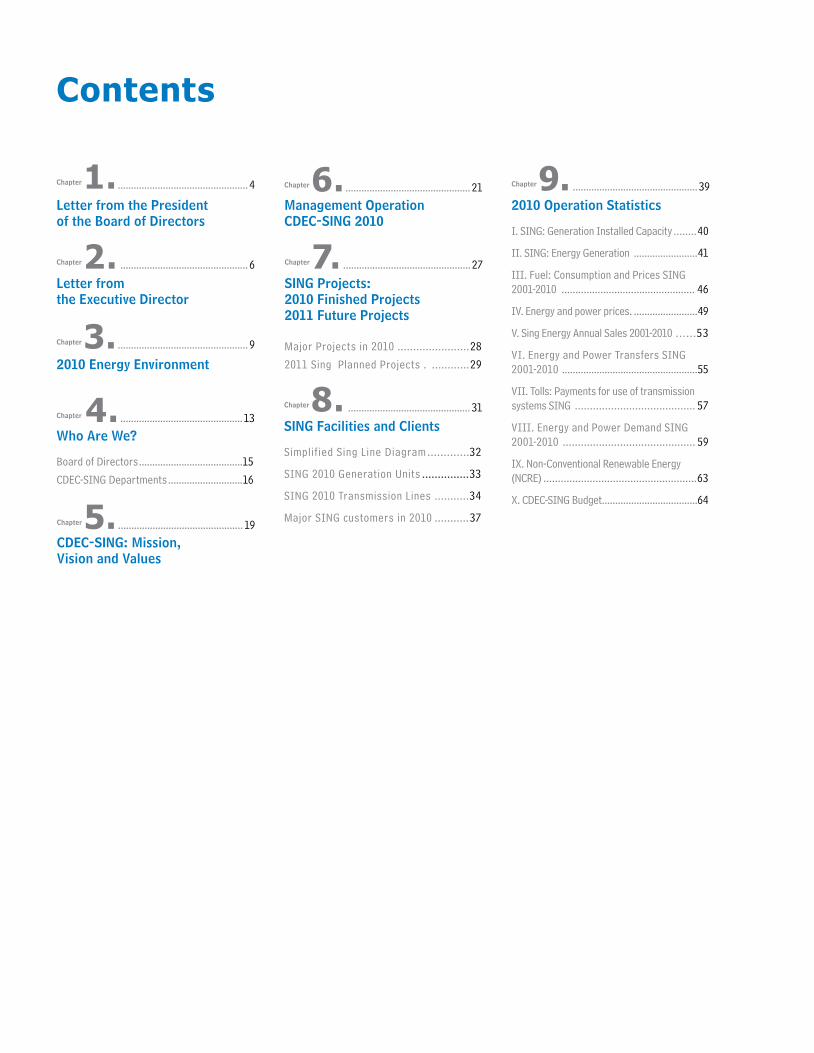
“In 2010 the CDEC-SING was rated a strategic company as a result of virtue of its role and relevance in the performance of the country.”
In 2010 Chile celebrated its bicentennial marked by situations that profoundly affected the country. Whether political, economic or social they were all matters that have important effects on the energy sector.
Politically, a new administration took over in the Energy sector. Economically the country reached a great international recognition. It was accepted as a full member of OECD, and thus becoming the first South American country to join the organization. The Central Bank figures indicated that the country achieved a growth of 5.2%, differing from growth in Latin America. However, the most marked by the bicentennial was on the morning of February 27, 2010.
An earthquake measuring 8.8 on the Richter scale and a subsequenttsunami struck the central-southern part of Chile. The earthquake caused substantial human and material losses, shaking the country. The world sat by and watched in astonishment, one of the largest earthquakes in the history of the world.
The geographical area covered by the Interconnected Northern System, SING, was not directly affected by the disaster. But because of the impact, the focus on prevention and safety in electrical installations to natural events was heavily discussed in the electrical industry throughout the year.
2010 Energy Environment3.
Ann
ual R
epor
t Sta
tistic
s an
d O
per
atio
n
9
In strictly energy matters, 2010 brought the creation of a new establishment, the creation of the Department of Energy. The new change of power in the executive branch created new regional authorities and generated new energy positions in different parts of the country.
As far as the SING, the year 2010 should be distinguished as the year that totally surpassed the crisis. The system was affected due to the shortage of natural gas.
The natural gas crisis - a leading production challenge of the country - occurred during the second half of the last decade. This was a time of high complexity and pressure throughout the SING. The companies had to mobilize significant resources to replace the lack
of natural gas and ensure the demand of their customers. This issue allows resolving the main necessity of the system. This is the balance between supply and demand of the deficit product production. It also addressed at the same time other priorities such as those related to infrastructure of transmission.
In 2010 the SING had notable improvements, for example: the Dispatch and Control Center doubled its size. This facilitated a backup site to guarantee the continuity and security of the system. The recovery service was updated and reviewed and worked on obtaining better and more expeditious communication channels. In this subject matter, the company was rated business strategy, by virtue of its role and relevance to the operation of the country. Because of the specialized knowledge, SING provided the technical
CD
EC
-SIN
G
10
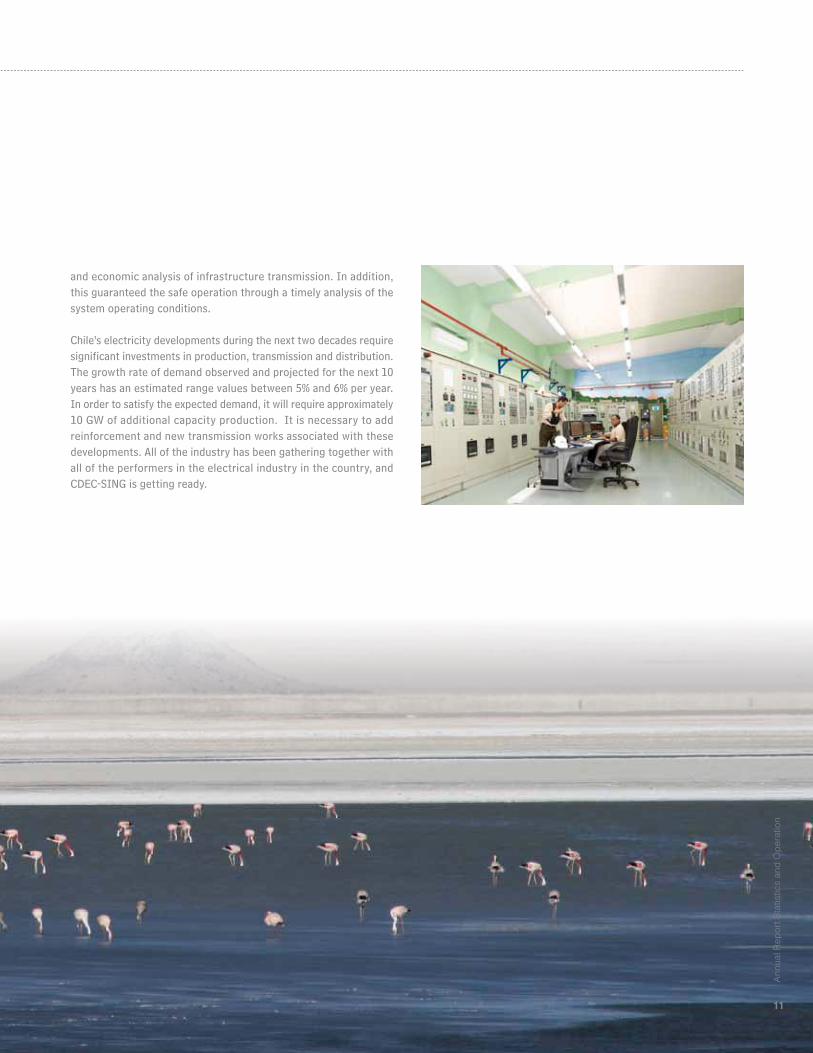
and economic analysis of infrastructure transmission. In addition, this guaranteed the safe operation through a timely analysis of the system operating conditions.
Chile’s electricity developments during the next two decades require significant investments in production, transmission and distribution. The growth rate of demand observed and projected for the next 10 years has an estimated range values between 5% and 6% per year. In order to satisfy the expected demand, it will require approximately 10 GW of additional capacity production. It is necessary to add reinforcement and new transmission works associated with these developments. All of the industry has been gathering together with all of the performers in the electrical industry in the country, and CDEC-SING is getting ready.
Ann
ual R
epor
t Sta
tistic
s an
d O
per
atio
n
11

CD
EC
-SIN
G
12

4.Center for Economic Load Dispatch System Northern
Interconnected (CDEC-SING)
Who Are We?
The Center for Economic Load Dispatch System Northern Interconnected (CDEC-SING) is the organization that coordinates the operation of electrical installations. These installations operate an interconnected system, fulfilling the role of preserving the safety and quality of service.
CDEC-SING is recognized by the government of Chile as a strategic organization. This is because of the public role the company provides in concentrating its activities not only in the electrical supply but also in the safety of the public, the industry and also in the economy of the country.
The management instructions emanating from the CDEC-SING are mandatory for the 40 companies that own the facilities in the
interconnected system. In addition to generate, transport and distribute electricity in the SING, which covers the territory Arica-Parinacota, Tarapaca and Antofagasta, Fifteenth,First and second regions of Chile, respectively, covering an area of 185,142 km2, equivalent to 24.5% of the continental territory.
The SING system is responsible for providing and ensuring the provision of the main production sector. The mining, accounts for almost 15% of GDP, one third of total foreign investment and more than 60% of the total value of exports in the country.
CDEC-SING consists of 40 member companies operating in the sections of generation, trunk transmission, sub transmission and free customers, represented by a Board of Directors consisting of 10 members. A
nnua
l Rep
ort S
tatis
tics
and
Op
erat
ion
13

To accomplish the objectives, SING is structure with three Technical Divisions: the Department of Operations, Department of Tolls, and Department of Office Management/Budget. The most fundamental part of the CDEC-SING is the Dispatch and Control Center which it is under the Operations Department.
CDEC-SING currently has a staff of 46 people who divide their functions in the city of Antofagasta and Santiago. They preside over their professional performance by the values of professionalism, proactively, loyalty, trust and responsibility.
According to the General Law of Electricity Services CDEC-SING is responsible for:
• Maintaining the overall security of electrical systems;• Ensure the most economical operation for all the Electric System facilities;
• Ensure open access to transmission systems and core sub transmission;• Ensure open access to additional transmission systems additional
according to the provisions of the final paragraph of Article 77 of Law;• Determine economic transfers between members CDEC, and• Prepare studies and reports required by the National Energy, the
Superintendent of Electricity and Fuels and the Ministry of Energy.
Board of DirectorsOperations and Tolls Departments
Tolls Department
Toll Division Transfer Division Operations Division Electric Systems
Division Dispatch and
Control Center
Operation Department Administration/Budget Department
Organizational Chart
CD
EC
-SIN
G
14

BOARD Of DIRECTORS
The Board of the CDEC-SING consists of two representatives from the generation department with installed capacity below 300 MW (division A), three representatives from the generation department with installed capacity greater than or equal to 300 MW (division B), two trunk transmission departments (division C), two sub-transmission segments (division D), and a representative of the free customer segment (division E). The current Board is chaired by Mr. Enzo Quezada Zapata, assisted in his functions by Carlos Aguirre Pallavicini
As established by the electrical regulations, the Board of Directors should ensure compliance with the regulatory aspects in the system. The board also oversees the proper functioning of the Departments of the CDEC. The Board of Directors must designate the directors of the departments, elaborate the internal regulation and approve the budget.
DIvISIoN A Eduardo Soto TrincadoJuan Pablo Cárdenas Peréz
DIvISIoN BPedro de la Sotta SánchezCarlos Aguirre PallaviciniEnzo Quezada Zapata
DIvISIoN CRodrigo López vergaraRaúl valpuesta Araya
DIvISIoN DRobin Cuevas CanalesAlfredo Cárdenas ocampo
DIvISIoN E Carlos Finat Díaz
Ann
ual R
epor
t Sta
tistic
s an
d O
per
atio
n
15

ExECuTIvE DIRECToR DIRECToR oF oPERATIoN AND ToLLS. Daniel Salazar J.
DIRECToR oF ADmINISTRATIoN/BuDGETAlvaro Grondona C.
DEPuTy oF oPERATIoN Raúl moreno T.
ASSISTANT ToLL DEPARTmENT Claudia Carrasco A.
CDEC-SING DEPARTMENTS
The three Divisions of the CDEC-SING are eminently technical and executive bodies that carry out their functions under the regulatory forces. The head of the departments are appointed for four years. They can be removed and re-elected by the Board.
DISPATCh AND CoNTRoL mANAGER marco urrutia u.
oPERATIoNS mANAGERPatricio valenzuela v.
mANAGER oF ELECTRICAL SySTEmS Felipe morales S.
ASSISTANT ToLL DEPARTmENT José Arévalo A.
ASSISTANT ToLL DEPARTmENT Fiorella Roncagliolo D.
CD
EC
-SIN
G
16

OPERATION DEPARTMENT
The Department of Operations is responsible for coordinating the operation of all facilities of the Northern Interconnected System. Each are Interconnected to generate, transport and distribute electrical power, while preserving the security and the economic efficiency of the system.
The Operation Department is a group of professionals from three divisions or departments. These are: The Control and Dispatch Center, Operations Department and the Department of Electrical System.
Dispatch and Control Center
The Dispatch and Control Center is responsible for overseeing and coordinating the operations of the SING in real time. This is done according to the standards policies. These standards allow the Center to keep a safe and economic operation in the SING. The Center has a team of 15 professionals, including 11 dispatchers that work in the supervision and coordination of the operation in rotation shifts, twenty-four hours a day, seven days a week.
The Dispatch and Control Center department are the operation decision-makers with the help of the SCADA system. This system provides the electrical variables and is one of the main tools of the CDEC-SING. At the same time, the center communicates via voice channels with the other Controls Centers of the companies that own installations. This scheme is dedicated exclusively to real time operation. This operation is coordinated according to the generation programs prepared by the Operations Department.
Operations Department
The Operations Department has the task of planning and coordinating the SING operation. This task should be done according to the policy standards and the criteria established by the current policy. This put into practice is aimed at maintaining a safe and economical operation in the SING.
A team of six professionals that make up this Department have the main task to develop and establish a daily optimum operation program. It covers the needs of supply of the system. They also schedule and coordinate the maintenance and repair of facilities requested by companies. It develops the analysis program that will allow the operation of the SING in consistency with criterion and polices of operation that elaborates the Electrical Department Systems
Electrical Systems Department
The Department of Electrical Systems is the one that develops the analysis and studies. These analysis and studies have the tendency to have criterion and policies that allow the synchronization of the safely and economically operation of the SING.
The six professionals that work in this department have the main task of developing the criterion and policies of the operation. Also to design, and evaluate the control schemes as well as the protection aimed to maintain a safe an economical SING operation. Simultaneously, it will study and analyze the reports and technical background of the facilities that modified, incorporates, or pulls out from the system.
The department also develops various studies under the current rules, which includes analyzing the contingencies that result in disconnection of generation facilities,transmission, or consumption
TOLLS DEPARTMENT
The Tolls Department is responsible for managing economic transfers between companies in the Northern Interconnected System. This is subject to the coordination of the CDEC-SING and responsible for ensuring open access to trunk transmission systems, sub-transmission or further regulations as established.
Ann
ual R
epor
t Sta
tistic
s an
d O
per
atio
n
17

The Toll Department is a team of professionals grouped into two teams or departments. These are: The Transfers Department and the Department of Tolls.
Transfer Department
The Transfer Department determines the physical and economic transfers that occur between media companies that own generation. This is from the transfer or exchange of energy and time hourly power produced in the actual operation of the system.
The main functions of the four people that work in this department are to determine the physical balances and prices for each transfer. This is accomplished once the real process occurs and it is by monthly or annual reports, and transfer balance sheets of energy, power and non-conventional renewable energy.
Furthermore, the Transfer Department must determine the reassessments among public service concessions. This is referred to as the long term node prices. The Transfer Department also determines the associated transfers with complementary services once they take effect.
Department of Tolls
The primary task of the Department of Tolls is to ensure open access to the trunk transmission systems, sub transmission or additional duties a determined by SING. This task should be according to the current regulation provisions.
The team of four experts that form this department is responsible for determining payments for tolls that apply to the transmission system facilities of SING. In particular, the team develops research and analysis aimed to recommend infrastructure for system expansion of trunk transmission. Also in regard to determining new works, this department is responsible for carrying out international bidding processes for the construction and operation of such projects.
The sub transmission section determines the distribution of regulated revenues among companies operating in this segment. And, furthermore it must issue reports of supply quality,product quality and facilities unavailability.
DEPARTMENT Of ADMINISTRATION/BUDGET
The Department of Management and Budget’s mission is to develop, manage, and execute the annual budget of CDEC SING. It must also calculate and collect the amounts of contributions to the budget that should be executed monthly, every member company, in accordance with the policy regulations.
In the management field, the department establishes and monitors salary guidelines, contracts and department personnel. This department hires the required technical personnel, design and manages procurement policies and payments to suppliers and overhead.
CD
EC
-SIN
G
18

our Vision“To be referred to as a Chilean technical electrical organization,providing coordination services for the operation and development of the Northern Interconnected System. To be reliable and efficient to our customers;having a poly-functional team that guides its work of Excellence, with high quality performance with optimal technology and point tools usage. “
CDEC-SING: mission, vision and values 5.
our Mission“Execute with excellence the coordination of the SING operation. Lead the development, help to preserve and guarantee Safety and efficiency, and ensure accessibility to the system.”
our Value
Ann
ual R
epor
t Sta
tistic
s an
d O
per
atio
n
19

CD
EC
-SIN
G
20

management operation CDEC-SING 2010
MANAGEMENT OPERATION
The Department of Operation of CDEC-SING, through the three divisions that embrace the Corporation; the Dispatch Center and Control (CDC), the Department of Operations and the Department of Electrical Systems developed in 2010 an administration that was guided by the continuous review of conditions of the operation system. It was guided by the objectives of security and economic efficiency that apply to the CDEC-SING. At the same time, significant progress was achieved in the development and connection of infrastructure projects associated with electrical generation, transmission and consumption of the SING.
Also, the teams had a noticeable task on the development of different procedures. These notorious well-known procedures were required by existing standards and promoted by the Department. All the procedures have intended to formalize and objectify the rules addressed in the various areas the operation of SING.
Dispatch and Control Center
Under the comprehensive plan for contingencies that the operation management defined, the CDC department led the implementation of two workshops in voice communications in stressful situations. Specialized personnel from the CDC and the Centers for the Control of the Sing attended the implementation.
6.
Ann
ual R
epor
t Sta
tistic
s an
d O
per
atio
n
21
In addition, the CDC enabled a backup site for the operation of the system to address the need to strengthen the capacity of emergency response. This was an alternative to the main site. That site aims to continue the functions of the CDC in the event that required emergency reasons leave the main site. The back up features and data channels voice increased the redundancy of the systems communication from the CDC.
Also, in order to review the Recovery Plan of the Service and the use of a backup site we performed a mock. It is a total blackout with the participation of all Centers for Control of the companies that included the CDEC-SING. The success of the exercise allowed recommendations to improve the skills and resources to face any emergencies.
In matters relating to the SCADA, in 2010 the CDC continued the integration of companies that were coordinated to connect to the SING; and also with the updated data from the current coordinated. This has allowed the development of various applications supported by SCADA, such as: the incorporation of control and supervision elements of the operational policies. These are supplementary clues that allow the CDC to review transfers and limitations, to control and monitor the voltage transmission, and perform other estimates that support the operation in real time.
Finally, it is important to note that the CDC has completed the coordination of the operation in real time, with high standards. The CDC has done it successfully taking into consideration the various challenges presented in 2010. One of the main challenges was the coordination of testing and commissioning of a significant number of new installations and modifications of existing ones.
Operations Department
In 2010 the planning of the system operation mainly addressed ways to improve the levels of efficiency and security constraints in the operation.
Today the accuracy achieved in the planning of the operation, allows the complete reproduction of the results obtained, and is available for companies comprise by the CDEC SING and anyone interested. In 2010 a total of 600 programs were broadcaster and re dispatched for the daily and weekly operation. In examining the results, we can state that the processes associated with scheduling the operation have an advanced level of technology due to the investment made in recent years in the field.
In previous years the projection of the conditions of supply and scheduling of maintenance by the Department of Operations was successfully established. These schedules were in recurrent
CD
EC
-SIN
G
22

consultation and information required to project conditions of 2010. This activity was permanently developed in order to not demean rates expected reliability of supply. It was achieved thanks to the efforts carried out by the Directorate of Operation and the companies comprising the CDEC-SING, and maintaining timely and constantly inform the segment authority. Finally, the addition of Liquefied Natural Gas LNG, as power of generation in the SING was an important contribution. To better meet the condition of demand in the SING. This implicated to assume the challenges involved in prices, availability and operation plan of the product that was successfully completed in 2010.
Electrical System Department
The Department of Electrical Systems, created in 2010, previously known as the Research Department, had a busy schedule. This schedule was highlighted by the analysis and evaluation of information and studies of large numbers of new generation projects,transmission and consumption. It is interconnected to SING, exceeding by far the annual activity of the last 10 years in this area. Along with the analysis, the technical study standard established Safety and Quality of Service. It represented a significant milestone of the objectives set for 2010.
During the year the department analyzed the background studies of systemic coordination protections of twenty projects. From these analysis and various recommendations for improvements and adaptations to the original designs, new significant reforms were obtained. These reforms were in safety and quality of service to be incorporated in the projects of the system.
In the study and analysis of failures and contingencies occurring during 2010, the balance showed 67 studies and failure analysis. From these actions new corrective and preventive actions were taken with the companies involved.
One of the main activities of the Electrical System department, as frequently done in previous years was the revision of operating policies that apply to different areas of the SING. During 2010, specific policies of operation were defined and applied. These specific policies addressed main operating constraint identified in the system as the strain control supply in the north, range, Capricornio and in Chacaya substation. In all these cases all the efforts were maximized to find solutions to allow and continue safe and economic supply to each one of the areas.
MANAGEMENT Of THE DEPARTMENT Of TOLLS
The Department of Tolls of the CDEC-SING through the two teams that comprise: the Transfer Department and Department of Tolls, carried through the various economic transfers relations between the companies synchronized by the CDEC-SING, with high standards of quality and appropriateness.
In 2010 regarding legislation, there were two regulation drafts: Complementary Services and Trunk Transmission, both developed by the National Energy Commission. In both cases, there were various inputs and recommendations made by the Commission when defining the final text of such regulations.
Ann
ual R
epor
t Sta
tistic
s an
d O
per
atio
n
23

Transfer Division
The economic transfers determined by the Department of Transfers were performed under high standards of quality. They were also completed in time and in conformity with deadlines and commitments established by the department. To ensure no interruption and guarantee in the payments to the companies that participates in transfers of the CDEC-SING.
In 2010 there were no differences or discrepancies in assessments made in the energy and power balances. The department successfully dodged all processes of recovery that corresponded throughout the year. Several revisions were made to the consistency of prices that apply to transfers of energy. These revisions allowed a better definition of the prices charged in case of congestion or disconnection of the system.
The reassessment of payments between companies were reduced in order to improve and raise efficiency standards in the administrative and business management, which is derived from identified transfers in the CDEC-SING. This type of process helped to reduce and generate administrative costs and inefficiencies. The decision to reduce the prices had an improvement over the previous fiscal years.
Tolls Department
In 2010 the Department of Tolls developed several procedures. One of them was the use of the facilities. The use of the facilities is the main function of the Department of Tolls. The decision to use the facilities was an important progress. Because of the termination to use facilities, the department reviewed the node processing pricing conducted by the National Energy Commission. In reviewing the
In this same area, the Department of Tolls developed several Procedures during 2010. In this sense a breakthrough constitutes a favorable report from the National Energy Commission for the TD Procedure - “Payments for reassessment and Calculation Interests“. This allows improving and streamlines the rules that govern economic transfers within the CDEC-SING. One relevant issue is that the Department of Toll led the redesign of the new CDEC-SING web site. This new site is more modern, simple, easy to navigate, and user friendly. The Department of Tolls has fulfilled all the requirements set for the rules for CDEC SING.
Finally, during 2010 and to mark the beginning of the implementation of Law No. 20,257 on the generation of unconventional renewable energy URE, an assignment was performed jointly with the Department of Toll System Interconnected Central (CDEC-SIC), to review and evaluate the correct application of the rules.
CD
EC
-SIN
G
24

prices the department uses the principles that support each technical report of the SING. The outcome was to improve the replica and SING representation. During 2010 the department participated actively in the development of Broadcast transmission. This was part of the process of evaluation and expansion of the trunk transmission and sub transmission system. This is part of the quadrennial 2010-2014 process. The department developed and installed capacities. Theses capacities were planned an oriented for the transmission system. The department continues to work very proficiently in order to lead the transmission system of 220 KV.
To conclude, the department obtained an important achievement. This achievement is the development of the Annual Transmission System Expansion. This report was available to business and company members of the SING. This report covers technical and economic analysis of the needs of the infrastructure for the main transmission of 220 KV in the SING. This report provides recommendations to the works that needs to be done to keep both the system and expenses with high standards of safety and quality. The report contains an important analysis that contributes substantially to make key decisions in the system, and therefore, its generation is a relevant input for the Department of Tolls.
MANAGEMENT/ADMINISTRATION AND BUDGET.
One of the most significant issues conducted in 2010 by the Office of Management and Budget, was the lead-with a consulting company-the study of wages, benefits and practices associated with human resources management. It aimed to have measurable indicators to analyze and compare specific charges of the technical direction of the CDEC-SING with their counterparts. Six companies participated in the study. This allowed obtaining relevant information in wages job profiles and capabilities.
The results identified and defined some differences. A salary scale table and a performance evaluation were developed. This was developed in order to level the differences in some areas. There is a plan in project and will be in put into practice in 2011.
Because of the earthquake in 2010 the former headquarters of the CDEC -SING in Santiago were completely damaged. The administration department had the task to find a new building for the Corporation. After a period of a rigid qualification process the CDEC –SING was able to find new quarters. The new building was inaugurated with the attendance of authorities and members of the industry on November 8, 2010.
Ann
ual R
epor
t Sta
tistic
s an
d O
per
atio
n
25

CD
EC
-SIN
G
26

SING Projects: 2010 Finished Projects 2011 Future Projects7.
This chapter presents all energy infrastructure projects put into service and commercial operation in 2010 and prospects for 2011.
Ann
ual R
epor
t Sta
tistic
s an
d O
per
atio
n
27

MAJOR PROJECTS IN 2010
Infrastructure Projects
Company : Sociedad GNL Mejillones S.A.Project : Liquid Natural gas regasification plant. Commercial Operation : June 18, 2010Characteristics : Nominal regasification capacity up to 5.5 million daily cubic meters.
Transmission Projects
Company : E-CLProject : Chacaya Line - LNG Mejillones.Characteristics : Transmission line at 110 kV, 11.13 km in length and a rated capacity of 121.94 MVA. Company : Minera EsperanzaProject : Chacaya Line - MuelleCharacteristics : Transmission line at 110 kV, 54.9 km in length and rated capacity of 95.26 MVA
Company : Minera EsperanzaProject : Muelle line - Guayaques.Characteristics : Transmission line at 110 kV, 50 km long and rated at 19.05 MVA
Company : Empresa Eléctrica AngamosProyecto : Angamos Line - Laberinto Characteristics : Transmission line at 220 kV double circuit, 142 km in length and rated capacity of 539.95 MVA per circuit.
Company : Minera EscondidaProject : Sectioning and increase of Crucero Line capacity - Escondida. Characteristics : 1x220 kV Transmission Crucero Line - Escondida 236 km in length and rated at 183 MVA, is sectioned in
substations Laberinto y Nueva Zaldívar and increases its ability per segment, generating new lines: • Crucero - Laberinto No. 1, 132.7 km in length and rated capacity of 293.03 MVA. • Laberinto - Nueva Zaldívar No. 1, with 94.5 km in length and rated capacity of 293.03 MVA. • Nueva Zaldivar - Escondida No. 1, with 14 km in length and rated capacity of 293.03 MVA.
Company : Minera EsperanzaProject : El Cobre Line - EsperanzaCharacteristics : 2x220 kV transmission line El Cobre - Esperanza of 81.3 km in length and rated capacity of 179.09 MVA per
circuit.
Company : E-CLProject : Line section Laberinto - GabyCharacteristics : 1x220 kV transmission line Laberinto - Gaby 60 km in length and rated capacity of 189 MVA is sectioned in
substation EL Cobre, generating new lines: • Laberinto - El Cobre, 3 km in length and rated capacity of 228.63 MVA. • El Cobre - Gaby, 57 km in length and rated capacity of 73.16 MVA.
Company : Minera EsperanzaProject : El Tesoro Line - EsperanzaCharacteristics : 1x220 kV transmission line EL Tesoro - Esperanza of 12.5 km in length and rated capacity of 85.36 MVA.
CD
EC
-SIN
G
28

Generation Projects
Company : EnernuevasProject : PMGD Alto Hospicio.Commercial Operation : November 2010Characteristics : Hydroelectric Run of the River PMGD with 1.1 MW gross installed capacity.
Company : EnernuevasProject : PMGD El Toro.Commercial Operation : November 2010Characteristics : Hydroelectric Run of the River PMGD with 1.1 MW gross installed capacity.
2011 SING PLANNED PROJECTS
In 2011 it is expected the commissioning and commercial operation of the following projects: Transmission Project
Company : E-CLProject : Chacaya Line – El Cobre.Characteristics : 2x220 kV transmission Chacaya line Chacaya - El Cobre of 144 km in length and a rated capacity of 350.57 MVA
per circuit.
Company : TransemelProject : Salar Line - Calama.Characteristics : 1x110 kV transmission Salar line - Calama of 16.5 km in length and rated capacity of 55.06 MVA.
Generation Projects
Company : Empresa Eléctrica AngamosProject : Central Termoeléctrica Angamos.Operación comercial : Line 1, projected for April 2011, Unit 2 projected for October of 2011 Characteristics : Steam- Coal Thermoelectric Power Plant 264 MW of gross installed capacity per unit. l
Company : Central Termoeléctrica Andina S.A.Project : Central Termoeléctrica Andina.Commercial Operation : Preview for June of 2011 Characteristics : Steam- Coal Thermoelectric Power Plant 165 MW of gross installed capacity
Company : Inversiones Hornitos S.A.Project : Central Termoeléctrica Hornitos.Commercial Operation : Preview for June of 2011 Characteristics : Steam-Coal Thermoelectric Power Plant with 165 MW of installed capacity.
Ann
ual R
epor
t Sta
tistic
s an
d O
per
atio
n
29

CD
EC
-SIN
G
30

SING Facilities and Clients8.
This chapter describes the facilities that make up the Northern Interconnected System. It also indicates technical features and ownership. This information is for production plants as well as transmission lines. It also presents a list of SING major clients to December 2010.
Ann
ual R
epor
t Sta
tistic
s an
d O
per
atio
n
31

SIMPLIfIED SING LINE DIAGRAM
CD. AricaArica
Chapiquiña
Águila
Pukará
Chinchorro
Dolores
Cerro Colorado
Iquique
CD. Iquique
PacíficoPalafitos
Tarapacá
Norgener
Tocopillla
Mejillones
GNL Mejillones
Atacama
HornitosAndina
EnaexMejillones
Pampa
Antofagasta
La Portada
Spence Calama
Gaby
Oeste
O´HigginsPalestina Llanos
Andes
Nueva Zaldívar
Zaldívar
Laguna Seca
Óxidos
CentroSur
Uribe
Coloso
Radomiro Tomic
Mantos Blancos
Sierra Miranda
Michilla
HospicioHMC
Tamarugal
Collahuasi
Nueva Victoria
El AbraBarriles
Tamaya
La Cruz
Pozo Almonte
Cóndores
Lagunas
Salar
Escondida
Salta
Esmeralda
Parinacota
PERU
BOLIVIA
ARGENTINA
Important Nodes
Substation
Thermal Power Plant
Hydroelectric Power Plant
Line in 345 kV
Line in 220 kV
Line in 110 kV
Minor lines
REFERENCES
Cerro Chuño
Quebrada Blanca
Crucero
Encuentro
Chacaya
Atacama
La Negra
El NegroDesalant
0 300 600
KMS
72o
68o
56o
43o
19o
32o
72o
68o
5 39 0
TERRITORIO CHILENOANTARTICO
CHILE
El Loa
Quiani
Domeyko
Sulfuros
AngamosGuayaques
MuelleEl Cobre
Laberinto
Capricornio
Alto Norte
El TesoroEsperanza
Chuquicamata
Cerro Dragón
CD
EC
-SIN
G
32

SING 2010 GENERATION UNITS
Owner Power Plant name Unit Number of
Components
Total Gross Power [MW] Injection Bar Unit Type
Commissioning year
Celta Termoeléctrica Tarapacá TGTAR (1) 1 23,750 Tarapacá 220 kV Turbogas Diesel 1998CTTAR 1 158,000 Tarapacá 220 kV Steam-Coal 1999
E-CL Chapiquiña CHAP 2 10,200 Arica 66 kV Run of the River 1967Diesel Arica M1AR 3 2,997 Arica 66 kV Diesel engine 1953
M2AR 2 2,924 Arica 66 kV Diesel engine 1961-63GMAR 4 8,400 Arica 66 kV Diesel engine 1973
Diesel Iquique SUIQ 3 4,200 Iquique 66 kV Diesel engine 1957MIIQ 2 2,924 Iquique 66 kV Diesel engine 1963-64MAIQ 1 5,936 Iquique 66 kV Engine FO 6 1972TGIQ 1 23,750 Iquique 66 kV Turbogas Diesel 1978MSIQ 1 6,200 Iquique 66 kV Engine FO 6 1985
Termoeléctrica Mejillones CTM1 1 165,900 Chacaya 220 kV Steam-Coal 1995CTM2 1 175,000 Chacaya 220 kV Steam-Coal 1998CTM3 2 250,750 Chacaya 220 kV Natural Gas Combined Cycle 2000
Diesel Mantos Blancos (2) MIMB 10 28,640 Mantos Blancos 23 kV Engine FO 6 1995Cavancha (9) CAVA 1 2,8 Tap Off Cavancha Hydro 1995Diesel Enaex (4) DEUTZ 3 1,959 Enaex 110 kV Diesel engine 1996
CUMMINS 1 0,722 Enaex 110 kV Diesel engine 1996Electroandina Termoeléctrica Tocopilla U10 1 37,500 Central Tocopilla 110 kV Steam-FO 6 1970
U11 1 37,500 Central Tocopilla 110 kV Steam-FO 6 1970U12 1 85,300 Central Tocopilla 110 kV Steam-Coal 1983U13 1 85,500 Central Tocopilla 110 kV Steam-Coal 1985U14 (6) 1 136,400 Central Tocopilla 220 kV Steam-Coal 1987U15 (7) 1 132,400 Central Tocopilla 220 kV Steam-Coal 1990U16 2 400,000 Central Tocopilla 220 kV Natural Gas Combined Cycle 2001TG1 1 24,698 Central Tocopilla 110 kV Turbogas Diesel 1975TG2 1 24,931 Central Tocopilla 110 kV Turbogas Diesel 1975TG3 (3) 1 37,500 Central Tocopilla 220 kV Turbogas Natural Gas - Diesel 1993
Diesel Tamaya SUTA 10 103,680 Central Tamaya 110 kV Engine FO 6 2009AES Gener Salta CC SALTA (5) 3 642,800 Central Salta 345 kV Natural Gas Combined Cycle 2000Gasatacama Generación Atacama CC1 3 395,900 Central Atacama 220 kV Natural Gas Combined Cycle 1999
CC2 3 384,700 Central Atacama 220 kV Natural Gas Combined Cycle 1999Norgener Termoeléctrica Norgener NTO1 1 136,300 Norgener 220 kV Steam-Coal 1995
NTO2 1 141,040 Norgener 220 kV Steam-Coal 1997Enorchile Zofri ZOFRI_1-6 2 0,900 Iquique 13.8 kV Diesel Engine 2007
ZOFRI_2-5 4 5,160 Iquique 13.8 kV Diesel Engine 2007Diesel Estandartes ZOFRI 7-12 6 4,800 Iquique 66 kV Diesel Engine 2009
Inacal Diesel Inacal INACAL 4 6,800 La Negra 23 kV Engine FO 6 2009
Total to December 31st of 2010 3.696,061
Generating Units PMGD to December of 2010.
Owner Power Plant name UnitNº
Componentes
Total Gross Power [MW]
SE Primary bar of Associated Distribution Unit Type
Commissioning year
Cavancha Cavancha (8) CAVA 1 2,8 Tap Off Cavancha Hydro 1995Enernuevas Minihidro Alto Hospicio MHAH 1 1,100 Alto Hospicio 13.8 kV Hydro 2010Enernuevas Minihidro El Toro N° 2 MHT2 1 1,100 Alto Hospicio 13.8 kV Hydro 2010
TOTAL PMGD TO DECEMBER 31ST 2010 5,000
TTOAL SING TO DECEMBER 31ST 2010. 3.701,061
Notes: 1) During the period January-November 1999 TGTAR Unit belonged to Endesa. As of May 12, 1999 TGTAR is transferred to the SIC and is reinstated to SING. On November
29, 1999 becomes Celta’s property. (2) The Blancos Power Plant Diesel is represented in the CDEC-SING by E-CL.(3) Unit TG3 is available to operate with natural gas since September 2000.(4) Enaex Power Plant Diesel is represented in the CDEC-SING for Gasatacama until May 2007. As of June 2007 is represented by E-CL(5) The Gas Turbines TG12 and TG11 unit CC Salta, at the request of the Agency in charge of Dispatch (ACD) of the republic of Argentina, can be connected to the Argentinean
Interconnection System (SADI) giving a maximum power of 416 [MW].(6) U14 Unit increased its gross capacity of 128,300 to 136,400 MW on April 29, 2008.(7) U15 Unit increased its gross capacity of 130,300 to 132,400 MW on June 12 2009.(8) Cavancha Power Plant from November 3, 2010 belongs to PMGD.
Ann
ual R
epor
t Sta
tistic
s an
d O
per
atio
n
33

SING 2010 Transmission Lines
Owner Transmission Line voltage
(kV)Circuit
numbers
Approxi-mate length(km)
Capacity(MVA)
System Type
Commissioning year
AES GENER Andes - Tap Off Oeste 220 1 38 229 Additional 1998Andes - Nueva Zaldívar. Circuit Nº1 220 1 63 365.8 Additional 1999Andes - Nueva Zaldívar. Circuit Nº2 220 1 63 274.4 Additional 1999Laberinto - Mantos Blancos 220 1 70 290 Additional 1999Nueva Zaldívar - Zaldívar 220 1 0.20 330 Additional 1994Central Salta - Andes 345 1 408 777 Additional 1999
ANGAMOS Angamos - Laberinto 220 2 142x2 540x2 Additional 2010CODELCO NORTE Chuquicamata - 10 100 1 7 83.1 Additional 1988
Chuquicamata - 10A 100 1 8 90.9 Additional 1988Chuquicamata - A 100 2 0.8x2 99.9x2 Additional 1988Chuquicamata - Chamy 100 1 12 62.4 Additional 1990Chuquicamata - K1 100 1 6 90.9 Additional 1988Chuquicamata - KM6 100 1 11 100 Additional 1988K1 - 10 100 1 1 90.9 Additional 1985KM6 - 10A 100 1 6 90.9 Additional 1988KM6 - Sopladores 100 1 2 58.9 Additional 1993Salar - km6 100 2 2.2x2 62x2 Additional 2005Salar - Calama 110 1 14 44 Subtransmission 1982
E-CL Arica - Pozo Almonte 110 1 216 34.3 Subtransmission 1987Capricornio - Alto Norte 110 1 44 120 Additional 2000Capricornio - Antofagasta 110 1 28 91.5 Subtransmission 2000Capricornio - Sierra Miranda 110 1 25 22.9 Additional 2007Chacaya - GNL Mejillones 110 1 11 122 Additional 2010Chacaya - Mejillones 110 1 1.4 34.3 Subtransmission 1987Mejillones - Antofagasta 110 1 63 91.5 Subtransmission 1987Chacaya - Crucero 220 1 153 304.8 Additional 1987Chacaya - Mantos Blancos 220 1 66 304.8 Additional 1996Chacaya - Mejillones 220 1 1.4 365.8 Subtransmission 1987Crucero - Lagunas Nº1 220 1 174 182.9 Additional 1987Lagunas - Pozo Almonte 220 1 70 182.9 Additional 1987Central Chapiquiña - Arica 66 1 84 20.6 Additional 1967
Central Diesel Arica - Arica 66 1 7 20.6Subtransmission / Additional
1964
Central Diesel Iquique - Iquique 66 1 2 41.2 Additional 1970Iquique - Pozo Almonte.Circuito N°1 66 1 44 27.4 Subtransmission 1964Iquique - Pozo Almonte.Circuito N°2 66 1 39 27.4 Subtransmission 1987Pozo Almonte - Tamarugal 66 1 21 9.1 Subtransmission 1968
CD
EC
-SIN
G
34

Owner Transmission Line voltage
(kV)Circuit
numbers
Approxi-mate length(km)
Capacity(MVA)
System Type
Commissioning year
ELECTROANDINA El Cobre - Gaby 220 1 57 73 Additional 2010Laberinto - El Cobre 220 1 3 229 Additional 2010Central Diesel Tamaya - A 110 1 127 65 Additional 2009Central Diesel Tamaya - Salar 110 1 138 65 Additional 2009Central Tocopilla - A 110 2 141x2 65x2 Additional 1910Central Tocopilla - Central Diesel Tamaya 110 2 14x2 65x2 Additional 2009Central Tocopilla - Crucero 220 2 71.4x2 365.8x2 Additional 1986Crucero - Chuquicamata 220 1 70 274 Additional 1986Crucero - El Abra 220 1 101 182.9 Additional 1995Crucero - Radomiro Tomic 220 1 82 182.9 Additional 1996Crucero - Salar (1) 220 1 75 365.8 Additional 2005Salar - Chuquicamata (2) 220 1 13 274.4 Additional 2005Tap Off El Loa - El Loa 220 1 8 91.5 Additional 2000
EMELARI Parinacota - Quiani 66 1 7 12.6 Subtransmission 2002Tap Off Quiani - Quiani 66 1 0.5 12.6 Subtransmission 1998
GRACE Tap Off Barriles - Mantos de la Luna 110 1 27 57.16 Additional 2006HALDEMAN Pozo Almonte - Sagasca 66 1 55 3.4 Additional 1971MINERA CERRO COLORADO Pozo Almonte - Cerro Colorado 110 1 61 68.6 Additional 1993MINERA COLLAHUASI Encuentro - Collahuasi 220 1 201 109 Additional 2004
Lagunas - Collahuasi 220 2 118x2 109x2 Additional 1996MINERA EL TESORO Encuentro - El Tesoro 220 1 90 125 Additional 2000MINERA ESCONDIDA Atacama - Domeyko 220 2 205x2 245.8x2 Additional 1999
Crucero - Laberinto. Circuito Nº1 220 1 133 293 Additional 2010Domeyko - Escondida 220 1 7 245.8 Additional 1999Domeyko - Laguna Seca 220 1 13 245.8 Additional 2001Domeyko - Planta Óxidos 220 1 1 182.9 Additional 1998Domeyko - Sulfuros 220 1 1 293 Additional 2005Laberinto - Nueva Zaldívar. Circuito Nº1 220 1 95 293 Additional 2010Mejillones - O’Higgins 220 1 73 182.9 Additional 2006Nueva Zaldívar - Escondida 220 1 14 293 Additional 2010Nueva Zaldívar - Sulfuros 220 1 13 293 Additional 2006O’Higgins - Coloso 220 1 32 91.5 Additional 1993O’Higgins - Domeyko 220 1 128 182.9 Additional 1999Zaldívar - Escondida (3) 220 1 14 293 Additional 1995
MINERA ESPERANZA Chacaya - Muelle 110 1 55 95 Additional 2010Muelle - Guayaques 110 1 50 19 Additional 2010El Cobre - Esperanza 220 2 81.3x2 179x2 Additional 2010El Tesoro - Esperanza 220 1 13 85.4 Additional 2010
Ann
ual R
epor
t Sta
tistic
s an
d O
per
atio
n
35

Owner Transmission Line voltage
(kV)Circuit
numbers
Approxi-mate length(km)
Capacity(MVA)
System Type
Commissioning year
MINERA MERIDIAN Tap Off Palestina - El Peñón 66 1 66 27.4 Additional 1999MINERA MICHILLA Mejillones - El Lince 110 1 74 34.3 Additional 1991MINERA QUEBRADA BLANCA Collahuasi - Quebrada Blanca 220 1 18 68.6 Additional 2002MINERA RAYROCK Tap Off Pampa - Iván Zar 66 1 17 1 Additional 1994MINERA SPENCE Encuentro - Spence 220 1 67 274.4 Additional 2005MINERA ZALDIVAR Crucero - Laberinto. Circuito Nº2 220 1 133 330 Additional 1994
Laberinto - Nueva Zaldívar. Circuito Nº2 220 1 95 228.6 Additional 1994MOLY-COP Chacaya - Molycop 220 1 1 45.7 Additional 2004NORGENER Tap Off Oeste - Minsal 110 1 33 34.3 Additional 1997
Laberinto - Lomas Bayas 220 1 10 91.5 Additional 1997Tap Off Oeste - Laberinto 220 1 85 228.63 Additional 1998Norgener - Crucero 220 2 72x2 304.8x2 Additional 1997
TRANSELEC NORTE Atacama - Encuentro 220 2 153x2 386x2 Additional 1999Atacama - Esmeralda 220 1 69 197.4 Subtransmission 2001Crucero - Encuentro. Circuito N°1 220 1 1 304.8 Troncal 1999Crucero - Encuentro. Circuito N°2 220 1 1 304.8 Troncal 2000Crucero - Lagunas Nº2 220 1 173 121.9 Additional 1998Cóndores - Parinacota 220 1 222 72 Subtransmission 2002Tarapacá - Cóndores 220 1 70 182.9 Subtransmission 2002Tarapacá - Lagunas 220 2 56x2 152.4x2 Additional 1998
TRANSEMEL Cóndores - Cerro Dragón 110 1 5 34.3 Subtransmission 2001Cóndores - Pacífico 110 1 11 34.3 Subtransmission 2002Cóndores - Palafitos 110 1 9 34.3 Subtransmission 2002Esmeralda - Centro 110 1 1 67.1 Subtransmission 2001Esmeralda - La Portada 110 1 17 34.3 Subtransmission 2001Esmeralda - Sur 110 1 7 34.3 Subtransmission 2002Esmeralda - Uribe 110 1 17 68.6 Subtransmission 2001Tap Off Alto Hospicio - Alto Hospicio 110 1 0 34.3 Subtransmisón 2001Parinacota - Chinchorro 66 1 4 21 Subtransmission 2002Parinacota - Pukará 66 1 4 42.1 Subtransmission 2002
XSTRATA COPPER - ALTONORTE Antofagasta - Alto Norte 110 1 24 68.6Subtransmission / Additional
1993
Total Lines 66 kV 349 266Total Lines 100 kV 58 992Total Lines 110 kV 1,367 1,669Total Lines 220 kV 4,676 14,730Total Lines 345 kV 408 777
Total SING to December 31, 2010 6,857 18,434
CD
EC
-SIN
G
36

MAJOR SING CUSTOMERS IN 2010
CLIENT CATEGORY BAR SUPPLY SUPPLIER ACF Minera Minning Lagunas 220 kV CeltaAtacama Agua y Tecnología Industrial Antofagasta 110 kV E-CLAtacama Minerals Minning Mejillones 220 kV E-CLCamiña Distribution Dolores 110 kV E-CLCerro Colorado Minning Pozo Almonte 220 kV E-CLCerro Dominador - Sierra Gorda Minning Encuentro 220 kV E-CLCerro Dominador - Santa Margarita Minning Calama 110 kV ElectroandinaCía. Portuaria Mejillones Industrial Mejillones 110 kV E-CLCodelco - Chuquicamata Minning Crucero 220 kV - Chuquicamata 220 kV - Salar 220 kV - Salar 100 kV - S/E A 100 kV ElectroandinaCodelco - Radomiro Tomic Minning Crucero 220 kV ElectroandinaCollahuasi Minning Collahuasi 220 kV Celta - GasatacamaCollahuasi Puerto Industrial Tarapacá 220 kV CeltaCosayach Minning Pozo Almonte 23 kV - Dolores 110 kV - Tamarugal 66 kV E-CLEl Abra Minning Crucero 220 kV ElectroandinaEl Tesoro Minning Encuentro 220 kV GasatacamaElecda Distribution Esmeralda 220 kV - Calama 110 kV - Tocopilla 5 kV - La Negra 23 kV - Mejillones 23 kV - Antofagasta 13,8 kV GasatacamaEliqsa Distribution Cóndores 220 kV - Pozo Almonte 23 kV - Tamarugal 66 kV GasatacamaEmelari Distribution Parinacota 220 kV GasatacamaEnaex Industrial Mejillones 110 kV E-CLGaby Minning El Cobre 220 kV E-CLGNL Mejillones Industrial Chacaya 110 kV E-CLGrace Minning Barriles 220 kV AES GenerHaldeman Minning Pozo Almonte 66 kV E-CLInacesa Industrial La Negra 23 kV EnorchileInteracid Industrial Tarapacá 220 kV CeltaLomas Bayas Minning Laberinto 220 kV E-CLMall Plaza Antofagasta Industrial CD Antofagasta 13,8 kV E-CLMamiña Minning Pozo Almonte 220 kV E-CLMantos Blancos Minning Mantos Blancos 220 kV E-CLMegapuerto Industrial Mejillones 23 kV E-CLMichilla Minning Mejillones 110 kV E-CLMinera Escondida Minning Mejillones 220 kV - Zaldívar 220 kV - Crucero 220 kV - Atacama 220 kV Norgener - GasatacamaMinera Esperanza Minning El Cobre 220 kV - Chacaya 110 kV ElectroandinaMinera Meridian Minning C. Atacama 220 kV GasatacamaMolycop Industrial Chacaya 220 kV E-CLMolynor Industrial Mejillones 23 kV E-CLPolpaico Industrial Mejillones 23 kV E-CLQuebrada Blanca Minning Collahuasi 220 kV GasatacamaQuiborax Minning El Águila 66 kV E-CLRayrock Minning Pampa 110 kV E-CLSpence Minning Encuentro 220 kV E-CLSQM El Loa Minning El Loa 220 kV ElectroandinaSQM Iris (ex DSM) Minning Lagunas 220 kV CeltaSQM Minsal Minning Oeste 220 kV NorgenerSQM Nitratos Minning La Cruz 220 kV NorgenerSQM Nva.Victoria Minning Nva.Victoria 220 kV ElectroandinaSQM Salar Minning El Negro 110 kV ElectroandinaXstrata Copper - Altonorte Industrial Alto Norte 110 kV E-CLZaldívar Minning Zaldivar 220 kV E-CL
Ann
ual R
epor
t Sta
tistic
s an
d O
per
atio
n
37

CD
EC
-SIN
G
38

2010 Operation Statistics9.
Ann
ual R
epor
t Sta
tistic
s an
d O
per
atio
n
39

I. SING: Generation Installed Capacity
GENERATION INSTALLED CAPACITY PERIODS 2001-2010
In physical units (MW)Fuel Company 2001 2002 2003 2004 2005 2006 2007 2008 2009 2010
HydroE-CL 13 13 13 13 13 13 13 13 13 10Cavancha 3Enernuevas 2
Subtotal 13 13 13 13 13 13 13 13 13 15
Coal
Celta 158 158 158 158 158 158 158 158 158 158E-CL 341 341 341 341 341 341 341 341 341 341Electroandina 429 429 429 429 429 429 429 438 440 440Norgener 277 277 277 277 277 277 277 277 277 277
Subtotal 1,206 1,206 1,206 1,206 1,206 1,206 1,206 1,214 1,216 1,216
Diesel
Celta 24 24 24 24 24 24 24 24 24 24E-CL 62 62 62 62 62 62 65 48 48 48Electroandina 42 42 50 50 50 50 50 50 50 50Gasatacama 3 3 3 3 3 3Enorchile 6 6 11 11
Subtotal 130 130 138 138 138 138 144 127 132 132
Fuel OilE-CL 53 53 53 53 53 53 53 53 41 41Electroandina 120 120 120 75 75 75 75 75 179 179Inacal 7 7
Subtotal 173 173 173 128 128 128 128 128 226 226
Natural Gas
E-CL 251 251 251 251 251 251 251 251 251 251AES Gener 643 643 643 643 643 643 643 643 643 643Gasatacama 588 781 781 781 781 781 781 781 781 781Electroandina 438 438 438 438 438 438 438 438 438 438
Subtotal 1,919 2,112 2,112 2,112 2,112 2,112 2,112 2,112 2,112 2,112
TOTAL 3,440 3,633 3,641 3,596 3,596 3,596 3,602 3,593 3,699 3,701
Natural Gas 57.1%
Coal 32.9%
Fuel Oil No 6 6.1%
Diesel 3.6%
Hydroelectric 0.4%
Electroandina 29.9%
Gas Atacama 21.1%
E-CL 18.7%
AES Gener 17.4%
Norgener 7.5%
Celta 4.9%
Others 0.7%
Enor Chile 0.29%
Inacal 0.18%
Enernuevas 0.06%Cavancha 0.08%
INSTALLED CAPACITY PER
fUEL
INSTALLED CAPACITY PER
COMPANY2010
CD
EC
-SIN
G
40

II. SING: Energy Generation
JAN FEB MAR APR MAY JUN JUL AUG SEP OCT NOV DEC ANNUAL
ELECTROANDINAU10 - U11 2.9 6.1 9.8 12.1 1.1 1.2 4.8 4.1 0.5 1.9 0.0 0.0 44.6U12 - U13 99.7 50.5 75.3 101.1 98.3 107.4 104.6 103.7 109.4 98.5 107.7 111.3 1,167.5U14 - U15 173.3 161.6 164.9 165.2 161.7 158.8 174.6 161.0 83.7 140.3 168.0 175.3 1,888.4U16 80.1 6.1 66.3 72.4 136.2 172.8 184.5 119.6 177.7 157.4 177.3 176.4 1,526.8TG1 0.4 0.5 0.3 0.5 0.4 0.0 0.2 0.2 0.3 0.1 0.0 0.0 2.8TG2 0.3 0.2 0.1 0.0 0.0 0.0 0.0 0.3 0.2 0.1 0.0 0.0 1.1TG3 1.6 3.7 1.9 1.9 1.1 1.4 0.3 0.5 3.0 3.6 0.0 0.6 19.6SUTA 21.4 38.3 12.1 11.1 4.1 13.1 22.0 19.8 23.7 14.0 0.2 7.3 187.1Total Gross Generation 379.7 267.0 330.6 364.4 402.8 454.6 491.1 409.3 398.5 415.8 453.3 470.9 4,838.0Own Consumption 24.6 19.1 22.5 24.6 24.5 25.8 29.3 25.5 20.4 24.6 25.7 27.0 293.5Total Net Generation 355.1 247.9 308.2 339.8 378.3 428.8 461.8 383.8 378.2 391.2 427.7 443.9 4,544.5
E-CLCHAPIQUIÑA 4.3 3.6 3.6 3.5 3.6 3.5 3.4 3.6 3.2 3.3 3.0 3.6 42.3CAVA (1) 1.5 1.3 1.4 1.3 1.3 1.2 1.2 1.2 1.2 1.3 0.0 0.0 12.9CD ARICA 1.5 2.2 2.3 1.9 1.1 1.9 2.5 2.3 2.9 1.9 1.9 2.3 24.7CD IQUIQUE 2.3 4.2 4.6 4.2 1.6 3.3 3.9 4.9 2.8 3.1 3.3 4.3 42.5CD MANTOS BLANCOS 6.4 10.5 8.1 10.9 3.5 7.2 10.7 8.6 7.4 5.9 3.6 5.4 88.2CTM3 42.6 49.1 94.6 92.1 13.6 0.0 0.2 45.9 0.3 0.0 0.0 28.5 366.7CTM2 66.8 109.1 120.4 39.0 107.7 108.4 113.6 114.7 101.8 114.3 110.4 113.7 1,219.8CTM1 107.4 102.8 111.4 109.6 108.9 101.4 109.7 110.1 107.6 89.0 0.0 56.5 1,114.5CD ENAEX 0.0 0.0 0.1 0.1 0.0 0.0 0.1 0.0 0.1 0.0 0.0 0.1 0.5Total Gross Generation 232.8 282.9 346.4 262.4 241.4 226.8 245.4 291.3 227.3 218.9 122.3 214.3 2,912.1Own Consumption 15.7 18.2 21.3 15.0 17.6 17.0 18.0 19.6 16.6 16.4 8.4 15.4 199.1Total Net Generation 217.1 264.7 325.1 247.4 223.7 209.9 227.4 271.7 210.7 202.5 113.9 198.9 2,713.0
CELTACTTAR 71.5 93.9 50.4 84.7 81.5 101.7 104.0 99.0 97.1 100.6 101.9 89.8 1,076.3TGTAR 0.8 1.1 1.0 0.2 0.5 0.6 1.1 0.8 0.7 0.7 1.0 1.0 9.6Total Gross Generation 72.3 95.1 51.5 84.9 82.0 102.3 105.1 99.8 97.9 101.3 102.8 90.8 1,085.9Own Consumption 6.0 7.8 4.3 6.8 6.7 8.0 8.3 8.1 7.6 8.1 8.0 7.1 86.5Total Net Generation 66.3 87.3 47.2 78.2 75.3 94.4 96.9 91.8 90.2 93.2 94.9 83.7 999.4
NORGENERNTO1 93.7 87.7 98.4 96.9 95.2 94.9 100.2 96.3 87.4 51.2 95.9 101.1 1,098.9NTO2 100.6 83.8 100.1 97.1 100.7 97.4 100.9 98.0 97.4 101.3 93.8 99.3 1,170.5Total Gross Generation 194.3 171.5 198.5 194.0 196.0 192.2 201.1 194.3 184.8 152.5 189.7 200.4 2,269.3Own Consumption 12.7 12.4 12.9 12.6 12.7 12.5 13.1 12.6 12.0 9.9 12.5 13.1 149.0Total Net Generation 181.7 159.1 185.6 181.4 183.2 179.7 188.0 181.6 172.8 142.6 177.2 187.4 2,120.3
GASATACAMACC1 55.4 0.7 14.1 17.0 149.8 122.8 117.0 139.7 178.7 116.8 163.3 168.6 1,243.8CC2 132.6 189.2 178.9 199.1 39.6 114.5 128.5 154.8 153.6 162.7 99.6 175.7 1,728.9Total Gross Generation 188.0 189.9 193.1 216.1 189.4 237.3 245.5 294.5 332.3 279.5 262.9 344.3 2,972.7Own Consumption 6.4 4.7 5.4 6.0 6.8 7.1 7.0 8.3 8.6 8.2 7.7 9.0 85.1Total Net Generation 181.6 185.2 187.7 210.0 182.6 230.2 238.5 286.1 323.7 271.3 255.2 335.3 2,887.6
AES GENERSalta Power Plant 140.7 114.1 137.4 122.8 116.1 46.3 0.0 0.0 27.9 92.2 129.3 31.2 958.1Total Gross Generation 140.7 114.1 137.4 122.8 116.1 46.3 0.0 0.0 27.9 92.2 129.3 31.2 958.1Own Consumption 0.7 0.6 0.7 0.6 0.6 0.2 0.0 0.0 0.1 0.5 0.7 0.2 4.9Total Net Generation 140.0 113.5 136.7 122.2 115.5 46.1 0.0 0.0 27.8 91.7 128.7 31.0 953.2
CAVANCHACAVA (2) 0.0 0.0 0.0 0.0 0.0 0.0 0.0 0.0 0.0 0.0 1.2 1.3 2.5Total Gross Generation 0.0 0.0 0.0 0.0 0.0 0.0 0.0 0.0 0.0 0.0 1.2 1.3 2.5Own Consumption 0.0 0.0 0.0 0.0 0.0 0.0 0.0 0.0 0.0 0.0 0.0 0.0 0.0Total Net Generation 0.0 0.0 0.0 0.0 0.0 0.0 0.0 0.0 0.0 0.0 1.2 1.3 2.5
ENERGY GENERATION YEAR 2010
Ann
ual R
epor
t Sta
tistic
s an
d O
per
atio
n
41

JAN FEB MAR APR MAY JUN JUL AUG SEP OCT NOV DEC ANNUAL
ENORCHILECD ZOFRI 0.4 0.5 0.4 0.2 0.2 0.4 0.8 0.8 0.9 0.8 0.7 0.7 6.8ESTANDARTES 0.6 1.1 1.1 0.8 0.5 0.7 0.9 0.9 1.4 0.9 0.8 0.9 10.6Total Gross Generation 1.1 1.6 1.5 1.0 0.7 1.1 1.7 1.7 2.3 1.7 1.4 1.6 17.5Own Consumption 0.0 0.0 0.0 0.0 0.0 0.0 0.0 0.0 0.0 0.0 0.0 0.0 0.2Total Net Generation 1.1 1.6 1.5 1.0 0.7 1.1 1.7 1.7 2.3 1.7 1.4 1.6 17.2
INACALINACAL1 - 4 2.6 4.0 4.4 4.1 3.2 4.1 4.0 3.0 3.0 3.6 3.8 4.3 44.1Total Gross Generation 2.6 4.0 4.4 4.1 3.2 4.1 4.0 3.0 3.0 3.6 3.8 4.3 44.1Own Consumption 0.0 0.0 0.0 0.0 0.0 0.0 0.0 0.0 0.0 0.0 0.0 0.0 0.0Total Net Generation 2.6 4.0 4.4 4.1 3.2 4.1 4.0 3.0 3.0 3.6 3.8 4.3 44.1
ANDINACTA 0.0 0.0 0.0 0.0 0.0 0.0 0.0 0.0 0.0 0.0 0.0 0.6 0.6Total Gross Generation 0.0 0.0 0.0 0.0 0.0 0.0 0.0 0.0 0.0 0.0 0.0 0.6 0.6Own Consumption 0.0 0.0 0.0 0.0 0.0 0.0 0.0 0.0 0.0 0.0 0.0 0.0 0.0Total Net Generation 0.0 0.0 0.0 0.0 0.0 0.0 0.0 0.0 0.0 0.0 0.0 0.6 0.6
ANGAMOSANG1 0.0 0.0 0.0 0.0 0.0 0.0 0.0 0.0 0.0 0.0 0.0 0.2 0.2Total Gross Generation 0.0 0.0 0.0 0.0 0.0 0.0 0.0 0.0 0.0 0.0 0.0 0.2 0.2Own Consumption 0.0 0.0 0.0 0.0 0.0 0.0 0.0 0.0 0.0 0.0 0.0 0.0 0.0Total Net Generation 0.0 0.0 0.0 0.0 0.0 0.0 0.0 0.0 0.0 0.0 0.0 0.2 0.2
ENERNUEVASMHAH - MHT2 0.0 0.0 0.0 0.0 0.0 0.0 0.0 0.0 0.0 0.1 1.3 1.3 2.8Total Gross Generation 0.0 0.0 0.0 0.0 0.0 0.0 0.0 0.0 0.0 0.1 1.3 1.3 2.8Own Consumption 0.0 0.0 0.0 0.0 0.0 0.0 0.0 0.0 0.0 0.0 0.0 0.0 0.0Total Net Generation 0.0 0.0 0.0 0.0 0.0 0.0 0.0 0.0 0.0 0.1 1.3 1.3 2.8
TOTAL SINGGeneración Bruta 1,211.5 1,126.1 1,263.2 1,249.8 1,231.6 1,264.8 1,294.0 1,293.8 1,274.0 1,265.6 1,268.1 1,361.2 15,103.8Own Consumption 66.0 62.8 67.1 65.7 69.0 70.6 75.6 74.1 65.3 67.6 62.9 71.6 818.2Net Generation 1,145.6 1,063.3 1,196.2 1,184.2 1,162.6 1,194.2 1,218.3 1,219.8 1,208.7 1,198.0 1,205.2 1,289.6 14,285.6Transmission losses 44.1 31.3 46.4 43.1 42.2 38.6 39.2 38.9 37.2 39.1 40.6 52.8 493.4
Sales to Free Customers 979.7 916.3 1,019.5 1,015.3 991.2 1,029.1 1,047.9 1,055.9 1,053.0 1,034.8 1,042.6 1,111.4 12,296.7Sales to Regulated customers 121.8 115.7 130.3 125.8 129.2 126.5 131.2 125.0 118.5 124.1 122.0 125.4 1,495.5Total Sales 1,101.5 1,032.0 1,149.8 1,141.1 1,120.4 1,155.6 1,179.1 1,180.9 1,171.5 1,158.9 1,164.6 1,236.8 13,792.2
TOTAL SING (%)Total Gross Generation 100% 100% 100% 100% 100% 100% 100% 100% 100% 100% 100% 100% 100%Own Consumption 5% 6% 5% 5% 6% 6% 6% 6% 5% 5% 5% 5% 5%Total net generation 95% 94% 95% 95% 94% 94% 94% 94% 95% 95% 95% 95% 95%Transmission Losses 4% 3% 4% 3% 3% 3% 3% 3% 3% 3% 3% 4% 3%
Sales to Free Customers 81% 81% 81% 81% 80% 81% 81% 82% 83% 82% 82% 82% 81%Sales to Regulated customers 10% 10% 10% 10% 10% 10% 10% 10% 9% 10% 10% 9% 10%Total Sales 91% 92% 91% 91% 91% 91% 91% 91% 92% 92% 92% 91% 91%
(1) Cavancha until November 3, 2010 CDEC-SING represented by E-CL. (2) Cavancha from November 3, 2010 belongs to PMGD.
Coal 57.8%
Natural Gas 26.8%
Diesel 12.4%
Fuel Oil Nº6 2.6%
Hydroelectric 0.4%
Electroandina 32.0%
Gas Atacama 19.7%
E-CL 19.2%
Norgener 15.0%
Celta 7.2%
AES Gener 6.3%
Others 0.5%
Enor Chile 0.12%
Inacal 0.29%
Enernuevas 0.02%Cavancha 0.10%
CD
EC
-SIN
G
42

Coal 57.8%
Natural Gas 26.8%
Diesel 12.4%
Fuel Oil Nº6 2.6%
Hydroelectric 0.4%
Electroandina 32.0%
Gas Atacama 19.7%
E-CL 19.2%
Norgener 15.0%
Celta 7.2%
AES Gener 6.3%
Others 0.5%
Enor Chile 0.12%
Inacal 0.29%
Enernuevas 0.02%Cavancha 0.10%
GROSS POWER GENERATION PER
fUEL 2010
GROSS POWER GENERATION BY COMPANY 2010
SING POWER PLANTS GENERATION 2001-2010
2001 2002 2003 2004 2005 2006 2007 2008 2009 2010
ELECTROANDINAU10 - U11 29 1 0 7 0 19 187 322 112 45U12 - U13 338 663 455 478 207 463 1052 1125 1,121 1,167U14 - U15 664 1,266 1,304 1,409 1,549 1,688 1905 1784 1,820 1,888U16 1,458 1,174 1,627 1,458 1,753 1,884 936 474 732 1,527TG1 - TG2 16 7 2 2 1 0 12 25 12 4TG3 43 4 11 91 43 12 40 56 33 20SUTA 184 187Total Gross Generation 2,548 3,115 3,398 3,444 3,553 4,066 4,132 3,785 4,014 4,838Own Consumption 139 199 198 194 191 218 255 254 249 294Total Net Generation 2,409 2,917 3,201 3,250 3,361 3,848 3,877 3,531 3,764 4,545
E-CLCHAPIQUIÑA 53 54 51 51 45 55 53 53 47 42CAVA (1) 12 13 14 15 15 15 15 15 15 13CD ARICA 5 2 1 5 2 7 33 32 17 25CD IQUIQUE 14 8 6 11 4 13 50 60 31 42CD ANTOFAGASTA 5 2 2 7 2 15 32 6 0 0CD MANTOS BLANCOS 7 6 7 16 4 25 7 0 69 88CTM3 1,131 849 1,695 1,449 1,601 600 400 814 632 367CTM2 774 918 575 1,003 849 1033 1188 1298 1,282 1,220CTM1 257 18 144 498.7 446.6 880 1057 1202 1,191 1,114CD ENAEX 1 0 1 1Total Gross Generation 2,257 1,870 2,495 3,054 2,970 2643 2837 3480 3,285 2,912Own Consumption 131 111 113 162 159 169 200 230 225 199Total Net Generation 2,125 1,759 2,382 2,892 2,810 2475 2637 3250 3,060 2,713
CELTACTTAR 760 639 435 435 422 830 1012 981.0 1,065 1,076.3TGTAR 3 1 1 1 0 2 14 17.9 11 9.6Total Gross Generation 763 640 436 436 423 832 1026 999 1,076 1,085.9Own Consumption 67 61 40 39 39 72 84 81 86 86.5Total Net Generation 696 579 397 398 383 760 941 918 990 999.4
Ann
ual R
epor
t Sta
tistic
s an
d O
per
atio
n
43

2001 2002 2003 2004 2005 2006 2007 2008 2009 2010
NORGENERNTO1 1 63 16 216 549 776 897 1,039 1,049 1,099NTO2 67 252 126 578 528 938 1,107 1,061 911 1,170CD ZOFRI (3) 8 14Total Gross Generation 68 315 142 794 1,077 1,714 2,011 2,113 1,960 2,269Own Consumption 7 32 14 66 91 125 138 145 134 149Total Net Generation 61 283 128 727 986 1,589 1,873 1,969 1,826 2,120
GASATACAMACC1 1,462 1,431 1,434 1,168 1,144 411 1,002 2,331.3 1,405 1,244CC2 1,368 1,216 1,568 1,530 1,338 1,285 1,311 639.6 1,801 1,729CD ENAEX 0 0 0 0 0 0 0Total Gross Generation 2,830 2,647 3,002 2,698 2,482 1,696 2,313 2,971 3,205 2,973Own Consumption 91 77 82 82 69 61 75 73 90 85Total Net Generation 2,739 2,570 2,920 2,615 2,413 1,635 2,237 2,898 3,116 2,888
AES GENERCC Salta 1,386 1,813 1,950 1,903 2,154 2,285 1,628 1,154 1,348 958Total Gross Generation 1,386 1,813 1,950 1,903 2,154 2,285 1,628 1,154 1,348 958Own Consumption 35 45 46 43 44 46 38 22 7 5Total Net Generation 1,351 1,768 1,904 1,860 2,110 2,239 1,590 1,132 1,341 953
CAVANCHACAVA (2) 2Total Gross Generation 2Own Consumption 0Total Net Generation 2
ENORCHILECD ZOFRI 6 7Central Estandartes 0 11Total Gross Generation 6 17Own Consumption 0 0Total Net Generation 6 17
INACALCD Inacal 13 44Total Gross Generation 13 44Own Consumption 0 0Total Net Generation 13 44
ANDINACTA 1Total Gross Generation 1Own Consumption 0Total Net Generation 1
ANGAMOSANG1 0Total Gross Generation 0Own Consumption 0Total Net Generation 0
CD
EC
-SIN
G
44

2001 2002 2003 2004 2005 2006 2007 2008 2009 2010
ENERNUEVASMHAH - MHT2 3Total Gross Generation 3Own Consumption 0Total Net Generation 3
TOTAL SINGGross Generation 9,851 10,400 11,424 12,330 12,657 13,236 13,946 14,502 14,907 15,104Own Consumption 471 524 492 587 594 692 790 804 792 818Net Generation 9,381 9,876 10,932 11,743 12,063 12,544 13,156 13,698 14,115 14,286Transmission Losses 390 394 452 503 503 515 481 479 459 493
Sales to Free Customers 8,046 8,473 9,433 10,164 10,401 10,774 11,343 11,832 12,240 12,297Sales to Regulated customers 945 1,009 1,047 1,075 1,159 1,256 1,332 1,387 1,417 1,496Total Sales 8,991 9,482 10,480 11,240 11,560 12,029 12,674 13,219 13,656 13,792
TOTAL SING (%)Gross Generation 100% 100% 100% 100% 100% 100% 100% 100% 100% 100%Own Consumption 5% 5% 4% 5% 5% 5% 6% 6% 5% 5%Net Generation 95% 95% 96% 95% 95% 95% 94% 94% 95% 95%Transmission Losses 4% 4% 4% 4% 4% 4% 3% 3% 3% 3%
Sales to Free Customers 82% 81% 83% 82% 82% 81% 81% 82% 82% 81%Sales to Regulated customers 10% 10% 9% 9% 9% 9% 10% 10% 10% 10%Total Sales 91% 91% 92% 91% 91% 91% 91% 91% 92% 91%
1) Cavancha until November 3, 2010 CDEC-SING represented by E-CL. (2) Cavancha from November 3, 2010 corresponds to PMGD. (3) CD ZOFRI until 2008 CDEC-SING represented by Norgener
0
500
1,000
1,500
2,000
Electroandina E-CL Celta Gas Atacama AES Gener Norgener
Pow
er [
MW
]
2001 2002 2003 2004 2005 2006 2007 2008 2009 2010
MONTHLY AVERAGE HOURLY GENERATION (MW)Period 2001-2010
Ann
ual R
epor
t Sta
tistic
s an
d O
per
atio
n
45

III. Fuel: Consumption and Prices SING 2001-2010 ANNUAL COAL CONSUMPTION BY POWER PLANT
ANNUAL NATURAL GAS CONSUMPTION PER POWER PLANT
ANNUAL CONSUMPTION Of LIQUID fUELS PER POWER PLANT
0
100
200
300
400
500
600
700
800
Mill
ions
of m
3
Atacama Salta Mejillones Tocopilla
2001 2002 2003 2004 2005 2006 2007 2008 2009 2010
0
300
600
900
1,200
1,500
Thou
sand
s of
Tons
Mejillones
2001 2002 2003 2004 2005 2006 2007 2008 2009 2010
Norgener Tocopilla Tarapacá
0
100
200
300
400
500
600
Thou
sand
s of
Tons
2001 2002 2003 2004 2005 2006 2007 2008 2009 2010
Arica Iquique Antofagasta Mantos Blancos Mejillones Enaex Norgener Tocopilla Tamaya
Tarapacá C. Atacama C. Salta Zofri Estandartes Inacal Angamos Andina
CD
EC
-SIN
G
46

0
50
100
150
200
US$
/ to
n
2001 2002 2003 2004 2005 2006 2007 2008 2009 2010
C. Mejillones C. Norgener C. Tarapacá C. Tocopilla
0
5
10
15
20
25
US$
/ M
btu
2001 2002 2003 2004 2005 2006 2007 2008 2009 2010
C. Atacama C. Salta C. Mejillones C. Tocopilla
NATURAL GAS PRICE
COAL PRICE
Ann
ual R
epor
t Sta
tistic
s an
d O
per
atio
n
47
80
160
240
320
400
480
560
640
720
800
880
960
1,040
1,120
1,200
1,280
US$
/ to
n
2001 2002 2003 2004 2005 2006 2007 2008 2009 2010
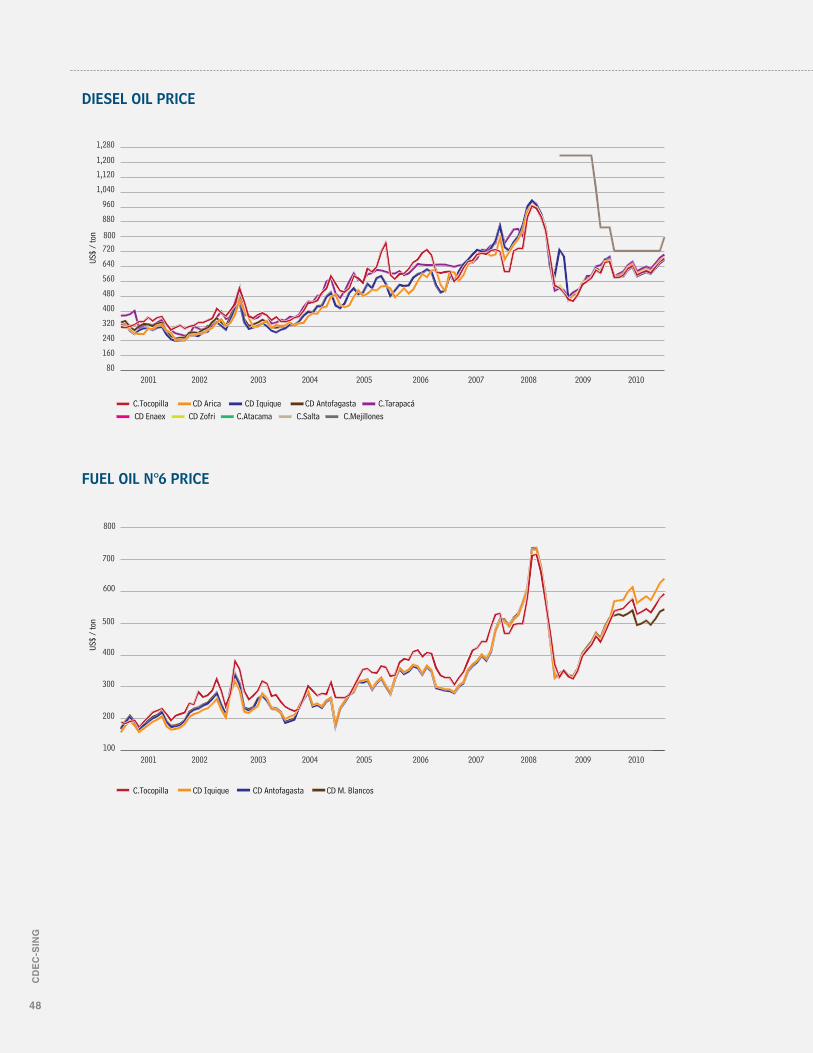
C.Tocopilla CD Arica CD Iquique CD Antofagasta C.TarapacáCD Enaex CD Zofri C.Atacama C.Salta C.Mejillones
100
200
300
400
500
600
700
800
US$
/ to
n
2001 2002 2003 2004 2005 2006 2007 2008 2009 2010
C.Tocopilla CD Iquique CD Antofagasta CD M. Blancos
fUEL OIL N°6 PRICE
DIESEL OIL PRICE
CD
EC
-SIN
G
48
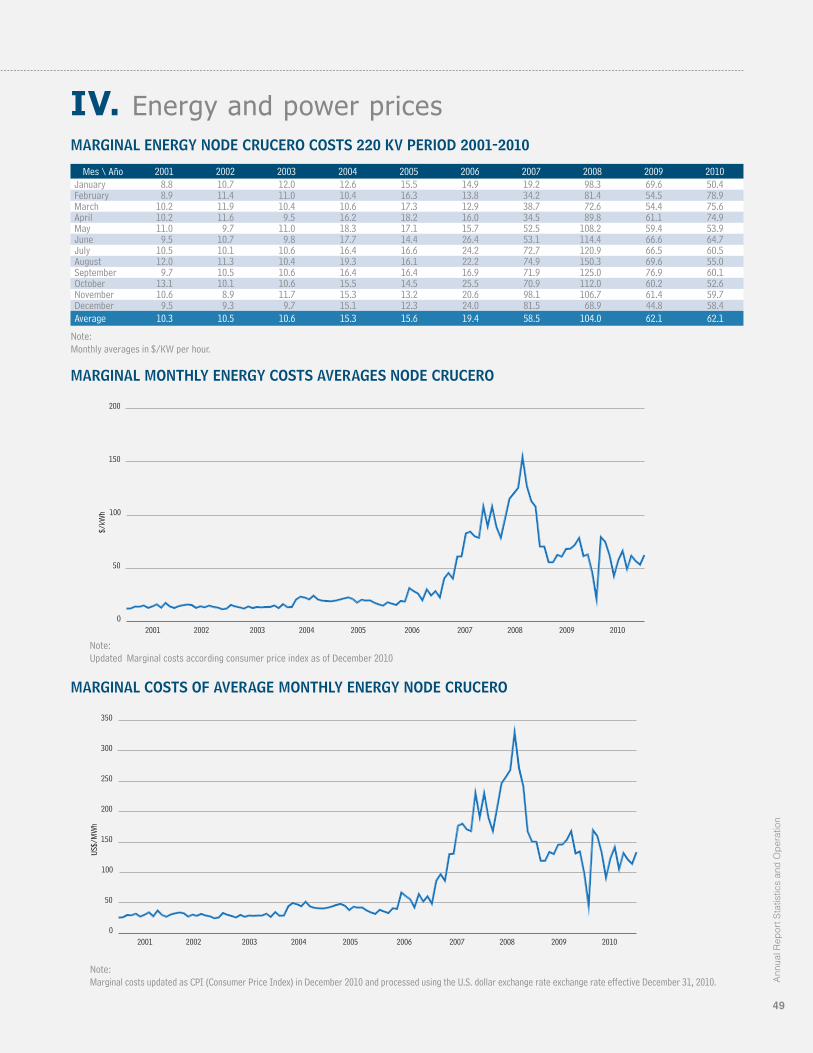
IV. Energy and power pricesMARGINAL ENERGY NODE CRUCERO COSTS 220 kV PERIOD 2001-2010
MARGINAL MONTHLY ENERGY COSTS AVERAGES NODE CRUCERO
MARGINAL COSTS Of AVERAGE MONTHLY ENERGY NODE CRUCERO
Mes \ Año 2001 2002 2003 2004 2005 2006 2007 2008 2009 2010January 8.8 10.7 12.0 12.6 15.5 14.9 19.2 98.3 69.6 50.4February 8.9 11.4 11.0 10.4 16.3 13.8 34.2 81.4 54.5 78.9March 10.2 11.9 10.4 10.6 17.3 12.9 38.7 72.6 54.4 75.6April 10.2 11.6 9.5 16.2 18.2 16.0 34.5 89.8 61.1 74.9May 11.0 9.7 11.0 18.3 17.1 15.7 52.5 108.2 59.4 53.9June 9.5 10.7 9.8 17.7 14.4 26.4 53.1 114.4 66.6 64.7July 10.5 10.1 10.6 16.4 16.6 24.2 72.7 120.9 66.5 60.5August 12.0 11.3 10.4 19.3 16.1 22.2 74.9 150.3 69.6 55.0September 9.7 10.5 10.6 16.4 16.4 16.9 71.9 125.0 76.9 60.1October 13.1 10.1 10.6 15.5 14.5 25.5 70.9 112.0 60.2 52.6November 10.6 8.9 11.7 15.3 13.2 20.6 98.1 106.7 61.4 59.7December 9.5 9.3 9.7 15.1 12.3 24.0 81.5 68.9 44.8 58.4Average 10.3 10.5 10.6 15.3 15.6 19.4 58.5 104.0 62.1 62.1
Note:Monthly averages in $/KW per hour.
0
50
100
150
200
250
300
350
US$/
MW
h
2001 2002 2003 2004 2005 2006 2007 2008 2009 2010
0
50
100
150
200
$/kW
h
2001 2002 2003 2004 2005 2006 2007 2008 2009 2010
Note:Updated Marginal costs according consumer price index as of December 2010
Note:Marginal costs updated as CPI (Consumer Price Index) in December 2010 and processed using the U.S. dollar exchange rate exchange rate effective December 31, 2010.
Ann
ual R
epor
t Sta
tistic
s an
d O
per
atio
n
49

MARGINAL ENERGY COSTS 220 kV NODE CRUCERO - YEAR 2010
Day January February March April May June July August September October November December1 21.7 82.2 78.8 78.5 96.3 47.8 75.8 61.1 60.4 60.6 62.5 48.62 30.9 81.6 65.7 87.2 58.7 69.7 71.4 39.4 61.9 61.3 64.9 60.03 41.6 82.0 61.9 88.6 65.9 65.4 67.2 42.7 54.0 63.2 54.2 65.14 30.0 82.4 52.4 82.1 77.5 64.8 68.6 31.0 51.3 57.3 60.4 36.85 24.5 66.1 80.9 73.6 30.7 67.1 68.9 54.5 65.0 60.6 51.0 61.46 45.8 65.3 80.7 51.3 33.7 68.6 65.1 43.7 51.8 60.8 48.0 58.57 20.6 77.8 73.3 61.2 42.2 57.0 65.9 49.0 61.6 56.7 53.3 62.68 23.7 81.0 82.3 50.2 26.2 72.5 55.8 55.0 48.8 38.2 60.4 68.19 28.2 77.4 56.6 85.4 51.6 65.1 66.5 59.9 64.9 57.8 60.0 69.2
10 21.1 75.3 60.6 85.3 29.2 65.9 64.5 50.0 61.0 61.5 59.0 64.111 26.3 77.1 71.5 87.7 26.7 66.0 68.7 53.3 60.4 60.9 58.1 74.712 32.7 58.1 56.3 85.4 45.5 52.4 67.5 37.3 62.1 58.2 62.6 65.513 31.2 61.1 75.9 94.5 35.1 54.4 64.6 45.1 60.0 37.3 62.0 65.314 30.8 88.1 74.0 94.7 48.2 61.6 64.2 48.0 60.1 51.6 64.2 65.015 45.6 107.2 56.1 86.1 56.6 64.6 52.3 36.1 58.1 31.8 61.4 40.816 46.2 81.0 64.3 87.4 62.1 59.1 61.1 69.7 62.3 32.3 50.8 39.517 31.6 79.0 56.2 86.1 71.8 61.3 66.3 45.3 61.2 51.6 51.4 69.618 66.3 90.5 86.0 89.4 66.7 63.7 60.9 61.4 59.0 58.5 48.9 38.419 68.7 91.1 83.7 90.5 45.5 73.7 44.4 62.4 40.9 51.7 63.7 33.220 68.4 87.3 86.7 86.4 77.9 74.3 61.1 68.6 61.9 29.4 68.8 42.121 68.9 78.8 89.1 88.7 72.3 69.5 46.7 66.6 59.8 40.2 63.8 64.922 76.7 74.5 87.5 53.6 60.5 56.5 48.0 65.3 58.6 40.6 67.7 58.723 74.0 69.0 71.4 88.6 37.9 66.2 65.8 43.9 64.1 61.5 65.0 59.524 66.6 76.7 78.0 46.2 55.5 58.7 80.4 69.4 70.5 45.2 63.1 61.825 73.8 78.4 90.5 37.3 59.0 65.6 63.4 69.0 58.2 47.5 59.7 58.326 74.2 75.9 89.5 62.7 37.7 64.9 57.5 75.0 47.3 57.6 66.7 74.727 76.8 74.9 82.2 46.0 43.6 70.1 52.2 56.4 63.3 62.6 64.8 69.828 76.2 89.4 87.5 81.5 72.7 70.7 44.8 57.1 70.6 66.5 66.8 65.629 77.4 90.0 52.8 66.4 69.4 60.4 62.5 76.8 45.1 55.3 60.030 79.9 92.5 57.9 52.3 75.5 47.7 65.0 67.5 71.8 53.2 45.131 81.2 81.4 63.7 29.2 62.4 52.1 62.8
Average 50.4 78.9 75.6 74.9 53.9 64.7 60.5 55.0 60.1 52.6 59.7 58.4
Note:Daily averages in s/KWh of each day
CD
EC
-SIN
G
50

0.0
0.2
0.4
0.6
0.8
1.0
1.2
Arica
110 k
V
Pozo Alm
onte
220 k
V
Lagu
nas 2
20 kV
Tarap
acá 2
20 kV
A 100 k
V
Crucero
220 k
V
Toco
pilla
220 k
V
Norgen
er 22
0 kV
Mejillo
nes 2
20 kV
Chaca
ya 22
0 KV
Atacam
a 220
kV
Mantos
Blanco
s 220
kV
Salta
345 k
V
Andes
220 k
V
Domey
ko 22
0 kV
POWER fACTOR PENALTY YEAR 2010
MONTHLY AVERAGE POWER fACTOR PENALTY YEAR 2010
Busbar Average Maximum MinimumArica 110 kV 1.00703 1.03865 0.99366Pozo Almonte 220 kV 1.04766 1.05637 1.04227Lagunas 220 kV 1.03440 1.04599 1.02982Tarapacá 220 kV 1.03138 1.04689 1.02640A 100 kV 1.03333 1.03561 1.03053Crucero 220 kV 1.00000 1.00000 1.00000Tocopilla 220 kV 0.95885 0.96994 0.94978Norgener 220 kV 0.97962 0.98466 0.96622Mejillones 220 kV 0.98319 1.02413 0.94314Chacaya 220 KV 0.98231 1.02360 0.94215Atacama 220 kV 0.97978 0.98788 0.96862Mantos Blancos 220 kV 1.01166 1.04124 0.97797Salta 345 kV 1.01290 1.06140 0.96352Andes 220 kV 1.03516 1.06600 1.00456Domeyko 220 kV 1.04595 1.07198 1.02252
Note: Average values for the weekly schedule.
Ann
ual R
epor
t Sta
tistic
s an
d O
per
atio
n
51

POWER PRICE POINT 220 kV NODE CRUCERO
Year Valid Power Price
Set Price From To ($/kW-month)
2001
Oct-00 01/01/01 05/03/01 3,581.24Apr-01 05/04/01 08/30/01 3,717.30Apr-01 (index Aug-01) 08/31/01 11/04/01 4,023.03Oct-01 11/05/01 12/31/01 4,407.20
2002Oct-01 01/01/02 05/03/02 4,407.20Apr-02 05/04/02 11/03/02 3,970.10Oct-02 11/04/02 12/31/02 4,132.90
2003Oct-02 01/01/03 05/04/03 4,132.90Apr-03 05/05/03 12/21/03 4,263.54Oct-03 12/22/03 12/31/03 3,895.71
2004
Oct-03 01/01/04 01/28/04 3,895.71Oct-03 (index Jan-04) 01/29/04 04/30/04 3,586.78Apr-04 05/01/04 10/31/04 3,637.22Oct-04 11/01/04 12/31/04 3,713.71
2005Oct-04 01/01/05 04/30/05 3,713.71Apr-05 05/01/05 10/31/05 3,696.46Oct-05 11/01/05 12/31/05 3,594.48
2006
Oct-05 01/01/06 04/30/06 3,594.48Apr-06 05/01/06 06/26/06 3,662.67Apr-06 (index Jun-06) 06/27/06 10/19/06 3,672.49Apr-06 (index Oct-06) 10/20/06 10/31/06 3,769.31Oct-06 11/01/06 12/31/06 3,734.15
2007
Oct-06 01/01/07 04/30/07 3,734.15Apr-07 05/01/07 07/16/07 3,840.04Apr-07 (index Jul-07) 07/17/07 09/15/07 3,795.11Apr-07 (index Sep-07) 09/16/07 10/31/07 3,792.04Oct-07 11/01/07 12/31/07 3,835.63
2008
Oct-07 01/01/08 02/15/08 3,835.63Oct-07 (index Feb-08) 02/16/08 04/30/08 3,692.18Apr-08 05/01/08 08/15/08 3,455.74Apr-08 (index Aug-08) 08/16/08 10/15/08 3,882.18Apr-08 (index Oct-08) 10/16/08 10/31/08 4,124.06Oct-08 11/01/08 12/31/08 4,198.66
2009
Oct-08 01/01/09 01/18/09 4,198.66Oct-08 (index Jan-09) 01/19/09 04/30/09 5,053.92Apr-09 05/01/09 08/15/09 5,054.71Apr-09 (index Aug-09) 08/16/09 10/31/09 4,762.80Oct-09 11/01/09 12/31/09 4,662.80
2010
Oct-09 01/01/10 04/15/10 4,662.80Oct-09 (index Apr-10) 04/16/10 04/30/10 4,571.04Apr-10 05/01/10 10/31/10 4,520.17Oct-10 11/01/10 12/31/10 4,373.28
CD
EC
-SIN
G
52

SING ANNUAL SALES EVOLUTION (GWH)
SING ANNUAL SALES Period 2001-2010
V. SING Energy Annual Sales 2001-2010
Sales (GWh) GrowthYear Free Regulated Total Annual Average Accumulated
Customers Customers Accumulated2001 8,046 945 8,991 0.0%2002 8,473 1,009 9,482 5.5% 2.7% 5.5%2003 9,433 1,047 10,480 10.5% 5.3% 16.6%2004 10,164 1,075 11,240 7.2% 5.8% 25.0%2005 10,401 1,159 11,560 2.8% 5.2% 28.6%2006 10,774 1,256 12,029 4.1% 5.0% 33.8%2007 11,343 1,332 12,674 5.4% 5.1% 41.0%2008 11,832 1,387 13,219 4.3% 5.0% 47.0%2009 12,240 1,417 13,656 3.3% 4.8% 51.9%2010 12,297 1,496 13,792 1.0% 4.4% 53.4%
Note: Cumulative percentage growth refers to sales for the year 2001 (8.991 GWh). Annual sales correspond to net less transmission losses.
0
3,000
6,000
9,000
12,000
15,000
Free Customers
2001 2002 2003 2004 2005 2006 2007 2008 2009 2010
Regulated CustomersA
nnua
l Rep
ort S
tatis
tics
and
Op
erat
ion
53

COMPOSITION Of SING ANNUAL SALES (GWh)
0
3,000
6,000
9,000
12,000
15,000
Own Production
2001 2002 2003 2004 2005 2006 2007 2008 2009 2010
Transfers Between Generators
COMPOSITION Of SING ANNUAL SALES Period 2001 - 2010
Year Energy Sales Own Generation Transfers between generators Transfer Percentage/Sales (GWh) (GWh) (GWh) (%)
2001 8,991 5,808 3,183 35%2002 9,482 6,299 3,183 34%2003 10,480 7,777 2,703 26%2004 11,240 8,407 2,832 25%2005 11,560 8,654 2,905 25%2006 12,029 9,332 2,698 22%2007 12,674 10,838 1,836 14%2008 13,219 11,513 1,706 13%2009 13,656 11,890 1,766 13%2010 13,792 12,154 1,639 12%
CD
EC
-SIN
G
54

ENERGY TRANSfER BETWEEN GENERATORS CDEC-SING (GWh)
Year 2010Company January February March April May June July August September October November December Total NET
CELTAPurchases 22.2 30.8 8.4 3.3 64.7Sales 10.8 1.5 7.3 10.7 18.2 9.1 11.6 15.9 85.1 20.4
E-CLPurchases 18.3 11.9 51.5 47.4 47.3 2.9 50.7 70.8 157.6 90.2 548.6 473.2Sales 23.9 51.5 75.4
ELECTROANDINAPurchases 83.7 60.5 14.3 158.5Sales 18.3 17.2 72.3 98.4 18.0 16.3 29.7 81.2 66.9 418.3 259.8
AES GENERPurchases 8.8 8.7 17.5Sales 124.7 100.4 122.9 110.1 104.3 36.9 18.4 81.5 117.5 19.3 836.0 818.5
GASATACAMAPurchases 120.5 78.3 112.3 94.8 109.8 83.7 77.9 30.5 22.0 65.2 795.0 775.1Sales 13.9 6.0 19.9
NORGENERPurchases 7.4 31.8 1.4 40.6Sales 14.9 21.9 24.0 14.6 34.8 10.0 20.1 5.1 4.8 150.2 109.6
INACALPurchasesSales 2.5 3.8 4.2 3.9 3.0 3.9 3.9 2.9 2.9 3.5 3.8 4.1 42.4 42.4
ANGAMOSPurchases 1.5 1.5 1.5Sales
ENORCHILEPurchases 2.0 2.4 1.9 3.0 2.9 12.2 6.7Sales 0.6 1.1 1.0 0.8 0.5 0.6 0.9 5.5
CAVANCHAPurchasesSales 1.2 1.3 2.5 2.5
ANDINAPurchasesSales 0.4 0.4 0.4
ENERNUEVASPurchasesSales 0.1 1.4 1.4 2.9 2.9
Note: The amounts shown do not include transactions of sale contract between the generations
AES Gener 65.1%
Electroandina 20.7%
Norgener 8.7%
Inacal 3.4%
Celta 1.6%
Enernuevas 0.2%
Cavancha 0.2%
Andina 0.0%
GasAtacama 61.7%
E-CL 37.7%
Enorchile 0.5%
Angamos 0.1%NET PURCHASES
Of ENERGY IN CDEC
NET SALES Of ENERGY IN CDEC
VI. Energy and Power Transfers SING 2001-2010
Ann
ual R
epor
t Sta
tistic
s an
d O
per
atio
n
55
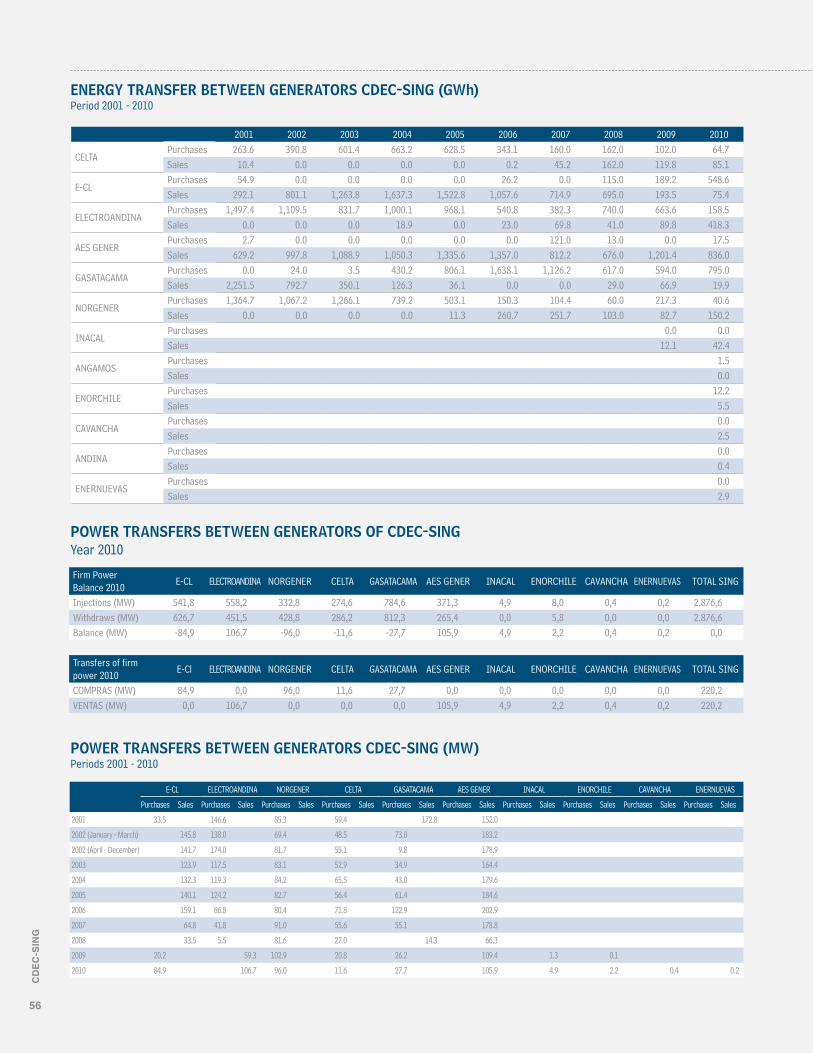
ENERGY TRANSfER BETWEEN GENERATORS CDEC-SING (GWh)Period 2001 - 2010
POWER TRANSfERS BETWEEN GENERATORS CDEC-SING (MW)Periods 2001 - 2010
POWER TRANSfERS BETWEEN GENERATORS Of CDEC-SING Year 2010
2001 2002 2003 2004 2005 2006 2007 2008 2009 2010
CELTAPurchases 263.6 390.8 601.4 663.2 628.5 343.1 160.0 162.0 102.0 64.7Sales 10.4 0.0 0.0 0.0 0.0 0.2 45.2 162.0 119.8 85.1
E-CLPurchases 54.9 0.0 0.0 0.0 0.0 26.2 0.0 115.0 189.2 548.6Sales 292.1 801.1 1,263.8 1,637.3 1,522.8 1,057.6 714.9 695.0 193.5 75.4
ELECTROANDINAPurchases 1,497.4 1,109.5 831.7 1,000.1 968.1 540.8 382.3 740.0 663.6 158.5Sales 0.0 0.0 0.0 18.9 0.0 23.0 69.8 41.0 89.8 418.3
AES GENERPurchases 2.7 0.0 0.0 0.0 0.0 0.0 121.0 13.0 0.0 17.5Sales 629.2 997.8 1,088.9 1,050.3 1,335.6 1,357.0 812.2 676.0 1,201.4 836.0
GASATACAMAPurchases 0.0 24.0 3.5 430.2 806.1 1,638.1 1,126.2 617.0 594.0 795.0Sales 2,251.5 792.7 350.1 126.3 36.1 0.0 0.0 29.0 66.9 19.9
NORGENERPurchases 1,364.7 1,067.2 1,266.1 739.2 503.1 150.3 104.4 60.0 217.3 40.6Sales 0.0 0.0 0.0 0.0 11.3 260.7 251.7 103.0 82.7 150.2
INACALPurchases 0.0 0.0Sales 12.1 42.4
ANGAMOSPurchases 1.5Sales 0.0
ENORCHILEPurchases 12.2Sales 5.5
CAVANCHAPurchases 0.0Sales 2.5
ANDINAPurchases 0.0Sales 0.4
ENERNUEVASPurchases 0.0Sales 2.9
Firm Power Balance 2010
E-CL ELECTROANDINA NORGENER CELTA GASATACAMA AES GENER INACAL ENORCHILE CAVANCHA ENERNUEVAS TOTAL SING
Injections (MW) 541,8 558,2 332,8 274,6 784,6 371,3 4,9 8,0 0,4 0,2 2.876,6Withdraws (MW) 626,7 451,5 428,8 286,2 812,3 265,4 0,0 5,8 0,0 0,0 2.876,6Balance (MW) -84,9 106,7 -96,0 -11,6 -27,7 105,9 4,9 2,2 0,4 0,2 0,0
Transfers of firm power 2010
E-Cl ELECTROANDINA NORGENER CELTA GASATACAMA AES GENER INACAL ENORCHILE CAVANCHA ENERNUEVAS TOTAL SING
COMPRAS (MW) 84,9 0,0 96,0 11,6 27,7 0,0 0,0 0,0 0,0 0,0 220,2VENTAS (MW) 0,0 106,7 0,0 0,0 0,0 105,9 4,9 2,2 0,4 0,2 220,2
E-CL ELECTROANDINA NORGENER CELTA GASATACAMA AES GENER INACAL ENORCHILE CAVANCHA ENERNUEVAS
Purchases Sales Purchases Sales Purchases Sales Purchases Sales Purchases Sales Purchases Sales Purchases Sales Purchases Sales Purchases Sales Purchases Sales
2001 33.5 146.6 85.3 59.4 172.8 152.0
2002 (January - March) 145.8 138.0 69.4 48.5 73.0 183.2
2002 (April - December) 141.7 174.0 81.7 55.1 9.8 178.9
2003 123.9 117.5 83.1 52.9 34.9 164.4
2004 132.3 119.3 84.2 65.5 43.0 179.6
2005 140.1 124.2 82.7 56.4 61.4 184.6
2006 159.1 86.8 80.4 71.8 122.9 202.9
2007 64.8 41.8 91.0 55.6 55.1 178.8
2008 33.5 5.5 81.6 27.0 14.3 66.3
2009 20.2 59.3 102.9 20.8 26.2 109.4 1.3 0.1
2010 84.9 106.7 96.0 11.6 27.7 105.9 4.9 2.2 0.4 0.2
CD
EC
-SIN
G
56
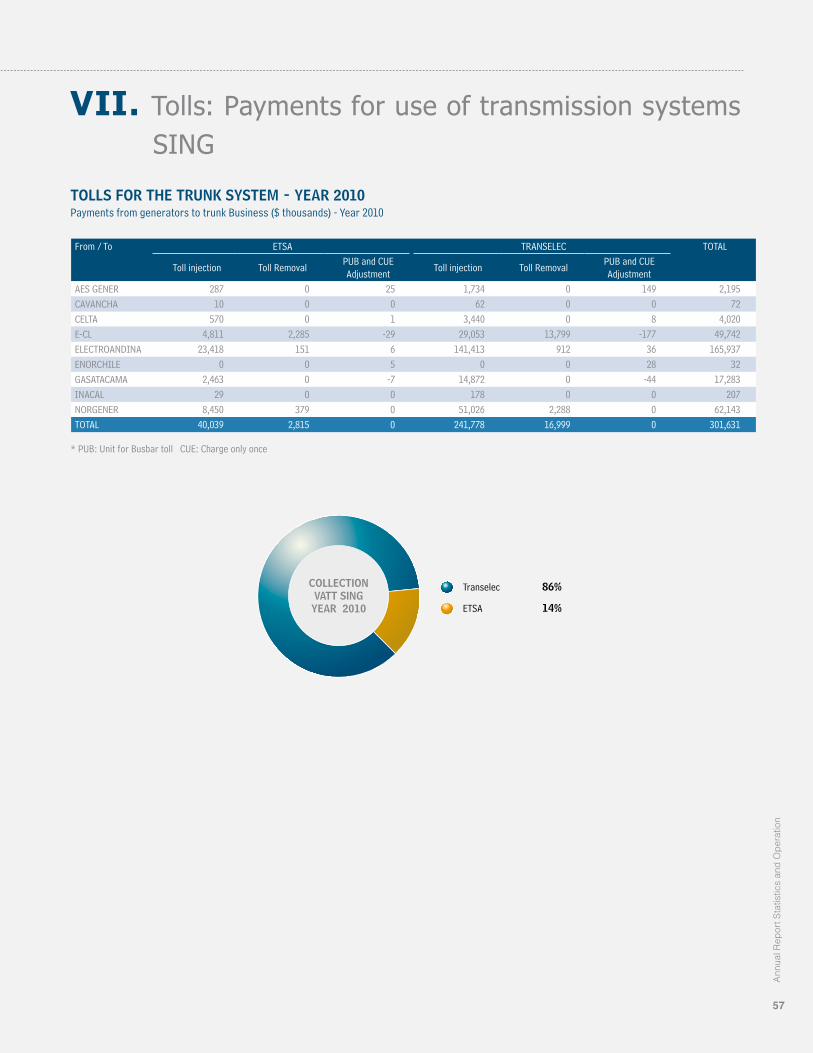
TOLLS fOR THE TRUNk SYSTEM - YEAR 2010Payments from generators to trunk Business ($ thousands) - Year 2010
VII. Tolls: Payments for use of transmission systems SING
From / To ETSA TRANSELEC TOTAL
Toll injection Toll RemovalPUB and CUE Adjustment
Toll injection Toll RemovalPUB and CUE Adjustment
AES GENER 287 0 25 1,734 0 149 2,195CAVANCHA 10 0 0 62 0 0 72CELTA 570 0 1 3,440 0 8 4,020E-CL 4,811 2,285 -29 29,053 13,799 -177 49,742ELECTROANDINA 23,418 151 6 141,413 912 36 165,937ENORCHILE 0 0 5 0 0 28 32GASATACAMA 2,463 0 -7 14,872 0 -44 17,283INACAL 29 0 0 178 0 0 207NORGENER 8,450 379 0 51,026 2,288 0 62,143TOTAL 40,039 2,815 0 241,778 16,999 0 301,631
* PUB: Unit for Busbar toll CUE: Charge only once
Transelec 86%
ETSA 14%
COLLECTION VATT SING YEAR 2010
Ann
ual R
epor
t Sta
tistic
s an
d O
per
atio
n
57

Payments from Sub transmitters to generators by Energy and power losses. r ($ thousands) - Year 2010
From / To E-CL ELECTROANDINA GASATACAMA NORGENER AES GENER Total ALTO NORTE 1,406 69 5,017 208 28 6,729E-CL 49,846 2,247 174,024 6,700 438 233,255TRANSELEC NORTE 55,582 2,875 199,137 8,074 2,541 268,208TRANSEMEL 198,368 8,806 710,739 23,008 4,672 945,593Total 305,203 13,997 1,088,916 37,990 7,678 1,453,785
Transemel 65.04%
Transelec Norte 18.45%
Edelnor 16.04%
Alto Norte 0.46%
PAYMENTS fOR LOSS Of ENERGY
AND POWER - YEAR 2010
TOLLS fOR THE SUBSTRANSMISSION SYSTEM - 2010
VASTx payments from generators to Subtransmission ($ thousands) - Year 2010
Transelec Norte 29.95%
E-CL 29.91%
Transemel 18.39%
Elecda 10.12%
Eliqsa 5.66%
Emelari 4.94%
Alto Norte 0.98%
Codelco Norte 0.04%
From / To AES GENER E-CL ELECTROANDINA GASATACAMA ENORCHILE NORGENER TOTALALTO NORTE 742 18,071 186 124,050 3,406 25 146,480CODELCO NORTE 33 813 8 5,583 153 1 6,593E-CL 22,702 552,956 5,706 3,795,859 104,222 770 4,482,214ELECDA 7,682 187,106 1,931 1,284,417 35,266 260 1,516,662ELIQSA 4,294 104,600 1,079 718,046 19,715 146 847,881EMELARI 3,752 91,385 943 627,331 17,224 127 740,762TRANSELEC NORTE 22,730 553,657 5,713 3,800,668 104,354 771 4,487,893TRANSEMEL 13,954 339,898 3,507 2,333,284 64,064 473 2,755,181Total 75,889 1,848,486 19,074 12,689,238 348,405 2,573 14,983,666
VASTX COLLECTION YEAR
2010
CD
EC
-SIN
G
58

VIII. Energy and Power Demand SING 2001-2010
Year Gross Generation [GWh] Growth Rate2001 9,852 0.02002 10,400 5.6%2003 11,424 9.9%2004 12,330 7.9%2005 12,657 2.7%2006 13,236 4.6%2007 13,946 5.4%2008 14,502 4.0%2009 14,907 2.8%2010 15,104 1.3%
ENERGY
SING GROSS GENERATION Of ENERGY (GWh)Period 2001 - 2010
ANNUAL DEMAND Of SING Period 2001 - 2010
0
2,000 1.5%
3.0%
4.5%
6.0%
7.5%
9.0%
10.5%
12.0%
4,000
6,000
8,000
10,000
12,000
14,000
16,000
Gross Generation Growth Rate
2001 2002 2003 2004 2005 2006 2007 2008 2009 2010
Year Day Hour Maximum Gross Production (MW) Maximum Net Demand (MW)2001 05-Nov-01 22 1,281 1,2212002 23-Dec-02 22 1,420 1,3602003 14-Dec-03 22 1,467 1,4162004 19-Dec-04 23 1,644 1,5672005 27-Nov-05 22 1,635 1,5662006 15-Dec-06 23 1,770 1,6762007 24-Apr-07 22 1,751 1,6652008 21-Dec-08 22 1,897 1,8052009 27-Sep-09 22 1,907 1,8162010 26-Dec-10 23 1,995 1,900
Note:Gross peak demand is obtained as the gross production minus own consumption of plants.
Ann
ual R
epor
t Sta
tistic
s an
d O
per
atio
n
59

MAXIMUM ANNUAL GROSS PRODUCTION (MW)
0
500
1,000
1,500
2,000
2001 2002 2003 2004 2005 2006 2007 2008 2009 2010
CD
EC
-SIN
G
60

Gross Average Hourly Generation 2010. April-June
1,600
1,650
1,700
1,750
1,800
1,850
1,900
MW
Hour1 2 3 4 5 6 7 8 9 10 11 12 13 14 15 16 17 18 19 20 21 22 23 24
Monday Tuesday-Friday Saturday Sunday
GENERATION/GROSS HOURLY DEMAND. SING TYPICALLY DAILY CURVES YEAR 2010
Gross Average Hourly Generation 2010. January-March
1,600
1,650
1,700
1,750
1,800
1,850
1,900
MW
Hour1 2 3 4 5 6 7 8 9 10 11 12 13 14 15 16 17 18 19 20 21 22 23 24
Monday Tuesday-Friday Saturday Sunday
Ann
ual R
epor
t Sta
tistic
s an
d O
per
atio
n
61

Gross Average Hourly Generation 2010. July-September
Gross Average Hourly Generation 2010. October-December
1,600
1,650
1,700
1,750
1,800
1,850
1,900
MW
Hour1 2 3 4 5 6 7 8 9 10 11 12 13 14 15 16 17 18 19 20 21 22 23 24
Monday Tuesday-Friday Saturday Sunday
1,600
1,650
1,700
1,750
1,800
1,850
1,900
MW
Hour1 2 3 4 5 6 7 8 9 10 11 12 13 14 15 16 17 18 19 20 21 22 23 24
Monday Tuesday-Friday Saturday Sunday
CD
EC
-SIN
G
62
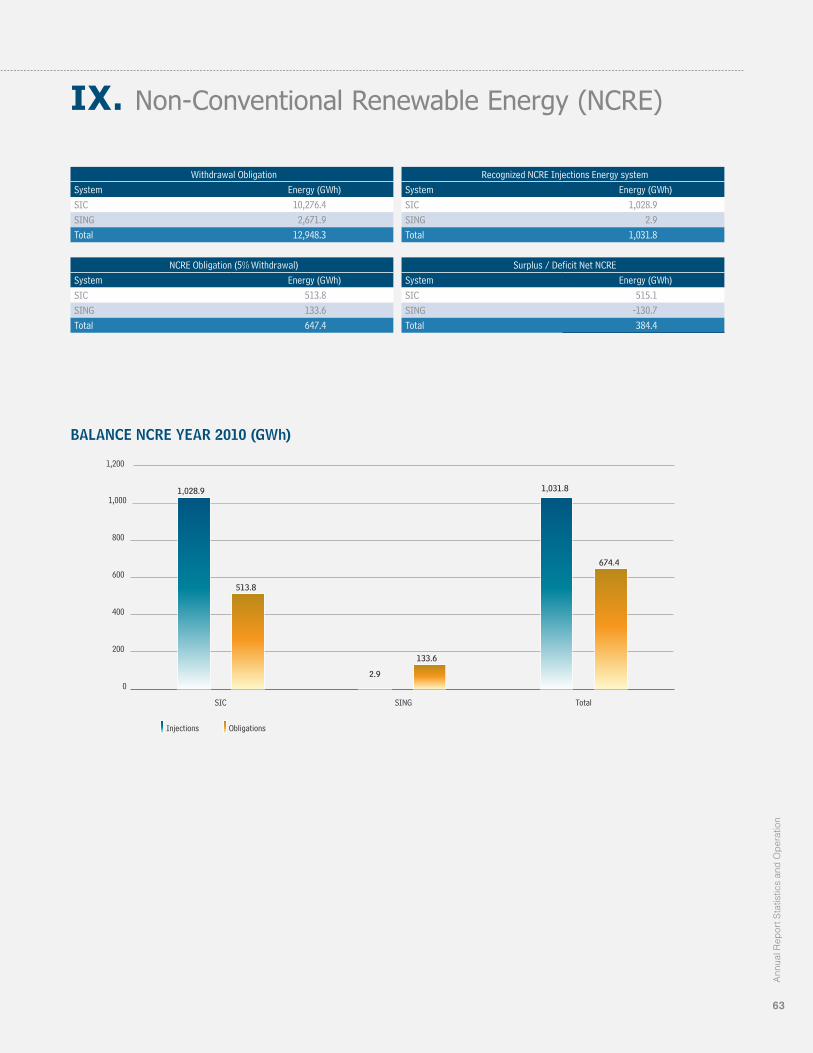
IX. Non-Conventional Renewable Energy (NCRE)
Withdrawal ObligationSystem Energy (GWh)SIC 10,276.4SING 2,671.9Total 12,948.3
NCRE Obligation (5% Withdrawal) System Energy (GWh)SIC 513.8SING 133.6Total 647.4
0
200
400
600
800
1,000
1,200
SIC
1,028.9
513.8
2.9
133.6
1,031.8
674.4
SING Total
Injections Obligations
BALANCE NCRE YEAR 2010 (GWh)
Recognized NCRE Injections Energy systemSystem Energy (GWh)SIC 1,028.9SING 2.9Total 1,031.8
Surplus / Deficit Net NCRESystem Energy (GWh)SIC 515.1SING -130.7Total 384.4
Ann
ual R
epor
t Sta
tistic
s an
d O
per
atio
n
63

X. CDEC-SING BudgetBudget CDEC-SING Ltda.(Thousand UF) 2010 2009 Variation (Thousands UF) Variation %Administration Expenses 7,1 6,5 0,6 9,5%Other charges 18,8 18,6 0,1 0,6%Operational Costs 93,8 77,7 16,1 20,7%
Salaries and others 63,2 57,8 5,4 9,3%Office rent and expenses 7,8 7,1 0,7 9,6%Services and Contractors 2,7 2,2 0,5 22,6%Equipment rent, Software and Services 20,1 10,5 9,5 90,3%
Total 120 103 17 16,33%
0
20
40
60
80
100
Administration Expenses Other charges Operational Costs
2010 2009
Electroandina 15.4%
Norgener 14.4%
E-Cl 12.0%
Escondida 10.6%
Gasatacama 8.7%
Celta 6.7%
Aes Gener 6.0%
Codelco Norte 5.1%
Transelec 4.1%
Collahuasi 3.1%
SQM 1.7%
Zaldivar 1.5%
Spence 1.0%
Others 10.0%
BUDGET CDEC-SING LTDA. (THOUSANDS Of Uf)
BUDGET MEMBERS SHARE CDEC-SING
Note: Only individual members of the CDEC-SING with more than 1% share.
CD
EC
-SIN
G
64

Chapter 1. ................................................. 4
Chapter 2. ................................................ 6
Chapter 3. ................................................. 9
Chapter 4. .............................................. 13
Chapter 5. ............................................... 19
Chapter 6. ............................................... 21
Chapter 7. ................................................ 27
Chapter 8. .............................................. 31
Chapter 9. ............................................... 39
Letter from the president of the Board of directors
Letter from the executive director
2010 energy environment
Who are We?
Board of Directors .......................................15
CDEC-SING Departments ............................16
CdeC-sinG: mission, Vision and Values
management operation CdeC-sinG 2010
sinG projects: 2010 finished projects 2011 future projects
Major Projects in 2010 .......................28
2011 Sing Planned Projects . ............29
sinG facilities and Clients
Simplified Sing Line Diagram .............32
SING 2010 Generation Units ...............33
SING 2010 Transmission Lines ...........34
Major SING customers in 2010 ........... 37
2010 operation statistics
I. SING: Generation Installed Capacity ........40
II. SING: Energy Generation ........................41
III. Fuel: Consumption and Prices SING 2001-2010 ................................................ 46
IV. Energy and power prices. ........................49
V. Sing Energy Annual Sales 2001-2010 .. . . . .53
VI. Energy and Power Transfers SING 2001-2010 ...................................................55
VII. Tolls: Payments for use of transmission systems SING ........................................ 57
VIII. Energy and Power Demand SING 2001-2010 ............................................ 59
IX. Non-Conventional Renewable Energy (NCRE) .....................................................63
X. CDEC-SING Budget ....................................64
Contents
Design & Production LEADERS S.A.

Anu
ario
201
0 y
Est
adís
ticas
de
Ope
raci
ón
CDEC-SING
Center for eConomiC Load dispatCh of northern interConneCted system
Avenida Apoquindo 4501, Office 603-604, Las Condes, Santiago Chile, Phone: 56 (2) 367 2400, Fax: 378 9296Visit us: www.cdec-sing.cl
CE
NTR
O D
E D
ES
PAC
HO
EC
ON
ÓM
ICO
DE
CA
RG
A D
EL
SIS
TEM
A IN
TER
CO
NE
CTA
DO
DE
L N
OR
TE G
RA
ND
E
CDEC-SING
CDEC-SING
Annual Report
OperationStatistics and