Embed Size (px)
Citation preview
1
The 14th China International Petroleum & Petrochemical
Technology and Equipment Exhibition
The 14th China International Offshore Oil & Gas Exhibition
The 14th China International Explosion Protection
Electric Technology & Equipment Exhibition
The 14th China International Exhibition on Equipment of
Pipeline and Oil & Gas Storage and Transportation
China International Marine Technology & Equipment Exhibition
China International Shale Gas Technology and Equipment Exhibition
Visitors Data Analysis Report
Beijing Zhenwei Exhibition Co., Ltd. Date:May. 10 2014
Beijing Zhenwei Exhibition Co., Ltd.
This file contains confidential exhibition information belonging to Beijing Zhenwei, while the ideas, structure to express this information belong to Zhenwei Expo. So it is only intended for correlated personnel. Without Zhenwei Expo’s approval in written, the file cannot be provided to third party irrelevant to this exhibition.
2
1. Concept definition A. Region division: In this document, we use the following parts to clearly define the
source of the visitors:
North China: Beijing, Tianjin, Hebei, Shaanxi, Inner Mongolia
East China: Shanghai, Zhejiang, Jiangsu ,Anhui, Shandong,Jiangxi, Fujian
South China: Guangdong,Guangxi, Hainan
Southwest China: Sichuan, Chongqing, Yunnan, Guizhou, Tibet
Northwest China: Shanxi, Gansu, Ningxia, Qinghai , Xinjiang
Northeast China: Jilin, Liaoning and Heilongjiang
Central China: Hunan Hubei Henan
B. We use the following items to describe the Visitors’ arrival situation:
Total arrival times of the visitors
Total arrival number of the visitors: This is the total number of the visitors, less than total arrival times.
Total new arrival number: the intraday new registered visitors
New arrival proportion
C. We use the following items to describe the position items:
Decision maker, Manager, Staff, Not specify
D. We use the following items to describe the department items:
Management, Sales, Purchase, Technology, Service
3
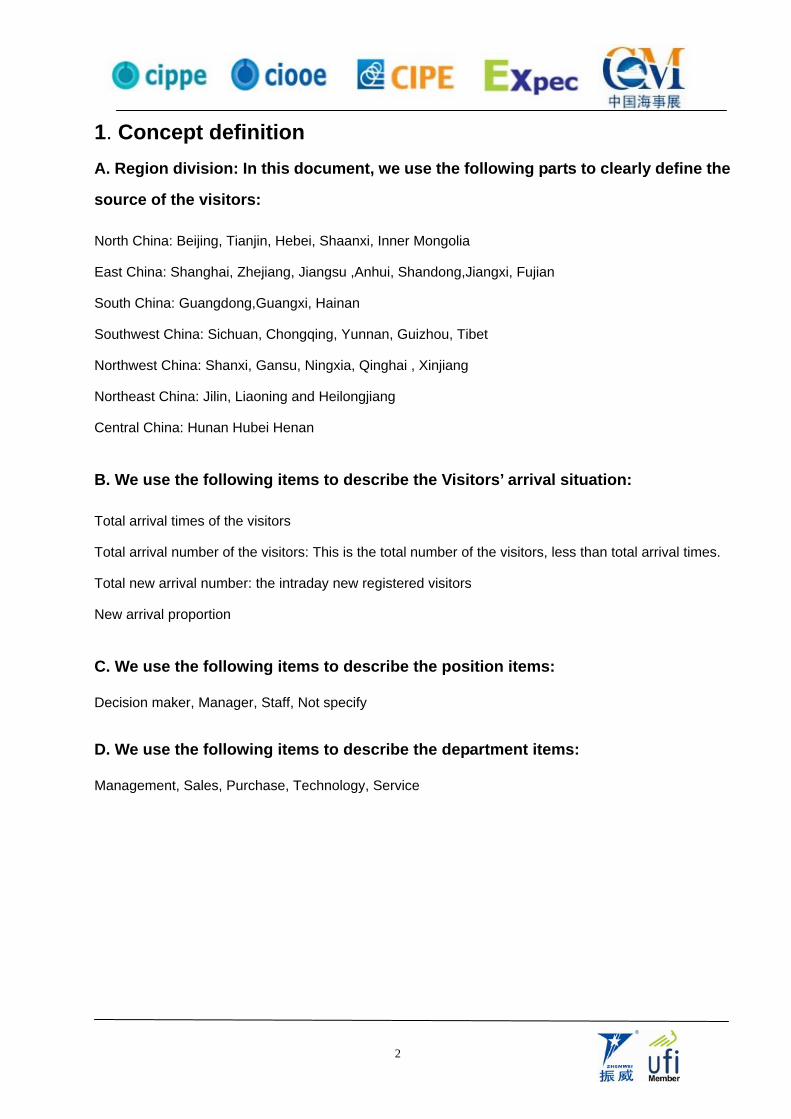
2. Overview
A. The arrival situation of everyday:
Data Total arrive times
Total arrive visitors
Total New arrive visitors
Percentage of new arrive
2014-3-19 35814 25105 25105 100.00%
2014-3-20 21242 18857 15800 75.94%
2014-3-21 8759 5555 5099 59.04%
Total 65815 49517 46004 85.56%
2014-3-1956.01%
2014-3-2036.20%
2014-3-217.78%
2014-3-19
2014-3-20
2014-3-21
4
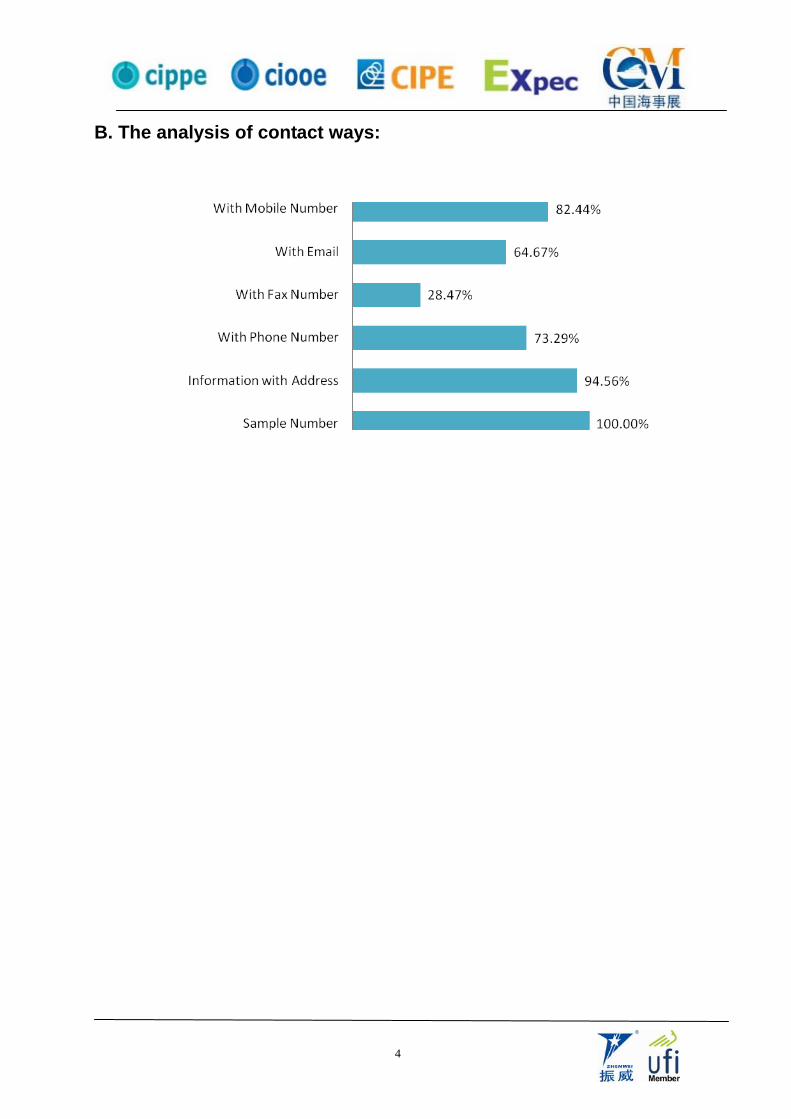
B. The analysis of contact ways:
5
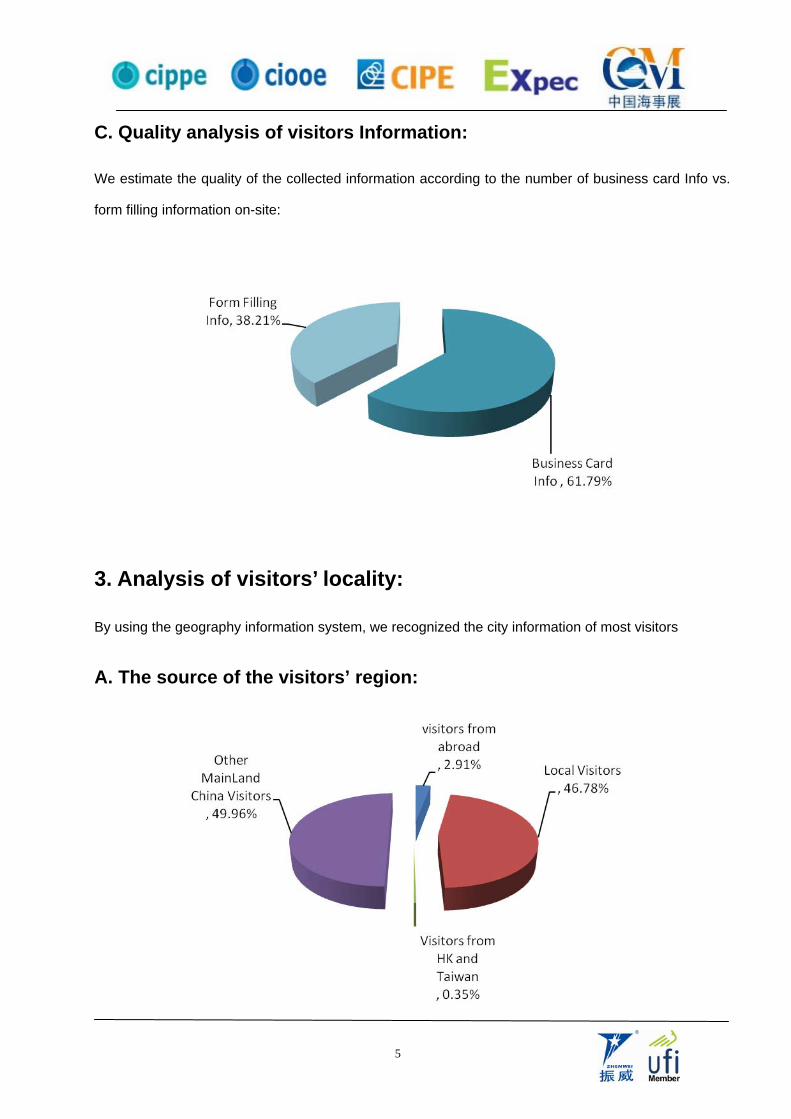
C. Quality analysis of visitors Information:
We estimate the quality of the collected information according to the number of business card Info vs.
form filling information on-site:
3. Analysis of visitors’ locality:
By using the geography information system, we recognized the city information of most visitors
A. The source of the visitors’ region:
6
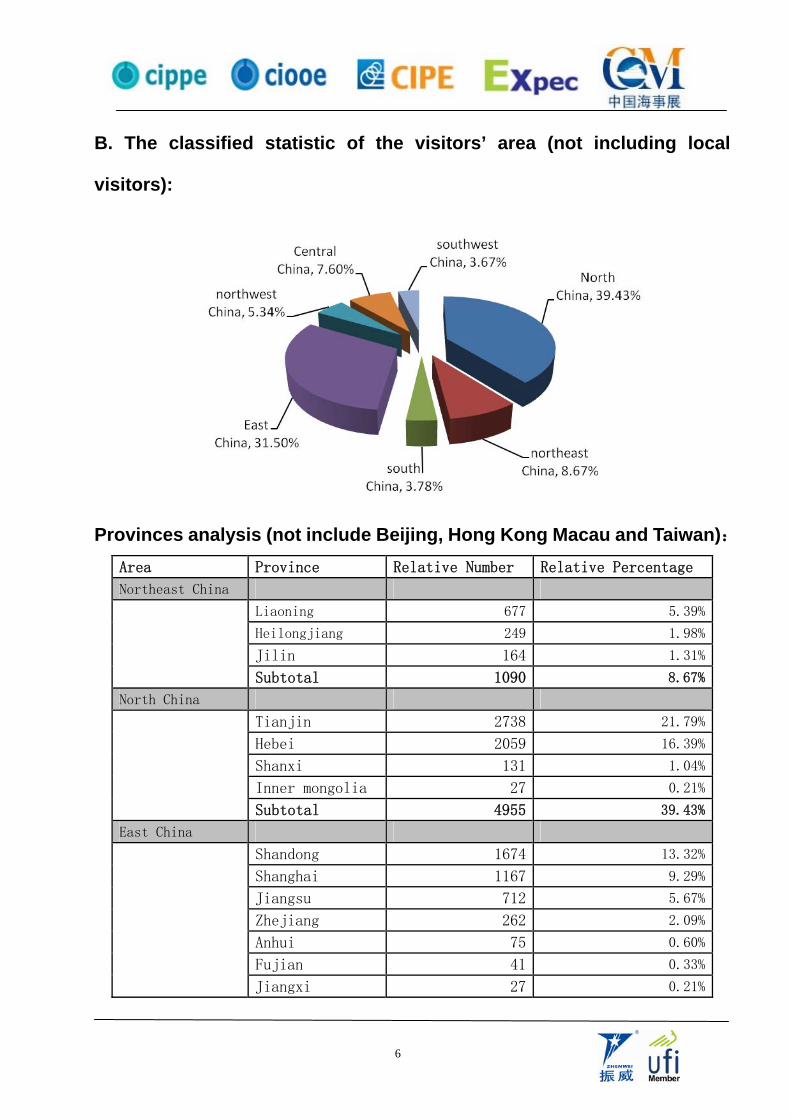
B. The classified statistic of the visitors’ area (not including local
visitors):
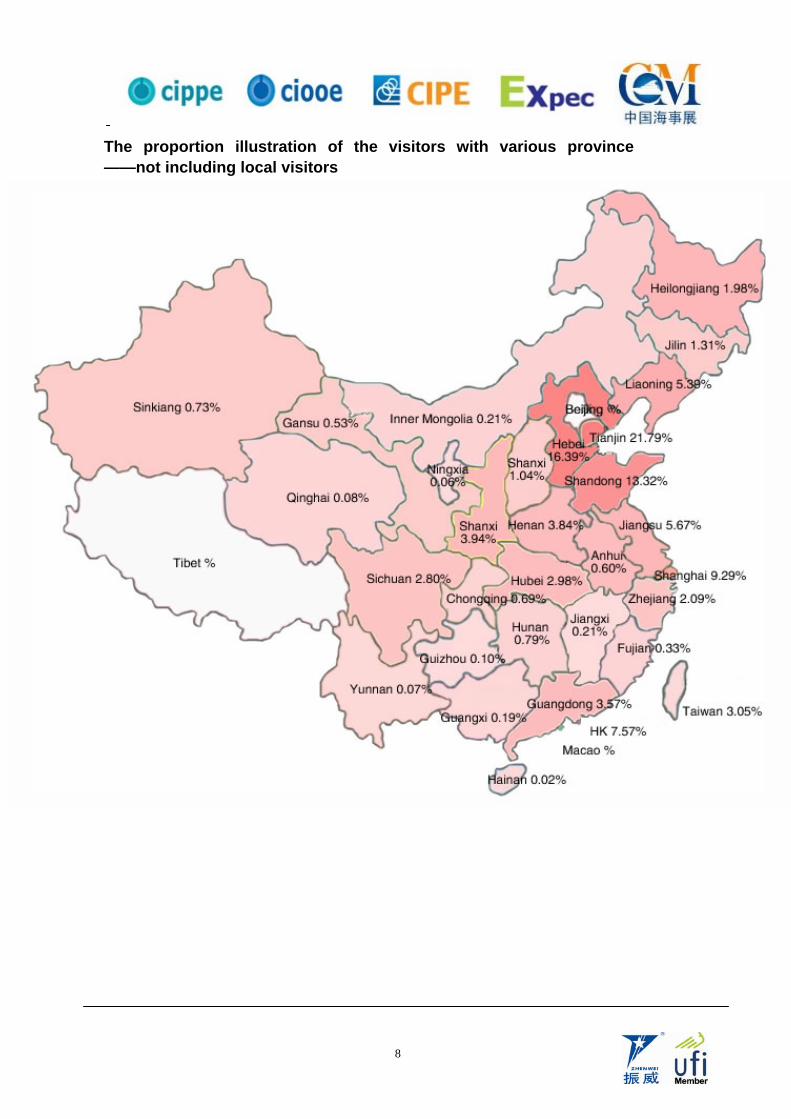
Provinces analysis (not include Beijing, Hong Kong Macau and Taiwan): Area Province Relative Number Relative Percentage
Northeast China
Liaoning 677 5.39%
Heilongjiang 249 1.98%
Jilin 164 1.31%
Subtotal 1090 8.67%
North China
Tianjin 2738 21.79%
Hebei 2059 16.39%
Shanxi 131 1.04%
Inner mongolia 27 0.21%
Subtotal 4955 39.43%
East China
Shandong 1674 13.32%
Shanghai 1167 9.29%
Jiangsu 712 5.67%
Zhejiang 262 2.09%
Anhui 75 0.60%
Fujian 41 0.33%
Jiangxi 27 0.21%
7
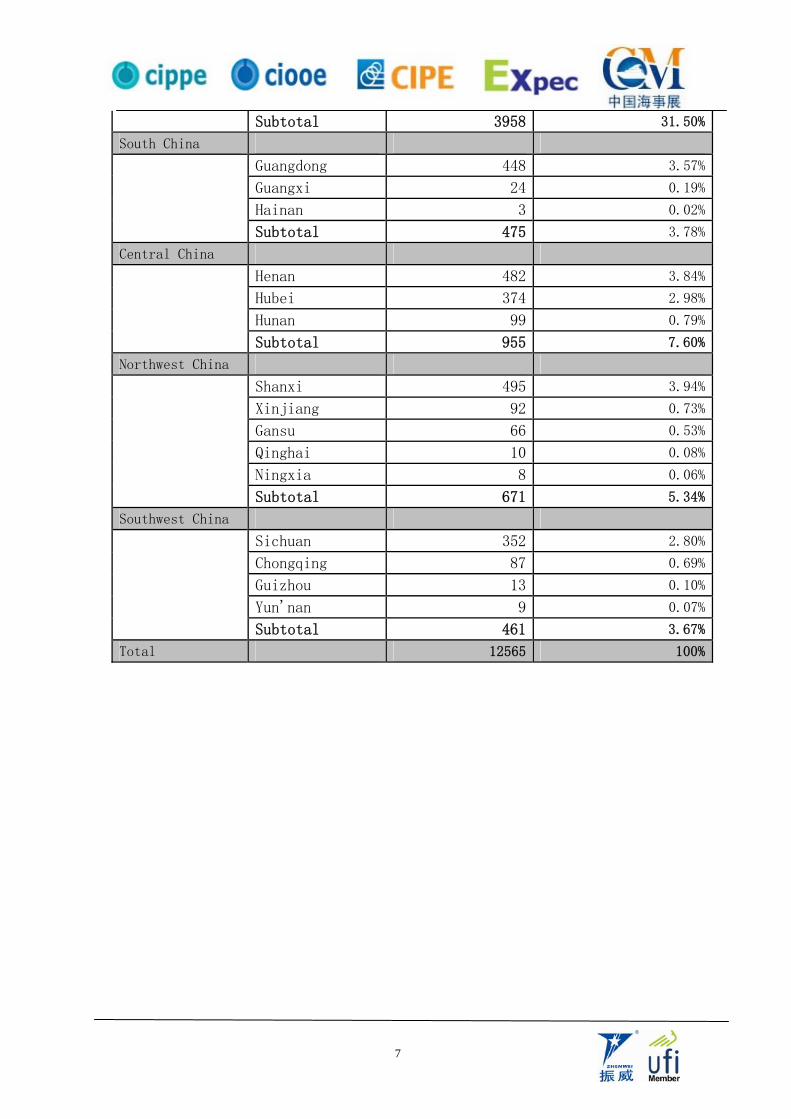
Subtotal 3958 31.50%
South China
Guangdong 448 3.57%
Guangxi 24 0.19%
Hainan 3 0.02%
Subtotal 475 3.78%
Central China
Henan 482 3.84%
Hubei 374 2.98%
Hunan 99 0.79%
Subtotal 955 7.60%
Northwest China
Shanxi 495 3.94%
Xinjiang 92 0.73%
Gansu 66 0.53%
Qinghai 10 0.08%
Ningxia 8 0.06%
Subtotal 671 5.34%
Southwest China
Sichuan 352 2.80%
Chongqing 87 0.69%
Guizhou 13 0.10%
Yun'nan 9 0.07%
Subtotal 461 3.67%
Total 12565 100%
8
The proportion illustration of the visitors with various province ——not including local visitors
9
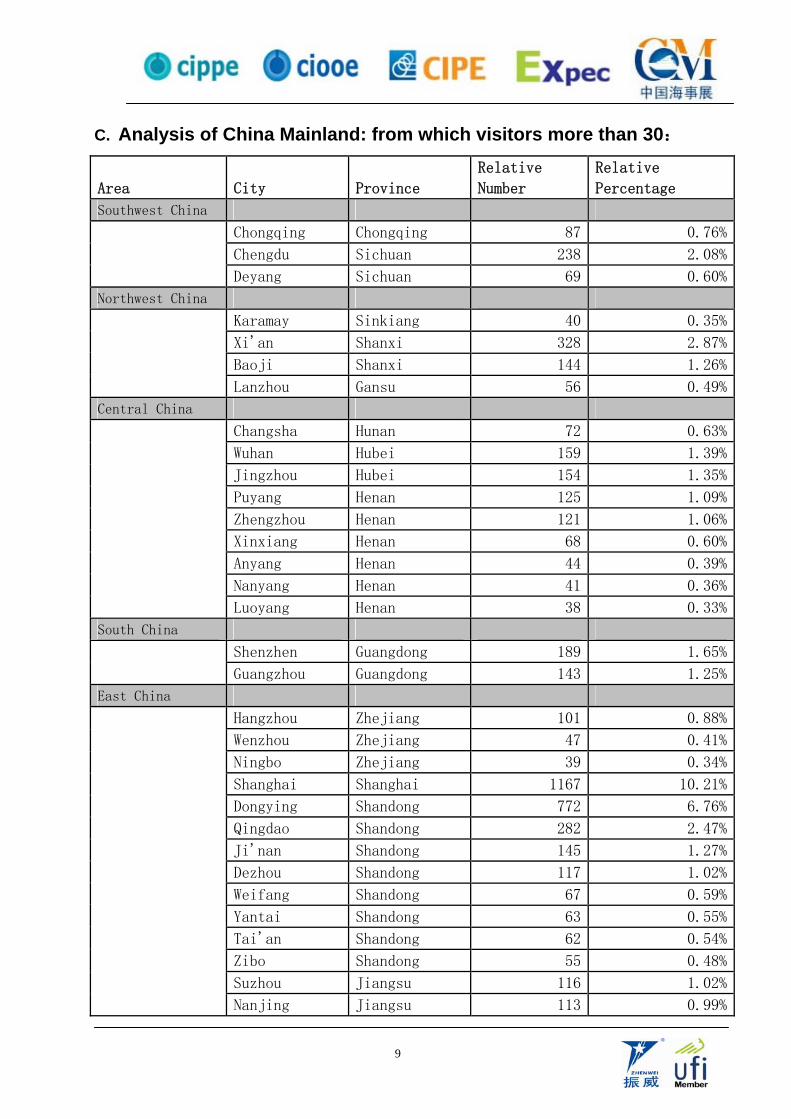
C. Analysis of China Mainland: from which visitors more than 30:
Area City Province
Relative
Number
Relative
Percentage
Southwest China
Chongqing Chongqing 87 0.76%
Chengdu Sichuan 238 2.08%
Deyang Sichuan 69 0.60%
Northwest China
Karamay Sinkiang 40 0.35%
Xi'an Shanxi 328 2.87%
Baoji Shanxi 144 1.26%
Lanzhou Gansu 56 0.49%
Central China
Changsha Hunan 72 0.63%
Wuhan Hubei 159 1.39%
Jingzhou Hubei 154 1.35%
Puyang Henan 125 1.09%
Zhengzhou Henan 121 1.06%
Xinxiang Henan 68 0.60%
Anyang Henan 44 0.39%
Nanyang Henan 41 0.36%
Luoyang Henan 38 0.33%
South China
Shenzhen Guangdong 189 1.65%
Guangzhou Guangdong 143 1.25%
East China
Hangzhou Zhejiang 101 0.88%
Wenzhou Zhejiang 47 0.41%
Ningbo Zhejiang 39 0.34%
Shanghai Shanghai 1167 10.21%
Dongying Shandong 772 6.76%
Qingdao Shandong 282 2.47%
Ji'nan Shandong 145 1.27%
Dezhou Shandong 117 1.02%
Weifang Shandong 67 0.59%
Yantai Shandong 63 0.55%
Tai'an Shandong 62 0.54%
Zibo Shandong 55 0.48%
Suzhou Jiangsu 116 1.02%
Nanjing Jiangsu 113 0.99%
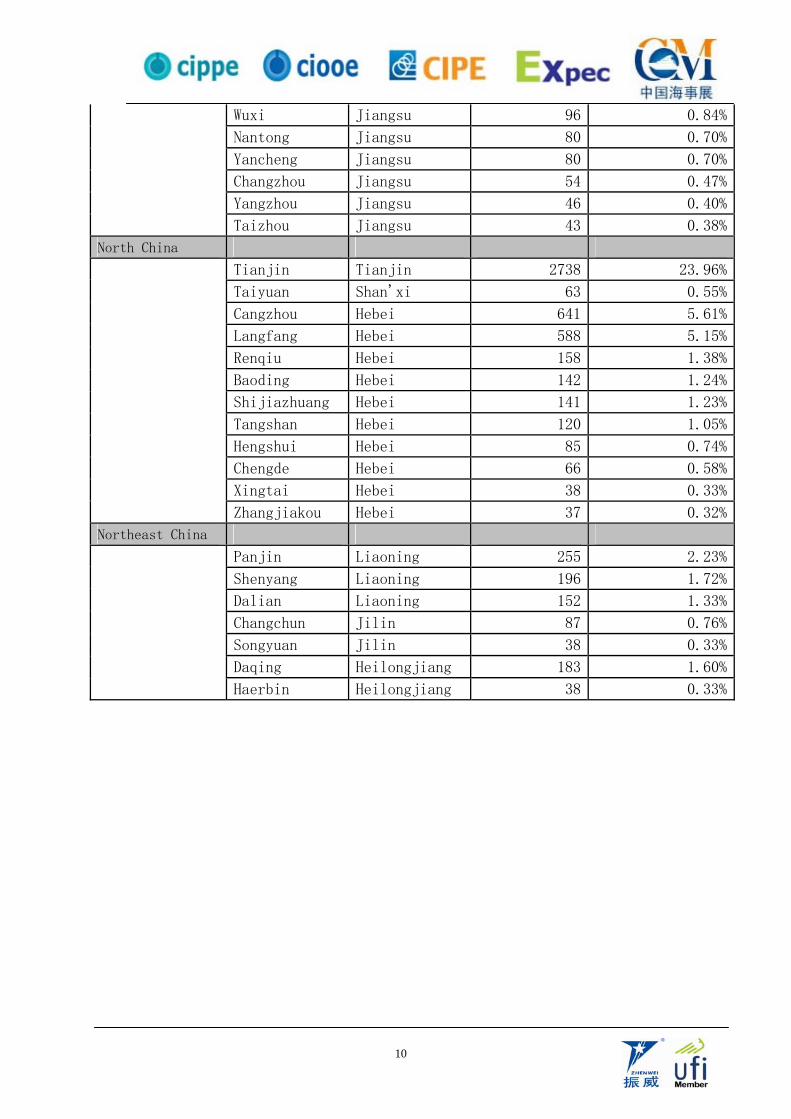
10
Wuxi Jiangsu 96 0.84%
Nantong Jiangsu 80 0.70%
Yancheng Jiangsu 80 0.70%
Changzhou Jiangsu 54 0.47%
Yangzhou Jiangsu 46 0.40%
Taizhou Jiangsu 43 0.38%
North China
Tianjin Tianjin 2738 23.96%
Taiyuan Shan'xi 63 0.55%
Cangzhou Hebei 641 5.61%
Langfang Hebei 588 5.15%
Renqiu Hebei 158 1.38%
Baoding Hebei 142 1.24%
Shijiazhuang Hebei 141 1.23%
Tangshan Hebei 120 1.05%
Hengshui Hebei 85 0.74%
Chengde Hebei 66 0.58%
Xingtai Hebei 38 0.33%
Zhangjiakou Hebei 37 0.32%
Northeast China
Panjin Liaoning 255 2.23%
Shenyang Liaoning 196 1.72%
Dalian Liaoning 152 1.33%
Changchun Jilin 87 0.76%
Songyuan Jilin 38 0.33%
Daqing Heilongjiang 183 1.60%
Haerbin Heilongjiang 38 0.33%
11
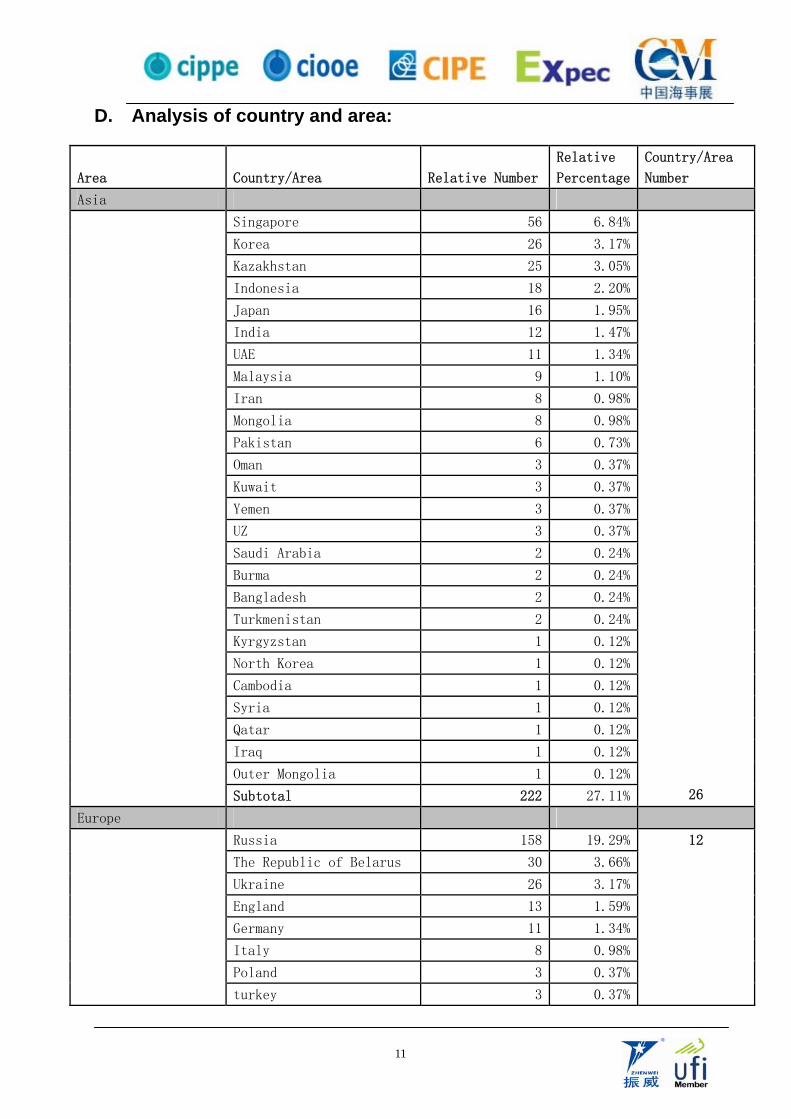
D. Analysis of country and area:
Area Country/Area Relative Number
Relative
Percentage
Country/Area
Number
Asia
Singapore 56 6.84%
Korea 26 3.17%
Kazakhstan 25 3.05%
Indonesia 18 2.20%
Japan 16 1.95%
India 12 1.47%
UAE 11 1.34%
Malaysia 9 1.10%
Iran 8 0.98%
Mongolia 8 0.98%
Pakistan 6 0.73%
Oman 3 0.37%
Kuwait 3 0.37%
Yemen 3 0.37%
UZ 3 0.37%
Saudi Arabia 2 0.24%
Burma 2 0.24%
Bangladesh 2 0.24%
Turkmenistan 2 0.24%
Kyrgyzstan 1 0.12%
North Korea 1 0.12%
Cambodia 1 0.12%
Syria 1 0.12%
Qatar 1 0.12%
Iraq 1 0.12%
Outer Mongolia 1 0.12%
Subtotal 222 27.11% 26
Europe
Russia 158 19.29%
The Republic of Belarus 30 3.66%
Ukraine 26 3.17%
England 13 1.59%
Germany 11 1.34%
Italy 8 0.98%
Poland 3 0.37%
turkey 3 0.37%
12
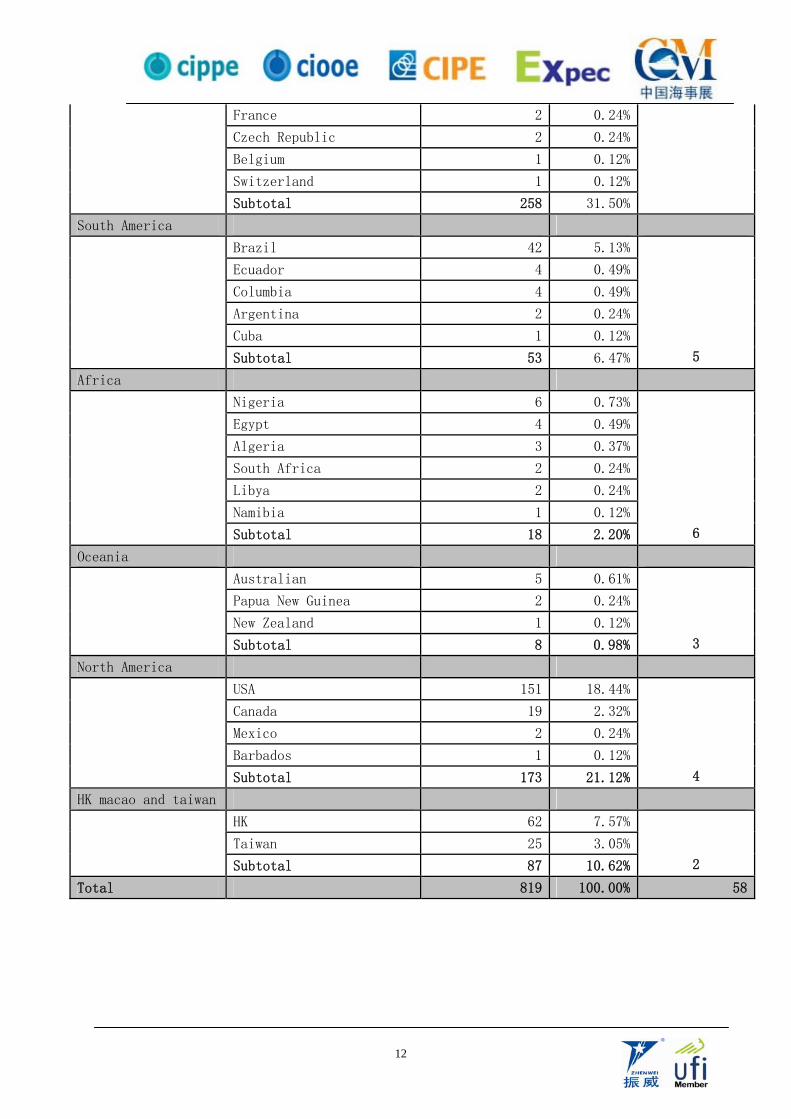
12
France 2 0.24%
Czech Republic 2 0.24%
Belgium 1 0.12%
Switzerland 1 0.12%
Subtotal 258 31.50%
South America
Brazil 42 5.13%
Ecuador 4 0.49%
Columbia 4 0.49%
Argentina 2 0.24%
Cuba 1 0.12%
Subtotal 53 6.47% 5
Africa
Nigeria 6 0.73%
Egypt 4 0.49%
Algeria 3 0.37%
South Africa 2 0.24%
Libya 2 0.24%
Namibia 1 0.12%
Subtotal 18 2.20% 6
Oceania
Australian 5 0.61%
Papua New Guinea 2 0.24%
New Zealand 1 0.12%
Subtotal 8 0.98% 3
North America
USA 151 18.44%
Canada 19 2.32%
Mexico 2 0.24%
Barbados 1 0.12%
Subtotal 173 21.12% 4
HK macao and taiwan
HK 62 7.57%
Taiwan 25 3.05%
Subtotal 87 10.62% 2
Total 819 100.00% 58
13
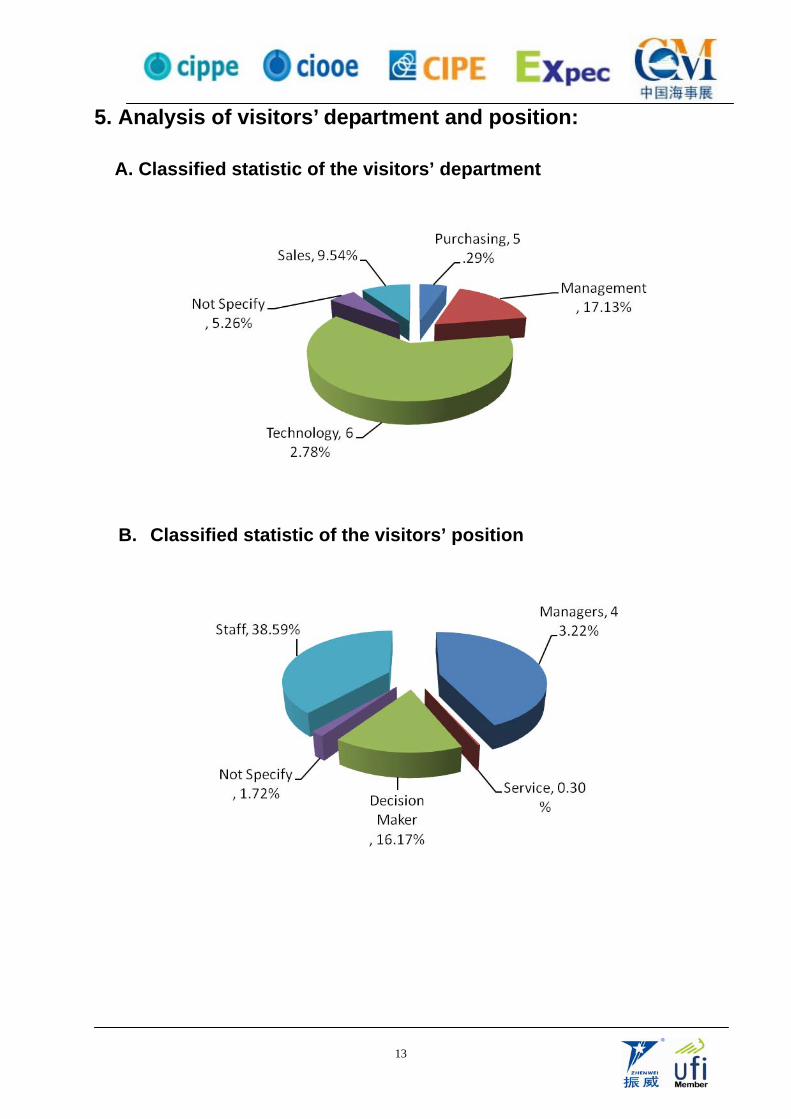
5. Analysis of visitors’ department and position:
A. Classified statistic of the visitors’ department
B. Classified statistic of the visitors’ position
14
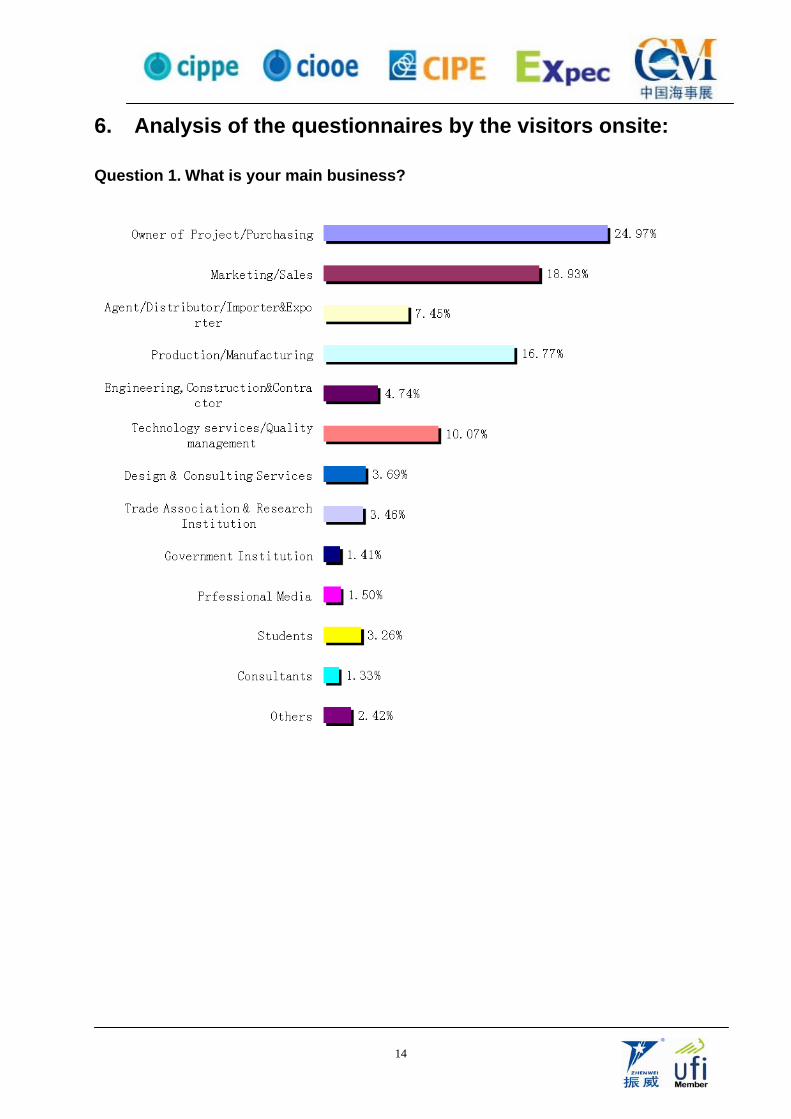
6. Analysis of the questionnaires by the visitors onsite:
Question 1. What is your main business?
15
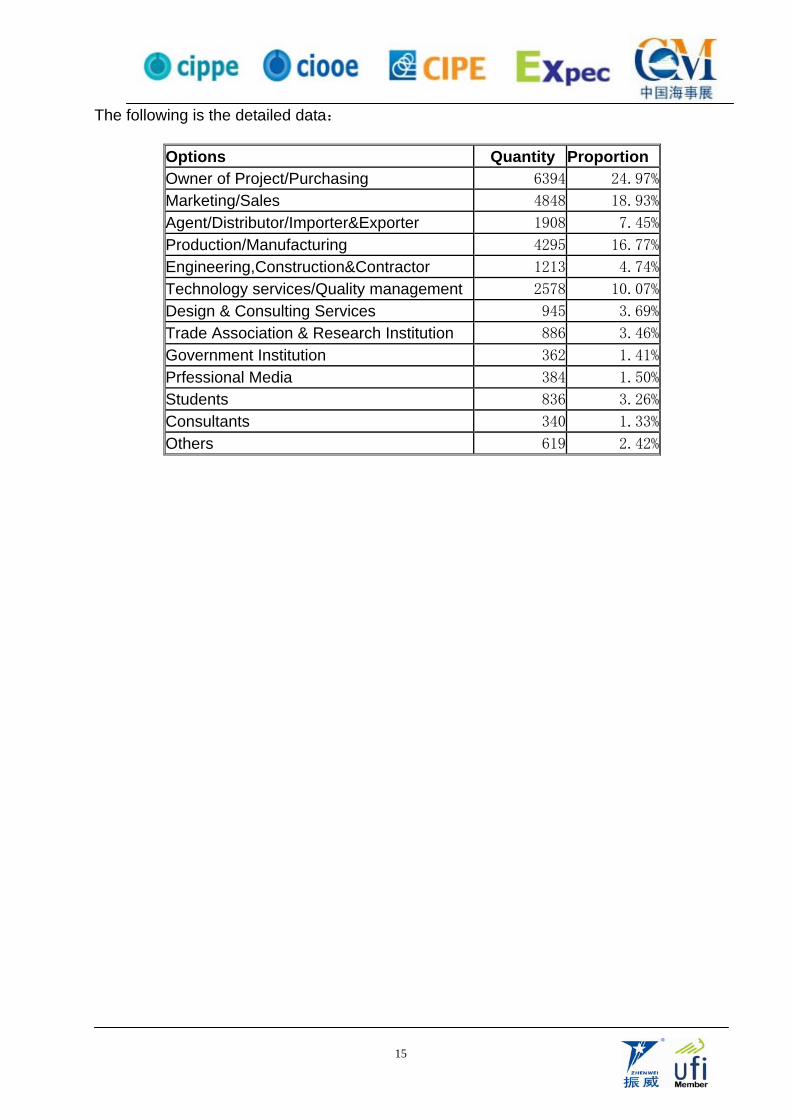
The following is the detailed data:
Options Quantity Proportion Owner of Project/Purchasing 6394 24.97%
Marketing/Sales 4848 18.93%
Agent/Distributor/Importer&Exporter 1908 7.45%
Production/Manufacturing 4295 16.77%
Engineering,Construction&Contractor 1213 4.74%
Technology services/Quality management 2578 10.07%
Design & Consulting Services 945 3.69%
Trade Association & Research Institution 886 3.46%
Government Institution 362 1.41%
Prfessional Media 384 1.50%
Students 836 3.26%
Consultants 340 1.33%
Others 619 2.42%
16
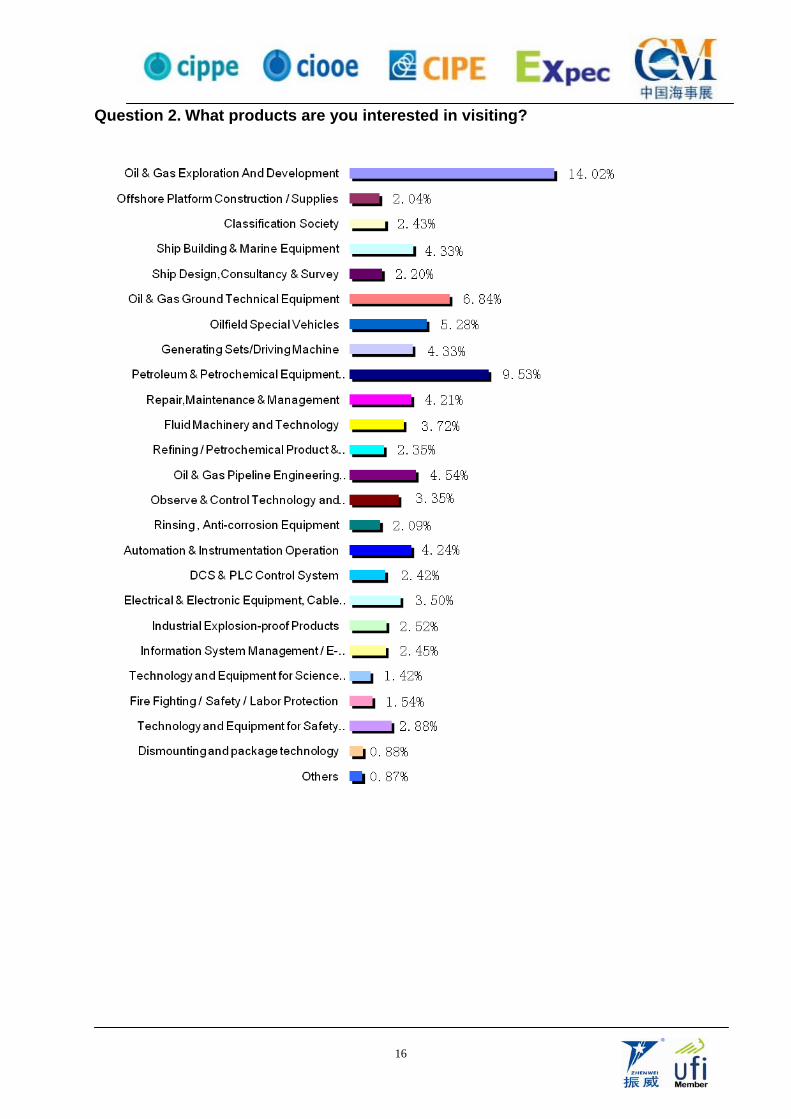
Question 2. What products are you interested in visiting?
17
The following is the detailed data:
Options Quantity ProportionOil & Gas Exploration And Development 6901 14.02%Offshore Platform Construction / Supplies 1006 2.04%Classification Society 1625 2.43%Ship Building & Marine Equipment 2195 4.33%Ship Design,Consultancy & Survey 3553 2.20%Oil & Gas Ground Technical Equipment 3369 6.84%Oilfield Special Vehicles 2600 5.28%Generating Sets/Driving Machine 2130 4.33%Petroleum & Petrochemical Equipment and Manufacturing 4690 9.53%Repair,Maintenance & Management 2072 4.21%Fluid Machinery and Technology 1829 3.72%Refining / Petrochemical Product & Advanced Material 1155 2.35%Oil & Gas Pipeline Engineering Construction / Transportation & storage 2236 4.54%Observe & Control Technology and Equipment on Pipeline 1651 3.35%Rinsing , Anti-corrosion Equipment 1029 2.09%Automation & Instrumentation Operation 2088 4.24%DCS & PLC Control System 1190 2.42%Electrical & Electronic Equipment, Cable and Electric Wire 1723 3.50%Industrial Explosion-proof Products 1239 2.52%Information System Management / E-Commerce 1208 2.45%Technology and Equipment for Science Research and Laboratory in Petroleum etrochemical Industry 697 1.42%Fire Fighting / Safety / Labor Protection 757 1.54%Technology and Equipment for Safety , Environmental Protection , and Energy Conservation 1419 2.88%Dismounting and package technology 435 0.88%Others 429 0.87%
18
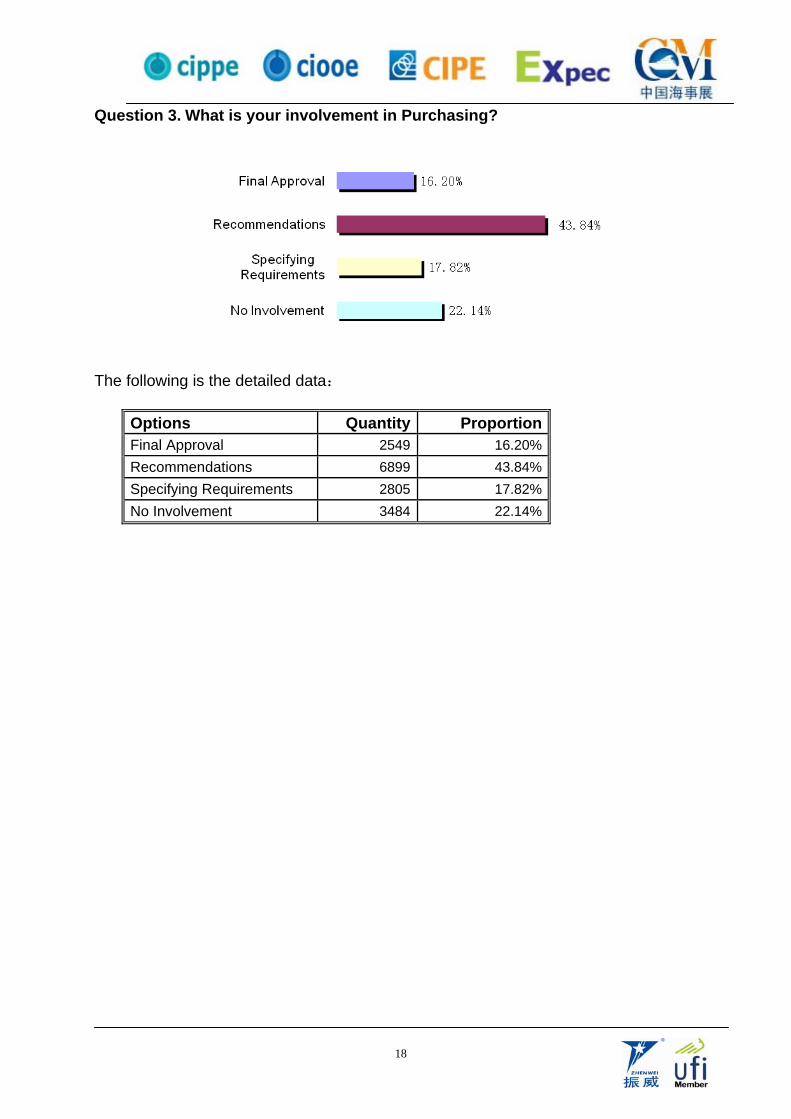
Question 3. What is your involvement in Purchasing?
The following is the detailed data:
Options Quantity ProportionFinal Approval 2549 16.20%Recommendations 6899 43.84%Specifying Requirements 2805 17.82%No Involvement 3484 22.14%
19
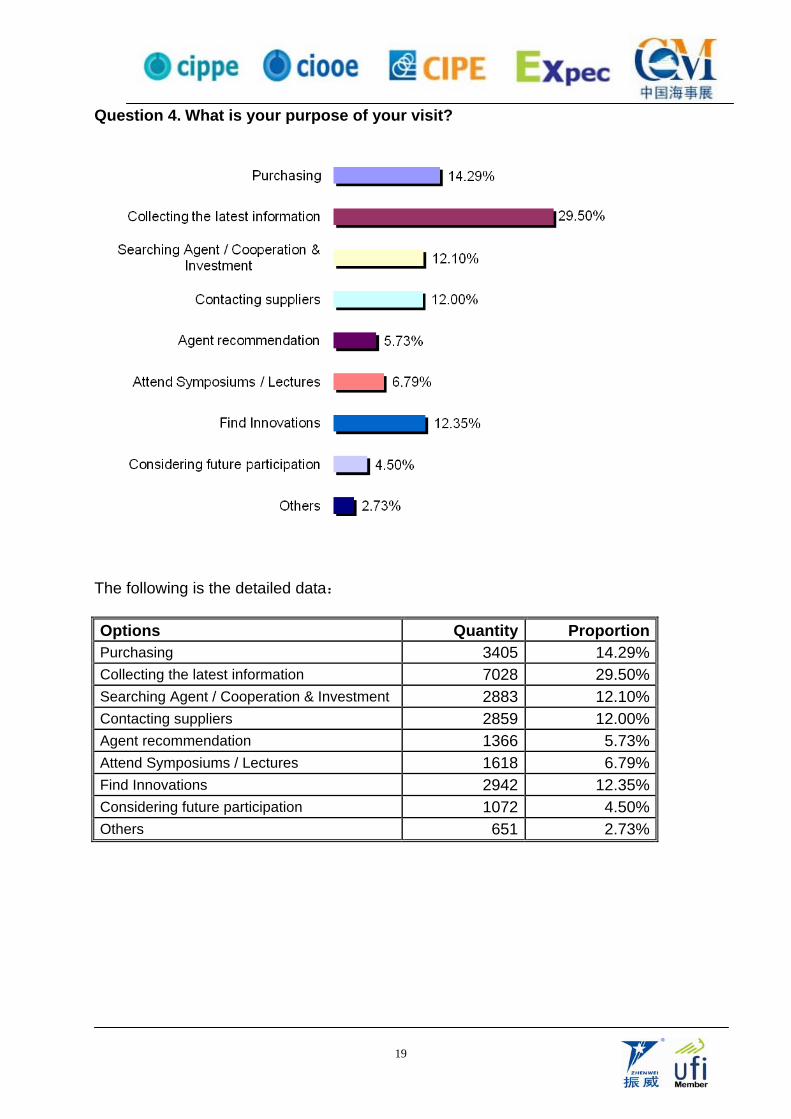
Question 4. What is your purpose of your visit?
The following is the detailed data:
Options Quantity Proportion Purchasing 3405 14.29% Collecting the latest information 7028 29.50% Searching Agent / Cooperation & Investment 2883 12.10% Contacting suppliers 2859 12.00% Agent recommendation 1366 5.73% Attend Symposiums / Lectures 1618 6.79% Find Innovations 2942 12.35% Considering future participation 1072 4.50% Others 651 2.73%
20
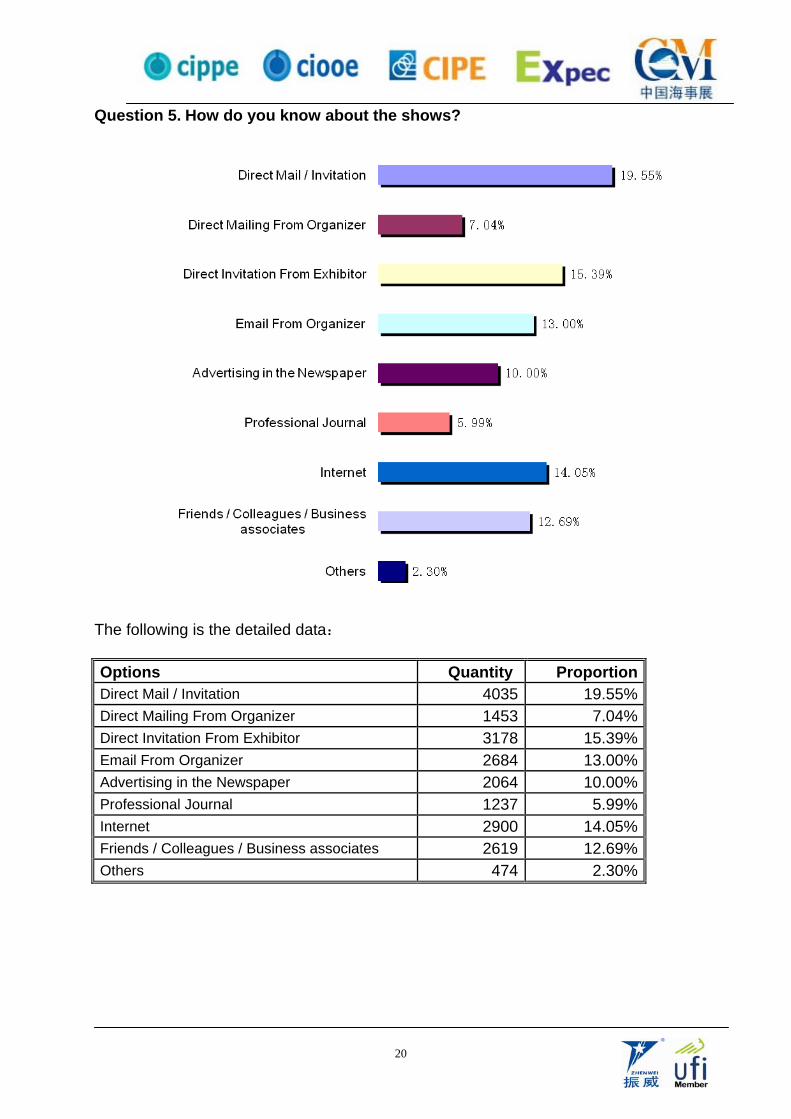
Question 5. How do you know about the shows?
The following is the detailed data:
Options Quantity Proportion Direct Mail / Invitation 4035 19.55% Direct Mailing From Organizer 1453 7.04% Direct Invitation From Exhibitor 3178 15.39% Email From Organizer 2684 13.00% Advertising in the Newspaper 2064 10.00% Professional Journal 1237 5.99% Internet 2900 14.05% Friends / Colleagues / Business associates 2619 12.69% Others 474 2.30%
21
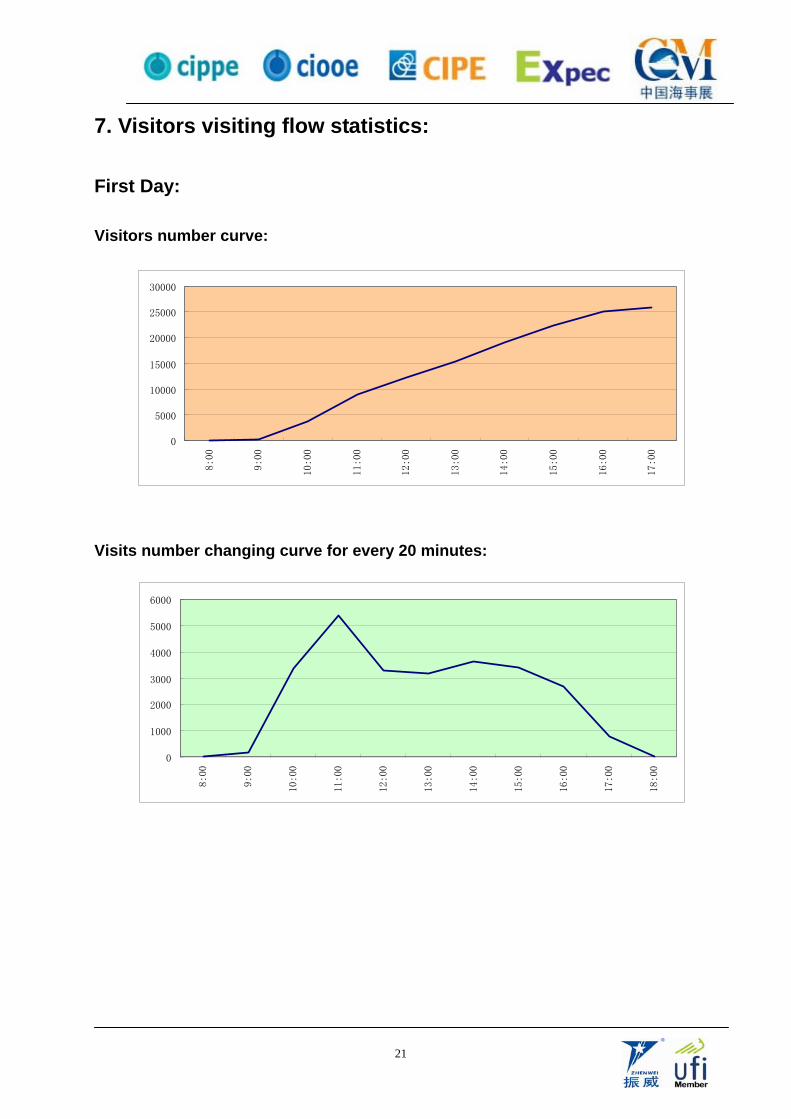
7. Visitors visiting flow statistics:
First Day:
Visitors number curve:
0
5000
10000
15000
20000
25000
30000
8:00
9:00
10:00
11:00
12:00
13:00
14:00
15:00
16:00
17:00
Visits number changing curve for every 20 minutes:
0
1000
2000
3000
4000
5000
6000
8:00
9:00
10:00
11:00
12:00
13:00
14:00
15:00
16:00
17:00
18:00
22
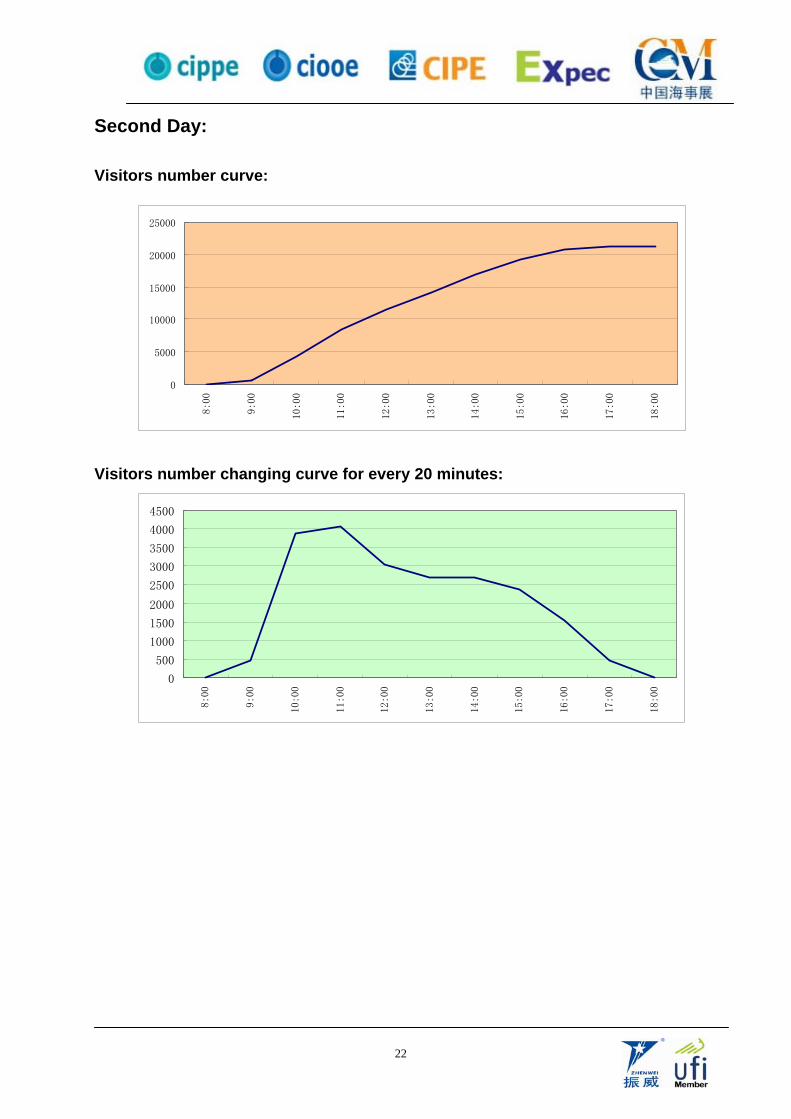
Second Day:
Visitors number curve:
0
5000
10000
15000
20000
25000
8:00
9:00
10:0
0
11:0
0
12:0
0
13:0
0
14:0
0
15:0
0
16:0
0
17:0
0
18:0
0
Visitors number changing curve for every 20 minutes:
0
500
1000
1500
2000
2500
3000
3500
4000
4500
8:00
9:00
10:00
11:00
12:00
13:00
14:00
15:00
16:00
17:00
18:00
23
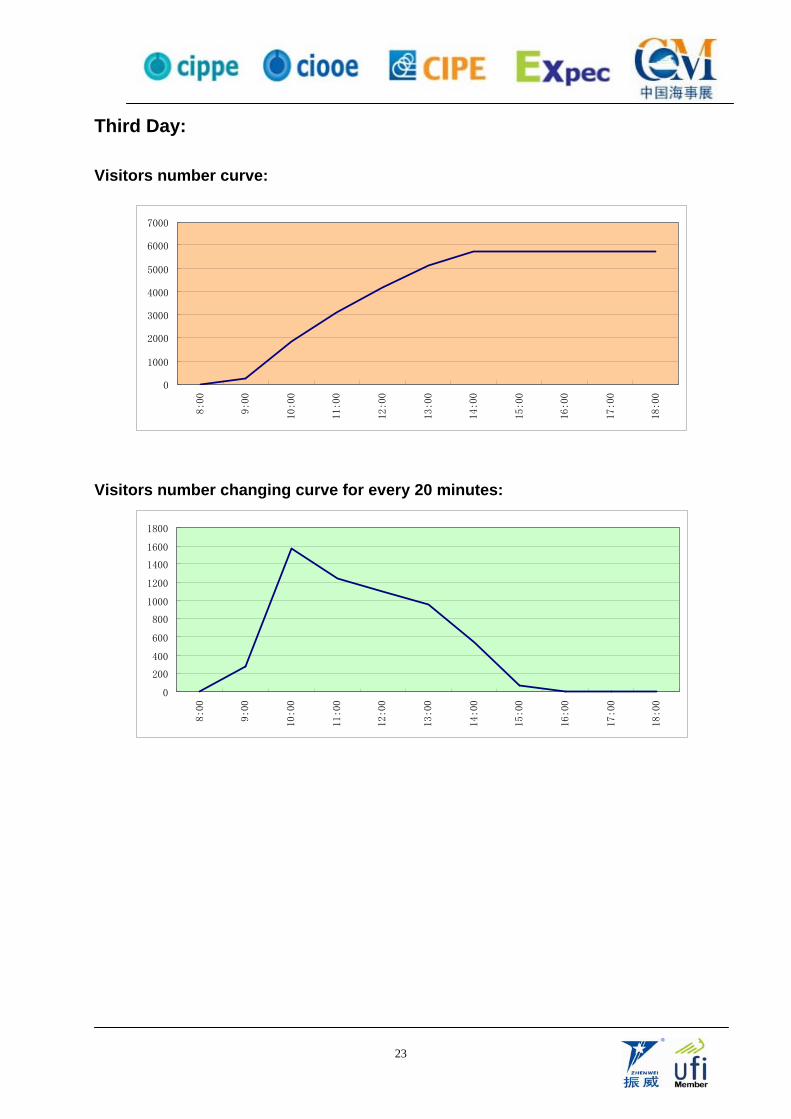
Third Day:
Visitors number curve:
0
1000
2000
3000
4000
5000
6000
7000
8:00
9:00
10:0
0
11:0
0
12:0
0
13:0
0
14:0
0
15:0
0
16:0
0
17:0
0
18:0
0
Visitors number changing curve for every 20 minutes:
0
200
400
600
800
1000
1200
1400
1600
1800
8:00
9:00
10:00
11:00
12:00
13:00
14:00
15:00
16:00
17:00
18:00