Embed Size (px)
Citation preview
Visual Acuity for High-Contrast Tri-bar Targets
Illuminated with Spectra Simulating Night Vision Goggle
(NVG) Displays and the No-moon Night Sky
by V. Grayson CuQlock-Knopp, Edward Bender, John Merritt,
and Jennifer Smoot
ARL-TR-5393 November 2010
Approved for public release; distribution unlimited.
NOTICES
Disclaimers
The findings in this report are not to be construed as an official Department of the Army position
unless so designated by other authorized documents.
Citation of manufacturer’s or trade names does not constitute an official endorsement or
approval of the use thereof.
Destroy this report when it is no longer needed. Do not return it to the originator.
Army Research Laboratory Aberdeen Proving Ground, MD 21005
ARL-TR-5393 November 2010
Visual Acuity for High-Contrast Tri-bar Targets
Illuminated with Spectra Simulating Night Vision Goggle
(NVG) Displays and the No-moon Night Sky
V. Grayson CuQlock-Knopp and Jennifer Smoot Human Research and Engineering Directorate, ARL
Edward Bender U.S. Army RDECOM CERDEC
Night Vision and Electronic Sensors Directorate
John Merritt The Merritt Group
Approved for public release; distribution unlimited.
ii
REPORT DOCUMENTATION PAGE Form Approved
OMB No. 0704-0188 Public reporting burden for this collection of information is estimated to average 1 hour per response, including the time for reviewing instructions, searching existing data sources, gathering and maintaining the
data needed, and completing and reviewing the collection information. Send comments regarding this burden estimate or any other aspect of this collection of information, including suggestions for reducing the
burden, to Department of Defense, Washington Headquarters Services, Directorate for Information Operations and Reports (0704-0188), 1215 Jefferson Davis Highway, Suite 1204, Arlington, VA 22202-4302.
Respondents should be aware that notwithstanding any other provision of law, no person shall be subject to any penalty for failing to comply with a collection of information if it does not display a currently
valid OMB control number.
PLEASE DO NOT RETURN YOUR FORM TO THE ABOVE ADDRESS.
1. REPORT DATE (DD-MM-YYYY)
November 2010
2. REPORT TYPE
Final
3. DATES COVERED (From - To)
FY10
4. TITLE AND SUBTITLE
Visual Acuity for High-Contrast Tri-bar Targets Illuminated with Spectra
Simulating Night Vision Goggle (NVG) Displays and the No-moon Night Sky
5a. CONTRACT NUMBER
5b. GRANT NUMBER
5c. PROGRAM ELEMENT NUMBER
6. AUTHOR(S)
V. Grayson CuQlock-Knopp, Edward Bender, John Merritt, and Jennifer Smoot
5d. PROJECT NUMBER
0MS22S
5e. TASK NUMBER
5f. WORK UNIT NUMBER
7. PERFORMING ORGANIZATION NAME(S) AND ADDRESS(ES)
U.S. Army Research Laboratory
ATTN: RDRL-HRS-D
Aberdeen Proving Ground, MD 21005
8. PERFORMING ORGANIZATION REPORT NUMBER
ARL-TR-5393
9. SPONSORING/MONITORING AGENCY NAME(S) AND ADDRESS(ES)
10. SPONSOR/MONITOR'S ACRONYM(S)
11. SPONSOR/MONITOR'S REPORT NUMBER(S)
12. DISTRIBUTION/AVAILABILITY STATEMENT
Approved for public release; distribution unlimited.
13. SUPPLEMENTARY NOTES
14. ABSTRACT
This report presents two studies that measured unaided visual acuity using a 50-in square high-contrast U.S. Air Force
(USAF) 1951 Tri-Bar chart viewed from 12 ft at luminance levels ranging from 0.00046 fL (much darker than a night vision
goggle [NVG] display of an overcast starlight scene) to 21.5 fL (much brighter than a NVG display of a full-moon scene). To
avoid visual noise artifacts, these studies did not use actual NVG displays. The studies were designed to support general
modeling efforts at the U.S. Army Research Development and Engineering Command (RDECOM) Communications-
Electronics Research Development and Engineering Center (CERDEC), Night Vision and Electronic Sensors Directorate
(NVESD). For Study 1, the Tri-Bar chart was back-lit with a spectrum similar to the standard yellowish-green (P43) phosphor
NVG display. In Study 2, the chart was back-lit with tungsten illumination, similar to a 2856 K blackbody spectrum. In
addition to providing measures of unaided visual acuity, we introduced a new technique—the Green-appearance Scale—to
determine the luminance levels at which participants transitioned from scotopic viewing of the Tri-Bar chart to mesopic
viewing, and from mesopic viewing to photopic viewing. We describe this technique and present the data as part of the
methodology and results of Study 1.
15. SUBJECT TERMS
Unaided visual acuity, night vision goggles
16. SECURITY CLASSIFICATION OF:
17. LIMITATION OF
ABSTRACT
UU
18. NUMBER OF
PAGES
36
19a. NAME OF RESPONSIBLE PERSON
V. Grayson CuQlock-Knopp
a. REPORT
Unclassified
b. ABSTRACT
Unclassified
c. THIS PAGE
Unclassified
19b. TELEPHONE NUMBER (Include area code)
(410) 278-5988
Standard Form 298 (Rev. 8/98)
Prescribed by ANSI Std. Z39.18
iii
Contents
List of Figures v
List of Tables v
1. Introduction 1
2. Study 1: Visual Acuity for High-contrast Tri-Bar Targets Illuminated with a
Spectrum Simulating a P43 Green-phosphor NVG Display 3
2.1 Method.............................................................................................................................3
2.1.1 Target Chart .........................................................................................................3
2.1.2 The Green-appearance Scale ...............................................................................4
2.1.3 Luminance Levels ...............................................................................................5
2.1.4 Luminance-level Apparatus ................................................................................5
2.1.5 Photometric Equipment .......................................................................................6
2.2 Participants ......................................................................................................................6
2.3 Procedures .......................................................................................................................6
2.4 Results .............................................................................................................................7
2.5 Green-appearance Scale ..................................................................................................9
3. Study 2: Visual Acuity for High-contrast Tri-bar Targets Illuminated with a
Spectrum Simulating a 2856 K Display 9
3.1 Method...........................................................................................................................10
3.1.1 Participants ........................................................................................................10
3.1.2 Results ...............................................................................................................10
3.2 NVESD Versus Morgan for the White Illumination .....................................................14
3. Conclusions 16
4. References 18
Appendix A. Moss Green Filter Information 19
Appendix B. Tri-Bar Instructions 21
iv
Appendix C. Graphical Representation of Percentages 23
List of Symbols, Abbreviations, and Acronyms 25
Distribution List 26
v
List of Figures
Figure 1. The position of P43 phosphor, ~2856 K blackbody, and the single layer moss-green filter (Roscolux #89,1), which is located adjacent to the P43 in CIE space. The ~2856 K blackbody is shown on the chart as CIE Illuminant A. ..............................................2
Figure 2. The USAF 1951 Tri-Bar resolution chart used in the study, 50 x 50 in..........................4
Figure 3. The Green-appearance Scale used to rate the appearance of the Tri-Bar chart at each luminance level. .................................................................................................................4
Figure 4. Tri-Bar acuity as a function of luminance level for the green-phosphor simulation. Higher numbers are better acuity. ..............................................................................................8
Figure 5. Tri-Bar acuity as a function of luminance level for the 2856 K display simulation for the 16 Morgan participants. ................................................................................................11
Figure 6. Tri-Bar acuity as a function of luminance level for binocular, green (31 Morgan) and white (16 Morgan participants) illumination. ..................................................................12
Figure 7. Tri-Bar acuity data as a function of luminance level for monocular left-eye and right-eye, 2856 K white-display and green-display illuminations. ..........................................13
Figure 8. Binocular Tri-Bar acuity as a function of luminance level for the college-age Morgan and the older NVESD participants. ............................................................................14
Figure 9. Left-eye and right-eye Tri-Bar acuity as a function of luminance level for the Morgan and the NVESD participants. ....................................................................................14
Figure A-1. Spectral plot for the Roscolux #89 Moss Green filter. ..............................................19
Figure A-2. Composite spectral plots for typical NVG phosphors and the Roscolux filter emulators, in both single- and dual-layer configurations. ........................................................20
Figure C-1. Percentage of participants providing a rating for each luminance level and rating category. ...................................................................................................................................23
List of Tables
Table 1. The luminance levels used in Studies 1 and 2, with descriptive equivalents. ..................5
Table 2. The means and standard deviations of the P43 visual acuity scores (in cycles per milliradian) for the left (L)-eye, right (R)-eye, and binocular viewing of the Tri-Bar chart at all 15 luminance levels. ..........................................................................................................8
Table 3. The percentages of each of the 31 participants that made each of the five ratings on the Green-appearance scale for each luminance level. ..............................................................9
vi
Table 4. The means and standard deviations of the visual acuity for the L-eye, R-eye, and binocular viewing of the Tri-Bar chart at all 15 luminance levels for the 2856 K illumination for the 16 Morgan participants. ...........................................................................11
Table 5. The binocular visual acuity means (in cycles per milliradian) and standard deviations for or the P43 green simulation (original 31 Morgan participants) and 2856 K ―white‖ viewing conditions (subset of 16 Morgan participants). ............................................13
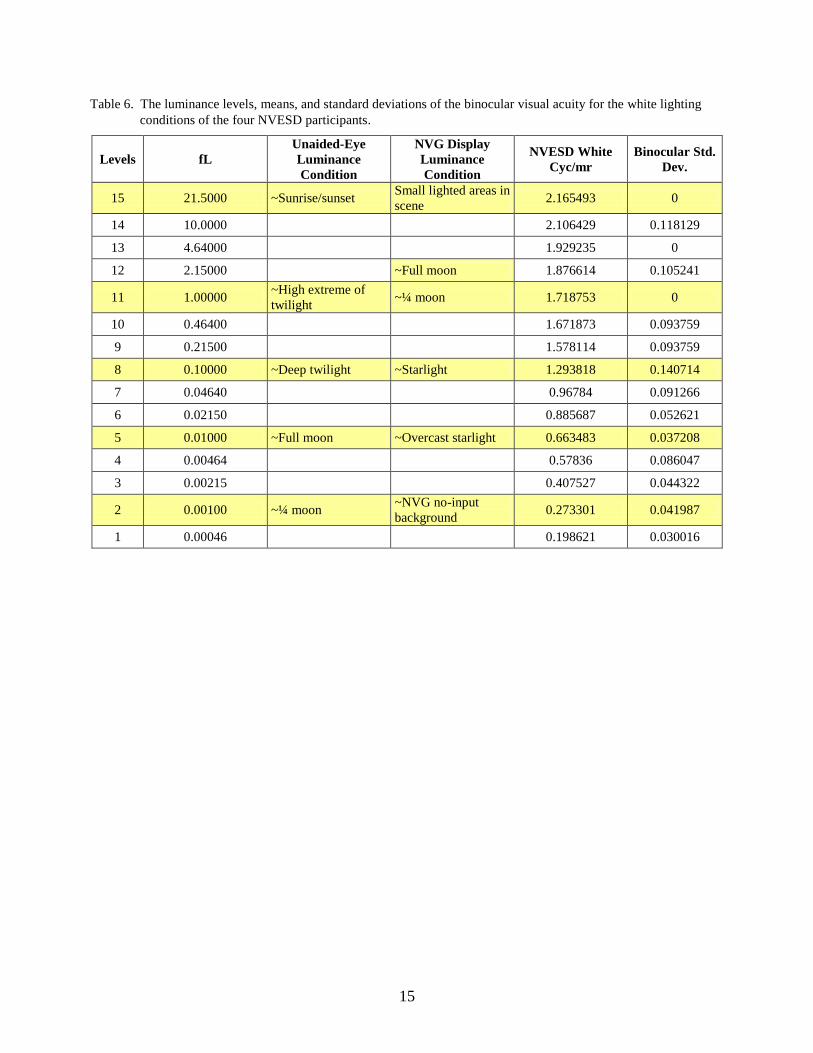
Table 6. The luminance levels, means, and standard deviations of the binocular visual acuity for the white lighting conditions of the four NVESD participants. .........................................15
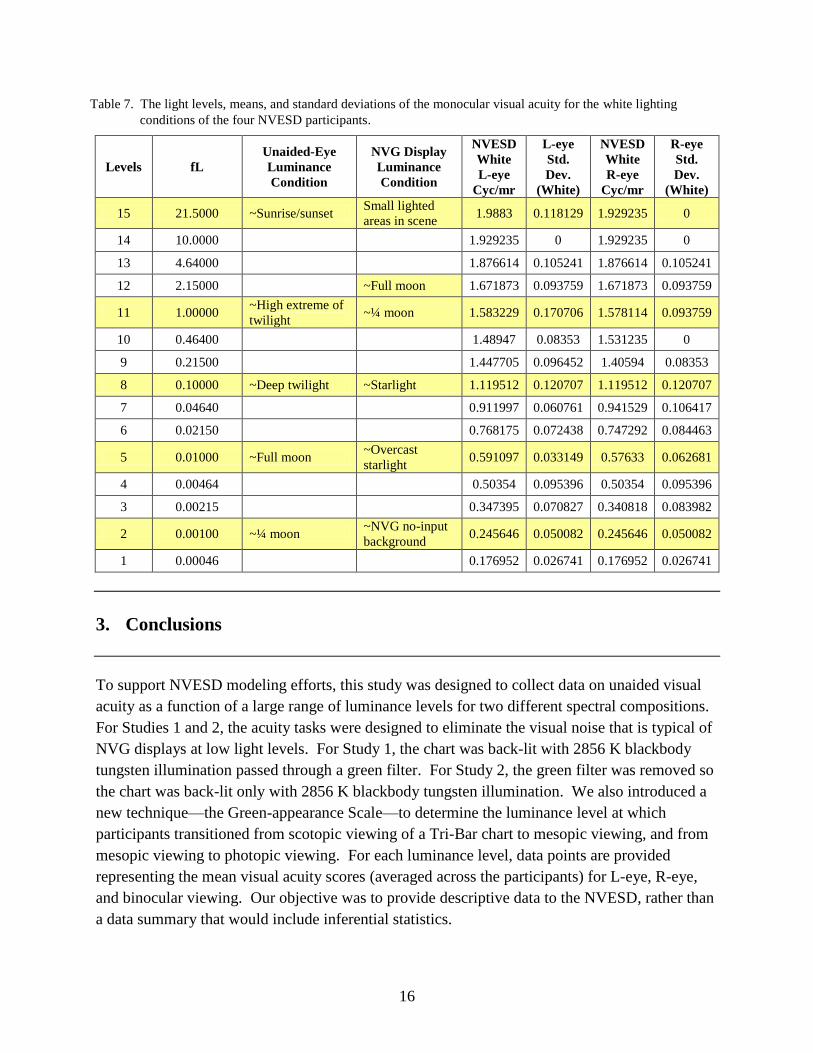
Table 7. The light levels, means, and standard deviations of the monocular visual acuity for the white lighting conditions of the four NVESD participants. ...............................................16
1
1. Introduction
Models designed to predict visual task performance when using night vision devices (NVDs) are
predicated upon a given set of human-eye performance data for viewing imagery displayed at the
typical luminance levels experienced when using NVDs. In the case of direct-view image-
intensified (I2) systems, such as night vision goggles (NVGs), the I2 display imagery can range in
luminance from several foot-lamberts (fL, equivalent to ~3.426 cd/m2) under full-moon
conditions to as little as 0.01 fL under overcast starlight conditions. One key parameter used in
these models is visual acuity. Typically, for the assessment of visual acuity aided by NVGs, an
observer views a high-contrast visual test chart through NVGs and his or her visual acuity, based
on reading the chart, is recorded.* One noteworthy finding in this area is that when visual-acuity
assessments were obtained across seven different laboratories using the same two NVGs (two
pairs of intensifier tubes), a range of 0.41 cyc/mrad in visual acuity measurement was found
(Task, 2001). Task attributed differences in visual acuity measurements, in part, to differences in
the test charts and the testing procedures used for obtaining the assessments. Task and Pinkus
(2007) and Capo´-Aponte, Temme, and Task et al. (2009) discuss a variety of other factors that
interfere with reproducing NVG-aided visual acuity measurements for identical types of NVGs.
An assessment of unaided visual acuity (direct view without NVGs) is needed to separate the
performance of the NVGs from the limits of the human visual system alone.
The objective of the present series of studies was to fulfill the U.S. Army Research Development
and Engineering Command (RDECOM) Communications-Electronics Research Development
and Engineering Center (CERDEC), Night Vision and Electronic Sensors Directorate (NVESD)
modelers’ need for germane unaided-eye performance data obtained using high-contrast targets
back-illuminated with (1) a spectrum simulating the yellowish-green P43 phosphor and (2) a
spectrum simulating 2856 K blackbody illumination. Unaided-eye performance data were
needed for both monocular and binocular viewing conditions and for a very wide luminance
range from dimmer than any NVG display (0.005 fL) to the bright extreme of an NVG display
(4.0 fL). In order to control for NVG display artifacts, it was particularly important in this series
of studies to avoid the pronounced temporal noise scintillations that would have been present if
visual acuity had been measured while looking through NVGs under the very dim no-moon
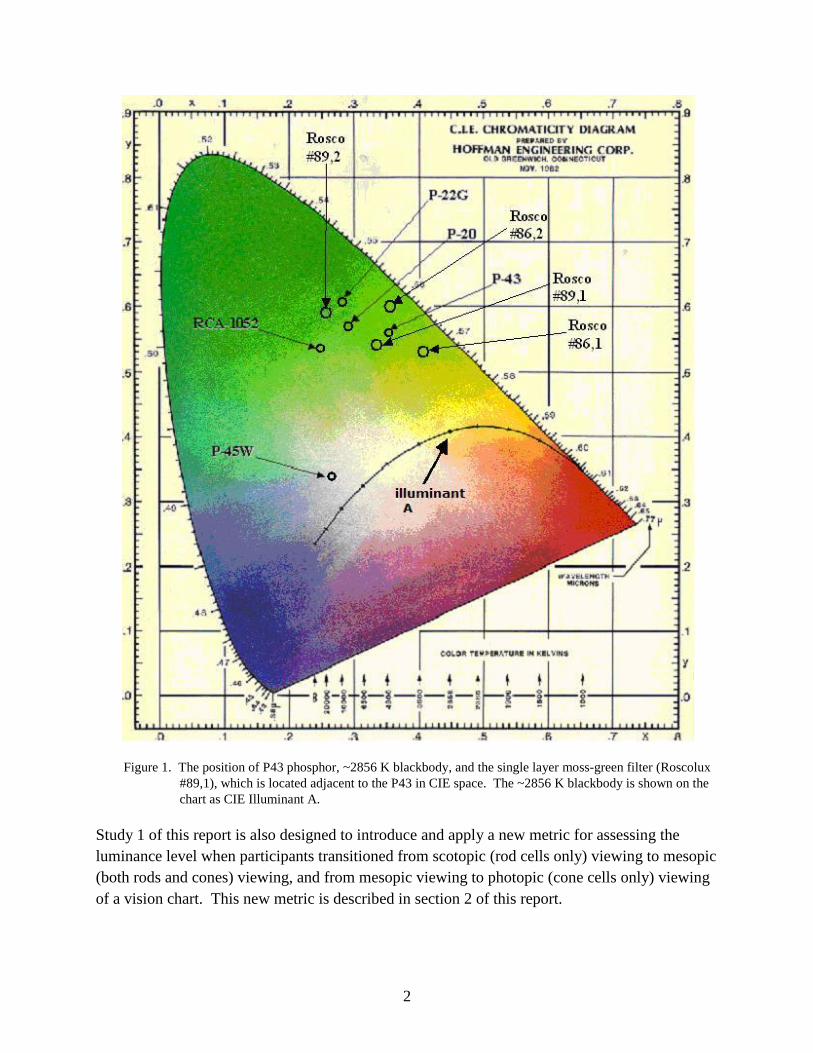
conditions of the luminance range used in this report. The positions of the P43 phosphor,
~2856 K blackbody, and the filter used to simulate the P43 phosphor in the International
Commission on Illumination (CIE) chromaticity diagram space are shown in figure 1.
*Task and Pinkus (2007) denote visual acuity assessed through the NVDs as ―NVG-aided visual acuity.‖
2
Figure 1. The position of P43 phosphor, ~2856 K blackbody, and the single layer moss-green filter (Roscolux
#89,1), which is located adjacent to the P43 in CIE space. The ~2856 K blackbody is shown on the
chart as CIE Illuminant A.
Study 1 of this report is also designed to introduce and apply a new metric for assessing the
luminance level when participants transitioned from scotopic (rod cells only) viewing to mesopic
(both rods and cones) viewing, and from mesopic viewing to photopic (cone cells only) viewing
of a vision chart. This new metric is described in section 2 of this report.
3
2. Study 1: Visual Acuity for High-contrast Tri-Bar Targets Illuminated with
a Spectrum Simulating a P43 Green-phosphor NVG Display
Study 1 was designed to support the NVESD modeling efforts by providing visual-acuity data
for targets back-illuminated with a spectral content similar to the yellowish-green appearance of
the typical P43 NVG. The study also introduced a new metric, the Green-appearance Scale, for
measuring at what luminance levels observers transitioned from scotopic to mesopic to photopic
viewing of the vision test chart.
2.1 Method
2.1.1 Target Chart
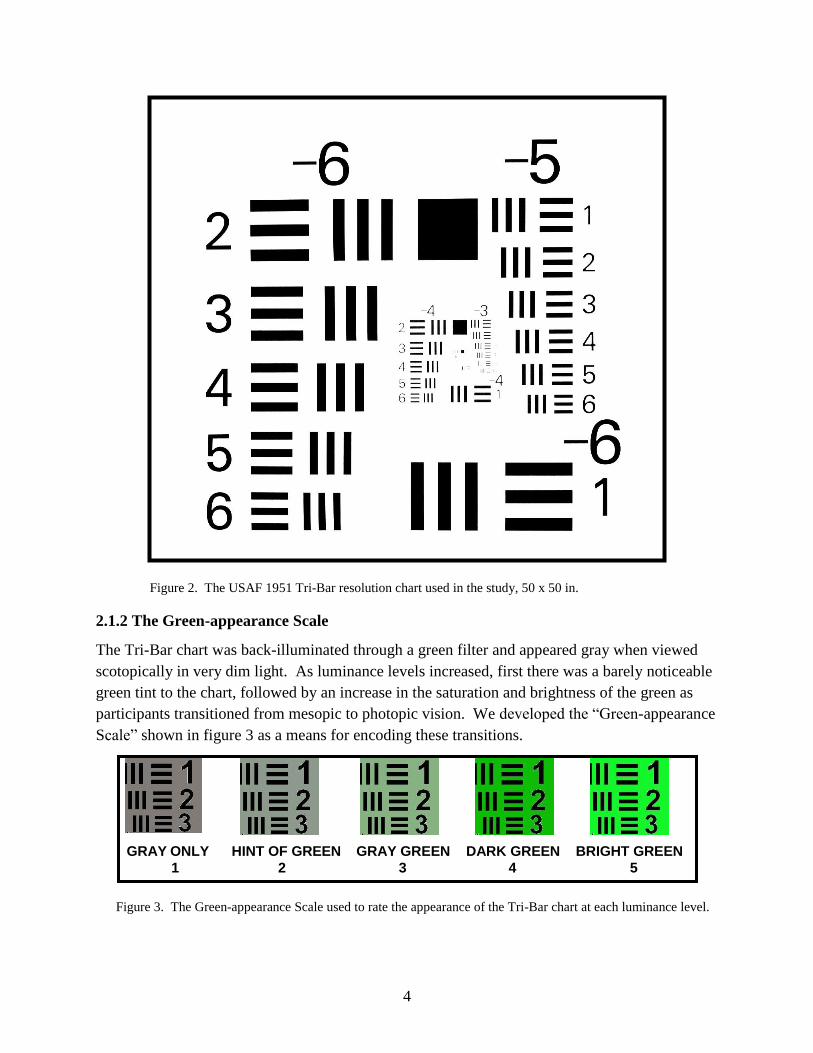
The experimenter measured the observer’s high-contrast visual acuity using a large-size (50-in
square) U.S. Air Force (USAF) 1951 Tri-Bar resolution chart, shown in figure 2. The Tri-Bar
chart consists of six groups with six ―elements‖ each diminishing in size steps of ~12%, with
each element having three vertical bars and three horizontal bars. The six elements in each
successive group are half the size of the elements in the preceding group. The Tri-Bar chart was
chosen because it provides six small steps in target size between doublings, unlike most standard
visual-acuity eye charts.
4
Figure 2. The USAF 1951 Tri-Bar resolution chart used in the study, 50 x 50 in.
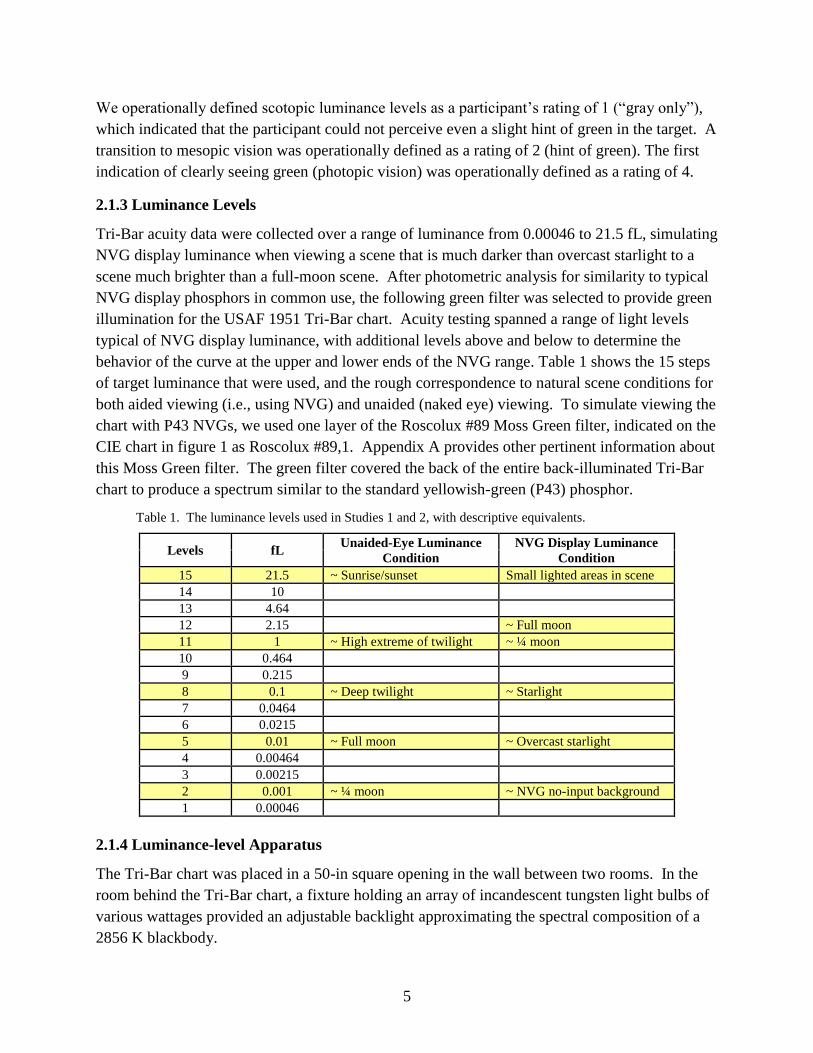
2.1.2 The Green-appearance Scale
The Tri-Bar chart was back-illuminated through a green filter and appeared gray when viewed
scotopically in very dim light. As luminance levels increased, first there was a barely noticeable
green tint to the chart, followed by an increase in the saturation and brightness of the green as
participants transitioned from mesopic to photopic vision. We developed the ―Green-appearance
Scale‖ shown in figure 3 as a means for encoding these transitions.
Figure 3. The Green-appearance Scale used to rate the appearance of the Tri-Bar chart at each luminance level.
GRAY ONLY
1
GRAY GREEN
3
DARK GREEN
4
BRIGHT GREEN
5
HINT OF GREEN
2
5
We operationally defined scotopic luminance levels as a participant’s rating of 1 (―gray only‖),
which indicated that the participant could not perceive even a slight hint of green in the target. A
transition to mesopic vision was operationally defined as a rating of 2 (hint of green). The first
indication of clearly seeing green (photopic vision) was operationally defined as a rating of 4.
2.1.3 Luminance Levels
Tri-Bar acuity data were collected over a range of luminance from 0.00046 to 21.5 fL, simulating
NVG display luminance when viewing a scene that is much darker than overcast starlight to a
scene much brighter than a full-moon scene. After photometric analysis for similarity to typical
NVG display phosphors in common use, the following green filter was selected to provide green
illumination for the USAF 1951 Tri-Bar chart. Acuity testing spanned a range of light levels
typical of NVG display luminance, with additional levels above and below to determine the
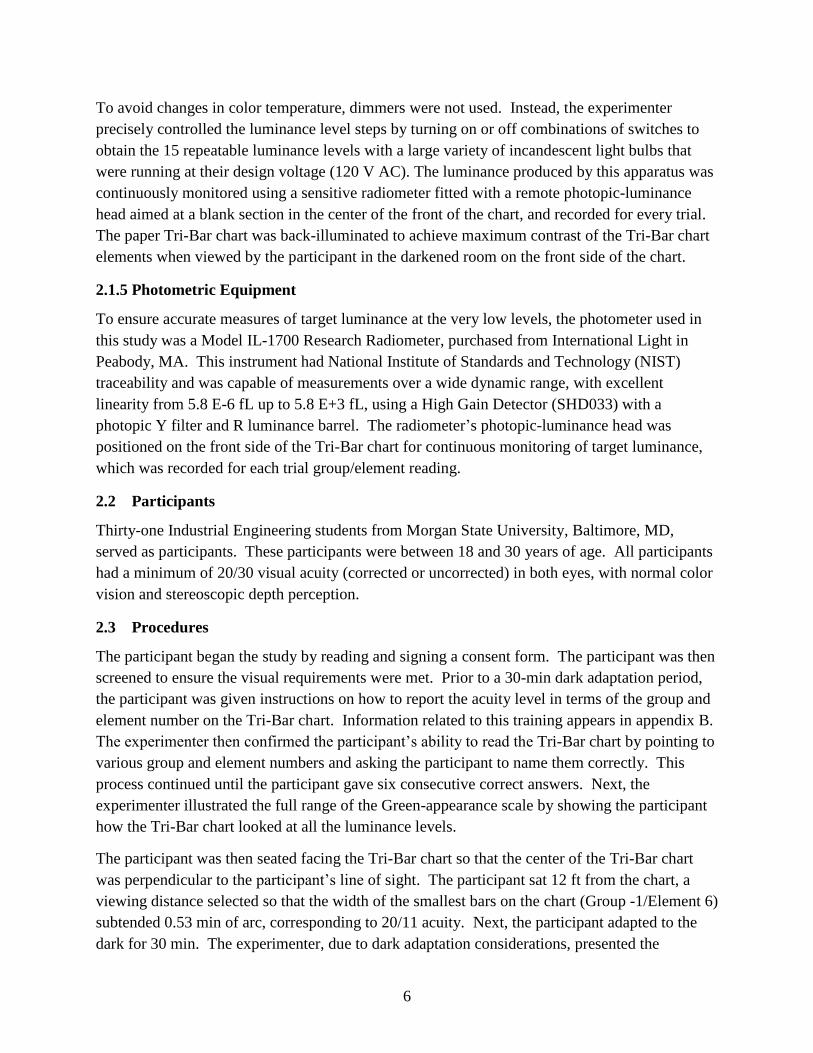
behavior of the curve at the upper and lower ends of the NVG range. Table 1 shows the 15 steps
of target luminance that were used, and the rough correspondence to natural scene conditions for
both aided viewing (i.e., using NVG) and unaided (naked eye) viewing. To simulate viewing the
chart with P43 NVGs, we used one layer of the Roscolux #89 Moss Green filter, indicated on the
CIE chart in figure 1 as Roscolux #89,1. Appendix A provides other pertinent information about
this Moss Green filter. The green filter covered the back of the entire back-illuminated Tri-Bar
chart to produce a spectrum similar to the standard yellowish-green (P43) phosphor.
Table 1. The luminance levels used in Studies 1 and 2, with descriptive equivalents.
Levels fL Unaided-Eye Luminance
Condition
NVG Display Luminance
Condition
15 21.5 ~ Sunrise/sunset Small lighted areas in scene
14 10
13 4.64
12 2.15 ~ Full moon
11 1 ~ High extreme of twilight ~ ¼ moon
10 0.464
9 0.215
8 0.1 ~ Deep twilight ~ Starlight
7 0.0464
6 0.0215
5 0.01 ~ Full moon ~ Overcast starlight
4 0.00464
3 0.00215
2 0.001 ~ ¼ moon ~ NVG no-input background
1 0.00046
2.1.4 Luminance-level Apparatus
The Tri-Bar chart was placed in a 50-in square opening in the wall between two rooms. In the
room behind the Tri-Bar chart, a fixture holding an array of incandescent tungsten light bulbs of
various wattages provided an adjustable backlight approximating the spectral composition of a
2856 K blackbody.
6
To avoid changes in color temperature, dimmers were not used. Instead, the experimenter
precisely controlled the luminance level steps by turning on or off combinations of switches to
obtain the 15 repeatable luminance levels with a large variety of incandescent light bulbs that
were running at their design voltage (120 V AC). The luminance produced by this apparatus was
continuously monitored using a sensitive radiometer fitted with a remote photopic-luminance
head aimed at a blank section in the center of the front of the chart, and recorded for every trial.
The paper Tri-Bar chart was back-illuminated to achieve maximum contrast of the Tri-Bar chart
elements when viewed by the participant in the darkened room on the front side of the chart.
2.1.5 Photometric Equipment
To ensure accurate measures of target luminance at the very low levels, the photometer used in
this study was a Model IL-1700 Research Radiometer, purchased from International Light in
Peabody, MA. This instrument had National Institute of Standards and Technology (NIST)
traceability and was capable of measurements over a wide dynamic range, with excellent
linearity from 5.8 E-6 fL up to 5.8 E+3 fL, using a High Gain Detector (SHD033) with a
photopic Y filter and R luminance barrel. The radiometer’s photopic-luminance head was
positioned on the front side of the Tri-Bar chart for continuous monitoring of target luminance,
which was recorded for each trial group/element reading.
2.2 Participants
Thirty-one Industrial Engineering students from Morgan State University, Baltimore, MD,
served as participants. These participants were between 18 and 30 years of age. All participants
had a minimum of 20/30 visual acuity (corrected or uncorrected) in both eyes, with normal color
vision and stereoscopic depth perception.
2.3 Procedures
The participant began the study by reading and signing a consent form. The participant was then
screened to ensure the visual requirements were met. Prior to a 30-min dark adaptation period,
the participant was given instructions on how to report the acuity level in terms of the group and
element number on the Tri-Bar chart. Information related to this training appears in appendix B.
The experimenter then confirmed the participant’s ability to read the Tri-Bar chart by pointing to
various group and element numbers and asking the participant to name them correctly. This
process continued until the participant gave six consecutive correct answers. Next, the
experimenter illustrated the full range of the Green-appearance scale by showing the participant
how the Tri-Bar chart looked at all the luminance levels.
The participant was then seated facing the Tri-Bar chart so that the center of the Tri-Bar chart
was perpendicular to the participant’s line of sight. The participant sat 12 ft from the chart, a
viewing distance selected so that the width of the smallest bars on the chart (Group -1/Element 6)
subtended 0.53 min of arc, corresponding to 20/11 acuity. Next, the participant adapted to the
dark for 30 min. The experimenter, due to dark adaptation considerations, presented the
7
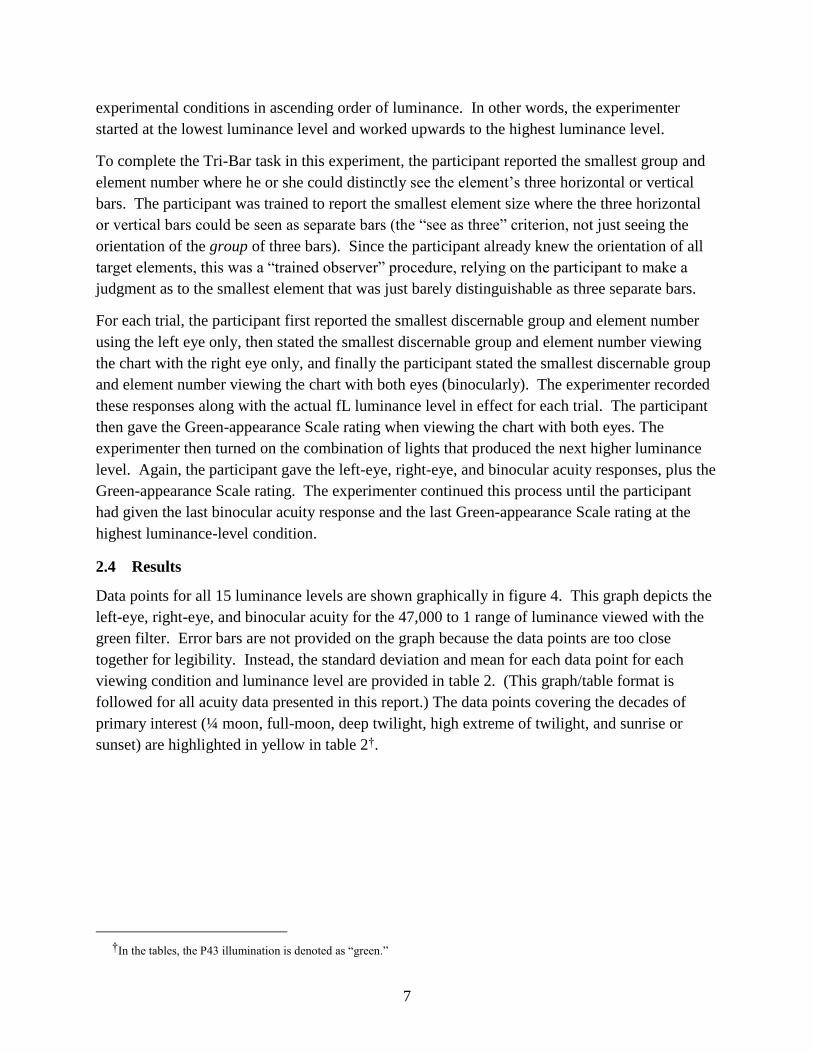
experimental conditions in ascending order of luminance. In other words, the experimenter
started at the lowest luminance level and worked upwards to the highest luminance level.
To complete the Tri-Bar task in this experiment, the participant reported the smallest group and
element number where he or she could distinctly see the element’s three horizontal or vertical
bars. The participant was trained to report the smallest element size where the three horizontal
or vertical bars could be seen as separate bars (the ―see as three‖ criterion, not just seeing the
orientation of the group of three bars). Since the participant already knew the orientation of all
target elements, this was a ―trained observer‖ procedure, relying on the participant to make a
judgment as to the smallest element that was just barely distinguishable as three separate bars.
For each trial, the participant first reported the smallest discernable group and element number
using the left eye only, then stated the smallest discernable group and element number viewing
the chart with the right eye only, and finally the participant stated the smallest discernable group
and element number viewing the chart with both eyes (binocularly). The experimenter recorded
these responses along with the actual fL luminance level in effect for each trial. The participant
then gave the Green-appearance Scale rating when viewing the chart with both eyes. The
experimenter then turned on the combination of lights that produced the next higher luminance
level. Again, the participant gave the left-eye, right-eye, and binocular acuity responses, plus the
Green-appearance Scale rating. The experimenter continued this process until the participant
had given the last binocular acuity response and the last Green-appearance Scale rating at the
highest luminance-level condition.
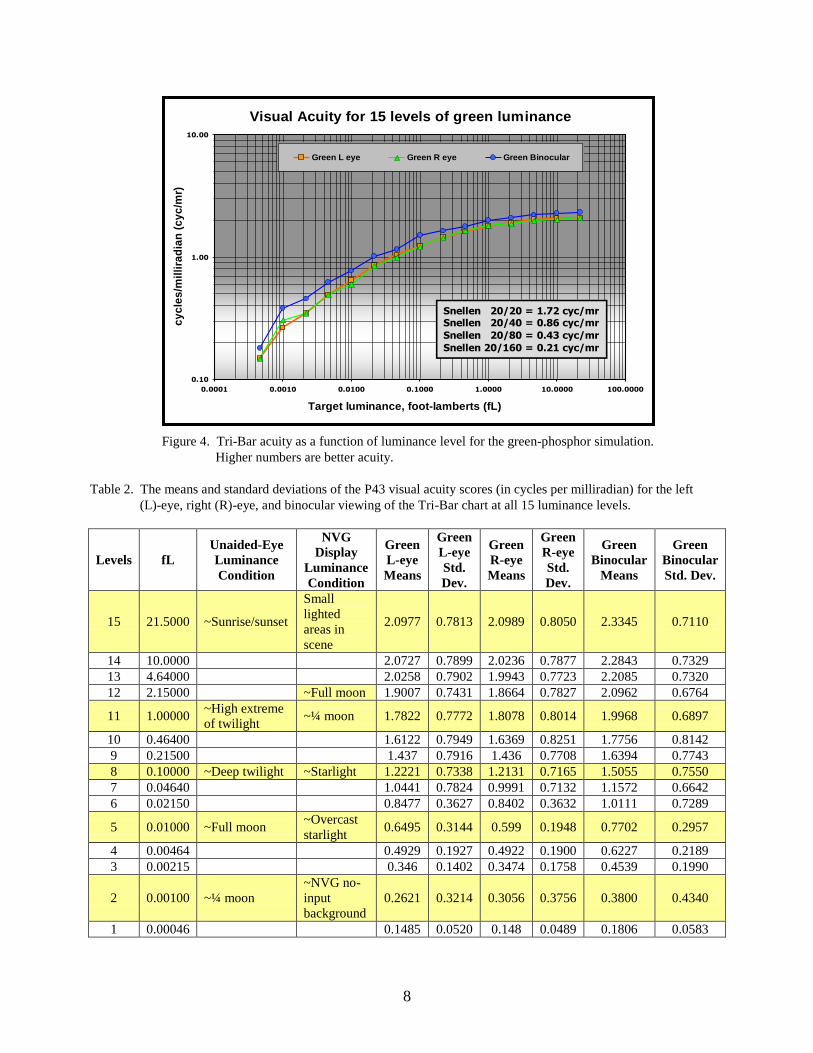
2.4 Results
Data points for all 15 luminance levels are shown graphically in figure 4. This graph depicts the
left-eye, right-eye, and binocular acuity for the 47,000 to 1 range of luminance viewed with the
green filter. Error bars are not provided on the graph because the data points are too close
together for legibility. Instead, the standard deviation and mean for each data point for each
viewing condition and luminance level are provided in table 2. (This graph/table format is
followed for all acuity data presented in this report.) The data points covering the decades of
primary interest (¼ moon, full-moon, deep twilight, high extreme of twilight, and sunrise or
sunset) are highlighted in yellow in table 2†.
†In the tables, the P43 illumination is denoted as ―green.‖
8
Figure 4. Tri-Bar acuity as a function of luminance level for the green-phosphor simulation.
Higher numbers are better acuity.
Table 2. The means and standard deviations of the P43 visual acuity scores (in cycles per milliradian) for the left
(L)-eye, right (R)-eye, and binocular viewing of the Tri-Bar chart at all 15 luminance levels.
Levels fL
Unaided-Eye
Luminance
Condition
NVG
Display
Luminance
Condition
Green
L-eye
Means
Green
L-eye
Std.
Dev.
Green
R-eye
Means
Green
R-eye
Std.
Dev.
Green
Binocular
Means
Green
Binocular
Std. Dev.
15 21.5000 ~Sunrise/sunset
Small
lighted
areas in
scene
2.0977 0.7813 2.0989 0.8050 2.3345 0.7110
14 10.0000 2.0727 0.7899 2.0236 0.7877 2.2843 0.7329
13 4.64000 2.0258 0.7902 1.9943 0.7723 2.2085 0.7320
12 2.15000 ~Full moon 1.9007 0.7431 1.8664 0.7827 2.0962 0.6764
11 1.00000 ~High extreme
of twilight ~¼ moon 1.7822 0.7772 1.8078 0.8014 1.9968 0.6897
10 0.46400 1.6122 0.7949 1.6369 0.8251 1.7756 0.8142
9 0.21500 1.437 0.7916 1.436 0.7708 1.6394 0.7743
8 0.10000 ~Deep twilight ~Starlight 1.2221 0.7338 1.2131 0.7165 1.5055 0.7550
7 0.04640 1.0441 0.7824 0.9991 0.7132 1.1572 0.6642
6 0.02150 0.8477 0.3627 0.8402 0.3632 1.0111 0.7289
5 0.01000 ~Full moon ~Overcast
starlight 0.6495 0.3144 0.599 0.1948 0.7702 0.2957
4 0.00464 0.4929 0.1927 0.4922 0.1900 0.6227 0.2189
3 0.00215 0.346 0.1402 0.3474 0.1758 0.4539 0.1990
2 0.00100 ~¼ moon
~NVG no-
input
background
0.2621 0.3214 0.3056 0.3756 0.3800 0.4340
1 0.00046 0.1485 0.0520 0.148 0.0489 0.1806 0.0583
Visual Acuity for 15 levels of green luminance
0.10
1.00
10.00
0.0001 0.0010 0.0100 0.1000 1.0000 10.0000 100.0000
Target luminance, foot-lamberts (fL)
cy
cle
s/m
illi
rad
ian
(c
yc
/mr)
Green L eye Green R eye Green Binocular
Snellen 20/20 = 1.72 cyc/mrSnellen 20/40 = 0.86 cyc/mr
Snellen 20/80 = 0.43 cyc/mr
Snellen 20/160 = 0.21 cyc/mr
9
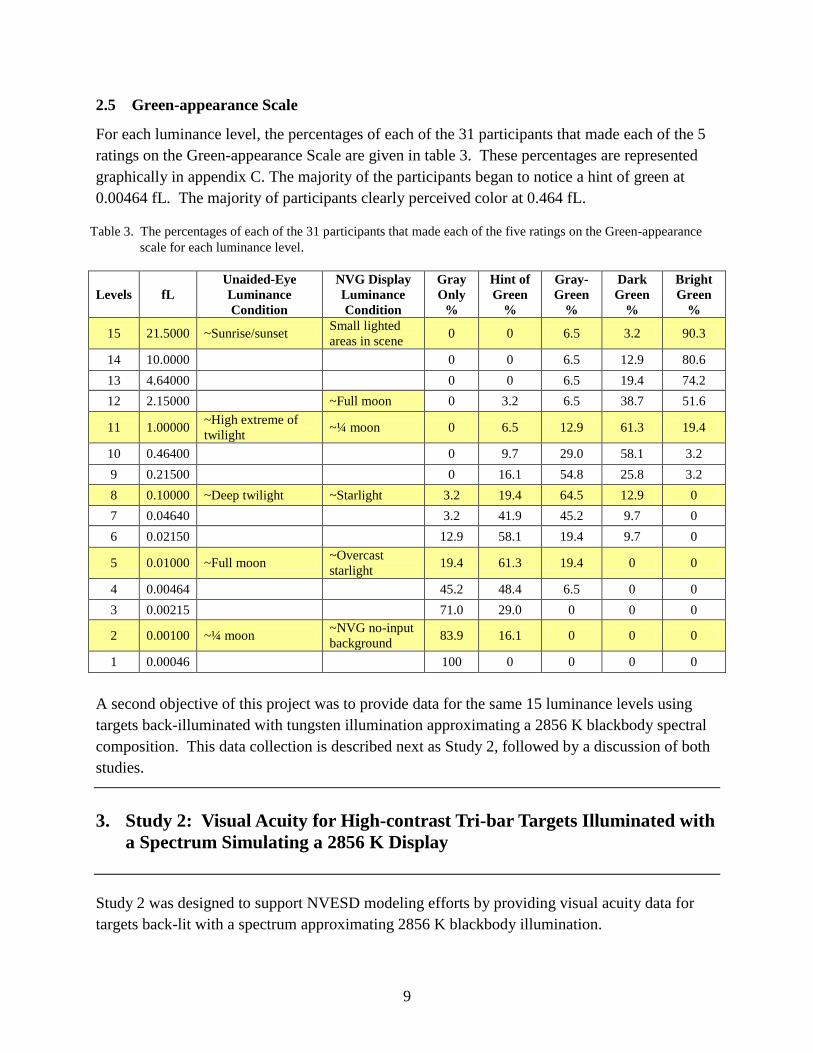
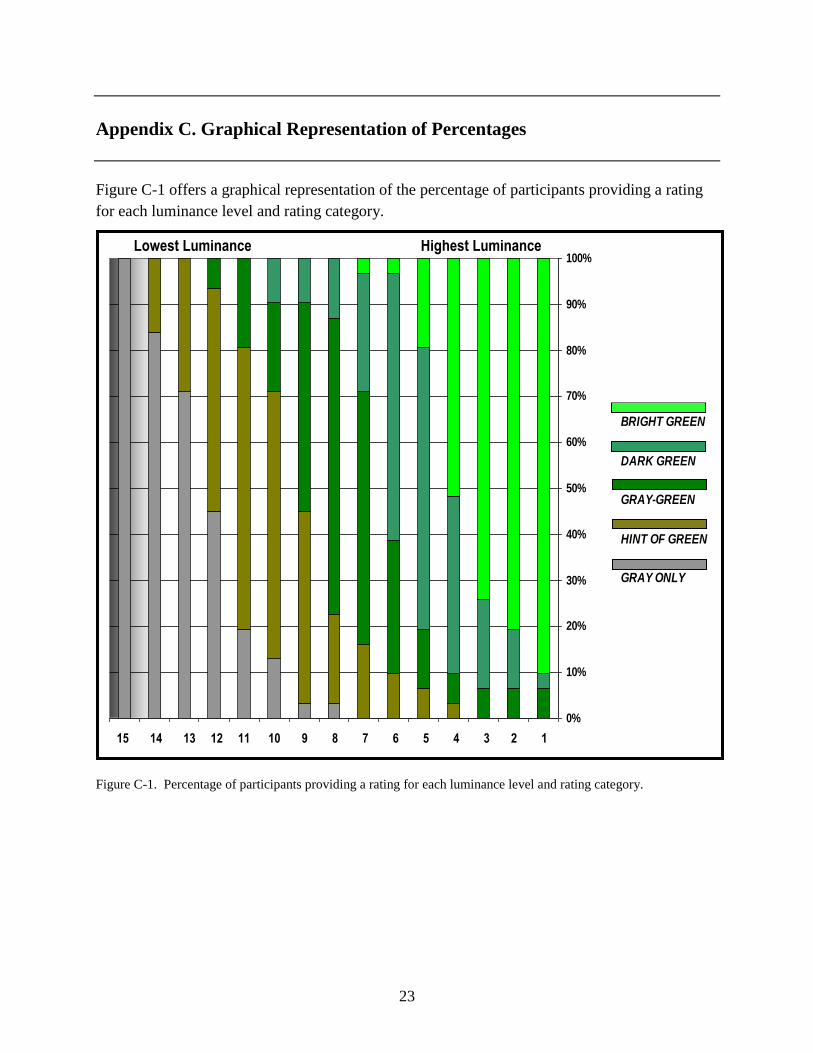
2.5 Green-appearance Scale
For each luminance level, the percentages of each of the 31 participants that made each of the 5
ratings on the Green-appearance Scale are given in table 3. These percentages are represented
graphically in appendix C. The majority of the participants began to notice a hint of green at
0.00464 fL. The majority of participants clearly perceived color at 0.464 fL.
Table 3. The percentages of each of the 31 participants that made each of the five ratings on the Green-appearance
scale for each luminance level.
Levels fL
Unaided-Eye
Luminance
Condition
NVG Display
Luminance
Condition
Gray
Only
%
Hint of
Green
%
Gray-
Green
%
Dark
Green
%
Bright
Green
%
15 21.5000 ~Sunrise/sunset Small lighted
areas in scene 0 0 6.5 3.2 90.3
14 10.0000 0 0 6.5 12.9 80.6
13 4.64000 0 0 6.5 19.4 74.2
12 2.15000 ~Full moon 0 3.2 6.5 38.7 51.6
11 1.00000 ~High extreme of
twilight ~¼ moon 0 6.5 12.9 61.3 19.4
10 0.46400 0 9.7 29.0 58.1 3.2
9 0.21500 0 16.1 54.8 25.8 3.2
8 0.10000 ~Deep twilight ~Starlight 3.2 19.4 64.5 12.9 0
7 0.04640 3.2 41.9 45.2 9.7 0
6 0.02150 12.9 58.1 19.4 9.7 0
5 0.01000 ~Full moon ~Overcast
starlight 19.4 61.3 19.4 0 0
4 0.00464 45.2 48.4 6.5 0 0
3 0.00215 71.0 29.0 0 0 0
2 0.00100 ~¼ moon ~NVG no-input
background 83.9 16.1 0 0 0
1 0.00046 100 0 0 0 0
A second objective of this project was to provide data for the same 15 luminance levels using
targets back-illuminated with tungsten illumination approximating a 2856 K blackbody spectral
composition. This data collection is described next as Study 2, followed by a discussion of both
studies.
3. Study 2: Visual Acuity for High-contrast Tri-bar Targets Illuminated with
a Spectrum Simulating a 2856 K Display
Study 2 was designed to support NVESD modeling efforts by providing visual acuity data for
targets back-lit with a spectrum approximating 2856 K blackbody illumination.
10
3.1 Method
3.1.1 Participants
Sixteen of the 31 Morgan participants who completed Study 1 participated again in Study 2. The
participants were between 18 and 30 years of age. All participants had a minimum of 20/30
acuity (corrected or uncorrected) in both eyes, with normal color vision and stereoscopic depth
perception. The selection of the subset of 16 was based exclusively on the experimenter’s ability
to locate the original participants, assumed to be a random selection process‡.
In addition to recalling a subset of 16 of the original 31 participants, four NVESD subject-matter
experts (SMEs), between the ages of 35 and 52, were included in this data collection. These four
participants were tested prior to testing the 16 Morgan participants. The NVESD participants
had a minimum of 20/30 acuity (corrected or uncorrected) in both eyes, with normal color vision
and stereoscopic depth perception. Their data are reported here separately from the data from the
Morgan participants because of potential differences that could be attributable to age or
experience in reading Tri-Bar charts.
All procedures and apparatus for Study 2 were the same as in Study 1, except that the green filter
behind the Tri-Bar chart was removed. The chart was back-lit with the same tungsten-bulb
apparatus, approximating the spectral composition of 2856 K blackbody illumination.
3.1.2 Results
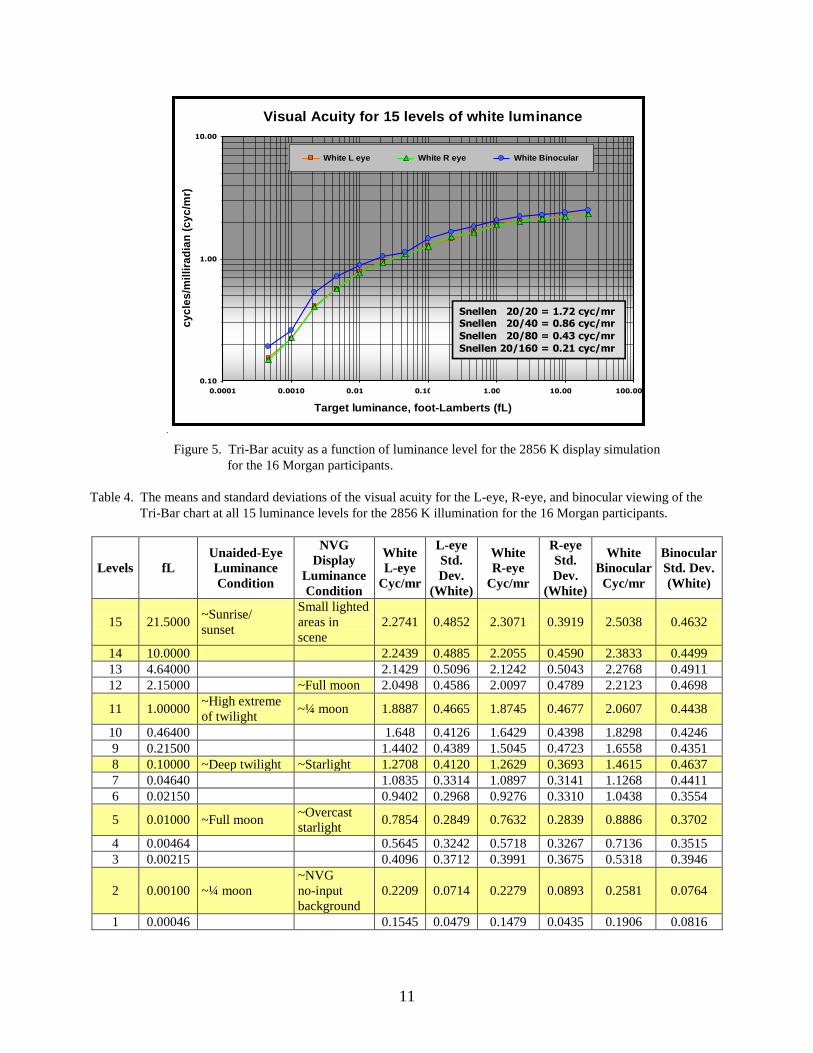
Figure 5 presents a graph of the left-eye, right-eye, and binocular acuity for all 15 luminance
levels for the 16 Morgan participants viewing the Tri-Bar chart with no filter (the 2856 K-display
simulation). Table 4 provides the means and standard deviations for the unaided visual acuity
data using the 2856 K display for all luminance levels for the 16 Morgan participants who
completed Study 2. In the tables, the 2856 K illumination is denoted as ―white.‖
‡There is no reason to believe that our ability to locate any given participant would be related to his or her visual acuity.
11
Figure 5. Tri-Bar acuity as a function of luminance level for the 2856 K display simulation
for the 16 Morgan participants.
Table 4. The means and standard deviations of the visual acuity for the L-eye, R-eye, and binocular viewing of the
Tri-Bar chart at all 15 luminance levels for the 2856 K illumination for the 16 Morgan participants.
Levels fL
Unaided-Eye
Luminance
Condition
NVG
Display
Luminance
Condition
White
L-eye
Cyc/mr
L-eye
Std.
Dev.
(White)
White
R-eye
Cyc/mr
R-eye
Std.
Dev.
(White)
White
Binocular
Cyc/mr
Binocular
Std. Dev.
(White)
15 21.5000 ~Sunrise/
sunset
Small lighted
areas in
scene
2.2741 0.4852 2.3071 0.3919 2.5038 0.4632
14 10.0000 2.2439 0.4885 2.2055 0.4590 2.3833 0.4499
13 4.64000 2.1429 0.5096 2.1242 0.5043 2.2768 0.4911
12 2.15000 ~Full moon 2.0498 0.4586 2.0097 0.4789 2.2123 0.4698
11 1.00000 ~High extreme
of twilight ~¼ moon 1.8887 0.4665 1.8745 0.4677 2.0607 0.4438
10 0.46400 1.648 0.4126 1.6429 0.4398 1.8298 0.4246
9 0.21500 1.4402 0.4389 1.5045 0.4723 1.6558 0.4351
8 0.10000 ~Deep twilight ~Starlight 1.2708 0.4120 1.2629 0.3693 1.4615 0.4637
7 0.04640 1.0835 0.3314 1.0897 0.3141 1.1268 0.4411
6 0.02150 0.9402 0.2968 0.9276 0.3310 1.0438 0.3554
5 0.01000 ~Full moon ~Overcast
starlight 0.7854 0.2849 0.7632 0.2839 0.8886 0.3702
4 0.00464 0.5645 0.3242 0.5718 0.3267 0.7136 0.3515
3 0.00215 0.4096 0.3712 0.3991 0.3675 0.5318 0.3946
2 0.00100 ~¼ moon
~NVG
no-input
background
0.2209 0.0714 0.2279 0.0893 0.2581 0.0764
1 0.00046 0.1545 0.0479 0.1479 0.0435 0.1906 0.0816
Visual Acuity for 15 levels of white luminance
0.10
1.00
10.00
0.0001 0.0010 0.0100 0.1000 1.0000 10.0000 100.0000
Target luminance, foot-Lamberts (fL)
cy
cle
s/m
illi
rad
ian
(c
yc
/mr)
White L eye White R eye White Binocular
Snellen 20/20 = 1.72 cyc/mrSnellen 20/40 = 0.86 cyc/mr
Snellen 20/80 = 0.43 cyc/mr
Snellen 20/160 = 0.21 cyc/mr
12
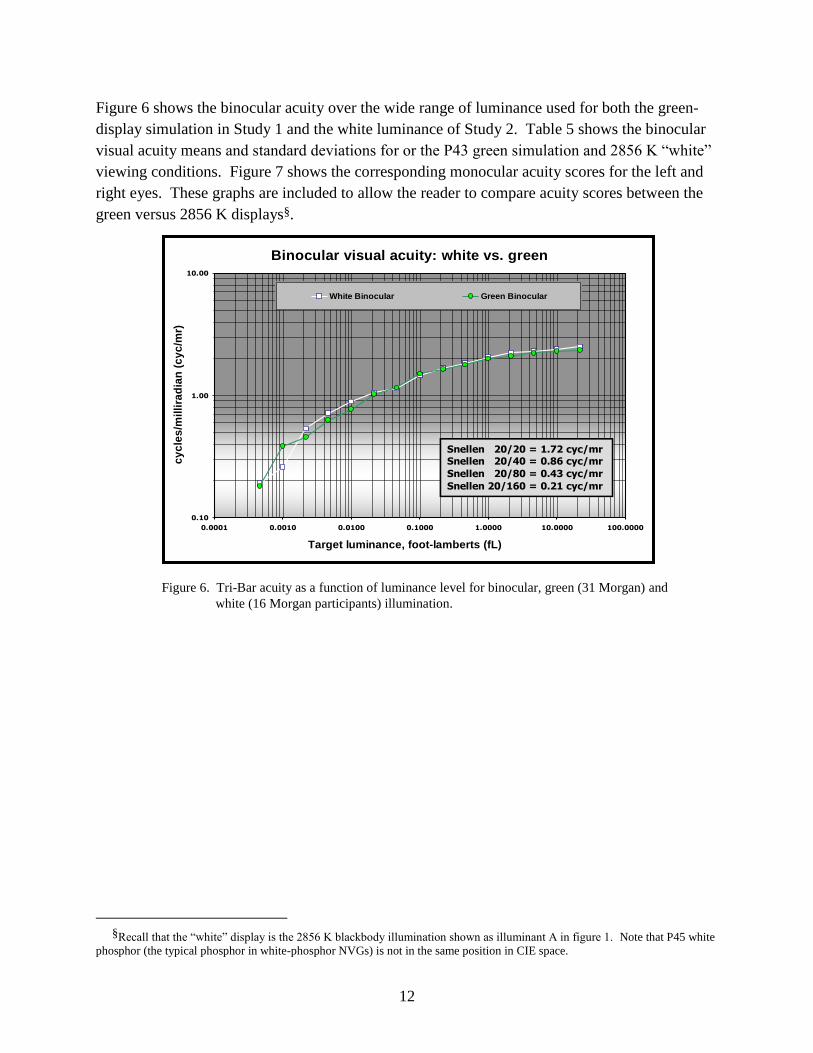
Figure 6 shows the binocular acuity over the wide range of luminance used for both the green-
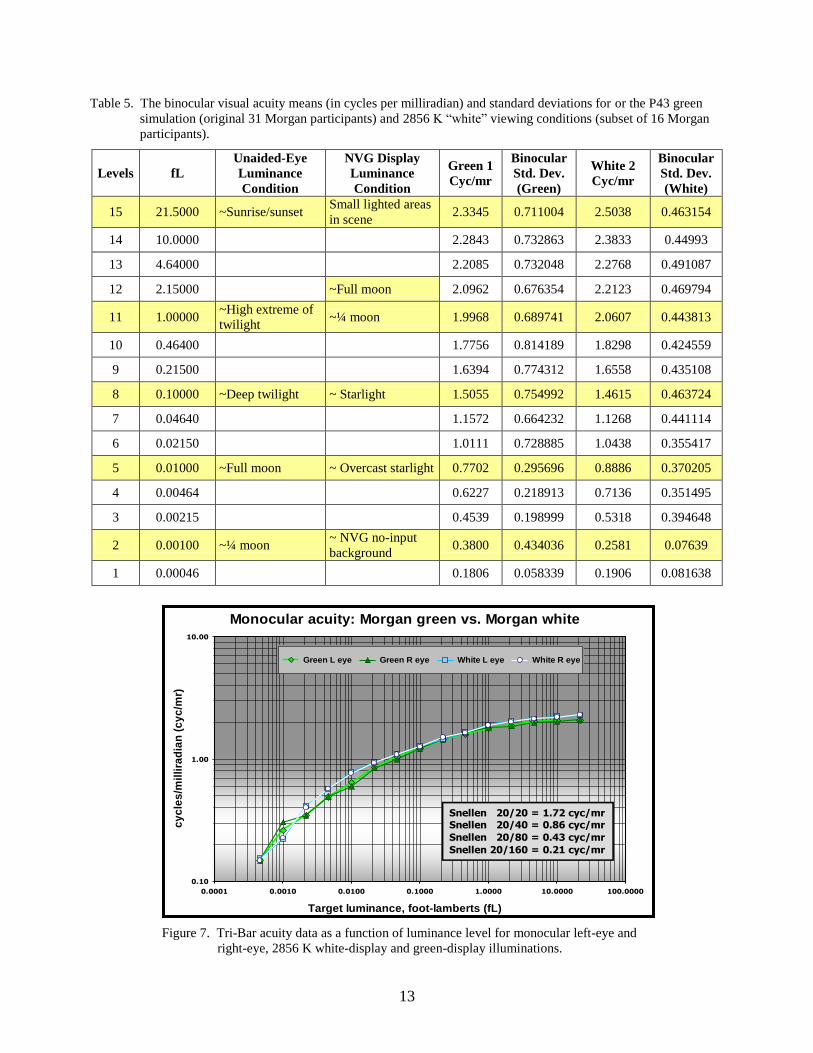
display simulation in Study 1 and the white luminance of Study 2. Table 5 shows the binocular
visual acuity means and standard deviations for or the P43 green simulation and 2856 K ―white‖
viewing conditions. Figure 7 shows the corresponding monocular acuity scores for the left and
right eyes. These graphs are included to allow the reader to compare acuity scores between the
green versus 2856 K displays§.
Figure 6. Tri-Bar acuity as a function of luminance level for binocular, green (31 Morgan) and
white (16 Morgan participants) illumination.
§Recall that the ―white‖ display is the 2856 K blackbody illumination shown as illuminant A in figure 1. Note that P45 white
phosphor (the typical phosphor in white-phosphor NVGs) is not in the same position in CIE space.
Binocular visual acuity: white vs. green
0.10
1.00
10.00
0.0001 0.0010 0.0100 0.1000 1.0000 10.0000 100.0000
Target luminance, foot-lamberts (fL)
cy
cle
s/m
illi
rad
ian
(c
yc
/mr)
White Binocular Green Binocular
Snellen 20/20 = 1.72 cyc/mrSnellen 20/40 = 0.86 cyc/mr
Snellen 20/80 = 0.43 cyc/mr
Snellen 20/160 = 0.21 cyc/mr
13
Table 5. The binocular visual acuity means (in cycles per milliradian) and standard deviations for or the P43 green
simulation (original 31 Morgan participants) and 2856 K ―white‖ viewing conditions (subset of 16 Morgan
participants).
Levels fL
Unaided-Eye
Luminance
Condition
NVG Display
Luminance
Condition
Green 1
Cyc/mr
Binocular
Std. Dev.
(Green)
White 2
Cyc/mr
Binocular
Std. Dev.
(White)
15 21.5000 ~Sunrise/sunset Small lighted areas
in scene 2.3345 0.711004 2.5038 0.463154
14 10.0000 2.2843 0.732863 2.3833 0.44993
13 4.64000 2.2085 0.732048 2.2768 0.491087
12 2.15000 ~Full moon 2.0962 0.676354 2.2123 0.469794
11 1.00000 ~High extreme of
twilight ~¼ moon 1.9968 0.689741 2.0607 0.443813
10 0.46400 1.7756 0.814189 1.8298 0.424559
9 0.21500 1.6394 0.774312 1.6558 0.435108
8 0.10000 ~Deep twilight ~ Starlight 1.5055 0.754992 1.4615 0.463724
7 0.04640 1.1572 0.664232 1.1268 0.441114
6 0.02150 1.0111 0.728885 1.0438 0.355417
5 0.01000 ~Full moon ~ Overcast starlight 0.7702 0.295696 0.8886 0.370205
4 0.00464 0.6227 0.218913 0.7136 0.351495
3 0.00215 0.4539 0.198999 0.5318 0.394648
2 0.00100 ~¼ moon ~ NVG no-input
background 0.3800 0.434036 0.2581 0.07639
1 0.00046 0.1806 0.058339 0.1906 0.081638
Figure 7. Tri-Bar acuity data as a function of luminance level for monocular left-eye and
right-eye, 2856 K white-display and green-display illuminations.
Monocular acuity: Morgan green vs. Morgan white
0.10
1.00
10.00
0.0001 0.0010 0.0100 0.1000 1.0000 10.0000 100.0000
Target luminance, foot-lamberts (fL)
cy
cle
s/m
illi
rad
ian
(c
yc
/mr)
Green L eye Green R eye White L eye White R eye
Snellen 20/20 = 1.72 cyc/mrSnellen 20/40 = 0.86 cyc/mr
Snellen 20/80 = 0.43 cyc/mr
Snellen 20/160 = 0.21 cyc/mr
14
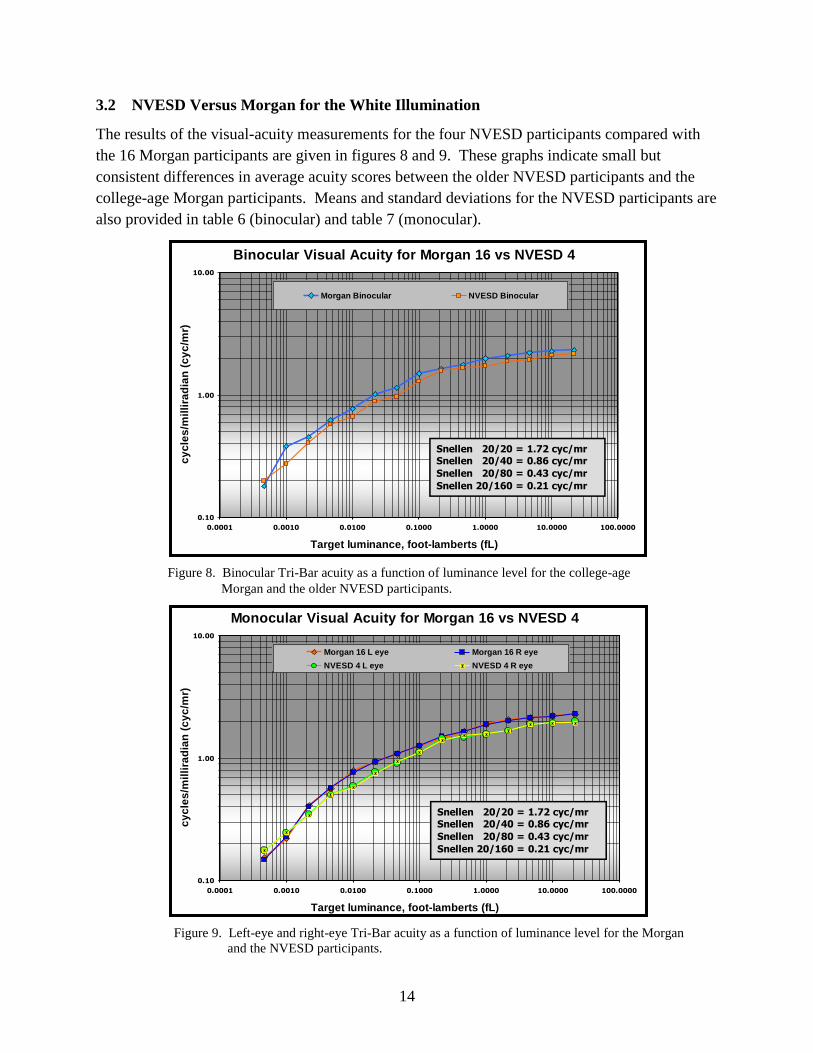
3.2 NVESD Versus Morgan for the White Illumination
The results of the visual-acuity measurements for the four NVESD participants compared with
the 16 Morgan participants are given in figures 8 and 9. These graphs indicate small but
consistent differences in average acuity scores between the older NVESD participants and the
college-age Morgan participants. Means and standard deviations for the NVESD participants are
also provided in table 6 (binocular) and table 7 (monocular).
Figure 8. Binocular Tri-Bar acuity as a function of luminance level for the college-age
Morgan and the older NVESD participants.
Figure 9. Left-eye and right-eye Tri-Bar acuity as a function of luminance level for the Morgan
and the NVESD participants.
Binocular Visual Acuity for Morgan 16 vs NVESD 4
0.10
1.00
10.00
0.0001 0.0010 0.0100 0.1000 1.0000 10.0000 100.0000
Target luminance, foot-lamberts (fL)
cy
cle
s/m
illi
rad
ian
(c
yc
/mr)
Morgan Binocular NVESD Binocular
Snellen 20/20 = 1.72 cyc/mrSnellen 20/40 = 0.86 cyc/mr
Snellen 20/80 = 0.43 cyc/mr
Snellen 20/160 = 0.21 cyc/mr
Monocular Visual Acuity for Morgan 16 vs NVESD 4
0.10
1.00
10.00
0.0001 0.0010 0.0100 0.1000 1.0000 10.0000 100.0000
Target luminance, foot-lamberts (fL)
cy
cle
s/m
illi
rad
ian
(c
yc
/mr)
Morgan 16 L eye Morgan 16 R eye
NVESD 4 L eye NVESD 4 R eye
Snellen 20/20 = 1.72 cyc/mrSnellen 20/40 = 0.86 cyc/mr
Snellen 20/80 = 0.43 cyc/mr
Snellen 20/160 = 0.21 cyc/mr
15
Table 6. The luminance levels, means, and standard deviations of the binocular visual acuity for the white lighting
conditions of the four NVESD participants.
Levels fL
Unaided-Eye
Luminance
Condition
NVG Display
Luminance
Condition
NVESD White
Cyc/mr
Binocular Std.
Dev.
15 21.5000 ~Sunrise/sunset Small lighted areas in
scene 2.165493 0
14 10.0000 2.106429 0.118129
13 4.64000 1.929235 0
12 2.15000 ~Full moon 1.876614 0.105241
11 1.00000 ~High extreme of
twilight ~¼ moon 1.718753 0
10 0.46400 1.671873 0.093759
9 0.21500 1.578114 0.093759
8 0.10000 ~Deep twilight ~Starlight 1.293818 0.140714
7 0.04640 0.96784 0.091266
6 0.02150 0.885687 0.052621
5 0.01000 ~Full moon ~Overcast starlight 0.663483 0.037208
4 0.00464 0.57836 0.086047
3 0.00215 0.407527 0.044322
2 0.00100 ~¼ moon ~NVG no-input
background 0.273301 0.041987
1 0.00046 0.198621 0.030016
16
Table 7. The light levels, means, and standard deviations of the monocular visual acuity for the white lighting
conditions of the four NVESD participants.
Levels fL
Unaided-Eye
Luminance
Condition
NVG Display
Luminance
Condition
NVESD
White
L-eye
Cyc/mr
L-eye
Std.
Dev.
(White)
NVESD
White
R-eye
Cyc/mr
R-eye
Std.
Dev.
(White)
15 21.5000 ~Sunrise/sunset Small lighted
areas in scene 1.9883 0.118129 1.929235 0
14 10.0000 1.929235 0 1.929235 0
13 4.64000 1.876614 0.105241 1.876614 0.105241
12 2.15000 ~Full moon 1.671873 0.093759 1.671873 0.093759
11 1.00000 ~High extreme of
twilight ~¼ moon 1.583229 0.170706 1.578114 0.093759
10 0.46400 1.48947 0.08353 1.531235 0
9 0.21500 1.447705 0.096452 1.40594 0.08353
8 0.10000 ~Deep twilight ~Starlight 1.119512 0.120707 1.119512 0.120707
7 0.04640 0.911997 0.060761 0.941529 0.106417
6 0.02150 0.768175 0.072438 0.747292 0.084463
5 0.01000 ~Full moon ~Overcast
starlight 0.591097 0.033149 0.57633 0.062681
4 0.00464 0.50354 0.095396 0.50354 0.095396
3 0.00215 0.347395 0.070827 0.340818 0.083982
2 0.00100 ~¼ moon ~NVG no-input
background 0.245646 0.050082 0.245646 0.050082
1 0.00046 0.176952 0.026741 0.176952 0.026741
3. Conclusions
To support NVESD modeling efforts, this study was designed to collect data on unaided visual
acuity as a function of a large range of luminance levels for two different spectral compositions.
For Studies 1 and 2, the acuity tasks were designed to eliminate the visual noise that is typical of
NVG displays at low light levels. For Study 1, the chart was back-lit with 2856 K blackbody
tungsten illumination passed through a green filter. For Study 2, the green filter was removed so
the chart was back-lit only with 2856 K blackbody tungsten illumination. We also introduced a
new technique—the Green-appearance Scale—to determine the luminance level at which
participants transitioned from scotopic viewing of a Tri-Bar chart to mesopic viewing, and from
mesopic viewing to photopic viewing. For each luminance level, data points are provided
representing the mean visual acuity scores (averaged across the participants) for L-eye, R-eye,
and binocular viewing. Our objective was to provide descriptive data to the NVESD, rather than
a data summary that would include inferential statistics.
17
One general comment about these data-collection activities is that the Tri-Bar chart and
methodology used in these studies depends on an honest and consistent assessment from a
―trained observer‖ as to the smallest element that was just barely distinguishable as three
separate bars. We attempted to motivate the participants during the experimental-overview
process about the importance of honest responses, and we believe we were successful. A
verifiable method, however, would be preferred to allow the experimenter to confirm each
participant’s performance. Future research will address this issue by using a test chart with
Sloan characters (Ricci, Cedrone, and Cerulli, 1998). A test chart with Sloan characters requires
a participant to identify the letters correctly, allowing the experimenter to verify the participant’s
accuracy.
This study provides acuity data for observers viewing a Tri-Bar chart with luminance conditions
simulating the P43 green-phosphor and luminance conditions simulating a 2856 K display. The
2856 K simulation was not intended, however, to provide the basis for an acuity comparison for
P43 green-phosphor versus P45 white-phosphor displays. To address a comparison of these two
phosphors, we conducted a study to examine the effect of phosphor type (white versus green) on
visual acuity across a range of illumination conditions created using neutral density (ND) filters
placed over the eyepieces of actual NVGs. This ND-filter approach allowed us to avoid the
increasing scintillation and noise that is typical of current NVG displays operating in low
luminance conditions. This study is described in a separate report (currently under review)
comparing P43 and P45 phosphors.
18
4. References
Capo´-Aponte, J. E.; Temme, L. A.; Task, H. L. et al. Visual Perception and Cognitive
Performance. In Helmet-Mounted Displays: Sensation, Perception and Cognitive Issues.
Rash, C. E.; Russo, M. B.; Letowski, T. R.; Schmeisser, E. T., eds., U.S. Army Aeromedical
Research Laboratory, Fort Rucker, AL, 2009, 335–390.
Ricci, F.; Cedrone, C.; Cerulli, L. Standardized Measurement of Visual Acuity. Ophthalmic
Epidemiology 1998, 5 (1), 41–53.
Task, H. L. Night Vision Goggle Visual Acuity Assessment: Results of an Interagency Test.
Proceedings of the SPIE- The International Society of Optical Engineering: Helmet- and
Head-Mounted Displays VI, 4361, 2001, 130–137.
Task, H. L.; Pinkus, A. R. Theoretical and Applied Aspects of Night Vision Goggle Resolution
and Visual Acuity Assessment. Proceedings of the SPIE- The International Society of
Optical Engineering: Helmet- and Head-Mounted Displays Xll, 6557, 2007, 1–11.
19
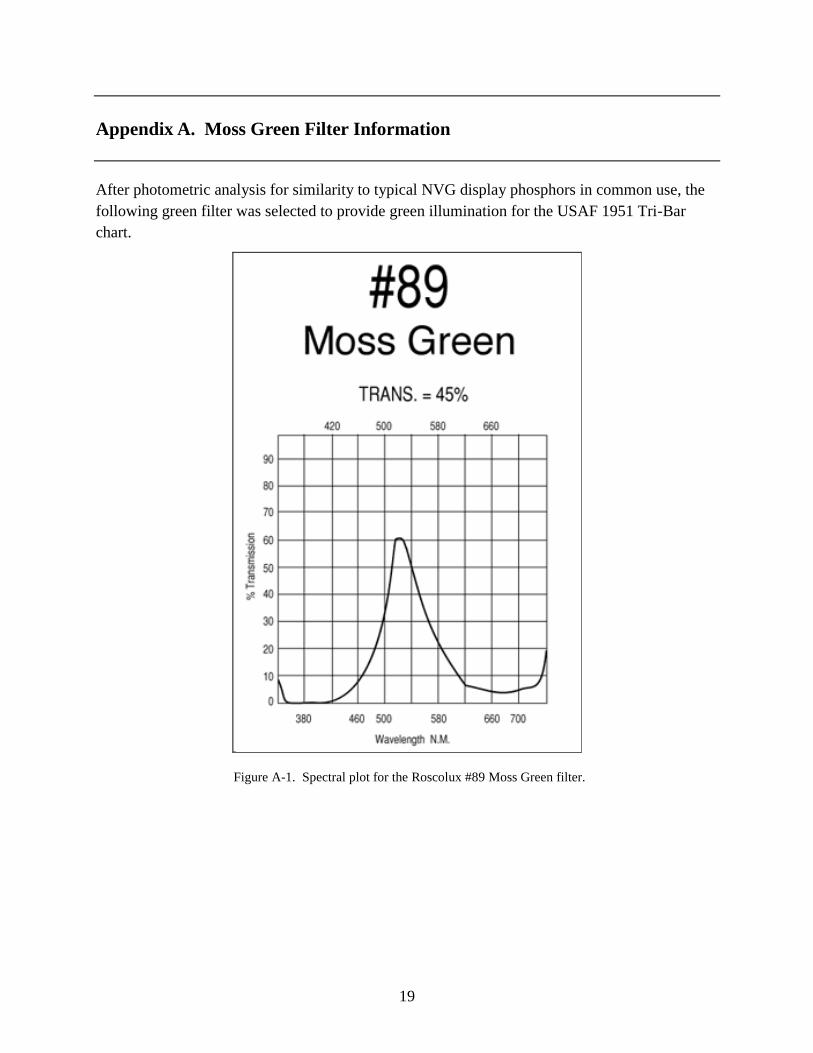
Appendix A. Moss Green Filter Information
After photometric analysis for similarity to typical NVG display phosphors in common use, the
following green filter was selected to provide green illumination for the USAF 1951 Tri-Bar
chart.
Figure A-1. Spectral plot for the Roscolux #89 Moss Green filter.
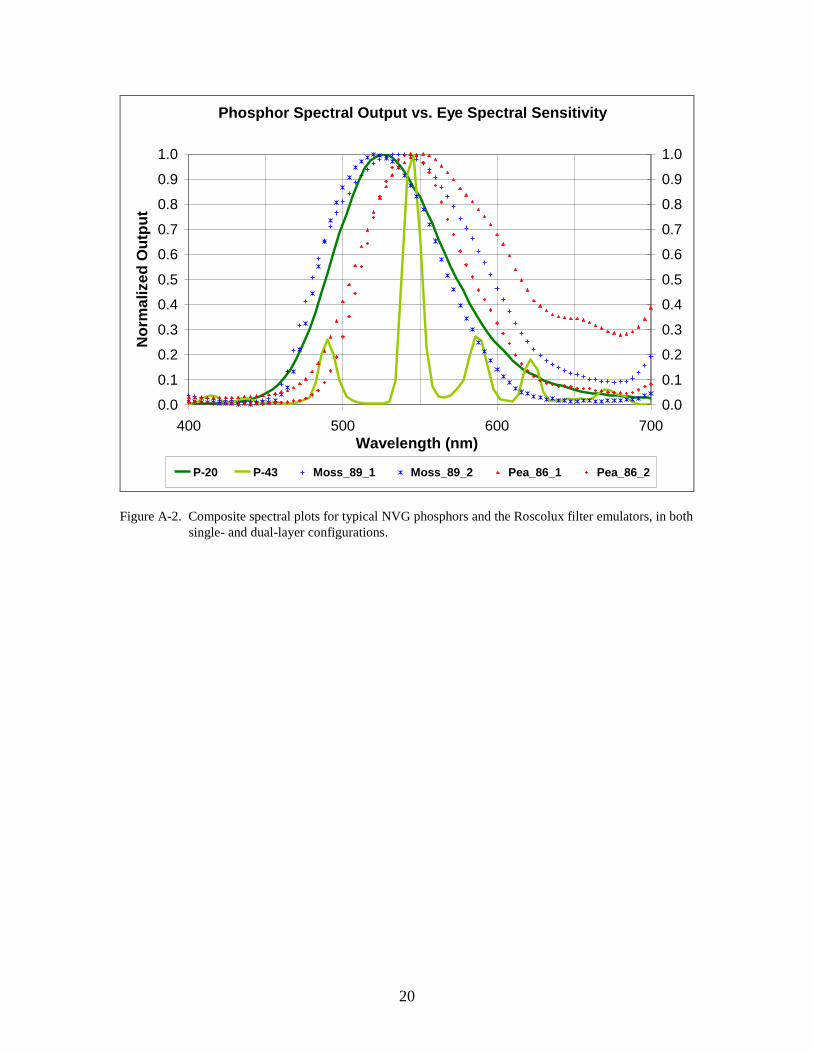
20
Figure A-2. Composite spectral plots for typical NVG phosphors and the Roscolux filter emulators, in both
single- and dual-layer configurations.
Phosphor Spectral Output vs. Eye Spectral Sensitivity
0.0
0.1
0.2
0.3
0.4
0.5
0.6
0.7
0.8
0.9
1.0
400 500 600 700
Wavelength (nm)
No
rma
lize
d O
utp
ut
0.0
0.1
0.2
0.3
0.4
0.5
0.6
0.7
0.8
0.9
1.0
P-20 P-43 Moss_89_1 Moss_89_2 Pea_86_1 Pea_86_2
21
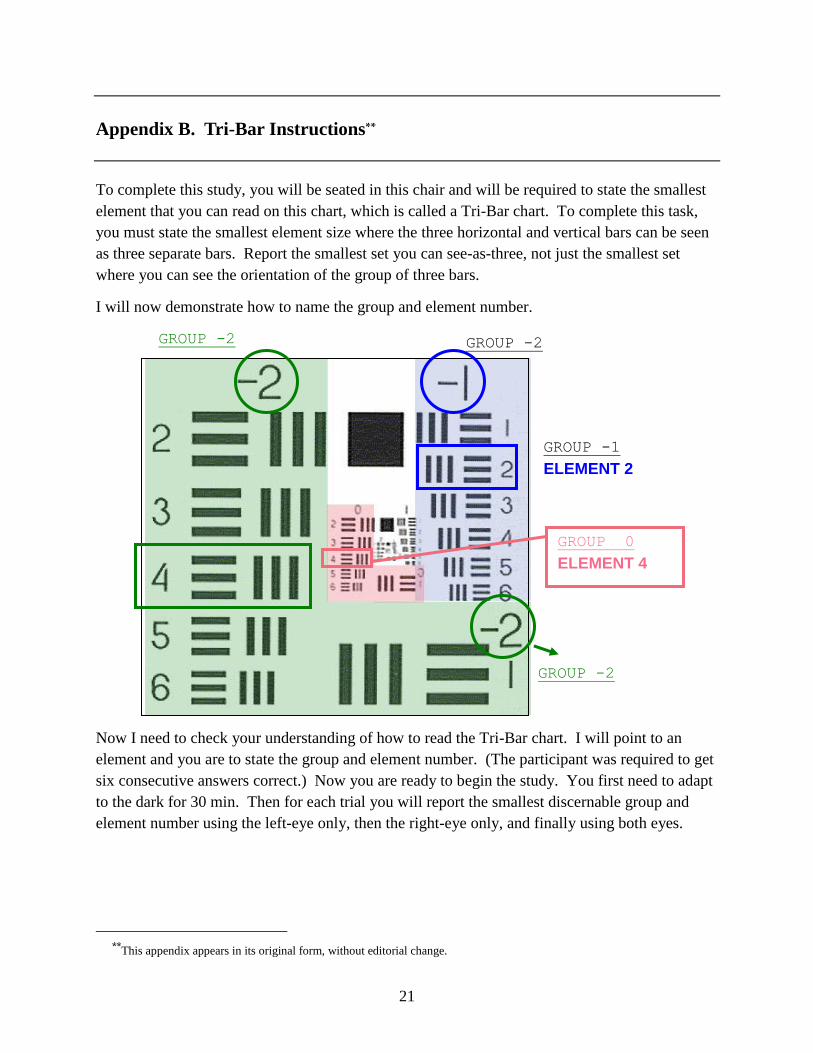
Appendix B. Tri-Bar Instructions**
To complete this study, you will be seated in this chair and will be required to state the smallest
element that you can read on this chart, which is called a Tri-Bar chart. To complete this task,
you must state the smallest element size where the three horizontal and vertical bars can be seen
as three separate bars. Report the smallest set you can see-as-three, not just the smallest set
where you can see the orientation of the group of three bars.
I will now demonstrate how to name the group and element number.
Now I need to check your understanding of how to read the Tri-Bar chart. I will point to an
element and you are to state the group and element number. (The participant was required to get
six consecutive answers correct.) Now you are ready to begin the study. You first need to adapt
to the dark for 30 min. Then for each trial you will report the smallest discernable group and
element number using the left-eye only, then the right-eye only, and finally using both eyes.
**This appendix appears in its original form, without editorial change.
GROUP -2
GROUP -2
GROUP -1
ELEMENT 2
GROUP 0
ELEMENT 4
GROUP -2
22
INTENTIONALLY LEFT BLANK.
23
Appendix C. Graphical Representation of Percentages
Figure C-1 offers a graphical representation of the percentage of participants providing a rating
for each luminance level and rating category.
Figure C-1. Percentage of participants providing a rating for each luminance level and rating category.
0%
10%
20%
30%
40%
50%
60%
70%
80%
90%
100%
123456789101112131415
BRIGHT GREEN
DARK GREEN
GRAY-GREEN
HINT OF GREEN
GRAY ONLY
Lowest Luminance Highest Luminance
Highest Luminance Lowest Luminance
15 14 13 12 11 10 9 8 7 6 5 4 3 2 1
24
INTENTIONALLY LEFT BLANK.
25
List of Symbols, Abbreviations, and Acronyms
CERDEC Communications-Electronics Research Development and Engineering Center
CIE International Commission on Illumination
I2 image-intensifier
ND neutral density
NIST National Institute of Standards and Technology
NVDs night vision devices
NVESD Night Vision and Electronic Sensors Directorate
NVGs night vision goggles
RDECOM Research Development and Engineering Command
USAF U.S. Air Force
NO. OF
COPIES ORGANIZATION
26
1 DEFENSE TECHNICAL
(PDF INFORMATION CTR
only) DTIC OCA
8725 JOHN J KINGMAN RD
STE 0944
FORT BELVOIR VA 22060-6218
1 DIRECTOR
US ARMY RESEARCH LAB
IMNE ALC HRR
2800 POWDER MILL RD
ADELPHI MD 20783-1197
1 DIRECTOR
US ARMY RESEARCH LAB
RDRL CIM L
2800 POWDER MILL RD
ADELPHI MD 20783-1197
1 DIRECTOR
US ARMY RESEARCH LAB
RDRL CIM P
2800 POWDER MILL RD
ADELPHI MD 20783-1197
1 DIRECTOR
US ARMY RESEARCH LAB
RDRL D
2800 POWDER MILL RD
ADELPHI MD 20783-1197
ABERDEEN PROVING GROUND
1 DIR USARL
RDRL CIM G (BLDG 4600)
NO. OF NO. OF
COPIES ORGANIZATION COPIES ORGANIZATION
27
1 ARMY RSCH LABORATORY – HRED
RDRL HRM A J MARTIN
MYER CENTER BLDG 2700 RM 2D311
FORT MONMOUTH NJ 07703-5601
1 ARMY RSCH LABORATORY – HRED
RDRL HRM C A DAVISON
320 MANSCEN LOOP STE 115
FORT LEONARD WOOD MO 65473
2 ARMY RSCH LABORATORY – HRED
RDRL HRM DI T DAVIS
RDRL HRM AJ J HANSBERGER
BLDG 5400 RM C242
REDSTONE ARSENAL AL 35898-7290
1 ARMY RSCH LABORATORY – HRED
RDRL HRS EA DR V J RICE
BLDG 4011 RM 217
1750 GREELEY RD
FORT SAM HOUSTON TX 78234-5002
1 ARMY RSCH LABORATORY – HRED
RDRL HRM DG K GUNN
BLDG 333
PICATINNY ARSENAL NJ 07806-5000
1 ARMY RSCH LABORATORY – HRED
ARMC FIELD ELEMENT
RDRL HRM CH C BURNS
THIRD AVE BLDG 1467B RM 336
FORT KNOX KY 40121
1 ARMY RSCH LABORATORY – HRED
AWC FIELD ELEMENT
RDRL HRM DJ D DURBIN
BLDG 4506 (DCD) RM 107
FORT RUCKER AL 36362-5000
1 ARMY RSCH LABORATORY – HRED
RDRL HRM CK J REINHART
10125 KINGMAN RD
FORT BELVOIR VA 22060-5828
1 ARMY RSCH LABORATORY – HRED
RDRL HRM AY M BARNES
2520 HEALY AVE
STE 1172 BLDG 51005
FORT HUACHUCA AZ 85613-7069
1 ARMY RSCH LABORATORY – HRED
RDRL HR MP D UNGVARSKY
POPE HALL BLDG 470
BCBL 806 HARRISON DR
FORT LEAVENWORTH KS 66027-2302
1 ARMY RSCH LABORATORY – HRED
RDRL HRM DQ M R FLETCHER
NATICK SOLDIER CTR
AMSRD NSC WS E BLDG 3 RM 343
NATICK MA 01760-5020
1 ARMY RSCH LABORATORY – HRED
RDRL HRM AT J CHEN
12350 RESEARCH PKWY
ORLANDO FL 32826-3276
1 ARMY RSCH LABORATORY – HRED
RDRL HRM AT C KORTENHAUS
12350 RESEARCH PKWY
ORLANDO FL 32826
1 ARMY RSCH LABORATORY – HRED
RDRL HRM AS C MANASCO
SIGNAL TOWERS
BLDG 29808A RM 303A
FORT GORDON GA 30905-5233
1 ARMY RSCH LABORATORY – HRED
RDRL HRM CU
6501 E 11 MILE RD MS 284
BLDG 200A 2ND FL RM 2104
WARREN MI 48397-5000
1 ARMY RSCH LABORATORY – HRED
FIRES CTR OF EXCELLENCE
FIELD ELEMENT
RDRL HRM AF C HERNANDEZ
3040 NW AUSTIN RD RM 221
FORT SILL OK 73503-9043
1 ARMY RSCH LABORATORY – HRED
RDRL HRM AV S MIDDLEBROOKS
91012 STATION AVE RM 348
FORT HOOD TX 76544-5073
1 ARMY RSCH LABORATORY – HRED
RDRL HRM CN R SPENCER
DCSFDI HF
HQ USASOC BLDG E2929
FORT BRAGG NC 28310-5000
NO. OF
COPIES ORGANIZATION
28
1 ARMY RSCH LABORATORY – HRED
RDRL HRM DW E REDDEN
BLDG 4 CL 60
FORT BENNING GA 31905-5400
1 ARMY G1
(CD DAPE MR B KNAPP
only) 300 ARMY PENTAGON RM 2C489
WASHINGTON DC 20310-0300
ABERDEEN PROVING GROUND
5 DIR USARL
RDRL CIM G
S FOPPIANO
RDRL HR
L ALLENDER
T LETOWSKI
RDRL HRM B
J LOCKETT
RDRL HRS D
B AMREIN
20 U.S. ARMY RDECOM CERDEC
NIGHT VISION & ELECTRONIC SENSORS DIRECTORATE
RDER NVS IM EDWARD J. BENDER
10221 BURBECK ROAD
BUILDING 305 ROOM 227
FORT BELVOIR VA 22060-5806
20 US ARMY RSCH LABORATORY – HRED
RDRL HRS D G CUQLOCK-KNOPP
BUILDING 520
ABERDEEN PROVING GROUND MD 21005