Embed Size (px)
Citation preview

Visual Analysis of Historic Hotel Visitation Patterns
Chris Weaver∗ David Fyfe† Anthony Robinson‡ Deryck Holdsworth§ Donna Peuquet¶
Alan M. MacEachren‖
The GeoVISTA Center and Department of GeographyPenn State University
ABSTRACT
Understanding the space and time characteristics of human interac-tion in complex social networks is a critical component of visualtools for intelligence analysis, consumer behavior analysis, and hu-man geography. Visual identification and comparison of patternsof recurring events is an essential feature of such tools. In this pa-per, we describe a tool for exploring hotel visitation patterns in andaround Rebersburg, Pennsylvania from 1898-1900. The tool usesa wrapping spreadsheet technique, called Reruns, to display cyclicpatterns of geographic events in multiple overlapping natural andartificial calendars. Implemented as an Improvise visualization, thetool is in active development through a iterative process of datacollection, hypothesis, design, discovery, and evaluation in closecollaboration with historical geographers. Several discoveries haveinspired ongoing data collection and plans to expand exploration toinclude historic weather records and railroad schedules. Using theE-Delphi method to conduct online, anonymous evaluations of us-ability and usefulness has resulted in numerous feature and designrecommendations.
CR Categories: D.2.2 [Software Engineering]: Design Tools andTechniques—User Interfaces; H.5.2 [Information Systems]: Infor-mation Interfaces and Presentation—User Interfaces
Keywords: geovisualization, exploratory visualization, historicalgeography, coordinated multiple views, travel pattern analysis
1 INTRODUCTION
As a part of the research and development agenda for visual analyt-ics [14], the development of integrated software for rapid construc-tion of visual data analysis tools is a recent focus of research in bothinformation and geographic visualization [10]. The goal is to allowusers to explore information that contains geospatial, temporal, andabstract components in a flexible, integrated, interactive graphicalenvironment that requires minimal training to use. In pursuit ofthis goal, Improvise [16] is an exploratory visualization softwareapplication written in Java that is freely available on the web un-der an open source license. In Improvise, analysts rapidly buildand browse multiple coordinated views of their data. What makesImprovise special is that it provides precise control over how in-teraction affects the presentation of space, time, and abstract dataattributes in and between multi-layer maps, scatter plots, parallelcoordinate plots, tables, spreadsheets, and other views. Most im-portantly, Improvise visualizations can be rapidly modified and ex-tended to develop hypotheses and exploit discoveries during ongo-ing geovisual exploration and analysis.
∗e-mail:[email protected]†e-mail:[email protected]‡e-mail:[email protected]§e-mail:[email protected]¶e-mail:[email protected]‖e-mail:[email protected]
This paper describes the evolutionary process of developing avisual tool for exploring visitation patterns in hotel guest registers.Genealogists and autograph collectors have long valued informa-tion found in historic hotel registers. Academic researchers can alsoextract a wealth of information about commercial and cultural con-nectivity patterns from these archival documents. Most registerscontain a date, name, and home town for each visitor. They mayalso include information such as whether the guest represented abusiness, minstrel show, or baseball team, whether they were trav-eling with a spouse, or whether they stabled a horse in the livery.
Starting with data transcribed from the guest register for the Re-bersburg Hotel in Rebersburg, PA from 1898-1900, the visualiza-tion evolved through an iterative process of creating views, popu-lating them with data, and coordinating them in terms of user in-teraction. This tightly integrated method of building and browsingvisualizations in Improvise makes it possible to realize and experi-ment with different displays of the hotel data in a matter of hours,including a multi-layer map of guest hometowns along railroadsand rivers, table views containing nested bar plots of visits overtime for individual guests and their residences, and an arc diagramshowing sequences of visits by guests and groups.
The key component of the visualization is a technique called re-runs that displays temporal information in a wrapping spreadsheet,thereby allowing exploration of cyclic temporal patterns acrossmultiple natural and artificial calendars. Extensive cross-filteringbetween the reruns view, map, and other views allows analysts tofollow chains of evidence involving complex groupings of people,dates, and places. Moreover, the data domain, rapid design ap-proach, and analysis process appear to be directly applicable to cur-rent efforts to develop visual tools for use in intelligence analysisand emergency response management.
Using the visualization, historical geographers have discoverednumerous interesting patterns that prompt a large increase in datacollection and a desire to expand exploration to include weather andtransportation information. Evaluation of the tool suggests strongsupport for continued efforts along these avenues as well.
2 DATA COLLECTION AND TRANSCRIPTION
The register for the Rebersburg Hotel [2] lists daily guests at a smallhotel in Rebersburg, a village in the Brush Valley region of Cen-tre County, Pennsylvania, between June 1898 and November 1900.All told there are 2411 guest entries. Some 219 different places oforigin are recorded, including 162 towns and cities in Pennsylva-nia, 14 in New York, and seven in Ohio, as well as 36 places in 13other states, plus Canada and a visitor from London, England. Withnearly a hundred guests each month signing the register from thiswide variety of places, thousands of data points represent patternsof local and regional connectivity. However, when analyzing theactual archival document (figure 1), patterns were not immediatelyapparent. Barely legible signatures and cryptic notations were be-wildering and the eye rested on the bizarre, such as a sketch of alog cabin added by a traveling vaudeville company or the battingline-up of a visiting baseball team.

Figure 1: The Rebersburg Hotel Register.
The data was transcribed into a spreadsheet so that visits couldbe sorted and temporal and spatial patterns discerned using compu-tational methods. The process of transcribing each entry into appro-priate columns in a spreadsheet took approximately 80 hours. Oncethe data was transcribed, the columns for guests and residenceswere sorted to check for errors and/or inconsistencies within thedataset. Place-name indexes were consulted to clarify settlementnames. Some place names could not be deciphered or located, norcould some surnames (overall, 6% of the data set was not legible).Summary tables were made for total number of visits per personand per declared home residence. Then, graphs of these tables werecreated to provide a visual representation of which visitors and res-idences appeared most often. Many guests appeared several timesthroughout the two-and-a-half-year period. Forty people registeredat the hotel on at least four occasions; one came 78 times. Furtherresearch using other archival resources revealed that some of theserepeat visitors were draymen (heavy cart drivers), hucksters (localpeddlers), and traveling salesmen. Three of the hucksters, A. M.Sheats, R. A. Sheats, and Harry Welshans, came to the hotel a com-bined 148 times from Booneville in neighboring Sugar Valley. Foreach of these men, the observed pattern of visits involves a singleday of the week: Tuesdays for Welshans, Fridays for both Sheats.E. K. Hess, a traveling salesman from Williamsport, paid 40 visitsto the hotel. Like the Booneville hucksters, his visits were also pre-dominantly on a single day, in his case Thursdays, with very fewvisits on any other day of the week. A graph of monthly visit totalsby all guests revealed evidence of seasonal rhythms; some summermonths had nearly twice the number of visitors as winter months.
The geographical location of each home residence was obtainedby merging the hotel data with an existing spatial dataset. The homelocation and number of visits were then mapped using commer-cial GIS software, revealing distance-decay gradients. More than1800 visits were by people whose claimed residence was less than50 miles from Rebersburg, and more than half were visiting fromwithin 20 miles of the hotel. Many of these places were accessibleonly by horse and wagon, as the nearest railroad stations were ninemiles south in Coburn and 20 miles north in Mill Hall.
The spatial and temporal patterns found by these methods werelimited to aggregated representations of the data. The texture of in-dividual dates and guests was lost. Moreover, these search methodswere relatively time consuming. In order to understand the intrica-cies of social connectivity patterns at the level of individual peopleand relationships, new methods are needed to bridge historical do-main knowledge with visual analysis techniques. (For examples ofhistorical geographers working in this area see [7, 8].)
3 EXPLORATORY VISUALIZATION IN IMPROVISE
Improvise is a self-contained, web-capable visualization builderand browser that shares many capabilities with other coordinatedmultiple view visualization systems [9, 12, 11] and toolkits [4, 6].Users browse visualizations using mouse and keyboard interactionsto navigate multidimensional space and select data items acrossmultiple coordinated views.
Improvise visualizations are build around a coordination modelcall Live Properties coupled with a visual abstraction languagecalled Coordinated Queries. Coordination takes place throughshared interactive parameters that determine what, how and whereviews display data. Multiple views are coordinated whenever theyare connected through at least one such parameter. CoordinatedQueries is a flexible, yet high-level visualization query languagefor coordinating access, processing, and rendering of multiple datasets across multiple views. Query expressions specify how to mapdata attributes into graphical attributes in views. Multiple data setscan be loaded, indexed, grouped, filtered, sorted, and visually en-coded in terms of navigation and selection in and between multi-ple views. The combination of Live Properties and CoordinatedQueries enables open-ended visual analysis by allowing users todesign, construct, explore, and extend highly-coordinated visual-izations of multiple simultaneous data sets interactively.
Improvise consists of a graphic user interface on top of a modu-lar library of visualization components (figure 2). In the user inter-face, designers create, layout, parameterize, and coordinate views.Building occurs inside the same top-level window that containsviews. Building is fully live, so that all design changes take effectimmediately without the need for a separate compilation stage. Thislive, amodal interface design allows trained users to switch rapidlybetween building and browsing. The goal is to facilitate open-endedvisual exploration and analysis of information by close-knit teamsof collaborating domain experts and experienced visualization de-signers. In other words, to support improvisational visualization ona timescale of hours or days.
Layout Editing Query Editing Interactive Parameter Editing
ΔViews ΔExpressions ΔVariables
InteractionNotification
Albums Hotels
Browser UIs
Ions Elections
Build
Coordinated Queries
Views/Controls
Space (3-D)Scatterplot Table/List Graph PCP RerunsMatrix Axis Slider Checkbox
Data Access
IndexingVisualEncoding
Filtering Sorting Grouping
Algorithms
Flat Dbf +Shapefile
JDBCXML ...
...
...
Builder UI
ViewsPages FramesQuery
Expressions
Data Editing
ΔData
Data+ Metadata
Figure 2: The Improvise software architecture.
Improvise has been used to build a wide variety of informationvisualizations, and has recently been extended for geovisualizationof census, election, and ham radio communications involving spa-tial, temporal, and abstract data attributes. The ongoing evolution ofthe hotel register visualization is one of the major successes of thiseffort. (Because it is just one of many Improvise “documents”—allsaved as regular, self-contained XML files—we have not adopted aformal name for the visualization as an independent tool. In fact,we refer to it internally simply as “the hotels vis.”)
4 HOTELS VISUALIZATION INTERFACE
Using Improvise, we have developed a visualization of the guestregister for a hotel in Rebersburg, PA from 1898-1900. The vi-

Figure 3: The hotels visualization. The map shows travel on Sunday, September 2, 1900 (Labor Day weekend) by 42 visitors to the RebersburgHotel, including three who came from places unknown. Although many guests may have come from places on rail lines or rivers, the locationof the hotel in Rebersburg suggests that a portion of each trip may have been in coaches, by horse, on foot, or by similar means.
sualization is a result of an iterative process of design, construc-tion, testing, exploration, and evaluation involving close collabora-tion between visualization researchers [Weaver, Robinson, Peuquet,MacEachren] and historical geographers [Fyfe, Holdsworth]. Thisprocess has resulted in four major versions and dozens of minor ver-sions of the visualization over the course of six months. Evolutionof the visualization has been driven primarily by the exploratoryand analytic needs of the historical geographers, who have adoptedthe visualization as a important tool in their research arsenal.
The visualization (figure 3) consists of the following views:
• A table view, showing the names, total visits, and pattern ofvisits over time for each guest.
• A table view, showing the same information for each resi-dence (place of origin).
• A reruns view, showing total visits on each day using textand/or color. Squares distinguish weekends from circularweekdays. Months and seasons optionally appear as celledges and a fill gradient, respectively. Cycle length and cellsize can be rapidly adjusted using sliders. Mousing over a cellshows its date in the top left corner.
• A vertical histogram along the right side of the reruns view,summarizing total visits for each period.
• A horizontal histogram along the bottom of the reruns view,summarizing total visits for each day in the cycle.
• A multi-layer map, showing crow-flies paths from residencesto the hotel, relative to railroads and rivers.
• An arc diagram [15], showing past (red) and future (blue) vis-its by guests visiting on selected dates.
• A drill-down table view, showing individual register entries.
All views support additive selection of multiple data items. Inthe reruns view, selection of individual dates or particular cyclesand periods happens by clicking individual cells or rubberband-ing around blocks of cells. The map allows selection of residencesby clicking, rubberbanding, or lassoing regions. Improvements toquerying and rendering performance have resulted in navigationand selection coordination that is much faster than in earlier ver-sions, enabling smooth interaction throughout the visualization.
Extensive cross-filtering between views enables exploration ofcomplex interdependent groupings of people, dates, and places.Bidirectional filtering allows users to show subsets of guests and/orhome residences (as selected in the corresponding table views) inthe reruns view, and conversely to show subsets of dates (as selectedin the reruns view) in the guests and residences table views. Filter-ing between the residences table view and the nested bar plots in theguests table view allows users to show temporal visitation patternsfor all guests, restricted to travel that involves selected residences.Similar filtering in the opposite direction shows temporal patternsof travel from all towns by selected guests only.
Using a process of successive selection and filtering, it is possi-ble to ask specific questions and follow detailed chains of evidence.

For example, an analyst might explore possible repeat meetings be-tween guests prior to some critical event by asking the question,“For visitors on a particular date, on what previous dates did twoor more of them visit repeatedly?” To start to answer this question,the analyst would select the critical event date in the reruns view,filter the guests table on date, select all guests in the guests table,filter the reruns view on selected guests, select all dates in the re-runs view that involve multiple visitors, then look for guests havingmultiple visits with similar temporal patterns in the guests view. Fil-tering the residences table and map view on dates and guests duringthis process would provide increasingly specific information abouttravel from particular cities, possibly revealing overlapping origins,destinations, or paths for guests under scrutiny.
Moreover, this process can involve unknown or uncertain people,places, and times by selecting similar names, nearby residences (asindicated in the map), and preceding or following dates. The abil-ity to visualize uncertainty is critical for dealing with noise in theoriginal data and errors in the transcription process. In the visu-alization, uncertain guest (44%) and place (14%) names are indi-cated with question marks. Uncertain portions of such names aresimilarly indicated (e.g. “?, PA”). Because all views can displayall register entries—including uncertain ones—it is possible to ex-plore patterns involving unidentified persons across time and space.The exception is the map view, which does depict uncertain guestsfrom certain places but does not depict any guests (certain or oth-erwise) from uncertain places. Many instances of possible errorsin the transription process were discovered using the visualizationitself. In particular, the ability to select and filter on multiple guestand residences gave us a means to explore whether similar namesin fact refer to the same person or place.
5 VISUAL ANALYSIS
Visual exploration has been a key factor in the discovery of severalspatiotemporal patterns of social relationships at a time when travelwas by horse and buggy locally, or along specific railroad corridorsover longer distances. In particular, the visualization has providedsignificant evidence in support of hypotheses regarding cooperationbetween travelling merchants, the effects of weather and seasonalclimate variations, circuitous routes taken by salesmen, and gather-ings on holidays, as well as a variety of idiosyncratic travel patternsinvolving individuals, families, and other groups.
5.1 Organized Groups
When examining the visitation patterns of the hucksters fromBoonville, relative consistency in weekday visits for each hucksteris immediately identifiable (figure 4). Filtering the reruns view onthe three selected guests reveals alternating visits on Tuesday andFriday. Rapidly switching which of the three is selected reveals thatWelshans stays on Tuesday and that Friday visits by R. A. Sheatstransition to Friday visits by A. M. Sheats in March 1898. The latteris also suggested by per-guest time charts in the guests table view.
Prior to the use of the visualization, each register entry for thesevisitors had to be manually added to a calendar. In this cumbersomeprocess, the individuals’ visitation patterns could not be comparedin the context of all the other guests. In addition, the original cal-endar did not have the ability to change the cycle length for explo-ration of different cyclic temporal patterns.
5.2 Weather and Climatic Effects
Finding the regular pattern of Friday visits by A. M. Sheatsprompted us to look for deviations from this routine. By settingthe reruns view to a 14-day cycle then scrolling to earlier dates,we were able to determine that there were two periods when his
Hotels
Name VisitsRebersburg, PA 2412
Roaring Spring, PA 3922
Residences
Filter GuestsFilter Dates
Name VisitsBooneville, PA 196
Centre Hall, PA 174
Coburn, PA 159
Loganton, PA 121
Williamsport, PA 118
Bellefonte, PA 117
Millheim, PA 90
Rebersburg, PA 81
Lock Haven, PA 72
Spring Mills, PA 61
Guests
Filter ResidencesFilter Dates
Name Visitssheats, a-m 78
sheats, r-a 32
stonebraker, j-m 31
hess, e-k 27
welshans, h-w 24
stover, thos-n 22
klinefelder, john-? 19
orwig, c-h 16
nearhood, harry-o 15
chamberlin, wm-b 14
Parameters (Reruns)
Options
Outline DatesCount Guests
Fill Seasons Outline Months
Cell Size
14
Cycle Length
21
Reruns
Filter Residences
Filter Guests
33
31
33
12 935 31 4 1810
1 1
(None)
3
4
44
52353
4
4
34
44
6365465243
3333
3
2
1899.04.23 - 1899.05.13
1899.06.25 - 1899.07.15
1898.09.25 - 1898.10.151898.10.16 - 1898.11.05
1898.11.27 - 1898.12.171898.12.18 - 1899.01.071899.01.08 - 1899.01.281899.01.29 - 1899.02.181899.02.19 - 1899.03.11
1900.02.11 - 1900.03.03
1900.05.27 - 1900.06.16
1899.03.12 - 1899.04.011899.04.02 - 1899.04.22
1899.05.14 - 1899.06.031899.06.04 - 1899.06.24
1899.07.16 - 1899.08.051899.08.06 - 1899.08.261899.08.27 - 1899.09.161899.09.17 - 1899.10.071899.10.08 - 1899.10.281899.10.29 - 1899.11.181899.11.19 - 1899.12.091899.12.10 - 1899.12.301899.12.31 - 1900.01.201900.01.21 - 1900.02.10
1900.03.04 - 1900.03.241900.03.25 - 1900.04.141900.04.15 - 1900.05.051900.05.06 - 1900.05.26
1900 06 17 1900 07 07
1898.11.06 - 1898.11.26
6 2013 195 171211 212 4 18103 9 16
1
1
1 1 1
1
1 1 1
1 1
1 1 1
1 1 1
1 1
1 1
2
1
1
1 1 1
1 1
1 1
1 1 1
1 1
1 1
1 1 1
1 1
1 1 1
1 1
1
1 1 1
1 1 1
1 1
1 1 1
1 1 1
1 1
1 1 1
1 1 1
1 1 1
1 1 1
1 1
1 1 1
1
1 1 1
1 1
1 1
1
1
1
1
1
1 1
1 1
1 1 1
1 1
1
1
1
1
1
1
1 1
1
1
1
1
Figure 4: Alternating visits on Tuesdays and Fridays by an organizedgroup of hucksters.
scheduled visits were not on Fridays. It was only after the seasonsoption was turned on that we noticed that the only times he did notarrive on a Friday was during winter months (figure 5). This hasled us to believe that the weather may have had something to dowith these variations. While the exact reason for these deviationshas not yet been determined, the tool has now guided us to examinehistorical climate data to test this hypothesis. Such records indicatethat February 5-14, 1899 included “the arrival of the greatest Arcticoutbreak in United States meteorological records.” [5]
Hotels
Name VisitsRebersburg, PA 2412
Roaring Spring, PA 3922
Residences
Filter GuestsFilter Dates
Name VisitsBooneville, PA 196
Centre Hall, PA 174
Coburn, PA 159
Loganton, PA 121
Williamsport, PA 118
Bellefonte, PA 117
Millheim, PA 90
Rebersburg, PA 81
Lock Haven, PA 72
Spring Mills, PA 61
Parameters (Reruns)
Options
Outline DatesCount Guests
Fill Seasons Outline Months
Cell Size
21
Cycle Length
14
Guests
Filter ResidencesFilter Dates
Name Visitssheats, a-m 78
sheats, r-a 32
stonebraker, j-m 31
hess, e-k 27
welshans, h-w 24
stover, thos-n 22
klinefelder, john-? 19
orwig, c-h 16
nearhood, harry-o 15
chamberlin, wm-b 14
Reruns
Filter Residences
Filter Guests
49
48
3 383 121 12 1
(None)
2
1
2
2
2
1
2
2
1
2
2
4
2
2
2
2
2
3
2
1899.04.16 - 1899.04.29
1898.08.21 - 1898.09.03
1898.09.04 - 1898.09.17
1898.09.18 - 1898.10.01
1898.10.02 - 1898.10.15
1898.10.16 - 1898.10.29
1898.11.27 - 1898.12.10
1898.12.11 - 1898.12.24
1898.12.25 - 1899.01.07
1899.01.08 - 1899.01.21
1899.01.22 - 1899.02.04
1899.02.05 - 1899.02.18
1899.02.19 - 1899.03.04
1899.03.05 - 1899.03.18
1899.03.19 - 1899.04.01
1899.04.02 - 1899.04.15
1899.04.30 - 1899.05.13
1899.05.14 - 1899.05.27
1899 05 28 1899 06 10
1365 12104 1472 93 11
1
1
1 1
1 1
1 1
1
1 1
1 1
1
1 1
1 1
1 1
1 1
1
1 1
1 1
1
1
1 1
1 1
1
1
1
1
1
1 1 1
Figure 5: Variation in regular visits due to weather. The days high-lighted in the reruns view involve recorded extreme winter conditions.
The visualization also reveals how time of year strongly corre-lates with the overall number of visits, possibly due to seasonalvariations in climate that affect travel. In the vertical histogram(figure 6), total number of visits is highest during the summer andlowest during the winter, with the exception of major holidays.
Reruns
Filter Residences
Filter Guests
84
11
99
1
95
10
8
81
11
1
95
88
11
8
78
11
2
98
79
11
1
98
72
91
12
09
0
10
7
10
16
9
85
11
1
(None)59
52
94
69
86
79
59
72
103
66
104
54
74
6343
60
6459
40
78
77
78
40
57
66
60
8972
58
43
54
7593
97
5322
1898.06.12 - 1898.07.06
1900.02.27 - 1900.03.23
1900.05.13 - 1900.06.06
1899.09.05 - 1899.09.29
1900.06.07 - 1900.07.01
1898.08.01 - 1898.08.25
1899.09.30 - 1899.10.24
1900.07.02 - 1900.07.26
1898.08.26 - 1898.09.19
1899.06.22 - 1899.07.16
1900.08.21 - 1900.09.14
1899.12.14 - 1900.01.07
1898.07.07 - 1898.07.31
1898.12.29 - 1899.01.221899.01.23 - 1899.02.16
1900.09.15 - 1900.10.09
1899.04.08 - 1899.05.021899.03.14 - 1899.04.07
1900.01.08 - 1900.02.01
1898.10.15 - 1898.11.08
1899.08.11 - 1899.09.04
1899.11.19 - 1899.12.13
1898.12.04 - 1898.12.28
1898.09.20 - 1898.10.14
1900.07.27 - 1900.08.20
1899.02.17 - 1899.03.13
1899.05.28 - 1899.06.211899.05.03 - 1899.05.27
1898.11.09 - 1898.12.03
1900.02.02 - 1900.02.26
1899.10.25 - 1899.11.18
1900.03.24 - 1900.04.171900.04.18 - 1900.05.12
1899.07.17 - 1899.08.10
1900.10.10 - 1900.11.031900 11 04 - 1900 11 28
1 3 4 21 24126 8 2213 2314 19 25205 102 16159 18177 11
Figure 6: Seasonal variation in the overall number of visits. A palecolor gradient from blue to green to red to gold indicates winter,spring, summer, and fall.
5.3 Biweekly Circuits
While exploring the travel patterns of frequent visitors, selectingtraveling salesman E. K. Hess of Williamsport led to the discoveryof visitation patterns spanning multiple weeks (figure 7). Changingthe cycle length of the reruns view to 14 days reveals that Hess vis-its strongly correlate with the second Thursday in this cycle, sug-gesting that he visited every other week. Perhaps more interest-ing is that there are several cases in which he did not return untilthe fourth or even sixth week, always maintaining an even num-ber of weeks between visits. This pattern suggests that salesmenfrom larger cities such as Williamsport may have had larger cir-cuits than those of the local hucksters, thus preventing them fromcoming every week. The visualization also shows that two otherguests, William B. Chamberlain of Milton and Harry McClosky ofWilliamsport, also adhered to similar schedules, always visiting aneven number of weeks after their previous visit and on the same dayof the week. This pattern prompts further research inquiries to de-termine the profession of these men and possibly identify additionalcommercial connectivities, especially as all three men always camein the second week of successive two week periods.
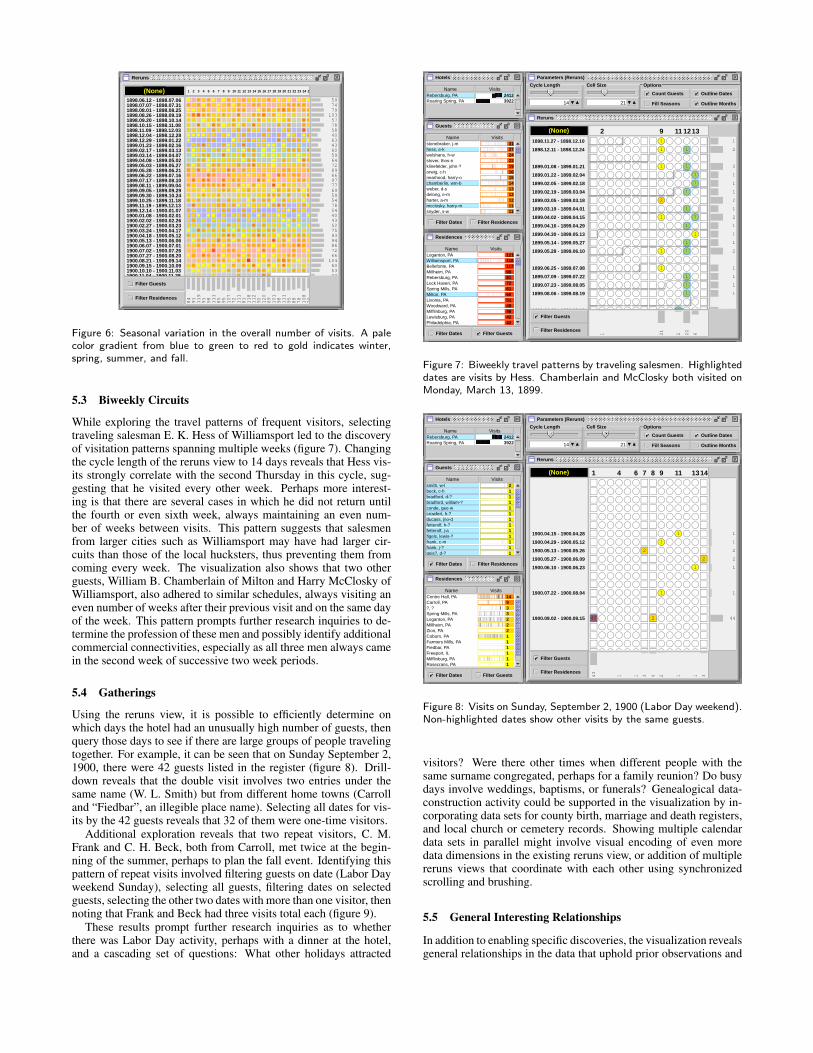
5.4 Gatherings
Using the reruns view, it is possible to efficiently determine onwhich days the hotel had an unusually high number of guests, thenquery those days to see if there are large groups of people travelingtogether. For example, it can be seen that on Sunday September 2,1900, there were 42 guests listed in the register (figure 8). Drill-down reveals that the double visit involves two entries under thesame name (W. L. Smith) but from different home towns (Carrolland “Fiedbar”, an illegible place name). Selecting all dates for vis-its by the 42 guests reveals that 32 of them were one-time visitors.
Additional exploration reveals that two repeat visitors, C. M.Frank and C. H. Beck, both from Carroll, met twice at the begin-ning of the summer, perhaps to plan the fall event. Identifying thispattern of repeat visits involved filtering guests on date (Labor Dayweekend Sunday), selecting all guests, filtering dates on selectedguests, selecting the other two dates with more than one visitor, thennoting that Frank and Beck had three visits total each (figure 9).
These results prompt further research inquiries as to whetherthere was Labor Day activity, perhaps with a dinner at the hotel,and a cascading set of questions: What other holidays attracted
Hotels
Name VisitsRebersburg, PA 2412Roaring Spring, PA 3922
Parameters (Reruns)
Options
Outline DatesCount Guests
Fill Seasons Outline Months
Cell Size
21
Cycle Length
14
Guests
Filter ResidencesFilter Dates
Name Visitsstonebraker, j-m 31hess, e-k 27welshans, h-w 24stover, thos-n 22klinefelder, john-? 19orwig, c-h 16nearhood, harry-o 15chamberlin, wm-b 14weber, d-s 13delong, e-m 12harter, a-m 12mcclosky, harry-m 11snyder, s-w 11
Reruns
Filter Residences
Filter Guests
21
1 622
2
(None)
2
2
2
1
2
2
1
1
1
1
1
1
1
1
1
1
1
1
1899.03.05 - 1899.03.18
1899.04.02 - 1899.04.15
1899.05.28 - 1899.06.10
1899.06.25 - 1899.07.08
1898.12.11 - 1898.12.24
1899.01.08 - 1899.01.21
1899.01.22 - 1899.02.04
1899.02.05 - 1899.02.18
1899.02.19 - 1899.03.04
1899.03.19 - 1899.04.01
1899.04.16 - 1899.04.29
1899.05.14 - 1899.05.27
1899.07.09 - 1899.07.22
1899.07.23 - 1899.08.05
1899.08.06 - 1899.08.19
1899 09 03 1899 09 16
1898.11.27 - 1898.12.10
1899.04.30 - 1899.05.13
92 131211
2
1
1
1
1
1
1
1
1
1
1
1
1
1
1
1
1
1
1
1
1
1
1
1
1
1
1
1
1
1
1
1
1
1
1
1
Residences
Filter GuestsFilter Dates
Name VisitsLoganton, PA 121Williamsport, PA 118Bellefonte, PA 117Millheim, PA 90Rebersburg, PA 81Lock Haven, PA 72Spring Mills, PA 61Milton, PA 60Livonia, PA 51Woodward, PA 49Mifflinburg, PA 46Lewisburg, PA 42Philadelphia, PA 42
Figure 7: Biweekly travel patterns by traveling salesmen. Highlighteddates are visits by Hess. Chamberlain and McClosky both visited onMonday, March 13, 1899.
Hotels
Name VisitsRebersburg, PA 2412Roaring Spring, PA 3922
Guests
Filter ResidencesFilter Dates
Name Visitssmith, w-l 2beck, c-h 1bradford, d-? 1bradford, william-? 1conde, geo-w 1crowfert, h-? 1ducass, jno-d 1fetterolf, h-? 1fetterolf, j-a 1figels, lewis-? 1frank, c-m 1frank, j-? 1geis?, d-? 1
Parameters (Reruns)
Options
Outline DatesCount Guests
Fill Seasons Outline Months
Cell Size
21
Cycle Length
14
Reruns
Filter Residences
Filter Guests
43
3 3124 111
(None)
44
2
2
1
1
1
1
1900.09.02 - 1900.09.15
1900.05.13 - 1900.05.26
1900.05.27 - 1900.06.09
1900.06.10 - 1900.06.23
1900.07.22 - 1900.08.04
1900.04.29 - 1900.05.12
1900.04.15 - 1900.04.28
1 7 141398 1164
42
2
2
1
1
2
1
1
42
Residences
Filter GuestsFilter Dates
Name VisitsCentre Hall, PA 14Carroll, PA 9?, ? 3Spring Mills, PA 3Loganton, PA 2Millheim, PA 2Zion, PA 2Coburn, PA 1Farmers Mills, PA 1Fiedbar, PA 1Freeport, IL 1Mifflinburg, PA 1Rosecrans, PA 1
Figure 8: Visits on Sunday, September 2, 1900 (Labor Day weekend).Non-highlighted dates show other visits by the same guests.
visitors? Were there other times when different people with thesame surname congregated, perhaps for a family reunion? Do busydays involve weddings, baptisms, or funerals? Genealogical data-construction activity could be supported in the visualization by in-corporating data sets for county birth, marriage and death registers,and local church or cemetery records. Showing multiple calendardata sets in parallel might involve visual encoding of even moredata dimensions in the existing reruns view, or addition of multiplereruns views that coordinate with each other using synchronizedscrolling and brushing.
5.5 General Interesting Relationships
In addition to enabling specific discoveries, the visualization revealsgeneral relationships in the data that uphold prior observations and

Hotels
Name VisitsRebersburg, PA 2412Roaring Spring, PA 3922
Residences
Filter GuestsFilter Dates
Name VisitsCentre Hall, PA 18Carroll, PA 15Spring Mills, PA 5Loganton, PA 4?, ? 3Woodward, PA 3Millheim, PA 2Milton, PA 2Zion, PA 2Aaronsburg, PA 1Allentown, PA 1Bareville, PA 1Booneville, PA 1
Parameters (Reruns)
Options
Outline DatesCount Guests
Fill Seasons Outline Months
Cell Size
21
Cycle Length
14
Reruns
Filter Residences
Filter Guests
2 22 11
(None)
2
2
2
1
1
1900.05.13 - 1900.05.26
1900.05.27 - 1900.06.09
1900.09.02 - 1900.09.15
1900.06.10 - 1900.06.23
1900.07.22 - 1900.08.04
7 141 139
2
2
2
1
1
2
2
1
1
2
Guests
Filter ResidencesFilter Dates
Name Visitsfrank, c-m 5beck, c-h 3smith, w-l 2?, e-f 1bradford, d-? 1bradford, william-? 1brungard, john-? 1chamberlin, wm-b 1conde, geo-w 1crowfert, h-? 1ducass, jno-d 1fetterolf, h-? 1fetterolf, j-a 1
Figure 9: Repeat visits by two of the Labor Day weekend guests oversummer months.
hypotheses. For example, we knew from transcribing that the num-ber of guests on weekend days was much lower than during theweek, a result reaffirmed in the horizontal histogram when showingall visits over cycle lengths that are multiples of seven.
In another case, several different guests were registered at thehotel who shared the same surname, Nearhood, as the proprietor ofthe hotel. When querying all guests with this last name (figure 10),it appears that, unlike most guests of the hotel, Nearhoods frequentthe hotel mainly on weekends. All but three are from Centre Hall,a town ten miles to the west, serving as another reminder that roadswere unimproved and thus places were too far away to allow for adaytime visit without an overnight stay.
5.6 Future Queries
Research in historical geography is much like intelligence analysisin the sense that it involves careful detective work to coax answersto highly specific questions from sparse and often extremely noisydata. For instance, women appear very infrequently throughout theregister. When they do appear, most often they are listed as comingwith men under the terms “and wife” or “Mr. and Mrs.” In somecases, “and lady” appears next to a guest’s name—though we neverfound “Mr. and Mrs. Smith”! Only eleven women registered bythemselves under the titles “Mrs.” or “Miss”. This prompts furtherresearch inquiries concerning where these women came from, whatmeans and patterns of travel were involved, and whether associatedmales registered by themselves on other occasions.
Some guests note when they sign the register that they are trav-eling with one or two horses (housed in the livery stable behind thehotel). This prompts further inquiries as to who these people wereand where they came from. For guests not listing a horse, how didthey arrive at the hotel? One means of transportation may have beenthe stagecoach—the block for which still sits in front of the buildingtoday–but this does not account for the lack of a horse annotationby our local hucksters (who by definition would have the goodsthey were selling with them, and hence likely a wagon). Does twohorses signify a freight wagon, whereas one horse implies a buggy?A search of census records for all names of people traveling with ahorse might reveal a specific occupational sector. The literature onhucksters suggests they often had a weekly circuit, only returning totheir “home” place on weekends to refill their wagon at their store.
Hotels
Name VisitsRebersburg, PA 2412Roaring Spring, PA 3922
Guests
Filter ResidencesFilter Dates
0Name Visitsnearhood, ?-c 1nearhood, H-? 1nearhood, e-? 5nearhood, e-L 1nearhood, e-c 8nearhood, g-e 1nearhood, geo-e 1nearhood, h-o 7nearhood, harry-? 2nearhood, harry-d 1nearhood, harry-o 15nearhood, j-d 1nelson, h-r 3
Parameters (Reruns)
Options
Outline DatesCount Guests
Fill Seasons Outline Months
Cell Size
21
Cycle Length
14
Residences
Filter GuestsFilter Dates
Name VisitsCentre Hall, PA 41Freeport, IL 1Rock Springs, PA 1Washington, PA 1?, ? 0?, PA 0Aaronsburg, PA 0Albertis, PA 0Albion, MI 0Alina, ? 0Alina, PA 0Allentown, PA 0Altoona, PA 0
Reruns
Filter Residences
Filter Guests
7 1 665 2 2 13 1 23 2
(None)
3
1
2
4
1
2
1
7
2
1
1899.12.10 - 1899.12.23
1900.06.24 - 1900.07.07
1900.05.13 - 1900.05.26
1899.12.24 - 1900.01.06
1900.01.21 - 1900.02.03
1900.02.04 - 1900.02.17
1900.03.18 - 1900.03.31
1900.04.01 - 1900.04.14
1900.04.15 - 1900.04.28
1899.10.15 - 1899.10.28
1 6 1487 1011 122 9 134 5
1
1
2
1 1
1 1 2
1
2
1
2 1 1 1 1 1
1 1
1
2
1
2 1 1 1 1 1
1 1
2
Figure 10: Travel from Centre Hall by possible members of the hotelproprietor’s family. Nine of 15 visits by Harry O. Nearhood (high-lighted) occurred sporadically over a three week period in April 1900.
In such cases, the obvious question is: What hotels were frequentedthe night prior and the night following their stay at the RebersburgHotel? In other registers being analyzed, notations sometimes giveinstructions for forwarding mail, and invariably it is to a named ho-tel in another town. Toward answering these questions, we haverecently added a second hotel register data set to the visualizationand are currently transcribing several more.
6 EVALUATION
We conducted a series of formative evaluations of the visualizationusing the E-Delphi toolkit [13] developed at the GeoVISTA Center.These evaluations targeted two goals: to solicit ideas for improve-ments and enhancements, and to evaluate the toolkit in terms ofhow well it satisfies a set of precepts for the design and evaluationof visualization tools.
Twelve Penn State graduate students participated in the evalua-tion. All were enrolled in a graduate seminar on geovisual analyt-ics. All but two were enrolled for graduate studies in Geographythat focus on emerging issues in GIScience. The other two studentscame from related fields in the school of Information Science &Technology. Members of the user group possess varied knowledgeof GIS systems and are familiar with research priorities for the ad-vancement of visual analytics.
6.1 E-Delphi
The Delphi method [3] was devised by the RAND Corporationshortly after World War II as a way for structuring group decisionsin a manner that ensures personality conflicts and power relation-ships do not taint the presentation of ideas. The Delphi methodfunctions by iteratively working through ideas in a distributed,anonymous manner through a moderator. The moderator receivesfeedback on a particular prompt or idea from multiple stakeholders,and then distills this feedback to create the next round of discussion.
E-Delphi is a web-based toolkit designed to support Delphi ex-ercises. We chose to use E-Delphi as a means to conduct soft-ware evaluations. Exercises take place in a online collaboratoryin which moderators can quickly initiate and lead multiple roundsof discussion. Round-based activities include surveys, metrics, free

responses, voting, threaded discussions, or a mixture of these meth-ods.
Software evaluation activities often require significant invest-ment of human and financial capital to develop and organize ac-tivities and procure technology to capture data. E-Delphi allows usto conduct qualitative evaluations via the web with little investmentin time and effort by either researchers or participants.
6.2 Process
We conducted three rounds of evaluation using E-Delphi. In Round1, we asked users to imagine extensions to the visualization tool. InRound 2, we had users indicate their opinions on the fit of the toolto a set of design precepts. Round 3 had users discuss the responsesthey provided in Round 2.
6.2.1 Round 1
We asked users to complete two short tasks to become familiar withthe capabilities of the visualization. We then asked them to respondto four short answer questions in E-Delphi:
1. Briefly describe a scenario in which a historian might use avisualization tool like the one you have tested.
2. What other types of data would be interesting to examine withthe tools you used today? Why?
3. Assume your task is to design one additional visualization toolto work with the set you have used today. Describe what youwould add next and why.
4. Imagine you work at a newspaper and you have been giventhis software to develop story ideas for future articles. Whattools and interactions would you need to do your job?
These questions were designed to provoke suggestions for situa-tions in which the visualization might be useful, additional kinds ofdata that might be required to tell a story using the visualization, andextensions that could be incorporated into the visualization to en-hance exploration and analysis. We asked users to avoid critiquingbasic appearance and behavior aspects of the visualization interfacein favor of focusing attention on higher-level ideas and goals for fu-ture prototypes. Users had 90 minutes (as part of seminar classtime) to complete the sample tasks and answer these prompts. Weallowed users to return to their responses for three days afterwardin case they wished to revise their answers.
6.2.2 Round 2
Amar and Stasko [1] identify six precepts that can be used to eval-uate the design of information visualizations in terms of how wellthey bridge Worldview and Rationale gaps:
• Provide facilities for creating, acquiring, and transferringknowledge or metadata about important domain parameterswithin a dataset. [Worldview]
• Support discovery (automated or manual) of useful correlativemodels and constraints. [Worldview]
• Support the interactive formulation and verification of userhypotheses. [Worldview]
• Expose uncertainty in data measures and aggregations andshow possible effects of uncertainty on outcomes. [Rationale]
• Clearly present what comprises the representation of a re-lationship and present concrete outcomes when appropriate.[Rationale]
• Clarify possible sources of causation. [Rationale]
In Round 2 we assessed the visualization in terms of these pre-cepts. We asked users to indicate their level of agreement that thevisualization satisfied these precepts on a five-point Likert scale.We also requested a short text response to provide justification fortheir choices. The instructions suggested that they re-examine thetoolkit as necessary to refresh their memory. The activity took 90minutes and we again provided several days for revision.
6.2.3 Round 3
In Round 3, we asked users to examine a major theme that we no-ticed in the results from Round 2: the Worldview precepts weremore satisfied by the visualization than the Rationale precepts. Theinstructions were to discuss this dichotomy in terms of which thingsshould be implemented next to introduce a more appropriate bal-ance to the design. Users had another 90 minute session duringclass time and a few days afterward for revision. We extended re-sponse time an additional week to compensate for spring break.
6.3 Results
6.3.1 Round 1
Round 1 provided a great deal of valuable feedback on potential ex-tensions to the visualization, additional data sources, and situationsin which it might be particularly useful. One proposed extensionwas the addition of a geographically-based filtering capability, toallow the use of the map as the primary interface for selecting guestvisits with a bounding box over cities of interest. Another usersuggested the need for a means to help find groups of people whotravelled together on the same day, perhaps from different placesand for different lengths of stay. Several users mentioned a desireto drill down to greater detail for each guest, to view a profile foreach person. This profile would contain personal information suchas their workplace, address, birthday, and other details. Other sug-gestions for additional data sources include: transportation sched-ules, letters and other personal communication, bank transactions,hospital records, and the ability to integrate the results of Googlesearches for dates and names.
Users also requested sophisticated capture and annotation toolsas part of the visualization so that they could develop stories aboutwhat they were seeing. Suggestions for situations in which suchtools might be useful included: tracking the impact of a major event(such as a flood or hurricane), analyzing the travel behavior of aspecific individual or group of people, and characterizing hotels interms of the types of people they typically attract.
6.3.2 Round 2
The agreement between responses we received in Round 2 indi-cated that our users generally agreed that the visualization worksto bridge the three Worldview gaps to create knowledge, supportdiscovery of correlative models, and support the interactive formu-lation of hypotheses. On the other hand, users generally disagreedthat it satisfies the three Rationale gap precepts to expose uncer-tainty, present concrete outcomes, and clarify causation.
The biggest weakness noted by users was the inability to ex-pose uncertainty in data and indicate its effect on outcomes. Thiswas the only precept of the six that received all negative or neutralresponses. Users pointed out that there was no explicit visual indi-cation of uncertainty in the data. A few noted that the only way for

uncertainty to enter the picture in the current design was if the usercould infer it from prior intimate knowledge of the data.
6.3.3 Round 3
Round 3 provided further clarification of the survey responses re-ceived in Round 2. To better expose uncertainty and show its effectson data, users suggested the creation of a visual summary for regis-ter entries that are incomplete or otherwise uncertain. Because theregister data is coded with question marks where names or placesare uncertain, it will be relatively easy to implement a summary ta-ble that either contains all such records or tags each record with amore obvious indication of uncertainty.
In order to better satisfy the need to present what comprises arelationship and to suggest concrete outcomes, users suggested wework first on clarifying the tasks that might be accomplished usingthe visualization. This request stemmed from the fact that someusers were unclear about the relationships they should be lookingfor, so they could not confidently define better ways to suggest out-comes. To clarify causation, the visualization could provide detailson demand for individual dates, guests, and residences. Users ex-pected to see ancillary information like holidays, special events, andweather in the reruns view. In the map, the number of guests andtheir names could appear as a popup when mousing over residencesand paths of travel. The guests view could provide an option to fur-ther visually highlight individuals or groups using avatars to betterbreak down patterns viewed in the reruns and map views.
7 CONCLUSIONS
Exploratory visualization provides a faster and more productivemeans of analysis than previous methods of examining historic ho-tel visits. By coordinating the reruns view with map and tabulardisplays, the hotels visualization allows detailed and contextual-ized queries regarding cyclic temporal patterns (in days, weeks,months, and years), seasonal temporal patterns with correspond-ing climate indications, social grouping patterns, spatial patternsof travel from particular places or regions, and complex combina-tions of all of these. Although the visualization focuses on histor-ical travel patterns in a specific social context, application to cur-rent problems of interest in the intelligence analysis and emergencyresponse communities—the behavior, movement, and communica-tion of persons, groups, vehicles, and resources under the influenceof terrain, climate, and weather—is an obvious next step. In fact,we anticipate that guest databases for multiple modern hotels (orother nexus points in travel networks) could be incorporated intothe visualization in a short time. Future plans involve increasing theusefulness of the visualization by adding historical weather recordsand railroad schedules in order to analyze actual means and pathsof travel by hotel visitors.
The E-Delphi evaluations resulted in overall positive feedback aswell as concrete suggestions for design improvements and exten-sions to the visualization. As we implement these changes we willcontinue to solicit feedback from both domain experts and generalusers. The E-Delphi method allows us to quickly conduct evalu-ations that can be repurposed for multiple user groups with littleeffort on our part. As the visualization matures, we will transitionour evaluation efforts to techniques such as verbal protocol analysisand formal focus groups composed of professional analysts.
By creating innovative ways of examining spatiotemporal data,the visualization aids significantly in exploration of historical hotelregister data, providing an opportunity to see travel patterns that hadpreviously gone unrecognized. Data for other hotels in other places,once transcribed, can be quickly incorporated, and spatiotemporalpatterns and irregularities can be quickly discerned. As a result, hy-pothesis generation and testing has accelerated over the traditional
techniques utilized in historical geography. Visual analysis has ledto multiple discoveries that have triggered new thought processesand shaped new research questions about social connectivity rela-tionships in rural areas at the turn of the twentieth century.
8 ACKNOWLEDGMENTS
Thanks to Bill Pike at PNNL for creating E-Delphi and helping usadapt it for our evaluation work. Thanks also to Scott Pezanowskiand Ritesh Agrawal for preparation of the geospatial layers used inthe map display.
REFERENCES
[1] Robert A. Amar and John T. Stasko. Knowledge precepts for the de-sign and evaluation of information visualizations. IEEE Transactionson Visualization and Computer Graphics, 11(4):432–442, July 2005.
[2] Historical Collections and Special Collections Library La-bor Archives. Rebersburg Hotel Guest Register, Rebersburg PA,1898-1900. The Pennsylvania State University Libraries, UniversityPark, PA.
[3] N. C. Dalkey. The delphi method: An experimental study on groupopinion. Technical Report RM-5888-PR, The Rand Corporation,1969.
[4] Jean-Daniel Fekete. The infovis toolkit. In Proceedings of the IEEESymposium on Information Visualization, pages 167–174, Austin, TX,Oct 2004. IEEE.
[5] Ben Gelber. Pocono Weather. Uriel Publishing, December 1992.[6] Jeffrey Heer, Stuart K. Card, and James A. Landay. Prefuse: A toolkit
for interactive information visualization. In Proceedings of CHI, Port-land, OR, April 2005. ACM.
[7] Deryck W. Holdsworth. Historical geography: New ways of imagingand seeing the past. Progress in Human Geography, 27(4):486–493,2003.
[8] A. K. Knowles, editor. Past Time, Past Place: GIS for History. ESRIPress, Redlands, CA, 2002.
[9] Miron Livny, Raghu Ramakrishnan, Kevin Beyer, G. Chen, DonkoDonjerkovic, Shilpa Lawande, Jussi Myllymaki, and Kent Wenger.DEVise: Integrated querying and visualization of large datasets. InProceedings of SIGMOD, pages 301–312, Tucson, AZ, 1997. ACM.
[10] Alan M. MacEachren, Mark Gahegan, William Pike, Isaac Brewer,Guoray Cai, Eugee Lengerich, and Frank Hardisty. Geovisualizationfor knowledge construction and decision support. IEEE ComputerGraphics and Applications, 24(1):13–17, January 2004.
[11] Chris North and Ben Shneiderman. Snap-together visualization: Auser interface for coordinating visualizations via relational schemata.In Proceedings of the Working Conference on Advanced Visual Inter-faces (AVI), pages 128–135, New York, NY, USA, May 2000. ACMPress.
[12] Chris Olston, Michael Stonebraker, Alexander Aiken, and Joseph M.Hellerstein. VIQING: Visual Interactive QueryING. In Proceedings ofthe 14th IEEE Symposium on Visual Languages, Halifax, Nova Scotia,Canada, September 1998. IEEE.
[13] William Pike, Brent Yarnal, Alan M. MacEachren, Mark Gahegan,and C. Yu. Infrastructure for human-environment collaboration:Building a prototype for the future of science. Environment, 47:8–21,2005.
[14] James J. Thomas and Kristin A. Cook, editors. Illuminating the Path:The Research and Development Agenda for Visual Analytics. IEEEComputer Society, August 2005.
[15] Martin Wattenberg. Arc diagrams: Visualizing structure in strings.In Proceedings of the IEEE Symposium on Information Visualization,pages 110–116, Boston, MA, October 2002. ACM.
[16] Chris Weaver. Building highly-coordinated visualizations in Impro-vise. In Proceedings of the IEEE Symposium on Information Visual-ization, pages 159–166, Austin, TX, October 2004. IEEE.