Embed Size (px)
Citation preview

Visual Parallel Programming on SGI Machines
Peter Kacsuk MTA SZTAKI
[email protected] www.lpds.sztaki.hu
Abstract
Visual parallel programming environments significantly can help non-experienced end-users to write their applications for parallel computers or other parallel/distributed platforms. P-GRADE is an integrated visual programming environment that supports the whole life-cycle of parallel program development. It also facilitates fast reengineering of sequential programs into parallel ones. A unified graphical interface enables parallel program design, debugging and performance visualization. Process groups and communication templates provide high-level graphical abstraction to design and generate message passing programs in the hybrid graphical language GRAPNEL. The novel macrostep-by-macrostep debugging concept introduced by the DIWIDE distributed debugger enables systematic debugging and automatic detection of deadlocks. The unique click-forward and click-back facilities of the PROVE performance visualization tool helps the user to correlate runtime activities with their source.
1 Introduction
In order to cope with the extra complexity of parallel programs arising due to inter-process communication and synchronisation, we have designed a visual programming environment called P-GRADE (Professional Graphical Application Development Environment). Its major goal is to provide an easy-to-use, integrated set of programming tools for development of general message-passing applications to be run on both heterogeneous and homogeneous distributed computing systems. The central idea of P-GRADE is to support each stage of the parallel program development life-cycle by an integrated graphical environment where all the graphical views applied at the separate stages are related back to the original graph that defines the parallel program and which is designed and edited by the user.
The parallel program development life-cycle supported by P-GRADE is shown in Fig.1. Rectangles represent activities of the life-cycle and the grey ovals inside the rectangles represent the tools that support the corresponding activity in the P-GRADE environment. Except for the PVM and MPI libraries (represented by white ovals) all the other libraries (grey ovals outside the rectangles) and the tools were developed either in the SEPP and HPCTI (EU COPERNICUS) projects or in the Hungarian P-GRADE project.
The first stage of the life-cycle is the program design which is supported by the GRAPNEL (GRAphical Process NEt Language) language and the GRED graphical

editor. In GRAPNEL, all process management and inter-process communication activities are defined graphically in the user's application. Low-level details of the underlying message-passing system are hidden. P-GRADE generates all message-passing library calls automatically on the basis of the graphical code of GRAPNEL. Since graphics hides all the low level details of message-passing, P-GRADE is an ideal programming environment for application programmers who are not experienced in parallel programming (e.g., for chemists, biologists, etc.). GRAPNEL is a hybrid language: while graphics is introduced to define parallel activities, textual language parts (C/C++ or FORTRAN) are used to describe sequential activities. The GRED editor helps the user to construct the graphical parts of GRAPNEL programs in an efficient and fast way. GRAPNEL programs edited by GRED are saved into the so-called GRP file which contains both the graphical and textual information of GRAPNEL programs.
The second stage is mapping which can be done by a very simple mapping table generated by P-GRADE. The mapping table can be easily modified by simple mouse clicks. The mapping information is also inserted into the GRP file.
The third step is the pre-compilation of GRAPNEL programs. This stage has the goal to translate the graphical language information of the GRP file into PVM or MPI function calls and to generate the C or FORTRAN source code of the GRAPNEL program. For the time being, the pre-compiler, called GRP2C, generates only C source code. For the sake of flexibility, PVM and MPI function calls are not called directly in the resulting C code, they are hidden in an internal library, called the GRAPNEL Library which has two versions. In the first version (GRP-PVM Library) the GRAPNEL Library functions are realised by PVM calls, and in the second version (GRP-MPI Library) they are realised by MPI function calls.
The fourth step is compiling and linking. Here the gnu C compiler and linker are used. The linker uses the following libraries:
• PVM, GRP-PVM, GRM (in the case of PVM communication system) • MPI, GRP-MPI, GRM (in the case of MPI communication system)
The GRM monitoring library is needed only when performance monitoring is applied at run time.
Having the necessary executables for the parallel/distributed computing system, the next stage is validating and debugging the code. The DIWIDE distributed debugger has been developed for P-GRADE in which the debugging information is related directly back to the user's graphical code. DIWIDE applies a novel macrostep debugging approach based on which both replay and systematic debugging is possible. GRAPNEL programs can be executed step-by-step both at the usual C instruction level, at the higher level graphical icon level and at the macrostep level (to be explained in Section 3.) These features significantly facilitate parallel debugging which is the most time-consuming stage of parallel program development.
After debugging the code, the next step is performance analysis. First, it requires performance monitoring which generates an event trace file at program execution time and then, performance visualisation which displays performance oriented information by several graphical views. Performance monitoring is performed by the GRADE Monitor (GRM) that can support both PVM and MPI. PROVE, the performance visualisation tool of GRADE, can provide both on-line and off-line visualisation based on the output trace file of GRM.

Fig. 1: Life-cycle of parallel program development and the supporting P-GRADE tools
Trace
executables
C source code, Cross-ref file,
GRP
GRP
Parallel Program Design
GRAPNEL GRED
Mapping
User mapping
Pre-compilation
GRP2C
Building executables
C compiler, linker
GRP-PVM
GRM Library
PVM Library
GRP-MPI
GRM Library
MPI Library
Debugging
DIWIDE
Monitoring
GRM
Visualisation
PROVE

As Fig. 1 shows any correctness or performance bug requires a step back to the program design stage where the error can be corrected in GRAPNEL by the GRED editor. When the code is bug-free the executables can run on any SGI platform where PVM or MPI are already installed.
A prototype version of P-GRADE, called GRADE, has been developed in the framework of two EU financed COPERNICUS projects (SEPP and HPCTI) and its main features are described in several papers [8], [9] and in a forthcoming book [6]. P-GRADE introduced many new concepts and techniques that were not available in GRADE and that made both the program design stage and the correctness and performance debugging phases easier to use. Therefore, in the current paper mainly those features of P-GRADE are overviewed that are introduced only in P-GRADE. In order to make the paper self-contained the basic features of P-GRADE that are common with GRADE are also explained.
Section 2 describes the basic concept of GRAPNEL and then shows the new features like groups and templates that can support SPMD style parallel programming. Section 3 introduces the macrostep concept of DIWIDE and its graphical user interface. Section 4 explains performance monitoring and visualization by GRM and PROVE, respectively.
2 GRAPNEL 2.1 The concept of GRAPNEL
There has been several attempts to support parallel programming with graphical user interfaces and particularly with graphical languages. A collection of such languages and their programming models have been overviewed in detail in [2].
There are several parallel programming paradigms that are successfully used in real-life application programs. The two main such paradigms are the shared memory concept and the message passing approach. In the design of a parallel programming language, the first decision point is the selection of the programming paradigm the language will support. In case of GRAPNEL, the message passing approach was chosen since this paradigm can be easily used for the whole range of parallel systems like supercomputers, clusters and even metacomputing systems. To make a message passing program portable it should be written by means of a communication library that is supported by each vendor of parallel systems. The de facto standards for message passing programming are the PVM and MPI communication libraries that were ported to nearly every parallel platform. In this case a parallel program can be formulated by the following expression:
(1) parallel program = (C/C++ or FORTRAN) + (PVM or MPI)
Unfortunately, the appearance of PVM or MPI in the parallel code makes both the
design and debugging phases of parallel program development much harder than developing sequential programs. First of all, the user should get acquaintance with the syntax and semantics of PVM/MPI. It requires especially great effort in the case of MPI since it contains more than 100 functions to handle and optimise parallel activities. Though PVM is much simpler, it is still very easy to make errors even in PVM programs and unfortunately the compiler cannot give significant support to

avoid these pitfalls. Then comes debugging which becomes a nightmare for parallel programming errors which typically appear in a non-deterministic way.
The main motivation of designing GRAPNEL was to hide the low level details of PVM and MPI by an easily conceivable graphical user interface that can help the user both in the design, compilation and debugging stages of parallel program development. However, graphical languages have the danger that the usage of too much graphics can reduce the readability of the program and results in the opposite effect for which they were designed. Hence, keeping the right balance between graphics and text is a decisive factor in the applicability of a graphical language. Accordingly, GRAPNEL applies graphics only at those levels where parallelism appears and every other code could be written in a well known textual language like C/C++ or FORTRAN. The philosophy of GRAPNEL can be expressed by the following equation:
(2) GRAPNEL = (C/C++ or FORTRAN) + graphics
Comparing equations (1) and (2) it is easy to see that graphics is indeed used only
for hiding PVM and MPI and it is the task of the GRAPNEL pre-compiler [3] to generate the appropriate PVM or MPI library calls from the graphical notations of GRAPNEL.
GRAPNEL is based on a hierarchical design concept that can support both top-down and bottom-up design methodologies. A GRAPNEL program has three hierarchical layers which are as follows from top to bottom:
• Application layer is a graphical layer which is used to define the component
processes, their communication ports as well as their connecting communication channels. Shortly, the Application layer serves for describing the interconnection topology of the component processes. An example is shown in Fig. 2.
• Process layer is also a graphical layer where several types of graphical blocks are applied: loop construct, conditional construct, sequential block, input/output activity block and graph block. These blocks can be arranged in a flow-chart like graph to describe the internal structure of processes (see Fig. 2).
• Text layer is used to define those parts of the program that are inherently sequential and hence a textual language like C/C++ or FORTRAN can be applied at this level. These textual codes are defined inside the sequential blocks of the Process layer(see Fig. 2).
The top-down design method can be used to describe parallel activities of the
application program. At the top level the topology and protocols of the interprocess communication can be defined and then in the next layer the internal structure of individual processes can be specified. At this level and in the Text layer the bottom-up and top-down design methods can be used in a mixed way. In the case of the top-down design method, the user can define the graphical structure of the process and then uses the Text layer to define the C/C++ or FORTRAN code for the sequential blocks. In the bottom-up design approach, the user can inherit code from existing

C/C++ or FORTRAN libraries and then can build up the internal process structure based on these inherited functions.
Fig. 2: Hierarchical layers of GRAPNEL programs and the supporting window types
2.2 New features of GRAPNEL introduced in P-GRADE
Process Groups and Group Ports Process groups were introduced both in PVM and MPI. In the case of GRAPNEL,
they can help the user in two respects: • Sub-graph abstraction: structured process topologies can be constructed by
defining compound nodes (i.e. sub-graphs representing process groups) to get a clear view of large process communication graphs.
• Group communication: scope of a communication operation can be extended to a whole group by defining communication ports for process groups.

Graphical representation of process groups in GRAPNEL is illustrated in Fig. 3. Groups are often used as container objects for processes that are logically separated from the rest of the application (e.g. they solve a separate sub-problem together). In such a case, it might be necessary to access several or even all members of that group in one communication step in order, for instance, to distribute some initial data for them or to collect their results. To support such communication operations, the user can define group ports. All member processes of a group can be accessed via such a group port without drawing the channels to the member processes individually. In order to support efficient translation of frequently used collective communication and computation operations into PVM or MPI code, GRAPNEL provides multicast, scatter, gather and reduce type of ports for such operations.
Process groups can be nested in arbitrary depth. The user can create new groups inside existing ones without any limitation regarding the number of levels in the hierarchy.
Fig. 3: Graphical representation of process groups in GRAPNEL

Communication Templates A communication template describes a group of processes that have a pre-defined
regular interconnection topology. The user only has to define the actual size and all the processes and channels comprised by the group are created by P-GRADE automatically. The most relevant difference between a communication template and a simple process group is the ability to change the number of member processes without modifying the graphical code of the application. GRAPNEL provides such communication templates for the most common regular process topologies like Process Farm, Pipe, 2D Mesh and Tree. Graphical appearance of the Pipe template is illustrated in Fig. 4. Templates are denoted by rectangles similar to group icons but the type of the template is also shown in the icon.
Similarly to process groups, templates can have group ports. Communication channels can cross the boundaries of a Template and they can connect ports of processes inside and outside the template. Ports of the member processes in a template are connected automatically based on the topology information so, they cannot be connected to outside processes (i.e. to processes that are not members of the template). However, some templates provide special communication points as "free" ports of some member processes to which outside processes can connect directly. For instance, in case of a pipeline, it is more natural to transfer the initial data to the first process by using a normal port clung to that particular process than by using a group port which is accessible in all members. These free ports are referred as interface ports in GRAPNEL.
There are seven attributes that characterise each template type: 1. Communication pattern 2. Index pattern 3. Minimal size 4. Channel structure 5. Interface ports 6. Code sharing 7. Actual size
They are explained in general as follows. Communication pattern describes the
regular communication topology of the member processes. Index pattern defines how the members of the template are identified, i.e. how many non-negative integer values are used to identify one member and what the meaning of each value is. Minimal size gives the minimal range of each index dimension. Each member in a minimal size template is called representative and they can have different code by default. For example, in a 2-D mesh the minimal representative size is 3x3 and there are 3 different representative processes whose code should be defined by the user:
1. Corner process (having 2 neighbours) 2. Edge process (having 3 neighbours) 3. Internal process (having 4 neighbours)
Channel structure refines the base communication pattern by defining the exact
channel connections and directions from the possible alternatives (e.g., one-directional or two-directional channels). Interface ports define the direct external
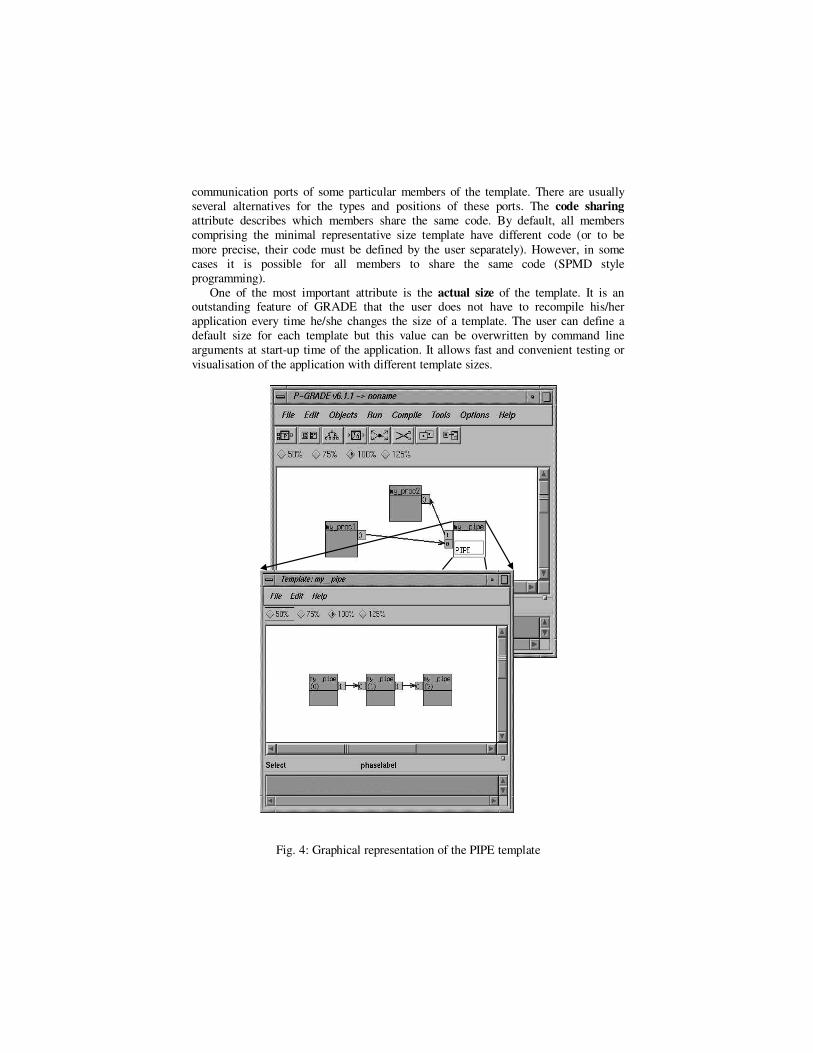
communication ports of some particular members of the template. There are usually several alternatives for the types and positions of these ports. The code sharing attribute describes which members share the same code. By default, all members comprising the minimal representative size template have different code (or to be more precise, their code must be defined by the user separately). However, in some cases it is possible for all members to share the same code (SPMD style programming).
One of the most important attribute is the actual size of the template. It is an outstanding feature of GRADE that the user does not have to recompile his/her application every time he/she changes the size of a template. The user can define a default size for each template but this value can be overwritten by command line arguments at start-up time of the application. It allows fast and convenient testing or visualisation of the application with different template sizes.
Fig. 4: Graphical representation of the PIPE template
3 Macrostep debugging by DIWIDE The DIWIDE distributed debugger provides two debugging mode for the user: • Pure debugging • Macrostep debugging
In the Pure debugging mode, the user can debug the component processes of the
parallel program according to the well-known sequential debugging techniques. Breakpoints and step-by-step execution can be used simultaneously in each Process window. In this way, DIWIDE realises the parallel running, sequential debuggers concept. Each process, independently from the others, can be controlled by DIWIDE. Step-by-step execution is possible both at the graphical level (icon-by-icon execution) and at the textual level (instruction-by-instruction execution).
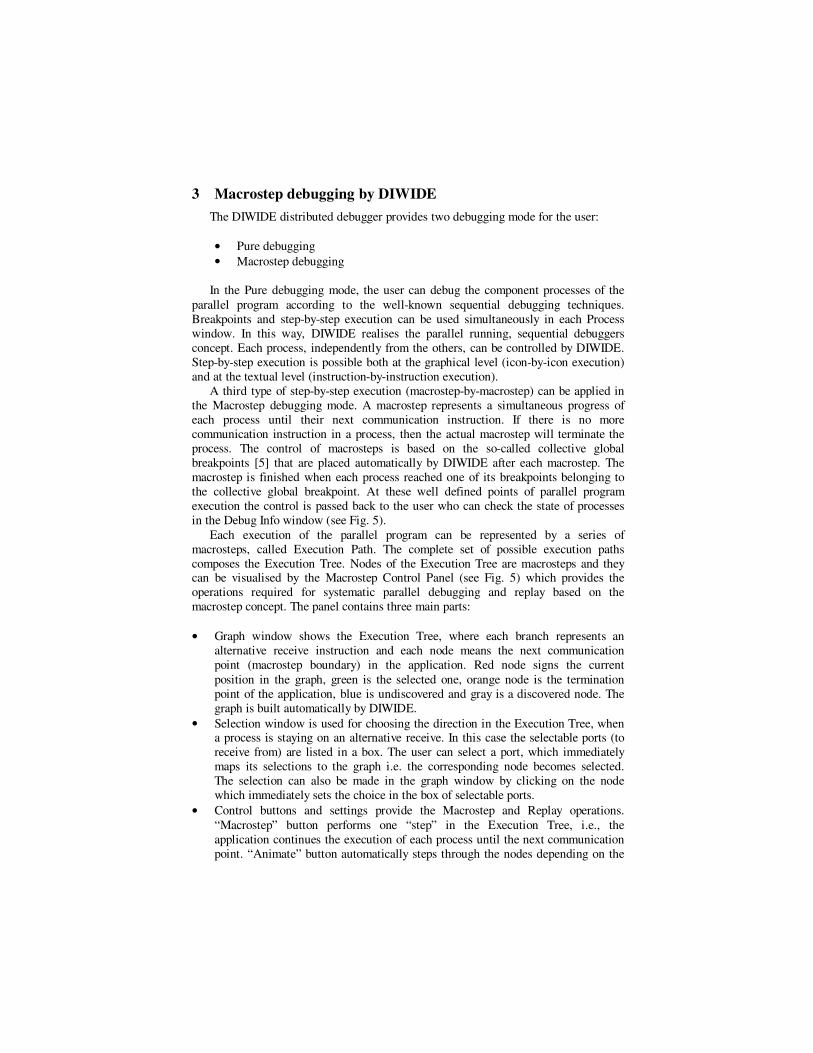
A third type of step-by-step execution (macrostep-by-macrostep) can be applied in the Macrostep debugging mode. A macrostep represents a simultaneous progress of each process until their next communication instruction. If there is no more communication instruction in a process, then the actual macrostep will terminate the process. The control of macrosteps is based on the so-called collective global breakpoints [5] that are placed automatically by DIWIDE after each macrostep. The macrostep is finished when each process reached one of its breakpoints belonging to the collective global breakpoint. At these well defined points of parallel program execution the control is passed back to the user who can check the state of processes in the Debug Info window (see Fig. 5).
Each execution of the parallel program can be represented by a series of macrosteps, called Execution Path. The complete set of possible execution paths composes the Execution Tree. Nodes of the Execution Tree are macrosteps and they can be visualised by the Macrostep Control Panel (see Fig. 5) which provides the operations required for systematic parallel debugging and replay based on the macrostep concept. The panel contains three main parts:
• Graph window shows the Execution Tree, where each branch represents an
alternative receive instruction and each node means the next communication point (macrostep boundary) in the application. Red node signs the current position in the graph, green is the selected one, orange node is the termination point of the application, blue is undiscovered and gray is a discovered node. The graph is built automatically by DIWIDE.
• Selection window is used for choosing the direction in the Execution Tree, when a process is staying on an alternative receive. In this case the selectable ports (to receive from) are listed in a box. The user can select a port, which immediately maps its selections to the graph i.e. the corresponding node becomes selected. The selection can also be made in the graph window by clicking on the node which immediately sets the choice in the box of selectable ports.
• Control buttons and settings provide the Macrostep and Replay operations. “Macrostep” button performs one “step” in the Execution Tree, i.e., the application continues the execution of each process until the next communication point. “Animate” button automatically steps through the nodes depending on the

“Animation mode” setting. “Restart” button reinitialises the application and “Close” button kills the application, finishes the Macrostep debugging and P-GRADE turns to “READY” state.
The panel provides the replay technique by allowing the user to reanimate the
whole application to a selected point (metabreakpoint [5]) in the Execution Tree graph, i.e., to execute each process to a specific state. The replay method also enables to discover all the states of the application by restarting the application after an execution path has been completed, and by selecting an unexplored execution path originating from a choice point of the Execution Tree. The same can be done automatically by DIWIDE. Selecting the Whole graph animation mode at the Macrostep Control Panel, DIWIDE automatically builds up the whole Execution Tree graph.
Fig. 5: Window types used in the DIWIDE debugger
With these supports the user can do the test for all inherently different timing
conditions of the component processes and is able to find the bugs caused by

concurrent behaviour. An important advantage of using the Macrostep debugging mode is that deadlocks can be detected automatically without user interaction. In the Whole graph animation mode, when DIWIDE reaches a node in the Execution Tree which is not a termination node and from where there is no possible continuation, then such a node represents a deadlock point in the parallel program and it is visualised by colouring the node black.
The details of the systematic debugging methodology based on the macrostep and replay techniques can be found in [5].
4 Performance monitoring and visualisation in P-GRADE Performance visualisation systems typically consist of the following four stages: 1. Source code instrumentation 2. Run-time monitoring (data acquisition) 3. Data analysis 4. Visualisation The first stage serves for instrumenting the code with the necessary calls to the
operating system or to the underlying extended communication library. The second stage serves to collect trace events during the execution of the parallel program. These collected events are typically stored in one or several log files that are analysed after the execution of the program. This third stage, called data analysis stage is important in order to establish the physical or logical timing order of the collected events. Finally, the ordered events are visualised by several display views in order to easily grasp the nature of parallel program execution.
Performance visualisation systems can be classified according how they support the four stages of performance measurement. Source code instrumentation is decisive concerning the convenient use of the system or simply from the point of view of usability. Scalability is another important aspect of performance visualisation systems. Scalability is strongly related with the second and third stages of performance visualisation. A tool is scalable if it enables the analysis of large, long running parallel programs. It requires special techniques to avoid the generation of too large trace files at run-time. Finally, versatility is another key issue that defines the various display views that the performance visualisation system can provide as well as the interoperability with other visualisation tools. In the next sections we give a detailed description of all these aspects and show how they are supported by the PROVE visualisation tool.
4.1 Source code instrumentation
Source code instrumentation has four major components that should be considered in classifying performance visualisation systems:
1. Instrumentation mode 2. Filtering 3. Support for monitoring modes 4. Support for click-back facility

The instrumentation mode can be manual or automatic. All the state-of-the-art
performance visualisation systems provide automatic instrumentation. It means that the user has not to touch the source code, it is the task of the compiling/linking system to transform the original source code or to call extended instrumented communication libraries that support run-time monitoring. In the case of PROVE it is the GRP2C pre-compiler and the Grapnel Library that are responsible for supporting automatic code instrumentation. The GRAPNEL Library can call either instrumented PVM or MPI library functions for tracing communication events. It also provides instrumented calls for the internal graphical nodes of GRAPNEL processes enabling event generation and visualisation at the GRAPNEL graphical icon level.
Filtering means that the user can specify for the
compiling/linking system the interesting program components for which the run-time events should be generated and collected. The lack of such a facility makes the trace file unnecessarily big. Oppositely, filtering makes the trace file customisable to the particular interest of the programmer. The size of the trace file is one of the most crucial problem of performance visualisation and hence all facilities that can reduce its size are worth supporting. In GRADE, filtering is supported at the level of GRAPNEL as a built-in feature of GRED. In the Filter types window (see Fig. 6) all the GRAPNEL graphical node types can be filtered. In default, GRM will collect events on the entry and exit point of each GRAPNEL graphical node. However, if the user is interested for example, only in the SEQ, CAI, CAO and CAIALT nodes, he can filter out all the other graphical nodes (see Fig. 6).
Moreover, there is a possibility to individually turn on or off filtering on each graphical node of the GRAPNEL program. In this way, the programmer is able to customise the monitoring system to his/her particular interest and to focus on the events most interesting for him/her.
Basically, two monitoring modes are supported in performance visualisation systems. The first one is the collection of individual events, the second one is the collection of statistics information based on counters and timers. The application of the latter one helps in reducing the size of the trace file and hence, its usage is highly advantageous. The version of PROVE in GRADE supported only the collection of individual events. The current version of PROVE in P-GRADE is able to collect both individual events and statistics information.
Although, the click-back facility is one of the most important facilities of performance visualisation systems there are only very few systems that can support this feature. The general problem with performance visualisation systems is the lack of correlating run-time activities with their source in the source code. The click-back facility applied in advanced tools is a remedy for the problem. Clicking on a visualised event, the system can highlight the part of the source code that is
Fig. 6: Filter Types pull-down menu

responsible for the generation of the event. None of the performance visualisation systems, except PROVE, can provide click-forward facility. This facility is the opposite of the click-back facility and it means that clicking on a source code line, the tool can indicate in the space-time diagram of PROVE which events were generated by the selected source code line. The pair-wise use of click-back and click-forward facilities ensure the perfect identification of the run-time activities of program components.
The vertical time bar in the space-time diagram of PROVE (bottom-left window in Fig. 7) is used to realise the click-back facility. The time bar selects the interested moment of the execution time. Clicking on the cross point of any process line and the time bar will result in highlighting (making red) the corresponding process in the Application window and the corresponding graphical node in the Process window. Vice versa, clicking on a graphical node in a Process window, the time bar will move in the space-time diagram to the next event that was generated by the selected graphical node.
Fig. 7: Window types used in the click-forward and click-back facilities

4.2 Data acquisition (monitoring)
All the selected events are collected during the program execution by the run-time monitoring system. The collected data are stored either in memory or in one or more trace files. Even if the data are stored in memory, time to time they should be saved into trace file otherwise, the monitoring system could not be scalable and would not be suitable to monitor large, long running parallel programs. The size of the trace file is crucial and hence, several techniques are applied in order to reduce its size.
One such technique is semi-on-line monitoring which is applied in P-GRADE. In case of semi-on-line monitoring, events are regularly buffered in local storage. However, when they are needed they are collected into a global trace and are processed and visualised resulting in a semi-on-line visualisation system.
In contrast, off-line monitoring means that trace events are stored in local or global storage areas (memory and files) and are processed only after program termination. In on-line monitoring, trace events are sent immediately to a tool that processes (visualise or evaluate) them.
The original version of PROVE in GRADE was an off-line performance visualisation tool. The applications were monitored and event traces were generated by the Tape/PVM off-line monitoring tool where both the clock synchronisation method and the trace collection techniques were off-line. The experience with creating applications in GRADE showed that real applications could not be evaluated since Tape/PVM and PROVE were not capable of visualising very large trace data.
For P-GRADE, we have created a new distributed monitor (GRM) that supports semi-on-line visualisation. During execution the user can force trace collection at any time. Events generated until this time are collected by GRM and the trace is presented immediately by PROVE. Similarly, if one of the local trace buffers is getting full, P-GRADE initiates a trace collection phase and PROVE visualises the data collected so far. Trace collection phases are clearly shown in the space-time diagram of PROVE. For example, Fig. 8 shows a space-time diagram where two zones of program execution are clearly separated. Between the two zones there is a gap during which GRM executed the semi-on-line trace collection.
The main design goals of the new semi-on-line monitor (GRM) were strongly related to the P-GRADE environment:
1. GRM should support monitoring and visualisation of message passing
programs at GRAPNEL level. 2. GRM should be part of an integrated development environment. 3. GRM should be portable. 4. Semi-on-line monitoring and visualisation to support
− evaluation of long-running programs − joined debugging with execution visualisation
5. Dynamic instrumentation to support − evaluation of long-running programs − automatic performance analysers integrated into P-GRADE in the future
6. Trace data must not be lost at program abortion. We want to visualise the program execution to the point of abortion.

7. The execution environment and the development environment should be separable. Thus, an application can be developed on a local host while it is executed on a remote cluster (and it is visualised semi-on-line on the local host).
Another technique to reduce the size of the trace file is filtering that could be
either static (as described in the previous section) or dynamic. Many systems can provide dynamic filtering mechanism. The dynamic selection of filters can be interactive or non-interactive. In VISTOP [1], the user can start visualisation at any time he wants and he can suspend the execution of the program when he needs additional information or he wants to filter out previously collected events. Paradyn [11] goes further and provides a non-interactive, adaptive filtering mechanism where the visualisation system is automatically able to focus on interesting events and turn off filtering on those events. Vice versa it is able to identify uninteresting events and turn on filtering for them.
Fig. 8: Space-time diagram of PROVE
The current version of PROVE cannot provide dynamic filtering. However, GRM and PROVE support a combined debugging/visualisation system based on the novel macrostep-by-macrostep debugging technique described in Section 3. Visualisation can be divided into phases according to macrosteps and at macrostep boundaries the user can interactively change the filters of the monitoring system. Trace files are collected during macrosteps and hence, their size can be radically reduced.

4.3 Data analysis
The third stage of performance visualisation is devoted to data analysis. The physical clocks of the processors in a distributed system are usually non synchronised or even in the case of synchronisation, they can be drifted to each other. Hence, the data collected at run time and time-stamped by the ticks of the physical clocks cannot be considered strongly and precisely ordered. The first task of the data analysis phase is to create an at least logical ordering among the collected events. The most frequently used ordering criteria is based on the happened-before relation introduced by Lamport [10].
Fig. 9: Zoomed space-time diagram
The data analysis phase should also support some displaying features that are most relevant for the user. Such facilities are zooming and filtering. Zooming means that user can focus on any part of the whole execution and the visualisation view shows the selected part in a much more detailed way. For example, the zoomed space-time diagram in Fig. 9 shows even the communication ports. In this way, the diagram is helpful in identifying the actual ports on which communications took place.
The role of post-mortem filtering is different from the role of the filtering during code instrumentation. Post-mortem filtering helps in selecting relevant information from the collected data similarly to the zooming feature. However, filtering is more selective than zooming and hence, it can help in selecting only the required processes, processors, communication events, etc. and to visualise only these selected events and units. In order to help the user in selecting post-mortem filters and to rearrange the order of processes and processors in the space-time diagram PROVE provides an extra dialog window.

4.4 Visualisation
Most of the performance visualisation tools (Paragraph [4], Pablo [12], VAMPIR [13]) provide a significant number of various display views to visualise the various aspects of program execution. The current version of PROVE gives a detailed space-time diagram that describes the communication aspects of parallel processes as well as the change of their state in time. The different colours in the horizontal process bars represent different process states like idle, waiting for communication and busy. It also shows on which processor the processes were executed and when they were created on the processor. Examples of the space-time diagram can be seen in Fig. 7, 8 and 9.
Fig. 10: Statistic windows of PROVE
PROVE provides several statistics window types, as well. One of them shows the processor utilisation by representing process states in a common window. The other two statistics windows are related with communication. The Process Communication window shows the amount of process communication in time. The Host Communication window shows the amount of communication among selected hosts

in the communication network or among selected processors in a parallel computer. The time range of the three windows are synchronised together and with the space-time diagram. The fourth window shows the proportion of the various states of each process in a histogram. The fifth window shows the same information for a given process as a pie chart. The five statistic window types are shown in Fig. 10.
5 Conclusions
The P-GRADE environment provides a unique and complete solution for efficient and easy parallel program development for non-specialist programmers.
The hybrid hierarchical language approach of GRAPNEL has many advantages compared to pure textual message passing programs as well as compared to a completely graphical approach. Advantages compared to a pure textual message passing program are as follows:
• The programmer does not have to learn the syntax of PVM or MPI. The graphical
notation is much simpler and easier to learn than the notations of PVM or MPI. • The GRAPNEL pre-compiler can check systematically and automatically the
correctness of communication protocols between communicating processes. This checking is impossible in PVM and MPI though incorrect protocols are the main source of programming errors in message passing parallel programs.
• The separation of parallel and sequential code by hierarchical layers facilitates the re-engineering of existing sequential programs into parallel ones.
• Graphical debugging can be applied at the Application and Process layer and is much more convenient and user friendly than textual debugging.
Advantages compared to a completely graphical approach:
• A completely graphical approach would result in huge graphs that would be very difficult to understand by the programmer. The separation of parallel and sequential code results in screen size graphs that can be easily conceived by the user.
• A completely graphical approach would require to rewrite existing sequential codes into a graphical one. It would prevent the user from applying of existing libraries.
• A completely graphical approach would mix up sequential and parallel code segments which would make design, debugging and code maintenance much more difficult.
The novel macrostep debugging concept of DIWIDE enables systematic testing
and debugging in a parallel programming environment. It also helps to automatically detect deadlocks in message passing parallel programs.
The GRM monitor and the PROVE visualisation tool provide a semi-on-line performance visualisation system that can be combined with the DIWIDE macrostep debugger.
GRADE and P-GRADE are the first two members of a family of visual programming environments. The third member of the family will be VisualMP that

will introduce further support for cluster programming. It will be able to handle checkpointing, dynamic load balancing and fault-tolerance which are very important issues both in dedicated and non-dedicated clusters. The fourth member of the family will be VisualGrid [7] that will extend the graphical programming environment concept towards grid computing including support for grid resource management, grid monitoring and mobile processes.
VisualMP and VisualGrid are under development in their design stage. The GRADE prototype system can be freely downloaded from the following web page: www.lpds.sztaki.hu. P-GRADE will be commercialised by Silicon Graphics Hungary Ltd.
Acknowledgements
This work was partially supported by the OMFB-00681/99 project, by the M-1/98 Hungarian-Mexican TéT project and by the T032226 OTKA project.
References
1. A. Bode and P. Braun: Monitoring and Visualization in TOPSYS, in Performance and Visualization of Parallel Systems (editors: G. Haring and G. Kotsis), Elsevier, pp. 97-118, 1993
2. G. Dózsa: Visual Programming to Support Parallel Program Design, in Parallel Program Development for Cluster Computing: Methodology, Tools and Integrated Environments, (editors: P. Kacsuk, J. Cunha and S. Winter), Nova Science Publ., in print
3. D. Drótós and P. Kacsuk: GRAPNEL To C Translation in the GRADE Environment, Computers and Artificial Intelligence, Vol. 18., No. 4., pp. 415-424, 1999
4. M.T.Heath and J.A.Etheridge: Visualizing the Performance of Parallel Programs, IEEE Software, Vol. 8., No. 5., pp. 29-39, 1991
5. P.Kacsuk: Systematic Macrostep Debugging of Message Passing Parallel Programs, Journal of Future Generation Computer Systems, Vol. 16., No. 6., pp. 609-624, 2000
6. P. Kacsuk, J. Cunha and S. Winter (editors): Parallel Program Development for Cluster Computing: Methodology, Tools and Integrated Environments, Nova Science Publ., in print
7. P .Kacsuk and G. Dózsa: VisualGrid: Graphical Programming Environment for Cluster and Grid Applications, Proc. of the 1st European Grid Forum Workshop, Poznan, pp. 305-312, 2000
8. P .Kacsuk, G. Dózsa, T. Fadgyas and R. Lovas: GRADE: A Graphical Programming Environment for Multicomputers, Computers and Artificial Intelligence. Vol. 17., No. 5., pp. 417-427, 1998
9. P .Kacsuk, G. Dózsa, T. Fadgyas and R. Lovas: The GRED Graphical Editor for the GRADE Parallel Program Development Environment, Future Generation Computer Systems, Vol. 15., pp. 443-452, 1999
10. L. Lamport: Time, Clocks, and the Ordering of Events in a Distributed System, CACM, 21(7), 1978, pp. 558-565
11. B.P.Miller, et al.: The Paradyn Parallel Performance Measurement Tools, IEEE Computer, Vol. 28., No. 11., pp. 37-46, 1995
12. D.A. Reed et al.: Scalable Performance Analysis: The Pablo Performance Analysis Environment", Proc. IEEE Scalable Parallel Libraries Conf., IEEE Service Center, Piscataway, N.J.,1993
13. VAMPIR Home Page: http://www.pallas.de/pages/vampir.htm