Embed Size (px)
Citation preview
Visualising Astronomy Data using VRMLBrett Beeson, Michael Lancaster, David G. Barnes�The University of Melbourne, Parkville, VIC 3010, Australia��
Paul D. Bourke�SwinburneUniversity of Technology, Hawthorn, VIC 3122, Australia��
Guy Rixon�University of Cambridge, MadingleyRoad, Cambridge CB3 0HA, UK��Correspondence to [email protected] (DGB)
ABSTRACTVisualisation is a powerful tool for understanding the large data sets typical of astronomical surveys and can reveal unsuspected relationships
and anomalous regions of parameter space which may be difficult to find programatically. Visualisation is a classic information technology for optimising scientific return. We are developing a number of generic on-line visualisation tools as a component of the Australian Virtual Observatory project. The tools will be deployed within the framework of the International Virtual Observatory Alliance (IVOA), and follow agreed-upon standards to make them accessible by other programs and people. We and our IVOA partners plan to utilise new information technologies (such as grid computing and web services) to advance the scientific return of existing and future instrumentation.Here we present a new tool - VOlume - which visualises point data. Visualisation of astronomical data normally requires the local installation of complex software, the downloading of potentially large datasets, and very often time-consuming and tedious data format conversions. VOlume enables the astronomer to visualise data using just a web browser and plug-in. This is achieved using IVOA standards which allow us to pass data between Web Services, Java Servlet Technology and Common Gateway Interface programs. Data from a catalogue server can be streamed in eXtensible Mark-up Language format to a servlet which produces Virtual Reality Modeling Language output. The user selects elements of the catalogue to map to geometry and then visualises the result in a browser plug-in such as Cortona or FreeWRL.Other than requiring an input VOTable format file, VOlume is very general. While its major use will likely be to display and explore astronomical source catalogues, it can easily render other important parameter fields such as the sky and redshift coverage of proposed surveys or the sampling of the visibility plane by a rotation-synthesis interferometer.
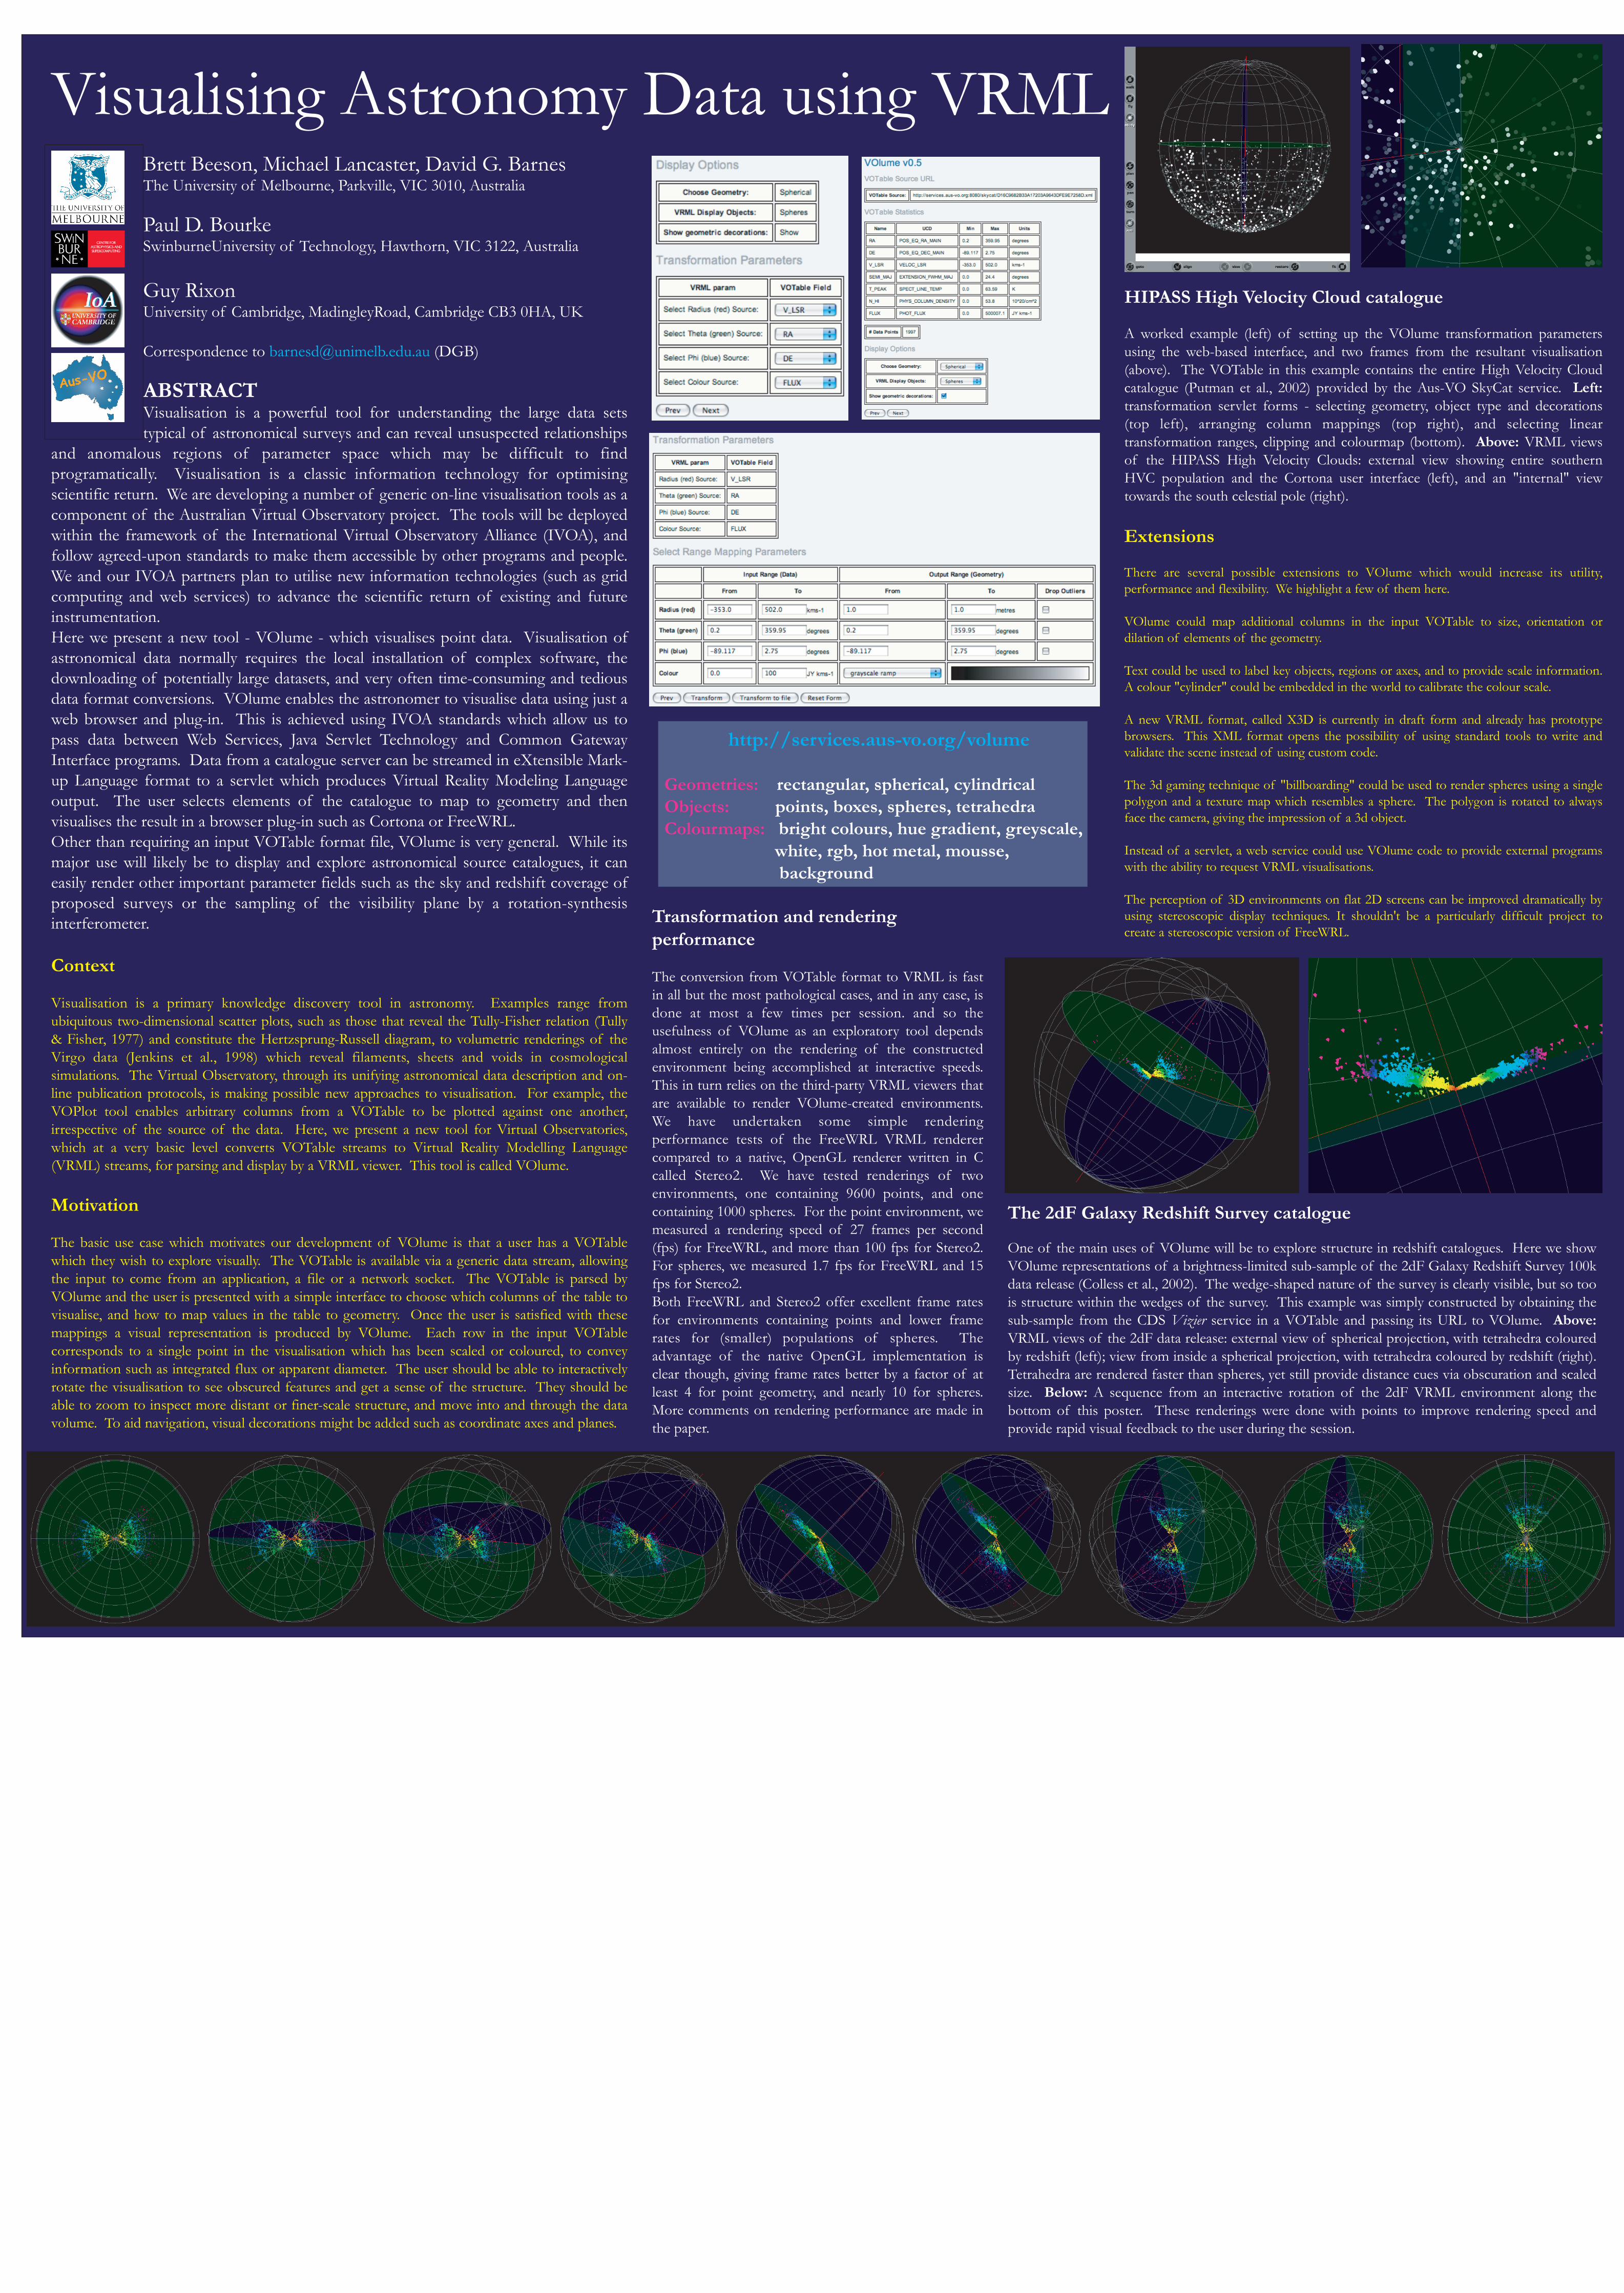
The 2dF Galaxy Redshift Survey catalogue
One of the main uses of VOlume will be to explore structure in redshift catalogues. Here we show VOlume representations of a brightness-limited sub-sample of the 2dF Galaxy Redshift Survey 100k data release (Colless et al., 2002). The wedge-shaped nature of the survey is clearly visible, but so too is structure within the wedges of the survey. This example was simply constructed by obtaining the sub-sample from the CDS Vizier service in a VOTable and passing its URL to VOlume. Above: VRML views of the 2dF data release: external view of spherical projection, with tetrahedra coloured by redshift (left); view from inside a spherical projection, with tetrahedra coloured by redshift (right). Tetrahedra are rendered faster than spheres, yet still provide distance cues via obscuration and scaled size. Below: A sequence from an interactive rotation of the 2dF VRML environment along the bottom of this poster. These renderings were done with points to improve rendering speed and provide rapid visual feedback to the user during the session.
HIPASS High Velocity Cloud catalogue
A worked example (left) of setting up the VOlume transformation parameters using the web-based interface, and two frames from the resultant visualisation (above). The VOTable in this example contains the entire High Velocity Cloud catalogue (Putman et al., 2002) provided by the Aus-VO SkyCat service. Left: transformation servlet forms - selecting geometry, object type and decorations (top left), arranging column mappings (top right), and selecting linear transformation ranges, clipping and colourmap (bottom). Above: VRML views of the HIPASS High Velocity Clouds: external view showing entire southern HVC population and the Cortona user interface (left), and an "internal" view towards the south celestial pole (right).
Transformation and rendering performance
The conversion from VOTable format to VRML is fast in all but the most pathological cases, and in any case, is done at most a few times per session. and so the usefulness of VOlume as an exploratory tool depends almost entirely on the rendering of the constructed environment being accomplished at interactive speeds. This in turn relies on the third-party VRML viewers that are available to render VOlume-created environments. We have undertaken some simple rendering performance tests of the FreeWRL VRML renderer compared to a native, OpenGL renderer written in C called Stereo2. We have tested renderings of two environments, one containing 9600 points, and one containing 1000 spheres. For the point environment, we measured a rendering speed of 27 frames per second (fps) for FreeWRL, and more than 100 fps for Stereo2. For spheres, we measured 1.7 fps for FreeWRL and 15 fps for Stereo2.Both FreeWRL and Stereo2 offer excellent frame rates for environments containing points and lower frame rates for (smaller) populations of spheres. The advantage of the native OpenGL implementation is clear though, giving frame rates better by a factor of at least 4 for point geometry, and nearly 10 for spheres. More comments on rendering performance are made in the paper.
Extensions
There are several possible extensions to VOlume which would increase its utility, performance and flexibility. We highlight a few of them here.
VOlume could map additional columns in the input VOTable to size, orientation or dilation of elements of the geometry.
Text could be used to label key objects, regions or axes, and to provide scale information. A colour "cylinder" could be embedded in the world to calibrate the colour scale.
A new VRML format, called X3D is currently in draft form and already has prototype browsers. This XML format opens the possibility of using standard tools to write and validate the scene instead of using custom code.
The 3d gaming technique of "billboarding" could be used to render spheres using a single polygon and a texture map which resembles a sphere. The polygon is rotated to always face the camera, giving the impression of a 3d object.
Instead of a servlet, a web service could use VOlume code to provide external programs with the ability to request VRML visualisations.
The perception of 3D environments on flat 2D screens can be improved dramatically by using stereoscopic display techniques. It shouldn't be a particularly difficult project to create a stereoscopic version of FreeWRL.
Context
Visualisation is a primary knowledge discovery tool in astronomy. Examples range from ubiquitous two-dimensional scatter plots, such as those that reveal the Tully-Fisher relation (Tully & Fisher, 1977) and constitute the Hertzsprung-Russell diagram, to volumetric renderings of the Virgo data (Jenkins et al., 1998) which reveal filaments, sheets and voids in cosmological simulations. The Virtual Observatory, through its unifying astronomical data description and on-line publication protocols, is making possible new approaches to visualisation. For example, the VOPlot tool enables arbitrary columns from a VOTable to be plotted against one another, irrespective of the source of the data. Here, we present a new tool for Virtual Observatories, which at a very basic level converts VOTable streams to Virtual Reality Modelling Language (VRML) streams, for parsing and display by a VRML viewer. This tool is called VOlume.
Motivation
The basic use case which motivates our development of VOlume is that a user has a VOTable which they wish to explore visually. The VOTable is available via a generic data stream, allowing the input to come from an application, a file or a network socket. The VOTable is parsed by VOlume and the user is presented with a simple interface to choose which columns of the table to visualise, and how to map values in the table to geometry. Once the user is satisfied with these mappings a visual representation is produced by VOlume. Each row in the input VOTable corresponds to a single point in the visualisation which has been scaled or coloured, to convey information such as integrated flux or apparent diameter. The user should be able to interactively rotate the visualisation to see obscured features and get a sense of the structure. They should be able to zoom to inspect more distant or finer-scale structure, and move into and through the data volume. To aid navigation, visual decorations might be added such as coordinate axes and planes.
http://services.aus-vo.org/volume
Geometries: rectangular, spherical, cylindricalObjects: points, boxes, spheres, tetrahedraColourmaps: bright colours, hue gradient, greyscale, white, rgb, hot metal, mousse, background