Embed Size (px)
Citation preview
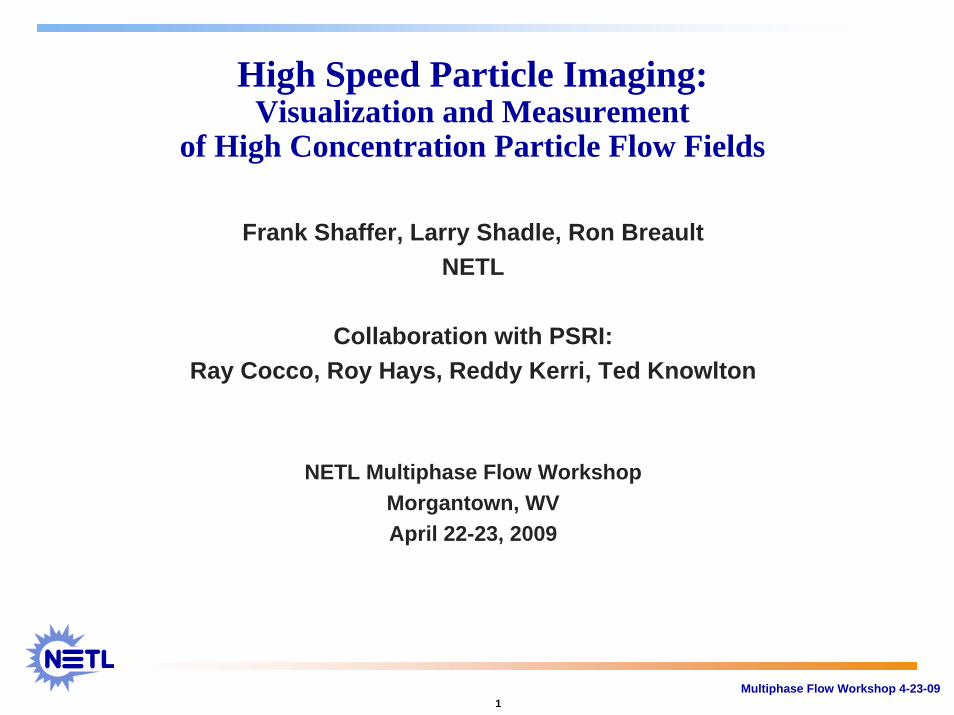
1Multiphase Flow Workshop 4-23-09
High Speed Particle Imaging:Visualization and Measurement
of High Concentration Particle Flow Fields
Frank Shaffer, Larry Shadle, Ron BreaultNETL
Collaboration with PSRI:Ray Cocco, Roy Hays, Reddy Kerri, Ted Knowlton
NETL Multiphase Flow WorkshopMorgantown, WVApril 22-23, 2009
2Multiphase Flow Workshop 4-23-09
High Speed Particle Imaging ?• The use of high resolution, high speed optical imaging
-- with and without a borescope -- to visualize andmeasure particle motion at all locations in particle flow fields of high particle concentrations.
• Using “fastest” high resolution, high speed camera available: Vision Research v12, with 1280 x 800 pixel resolution (12 bit grey scale) at 6200 frame per second. Up to 1 million frames per second at low resolution.
• Borescope diameter down to 6 mm to reduce interference with particle flow field.
3Multiphase Flow Workshop 4-23-09
High Speed Particle Imaging: Quantitative
Measured parameters:• 2D particle trajectory and velocity• Particle concentration• Particle collisions and rotation• Particle size and shape
• Accuracy is high enough (uncertainty ~ +1% for particle velocity) and sampling rate fast enough to resolve the 2D fluctuating components of particle velocity.
4Multiphase Flow Workshop 4-23-09
High Speed Particle Imaging: Qualitative
Generates high resolution, high speed videos of particle flow phenomena.
Measurements are made from the high speed videos.
This is the only measurement technique for which data can be interpreted by viewing a high speed video of the particle flow field from which the data were derived.
5Multiphase Flow Workshop 4-23-09
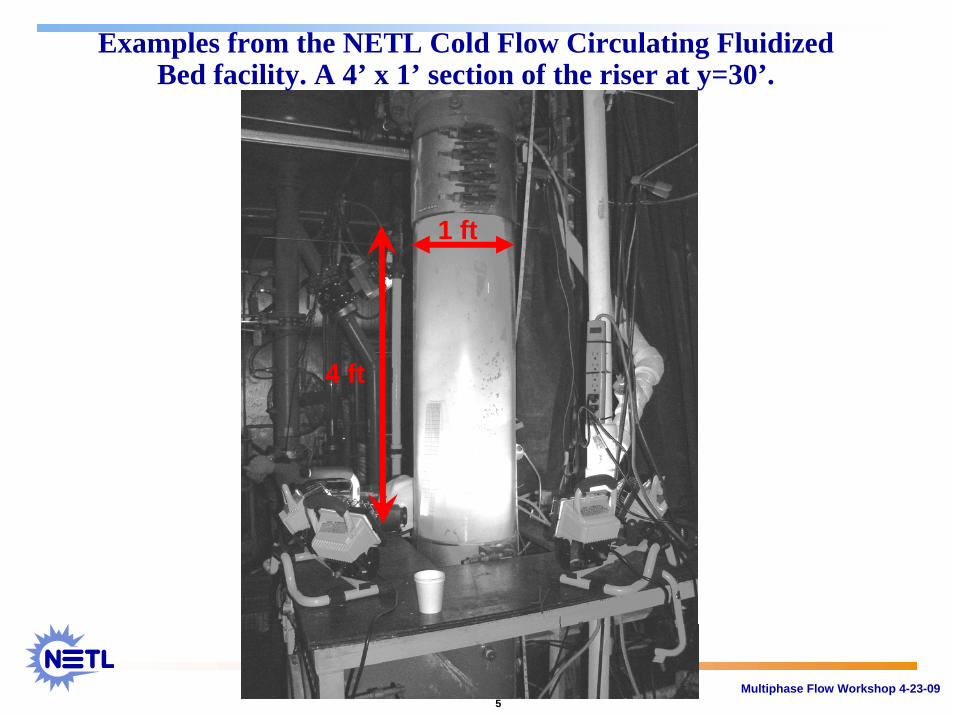
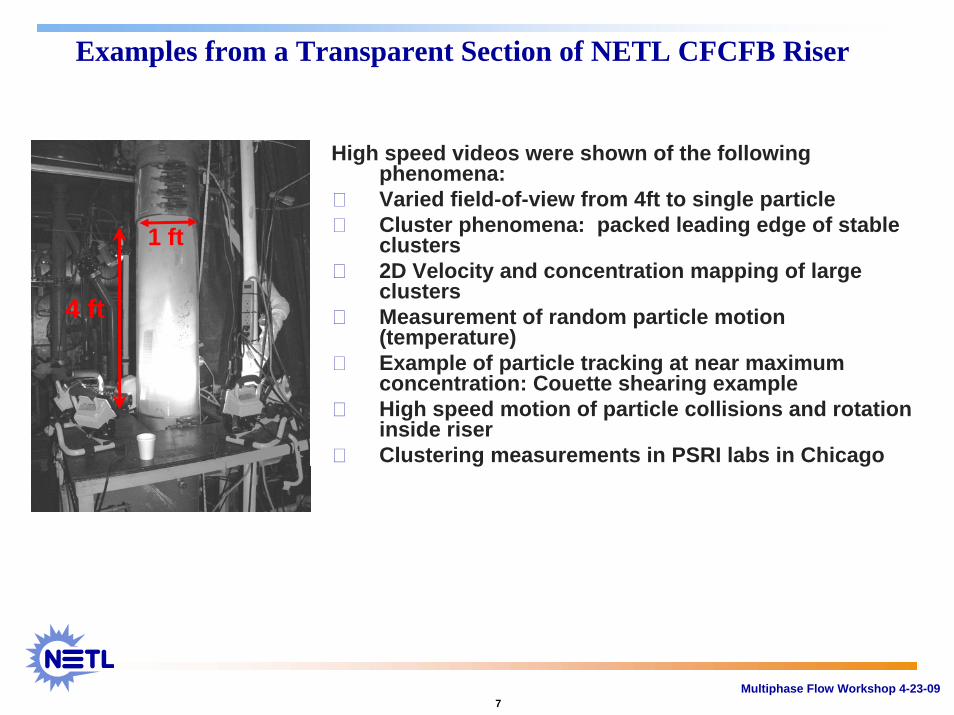
Examples from the NETL Cold Flow Circulating Fluidized Bed facility. A 4’ x 1’ section of the riser at y=30’.
4 ft
1 ft
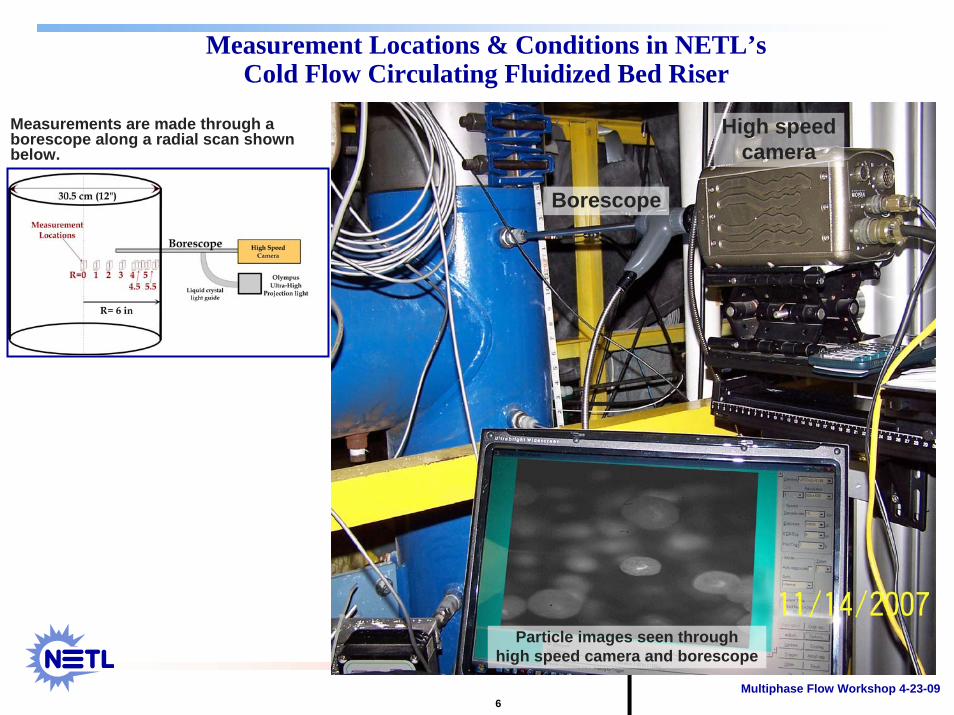
6Multiphase Flow Workshop 4-23-09
Measurement Locations & Conditions in NETL’sCold Flow Circulating Fluidized Bed Riser
Vertical Location on Riser = ?? m
Measurements are made through aborescope along a radial scan shown below.
Borescope
High speedcamera
Particle images seen throughhigh speed camera and borescope
7Multiphase Flow Workshop 4-23-09
Examples from a Transparent Section of NETL CFCFB Riser
4 ft
1 ft
High speed videos were shown of the following phenomena:Varied field-of-view from 4ft to single particleCluster phenomena: packed leading edge of stable clusters2D Velocity and concentration mapping of large clustersMeasurement of random particle motion (temperature)Example of particle tracking at near maximum concentration: Couette shearing exampleHigh speed motion of particle collisions and rotation inside riserClustering measurements in PSRI labs in Chicago
8Multiphase Flow Workshop 4-23-09
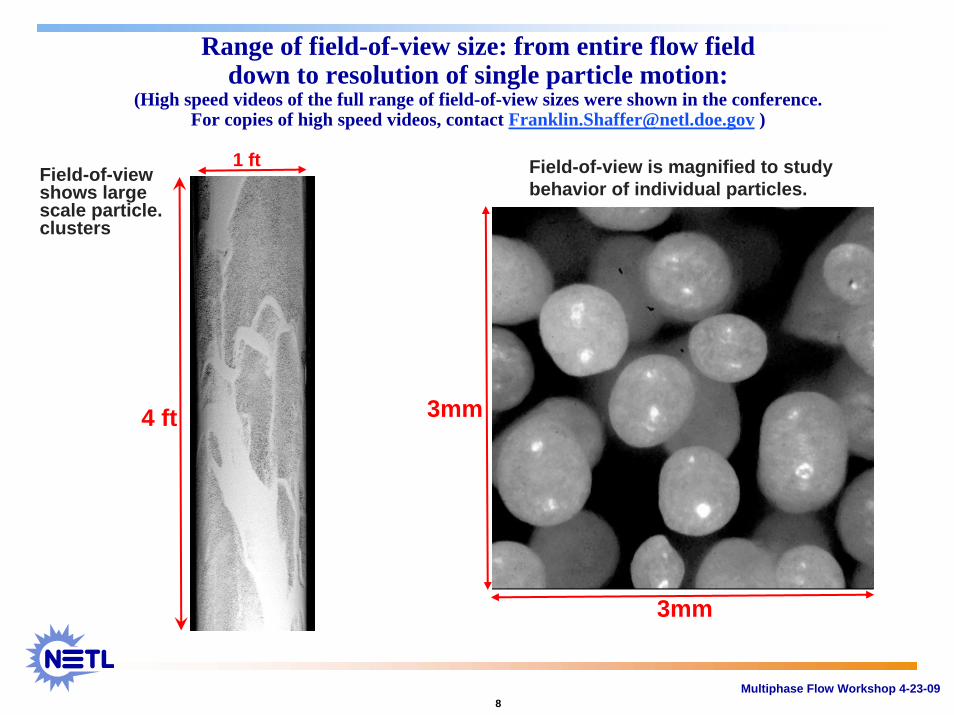
Range of field-of-view size: from entire flow field down to resolution of single particle motion:
(High speed videos of the full range of field-of-view sizes were shown in the conference.For copies of high speed videos, contact [email protected] )
3mm
1 ft Field-of-view is magnified to study behavior of individual particles.
4 ft
Field-of-view shows large scale particle. clusters
3mm
9Multiphase Flow Workshop 4-23-09
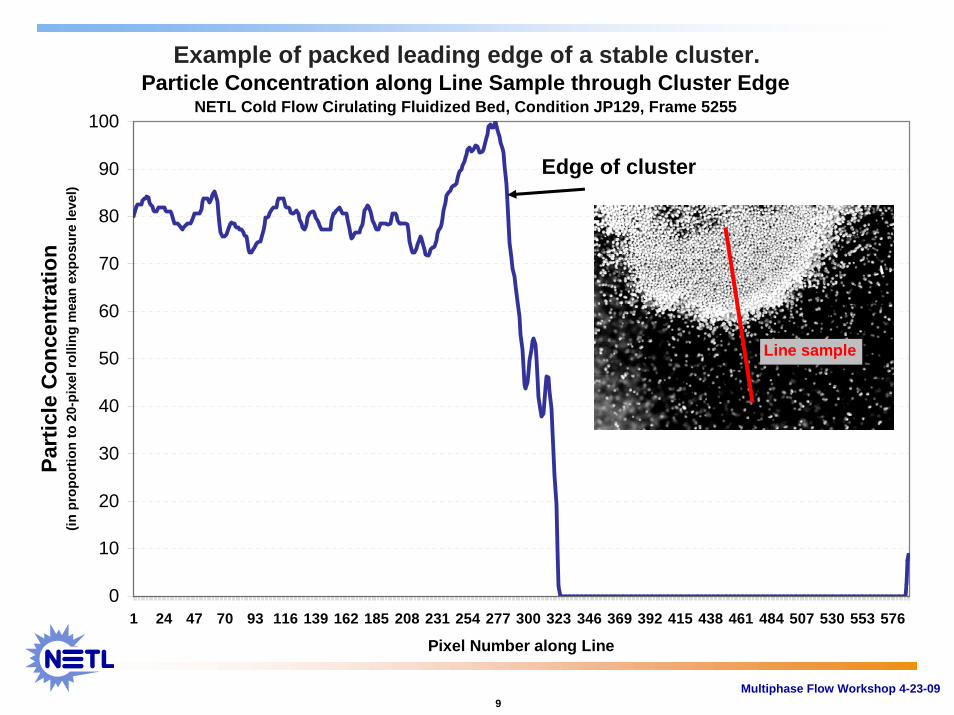
Particle Concentration along Line Sample through Cluster EdgeNETL Cold Flow Cirulating Fluidized Bed, Condition JP129, Frame 5255
0
10
20
30
40
50
60
70
80
90
100
1 24 47 70 93 116 139 162 185 208 231 254 277 300 323 346 369 392 415 438 461 484 507 530 553 576
Pixel Number along Line
Part
icle
Con
cent
ratio
n (in
pro
port
ion
to 2
0-pi
xel r
ollin
g m
ean
expo
sure
leve
l)
Edge of cluster
Line sample
Example of packed leading edge of a stable cluster.
10Multiphase Flow Workshop 4-23-09
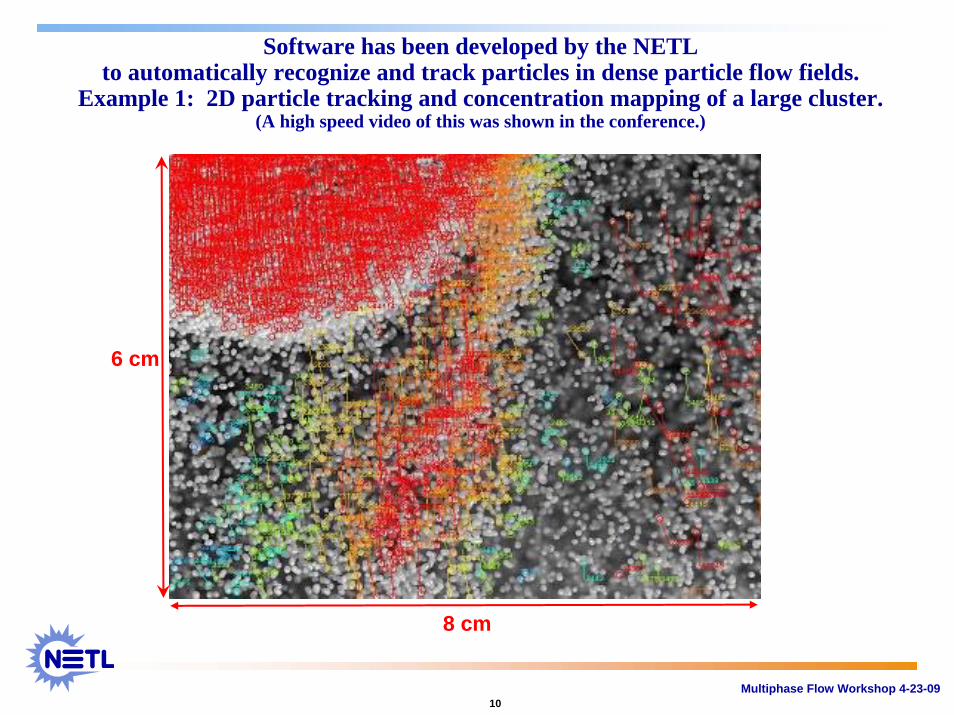
Software has been developed by the NETL to automatically recognize and track particles in dense particle flow fields.
Example 1: 2D particle tracking and concentration mapping of a large cluster.(A high speed video of this was shown in the conference.)
8 cm
6 cm
11Multiphase Flow Workshop 4-23-09
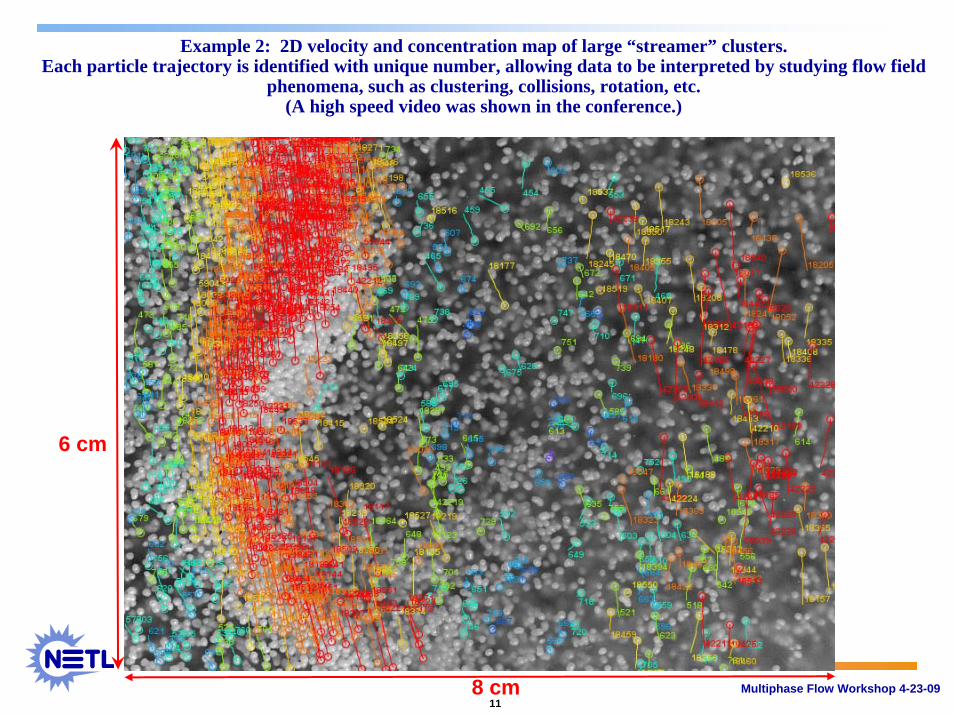
Example 2: 2D velocity and concentration map of large “streamer” clusters.Each particle trajectory is identified with unique number, allowing data to be interpreted by studying flow field
phenomena, such as clustering, collisions, rotation, etc.(A high speed video was shown in the conference.)
8 cm
6 cm
12Multiphase Flow Workshop 4-23-09
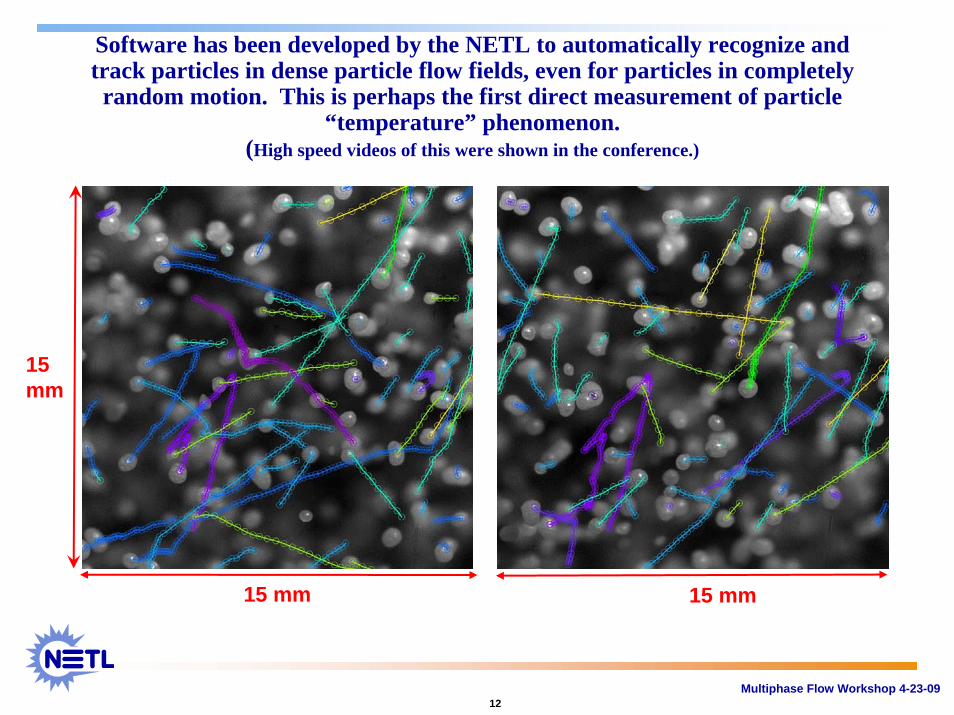
Software has been developed by the NETL to automatically recognize and track particles in dense particle flow fields, even for particles in completely random motion. This is perhaps the first direct measurement of particle
“temperature” phenomenon.(High speed videos of this were shown in the conference.)
15 mm
15mm
15 mm
13Multiphase Flow Workshop 4-23-09
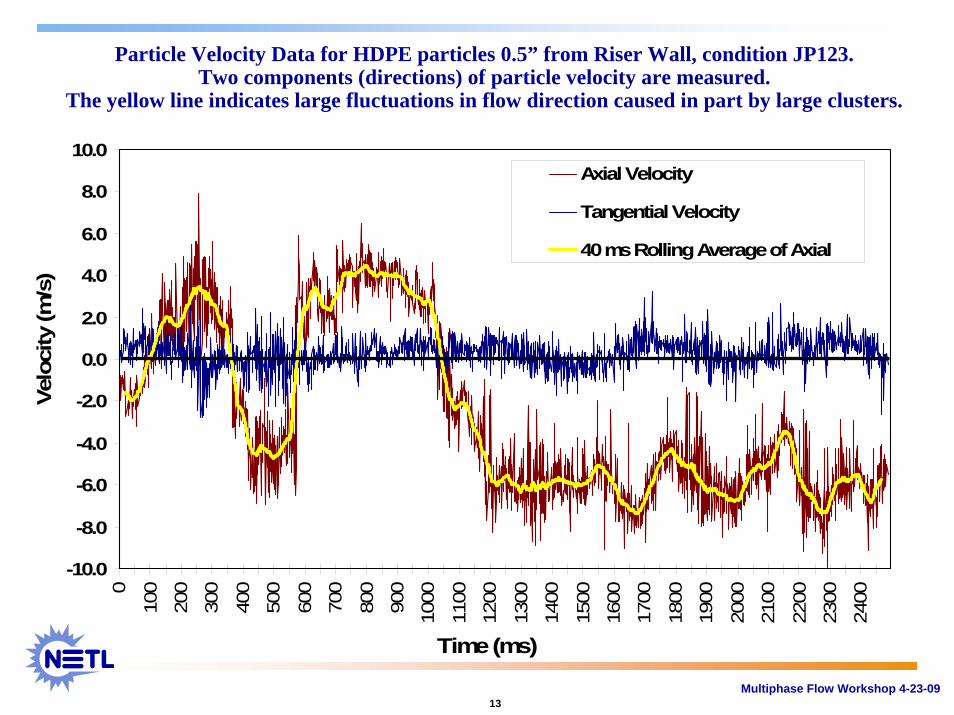
Particle Velocity Data for HDPE particles 0.5” from Riser Wall, condition JP123.Two components (directions) of particle velocity are measured.
The yellow line indicates large fluctuations in flow direction caused in part by large clusters.
-10.0
-8.0
-6.0
-4.0
-2.0
0.0
2.0
4.0
6.0
8.0
10.00
100
200
300
400
500
600
700
800
900
1000
1100
1200
1300
1400
1500
1600
1700
1800
1900
2000
2100
2200
2300
2400
Time (ms)
Axial Velocity
Tangential Velocity
40 ms Rolling Average of Axial
Velo
city
(m/s
)

14Multiphase Flow Workshop 4-23-09
Fluctuating Component of Particle Velocity, 0.5” from Wall, JP123 The large amplitude, low frequency component of velocity caused by clusters is removed, since, by
definition, particle fluctuations approach zero inside clusters.
-10.0
-8.0
-6.0
-4.0
-2.0
0.0
2.0
4.0
6.0
8.0
10.00
100
200
300
400
500
600
700
800
900
1000
1100
1200
1300
1400
1500
1600
1700
1800
1900
2000
2100
2200
2300
2400
Time (ms)
Fluctuating Component of Axial Velocity
Velo
city
(m/s
)
15Multiphase Flow Workshop 4-23-09
0
0.01
0.02
0.03
0.04
0.05
0.06
0 0.1 0.2 0.3 0.4 0.5 0.6 0.7 0.8 0.9
Solids fraction
ener
gy
total_fluctuating_energyTotal_fluct_energy_ke_regimeTotal_fluct_energy_GT_regime
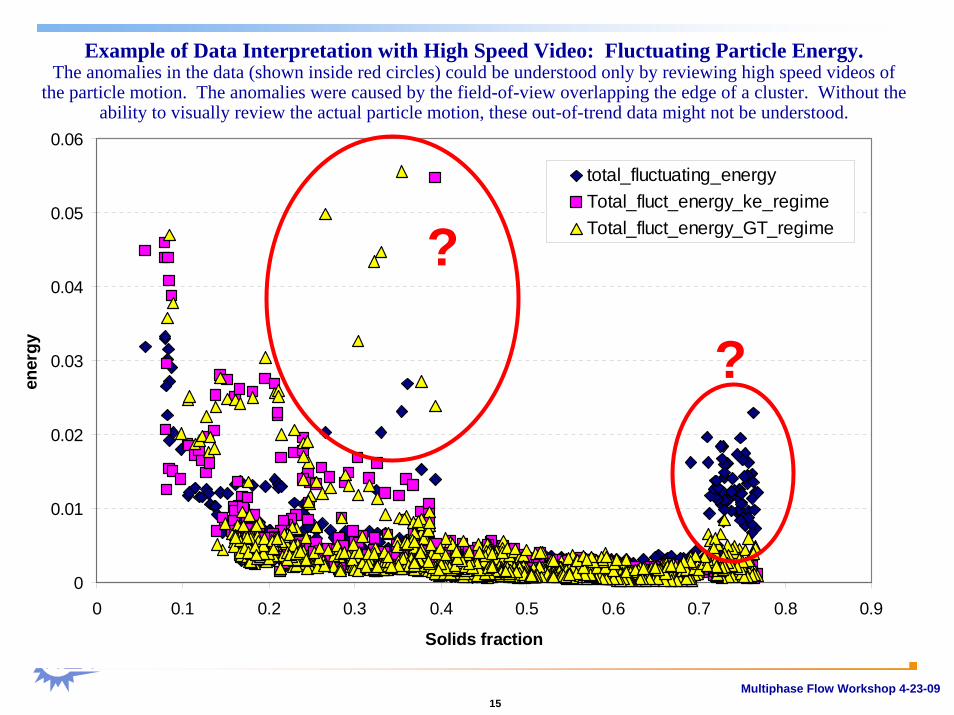
Example of Data Interpretation with High Speed Video: Fluctuating Particle Energy.The anomalies in the data (shown inside red circles) could be understood only by reviewing high speed videos of
the particle motion. The anomalies were caused by the field-of-view overlapping the edge of a cluster. Without the ability to visually review the actual particle motion, these out-of-trend data might not be understood.
?
?
16Multiphase Flow Workshop 4-23-09
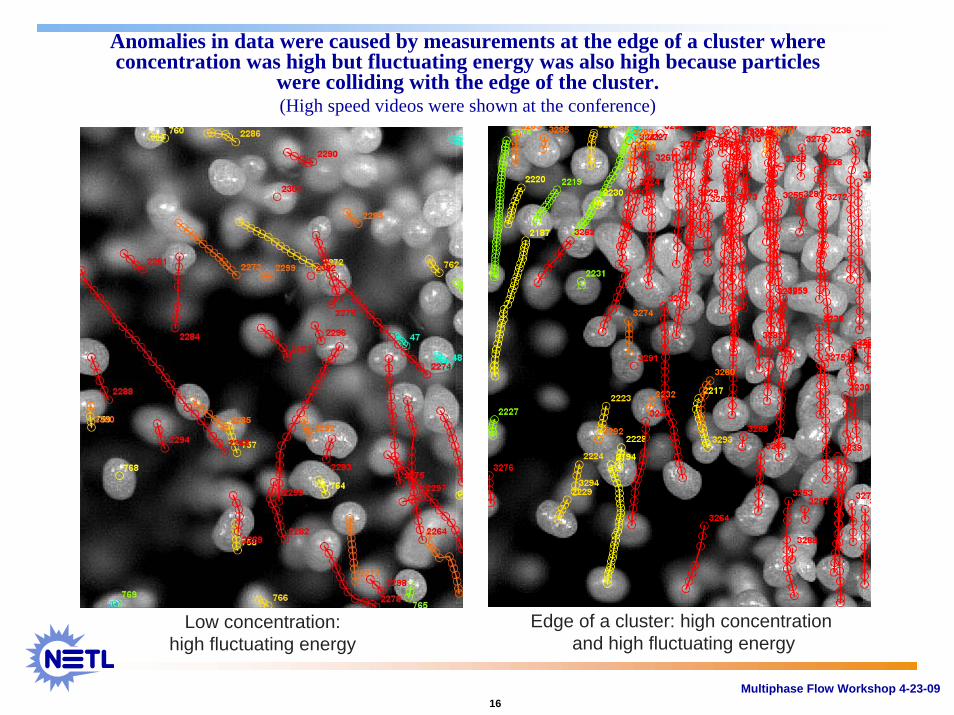
Low concentration:high fluctuating energy
Anomalies in data were caused by measurements at the edge of a cluster where concentration was high but fluctuating energy was also high because particles
were colliding with the edge of the cluster.(High speed videos were shown at the conference)
Edge of a cluster: high concentration and high fluctuating energy
17Multiphase Flow Workshop 4-23-09
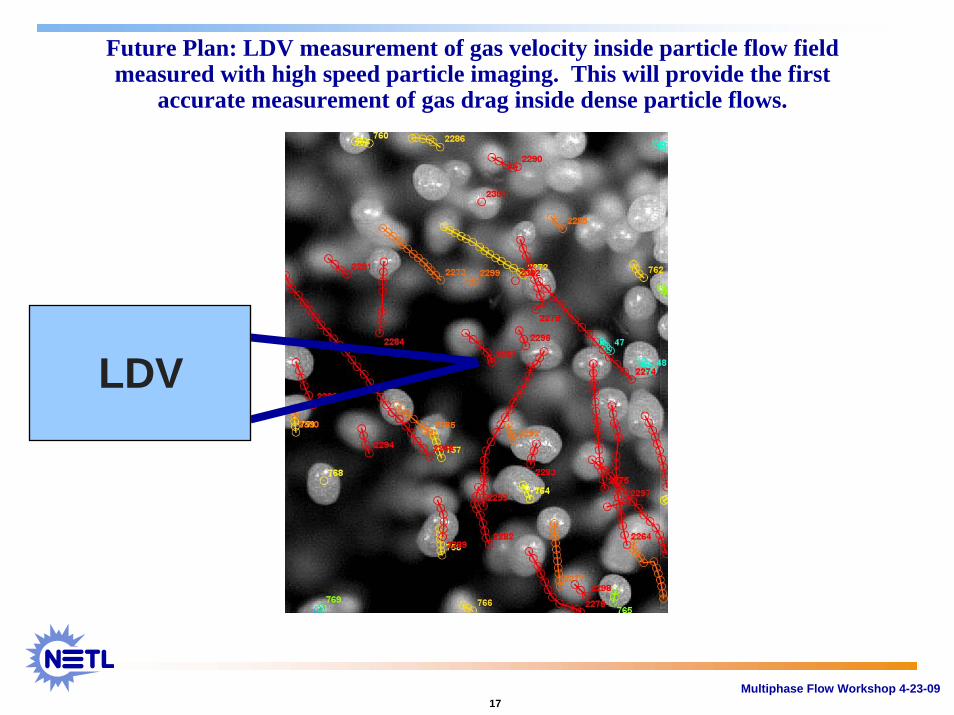
Future Plan: LDV measurement of gas velocity inside particle flow field measured with high speed particle imaging. This will provide the first
accurate measurement of gas drag inside dense particle flows.
LDV
0%
1%
2%
3%
4%
5%
6%
7%0
10,0
00
20,0
00
30,0
00
40,0
00
50,0
00
60,0
00
70,0
00
80,0
00
90,0
00
100,
000
Particle Rotation Rate (RPM)
% P
artic
les
rota
ting
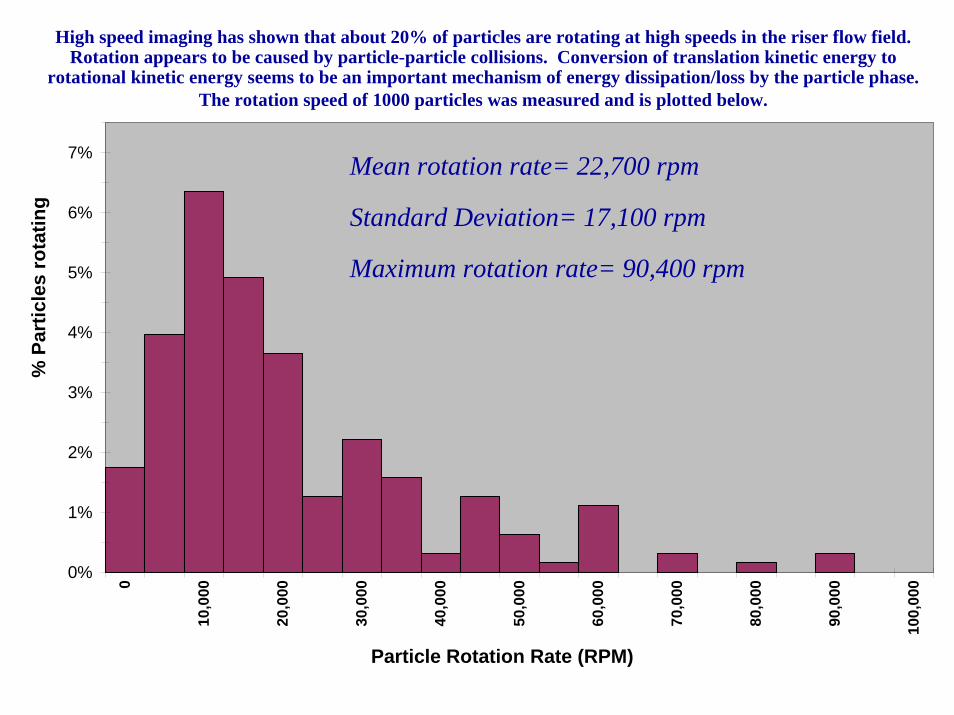
High speed imaging has shown that about 20% of particles are rotating at high speeds in the riser flow field. Rotation appears to be caused by particle-particle collisions. Conversion of translation kinetic energy to
rotational kinetic energy seems to be an important mechanism of energy dissipation/loss by the particle phase. The rotation speed of 1000 particles was measured and is plotted below.
Mean rotation rate= 22,700 rpm
Standard Deviation= 17,100 rpm
Maximum rotation rate= 90,400 rpm
19Multiphase Flow Workshop 4-23-09
Summary• A high speed particle imaging system has been developed and is
being applied at the NETL and PSRI• Image analysis software to automatically recognize and track
particles through thousands of high speed video frames at high particle concentrations has been developed by the NETL. A patent application is in process.
• Future plans include simultaneous measurement of gas velocity with LDV and particle velocity/concentration with high speed particleimaging.
• High speed particle imaging is unique in the ability to interpret measurement data by reviewing high speed videos of the particle motion from which the data were derived.
• High speed particle imaging can accurately measure two directions of the mean and fluctuating components of particle velocity.
• Questions remain regarding analysis of high speed PIV data− How to define region over which to calculate meaningful mean and
fluctuating components of particle velocity with presence of clusters
20Multiphase Flow Workshop 4-23-09
Thank You!
For copies of the high speed videos shown in the conference, contact Frank Shaffer at [email protected] , 412-386-5964
Please specify which high speed video you would like.
Some high speed videos shown in the conference presentation are large (several GBytes) so they may need to be sent through regular mail on DVD’s.