Embed Size (px)
Citation preview
VITAL STATISTICS OF THE UNITED STATES, 1977
VOLUME U-SECTION 5
LijiieTabZes
U.S. DEPARTMENT OFHEALTH, EDUCATION, AND WELFARE
PUBLIC HEALTH SERVICE
NATIONAL CENTER FOR HEALTH STATISTtCS
DHEW Publication No. (PHS) 80-1104
Hyattsville, Maryland: 1980
NATIONAL CENTER FOR HEALTH STATISTICS
DOROTHY P. RICE, Director
ROBERT A. ISRAEL, Depu ty Director
JACOB J. FELDMAN, Ph.D., Associate Director for Ana@s
GAIL F. FISHER, Ph. D., Associate Director for the Cooperative Health Statistics System
ROBERT A. ISI-U4EL, Acting A>sociate Director for Data System
ROBERT M. THORNER, SC.D., Acting Associate Director for International Statistics
ROBERT C. HUBER, Associate Directorforklanagenzent
MONROE G. SIRKEN, Ph.D., Associate Director for Mathematical Statistics
PETER L. HUKLEY, Associate Directorfor Operations
JAMES M. ROBEY, Ph.D., Associate Director for Program Development
PAUL E, LEAVERTON, Ph. D., Associate Director for Research
ALICE HAYWOOD, Information Officer
DIVISION OF VITAL STATISTICS
JOHN E. PATTERSON, Director
ALICE M. HETZEL, Depu ty Director
ROBERT J. ARMSTRONG, M.S., Actuarial Adviser
HARRY M. ROSENBERG, Ph. D., Chiej Mortality Statistics Branch
ROBERT L. HEUSER, M.A., Chiej Natality Statistics Branch
ALICE M. HETZEL, Chiej Marriage and Divorce Statistics Branch
LOREN E. CHANCELLOR, chief Registration Methods Brunch
WILLIAM F. PR4TT, Ph. D., chief Family Growth Survey Branch
MARSHALL C. EVANS, Chiej Data Control Branch
MABEL G. SMITH, Chief Statistical Resources Branch
JOSEPH D. FARRELL, Acting Chiej Programming Branch
--------------------------------------------------------
--------------------------------------------------------
----------------------------------
---------------------------------
----------------------------------------
------------------------------------------
------------------
------------------------
--------------------------------
--------------------------------------------
---------------------------------------
------------------------------------------------------
----------------------------------------------------
------------------------------------------------
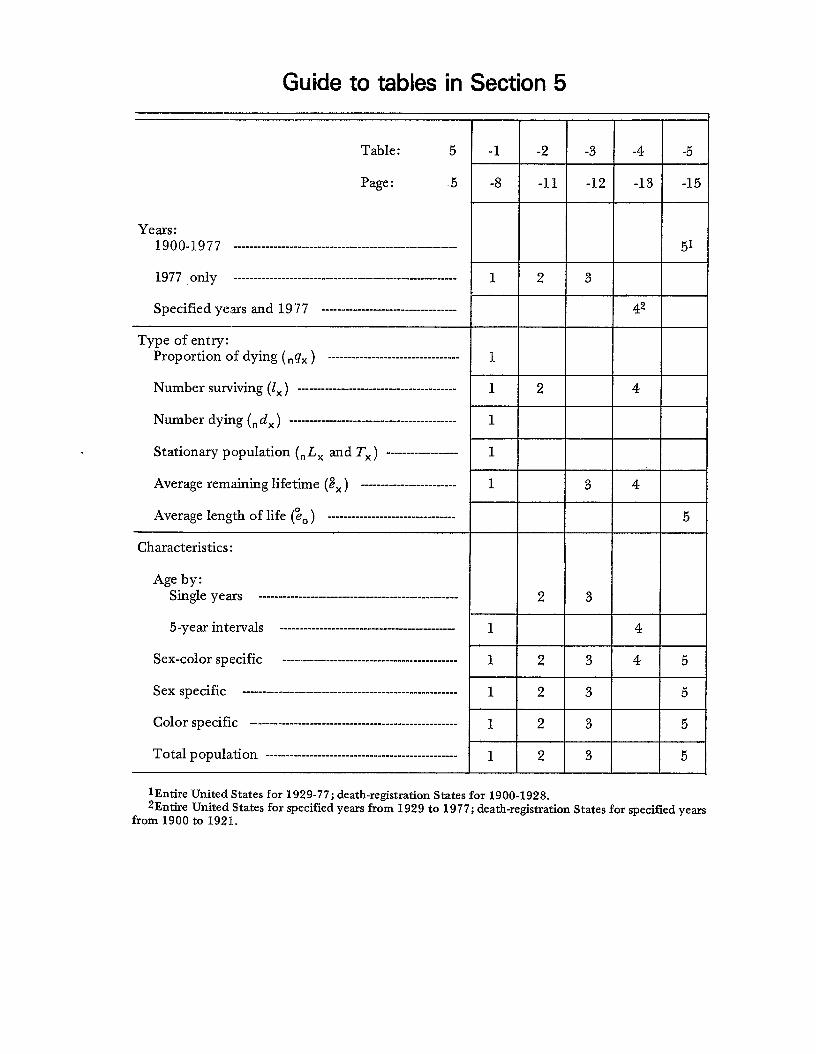
Guide to tables in Section 5
Table 5
Page: .5
Years: 1900-1977
1977 only
Specified years and19’77
Type of entry: Proportion of dying ( .!JX )
Number surviving (lX )
Number dying (n dX )
Stationary population (’nLX and Tx )
Average remaining Iifetime (2X)
Average length of life (20)
Characteristics:
Age by: Single years --------------------------- ...........------------
5-year intervals
Sex-color specific ----.,
Sex specific
Color specific
Total population
-1 -2 -3 -4 -5
-8 -11 -12 -13 -15
51
1 2 3
4?
1 2 4
1
1
1 3 4
5
2 3
1 4
1 2 3 4 5
1 2 3 5
1 2 3 5
1 2 3 5
1Entire T-JnitedStates for 1929-77; death-registration States for 1900-1928. 2Entire IJnited S,tates for specified years from 1929 to 1977; death-registration States for specified years
from 1900 to 1921.
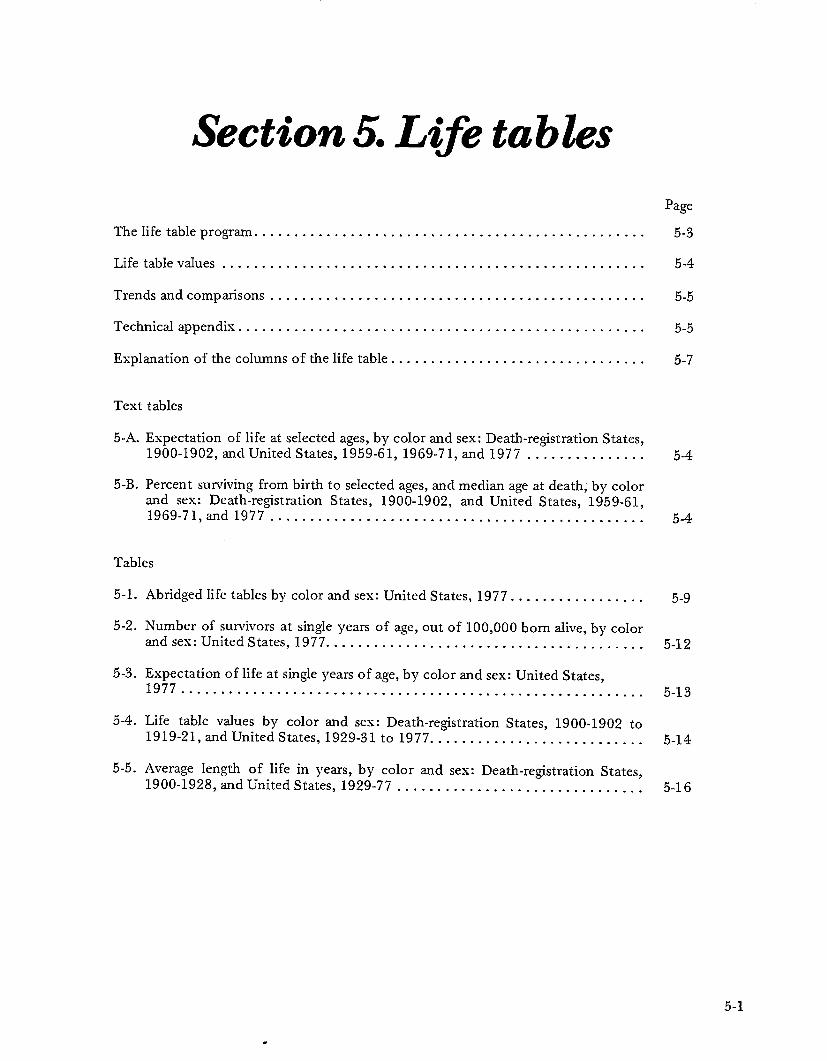
Section 5. Life tablesPage
The Iife table program . . . . . . . . . . . . . . . . . . . . . . . . . . . . . . . . . . . . . . . . . . . . . . . . . 5-3
Life table values . . . . . . . . . . . . . . . . . . . . . . . . . . . . . . . . . . . . . . . . . . . . . . . . . . . . . 5-4
Trends and comparisons . . . . . . . . . . . . . . . . . . . . . . . . . . . . . . . . . . . . . . . . . . . . . . . 5-5
Technical appendix . . . . . . . . . . . . . . . . . . . . . . . . . . . . . . . . . . . . . . . . . . . . . . . . . . . 5-5
Explanation ofthe columnsof thelife table . . . . . . . . . . . . . . . . . . . . . . . . . . . . . . . . 5-7
Text tables
5-A. Expectation of life at selected ages, bycolor and sex: Death-registration States, 1900-1902, and United States, 1959-61, 1969-71, and1977 . . . . . . . . . . . . . . . 5-4
5-B. Percent surviving from birthto selected ages, and median age at death, bycolor and sex: Death-registration States, 1900-1902, and United States, 1959-61, 1969-71, and 1977 . . . . . . . . . . . . . . . . . . . . . . . . . . . . . . . . . . . . . . . . . . . . . . . 5-4
Tables
5-1. Abridged life tabIesbycoIorand sex: United States, 1977 . . . . . . . . . . . . . . . . . 5-9
5-2. Number of survivors at single years of age, out of 100,OOObom alive, bycolor and sex: United States, 1977. . . . . . . . . . . . . . . . . . . . . . . . . . . . . . . . . . . . . . . . 5-12
5-3. Expectation oflifeat single years ofage, by color andsex: United States, 1977 . . . . . . . . . . . . . . . . . . . . . . . . . . . . . . . . . . . . . . . . . . . . . . . . . . . . . . . . . . 5-13
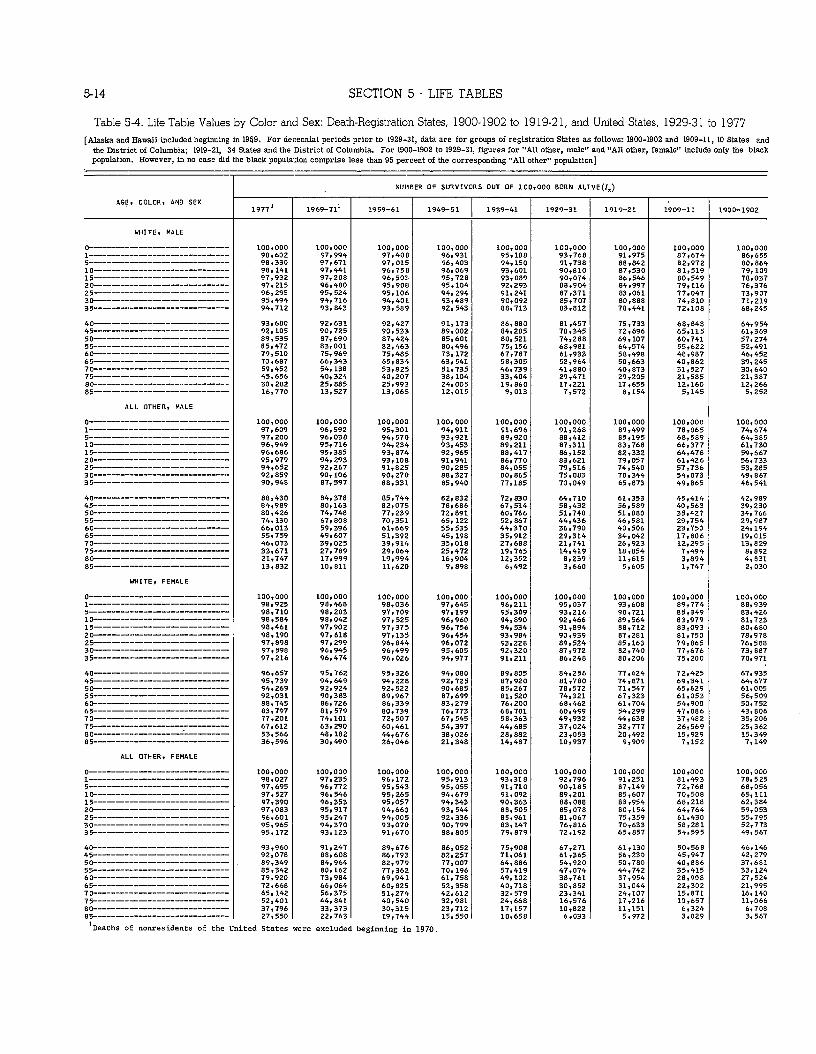
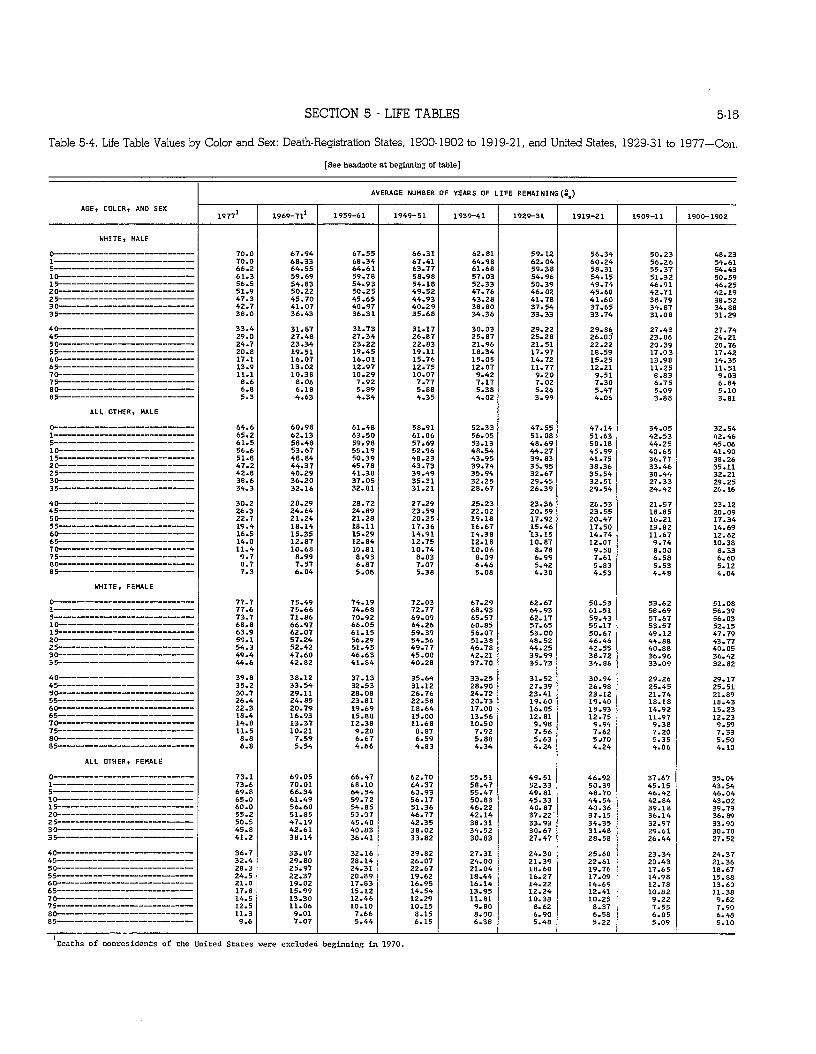
5-4. Life table values by color and sex: Death-registration States, 1900-1902” to 1919-21, and United States, 1929-31 to 1977 . . . . . . . . . . . . . . . . . . . . . . . . . . . 5-14
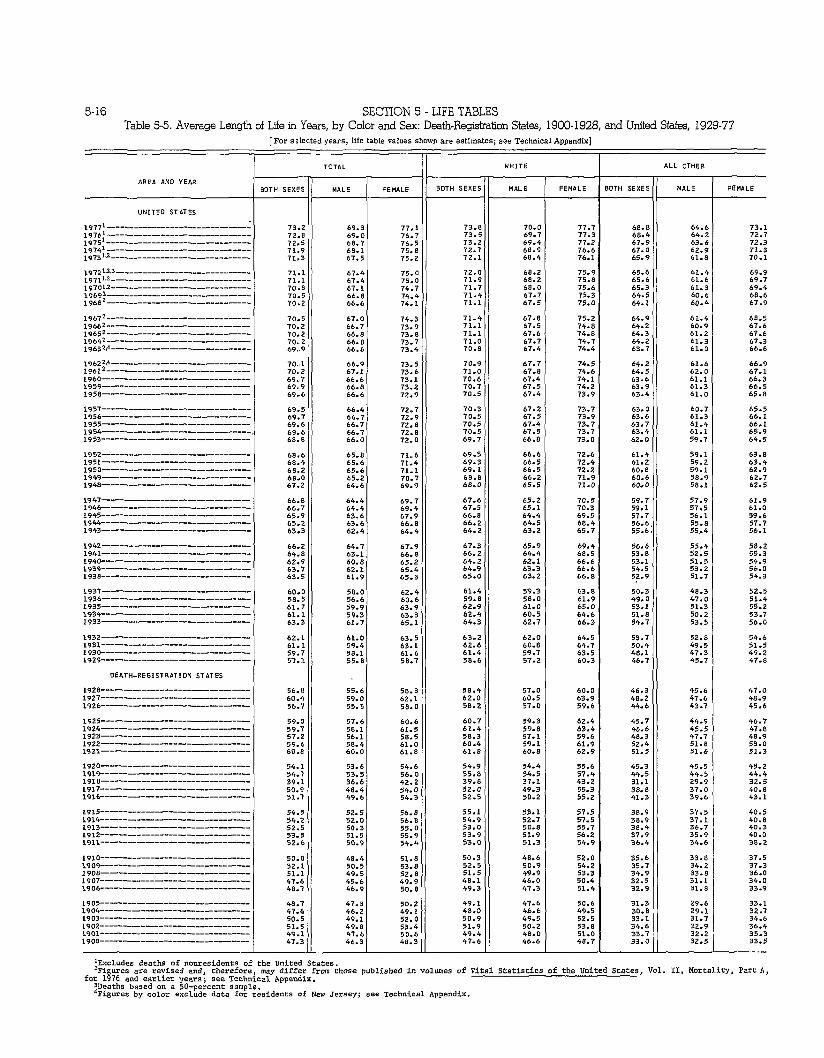
5-5. Average length of Iife in years, by color and sex: Death-registration States, 1900-1928, and United States, 1929-77 . . . . . . . . . . . . . . . . . . . . . . . . . . . . . . . 5-16
5-1
SECTION 5. LIFE TABLES
The mortality rates for a specific period may be summarized by the life table method to obtain measures of comparative longevity. There are two types of life tables–the generation or cohort life table and the current life table. The generation life table provides a “longitudinal” perspective in that it follows the mortality experience of a particular cohort, a.11persons born in the year 1900 for example, from the moment of birth through consecutive ages in successive calendar years. Based on age-specific death rates observed during consecutive calendar years, the generation life table reflects the mortality experience of a cohort from birth until no lives remain in the group.
The better known current life table may, by contrast, be characterized as “cross-sectional.” Unlike the generation life table, the current Iife table does not represent the mortality experience of an actual cohort. Rather, the current life table considers a hypothetical cohort and assumes that it is subject to the age-specific mortality rates observed for an actual population during a particular period. Thus, for ex-ample, a current life table for 1977 assumes a hypothetical cohort subject throughout its lifetime to the age-specific mortality rates prevailing for the actual population in 1977. The current life table may thus be characterized as rendering a “snapshot” of current mortality experience. In this section the term “life table” refers to the current life table only and not to the generation life table.
The life table program
There are three series of life tables prepared in the National Center for Health Statistics–complete, pro-visional abridged, and final abridged life tables. The complete life tables for the U.S. population contain life table values for singIe years of age and are based on decennial census data and deaths for a 3-year period about the census year and have been prepared since 1900. The provisioned abridged life tabIes contain values by age groups and are based on a 10-percent sample of deaths. The final abridged life tables (referred to in this section as “ abridged life tables”) also contain values by age groups but are based on a complete count of all reported deaths.
In response to a growing number of requests for postcensal life table values, a series of abridged Iife tables was initiated in 1945. Available annually since that year, the abridged life tables are based on deaths occurring during the calendar year and on midyear
postcensaI population estimates provided by the U.S. Bureau of the Census. Refinements in both the techniques for estimating population and the methods for constructing abridged Iife tables permit the preparation of abridged life tabIes which provide reasonably accurate data on current trends in expectation of Iife and survivorship. Beginning with 1945 abridged life tables have been constructed by reference to a standard table. * Methodology developed by GreviIIe was used in constructing Iife tables for 1945 to 1952. Since 1953 a modified method has been employed.z U.S. life tables for the decennial period 1969-71 are used as the standard table in constructing the 1977 abridged life tables.
The 1945 abridged life tables were prepared for white and all other males abridged life tables for the been available, and since have been calculated for maIes, regardless of color. tional abridged life tables
and females. Since 1946 totaJ population have also 1948 abridged life tables total ma.Ies and total fe-Starting with 1951 addihave been calculated for
the total white and “al other” population, regardless of sex.
Numerous requests have been received annually for current life table statistics that are more detailed than those available in the abridged life tables. There-fore tables showing 1X and :X values by single years of age interpolated from the abridged life tables have been published since 1960.
The demand for information regakl-hg up-to-date life table values has been responsible for the introduction of a third series, provisional abridged life tables. Starting with 1958 provisional abridged life tables have been published, for the total population only, in the “Annual Summary for the United States,” Monthly Vital Statistics Report. Values in these life tables are based on population estimates provided by the Bureau of the Census and on the estimated number of deaths derived from the “Current Mortality Sample” (CMS). The CMS consists of one-tenth of
lNational Office of Vital Statistics: Method of constructing the abridged life tables for the United States, 1949, by T. N. E. Greville. Vital Statistics-Spe&d Reports, Vol. 33, No. 15. Public Health Service. Washington, D.C., 1953.
2National Center for Health Statistics: Comparison of two methods of constructing abridged Iife tables by reference to a “standard” tabIe, by M. G. Sirken. Vital and Health Statistics. PHS Pub. No. 1000 -$enes 2-No. 4. Public Health Service. Washington. U.S. Government Printing Office, 1966.
5-3
5-4 SECTION 5- LIFE TABLES
the death certificates filed in the vital statistics registration offices (5 O States and the cities of Washing-ton, D. C., and New York). The sample is taken by selecting 1 certificate out of every 10 death certificates received between two dates a month apart.
Life table values
The data used to prepare the abridged U.S. life tables for 1977 are the final mort zility statistics and the midyear estimates of the population by age, color, and sex prepared by the U.S. Bureau of the Census. Selected life table values for 1900-1902, 1959-61, 1969-71, and 1977 are shown in tables 5-A and 5-B.
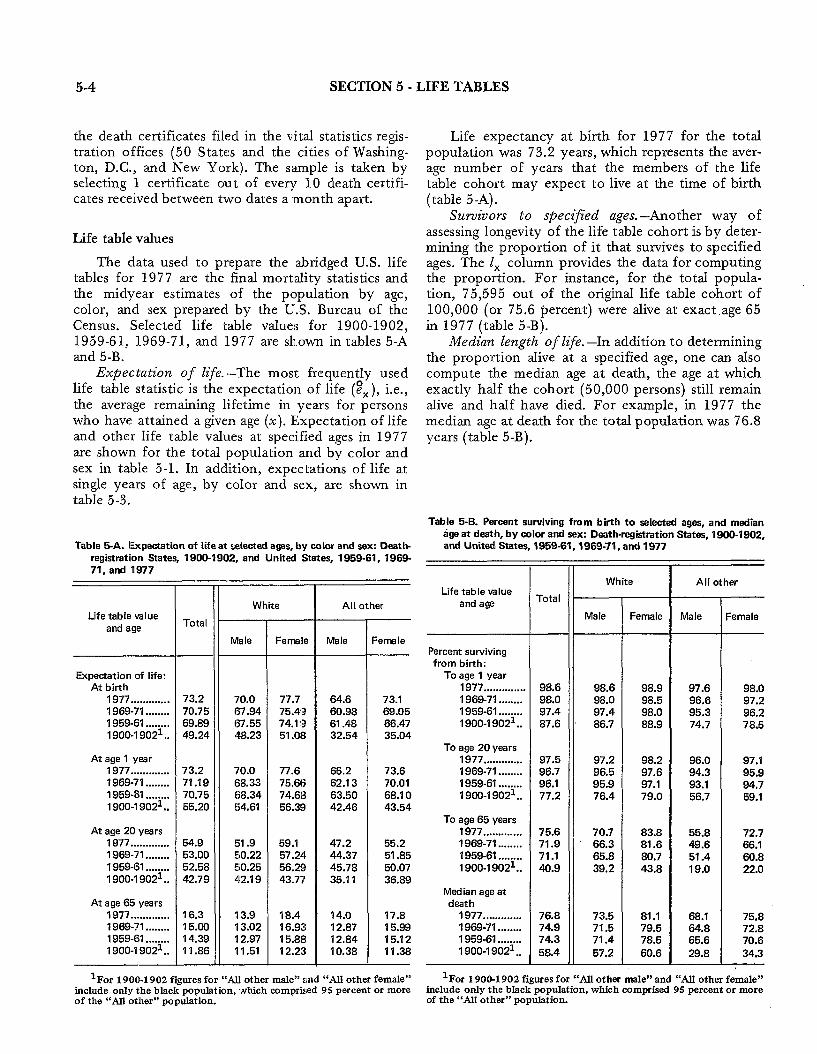
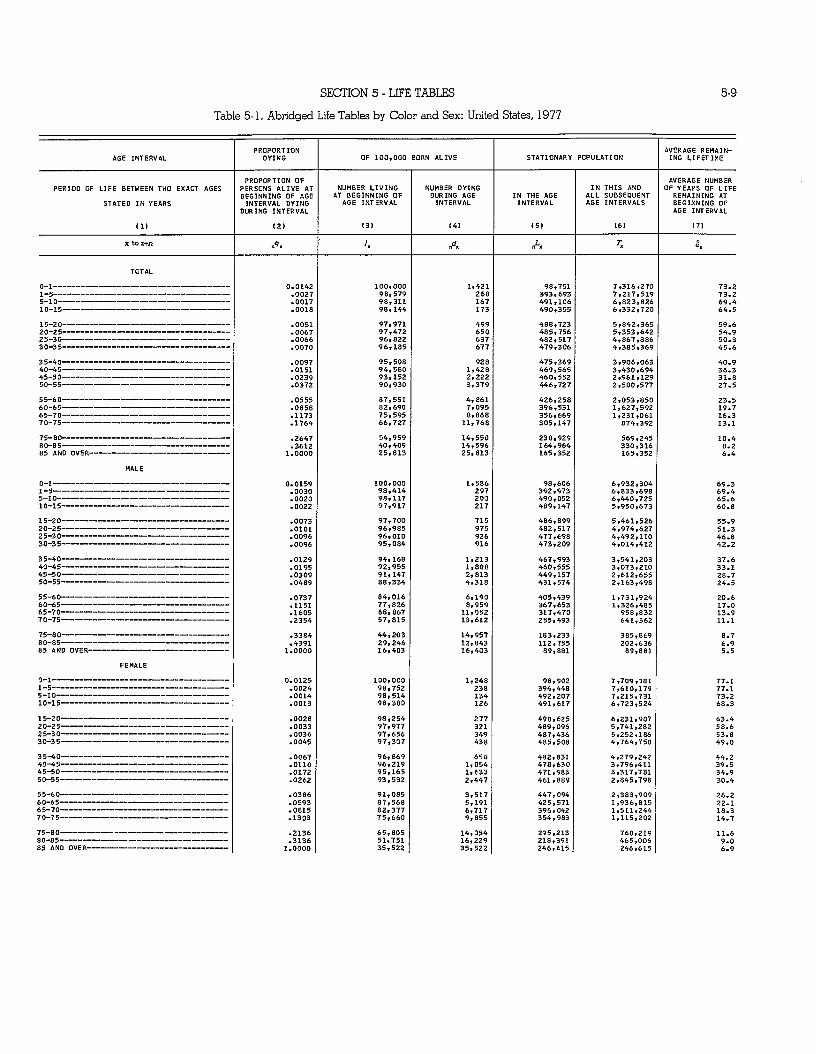
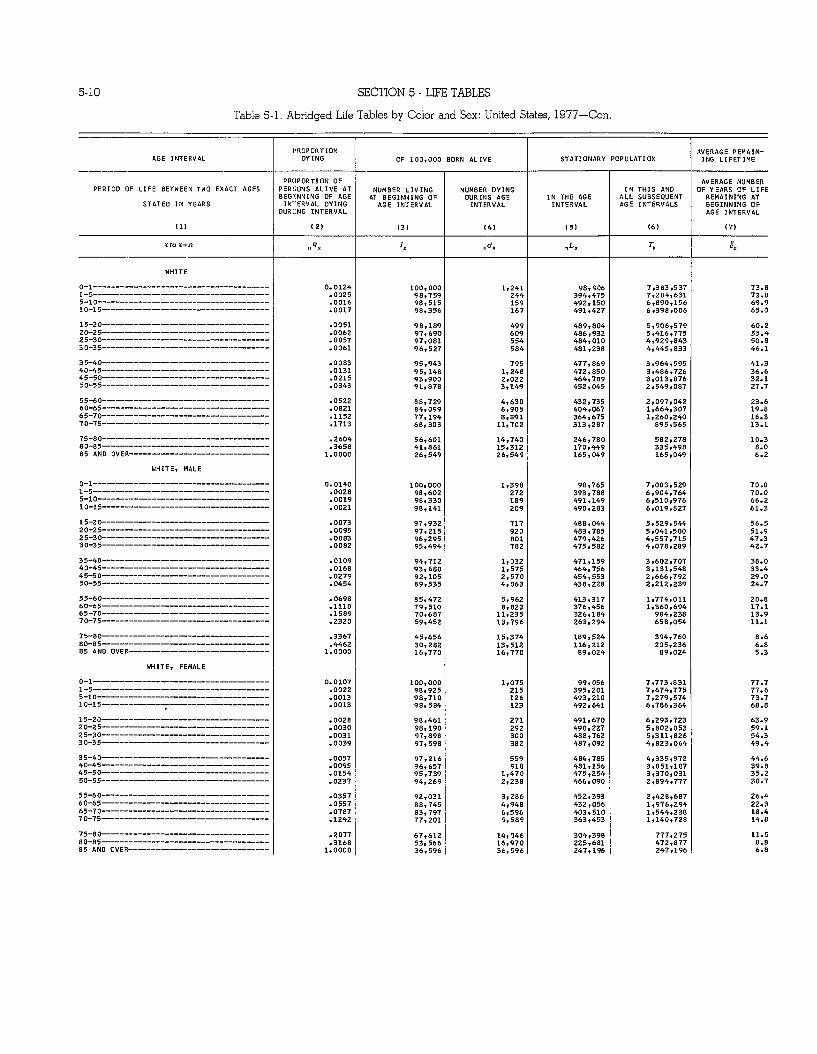
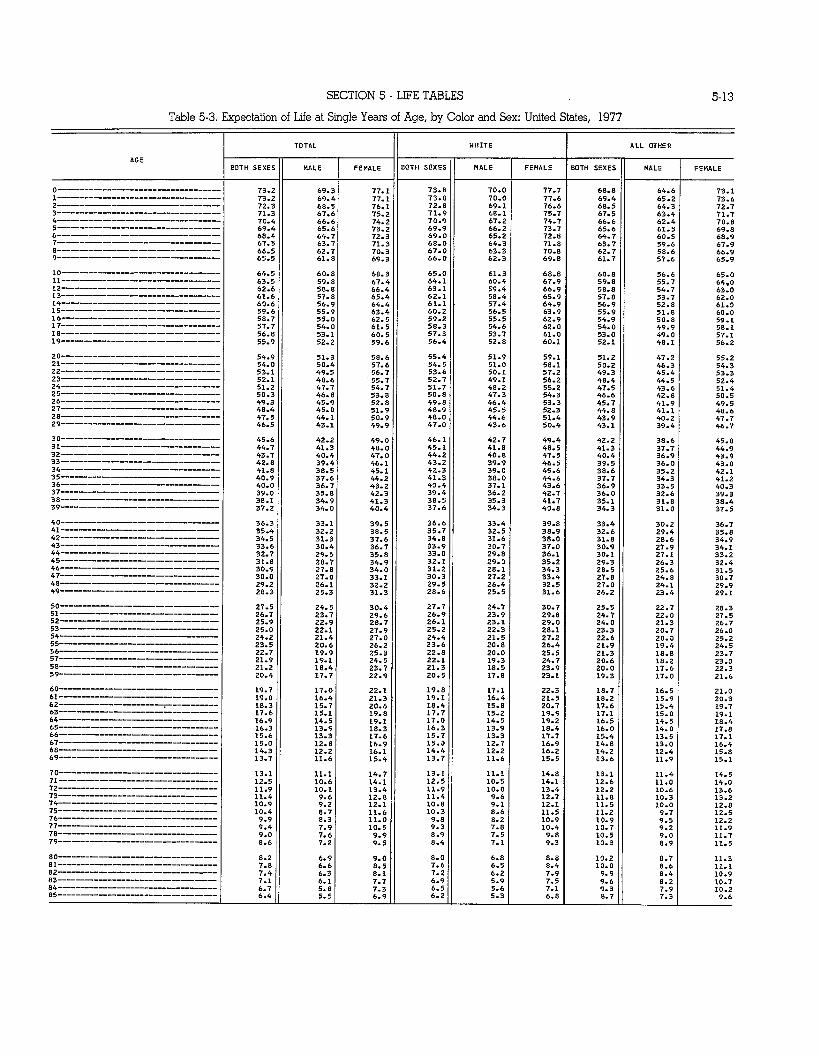
Expectation of life. –The most frequently used life table statistic is the expectation of life (:X), i.e., the average remaining lifetime in years for persons who have attained a given age (x). Expectation of life and other life table values at specified ages in 1977 are shown for the total population and by color and sex in tab~e 5-1. In addition, expectations of life at single years of age, by color and sex, are shown in table 5-3.
Tabla 5-A. Expectation of life at aelectad ages, by color and sex: Daethregistration States. 1900-1902’. and Unitad States, 1959-61, 1969-71_,and 1977
=
Wbite AH other Life table value —— Tota I
and age Ma Ie
Expectation of life: At birth
1977 ............ . 73.2 “70.0 1969-71 ........ 70.75 67.94 1959-61 ....... . 69.89 67.55 1900-19021.. 49.24 48.23
At age 1 year 1977 ............. 73.2 ;I().r) 1969-71 ........ 71.19 68.33 1959-61 ........ 70.75 68.34 1900-19021.. 55.20 54.61
At age 20 years 1977 .. .. ......... 54.9 51.9 1969-71 ........ 53.00 50.22 1959-61 ........ 52.58 50.25 1900-’19021.. 42.79 42.19
At age 65 years 1977 ............. 16.3 13.9 1969-71 ........ 15.00 13.02 1959-61 . ....... 14.39 12.97 1900-19021.. 11.86 11.51
lFor 1900. I 902 fig~es for “M other include only the black-poptdat ion, which of the “AN other” population.
Female MaIe ‘em Ie
77.7 64.6 73.1 75.4!9 60.98 69.05 74.1 !3 61.48 66.47 51.013 32.54 35.04
77.6 65.2 73.6 75.66 62.13 70.01 74.613 63.50 68.10 56.3{1 42,46 43.54
59.1 47.2 55.2 57.24 44.37 51.85 56.29 45.78 50.07 43.77’ 35.11 36.89
18.4 14.0 17.8 16.93 12.87 15.99 15.88 12.84 15.12 12.23 10.38 11.38
—.
male” and “All other female” comprised 95 percent or more
Life expectancy at birth for 1977 for the tots.I population was 73.2 years, which represents the aver-age number of years that the members of the life table cohort may expect to live at the time of birth (table 5-A).
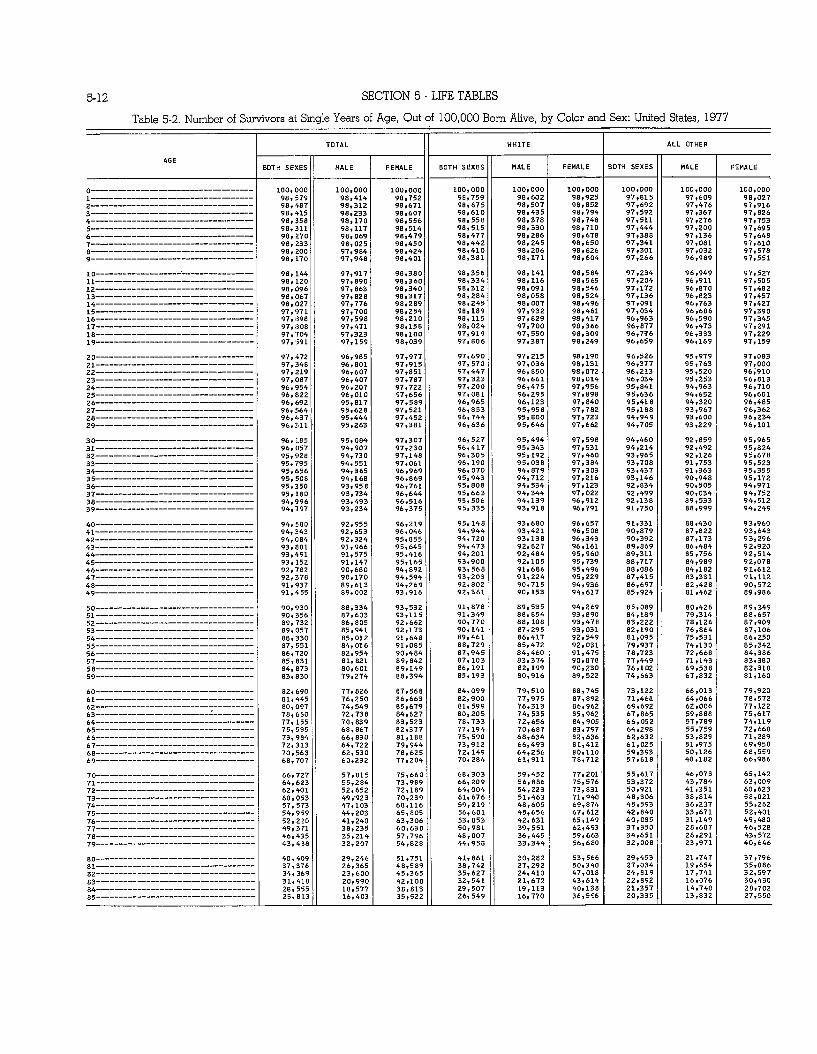
Survivors to specified ages. –Another way of assessing longevity of the life table cohort is by deter-mining the proportion of it that survives to specified ages. The 1X column provides the data for computing the proportion. For instance, for the total population, 75,595 out of the originzd life table cohort of 100,000 (or 75.6 percent) were alive at exact, age 65 in 1977 (table 5-B).
Median length of life. –In addition t o determining the proportion alive at a specified age, one can also compute the median age at death, the age at which exactly half the cohort (50,000 persons) still remain alive and half have died. For example, in 1977 the median age at death for the total population was 76.8 years (table 5-B).
Table 5-B. Percent surviving fro m birth to sa[eeted ages, and median age at death, by color and sex: Death-registration States, 1900-1902, and United States, 1959-61,1969-71, and 1977
White All other Life table value
Totaland age Male Female Male ‘emale
Percent surviving from birth:
To age 1 year 1977 .............. 98.6 98.6 98.9 97.6 98.0 1968-71 ........ 98.0 98.0 98.5 96.6 97.2 1959-61 ........ 97.4 97.4 98.0 95.3 96.2 1900-19021.. 87.6 86.7 88.9 74.7 78.5
To age 20 years 1977 .... ......... 97.5 97.2 98.2 96.0 97.1 1969-71 ........ 96.7 96.5 97.6 94.3 95.9 1959-61 .,...... 96.1 95.9 97.1 93.1 94.7 1900-19021.. 77.2 76.4 79.0 56.7 59.1
To age 65 years 1977 ............. 75.6 70.7 83.8 55.8 72.7 1969-71 ........ 71.9 66.3 81.6 48.6 66.1 1959-61 ........ 71.1 65.8 80.7 51.4 60.8 1900-19021.. 40.9 39.2 43.8 19.0 22.0
Madian aga at death
1977 . ............ 76.8 73.5 81.1 68.1 75.8 1969-71 ........ 74.9 71.5 79.5 64.8 72.8 1959-61 ........ 74.3 71.4 78.5 65.6 70.6 1900-19021.. 58.4 57.2 60.6 29.8 34.3
l~or ~~ool 90Zfigmesfor t~~ other male” and“AUotlwrfemale”
include only the black-population, which comprised 95 percent or more of the “AU other” uormlation.-.
SECTION 5- LIFE TABLES 5-5
Trends and comparisons
In 1977 among the four coIor-sex groups white females had the highest life expectancy at birth (77.7 years), followed by females other than white (73.1 years), white males (70.0 years), and males other than white (64.6 years) (table 5-A). This same rank order was maintained by the coIor-sex groups for the expectation of life at ages 1, 20, and 65 years, except that the expectation of Iife for males other than white at age 65 (14.0 years) was greater than that for white mzdes (13.9 years).
Trends in the expectation of life are shown in tables 5-A, 5-4, and 5-5. TabIe 5-4 shows the expectation of life and the number of cohort survivors at specified ages for the four color-sex groups around the census years since 1900 and for 1977. Table 5-5 shows expectations of life at birth for single calendar years since 1900. h4any of the figures shown in this table were estimated (see Technical Appendix).
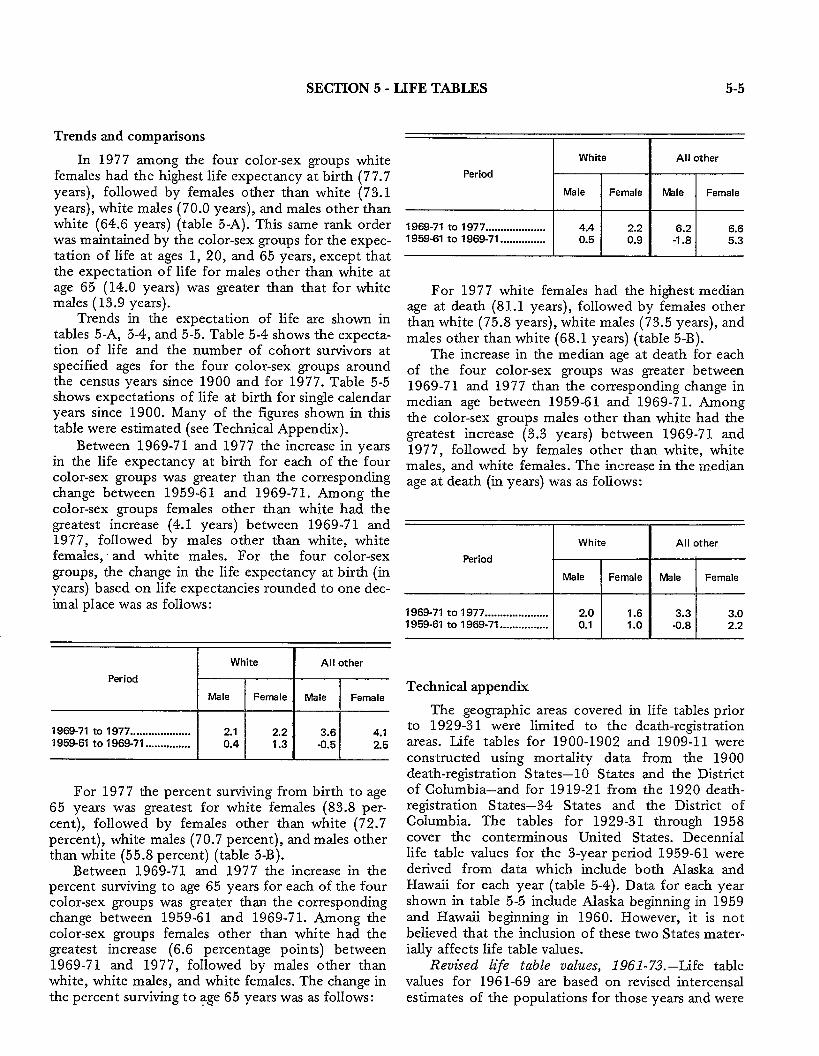
Between 1969-71 and 1977 the increase in years in the life expectancy at birth for each of the four coIor-sex groups was greater than the corresponding change between 1959-61 and 1969-71. Among the color-sex groups females other than white had the greatest increase (4. 1 years) between 1969-71 and 1977, foIlowed by males other than white, white females, ~and white males. For the four color-sex groups, the change in the life expectancy at birth (in years) based on life expectancies rounded to one decimal place was as follows:
White Ail other
Period
Male Female Male Female
1969-71 to 1977 .. . . .. .. .. . .... .. . .. 2.1 2.2 3.6 4.1 1959-61 to 1969-71 ... .. .. ... . .. . . 0.4 1.3 -0.5 2.5
For 1977 the percent surviving from birth to age 65 years was greatest for white females (83.8 per-cent), followed by females other than white (72.7 percent), white maIes (70.7 percent), and males other than white (55.8 percent) (table 5-B).
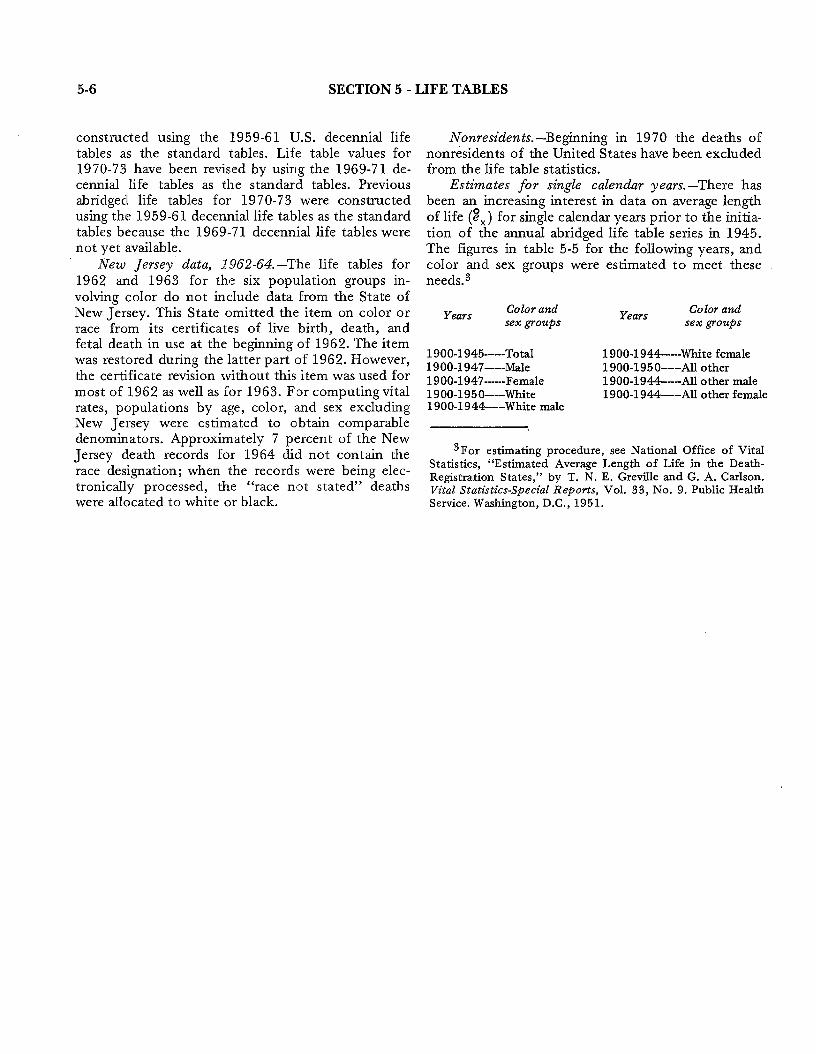
Between 1969-71 and 1977 the increase in the percent surviving to age 65 years for each of the four color-sex groups was greater than the corresponding change between 1959-61 and 1969-71. Among the color-sex groups females other than white had the greatest increase (6.6 percentage points) between 1969-71 and 1977, followed by males other than white, white males, and white femzdes. The change in the percent surviving to age 65 years was as follows:
White All other
Period
Male Famale Male Female
1969-71 to 1977 . . .. .. .. .. ... .. ... . . 4.4 2.2 I 6.2 6.6 1959-61 to 1969-71 . . .. .. .. .. ... . . 0.5 0.9 -1.8 5.3
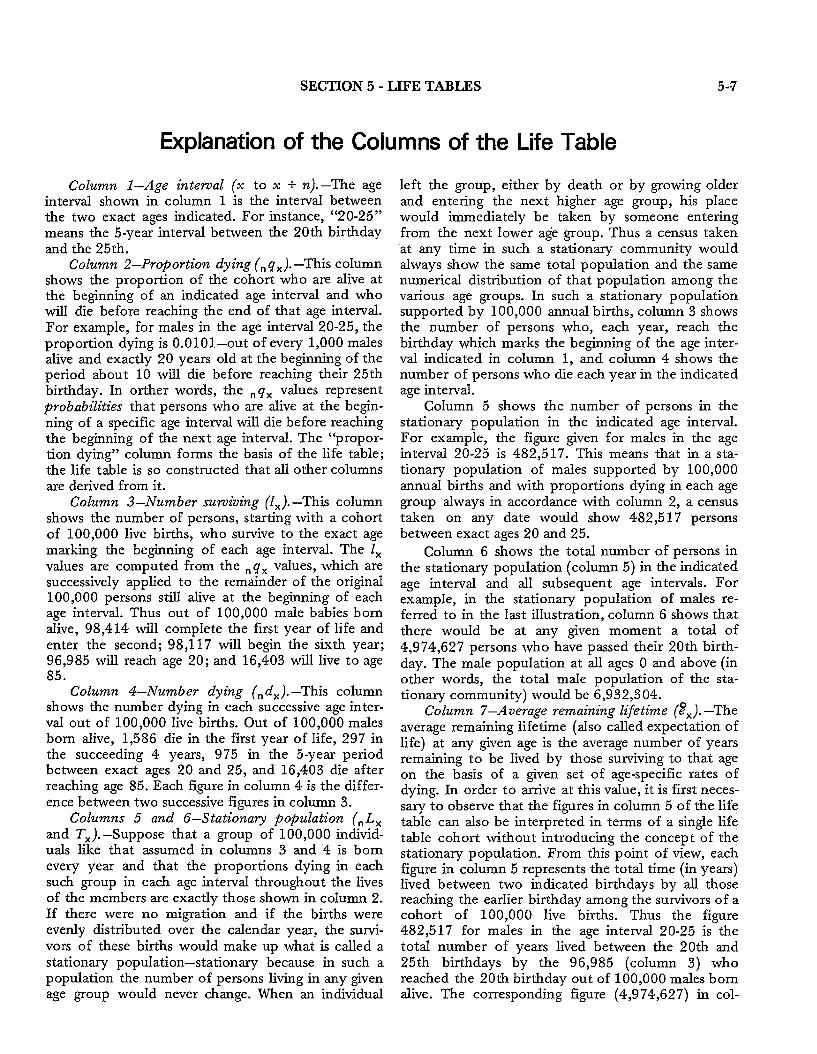
For 1977 white females had the highest median age at death (81.1 years), folIowed by females other than white (75.8 years), white mzdes (73.5 years), and males other than white (68.1 years) (tabIe 5-B).
The increase in the median age at death for each of the four color-sex groups was greater between 1969-71 and 1977 than the corresponding change in median age between 1959-61 and 1969-71. Among the coIor-sex groups males other than white had the greatest increase (3.3 years) between 1969-71 and 1977, foJ.Iowed by females other than white, white males, and white females. The increase in the ii].edi~ age at death (in years) was as follows:
1 I
W bite All other
Period I I
I Male I Female I Male I Female I
I I I
1969-71 to 1977 . . .. ... . ... .. . .... ... 2.0 1.6 3.3 3.0 1959-61 to 1969-71 . . . ... . .. .... . .. 0.1 1.0 -0.8 2.2
I
Technical appendix
The geographic areas covered in life tabIes prior to 1929-31 were Iimited to the death-registration areas. Life tables for 1900-1902 and 1909-11 were constructed using mortzdity data from the 1900 death-registration States–1 O States and the District of Columbia—and for 1919-21 from the 1920 death-registration States—34 States and the District of Columbia. The tables for 1929-31 through 1958 cover the conterminous United States. Decennial life table values for the 3-year period 1959-61 were derived from data which include both AIaska and Hawaii for each year (table 5-4). Data for each year shown in table 5-5 include Alaska beginning in 1959 and Hawaii beginning in 1960. However, it is not believed that the inclusion of these two States materially affects life table values.
Revised life table values, 1961-73. –Life table values for 1961-69 are based on revised intercensal estimates of the populations for those years and were
5-6 SECTION 5- LIFE TABLES
constructed using the 1959-61 IJ.S. decennial life tables as the standard tables. Life table values for 1970-73 have been revised by using the 1969-71 decennial life tables as the standard tables. Previous abridged life tables for 1970-73 were constructed using the 1959-61 decennial life tables as the standard tables because the 1969-71 decennial life tables were not yet available.
New Jersey data, 1962-64. –The life tables for 1962 and 1963 for the six population groups involving color do not include data from the State of New Jersey. This State omitted the item on color or race from its certificates of live birth, death, and fetal death in use at the beginning of 1962. The item was restored during the latter part (of 1962. However, the certificate revision without this item was used for most of 1962 as well as for 1963. For computing vital rates, populations by age, color, and sex excluding New Jersey were estimated to obtain comparable denominators. Approximately 7 percent of the New Jersey death records for 1964 did not contain the race designation; when the records were being electronically processed, the “race not stated” deaths were allocated to white or black.
Nonresidents. –Beginning in 1970 the deaths of nonresidents of the United States have been excluded from the life table statistics.
Estimates for single calendar years. –There has been an increasing interest in data on average length of life (~X) for single calendar years prior to the initiation of the annual abridged life table series in 1945. The figures in table 5-5 for the following years, and color and sex groups were estimated to meet these needs. s
Color and Color andYears Years sex groups sex gYoups
1900-1 945------Total 1900-1 944---White female 1900-1 947-----Male 1900-1950-----AI1 other 1900-1947-----Female 1900-1944----AII other male 1900-1 950--—White 1900-1 944---All other female 1900-1 944----White male
3 For estimating procedure, see National Office of Vital Statistics, “Estimated Average Length of Life in the Death-Registration States,” by T. N. E. Greville and G. A. Carlson. Vital Statistics-Special Reports, Vol. 33, No. 9. Public Health Service. Washington, D. C., 1951.
SECTION 5- LIFE TABLES 5-7
Explanation of the Columns of the Life Table
Column l–Age interval (x to x + n). –The age interval shown in column 1 is the interval between the two exact ages indicated. For instance, “20-25” means the 5-year interval between the 20th birthday and the 25th.
Column Z–Proportion dying (n qx). –This column shows the proportion of the cohort who are alive at the beginning of an indicated age interval and who will die before reaching the end of that age interval. For example, for maIes in the age interval 20-25, the proportion dying is 0.01 01–out of every 1,000 males alive and exactly 20 years old at the beginning of the period about 10 will die before reaching their 25th birthday. In orther words, the . qx values represent probabilities that persons who are alive at the beginning of a specific age interval will die before reaching the beginning of the next age interval. The “proportion dying” column forms the basis of the life table; the life table is so constructed that all other columns are derived from it.
Column 3–iVumber surviving (lX). –This column shows the number of persons, starting with a cohort of 100,000 live births, who survive to the exact age marking the beginning of each age interval. The lx values are computed from the “ qX values, which are successively applied to the remainder of the original 100,000 persons still alive at the beginning of each age interval. Thus out of 100,000 male babies born zdive, 98,414 will complete the first year of life and enter the second; 98,117 will begin the sixth year; 96,985 will reach age 20; and 16,403 wiI1 live to age 85.
Column 4–iVumber dying (n dX). –This column shows the number dying in each successive age interval out of 100,000 live births. Out of 100,000 males born alive, 1,586 die in the first year of life, 297 in the succeeding 4 yezus, 975 in the 5-year period between exact ages 20 and 25, and 16,403 die after reaching age 85. Each figure in column 4 is the difference between two successive figures in column 3.
Columns 5 and 6–Stationary population (nLX and 7’X,).-Suppose that a group of 100,000 individuals like that assumed in columns 3 and 4 is born every year and that the proportions dying in each such group in each age interval throughout the lives of the members are exactly those shown in column 2. If there were no migration and if the births were evenly distributed over the calendar year, the survivors of these births would make up what is called a stationary population—stationary because in such a population the number of persons living in any given age group would never change. When an individual
left the group, either by death or by growing older and entering the next higher age group, his place would immediately be taken by someone entering from the next lower age group. Thus a census taken ‘at any time in such a stationary community would always show the same total population and the same numerical distribution of that population among the various age groups. In such a stationary population supported by 100,000 annual births, column 3 shows the number of persons who, each year, reach the birthday which marks the beginning of the age interval indicated in column 1, and column 4 shows the number of persons who die each year in the indicated age interval.
Column 5 shows the number of persons in the stationary population in the indicated age interval. For example, the fi,gure given for males in the age interval 20-25 is 482-,517 .- This means that in a st;tionary population of males supported by 100,000 annual births and with proportions dying in each age group always in accordance with column 2, a census taken on any date would show 482,517 persons between exact ages 20 and 25.
Column 6 shows the total number of persons in the stationary population (column 5) in the indicated age interval and all subsequent age intervals. For example, in the stationary population of males referred to in the Iast ihstration, column 6 shows that there would be at any given moment a total of 4,974,627 persons who have passed their 20th birth-day. The male population at all ages O and above (in other words, the total male population of the stationary community) would be 6,932,304.
Column 7–Average remaining lifetime ($x). –The average remaining lifetime (also called expectation of life) at any given age is the average number of years remaining to be lived by those surviving to that age on the basis of a given set of age-specific rates of dying. In order to arrive at this vahe, it is first necessary to observe that the figures in column 5 of the life table can also be interpreted in terms of a single Iife table cohort without introducing the concept of the stationary population. From this point of view, each figure in column 5 represents the total time (in years) lived between two indicated birthdays by all those reaching the earlier birthday among the survivors of a cohort of 100,000 live births. Thus the figure 482,517 for males in the age interval 20-25 is the total number of years lived between the 20th and 25th birthdays by the 96,985 (column 3) who reached the 20th birthday out of 100,000 males born alive. The corresponding figure (4,974,627) in col-
5-8 SECTION 5- LIFE TABLES
umn 6 is the total number of years lived after attaining age 20 by the 96,985 reaching that age. This number of years divided by the number of persons (4,974,627 divided by 96,985) gives 51.3 years as the average remaining lifetime of males at age 20.
Care must be exercised in drawing conclusions from the figures in column 7. Thus in observing that the average remaining lifetime of white persons is greater than for those in the all other category, one should not conclude that the oldest ages reached by
white persons necessarily exceed those attained by the most long-lived of the zdl other group. The difference in the average length of life results from the fact that a greater proportion of all other persons die be-fore reaching old age. For example, the number surviving to age 65 out of 100,000 born alive is far greater among white persons than among all other persons; yet the average length of life remaining at age 65 is nearly the same for both groups.
--------
------
----------
SECTION 5- LIFE TABLES 5-9
Table 5-1. Abridged Life Tables by Color and Sex: United States, 1977
PROPORTION 4VERAGE REMAIN-AGE INTERVAL OYING OF 100,000 BORN ALIVE STATIONARY POPULATION ING LIFETIME
AvERAGE NUMBER
PERIOO OF LIFE BETMEEN TWO EXACT AGES NUMBER LIVING NUHBER OYING IN THIS ANO IF YEARS OF LIFE AT BEGINNING OF OURING AGE IN THE AGE ALL SUBSEQUENT REMAINING AT
STATEO IN YEARS AGE INTERVAL INTERVAL INTERVAL AGE INTERVALS BEGINNING OF AGE INTERVAL
(1) (2) (31 141 (5) [6) [71
9 lx d Lx to x+n “X . . “x
TOTAL
o-1--—--- —-—--—--—--—-—-------—-- 0.014; 100, Ooc 1,421 98,751 7,316,270 T3.2 1 -5———---——-——--—-— -———-- .002’ 98,575 268 393,693 7,217,519 73.2 5-lo-—--—--—--—--—----—-——-—-- .001” 98,311 16T 491,106 6,823,826 69.4 10-L 5—---—-——-——-—---——-—-- .001( 98,144 173 490,355 6,332,720 64.5
15-20 ---------—-———-——-——-—-- .005: 97,971 499 488,723 5,842,365 59.6 20-2 5—-----——-—-----—--—-—---—-- .006’ 97,4T2 650 4S5, 756 5,353,642 54.9 25-30 —-———-————-———---—-- .006( 96,822 637 482,517 4,867,886 50.3 30-35 ——-——--—-—————-—---—-- . 007( 96,185 677 479,306 4,385,369 45.6
35-4 o---——-—---—----——— -—---—-- .00% 95,50e 928 475,369 3,906,063 40.9 4045 -——--—--———--————---—-- .0151 94,58C 1,428 469,565 3,430,694 36.3 45-5 0-——————-—--——----—---—-- . 023~ 93,152 2,222 460,552 2,961,129 31.8
.037: 90,93C 3,379 446,727 2,500,5TT 27.5
.055: 87,551 4* 861 426,25e 2,053,850 23.5 -. .0851 82,690 7,095 396,531 1,627,592 19.7 65-7 O-—-—-————-—-————- —-- .llm T5,595 8,e.68 356,669 1,231,061 16.3 T O-T5---————-—-————-——-—-- .lT6~ 66,727 13.,768 305,147 874,392 13.1
75- co---——-——-——-—-—-—-——-—-- .26< 54,95q 14,550 23e,929 569,245 10.4 8 o-e 5--——-—--—--———----——-—--- .3612 40,409 14,596 164,964 330,316 8.2 85 ANO OVER--—-—————— ——-—- 1.000[ 25,813 25. e13 165,352 165,352 6.4
MALE
0-1--—---—-—-—- ———-——-—-—-- 0.015$ 100,000 l,5e6 98,606 6,932,304 69.3 1-5--—---—--—---—————-——-- .003C 9e,414 297 392,973 6,833,698 69.4
—--- ———— —---— —--5-lo——-- .002< 9e,l17 200 490,052 6,440,T25 65.6 .0022 97,917 217 4e9, 147 5,950,673 60. e
.007? 97,700 715 486,899 5,461,526 55.9 20-2 5-—-—-—-——————-———-—- .0101 96,9e5 975 4e2,517 4,974,627 51.3 25-3 o-—--—--—--—————--—-- .0096 96,010 926 4T7 ,698 4,492,110 46. e 30-35 -—--———----———-— ——-—-- .009( 95,084 916 473,209 4,014,412 42.2
35-40 -----——--—-—-—-—--—---—-- .012$ 94, 16e 1,213 467,993 3,541,203 37.6 40-45 ———-—--———--—-—-——-—--- .019! 92,955 l,eoe 460,555 3,073,210 33.1 .46 An —---—-—— ————— —--—-- .030< 91,147 2,e13 449,157 2,612,655 2e.7
. 04es 88,334 4,31e 431,574 2,163,49e 24.5
55-6 O———-——————---— —------ .0737 e4,016 6,190 405,439 1,731,924 20.6 6 O-A 5 ---——--—-—--——-———--—- .1151 T7,826 e,959 367,653 l,326,4e5 17.0
i&;~-— ——_-——--—-———-.1605 .2354
6e, 867 57, e15
11,052 13,612
31 T,470 255,493
95e,e32 641,362
13.9 11.1
T5-8 O—-——-—--——--—--———-—-- .3384 44,203 14,957 183,233 3e5, e69 e.7 R 0-R5---——-———————-— ——-—-- .4391 29,246 12,843 112,755 202,636 6.9 8; i NO OVE R-—————--——-—---—-- I.000c 16,403 16,403 e9, eel e9, eel 5.5
FEHALE
O-l--—---—-——— ————---——-—-- 0.0125 100,000 l,24e 9e,902 7,709,981 77.1 —-—---—-l-5----------—-——— .0024 9e,752 23e 394,448 T,61O,179 77.1
5-10 —----—-——--———----—---— .0019 9e,514 134 492,207 T,215,731 73.2 10-1 5--------——-——--——-——----—--- .0013 9e,380 126 491,6L7 6,723,524 68.3
15-2 O—-———-—-—----—-—--—-- .Ooze 9e,254 2T7 490, t25 6,231,907 63.4 20-25 -—-—---—-----—----—-—----—-- .0033 97,977 321 489,096 5,7kl,2e2 58.6 .25-3 o-—--—-— -----—————____ .0036 97,656 349 4e7,436 5,252,1e6 53. e 30-35 -—--————-———-——----— .0045 97,307 43e 4a5,50e 4,764, T50 49.0
35+0 —---——-——-————-—----—-- .0067 96, e69 650 482,831 4,279,242 44.2 40-45 ----—---——-———— —-—---—--- .0110 96,219 1,054 47e,630 3, T96,411 39.5 45-50 —-----—-————-——---—-- .0172 95,165 1,633 4T1 ,9e3 3,317,781 34.9 50-55 -----—-—-—-———----—— .0262 93,532 2,447 461, ee9 2*845,79e 30.4
55-6 O——---—-----—--—------------—-- .0386 91,085 3,517 447, o% 2,3e3,909 26.2 60-6 5-----———-————-—-------—-- .0593 87,568 5,191 425,571 1,936,815 22.1 6 5-70 —-——---—---———--— —----—-- .oe15 82,377 6,717 396,042 1,511,244 le.3 T O-7 5--—--—------—--—---—-—---—--- .1303 75,660 9,e55 354,983 1,115,202 14.7
75-8 O-—-------— -— —--—— —--—--—----- .2136 65, eo5 14,954 295,213 760,219 11.6 80-8 5- —-- ———-——--——-—-—---— .3136 51,751 16,229 21e,391 465,006 9.0 e5 A NO OVER--——-----—--——-——-—— 1.0000 35,522 35,522 246,615 246,615 6.9
--------
--------------
---------
------- --------------------------------
---------
--------
--------
------
------
---------------
-----------
------------------
5-1o SECTION 5- LIFE TABLES
Table 5-1. Abridged Life Tables by Color and Sex: United States, 1977–Con.
—
AGE INTERVAL
PERIOD OF LIFE SETWEEN TWO EXACT AGES
STATED IN YEARS
{1)
x63 .+*
WHITE
o-1--—-----—--------—-—------—--—--1 -5--—------------— —--—----—5-lo-—--—--—--—--—--------—----—--10-1 5—------------- —-—------ ——------
L 5-2 O—------—-----------— —-----——--20-2 5—-------------—------------—------25-30 --------—----- —----— 30-35 —---——-—--——-------—-----—--
3 5-40 —------—-----—-—------—----—--40-45 —------—-----------—-—— 45-50 —--- —-————------—--—----—--50-55 —------—-----—-------——----—--
55-60 —---—— 60-65 ----—--—---- ——--—-— 65-70 -----—-—-----—--—------------—--70-75 --------—---——----—-——-----—--
75-8 O----------------- —-----------------80-85 —-----------——-——----—-—-—--85 AND OVE R--—-—--—----—---—
WHITE, MALE
o-1----------——--—----—-—-—-——---1 -5---------—----—------—--—----—--5-lo-—------—--—-----------------——--I 0-15 —------------------------—---------
15-2 O—------—-------——---—------—---20-25 --------—-------——— —--— 25-30 -—-----—----- —--——-—-—---—---30-35 —----- —-—---------—--—---—---
35-40 —-------------—--—--—--—----—--40-45 —-----—-----— -—-—----—+5-5 &—-—----—------—--——-—— _______50-55 ---------------------------—----—--
55-60 —-------------—----—-—---—--—--60-6 5——-—--------—----——-—---——--65-T O-—----—-—---— -—- —----——--—--70-75 --------------————------—--—---
75-80---------—--———--—-—-—--—--80-85 ——---—---—---—-------—— 85 ANO OVER---------------—-—-—----—--
WHITE, FEMALE
o-l-------——-—-——--——----—---—---1-5---—------—-— —--——------—5-1 0---------—---— ——-—-—--—---—--10-1 5—------—---—----— -—-—--- —---
15-20 -------------—--—-----—--—--—---20-2 5-------------———--— —-—---—---
30-3 5------------—---—-—- —------—---
35-40 -—--—------—--——---—-— 40-45 —----- —----— —------—---45-5 o-----— —---—-—--——---------—---50-55 --------—---—--—--—-—
55-6 O-—----------—--——---—------—--60-6 5-—----------— —--------------------65-70 -----—-------- ——--------------—--70-75 —---—--------——
75-80-----—-----—--—-------------—---8 o-a 5---—---------------------------—---85 A NO OVER--—---—--—--— -—----------
PROPORTION OYING OF 100,000 BORN ALIVE STATIONARY POPULATION
PROPORTION OF JERSONS ALIVE AT NUMBER LIVING IN THIS ANO 3EGY.NNING OF AGE AT BEGINNING OF ALL SUBSEQUENT
1N7’ERVAL OYING AGE INTERVAL AGE INTERVALS IUR XNG INTERvAL
[2) (31 (6)
.Xd IL “x Tx
lVERAGE REMAINING LIFETIME
AvERAGE NUMBER IF YEARS OF LIFE
REMAINING AT BEGINNING OF AGE INTERVAL
(7)
o e,
0.0124 100,000 1,241 98,906 7,383,537 73.8 .0025 98,759 244 394,475 7,284,631 73.8 .0016 98,515 159 492,150 6,890,156 69.9 .0017 98,356 167 491,427 6,398,006 65.9
.0051 98,189 499 489,804 5,906,579 60.2
.0062 97,690 609 4B6 ,932 5,416,775 55.4
.0057 97,081 554 484,010 4,929,843 50.8
.0061 96,527 584 481,238 4,445,833 46.1
.00s3 95,943 795 477,869 3,964,595 41.3
.0131 95, 148 1,248 472,850 3,486,726 36.6
.0215 93,903 2,022 464,789 3,013,876 32.1
.0343 91,878 3,149 452,045 2,549,087 27.7
.0522 88,72’9 4,630 +32,735 2,097,042 23.6 .0821 84,099 6,905 404,067 1,664,307 19.8 .1152 77,194 8,891 364,675 1,260,240 16.3 .1713 68,303 11,702 313,287 S95 ,565 13.1
.2604 56,601 14,740 246,780 582,27B 10.3
.3658 41,861 15,312 170,449 335,498 8.0 1.0000 26,549 26,549 165,049 165,049 6.2
0.0140 100,000 1,398 98,765 7,003,529 70.0 .0028 98,602 272 393,78B 6,904,764 70.0 .0019 98,330 189 491,149 6,510,976 66.2 .0021 98,141 209 490,283 6,019,827 61.3
.0073 97,932 717 488,044 5,529,544 56.5
.0095 97,215 920 483,785 5,041,500 51.9
.0083 96,295 801 479,426 4,557,715 47.3
.0082 95,494 782 475,502 4,078,289 42. T
.0109 94,712 1,232 471,159 3,602,707 38.0 .0168 93,680 1,575 464,756 3,131,548 33.4 .0279 92,105 2,570 454,553 2,666,792 29.0 .0454 89,535 +, 063 438,228 2,212,239 24.7
.0698 85,472 5,962 .413,317 1,774,011 20.8
.1110 79,510 8,823 376,456 1,360,694 17.1
.1589 70,601 11,235 326,164 984,238 13.9
.2320 59,452 13,796 263,294 658,o54 11.1
.3367 45,656 15,374 189,524 394,760 8.6
.4462 30,282 13,512 116,212 205,236 6.8 1.0000 16,770 16,770 89,024 89,024 5.3
0.0107 100,000 1,075 99,056 7,773,831 77.7 .0022 98,925 215 395,201 7,674,775 77.6 .0013 98,710 126 493,210 7,279,574 73.7 .0013 98,584 123 492, 64i 6,786,364 68.8
.0028 98,461 271 491,670 6,293,723 63.9
.0030 98,190 292 490,227 5,802,053 59.1
.0031 97,898 300 488,762 5,311,826 54.3
.0039 97,598 382 487,092 4,823,064 49.4
.0057 97,216 539 484,785 4,335,972 44.6
.0095 96,651 918 481,156 3,851,187 39.8
.0154 95,739 1,470 475,254 3,370,031 35.2
.0237 94,269 2,238 +66 ,090 2,894,777 30.7
.0357 92,031 3,286 452,393 2,428,687 26.4
.0557 88,745 4,94a 432, o56 1,976,294 22.3
.0787 83,7’97 6,596 403,51C I,544,23B 18.4
.1242 77,201 9,589 363,453 1,140,728 14.8
.2077 67,612 14,946 304,398 777,275 11.5
.3168 53,566 16,970 225,681 472,871 8.8 1.0000 36,596 36,596 247,196 247,196 6.8

--
SECTION 5- LIFE TABLES 5-11
Table 5-1. Abridged Life Tables by Color and Sex: United States, 19’77-Con.
PROPORTION iVERAGE REHAIN-
&GE INTERVAL OYING OF 100,000 BCRN AL lVE STATIONARY POPULATION lNG LIFETIME
PROPOFTrnN CIF AVERAGE NUUBER
PERIOO OF LIFE BETWEEN ‘WO EXACT AG33 PERSON> A. IVE AT NUMBER LIVING NUMBER OYING IN THIS AND IF YEARS OF LIFE SEGINNING OF AGE AT BEGINNING OF DURING AGE IN THE AGE ALL SUBSEQUENT Retaining AT
STATED IN YEARS INTERVAL OYING ME INTERVAL INTERVAL INTERVAL AGE INTERvALS BEGINNING OF OURING INTERVAL
(11
Xtox+n
ALL OTHER
o-l--—--— -———-——---—-,
l-5—-—— _-————— —-. —.
5-1 o--———-—————----——---—-lo-15 -—-- —.————-———
15-20———— —————-—-—-—-,
20-2 5———-——-———-—-——-7 5-? o-—— —-—--— ——-—-——--—----
35-A O——-—--———--———--—--ii4s-—---——-—-——— —-——-—-4=.40——-—--——-—— —-—---,---50-55—— -—- ——— —-—-—-—..
55-6 o—--——--—————-—--—60-65——— ~—---—-.
65-70 —————— —-—---—.
70-7 5—--——--— ——-.-———,
75-80—— -———--————.
8 0-85 —-----—--———————-—85 A NO OVE R--————--—-————,
ALL OTHER, HAL E
,- .--— -— —--— ———-—-—-—-,
10-1 5—--———-————-—--—-—
-—--— —---15-2 O—-———————— 20-2 5—-——-——-———---—--—--—-25-3 o—-—-——————-—-—
-.. . 1.0-45-—--——————--—-————,
56-i&—--—————-——-—----55-6 0——---——-——-—-———-—----60-6 5—--—-—-———-—--——---—---65-70 -—--—-—-———--—-— —---—7 0-75—---—-—-——————-—--—-
75-8 O-—--—-—-----————-— —----—--80-85-—--———-—————-———85 A NO OVE R--—————--—-——-—
ALL MHER, FEMALE
1-5--—--—-—--——————-—-5-1 o--—--—-——----—--y—--———-10-1 5-—-—-————-—-———-
15-2 0—--—--—---————--—-—--— 20-2 5———-—-———---—-—-————
-——--—-25-3 o—-—-——-——— 30-35 _---_ -_-_ ———_-—--—------,
40-45 ——-———----—————-—---—-45-5 o—-—--—-----—--——-——----—-50-55 ---———--—--——-——--—---—-
55-60—---——-—-——————:-—-60-6 5---——-—---——-—-—-——---—-65 -70———---—-——-—-—— -—--—--70-7 5—————-——-—----———-—-
75-8 0——-—-—-----——-----—-——-—-80-8 5-----— -— ——— ——-— —-—-.
85 6.NO OVE R---------——-—-—-——-—-
(2) (3] (41 (51
lx d .L,“.8
0.0219 100.000 2,185 .0038 9T, L!15 371 .0022 97,444 210 .0021 97,234 200
.0052 97,034 508
.0092 96,526 890
.0123 95,636 1, IT6
.o13q 94,460 1,314
.0195 93,146 1,815
.0286 91,331 2,614 .0409 88,717 3,628 .0606 85,089 5,152
.0.353 T9,937 6, S15
.1207 73,122
.1350 64,298 8,681
.2297 55,617 12,777
.3125 42,840 13,387
.3096 29,453 9,118 1.0000 20,335 20,335
0.0239 100,000 2,391 .0042 97,609 409 .0026 97,200 251 .0027 96,949 263
.0073 96,686 70T
.0138 95,979 1,327
.0189 94,652 1,793
.0206 92,859 1,911
.0277 90,948 2,518
.0389 88,430 3,441
.0537 84,989 4,563
.0783 80,426 6,296
.1095 74* 130 8,117
.1533 66,013 10,254
.173T 55,759 9,6S6
.2692 46,073 12s402
.3541 33,671 11,924
.3640 21,74T 7,915 1.0000 13,832 13,832
0.0197 100,000 1,973 .0034 98,027 332 .0017 97,695 168 .0014 97,527 137
.0032 97,390 307
.0050 97,083 482
.0066 96,601 636
.0083 95,965 793
.0127 95,1T2 1,212
.0200 93,960 1,882
.0296 92,078 2,729
.0448 89,349 4,007
.0635 85,342 5,422
.0907 79,920 7,252
.1036 72,668 7,526
.1956 65,142 12,741
.2787 52,401 14,605
.2711 37,796 10,246 1.0000 27,550 27,550
98,090 390,372 486,643 485, T4T
484,055 480,513 475,300 469,160
461,424 450,426 434,913 413, 0T8
383,219 344,170 300,197 246,368
180,015 123,643 176,460
9T,926 389,469 485,318 484,211
481,905 476,750 468, S08 459,676
448,724 433,903 413,989 386,969
350,910 304,924 254,830 199,266
137,466 87,868
101,592
98,260 391,303 488,007 487,330
486,261484,272481,49247T,971
473*o15465,340453,890437,149
413,696382,179345,050294,377
225,229162,860265,097
AGE INTERVAL
(6 I [71
T,
6,8 S3,793 68.8 6, T85,703 69.4 6,395,331 65.6 5,908,688 60.8
5,422,941 55.9 4,938,886 51.2 4,458,3T3 46.6 3,983,073 42.2
3,513,913 37.7 3,052,489 33.4 2,602,063 29.3 2,167,150 25.5
1,754,072 21.9 1,370,853 18.T 1,026,683 16.0
726,486 13.1
480,118 11.2 300,103 10.2 176,460 8.7
6,464,504 64.6 6,366,578 65.2 5,977.109 61.5 5,491,791 56.6
5,00 T,580 51.8 4,525,675 47.2 4,048,925 42.8 3,580,117 38.6
3,120,441 34.3 2,671,717 30.2 2,237,814 26.3 1,823,825 22.7
1,436,056 19.4 1,085,946 16.5
701,022 14.’2 526,192 11.4
326,926 9.7 189,46’3 8.7 101,592 7.3
7,312,778 73.1 7,214,518 T3.6 6,823,215 69.8 6,335,208 65.0
5,84 T,8T8 60.0 5,361,617 55.2 4,877,345 50.5 4,395,853 45.8
3,91 T,882 41.2 3,444,867 36.7 .2,979,527 32.4 2,525,637 ~8.3
2,088,488 24.51,674,792 21.01,292,613 17.8
947,563 14.5
653,186 12.5 42 T,95T 11.3 265,097 9.6
-----
------------
-----------
-----
--------
-----------------
------------------------
----------
--------------------
------
--------
--- ------------------------
----------
--------------
-------------------------
--------------------------------
---------------
----------------------------
--------------
-----------------
------------
----- --------------
----------------------------------
----------------------
------------------
----------------------
---------------------
------------------------------------
5-12 SECTION 5- LIFE TABLES
Table 5-2. Number of Survivors at Siffle Years of Age, Out Of 100,000 Born Alive, by Color and Sex: United States, 1977
fiGE I07H SEXES
o--—-----------—-—————-— 100,000 1--—------—---—---—----------—-- 98,579 2--—------------————--------—- 98,487
3--—-—--- —--------— ——-----——- 98,415 4--— -—--------—---—------------7- 90,35S 5--—------—-—---——----—-----—- 98,311 ~—.—-----—---__-———— ___________ 98,270 7--—--------—----—-------—------- 98,233 8--— -—-------------— --—-------—- 98,200 9--—- —---—--—---— —--------—-- 98, 170
1 O-------------------.— 98, 144 11--—-----—------————-—---—- 90, 120 lo-—--—-----_- __---— ____________ 90,096 13-----------—----- ——--------—-- 9S, 067 lo- —------—-__-—-— 98,027 15- ——-—--—-----——-------—--- 97, ~971 lo---------—--___ -— —----------- 97, a9e 17------------—----- ———-----—--- 97,8308 1 8---------—-—-----—--—- —______ 97,704 19-—--—--------------------—--—-- 97,591
20-—------ —------———-----— 97,472 21- —---------------- ——---------—- 97,348 22-----—--------------———-------- 97,219 23-—----— —-------- —--—-—- —----- 97,087 24- —-—-- —--------—--— -—------- 96,954 25-—--—--—--------—--—— 96,822 26- —--—------___ —-— ___________ 96,692 27----——-—-—-----— __________ 96, 564 28-— -—------——------— 96,431 29----—---—--------— —---— 96.311
3 O-—--------—--_ --—— _____________ 96, 1.85 31 ---------------—--—-—--------— 96, [)57 32-—-—---— 95,928 33-—-—--—-—-----—-—-----—--- 95,195 3+- —------ ——-----—— 95,656 35-—--------_ -----— ________ 95* 508 36- —--—-----—----- ——--—---—-— 95, ?50 37-—-—--— 95,180 38-—--------——--- ——---— 94,996 3g-_----_-------___ --—--— _________ 94,197
.40 —-—------—---__ -— —--— 94,580 ‘41------------------—----—--------- 94,343 42---------— —---—--— 94,084 43-—------ —-------- ——---— 93,801 44--------- —-—-----— —---— 93,491 45-—----------------— —--------—-- 93,152 46-— --—--------------—-------—--- 92,782 47- —----------------——— 92,378 k8-------------------------------- 91,937 49-—---------—-----— 91,455
50-—---------__ -----— _____________ 90,930 51-—-—-------------——— 90,356 52------------------- — 89,732 53--—--------—----- ——------------ 89,057
54- — 88,330 55-—---------—-__ --—— __________ 87, 551 56-—---------__ —-_ —________ 86,720 57-—----------------—--— 85,031 58---------—--------— 84, 873 59-----—------------— 53,030
60- —-------------------------------- 02,690 61--------- —-------- — 81,445 62-----—--—--—--------—7 -----—-- 00,097 63-----------------—--—-----—----- 78,660 64--------- —-—-----—-------— 77, 155 65-------------—------— 75,595 &+---------------------------------- 73,904 67--------------—-—--— 72,313 6 8-------------------—----—----—-- 70,563 69-------------. — 68,7117
70-------------------——--—-------- 66,727 A l 64,623 72-----—---- —------ —----— 62,4,21 73------------—-----— 60,053 74-------—----____ --— _______________ 57, 573 75-------------------— 54, 95s 76-— ------—--------— —-------- 52, 22C 77-—------ —-------- —-- — 49,3’71
70---------------------— 46,435 79-— ---------— 43, 43t
~~_----___________---—--—__________ 40,409 *1 —------------------- —------------ 37,376 ~2--------------------------------- 34, 3C55
83---------— 3L,41E 84--------------------- — 28,555 ~------------------------------------ 25,81:
T07AL WH17E ALL 07 HER
NALE FEMALE BOTH SEXES MALE FEMALE 07H SEXES MALE FEMALE
100,000 100,000 100,000 100,000 100,000 100,000 100,000 100,000 98,414 98,752 98,759 98,602 98,925 97,815 97,609 98,027 98,312 98,671 90,675 98,507 98,852 97,692 97,476 97,916 98,233 90,607 98,610 9s,435 98,794 97,592 97,367 97,826 98,170 90,556 98,558 98, 37S 98,74s 97,511 97,276 97,753 98,117 98,514 98,515 98,330 98,710 97,444 97,200 97,695 98,069 98,479 98,477 98,286 98, 67S 97,388 97,136 97,64S 98,025 98,450 90,442 98,245 98,650 97,341 97,081 97,610 97,984 98,424 98,410 98,206 98,626 97,301 97,032 97,578 97,948 90,401 98,381 98,171 98,604 97,266 96,989 97,551
97,917 98,380 98,356 9a, 141 98,584 97,234 96,949 97,527 97,890 98,360 98,334 98, 116 98,565 97,204 96,911 97,505 97,863 98,340 90,312 9s,091 98,546 97,172 96,870 97,482 97,828 98,317 98,284 98,058 98,524 97,136 96,823 97,457 97,776 98,289 90,245 98,007 98,496 97,091 96,763 97,427 97,700 98,254 90,189 97,932 98,461 97,034 96,686 97,390 97,598 98,210 98, 115 97,029 98,417 96,963 96,590 97,345 97,471 98,158 90,024 97,700 98,366 96,077 96,473 97,291 97,323 98,100 97,919 97,550 98,309 96,776 96,333 97,229 97, 15s 98,039 97,806 97,387 90,249 96,659 96,169 97,159
96,905 97,977 97,690 97,215 98,190 96,526 95,979 97,083 96,801 97,915 97,570 97,036 9s,131 96,377 95,763 97,000 96,607 97, s51 97,447 96,850 98,072 96,213 95,520 96;910 96,407 97,787 97,323 96,661 98,014 96,034 95,253 96,813 96,207 97,722 97,200 96,475 97,956 95, s41 94,963 96,710 96,01C 97,656 97,081 96,295 97,898 95,636 94,652 96,601 95, s11 97,589 96,965 96,123 97, S40 95,418 94,320 96,405 95,620 97,521 96,853 95,958 97,702 95,188 93,967 96,362 95,444 97,452 96,744 95,800 97,723 94,949 93,600 96,234 95,263 97,381 96,636 95,646 97,662 94,705 93,229 96,101
95,084 97,307 96,527 95,494 97,598 94,460 92,859 95,965 94,903 97,230 96,417 95,343 97,531 94,214 92,492 95,824 94,730 97,148 96,305 95,192 97,460 93,965 92,126 95,678 94,551 97,061 96, 190 95,038 97,3s4 93,708 91,753 95,523 94,365 96,969 96,070 94,079 97,303 93,437 91,363 95,355 94,168 96,869 95,943 94,712 97,216 93,146 90,948 95,172 93,95f 96,761 95,808 94,534 97,123 92,834 90,505 94,971 93,734 96,644 95,663 94,344 97,022 92,499 90,034 94,752 93, 49? 96,316 95,506 94,139 96,912 92,138 09,533 94,512 93,234 96,375 95,335 93,910 96,791 91,750 8a ,999 94,249
92,955 96,219 95, 148 93,680 96,657 91,331 88,430 93,960 92,653 96,046 94,944 93,421 96,500 90, s79 S7, S22 93,643 92,324 95,855 94,720 93,138 96,343 90,392 87,173 93,296 91,966 95,645 94,473 92,827 96,161 89,869 86,484 92,920 91,575 95,416 94,201 92,484 95,960 89,311 05,756 92,514 91,147 95,165 93,900 92,105 95,739 8S,717 84,989 92,078 90, 6s0 94,892 93,568 91,686 95,496 88,086 84,182 91,612 90,17C 94,594 93,203 91,224 95,229 87,415 83,331 91,112 89,61? 94,269 92,802 90,715 94,936 86,697 02,428 90,572 89,002 93,916 92,361 90,153 94,617 85,924 81,462 89,986
88,334 93,532 91,878 89,535 94,269 85,089 80,426 89,349 07,60? 93,115 91,349 88, 054 93,890 84,189 79,314 88,657 86,80s 92,662 90,770 88, 108 93,478 03,222 78,126 87,909 05,941 92,173 90,141 87,295 93,031 82,190 76,864 87,106 05,012 91,648 89,461 .36,417 92,349 81,095 75,531 86,250 84,01( 91,085 88,729 85,472 92,031 79,937 74,130 85,342 82,954 90,484 87,945 84,460 91,475 78,723 72,668 84,386 81,821 89,842 87, 103 83,374 90,878 77,449 71,143 s3,3ao 80,601 89,149 86, 191 82,199 90,230 76,102 69,53a s2,31o 79,274 08,394 55,193 80,916 89,522 74,663 67,832 81,160
77,82t 07,560 84,099 79,510 Os, ?45 73,122 66,013 79,920 76,25C 86,663 82,900 77,975 87,892 71,46* 64,066 78,572 74, 54s 05,679 81,599 76,313 86,962 69,692 62,006 77,122 72,73t 84,627 80,205 74,535 85,962 67,865 59,88S 75,617 70,83: 83,523 78,733 72,656 84,905 66,052 57,785 74,119 68, s67 82,377 77,194 70,687 83, 79T 64,29S 55,759 72,668 66,83C 81,188 75,590 68,634 82,636 62,632 53,829 71,209 64,722 79,944 73,912 66,493 81,412 61,025 51 *975 69,950 62,53[ 70,625 72, 149 64,256 80,110 59,393 50,126 68,559 60,231 77,204 70,284 61,911 78,712 57,618 40,182 66,986
57,81! 75,660 68,303 59,452 77,201 55,617 46,073 65,142
55,2W 73,989 66,209 56,886 75,576 53,372 43,784 63,009
52,652 72,1S9 64,004 54,223 73,831 50,921 41,351 60,623 49,92? 70,239 61,676 51,463 71,940 48,306 30,014 58,021 47,10? 68,116 59,219 48,605 69,874 45,593 36,237 55,262
44, 20? 65,805 56,601 45,656 67,612 42,840 33,671 52,401
41,24( 63,306 53,853 42,631 65,149 40,085 31,149 49,480 38,23! 60,630 50,981 39,551 62,493 37,350 28,687 46,528
35,21, 57,796 48,007 36,445 59,663 34,651 26,291 43,572 32,201 54,828 44,958 33,344 56,680 32,008 23,971 40,646
29,24< 51,751 41, 861 30,282 53,566 29,453 21 ,T47 37,796 26, 36? 48,53.9 38,742 27,292 50,340 27,034 19,654 35,086 23,6o( 45,365 35,627 24,410 47,018 24,819 17,741 32,597
20,99( 42,100 32,541 21,672 +3,614 22,892 16,076 30,430 18,57; 38,813 29,507 19,113 40,138 21,357 14,74C 28,702 16,4C 35,522 26,549 16,770 36,596 20,335 13,832 27,550
------
-------
-------------
--------
--
--
SECTION 5- LIFE TABLES 5-13
Table 5-3. Expectation of Life at Single Years of Age, by Color and Sex: United States, 1977
TOTAL UHITE ALL OTHER
AGE B07H SEXES MALE FENALE 30TH SEXES MALE FEMALE !OTH SEXES MALE FEMALE
o——----—--—----— ——---—---—-- 73.2 69. ? 77.: 73.8 70. C 77.7 68. e 64. t 73.1 —--— -. ——-— ——— --—------ 73.2 69.1 77.: 73.0 70. ( 77.6 69.4 65.; 73.6
72.3 71.3 67. ( 75.: T1.9 68.1 75.7 67.5 63., 71.7
4—-—---—-----—-———--———— 70.4 66. t 74.: 70.9 67.2 74.7 66.6 62., 70.8 5 ——-—--—— —————-——. 69.4 65. t 73.: 69.9 66.2 73.7 65. ( 61. ! 69.8 6---—--————----—————-—--- 68.4 64.1 72.; 69.0 65.: 72.8 64.7 60.: 68.9 7——--—----———-——---——--- 67.5 63. i 71.: 68.0 64.: 71.8 63.7 59.6 67.9 8-----—-—-——--—————— 66.5 62.7 70.: 67.0 63. ? 70.8 62.7 58. t 66.9 9------------—--——————— 65.5 61. f 69.: 66.0 62. ? 69.8 61.7 57.t 65.9
10-—-————-—————-——--- 64.5 60. E 6s. ! 65.0 61.: 68.8 60.8 56. ( 65.0 1 l--—-——---——-—--————----— 63.5 59. E 67. A 64.1 60.4 67.9 59.8 55. i 64,0 12 —-——---—---——————-- 62.6 58. E 66.4 63.1 59.4 66.9 58.8 54.7 63.0 1 3-— ———--——-———----—-- 61.6 57. E 65., 62.1 58.4 65.9 57.8 53. i 62.0 lo--——--—-—-— _________ 60.6 56.5 64., 61.1 57.4 64.9 56. < 52. [ 61.0 1 5-——----—--————---—- 59.6 55.5 63., 60.2 56.5 63.9 55.5 51. f 60.0 lo-—————--———— 58.7 55. C 62. ! 59.2 55.5 62.9 54.9 50. Z 59.1 1 7-—------ —- —-——————--— 57.7 54. c 61. ! 58.3 54. t 62.0 54. c 49. < 58.1 18 —————-——-—————-——-— 56.8 53.1 60. ! 57.3 53. -( 61.0 53.0 49. < 57.1 ~.+- ——— 55.9 52.2 59. t 56.4 52. t 60.1 52.1 48.1 56.2
2 o-—-—---—-—---———__ 54.9 51.3 58. ( 55.4 51.5 59.1 51.2 47.2 55.2 21 -—---—-—————————— 54.0 50.4 57. ( 54.5 51. c 58.1 50.2 46. ? 54.3 22 -—--—--——-——————--—— 53.1 49.5 56. i 53.6 50.1 57.2 49.3 45.4 53.3 2 3—--—-———---————--—-—— 52.1 40.6 55.7 52.7 49.1 56.2 48.4 44.5 52.4
51.2 47.7 54. i 51.7 48.2 55.2 47.5 43.6 51.4 2 5-———-—-———————_ 50.3 46.8 53. t 50.8 47. ? 54.3 46.6 42.6 50.5 7 A—.----———— ——--—-—----------- 49.3 45.9 52. t 49.8 46.4 53.3 45.7 41.5 49.5 57-——--—--————————-—— 48.4 45.0 51. $ 48.9 45.5 52.3 44.8 41.1 48.6 28—-——--—-—————-—— 47.5 44.1 50. $ 48.0 44.6 51.4 43.9 40.2 47.7 2 9--—-—-—--——————-— ______ 46.5 43.1 49. $ 47.0 43..s 50.4 43.1 39.4 46.7
30-—————-————--—-— 45.6 42.2 49. < 46.1 42.7 49.4 42.2 38.6 45.8 3 l-—---———------——--——-- 44.7 41.3 48. C 45.1 41.8 48.5 41.3 37.7 44.9 32 ———-- ——— ——— —---- 43.7 40.4 47. c 44.2 40. e 47.5 40.4 36. S 43.9 33 ——-—-——-——--——------ 42.8 39.4 46.1 43.2 39. % 46.5 39.5 36. C 43.0 34-———---——---——---—--—— 41.8 38.5 45.1 42.3 39. C 45.6 38.6 35.2 42.1 3 5-——--——-————-------- 40.9 37.6 44. i 41.3 38. C 44.6 37.7 34. ? 41.2 3.+-——___ ——— _______ 40.0 36.7 43.2 49.4 37.1 43.6 36.9 33.5 40.3 3 7-—-—————--———————— 39.0 35.8 42.2 39.4 36.2 42.7 36.0 32.6 39.3 3 8----——-—---—————--—— 38.1 34.9 41. ? 38.5 35.3 41.7 35.1 31.8 38.4 39-——------—-—__ 37.2 34.0 40.4 37.6 34.3 40.8 34.3 31. C 37.5
40-—--—--—-—-——————-— 36.3 33.1 39.5 36.6 33.4 39.8 33.4 30.2 36.7 41 -—-—-----———————— 35.4 32.2 38.5 35.7 32.5 38.9 32.6 29.4 35.8 42-----——-—-———--—— 34.5 31.3 37. t 34.8 31.6 38.0 31.8 28.6 34.9
-— ——— ———-—43-—--——-————— 33.6 30.4 36.7 33.9 30.7 37.0 30.9 27.9 34.1 44———--—--—-———-—— 32.7 29.5 35.8 33.0 29.8 36.1 30.1 27.1 33.2 45-—------——-————-—__ —___ 31.8 28.7 34.5 32.1 29.1 35.2 29.3 26.3 32.4 46-———--—-—————--— 30.9 27.8 34. c 31.2 28.1 34.3 28.5 25.6 31.5 47-———— ———_------_- 30.0 27. o 33.1 30.3 27.2 33.4 27.8 24.8 30.7 48 ———-— ——— ——— —---- 29.2 26.1 32.2 29.5 26.4 32.5 27.0 24.1 29.9 49-— ———---—--—————-——-- 28.3 25.3 31.3 28.6 25.5 31.6 26.2 23.4 29. I
50----———------—— ————-————— 27.5 24.5 30.4 27.7 24.7 30.7 25.5 22.7 28.3 51 -—-—-—-——-——————--—— 26.7 23.7 29.6 26.9 23.9 29.8 24.7 22.0 27.5 52---—-—-——-—————--—— 25.9 22.9 28.7 26.1 23.1 29.0 24.0 21.3 26.7 53-—---—.--—--—___ 25.0 22.1 27.9 25.2 22.3 28.1 23.3 20.7 26.0
24.22-—-—---——--———--—-..—.—23.5 21.4 20.6
27.0 26.2
24.4 23.6
21.5 20.8
27.2 26.4
22.6 21.9
20. a 19.4
25.2 24.5
56-—--—--——--——_____ —__ 22.7 19.9 25.3 22.8 20.0 25.5 21.3 18.8 23.7 57--—---—--——--————----——--- 21.9 19.1 24.5 22.1 19.3 24.7 20.6 18.2 23.0
——— —— _____58 —-—-— 21.2 18.4 23.7 21.3 18.5 23.9 20.0 17.6 22.3 59—--—---——---———— —-_——__ 20.4 17.7 22.9 20.5 17.8 23.1 19.3 17.0 21.6
60-—--—-—---————-——-- 19.7 17.0 22.1 19.8 17.1 22.3 18.7 16.5 21.0 61 -———---——-————————-- 19.0 16.4 21.3 19.1 16.4 21.5 18.2 15.9 20.3 62- ———----——————-- —--—----- 18.3 15.7 20.6 18.4 15.8 20.7 17.6 15.4 19.7 63-—--—-—- ——-————--———————— 17.6 15.1 19.8 17.7 15.2 19.9 lT. 1 15.0 19.1 6.? —--——-——-———-—— 16.9 14.5 19.1 17.0 14.5 19.2 16.5 14.5 18.4 65-- —_---- —-- ——— —-------- 16.3 13.9 18.3 16.3 13.9 18.4 16.0 14.0 17.8 66--——---—-— ———— —— 15.6 13.3 17.6 15.7 13.3 17.7 15.4 13.5 17.1 67-— —-———-————--—-- 15.0 12.8 16.9 15.0 12.7 16.9 14.8 13.0 16.4 68- ———----—---———-— -—--- 14.3 12.2 16.1 14.4 12.2 16.2 14.2 12.4 15.8 69-— --—----——-———----- —-- 13.7 11.6 15.4 13.7 11.6 15.5 33.6 11.9 15.1
7 o-—-—------— -—--— ——--—--—-- 13.1 11.1 14.7 13.1 11.1 14.8 13.1 11.4 ?.4. 5 71--——--—-—---—————---—--- 12.5 10.6 14.1 12.5 10.5 14.1 12.6 11.0 14.0
—--- — _____________72- 11.9 10.1 13.4 11.9 10.0 13.4 12.2 10.6 13.6 73 -—-—-----------———--—---—— 11.4 9.6 12.8 11.4 9.6 12.7 11.8 10.3 13.2 74-—-—-—--—---—————-——— 10.9 9.2 12.1 10.8 9.1 12.1 11.5 10.0 12.8 75-———--—--—-—————---—- 10.4 8.7 11.6 10.3 8.6 11.5 11.2 9.7 12.5 76-— -—------— --—-——--—--—-- 9.9 8.3 11.0 9.8 8.2 10.9 10.9 9.5 12.2 77----—-—-- —--—--—---—----— 9.4 7.9 10.5 9.3 7.8 10.4 10.7 9.2 11.9
E---—-——-—————-—--—-- 68. ! 76.: 72.8 69.1 76.6 68.5 64.: 72.7
-——--———____________
-—
78-—-—---——----———----------— 9.0 7.6 9.9 8.9 7.5 9.8 10.5 9.0 11.7 79-—-— -———-----———------—-- 8.6 7.2 9.5 8.4 7.1 9.3 10.3 8.9 11.5
80——-—--—-——-————-----—- 8.2 6.9 9.0 8.0 6.8 8.8 10.2 8.7 11.3 E I -------------------— —----—--—-- 7.8 6.6 8.5 7.6 6.5 8.4 10.0 8.6 11.1 82----—------------—__ 7.4 6.3 8.1 7.2 6.2 7.9 9.9 0.4 10.9 83-—--—- —-----—-— —————-- 7.1 6.1 7.7 6.9 5.9 7.5 9.6 8.2 10.7 84-—--—-----—----_— —---------- 6.7 5.8 7.3 6.5 5.6 7.1 9.3 7.9 io. z 85-— --—--—------— ———---—--- 6.4 5.5 6.9 6.2 5.3 6.8 8.7 7.3 9.6
-----------------------
----------------------------------
------------------------
--------------
-------------
----------
------
--------
-------
--------
----------
-----
------------
--------
------------------------
------
----------
--------------
-------------------------------------------------------------
--------
------
-------------------------
-----------------
5-14 SECTION 5- LIFE TABLES
Table 5-4. Life Table Values by Color and Sex: Death-Registration States, 1900-1902 to 1919-21, and United States, 1929-31 to 1977
[Alaska and Hzviaii included beginning in 1959. For decennial periods prior to 1929-31, data are for groups of registration States as follows: 1900-1902 and 1909-11, 10 States and
the District of Columbia; 1919-21, 34 States and the District of CoIumbia. For 2300-1902 to 1929-31, figures for “All other, male” and “All other, female” include only the black population. However, in no case did the black population comprise less than 95 percent of the corresponding ,IA1l other,, population]
NUMBER OF SURVIVORS OU7 OF 100,000 BORN ALIVE (lX)
AGE, COLOR, ANO SEX 1977’ 1969-71’ 1939-41 1929-31 1919-21 1909-11 1900-1902
WHITE, MALE
o--------- —--------------------1-—------------—---------—---5-----—---------——-—1 O—--—----—-—1 5-------------— ------—--—---2 o---------- —------------------2 5----—3 o-—---------------—35--——
40-—-———----—--——-----—-45----—--------— 50—--—-------—----——--—— 55--—-——-—-—---L—-—-——— 6 b—--—------_—
6 5-—- —--- —-—-—--—----—---7 c—---------——--—--—-—-—— 7 5----——--—--—--— 8C---—------—-------—-—----85-----——----—-------—
ALL OTHER, MALE
o---—------------------------— l-—-—-----—------—--—--5-----—-------—-—--— 1 o----------—--------—-----—
do—----—--—-__---— ___________ 2 5--—--------------—--—-———
3 5----—-----—--___--—
40----—----—--------— 45---—--- —----—----—--—---5 o-—-----—--—— 55---—-—----—------—--—-— 6 O-—- —-----—---—--—— 65----—--- —-—--————---70--——------—---—-——-— 75---—---—--—----------——--80—-—---—------—-—-----—— 85 ——-------—--—--—--—-—
MHITE, FEMALE
o--—--—------—---— -—-----— l-----—--------—----—-----— 5—---—-------—------—--—-— 1 *--—-------— 1 5----—----_--_— _____________ 7 r+--—-------—------—-----——
;6----------—-—---—-——--— 3 5----—----------------------—
40--——-------—-—--—--—-— 45----—-------—-----— 5 o---—-------—-------------—— 5 5—--——____________________
6 O---—------————--------—— 65----— 7 o----—-----—-------——-—-— ? 5-—-— --------—-----— a 0----——-----—----:--------— e 5------------------—
ALL OTHER, FEMALE
o-------------------------------1-—--------—---------— 5-----—-------——----—1 o-----------—------—------——1 5---—-----—-——-------—---20—--——-----—2 5-----—3 o—---—3 5--—----- —--—-----—
40------------------------------
+ 5-— —-------------------—----50-----------------------------55-----------------------------60-—-------—---------—65------------------------------70- ——----—15------------------ —--—80------— ----------—83—-------—----------—
100,000 100,000 100,000 100,000 100,000 100,000 100,000 100,000 100,000 98,602 97,994 97,408 96,931 95,188 93,768 91,975 87,674 06,655 98,330 97,671 97,013 96,403 94,150 91,738 88,842 82,972 80,064 98,141 97,441 96,758 96,069 93,601 90,810 87,530 81,519 79, 109 97,932 97,208 96, 503 95,728 93,089 90,074 86,546 80,549 78,037 97,215 96,480 95,908 95,104 92,293 88,904 84,997 79,116 76,376 96,295 95,524 95, 106 94, 294 91,241 87,371 83,061 77,047 73,907 95,494 94,716 94,401 93,+89 90,092 05,707 80,888 74,810 71,219 94,712 93,843 93, 58q 92,543 88,713 83,812 7a ,441 72,108 68,245
93,680 92,631 92,427 91,173 86,880 al ,457 75,733 68,848 64,954 92,105 90,725 90,533 89,002 84,285 78,345 72,696 65,115 61,369 89,535 87, 69Ll 87,424 85,601 80,521 74,288 69,107 60,741 57,274 85,472 83,001 82,463 80,496 75, 156 68,981 64,574 55,622 52,491 79,510 75,969 75,485 73,172 67,787 61,933 58,498 48,987 46,452 T0,687 66,343 65, 834 63, 541 58,305 52,964 50,663 40,862 39,245 59,452 54,138 53, S25 51,735 46,739 41,880 40,873 31,527 30,640 45,656 40,324 40,207 38, 104 33,404 29,.471 29,205 21,585 21,387 30,282 25,885 25,993 24,005 19,860 17,221 17,655 12,160 12,266 16,770 13,527 13,065 12,015 9.013 7,572 8,154 5,145 5,252
100,000 100,000 100,000 100,000 100s000 100,000 100,000 100,000 100,000 97,609 96,592 95,301 94,911 91,696 91,268 89,499 78,065 74,674 97,200 96,038 94,570 93,921 89,92o 88,412 85,195 68,589 64,385 96,949 95,716 94,234 93,453 89,211 87,311 83,768 66,377 61,730 96,686 95,385 93,874 92,965 88,417 86,152 82,332 64,478 59,667 95,979 94,293 93,108 91,941 86,770 83,621 79,057 61,426 56,733 94,652 92,267 91,825 90,285 S4,055 79,516 74,540 57,736 53, 2B5 92,859 90, 106 90,270 88,327 B0,865 75,083 70,344 54,073 49,867 90,948 87,597 88,331 85,940 77,185 73,049 65,873 49,865 46,541
88,430 t74, 378 85,744 82,832 72,830 64,710 61,353 45,414 42,989 84,909 80,163 82,075 78,606 67,514 58,432 56,589 40,563 39,230 80,426 74,740 77,239 72,891 60,766 51,748 51,880 35,427 34,766 74,130 67,808 70,351 65, 122 52,867 44,436 46,581 29,754 29,907 66,013 59,396 61,669 55,535 44,370 36,790 40,506 23,750 24,194 55,759 49,607 51,392 45,198 35,912 29,314 34,042 17,806 19,015 46,073 39,025 39,914 35,018 27,608 21,741 26,923 12,295 13, B29 33,671 27,789 29,064 25,472 19,765 14,419 18 ,B54 7,494 8,892 21,747 17,995 19,994 16,904 12,352 8,239 11,615 3,894 4,031 13,832 10,811 11,620 9,898 6,492 3,660 5,605 1,747 2,02.0
I 100,000 100,000 100,000 100,000 100,000 100*OOO 100,000 100,000 100,000
98,925 98,468 98,036 97,645 96,211 95,037 93,608 89,774 8B,939 98,710 98,203 97,709 97,199 95,309 93,216 90,721 85,349 83,426 98,584 98,042 97, 525 96,960 94,890 92,466 S9,564 83,979 81,723 98,461 97,902 97,375 96,756 94,534 91,894 88,712 83,093 80,680 98,190 97,618 97,135 96,454 93,984 90,939 87,281 81,750 78,978 97,098 97,299 96,844 96,072 93,228 89,524 85,163 79,865 76,5B8 97,590 96,945 96,499 95,605 92,320 87,972 82,740 77,676 73,887 97,216 96,474 96,026 94,977 91,211 86,24S 80,206 75,200 70,971
I 96,657 95,762 95,326 94,080 89,805 84,256 77,624 72,425 67,935 95,739 94,649 94,228 92,725 87,920 81,780 74,871 69,341 64,677 94,269 92,924 92,522 90,685 85,267 7B,572 71,547 65,629 61,005 92,031 90,383 89,967 87,699 81,520 74,321 67,323 61,053 56,509 88,745 86,726 86,339 83,279 76,200 68,462 61,704 54,900 50,752 83,797 81,579 00,739 76,773 68,701 60,499 54,299 47,086 43,806 77,201 74,101 72,507 67,545 58,363 49,932 44,638 37,482 35,206 67,612 63,290 60,461 54,397 44,685 37,024 32,777 26,569 25,362 53,566 48,182 44,676 38,026 28,882 23,053 !20,492 15,929 15,349 36,596 30,490 26,046 21,348 14,487 10,937 9,909 7,152 7,149
100,000 100,000 100,000 100,000 100,000 100,000 100,000 100,000 100,000 90,027 97,235 96,172 95,913 93,318 92,796 91,251 81,493 78,525 97,695 96,772 95,543 95,055 91,710 90,185 87,149 72,768 68,056 97,527 96,546 95,265 94,679 91,092 89,201 85,607 70,508 65,111 97,390 96,353 95,057 94,343 90,363 88,088 83,954 68,218 62,384 97,083 95,917 94,660 93, 544 88,505 85,078 80,154 64,764 59,053 96,601 75,247 94,005 92,336 85,961 S1,067 75,359 61,430 55.795 95,965 94,370 93,070 90,799 83,147 76,816 70,633 58,281 52,773 95,172 93,123 91,670 88,805 79,879 72,192 65,857 54,595 49,567
93,960 91,247 89,676 86,052 75,908 67,271 61,130 50,568 46,146 92,078 88,608 86,793 82,257 71,061 61,365 56,230 45,947 42,279 89,349 04,964 82,979 77,007 64,806 54,920 50,780 40,886 37,681 05,342 80,162 77,362 70, 196 57*4i9 47,074 44,742 35,415 33,124 79,920 73,904 69,941 61,758 49,102 38,761 37,954 28,9!)8 27,524 72,660 66,064 60,825 52,358 40,718 30,852 31,044 22,302 21,995 65,142 56,375 51,274 42,612 32.579 23,341 24,107 15,871 16, 140 52,401 44,841 40,540 32,981 24,668 16,576 17,216 1!I,657 11,066 37,796 33,373 30,315 23,712 17,157 10,822 11,151 6,324 6,708 27,550 22,763 19, T44 15,550 10,658 6,033 5,972 3,029 3,567
‘Deaths of nonresidents of the United States were excluded beginning in 1970,
--------------
-----
-------
---------
---------
-----
SECTION 5- LIFE TABLES 5-15
Table 5-4. Life Table Values by Color and Sex: Death-Registration States, 1900-1902 to 1919-21, and United States, 1929-31 to 1977—Con.
[See headnote at beginning of table]
AVERAGE NuMBER OF YEARS OF LIFE REMAINING (:x)
AGE, COLOR, AND SEX
* 19771 1969-711 1959-61 1949-51 1939-41 1929-31 1919-21 1909-11 1900-1902
h’HITE , MALE I
o———-————--—--—--—— 1———----------——-—--—-—5—-—-—--—-—-——-— 1 &--—---—--—--— 1 5-—--—-—-——-—-— 20--—---—————---————— 2 5——-——--——---————— 3 o—--—-——-—---—-—-.--—————
3 5—----—-——-----—-—--—-—
40--—-—-———-——--— 45——-——-----—-—---—-— 5 o--————-—--——--————
i -i—-—--—--——--— 6 5—--—----——-—-——--——7C—-—-—-———---—--———75—------—---—--—--—--——
——--—-——8o———--———05——--—---—-—--—--——
ALL OTHER, MALE I o-—-—-————--—-———
—------———-—--——-l—————5-----—------———-—--—--1o——----——-—--—-—---13—-—--—-——-——-—_—_—_2 o--—--—--——-—-—--————25—-—--——--——-—-—30——---—-—--—-—--———35-—-————---—-—-——
4 o——--—--—-—--———— I ;-j—_-—---—--——--—-— 55—-——————--—--——60---—--— -———-—-———65--——--—--—--—-—--—---7o--——————-—--—-——
—-----—75—- ————-—
HH17E, FEMALE I
io——---——-—————— 15——--——---——--————
—-—-———--——2025———-—-—-——-——30————-----—-———-——35--—-------——--——-—-—
4 o—--—----——-——-—-—45-—--—---—--——--—————5D-———--—--——-—--——55————--——------—--——60---—-———--—-—--———
7o----------——--——---—-——75—-—-----—---———--———80--——-—---—-——-————
ALL OTHER, FEMALE I o—-——-----——--—-——-—-l—-———-———--——-—--5—--—---—-—--—--—-——1o—-—------——15---—-—-----—-—--—---——2o----—-----——---—-—---——2 5————-—-—-——-----—--do—--—--——-—--—
40-—-------—-—-—-——--——45---- ——-—-—-—-—-—-—5o-——----—-----—---------——55--——----—-——-——--—---6O——---—-——-————-——65----—-----------—------—-7o---—----—-—--—--——---75--——-------------—--—02-——----—-—--——------——85-—------—------- —--—--—--
70.0 67.94 67.55 70.0 68.33 68.34 66.2 64.55 64.61 61.3 59.69 59.78 56.5 54.83 54.93 51.9 50.22 50.25 47.3 45.70 45.65 42.7 41.07 40.97 3s.0 36.43 36.31
33.4 31.87 31.73 29.0 27.48 27.34 24.7 23.34 23.22 20.8 19.51 19.45 17.1 16.07 16.01 13.9 13.02 12.97 11.1 10.38 10.29 8.6 8.06 7.92 6.8 6.18 5.89 5.3 4.63 4.34
64.6 60.98 61.48 65.2 62.13 63.50 61.5 58.48 59.98 56.6 53.67 55.19 51.8 48.84 50.39 47.2 44.37 45.78 42.8 40.29 41.38 38.6 36.20 37.05 34.3 32.16 32.81
30.2 28.29 28.72 26.3 24.64 24.89 22.7 21.24 21.2s 19.4 18.14 18.11 16.5 15.35 15.29 14.0 12.87 12.84 11.4 10.68 10.81 9.7 8.99 8.93 8.7 7.57 6.S7 7.3 6.04 5.08
77.7 75.49 74.19 77.6 75.66 74.6S 73.7 71.86 70.92 68.8 66.97 66.05 63.9 62.07 61.15 59.1 57.24 56.29 54.3 52.42 51.45 49.4 47.60 46.63 44.6 42.82 41.84
39.8 38.12 37.13 35.2 33.54 32.53 30.7 29.11 28.08 26.4 24..95 23.81 22.3 20.79 19.69 18.4 16.93 15.88 14.8 13.37 12.38 11.5 10.21 9.28 8.8 r.s9 6.67 6.8 5.54 4.66
73.1 69.05 66.47 73.6 70.01 68.10 69.8 66.34 64.54 65.0 61.49 59.72 60.0 56.60 54..95 55.2 51.85 59.07 50.5 47.19 45.40 45.8 42.61 40.83 41.2 38.14 36.41
36.7 33.87 32.16 32.4 29.80 28.14 28.3 25.97 24.31 24.5 22.37 20.89 21.0 19.02 17.83 17.8 15.99 15.12 14.5 13.30 12.46 12.5 11.06 10.10 11.3 9.01 7.66 9.6 7.07 5.44
66.31 62. S1 59.12 56.34 50.2: 48.23 67.41 64.98 62.04 60.24 56.2{ 54.61 63.7? 61.68 59.38 58.31 55.3i 54.43 38.9f 57.03 54.96 54.15 51.3; 50.59 54.1[ 52.33 50.39 49.74 46.91 46.25 49.52 47.76 46.02 45.60 42.7~ 42.19 44.9? 43.28 41.78 41.60 38.7s 38.52 40.2$ 38.80 37.54 37.65 34. S7 34.88 35.6f 34.36 33.33 33.74 31.Of 31.29
31.li 30. D3 29.22 29.86 27.4: 27.74 26.87 25.87 25.20 26.00 23.8t 24.21 22.8: 21.96 21.51 22.22 20.3$ 20.76 19.11 1s.34 17.97 18.59 17.0: 17.42 15.7< 15.05 14.72 15.25 13.9[ 14.35 12.7! 12.07 11.77 12.21 11.2: 11.51 10.07 9.42 9.20 9.51 8.8: 9.03
7.77 7.17 7.02 7.30 6.7: 6.84 5.8[ 5.38 5.26 5.47 5.0$ 5.10 4.35 4.02 3.99 4.06 3.8E 3.81
58.91 52.33 47.55 47.14 34.05 32.54 61.06 56.05 51. 0s 51.63 42.5? 42.46 57.6S 53.13 4.3.69 50.18 44.25 +5. 06 52.9( 4s.54 44.27 45.99 40.65 41.90 48.22 43.95 39.83 41.75 36.77 38.26 43.7? 39.74 35.95 38.36 33.46 35.11 39.4< 35.94 32.67 35.54 30.44 32.21 35.31 32.25 29.45 32.51 27.3? 29.25 31.21 28.67 26.39 29.54 24.42 26.16
27.25 25.23 23.36 26.53 21.51 23.12 23.55 22.02 20.59 23.55 18.85 20.09 20.25 19.18 17.92 20.47 16.21 17.34 17.3t 16.67 15.46 17.50 13.82 14.69 14.91 14.3s .13.15 14.74 11.67 12.62 12.75 12.18 10.87 12.OT 9.74 10.38 10.74 10.06 8.78 9.58 8.00 8.33 8.83 8.09 6.99 7.61 6.58 6.60 7.07 6.46 5.42 5.83 5.53 5.12 5.38 5.08 4.30 4.53 4.48 4.04
72.03 67.29 62.67 58.53 53.62 51.08 72.77 68.93 64.93 61.51 58.69 56.39 69.09 65.57 62.17 59.43 57.67 56.03 64.26 60.85 57.65 55.17 53.57 52.15 59.39 56.07 53.00 50.67 49.12 47.79 54.56 51.38 48.52 46.46 44. S8 43.77 49.77 46.78 44.25 42.55 40.88 40.05 45.00 42.21 39.99 38.72 36.96 36.42 40.28 37.70 35.73 34.86 33.09 32.82
35.64 33.25 31.52 30.94 29.26 29.17 31.12 28.90 27.39 26.98 25.45 25.51 26.76 24.72 23.41 23.12 21.74 21.89 22.58 20.73 19.60 19.40 18.18 18.43 18.64 17.00 16.05 15.93 14.92 15.23 15.00 13.56 12.81 12.75 11.97 12.23 11.68 10.50 9.98 9.94 9.3s 9.59 8.S7 7.92 7.56 7.62 7.20 7.33 6.59 5.88 5.63 5.TO 5.35 5.50 4.83 4.34 4.24 4.24 4.06 4.10
62.70 55.51 49.51 46.92 37.67 35.04 64.37 58.47 52.33 50.39 45.15 43.54 60.93 55.47 49.81 48.7o 46.42 46.04 56.17 50.83 45.33 44.54 42.84 43.02 51.36 46.22 40.87 40.36 39.18 39.79 46.77 42.14 37.22 37.15 36.14 36.89 42.35 38.31 33.93 34.35 32.97 33.90 38.02 34.52 30.67 31.48 29.61 30.70 33.82 30.83 27.47 28.58 26.44 27.52
29. S2 27.31 24.30 25.60 23.34 24.3726.07 24.00 21.39 22.61 20.43 21.3622.67 21.04 18.60 19.76 17.65 18.6719.62 1s.44 16.27 17.09 14.98 15.8816.95 16.14 14.22 14.69 12.78 13.6114.54 13.95 12.24 12.41 10.82 11.3812.29 11.81 10.38 10.25 ‘?.22 9.6210.15 9.80 8.62 S.37 7.55 7.908.15 8.00 6.90 6.5S 6.o5 6.486.15 6.3a 5.48 5.22 5.09 5.10
1
Deaths of nonresidents of the United States were excluded begiming in 1970.
------ -----------------------
-------------------------
-------------------------------
------------------------
------------------------
-------------
------------
---------------------------------------
--------------
------------------
------
-----------------
---------------
----------
------
---------------
------------------
-----
-------------------
------------
-----------
-----------
------------------
--------------
-----
5-16 SECTION 5- LIFE TABLES Table 5-5. Average Length of Life in Years, by Color and Sex Death-RegistrationStates, 1900-1928, and United States, 1929-77
[ Fors?lected table seeTechnicalyears,life valuesshow areestimates; Appendix]
+s 70.0 77.7 68.8 64.6 73.1
~ 9761 72.8 69.0 76.7 73.5 69.7 77.3 6S.4 64.2 72.7 1975’ ------------------—-----—-—- 72.5 60.7 76.5 73.2 69.4 77.2 67.9 63.6 72.3 19741 ----.__--—-_---— 71.9 68.1 75. e 72.7 68.9 76.6 67.0 62.9 71.3 19731,2 ----__--___ ----— 71.3 67.5 75.2 72.1 68.4 76.1 65.9 61.8 70.1
~97~1,2,3-- .-_- _- —----------------- 71.1 67.4 T5. O 72.0 68.2 75.9 65.6 61.4 69.9 L9711,2---.-_---------— 71.1 67.4 75.0 71.9 68.2 75.8 65.6 61.6 69.7 19701,2 ----—--— 70.8 67.1 74.7 71.7 68.0 75.6 65.3 61.3 69.4 1969; -—-------------—------------ 70.5 66.8 74.4 71.4 67.7 75.3 64.5 60.6 68.6 1968 ----------—----——-------—--- 70.2 66.6 74.1 71.1 67.5 75.0 64.1 60.4 67.9
19 b72--—------____-- —------------ 70.5 67.0 74.3 71.4 67.0 75.2 64.9 61.4 68.5 19662 --—-----—---__—— 70”2 66.7 73.9 71.1 67.5 74.8 64.2 60.9 67.6 19652 ------_--—---— 70<,2 66.8 73.8 71.1 67.6 74.8 64.3 61.2 67.6 19642 ----------_—---— 70”2 66.8 73.7 71.0 67.7 74.7 64.2 61.3 67.3 19632,4 -------—-——— 69<.9 66.6 73.4 TO. S 67.4 T4.4 63.7 61.0 66.6
19622,~—-------------— 70<.1 66.9 73.5 70.9 67.7 74.5 64.2 61.6 66.9 19612 -—-ti-____---——__---—_-__- 70”2 67.1 73.6 71.0 67.8 74.6 64.5 62.0 67.1 1960 ----------——-——--—------—- 69.)7 66.6 73.1 70.6 67.4 74.1 63.6 61.1 66.3 1959 ---------------—--— 69.9 66. s T3.2 70.7 67.5 74.2 63.9 61.3 6b.5 1950---------—-------—-----—-—-- 69.6 66.6 72.9 70.5 67.4 73.9 63.4 61.0 65.8
1957 --—--—--—------— 69.3 66.4 72,,7 70.3 67.2 73.7 63.0 60.7 65.5 1956 -—---------—---—— 69.7 66.7 72.9 70.5 67.5 73.9 63.6 61.3 66.1 1955 -----—-——-----— 69.6 66.7 72. S 70.5 67.4 73.7 63.7 61.4 6b.1 1954 -—--—-——--————---—-----, 69.6 66.7 72.8 70.5 67.5 73.7 63.4 61.1 65.9 19 53-—-----——-----— 68. S 66.0 72.0 69.7 66.8 73.0 62.0 5q.7 64.5
1952 ---------——----—---------—-- 68.6 65.8 71.6 69.5 66.6 72.6 61.4 59.1 63.8 1951 —--------—---————--—-—-- 68.4 65.6 71.4 69.3 66.5 72.4 61.2 59.2 63.4 1950 --—-------------—--— 68,2 65.6 71.1 69.1 66.5 72.2 60.8 59.1 62.9 1949 ———----—--—--— 68.0 65.2 70.7 68.8 66.2 71.9 60.6 S8.9 62.7 1948 ----—----—---— ——--——--—-- 67.2 64.6 69.9 68.0 65.5 71.0 60.0 58.1 62.5
1947—-----—--—----— --—--— 66.0 64.4 69.7 67.6 65.2 70.5 59.7 57.9 61.9 1946------—------— --------—-—-- 66.7 64.4 69.4 67.3 b5.1 70.3 59.1 57.5 61.0 1945---—--— -—-—---——--— 65.9 63.6 67.9 66.8 64.4 b9.5 57.7 56.1 59.6 194+—-—-—-----—--— 65.2 63.6 66.8 66.2 64.5 68.4 56.6 55.8 57.7 1943 --—--—-———-———------—-- 63.3 62.4 64.4 64.2 63.2 65.7 55.6 53.4 56.1
1942 —-—-—---—-—-———-— 66.2 64.7 6T.9 67.3 65.9 69.4 56.6 55.4 58.2 1941 ---------------— -—--— 64.8 63.1 66. s 66.2 64.4 b8.5 53.8 52.5 55.3 1940--—-—---—----- ———-—--—--- 6.?.9 60.8 65.2 64.2 b2. 1 66.6 53.1 51.5 5+.9 1939 -—--------—----——-—---—-— 63.7 62.1 65.4 64.9 63.3 66.6 54.5 53.2 56.0 1930 --—------—-—--—-— 63.5 61.9 65.3 65.0 63.2 66.8 52.9 51.7 54.3
1 937-————--—-——-------—--- 60.0 58.0 62.4 61.4 59.3 63.8 50.3 48.3 52.5 1936 ——-----————--—---- 58.5 56.6 60.6 59.8 58.0 61.9 49.0 47.0 51.4 1 935--—--------—-— -—-----——- 61. T 59.9 63.9 62.9 61.0 65.0 53.1 51.3 55.2 193 A--—--—-—-——--——----— 61.1 59.3 63.3 b2.4 60.5 64. b 51.8 50.2 53.7 1 933 —-—----—----——--— 63.3 bl.7 b5.1 64.3 b2.7 bb.3 54.7 53.5 5b. O
1932 ——------—----——---- —-—--- 62.1 61.0 63.5 63.2 62.0 64.3 53.7 52.8 54.6 1931 ‘-—--—--—----—— 61.1 59.4 63.1 62.6 60.8 64.7 50.4 49.5 51.5 1 930---—-- —--— -———----— 59.7 5s.1 61.6 61.4 59.7 63.5 48.1 47.3 49.2 1929-—-—-—----— —-——----—-- 51.:1 35.8 58.7 58.6 57.2 60.3 46.7 45.7 47.8
DEATH-REGISTRATION STATES
I II ) 70TAL WHITE ALL OTHER
AREA AND YEAR BOTH SEXES MALE FEMALE SOTH SEXES MALE & MALE FEMALE
UNITEO STATES
19771 .---. ---.___-__---_ -_-___--_-: 73.2 69.3 77.1 73.8
192 S------—-----—-—--—-—-—--- 56.8 55.6 58.3 58.4 57.0 60.0 46.3 45.6 47.0 192 7----------—---——--—---— 60.4 59.0 62.1 62.0 60.5 63.9 48.2 47.6 48.9 1926--—---—-—-----— ——---------- 56.”/ 55.3 58.0 58.2 57.0 59.6 44. b 43.7 45.6
192 5--—------—----————------— 59.0 57.6 60.6 60.7 59.3 62.4 45.7 44.9 46.7 1926----—----—------- —---------— 59.7 58.1 61.5 61.4 59.8 63.4 46.6 45.5 47.8 1923 —-—---— —------——- 57.2 56.1 58.5 58.3 57.1 59.6 48.3 47.7 48.9 1922 ---—-- —-—--——--— 59.6 58.4 61.0 60.4 59.1 61.9 52.4 51.8 53.0 19 21—-—--—-—-—————-----—- 60.8 60.0 61.8 61.8 60.8 62.9 51.5 51.6 51.3
1920-------—--------——------—---- 54.1 53.6 54.6 54.9 54.4 55.6 45.3 45.5 45.2 1919-------—-——-—————----—-- 34.7 53.5 56.0 53.8 54.5 57.4 44.3 44.5 44.4
--—------- —------------—--1918—- 39.1 36.6 42.2 39.8 37.1 43.2 31.1 29.9 32.5 1917---—-----—--—- —--—------—-- 50.9 48.4 54.0 52.0 49.3 55.3 38.8 37.0 40.8 1916-—-—-——-———— 51.7 49.6 54.3 52.5 30.2 55.2 41.3 39.6 43.1
191 5--—-----—-————--—-—-- 54.5 52.5 56.0 35.1 53.1 57.5 38.9 37.5 40.5 L914-—--—-—--—---—— 54.2 52.0 56.0 54.9 52.7 57.5 38.9 37.1 40.8 1913 --—--—-—-—-----—------—-- 52.5 50.3 55.0 53.0 50.8 55.7 30.4 36.7 40.3 1912 --—--—--—--—-—--—------—-- 53.5 51.5 55.9 53.9 51.9 56.2 37.9 35.9 40.0 191 1--—---_ ------_— __________ 52.6 30.9 54.4 53.0 51.3 54.9 36.4 34.6 38.2
1910 ---—--_---_----_— 50.0 48.4 51.8 50.3 48.6 52.0 35. b 33.8 37.5 1909—--—---——-—--—-—---—--- 52.1 50.3 53.8 52.5 50.9 54.2 35.7 34.2 37.3 1908-—-------—------—----——--- 51.1 49.3 52.8 51.5 49.9 53.3 34.9 33.8 36.0 1907 ---------—-— 47.6 45.6 49.9 48.1 46.0 50.4 32.5 31.1 34.0
-—-------------1906---------— 48.7 46.9 50. a 49.3 47.3 51.4 32.9 31.8 33.9
1905 --—-----------—--— —---------- 48.7 47.3 47.6 50.6 31.3 29.6 33.1 1904----------—---———-—-—----- 47.6 46.2 4b.6 49.5 30.8 29.1 32.7 1903 -------—-—-----— 50.5 49.1 49.5 52.5 33.1 31.7 34.6 1902 --—---— --—--—-- —-—--------- 51.3 49.8 50.2 53.8 34.6 32.9 36.4 L901--—--—-—--—----—---— 49.1 47.6 48.0 51.0 33.7 32.2 35.3 1900 --—--—--—-----——--— -—----- 47.3 46.3 46.6 48.7 33.0 32.5 33.5
lExcludesdeathsof nonresidentsof the UnitedStates.2Figure8are revisedand, therefore,may differ from thosepublishedin volumesof ViCal Statisticsof the UnitedStates,Vol. 11, Mortality,PartA,
for 1976 and earlieryears; see TechnicalAppendix.30eathsbased on a 50-percentsample.4Figuresby color excludedata for residentsof New Jersey;see TechnicalAppendix.