Embed Size (px)
Citation preview
CENSUS OF INDIA 1951
VOL. VI PART IB
VITAL STATISTICS VVESrr BENGAL
1941-1950
By
A. MITRA of the Indian CiviL Service,
Superintendent of Census Operations, West Bengal,
and
P. G. CHOUDHURY, Assistant Direct01' of Health Services, Vital Statistics, West Benga1.
PUBLISHED BY THE MANAGER OF PUBLICATIONS, DELHI. PRINTED By TUE GOVERNMENT OF INDIA PRESS, CALCUTTA, INDIA.
1952,
OFFICE OF THE REGISTRAR GENERAL, INDIA, NEW DELHI.
nts in India from whom ldia Publications are available.
2011
Class No._
Book No._
Accession NO.
315,414
1951 Vit 5
20999
ilra..
RaUt nata;tu ...... ~T ------
Supdt., Ptg. & Stationery, U. P. Cniver' ;ty Book Agency (of Lahore). Post BOl{ No. 1'53· Wheeler & Co., Messrs. A. H.
ALWAR-Jaina General Stores, Bazaza Bazar.
AMBALA CANTT.English Book Depllt.
AMI:UTSAR-Peoples' Book Shop, Court Road. Sikh Publishing House Ltd., Court Road.
BA~ARAS--Banaras Book Corporation, eniversity Road, P. O. Lanka. St ldents Friends, University Gate. *Hinili pustak Agency.
BA~GALORE-Bock Emporium, Messrs. S. S., lI8, G. H. Extension
BasavlJ,ngudi P. O. Vicbara Sahitya Ltd., Balepet.
DAREILLY--Agarwal Bros., Bam Bazar. Sabitya Niketan, Pulkazi.
BARODA-Good Companions.
B1KANERGoyal & Co.
BOMBAY-Clifton &; Co., P. O. Box No. 6753, Sion, BombaY'22. Co-operators' Book DepOt, 9, Bakehouse Lane, Fort. Cnrrent Book House, H;Qrnby Road. Dutt & Co .• P. O. Box 'No. 0014, Parel. Lakhani Book Dep6t, BcimbaY-4· N:J.tional Information &; Publications Ltd., National House. New Book Co., Kitab Mahal, r88-90, Hornby Road. popular Book DeplJt, Grant Road. Supdt., Government Printing & Stationery, Queens RoaJ. Sydenham College Co-operative Stores, Ltd., 90, Hornby
Road. Taraporevala Sons & Co., Messrs. D. B. Th[ ;ker & Co., Ltd. Tripathi & Co., Mes~rs. N. 1\1 .. Princess Street, Kalvadebi
Road. Whco1er & Co., MeEsrs. A. H.
CALCtTTTA· ~h~tte.rjee & Co., 3, Ba~ha Ram Chattr,rjce Lo.ne. Hmdl P.usta.k Agency, 203, Harrison Road Hm?~ L1Drary, 09-A, Bala Ram De StreeL: ~ah1n & Co., Ltd., Messrs. S. K. Newman & Co., Ltd., Messrs. W. R.ECambray & Co., Lirl., Kent Hnuse, P-.l3 l\,1i 'io Hr ,.
xtenswn. ' , • Roy Chowdhury & Co., Messrs. N. M., 72 tlam<on I· Lt
~,-kar & Sons Ltd., Messrs. S. C 1./I/IC', Colle', S '. Standard Law Book Society 41 Beltala RrJad Bgh q .. P. O. ' , , owamput·
Thacker, Spink & Co. ([933) Ltd.
CHAMBA-(hamba Stationery ·Mal·
CHANDAUSI-Mr. "\fadan Mohan.
CUTTACK-Press Officer, Orissa Secretariat.
DEHRA DlN-Juga, Kishore & Co.
DELHI· -AtmB: R",m & Sons, Publishers, etc .• K,.shmere Gate. Bahn Brothers, 188, Lajpat Rai Markel Fe~eral Law Dep6t, Kashmere Gate. "Hmdi Pustak Agency. Im~erial Publishing Co., 3, Faiz Bazar. Darya Gani· In~l[1n Army Book Dep6t, 3, Da.rya Ganj. Jama & Bros. Me ,rs. J. M., Moti Gatl' M. Gulab Singh & Sons. Metropolitan Book Co., Delhi Gate. N. C. KansH & Co., Model Basti, Lane No. j.
New StatlOnery Hou,e, Subzimandi. Technical & Cornmt"l"ciaJ Book DepA" Students Park,
Kashmere Gate. ~ , Youngman & Co. (RE;gd.), Egerton Rnad.
FEROZEPLTR- -English Book DepOt.
GORAKHPFR-Halchal Sahityr Mandir.
GWALrOR-Jain & Bros., Messrs. M. B., Satafa Road. Mr. P. T. Sathe, Law Books Dealer.
HYDERABAD (DECCAN)-Eydl'rabad Book Dep6t.
INDORE--Students and Stu!,es, Sanyo@faganj.
J AIPllR CITY-Garg Book Co., Tripola. Bazar. Vani Mandir, Sawai :Mansingh Highway.
JAMMU (TAW!I' Krishna General Stores, Raghunath Bazar.
JHA~SI -l3hatia Book Dep6t, Sadar Bazar. English Book Depot.
JODHPUR-Kitab Ghar, Sojati Gate. Mr. Dwarkadas Rathi.
-----_.---------------"For Hind! Publications only.
[continued on inner sid, of tile back em) 'r

Preliminary remarks Errors in registration of vital statistics Birtlls Deaths Deaths by age, sex and communities Deaths classified by cause of death Death rate from child birth . Health Services of West Bengal Food production Roads Protected water supply Housing in crowded areas Diet
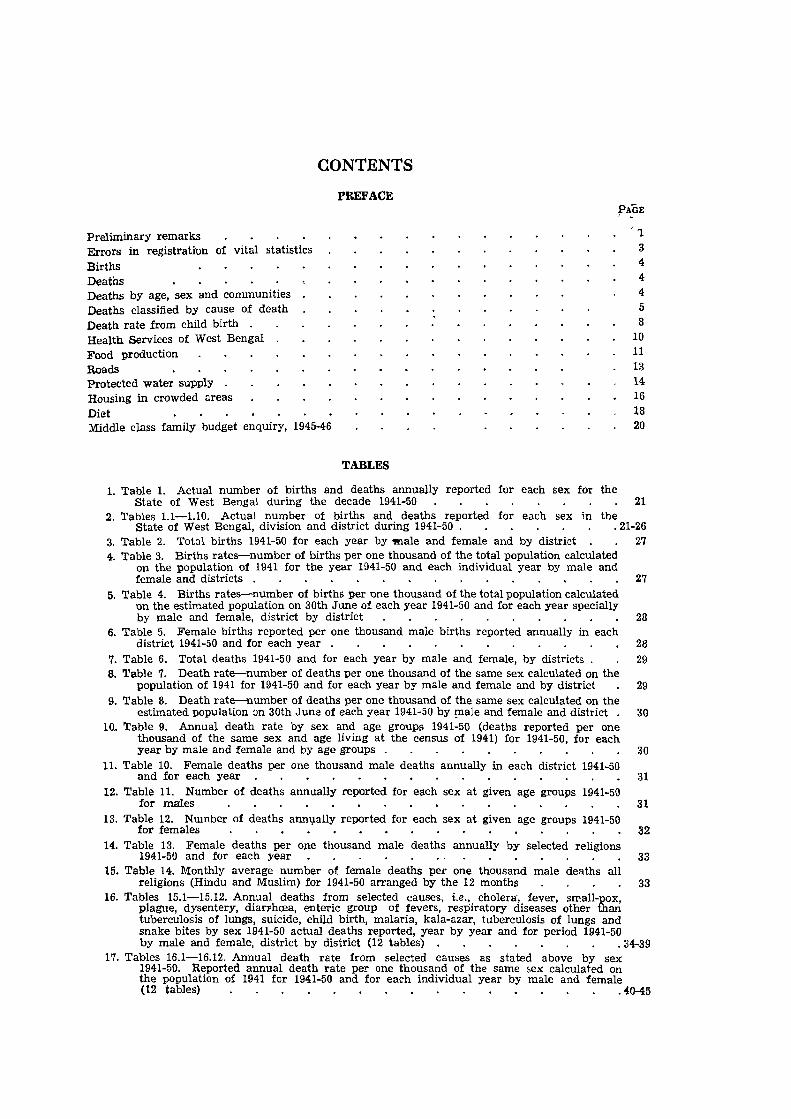
CONTENTS
PREFACE
Middle class family budget enquiry, 1945-46
TABLES
1. Table 1. Actual number of births and deaths annually reported for each sex for the
"1 3 4 4 4 5 8
10 11 13 14 16 18 20
State of West Bengal during the decade 1941-50 21 2. Tables 1.1-1.10. Actual number of births and deaths reported for each sex in the
State of West Bengal, division and district during 1941-50 . .21-26 3. Table 2. Total births 1941-50 for each year bY'!!lale and female and by district 27 4. Table 3. Births rates-number of births per one thousand of the total population calculated
on the population of 1941 for the year 1941-50 and each individual year by male and female and districts . 27
5. Table 4. Births rates-number of births per one thousand of the total population calculated on the estimated population on 30th June of each year 1941-50 and for each year speciallY by male and female, district by district 28
6. Table 5. Female births reported per one thousand male births reported annually in each district 1941-50 and for each year . 28
7. Table 6. Total deaths 1941-50 and for each year by male and female, by districts. 29 8. Table 7. Death rate-number of deaths per one thousand of the same sex calculated on the
population of 1941 for 1941-50 and for each year by male and female and by district 29 9. Table 8. Death rate-number of deaths per one thousand of the same sex calculated on the
estimated population :m 30th June of each year 1941-50 by !!lale and female and district. 30 10. Table 9. Annual death rate by sex and age groups 1941-50 (deaths reported per one
thousand of the same sex and age living at the census of 1941) for 1941-50, for each year by male and female and by age groups . 30
11. Table 10. Female deaths per one thousand male deaths annually in each district 1941-50 and for each year 31
12. Table 11. Number of deaths annually reported for each sex at given age groups 1941-50 for males 31
13. Table 12. Number of deaths ann1,lally reported for each sex at given age groups 1941-50 for females . . • . . . • . . . . . " 32
14. Table 13. Female deaths per one thousand male deaths annually by selected religions 1941-50 and for each year 33
15. Table 14. Monthly average number of female deaths per one thousand male deaths all religions (Hindu and Muslim) for 1941-50 arranged by the 12 months 33
16. Tables 15.1-15.12. Annual deaths from selected causes, i.e., cholera, fever, small-pox, plague, dysentery, diarFhcea, enteric group of fevers, respiratory diseases other than tuberculosis of lungs, suicide, child birth, malaria, kala-azar, tuberculosis of lungs and snake bites by sex 1941-50 actual deaths reported, year by year and for period 1941-50 by male and female, district by district (12 tables) . . 34-39
17. Tables 16.1-16.12. Annual death rate from selected causes as stated above by sex 1941-50. Reported annual death rate per one thousand of the same 5ex calculated on the population of 1941 for 1941-50 and for each individual year by male and female (12 tables) . 'H1-45
( ii )
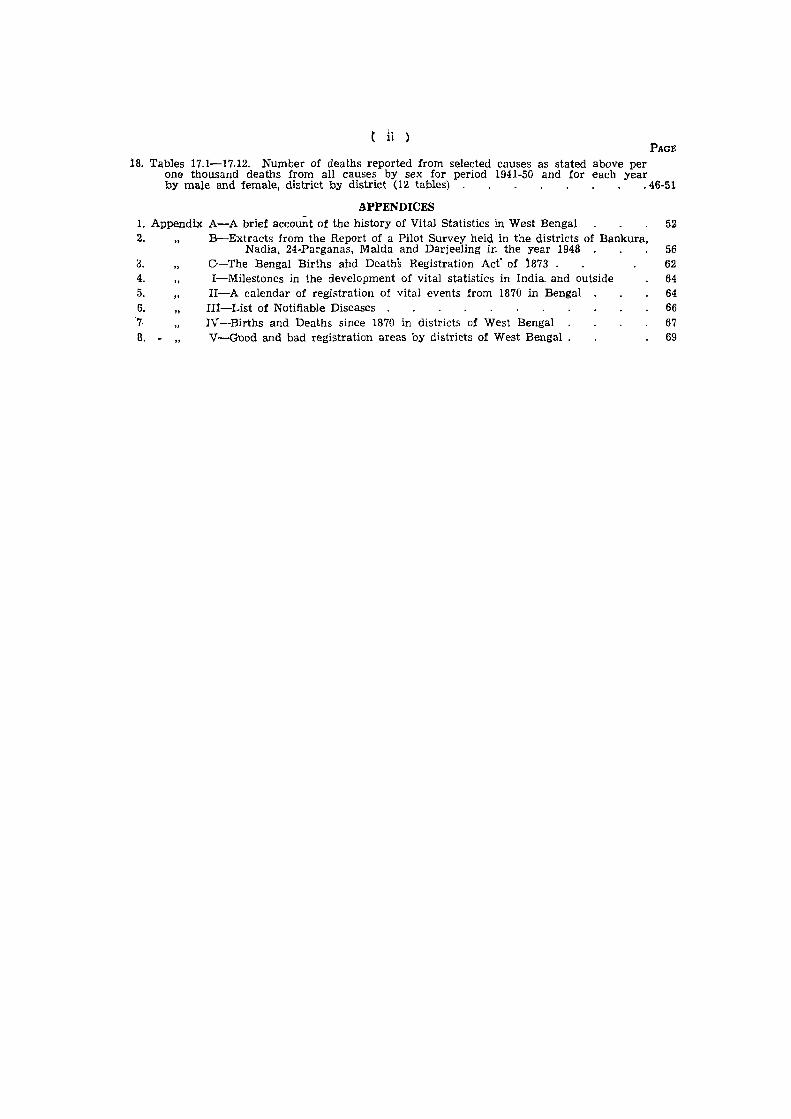
18. Tables 17.1-17.12. Number of deaths reported from selected causes as stated above per one thousand deaths from all causes by sex for period 1941-50 and for each year by male and female, district by district (12 tables) .46-51
APPENDICES 1. Appendix A-A brief account of the history of Vital Statistics in West Bengal 2. B-Extracts from the Report of a Pilot Survey held in the districts of Bankura,
:i. 4. 5. 6.
'7,
B. •
"
"
Nadia, 24-Parganas, MaIda and Darjeeling in the year 1948 C-The Bengal Births and Deaths Registration Act" of 1873 . I-Milestones in the development of vital statistics in India, and outside II-A calendar of registration of vital events from 1870 in Bengal III-List of Notifiable Diseases , IV --Births and Deaths since 1870 in districts of West Bengal V-Guod and bad registration areas by districts of West Bengal,
52
56 62 64 64 66 67 69
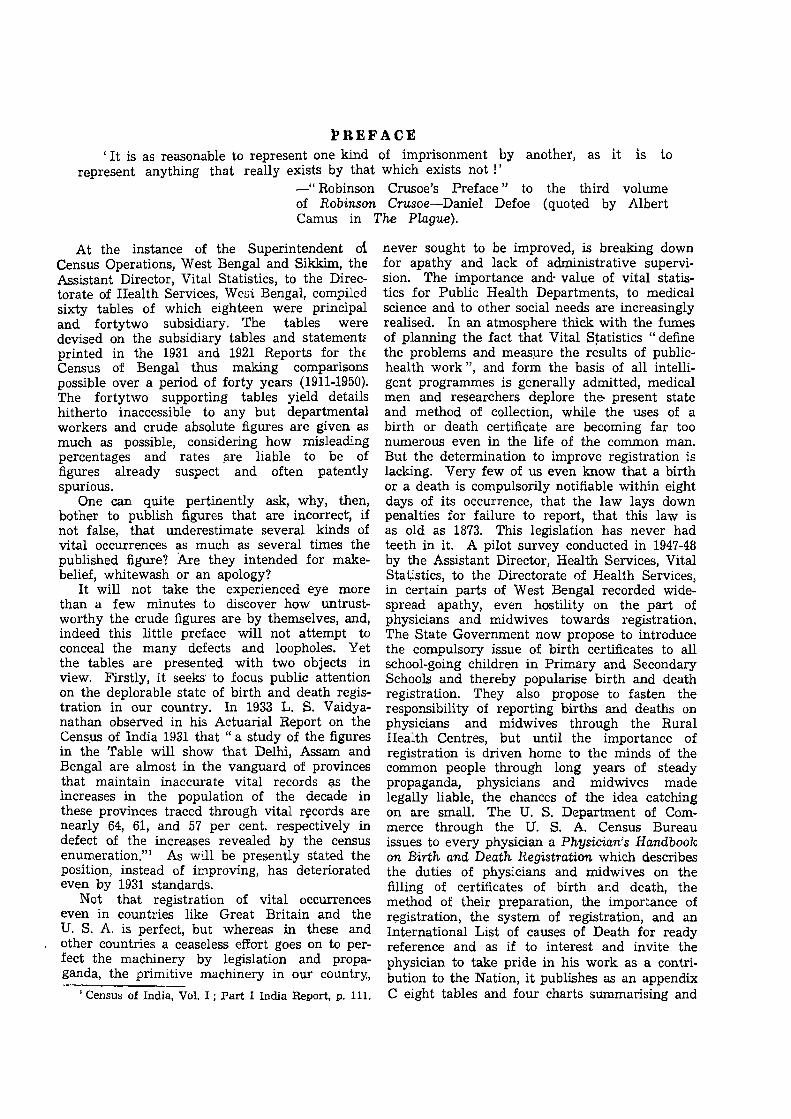
PREFACE (It is as reasonable to represent one kind of imprisonment by another, as it is to
represent anything that really exists by that which exists not !' _" Robinson Crusoe's Preface" to the third volume of Robinson Crusoe-Daniel Defoe (quoted by Albert Camus in The Plague).
At the instance of the Superintendent oi Census Operations, West Bengal and Sikkim, the Assistant Director, Vital Statistics, to the Directorate of Health Services, Wesi Bengal, compiled sixty tables of which eighteen were principal and fortytwo subsidiary. The tables were devised on the subsidiary tables and statement~ printed in the 1931 and 1921 Reports for tht Census of Bengal thus making comparisons possible over a period of forty years (1911-1950). The fortytwo supporting tables yield details hitherto inaccessible to any but departmental workers and crude absolute figures are given as much as possible, considering how misleading percentages and rates p're liable to be of figures already suspect and often patently spurious.
One can quite pertinently ask, why, then, bother to publish figures that are incorrect, if not false, that underestimate several kinds of vital occurrences as much as several times the published figure? Are they intended for makebelief, whitewash or an apology?
It will not take the experienced eye more than a few minutes to discover how untrustworthy the crude figures are by themselves, and, indeed this little preface will not attempt to conceal the many defects and loopholes. Yet the tables are presented with two objects in view. Firstly, it seeks' to focus public attention on the deplorable state of birth and death registration in our country. In 1933 L. S. Vaidyanathan observed in his Actuarial Report on the Census of India 1931 that" a study of the figures in the Table will show that Delhi, Assam and Bengal are almost in the vanguard of provinces that maintain inaccurate vital records gS the increases in the population of the decade in these provinces traced through vital rS!cords are nearly 64, 61, and 57 per cent. respectively in defect of the increases revealed by the census enumeration."l As will be presently stated the position, instead of improving, has deteriorated even by 1931 standards.
Not that registration of vital occurrences even in countries like Great Britain and the U. S. A. is perfect, but whereal> in these and other countries a ceaseless effort goes on to perfect the machinery by legislation and propaganda, the primitive machinery in our country.,
1 Census of India, Vol. I; Part I India Report, p. 111.
never sought to be improved, is breaking down for apathy and lack of administrative supervision. The importance and· value of vital statistics for Public Health Departments, to medical science and to other social needs are increasingly realised. In an atmosphere thick with the fumes of planning the fact that Vital S~atistics "define the problems and measure the results of publichealth work ", and form the basis of all intelligent programmes is generally admitted, medical men and researchers deplore the- present state and method of collection, while the uses of a birth or death certificate are becoming far too numerous even in the life of the common man. But the determination to improve registration is lacking. Very few of us even know that a birth or a death is compUlsorily notifiable within eight days of its occurrence, that the law lays down penalties for failure to report, that this law is as old as 1873. This legislation has never had teeth in it. A pilot survey conducted in 1947-48 by the Assistant Director, Health Services, Vital Statistics, to the Directorate of Health Services, in certain parts of West Bengal recorded widespread apathy, even hostility on the part of physicians and midwives towards registration. The State Government now propose to introduce the compulsory issue of birth certificates to all school-going children in Primary and Secondary Schools and thereby popularise birth and death registration. They also propose to fasten the responsibility of reporting births and deaths on physicians and midwives through the Rural Health Centres, but until the importance of registration is driven home to the minds of the common people through long years of steady propaganda, physicians and midwives made legally liable, the chances of the idea catching on are small. The U. S. Department of Commerce through the U. S. A. Census Bureau issues to every physician a Physician's Handbook on Birth and Death Registration which describes the duties of physicians and midwives on the filling of certificates of birth and death, the method of their preparation, the importance of r~gistration, the system of registration, and an International List of causes of Death for ready reference and as if to interest and invite the physician to take pride in his work as a contribution to the Nation, it publishes as an appendix C eight tables and four charts summarising and
showing the trends of vital occurrences in the U. S. A. First prepared in 1910 it was revised and published in 1939 and given to every practitioner.1 A similar booklet, and an imperative mood in the law's grammar respecting them, may induce physicians and midwives to take more active interest.
In the second place, the tables, while they are their own apology and although the cr:ude figures they record must be largely fictitious, yet present a picture consistent within their framework, a logic of reality in spite of the figures being unreal. It will be seen that underregistrations are fairly uniform and do not take sudden leaps and bounds from year to year, and the texture of reporting of vital occurrences by causes of death has the virtue of an even tension. In the majority of the tables few distinct trends are noticeable-this corresponds to general and expert experience-and insofar as they are so, they yield clues to the real state. This achieves the second object, that the tables exhibit ratios, tensions and relations that correspond to reality, while the data are unreal-and therefore do not deserve to be s~marily dismissed. They give food for thought.
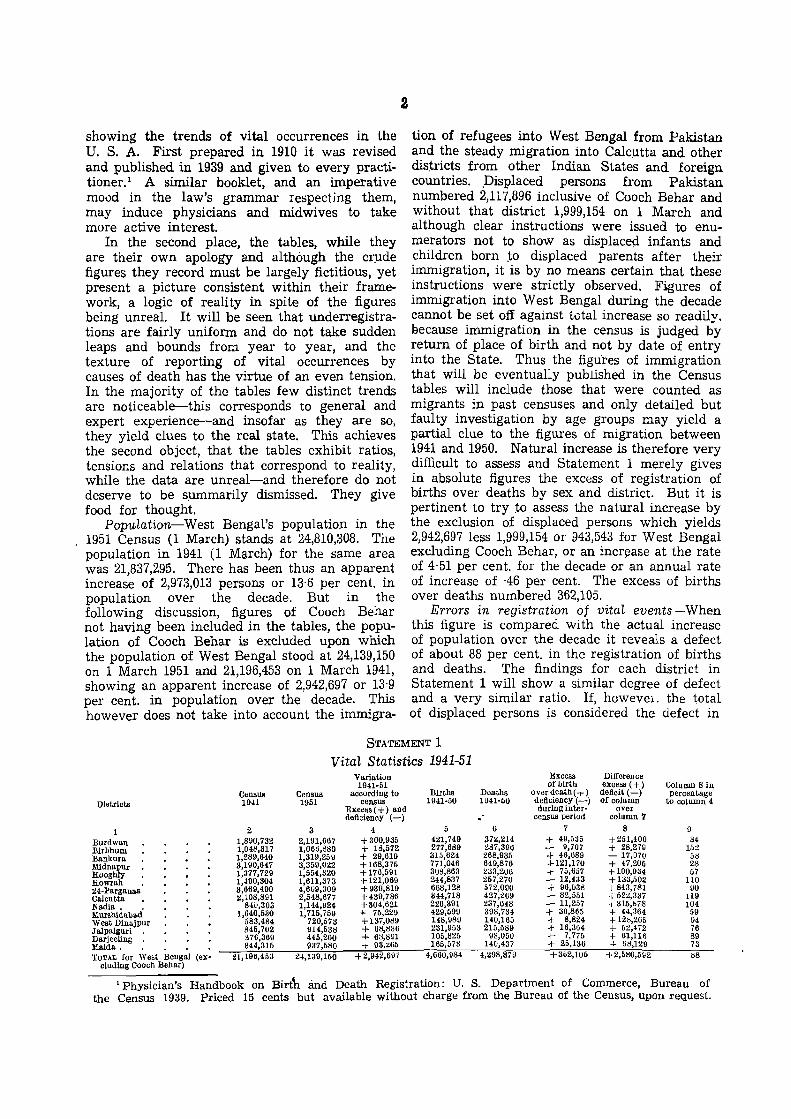
Population-West Bengal's population in the 1951 Census (1 March) stands at 24,810,308. The population in 1941 (1 March) for the same area was 21,837,295. There has been thus an apparent increase of 2,973,013 persons or 13-6 per cent. in population over the decade. But in the following discussion, figures of Coach Behar not having been included in the tables, the population of Coach Behar is excluded upon which the popUlation of West Bengal stood at 24,139,150 on 1 March 1951 and 21,196,453 on 1 March 1941, showing an apparent increase of 2,942,697 or 13'9 per cent. in population over the decade. This however does not take into account the immigra-
2
tion of refugees into West Bengal from Pakistan and the steady migration into Calcutta and other districts from other Indian States and foreign countries. _Displaced persons from Pakistan numbered 2,11'1,896 inclusive of Cooch Behar and without that district 1,999,154 on 1 March and although clear instructions were issued to enumerators not to show as displace~ infants and children born to displaced parents after their immigration, it is by no means certain that these instructions were strictly observed. Figures of immigration into West Bengal during the decade cannot be set off against total increase so readily. Because immigration in the census is judged by return of place of birth and not by date of entry into the State. Thus the figures of immigration that will be eventually published in the Census tables will inclu~e those that were counted as migrants in past censuses and only detailed but faulty investigation by age groups may yield a partial clue to the figures of migration between 1941 and 1950. Natural increase is therefore very difficult to asseSs and Statement 1 merely gives in absolute figures the exct!ss of registration of births over deaths by sex and district. But it is pertinent to try to assess the natural increase by the exclusion of displaced persons which yields 2,942,697 less 1,999,154 or 943,543 for West Bengal excluding Coach Behar, or an incr~ase at the rate of 4'51 per cent. for the decade or an annual rate of increase of ·46 per cent. The excess of births over deaths numbered 362,105.
Errors in registration oj vital events-When this figure is compared with the actual increase of population over the decade it reveals a defect of about 88 per cent. in the registration of births and deaths. The findings for each district in Statement 1 will show a similar degree of defect and a very similar ratio. If, however. the total of displaced persons js considered the defect in
STATEMENT 1
Vital Statistics 1941-51 Variation Excess Difference 1941·51 of uirth excess (+) Column 8 in
Celllllll! Census according to Births Deaths Over death ( ;- ) deficit (-) percentage DIstricts 1941 1951 census 1941·50 H41·50 deficiency (-) ofcoJumn to column 4
Excess ( +) and during Intsr· over deficiency (-) census period column '1
1 2 3 4 5 6 7 8 9
Burdwan 1.890,732 2,191,667 +300,935 421,749 Jl7~,214 + 49,535 +2.1,400 84
Birbhum 1,048.317 1,066,089 + 18,572 277,689 287,396 - 9,707 + 28,279 152 Bankura 1,289,640 1,319,25V + 29,619 315,624 268,935 + 46,689 - 17,070 5!j Mldnapur 3,190,647 3,359,022 +168,375 771,046 649,876 -1-121,170 + 47,205 28 Hooghly 1.377,729 1,554,320 +176,591 308,863 ~33,206 oj- 75,657 +100,934 57 Howrah 1,490,304 1,611,373 +121,069 244,837 257,270 - 12,433 +133,502 110 24-Parganas 3,669,490 4,6U9,300 +939,819 668,128 572,090 -i- 96,U38 +843,781 90 Calcutta 2,108,891 2,548,677 +439.786 344,718 427,269 - 82,551 +52~,337 119 Nadia. 84U,303 1,144,~24 +304,621 226,391 237,648 - 11,257 -r315,b78 104 Murshldab..d 1,640,530 1,715,759 +- 75,22~ 429,599 398,734 + 30,865 + 44,364 59 West Dinajpur 583,484 720,573 + 137,089 148,989 140,165 + 8,824 + 12l:>,265 94 JaJpaiguri . 846,702 Ul4,531l + 68,836 231,953 215,589 + 16,364 + 52,472 76 Darjeeling 376,369 445,260 -I- 63,891 105,825 98,050 +- 7,775 + 61,116 89 Maida. 844,315 937,580 ;- 93,~65 165,573 140,437 + 25,136 ... 68,129 73
TOTAL for We.t Bengal (ex· eluding Coach Behar)
21,196,453 201,139,150 +2,942,697 4,660,984 4,298,879 +362,105 +2,580,5~2 88
1 Physician's Handbook on Birtb and Death Registration: U. S. Department of Commerce, Bureau of the Census 1939. Priced 15 cents but available without charge from the Bureau of the Census, upon request.
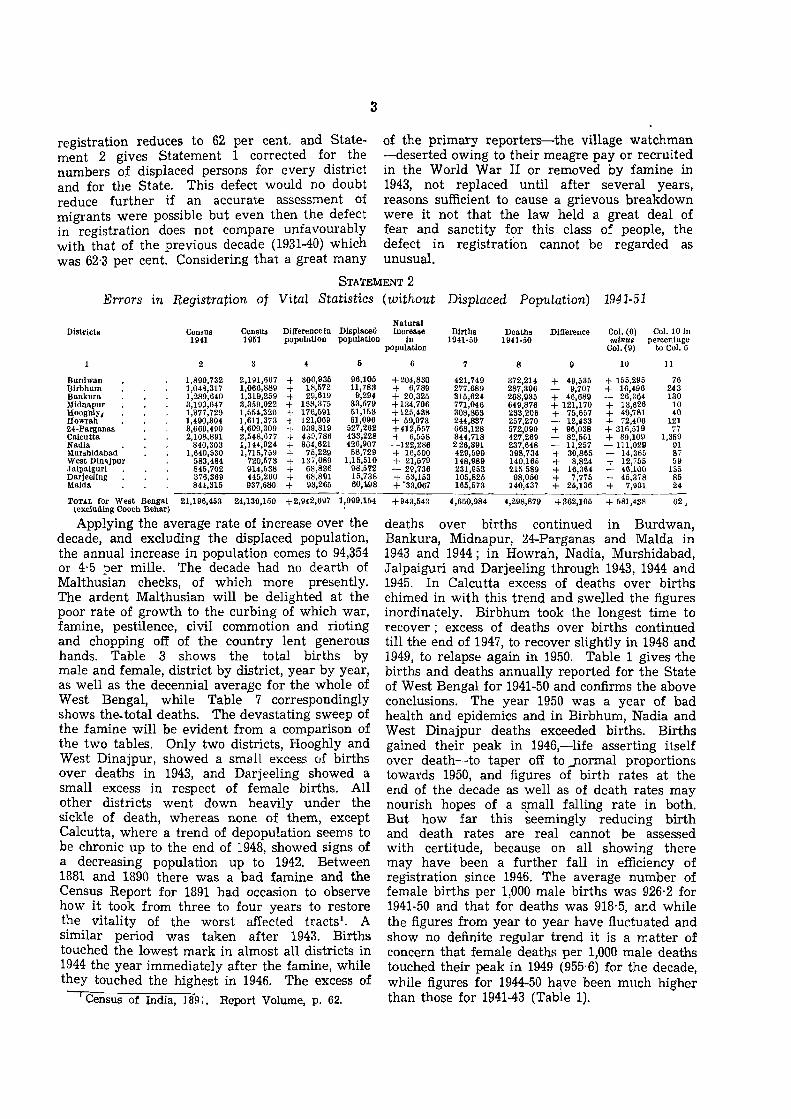
registration reduces to 62 per cent. and State- of the primary reporters-the village watchman ment 2 gives Statement 1 corrected for the -deserted owing to their meagre payor recruited numbers of displaced persons for every district in the World War II or removed by famine in and for the State. This defect would no doubt 1943, not replaced until after several years, reduce further if an accurate assessment of reasons sufficient to cause a grievous breakdown migrants were possible but even then the defect were it not that the law held a great deal of in registration does not compare unfavourably fear and sanctity for this class of people, the with that of the previous decade (1931-40) which defect in registration cannot be regarded as was 62·3 per cent. Considering that a great many unusual.
STATEMENT 2 Errors in Registration of Vital Statistics (without Displaced Population) 1941·51
Natural District. Census
1941 Census Difference III Dlsplacc(] Increase Births Deatbs Difference Col. (6) Col. 10 in 1951 population population in 1941·50 1941-50 minuB percentage
2 4 &
Burdw8n 1,890,732 2,191,667 + 300,935 96,105 B1rbhum 1,048,317 1,066,889 + 18,572 11,783 Bankura 1,289,640 1,319,259 + 29,619 9,294 Midnapur 3,190,647 3,359,022 + It!S,375 33,579 Hoogbly, 1,377,729 1,554,320 + 176,691 51,153 lIowrah 1,490,304 1,611,373 + 121,069 61,096 24·Parganas 3,669,490 4,609,309 + 939,819 527,262 Calcutta 2,108,891 2,548,677 + 45Q,786 433,228 Nadia 840,303 1,H4,924 + S04,621 426,907 Murshidabad 1,640,530 1,71f>,75~ + 75,229 58,729 West Dlnajpur 583,484 720,573 + 137,089 1,1&,510 ,1 alpaiguri 845,702 914,638 + 68,836 98,572 Darjeeling 376,369 445,260 + 68,8Ul 15,738 Maida 8H,315 937,680 + 93,265 60,1098
TOTAL for West Bengal 21,196,453 24,139,150 +2,942,697 1,999,154 (excluding Cooch Behar)
Applying the average rate of increase over the decade, and excluding the displaced population, the annual increase in population comes to 94,354 or 4'5 per mille. The decade had no de-arth of Malthusian cheCks, of which more presently. The ardent Malthusian will be delighted at the poor rate of growth to the curbing of which war, famine, pestilence, civil commotion and rioting and chopping off of the country lent generous hands. Table 3 shows the total births by male and female, district by district, year by year, as well as the decennial average for the whole of West Bengal, while Table 7 correspondingly shows the. total deaths. The devastating sweep of the famine will be evident from a comparison of the two tables. Only two districts, Hooghly and West Dinajpur, showed a small excess of births over deaths in 1943, and Darjeeling showed a small excess in respect of female births. All other districts went down heavily under the sickle of death, whereas none of them, except Calcutta, where a trend of depopUlation seems to be chronic up to the end of 1948, showed signs of a decreasing popUlation up to 1942. Between 1881 and 1890 there was a bad famine and the Census Report for 1891 had occasion to observe how it took from three to four years to restore the vitality of the worst affected tracts1
• A similar period was taken after 1943. Births touched the lowest mark in almost all districts in 1944 the year immediately after the famine, while they touched the highest in 1946. The excess of
I Census of lndia, ] 89 J. Report Volume, p, 62.
population
6
+204,830 + 6,789 + 20,325 + 134,796 +125,438 + 59,973 +412,557 + 6,558 -122,286 + 16,500 + 21,579 - 29,736 + 53,153 + "33,067
+943,543
7
421,749 277,689 315,624 771,046 308,863 244,837 668,128 344,718 226,391 429,599 148,989 231,953 105,825 165,673
4,660,984
8
372,214 287,396 268,935 649,876 233,206 257,270 572,090 427,269 237,648 398,734 140,165 215589 98,050
140,437
4,298,879
9
+ 49,635 - 9,707 + 46,689 + 121,170 + 75,657 - 12,433 + 96,038 - 82,561 - 11,257 + 30,865 + 8,824 + 16,364 + 7,775 + 25,136
+362,105
Col. (9) to Col. 6
10 J1
+ 155,295 76 + 16,496 243 - 26,364 130 + 13,626 10 + 49,781 40 .... 72,406 121 + 316,519 ,7 + 89,109 1,359 - 111,029 91 - 14,365 87 + 12,755 59 - 46,100 155 + 45,378 85 + 7,931 24
+ 581,438 62,
deaths over births continued in Burdwan, Bankura, Midnapur, 24-Parganas and MaIda in 1943 and 1944; in Howrah, Nadia, Murshidabad, Jalpaiguri and Darjeeling through 1943, 1944 and 1945. In Calcutta excess of deaths over births chimed in with this trend and swelled the figures inordinately. Birbhum took the longest time to recover; excess of deaths over births continued till the end of 1947, to recover slightly in 1948 and 1949, to relapse again in 1950, Table 1 gives -the births and deaths annually reported for the State of West Bengal for 1941-50 and confirms the above conclusions. The year 1950 was a year of bad health and epidemics and in Birbhum, Nadia and West Dinajpur deaths exceeded births. Births gained their peak in 1946,-life asserting itself over death-to taper off to _normal proportions towards 1950, and figures of birth rates at the end of the decade as well as of death rates may nourish hopes of a s,mall falling rate in both. But how far this seemingly reducing birth and death rates are real cannot be assessed with certitude, because on all showing there may have been a further fall in efficiency of registration since 1946. The average number of female births per 1,000 male births was 926·2 for 1941·50 and that for deaths was 918'5, and while the figures from year to year have fluctuated and show no definite regular trend it is a matter of concern that female deaths per 1,000 male deaths touched their peak in 1949 (955'6) for the decade, while figures for 1944-50 h~ve been much higher than those for 1941-43 (Table 1).
Births-The distribution of births by sex, year and district during 1941-50 is shown in Table 3 while the birth rates are shown in Tables 4, 5 and 6. About 466 thousands of births per year were the normal experience for the State, 242 thousands being males and 224 thousands females, thus yielding a birth rate of 24·0 per mille on an average in the middle of each year, of which 12·3 per mille were males and 11·7 were females. There were more males born than females and the rate, 926·2 female births per 1,000 male births, for 1941-50' represents more or less the rate for the individual intermediate years. The birth rate starting at 25'5 in 1941 touched its lowest in 1944 at 17·9 as a result of the Famine, climbed again to 24·7 in 1946 to fall off steadily to reach 20'7 per mille in 1950. Before 1943 a birth rate of over 30 per mille of population was recorded by the districts of Birbhum (34'2 in 1941 and 34·8 in 1942), Nadia (32'6 in 1941 and 33·8 in 1942), Murshidabad (34'5 in 1941 and 33·0 in 1942), J alpaiguri (30'7 in 1941 and 30'9 in 1942) and Darjeeling (30'1 in 1941), and a birth rate below 20 per mille was noticed only in the districts of Howrah (19'7 in 1941 and 15·7 in 1942), Calcutta (13'9 in 1941 and 9·4 in 1942) and MaIda (17'9 in 1941 and 14·0 in 1942). The birth rate immediately after the Famine (1944) was lower than that in 1941 in almost all districts, and the proportionate fall in the birth rate was maximum in the district of Murshidabad (17'9) to be followed by Nadia (19'3), Birbhum (20'6), Darjeeling (20'5) and Jalpaiguri (21,2). Thus the districts where birth rates were the highest in 1941-42 showed the greatest relative fall in birth rate in 1944, decidedly a greater rate of fall than those districts which showed a smaller birth rate in 1941-42. Calcutta has been showing a steadily climbing birth rate since 1943, one reason for it possibly being greater efficiency in registration.
Deaths-Deaths by year, district and sex and averages for the decade are given in Tables 7, 8 and 9. About 429 tliousand deaths per year were the normal experience for the State, 224 thousand being males and 205 thousand females, thus yielding a death rate of 20·3 per mille on an average in the middle of each year. The average specific death rate for males for 1941-50 was 19·4 per mille and for females 21·2 per mille. The specific death rate (number of deaths per ~,(JOO of the same sex) for females was found to be greater than that for males for eve:r-y year of the decade in the districts of Burdwan. Hooghly (except in 1943), Howrah (except in 1943), 24-Parganas (except in 1943), Calcutta, Nadia (except in 1941, 1942 and 1945). Jalpaiguri and Darjeeling. The exceptions for 1943 in Hooghly, Howrah and 24-Parganas may well have bean due to defective registration of female deaths in the Famine year.
The remaining districts do not show any noticeable preponderance uf male deaths per 1,000 males over female deaths per 1,000 fer.1ales, but just a narrow often doubtful margin. The preponderance of female deaths per mille females over male deaths per mille males has been less than 2 in most districts and years but in Calcutta was as much as 20·2 in 1950, 18·6 in 1943, 18 in 1948, 16·1 in 1944, 15·4 in 1949, 14·4 in 1947, 12'1 in 1945, 11'5 in 1941, 11'1 in 1946, 5'5 in 1942 and 14·3 as the annual average for the dE:cade (calculated on the estimated population at the middle of each year). This is 86 per cent. more than the specific death rate for males in Calcutta and the reason should be investigated.
The maximum deaths were registered in Burdwan, Hooghly, Howrah, Calcutta, MaIda, West Dinajpur and Jalpaiguri in 1944, the year following the famine. It is possible that deaths in these districts had been greater in 1943, and went unregistered. Of these, none except Burdwan and West Dinajpur was a surplus ricegrowing district. Deaths touched their maximum in 1943 in the other districts (Birbhum, Bankura, Midnapur, 24-Parganas, Nadia, and Murshidabad) all of which were either surplus or self-sufficient in food-grains in normal times. Before 1943, death rates above 25 per mille were recorded in the districts of Nadia and Darjeeling, a death rate above 20 but below 25 per mille in Birbhum, Bankura, Murshidabad and Jalpaiguri, a rate below 20 in the remaining districts, the lowest being MaIda. In 1943 all districts showed very high death rates, Nadia recording the maximum, followed by Birbhum and Murshidabad where the death rate was around 30 per mille. The rise in death rates between 1941 and 1943 was maximum in the Nadia district and next in Murshidabad where, it is pertinent to llote, birth rates were the highest before 1943. Following the trend for birth rates, it may be observed that those districts in which the death rate was high in 1941-42 showed a proportionately greater rise in its rate in 1943 than other districts where the death rate was comparatively low before 1943.
Deaths by age and sex and communitiesThese are given in Tables 8-15. The force of mortality was found to be greater among females than among' males, although the actual number of male deaths was more than female deaths. This apparent contradiction may be due to two causes: the preponderance of males over females in the State and the steady immigration of a large male population. The greater mortality among females must be a big factor in the steady decline of the female population of the State, where the gap between the number of males and females has been steadily widening since 1901. The ratio of female deaths to 1,000 male deaths
was an annual average of 918'5 for the decade, but as has already been noted, female deaths per 1,000 male deaths have been greater in the years 1944-50 than in 1941-43. The greater mortality among females than among males,-a circumstance contrary to the expectations of a civilised country-is itself a grave enough reflexion on the state of its public health and the fact that it has been worse in the past three years than previously probably indicates how inadequate existing medical and public health measures have been to cope with a sudden influx of over 2'1 million refugees.
It may be mentioned in passing that in 1943 female deaths exceeded male deaths only in Burdwan, Calcutta, Nadia, Jalpaiguri, West Dinajpur and Darjeeling. But in 1944 female deaths exceeded male deaths in these other districts as well as in those of 1943: Birbhum, Hooghly, Howrah and 24-Parganas. In Hooghly, Howrah and Calcutta undernourishment and unemployment may have removed many women who were residents as well as those who had gathered from other districts.
The specific rate of female deaths during the decade was higher than that of male deaths in the age groups of 1-5, 5-10, 15-40 and 60 and above, while the specific death rate for males were higher than that for females in the age groups 0-1, 10-15 and 40-60 years. This more or less corresponds to a universal trend but the differences are far more ac.ute than in western countries and absolute figures, even as they are, are depressing. The reasons for the higher specific mortality among females in the agegroups 1-5, 5-10, and 15-40, and 60 and above, not only as an annual average for the decade but for each year, may be found in the comparative neglect to which female children below 10 and women above 60 years of age are subject, greater risks attendant on women in the reproductive stage 15-40. Women enjoy a lower specific mortality than men only in the age groups 10-15 and 40-60, in the former because nature endows them with greater sturdiness in that period as is universally observed; in the latter because they have gone through the reproductive stage and are left in relative peace and comfort. Also because the hazards of life are greater for males in the age group 40-60 which are increased by the fate of the vast majority of males at these ages finding themselves the only breadwinners of their families and therefore bearing all the attendant strain and anxiety. Thus, these two groups do not indicate any exceptional social attention or medical aid, and the overall picture contributes to a steady decline of females.
The specific death rates according to ages show the normal U shaped curve. The bottom of
1 CENSUS
5
the U is at the age group 10-15 years, the death rate for infants between 0 and 1 being 172'1 for males and 156·0 for females, the death rate for the age groups of 60 years and above being 84'6 for males and 94·4 for females. Table 9 will show that infants and children up to 5 years of age fell the easiest victims to the 1943 famine, and next came persons aged above 30 years. Persons between the ages of 5 and 30 years suffered least and fought the Famine best.
Tables 10-12 illustrate and confirm the above remarks in detail. The districts of Howrah, 24-Parganas and Calcutta where the hazards of life for males are greater than those for females showed a greater number of male deaths than females, although the picture for specific mortality rates for males and females are necessarily different. The reproduction age takes a heavy toll of women, 1,246 female deaths for every 1,000 male deaths in age group 15-20, and 1,296 female deaths per 1,000 male deaths in the age group 20-30. The proportion of female deaths to 1,000 male deaths was an annual average 01 918'5 for the decade, but as will be evident from this discussion this average conceals a number of gaping wounds which cry out for vigorous social and public health measures. The difference between male and female deaths greatly widened in 1943, the famine year, which can be partly explained by the defect in registration of female deaths at this period. But this difference narrowed down in later years. In Birbhum female deaths per 1,000 male deaths exceeded 1,000 in 1944 (1,035'2), 1945 (1,028'1), 1946 (1,012'9) and 1949 (1,015'7), and the same happened in Midnapur in 1948 (1,000'8) and 1949 (1,017'0) and it occurred also in Nadia in 1949 (1,017'0).
Tables 13 and 14 will show that female deaths per 1,000 male deaths are lowest among Christians (851'6 for the decade) and highest among Hindus (922·5) and intermediate for Muslims (896,3). An appreciable seasonal variation in the monthly averages of female deaths per 1,000 male deaths for all religions during the decade is noticeable in Table 15, the highest rate being touched in November and the lowest in June. In November, disease and confinement strike jointly their hardest while in June the comparative slackness of disease and paucity of confinements lower the rates. The female death rate per 1,00Q male deaths for Hindus reaches its peak in November (970'4) while that for Muslims touches 979'9; the trough is reached in June, Hindus standing at 894'6 and Muslims at 841'5.
Deaths classified by causes of death-This is where, next to overall defective registration of births and deaths, we find registration most at fault. Whereas even in 1939 the Bureau of the
2
Census of the U. S. A. claimed that " about ninetenths of all births and an even higher proportion of deaths which occur yearly in the United States are attended by physicians ", it would not perhaps be an exaggeration to assert that about nine-tenths of all births and an even higher proportion of deaths in our country are not attended by qualified or unqualified midwives or physicians. Consequently causes of still birth (or an accurate record of it), death of infants at birth, maternal and infant mortality have never been properly investigated in our land except for small samples, and diseases causing death at ages over one year go improperly or fancifully recorded. It will presently be seen that in those districts where medical attention is more easily procurable deaths due to "Fever" have showea a steady decline. Causes of death are left to the fancy of the illiterate village watchman. Even in rural or town hospitals the clinical and therapeutic standards are such as would put under doubt quite a proportion of the declared causes of death. Against such a background it
i;; pleasant to note the even texture of the figures for each district over the decade; they even display trends. And be it noted that the figures are all crude figures and no effort has been made to graduate them.
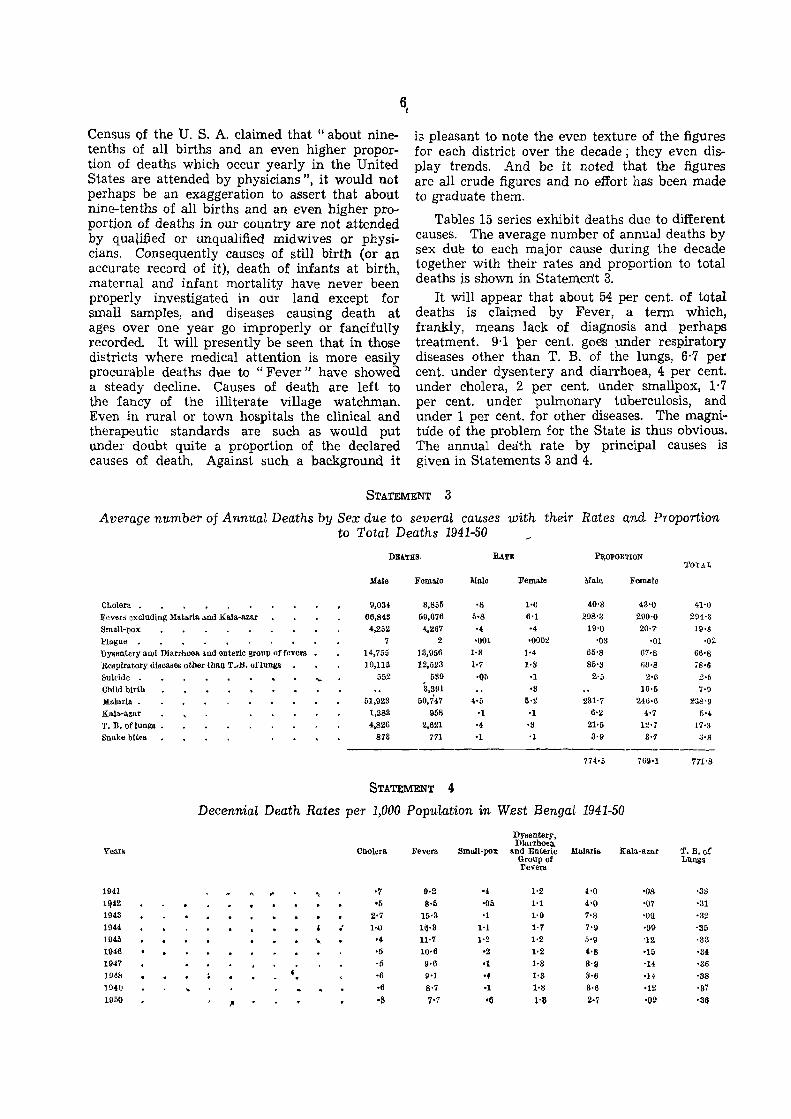
Tables 15 series exhibit deaths due to different causes. The average number of annual deaths by sex du~ to each major cause during the decade together with their rates and proportion to total deaths is shown in Statement 3.
It will appear that about 54 per cent. of total deaths is cfaimed by Fever, a term which, frankly, means lack of diagnosis and perhaps treatment. 9'1 per cent. goe'S under respiratory diseases other than T. B. of the lungs, 6·7 per cent. under dysentery and diarrhoea, 4 per cent. under cholera, 2 per cent. under smallpox, 1'7 per cent. under pulmonary tuberculosis, and under 1 per cent. for other diseases. The magnitude of the problem for the State is thus obvious. The annual dea'th rate by principal causes is given in Statements 3 and 4.
STATEMENT 3
Average number of Annual Deaths by Sex due to several causes with their Rates and Proportion to Total Deaths 1941-50
DEATHS. RATE PR,OPOl!.l!ION TOTAL
Male Female Male Female Male Female
Cholera 9,034 8.855 '8 1'0 40'S 43'0 41'0
Fevers excluding Malaria and Kala·azar 66,848 59,676 5·8 6'1 298'3 290'0 294'3
SmaU-pox 4,252 4.267 ., '4 19'0 20·7' 19'8
Plague 7 2 '001 'OOO~ '03 '01 ·0£ Dysentery and Diarrhoea and enteric group of fevers 14,755 13,956 1·3 1'4 65'8 67'8 66'8 Respiratory diseases other than T ,LB. oflungs 19,116 12,523 1'7 1·3 85-s 60'8 78'6
Suicide '" 552 539 -QI> ·1 2'5 2'6 2'D
Child birth 3.391 '3 16'5 j'9
Malaria. 51,923 50,747 .·5 5·2 231'7 246·(1 238'9
Kala-azar 1.383 958 ·1 '1 6'2 4'7 5-4
T. 11. oflungs • 4,826 2,621 ·4 ·3 21'5 12'7 17'3 Snake bites 873 771 '1 '1 8'9 3'7 :J.g
774'5 769'1 771-S
STATEMENT 4
Decennial Death Rates per 1,000 PopuLation in West Bengal 1941-50
DYsentery. Diarrhoea.
Years Cholera Fevers Small·polt and Enteric Malaria Kala-azar 1'. B. of' Group of L\Ulga Fevers
1941 ... '7 9·2 04 1'2 4'0 '08 ·38
11142 '5 8·5 'OS 1'1 4'0 '07 '31
1943 2·7 15·3 -I 1·9 7'8 '01) "32 1944 I 1'.0 1~·3 1·1 1·7 7'9 '09 '35 194.5 ' .. '4 11·7 1·2 1·2 5'9 '12 ·33 1948 '5 10·6 '2 1·2 4·S '15 ·34 1947 ·6 9·6 ·1 1·3 3·g '14 '36 194& I ·6 9'1 '4 1·3 3'6 .)4 '88 0 194~ ·6 8'7 '1 1·3 3'6 '12 'S7 1950 ,. oS 7'7 ·6 1'8 2-7 ·(19 '36
Except for two understandably big leaps (in 1943, the famine year, and 1944, the aftermath) cholera has remained almost parallel to the base at the mean rate of ·6 per mille. So has smallpox at ·2 with two big leaps in 1944 and 1945 (the years following the famine) and two smaller leaps in 1948 and 1950 (the years of heavy influx of displaced persons). So have dysentery and diarrhoea remained steady at the mean rate of 1·3 (except for 1·9 in 1943 and 1·7 in 1944) and Kala-azar at the mean rate of ·14 per mille. Malaria shows a slight decline from 1942 with peaks in 1943-46. T. B. of the lungs shows an upwru-d trend during the decade.
The districts of Howrah, 24-Parganas, Calcutta, and Nadia recorded an average annual rate of deaths due to cholera of about 1 per mille, while :Surdwan, Birbhum, Bankura, Midnapur, Hooghly, Murshidabad, MaIda and West Dinajpur showed rates ranging between ·5 and 1 per mille. Jalpaiguri showed a mean rate below ·5 per mille and Darjeeling, the lowest mean rate of ·1 per mille during the decade. The low rate in J alpaiguri may be ascribed largely to the improved and protected watersupply in the majority of tea gardens which cover the district, and that in Darjeeling to a similar reason and the temperate climate. Nowhere else do the rates show the beneficent action of preventive inoculation or improved water-supply.
V cry similar is the picture presented by smallpox. I t reached peaks in 1944 and 1945 and again in 1950 for the State as a whole while individual districts suffered in no fixed pattern. Calcutta and Howrah showed the maximum death rate from smallpox (where however public health staff per capita are the largest), while Jalpaiguri, Darjeeling and MaIda recorded the minimum. Dysentery and diarrhoea were prevalent in all districts together with respiratory diseases. There is no marked trend of decline and therefore no sign that the scourge is under control.
The worst districts for Fever were Birbhum, Nadia and Murshidabad while Hooghly, Howrah, 24-Parganas and Calcutta were better off. It should be noted that Birbhum, Nadia and Murshidabad constitute the central portion of the State where medical and public health conditions are poor. This may account for a large number of deaths having been returned as Fever. By contrast there is a larger proportion of qualified and unqualified medical practice in Hooghly, Howrah, 24-Parganas and Calcutta-which are predominantly urban;-mention of the causes of death is naturally more specific in these districts thus extricating a large '!lumber of deaths from the anonymity of Fever.
The decline in Malaria may be ascribed in a large measure to the intense drive of mepacrine,
atabrine, pal:ud.rine and. quinine that followed the 1943 famine and continued unabated till last year. Mention also must be made of the antimosquito campaign conducted by the American, British and Indian Armies during World War II which made large tracts of the country pleasantly habitable and set up new standards of cleanliness and public health (for instance, Raja-bhatkhawa and the Duars of J alpaiguri, Salbani and Khargpur in Midnapur, Ramporehat in Birbhum, Dhubulia and Ranaghat in Nadia, Panagarh in Burdwan and a number of places in 24-Parganas). The D.D.T. spraying conducted by the State in 1950 produced notable results and there is a new hope everywhere that Malaria is not inevitable. Malaria was worst in Birbhum, Nadia and Murshidabad, where the annual death rate was more than 9 per mille. Calcutta showed the lowest rate.
There is a very small but steady and noticeable decline in deaths from Respiratory Diseases other than T. B. of the Lungs in all districts except MaIda and West Dinajpur, where they are surprisingly enough on the increase. This decline may be due to defective registration or to the increased efficiency of dispensaries and the large number of free beds in A. G., F. R. E., and general hospitals and to a more general use of sulpha drugs and penicillin among physicians. No marked trend is noticeable in suicides as only Howrah and 24-Parganas show large figures. Calcutta, by reason of her being a city, ought to show a larger number of suicides but they are probably masked by other declarations. Deaths from snake-bite are almost uniform over the State on the basis of number of persons per square mile and were at a level of ·1 per mille, not by any means a small figure. Deaths from
'snake-bite were lowest in Howrah, Calcutta, Jalpaiguri and Darjeeling.
Happily, plague was confined only to Calcutta and Howrah ; in Calcutta it flared up in 1949 but was quickly brought under control, and public health measures were very efficient in this direction.
Kala-azar was conspicuously low in Birbhum, Bankura, Midnapur and Howrah. West Dinajpur was notorious while Darjeeling was bad. Deaths from T. B. of the Lungs were highest in Calcutta, the minimum and maximum deaths per 1,000 deaths from all causes, being 47·2 (1943) and 82·8 (1942) for males respectively, and 50·5 (1943) and 103·6 (1942) for females respectively, the annual averages standing at 58·6 for males and 65·4 per mille deaths for femaJes. Next in death from T. B. of the Lungs comes Darjeeling with annual averages of 53·2 for males and 51·6 per mille deaths for females, while the minimum and maximum for males were 42·0 (1946)
2A
and 70·2 (1949) and those for females were 43'1 (1941) and 65·2 (1949). In other districts the intensity varied from '1 to '6 per mille dJlring the decade.
A point to note about deaths from Kala-azar and T. B. of the Lungs is the very noticeably consistent small figures of female deaths from these causes in comparison to male deaths. This can only be explained by the comparatively poor diagnosis of these diseases amongst females than males. That this is so is amply supported by figures of deaths from these two causes in Calcutta, where because facilities of treatment for males and females qre almost even, the rate of deaths from T. B. of the lungs of fem~les per 1,000 deaths from all causes exceeds that of male::; and that for Kala-azar for females is within 1 per mille of that for males. By contrast, deaths
,from these two causes are recordea. at much lower figures for females than for ma.les in Darjeeling, and there is a wide margin between male and female deaths from these two causes in all other districts.
Death rate from child birth-Death rate from child-birth per 1,000 female death from all causes during the decade presents a depressing picture. For the State figures were highest in 1948 and 1949. In Burdwan the figure mounted steadily from 8'5 (1944) to 22'8 (1948) to fall to 16·4 in 1950, in Birbhum from 5'3 (1944) to 15·6 in 1948 to 8'1 in 1950; in Bankura from 7'5 (1944) to 17·0 (1946) to fall to 11·9 in 1950 ; in Midnapur from 89 (1943) to 22'8 (1946) to fall to 19·4 in 1950; in Hooghly from 14'2 (1945) to 24·2 (1948) and 18'1 in 1950; in Howrah jt varied between 9'9 and 13'8 between 1943 and 1949 and stood at 6'3 in 1950. In 24-Parganas the figure was 8·1 in 1944 and steadily climbed to 19'3 in 1949 and dropped to 14'8 in 1950. In Calcutta it climbed from 1'6 in 1943 to 17'6 in 1949 and fell to 12'1 in 1950. In Nadia it rose from 4·2 (1943) to 23·1 (1948) and dropped to 13'8 in 1950, in Murshidabad from 3·6 in 1943 to 16'5 in 1948 and 12·2 in 1950 ; in MaIda from 10·4 in 1944 to 22'9 in 1949 and 13·7 in 1950; in West Dinajpur from 22'9 in 1944 to 45'5 in 1949 to 29·1 in 1950; in Jalpaiguri from 29'5 in 1944 to 73·2 in 1942 to 56'2 in 1950; in Darjeeling from 18·5 in 1943 to 33'6 in 1949 to 16·2 in 1950. The steep rise from 1943-44 to 1949 may have been due to improved registration while it is not clear to which cause the fall in 1950 is to be ascribed. The average annual infantile mortality for the decade, it may be recalled, was 172'1 for males and 156·0 for females.
* * • In 1950 W. M. Frazer publi!ihed 'A History
oj EngLish Public Health 1834-1939' and the following information has been extracted from
his book. Says Frazer " The population (England & Wales) was given at the Census of 1921 as 37,885,242. In the period of a hundred years, therefore, the population of England and Wales had increased from 12 million to more than three times that number. Such an increase could only have been achieved in the exceptional economic and industrial circumstances of this country in the nineteenth century with markets throughout the world clamouring for manufactured goods, for which food and raw materials were received in return. The birth rate was, however, falling rapidly mainly in .the ranks of the middle and upper classes and, except amongst the very poor, the Victorian family of ten or a dozen children was seldom seen. In the period 1871-75 the birth rate had reached the peak figure of 35'5, and it began to fall rather rapidly after 1890, at a time when the general standard of living in the community as a whple had reached its highest point. By the quinquennium 1916-20, which included some of the war years, this figure had dropped to 20·1. There is little doubt that the rapid decline of the birth rate after 1890 was due very largely to the spread of the knowledge of contraceptive methods amongst people in the higher income groups, and there was an increasing tendency as the years went by for these methods to be adopted by the b~tter-off skilled workers. But the use of contraceptives must be regarded as only the means by which, largely, the birth rate was reduced, and the desire for smaller families, a social phenomenon of great consequence in the twentieth century, can be traced to a number of causes, including the emancipation of women and the general demand for more luxury and more comfortable conditions of living. The birth rate rose again in 1920 and 1921 as a result of the demobilisation of the armed forces, but later in the decade the tendency towards a decline in the annual number of births reasserted itself, and in the period 1926-30 the rate had dropped to 16'7.
"The declining birth rate was, however, masked by an almost equal reduction in the death rate, which in the period 1916-20 had declined to the figure of 14·4. Until the end of the nineteenth century the infantile mortality rate had remained obstinately at or near 150 but after 1900 a highly welcome decline took place. In the period 1901-05 this figure had dropped to 138, in 1911-15 to 110, and in the quinquennium 1916-20 to 90. The reduction of the infantile mortality rate to the latter figure meant that, as compared with the nineteenth century, the lives of 60 infants, out of each 1,000 born, were being saved each year, and this was a substantial offset to a declining birth rate. (Pp. 354-5.)
,. So ended the last of the cholera outbreaks in this country (1893). No outbreaks of cholera occurred in this country between the years 1866 and 1893. For that occurring in 1831-2 there are no mortality statistics available. In the epidemic of 1848-9 there were 54,398 deaths, in 1853-4, 24,516 deaths, in 1866, 14,378 deaths and in 1893,
,135." (P. 168.) . , " This epidemic (smallpox, 1870-3), whlch
occurred throughout England from the end of 1870 to the close of the second quarter in 1873, was part of a world-diffused pandemic. From the last quarter of 1870 to the end of t~e first quarter in 1873 when the outbreak termmated, the number of deaths from smallpox in England was 44,079 out of which 10,287 were contributed by London. In the London Smallpox and Vaccination Hospital the case-mortality rates for the years 1870 and 1871 were, respectively, 66,.2 and 77 per cent. in unvaccinated persons; and, m the two years combined, the rate amongst the vaccinated was 15 per cent. Dr. Seaton, who compiled this report for the Local Governm:nt Board, emphasizes that, in spite of the seventy of the smallpox outbreak of 1870-3, the country had been saved from something very much worse by the system of vaccination which had been in force for 30 years i and he observes that the mortality of this epidemic, alarming as it had been, had not approached what was the usual annual smallpox mortality of the Kingdom at the time when vaccination was unknown. 'The average annual smallpox death rate of the metropolis in the pre-vaccine period was from 400 to 500 per hundred thousand of population; the mean annual death rate of this epidemic was 148, having in 1871 been 243 and in 1872, 54.' (Pp. 169-70.) The total notifications of smallpox in London from the beginning of the epidemic (November 1901) to the end of March, 1902, amounted to over 6,000. (In Liverpool) the outbreak lasted until December, 1903, and caused much suffering, d.uring the course of which 2,278 persons were found to be suffering from the disease. (Pp. 289-90.) What was noteworthy about this epidemic was that it had died down completely by the end of 1906, and had scarcely left a trace behind it. From the end of 1906 up to the present day, the amount of severe smallpox (Variola Major) in any period has been very small, and such outbreaks as have occurred were mainly due to imported cases which had escaped
through the net of the Port sanitary authorities. (P. 370.)
., The more important of the facts about the transmission of plague were established by the Indian Plague Commission. As a prophylactic, Haffkine's vaccine has been used in areas subject to plague epidemics with some success. Plague was last seen in epidePlic form in thip country in 1665-6 ... Careful precautions are taken at the ports to destroy rats on ships by fumigation. (Pp. 269-70.)
" By the second decade of the twentieth century the main infectious diseases which had so much affected the mortality rates during the previous hundred years had been almost, if not entirely, stamped out. Apart from occasio~al imported cases, typhus, cholera and relapsmg fever had disappeared with the abolition of the conditions which favo:ured their spread, and the enteric group of diseases was decidedly less troublesome than before. In 1911 13,852 cases of these diseases were notified, in 1914 8,778, and in 1916 5,564. (P. 364.)
"The value of publicity and of directing attention to the exact cause of maternal deaths, instead of to generalities, was shown in what has come to be known as the "Rochdale experiment" which was begun in 1931. For the preceding ten years, Rochdale had the unenviable di~tinction of having the highest Maternal MortalIty rate in the country. Dr. Andrew Topping who became Medical Officer of Health in 1930 established the fact that the great majority of deaths were due to absence of adequate antenatal care and to unnecessary interference in labour on the part of doctors, and not occult rickets, 'women working in the mills', smokeladen atmosphere, etc., which had been advanced as causes. Frank exposure of the real causes by public lectures and in the local press, extension and improvement of antenatal and domiciliary midwifery services, together with cooperatio!,l from general practitioners, brought the rate down. to well below average within 18 months and It has remained at a comparatively low level since then. (P. 418.)
" Another favourable factor was the mortality rate from tuberculosis (all forms) which, in the period 1916-20, had fallen to 1'4 per thousand of the population." (P. 355.)
10
" Is it the pig that makes the Etye or the stye the pig? "
-Report of the Royal Commission on the Housing of the Working classes, 1885 (quoted by W. M. Frazer in A History of English PubLic Health).
Health Services of West Bengal-A casual observer or even a critic of the Health Services of West Bengal will admit the considerable achievements of the Department of Public Health since 1947 in the reorganisation of health services, improvement of rural water supply, inoculations and vaccination, the increase in the number of mobile medical units, sanitary and health staff, improved supply of medicines to itinerant health visitors, dispensaries and hospjtals. A bold step has been taken in the building up of rural health centres, in unions and thanas, in the rapid expansion of hospital beds throughout West Bengal, in an improved supply of women health visitors and midwives. The major hospitals in Calcutta and district towns have received beneficent attention and not a few of them have been enlarged and more fully staffed. The Government recently has created a number of new municipalities thus bringing their population within the ambit of municipal amenities.
All this ought to have reflected a substantial improvement of vital statistics figures were it not for the serious problems of sanitation and public health created by a sudden influx of 2'12 million displaced persons from East Bt:!ngal the majority of whom had to be huddled into makeshift camps of canvas and bamboo. The effect has also been masked by the general conditions of living which show no signs of improvement, but rather of deterioration. This section will briefly deal with the background of the Vital Stati~tics discussed above and will make the question, quoted above, which a Royal Commission in England put to itself in 1885, appear fraught with the deepest of meaning.
In 1842 Edwin Chadwick submitted his Report of an Enquiry into the Sanitary Condition of the Labouring Population of Great Britain and made the following observations (pp. 369-71 of the Synoptical Volume quoted by W. M. Frazer in A History of English PubLic Health pp. 18-19) which apply with particular force and poignancy to present conditions in our country and put the finger on our malady. These points had of course been made earlier by Malthus, but whereas Malthus's dissertation was wholly gloomy, Chadwick's language betrays great determination to alter the state of affairs that he had found the country in:
'.' That the various forms of epidemic, endemic and other disease caused, or aggravated, or propagated chiefly amongst the labouring classes by
atmospheric impurities produced by decomposing animal and vegetable substances by damp and filth and close and overcrowded dwellings prevail amongst the population in every part of the Kingdom, whether dwelling in separate houses, in rural villages, in small towns, in the larger towns-as they have been found to prevail in the lowest districts of the metropolis.
"That such disease, wherever its attacks are frequent, is always found in connexion with the physical circumstances above specified, and that where those circumstances are removed by drainage, proper cleansing, better ventilation and other means of diminishing atmospheric impurity, the frequency and intensity of such disease is abated; and where the removal of the noxious agencies appears to be complete, such disease almost entirely disappears".
"That the formation of all habits of cleanliness is obstructed by defective \ supplies of water ".
"That the annual loss of life from filth and bad ventilation is greater than the loss from death or wounds in any wars in which the crmntry has been engaged in modern times".
"That the ravages of epidemics and other diseases do not diminish but tend to incre·ase the pressure of population".
"That in the districts where the mortality is the greatest the births are not only sufficient to replace the numbers removed by death, but to add to the population".
"That the younger population, bred under noxious physical agencies, is inferior in physical organisation and general health to a popUlation preserved from the presence of such agencies ".
"That these adverse circumstances tend to produce an adult popUlation shortlived, improvident, reckless, and intemperate, and with habitual avidity for sensual gratifications".
"That the primary and ;most important measures and, at the same time, the most prs.cticable, and within the recognised province of public administration, are drainage, the removal of all refuse of habitations, streets and roads and the improvement of the supplies of water".
"That the expense of public drainage, of supplies of water laid on in houses, and of means of improved cleansing would be a pecuniary gain, by di~inishing the existing charges attendant on sickness and premature mortality".
11
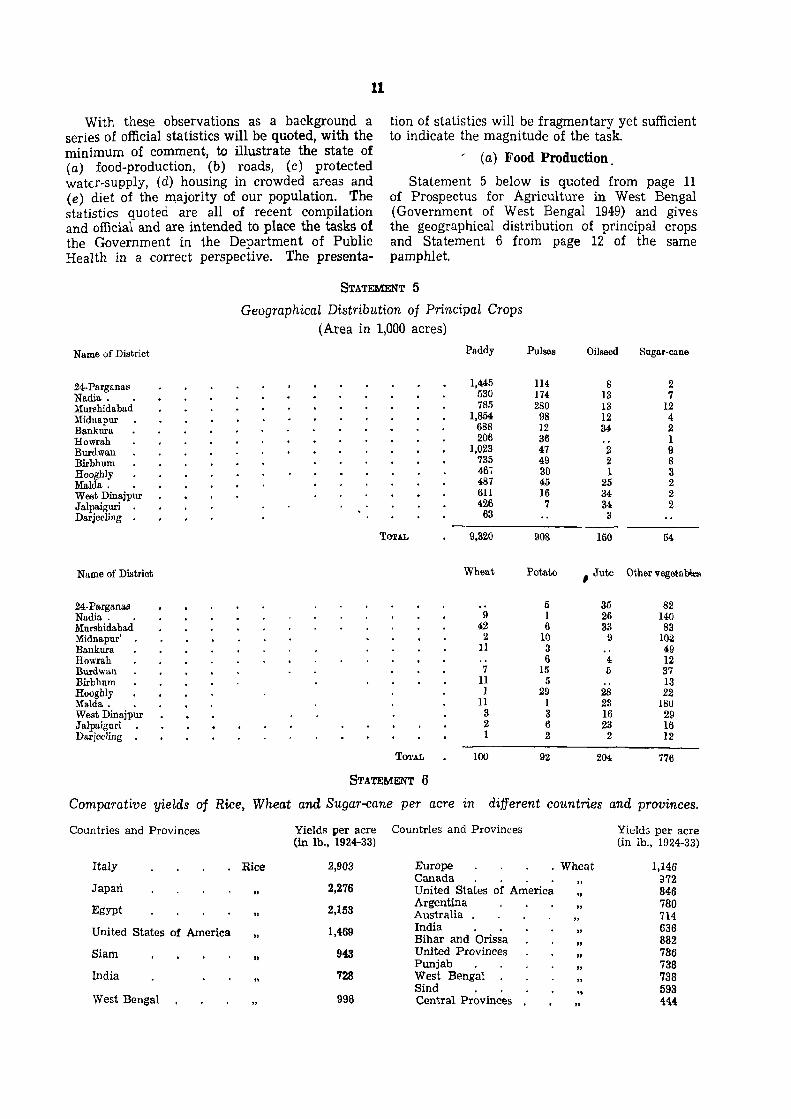
With these observations as a background a series of official statistics will be quoted, with the minimum of comment, to illustrate the state of (a) food-production, (b) roads, (c) protected watt:r-supply, (d) housing in crowded areas and (e) diet of the majority of our population. The statistics quoted are all of recent compilation and official and are intended to place the tasks of the Government in the Department of Public Health in a correct perspective. The presenta-
tion of statistics will be fragmentary yet sufficient to indicate the magnitude of the task.
(a) Food Production.
Statement 5 below is quoted from page 11 of Prospectus for Agriculture in West Bengal (Government of West Bengal 1949) and gives the geographical distribution of principal crops and Statement 6 from page 12 of the same pamphlet.
STATEMENT 5
Geographical Distribution of Principal Crops (Area in 1,000 acres)
Name of Distriot Paddy Pulses Oilseed Sugar-cane
24·Parganas 1,445 114 S 2 Nadia. . 530 174 13 7 Murshidabad 785 280 13 12 Midnapur 1,854 98 12 4 Bankura 688 12 34 2 Howrah 206 36 .. 1 Burdwan 1,023 47 2 9 Birbhum 735 49 2 8 Hooghly 467 30 1 3 MaIda. 487 45 25 2 West Dinajpur 611 16 34 2 Jalpaiguri 426 7 34 2 Darjeeling 63 3
TOTAL 9,320 908 150 54
Name of District Wheat Potato , Jute Other vegetalm
24-Pargllnas .. n 35 82 Nadia. 9 1 26 140 Murshidabad 42 6 33 83 Midnapur' 2 10 9 102 Bankura 11 3 ., 49 Howrah ., 6 4 12 Burdwan 7 15 (5 37 Birbhum 11 5 ., 13 Hooghly 1 29 28 22 MaIda. 11 1 23 180 West Dinajpur 3 3 16 29 Jalpaiguri 2 6 23 16 Darjeeling 1 2 2 12
TO'l'AL 100 92 204 776
STATEMENT 6
Comparative yields of Rice, Wheat and Sugar-cane per acre in different countries and provinces.
Countries and Provinces Yields per acre Countries and Provinces Yield~ per acre (in lb., 1924-33) (in ib., 1924-33)
Italy Rice 2,903 Europe . Wheat 1,146 Canada ;)72
Japan "
2,276 United States of America " 846
Egypt 2,153 Argentina
" 780 .. Australia 714
United States of America 1,469 India 636 .. Bihar and Orissa 882 " Siam
" 943 United Provinces
" 786 Punjab
" 738 India '128 West Bengal 738
Sind .. 593 West Bengal
" 998 Central Provinces
" 444
Provinces
Central Provinces Bihar. Orissa. .
Sugarcane (raw liugar)
STATEMENT 6-concld.
Yields per acre Provinces (in lb.)
3,394 2,280 4,352
Bombay • "Punjab (Undivided) West Bongal . •
Sugarcane (raw suga.r) .. "
Yields per ()ore (in lb.)
5,782 1,918 4,223
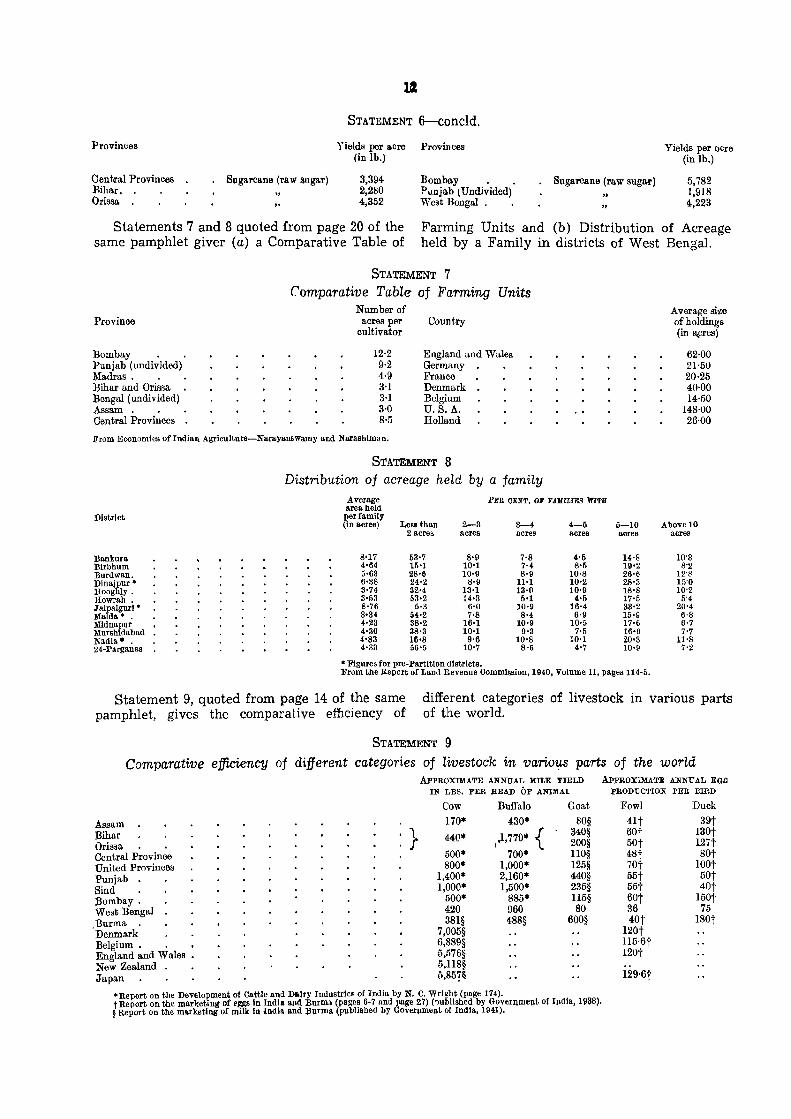
Statements 7 and 8 quoted from page 20 of the same pamphlet giver (a) a Comparative Table of
Farming Units and (b) Distribution of Acreage held by a Family in districts of West Bengal.
Province
Bombay Punjab (undivided) Madras. Bihar and Orissa Bengal (undivided) Assam. . . Central Provinces .
STATEMENT 7 Comparative Table of Farming Units
Number of acres per Country
cultivator
12·2 England and Wales 9·2 Germany 4·9 France 3·1 Denmark 3·1 Belgium 3·0 U. S. A. 8·5 Holland
From Economics of Inrlian. Agrlculture-Narayanswamy and Narashiman.
STATEMENT 8 Distribution of acreage held by a family
Average size of holdings (in Il,Slres)
62·00 21-50 20·25 40·00 14·50
148·00 26·00
Average PER CENT. OF F,unI,lES WITH area held
District per family (In acres) Less than 2-3 3-4 4-6 6-10 Above 10
2 acres acres acres acres acres acres
Bankura 8'17 53'7 8'9 7'8 4'6 14·8 10'3 Birbhum 4·64 15'1 10'1 7·4 8'5 19'2 8'2 Burdwan. 5·63 28·6 10'9 8·9 10'8 26'6 12'8 Dtn.ajpur • 6'38 24'2 8'9 11'1 10'2 28'3 15'0 Hooghly. 3·74 32·4 13·1 13'0 10·9 18'8 10'2 Howrah . 3'53 53·2 14'3 5'1 4'5 17·5 5'4 Jalpaiguri' 8'76 5·3 6'0 10·9 16'4 33'2 20'4 Maida' . 3·34 54·2 7·8 8·4 6·9 15·9 6·8 Midnapur 4·23 38·2 16'1 10·9 10'5 17'6 6·7 Murshldabad 4'30 38·3 10·1 9·3 7'5 16'9 7·7 Nadia· . 4'83 16·8 9'6 10'8 10'1 20'3 11'8 24·Parganas 4'33 56'5 10'7 8'6 4'7 10'9 7'2
• Figures for pre-Partition districts. From the Report of Land Revenue Commission, 1940, Volume II, pages 114-5.
Statement 9, quoted from page 14 of the same pamphlet, gives the comparative efuciency of
different categories of livestock in various parts of the world.
STATEMENT 9 Comparative efficiency of different categories of livestock in various parts of the world
APPROXIMATE ANNUAL MILK YIELD IN LBB. PER HEAD OF ANIMAL
COW Buffalo Goat
Assam 170· 430· 80§ Bihar } 440· ,1,770· { 340§ Orissa I 200§ Central Province 500· 700· 1l0§ United Provinces 800· 1,000* 125§ Punjab 1,400· 2,160· 440§ Sind 1,000· 1,500* 235§ Bombay. 500· 885· 115§ West Bengal 420 960 80
.Burma 381§ 488§ 600§ Denmark 7,005§ Belgium. , 6,889§ England and Wales 5,576§ New Zealand . 5.118§ Japan o.857q
'Report on the Development of Cattle and Dtolry Industries of India by N. C. Wright (page 174). t Report on the marketing of eggs in. India and Burma (pages 6·7 and page 27) (published by Governluent of India, 11138). § Report on the marketing of milk In India and Burma (published by Govemment of India, 1941).
APPROXIMATE ANNUAL EGG :PRODUCTION PER BIRD
Fowl Duck'
41t 39t 60t 130t 50t 127t 48t SOt 70t lOOt 55t 50t 55t 40t 60t 150t 36 75 40t lS0t
120t 115'6t 120t
129·6t
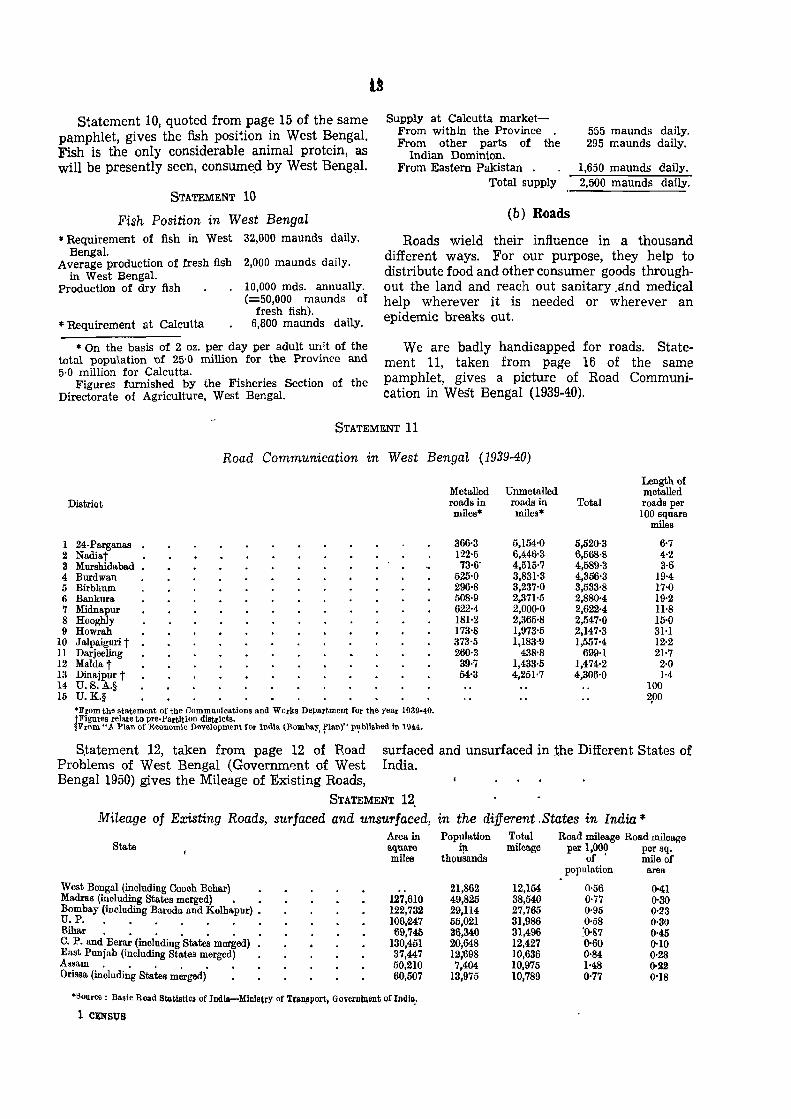
Statement 10, quoted from page 15 of the same pamphlet, gives the fish position in West Bengal. Fish is the only considerable animal protein, as will be presently seen, consume.d by West Bengal.
STATEMENT 10
Fish Position in West Bengal "Requirement of fish in West
Bengal. Average production of fresh fish
in West Bengal. Production of dry fish
* Requirement at Calcutta
32,000 maunds daily.
2,000 maunds daily.
10,000 mds. annually. (=50,000 maunds or
fresh fish). 6,800 maunds daily.
* On the basis of 2 oz. per day per adult un it of the total population 'Of 25·0 million for the Province and 5·0 million for Calcutta.
Figures furnished by the Fisheries Section of the Directorate of Agriculture, West Bengal.
Supply at Calcutta marketFrom within the Province . From other parts of the
Indian Dominion. From Eastern Pakistan .
Total supply
(b) Roads
555 maunds daily. 295 maunds daily.
1,650 maunds daily. 2,500 maunds daily.
Roads wield their influence in a thousand different ways. For our purpose, they help to distribute food and other consumer goods throughout the land and reach out sanitary ,and medical help wherever it is needed or wherever an epidemic breaks out.
Weare badly handicapped for roads. Statement 11, taken from page 16 of the same pamphlet, gives a picture of Road Communication in West Bengal (1939-40).
STATEMENT 11
1 2 3 4 5 6 7 8 9
10 U 12 13 14-15
Road Communication in West Bengal (1939-40)
District
24.Parganas Nadiat Murshidabad Burdwan Birbhum Bankura Midnapur Hooghly Howrah J alpaiguri t Darjeeling Maldat Dinajpur t U.S.A.§ U.K.§ 'From tM statement of the Oommuuications aud Works Department for the year 1939-40. tFigures relate to pre.Partition districts. §From "A Pian of Economic Development for India (Bombay, f'lan)" p~bll8hed In 1944.
Metalled Unmetalled roads in roads in miles* miles*
366·3 5,154'0 122'5 6,446'3 73·6' 4,515'7
525'0 3,831'3 296·8 3,237'0 508·9 2,371'5 622·4 2,000'0 181-2 2,365'8 173'8 1,973'5 373'5 1,183'9 260·3 438·8 39·7 1,433·5 54'3 4,251·7
Length of metalled
Total roads per 100 square
miles
5,520'3 6·7 6,568'8 4·2 4,589'3 3·6 4,356'3 19·4 3,533'8 17·0 2,880'4 19·2 2,622'4 U·8 2,547'0 15·0 2,147'3 31-1 1,557'4 12·2
699·1 21·7 1,474'2 2·0 4,306'0 1-4
100 2,00
S.tatement 12, taken from page 12 of F.oad Problems of West Bengal (Governm~nt of West Bengal 1950) gives the Mileage of Existing Roads,
surfaced and unsurfaced in the Different States of India.
STATEMENT 12, Mileage of Existing Roads, surfaced and unsar/aced, in the different . States in India *
State
West Bengal (including Cooch Behar) Madras (including States merged) . • Bombay (including Baroda and Kolhapur) • U.P. . . . . . . • Bihar . • . . . • C. P. and Berar (including States merged) East Punjab (including States merged) Assam. . . . . Orissa (including States merged)
Area in square miles
127,61q 122,732 106;247 69,740
130,451 37,447 50,210 60,507
-Source: Basic Road Statistics of Jlldla-)Unlstry of TraIl!lport, Govc:nillellt of Indl~.
1 ClNSVS
Population in
thousands
21,862 49,825 29,114 55,021 36,340 20,648 12,"698 7,404
13,975
Total mileage
12,154 38,540 27,765 31,986 31,496 12,427 10,636 10,975 10,789
Road mileage Road mileage per 1,000 pcr sq.
of • mile of popUlation area
0·56 0'41 0·77 0'30 0·95 0·23 0'58 0·30 :0'S7 0·45 0·60 0'10 0·84 0·28 1-48 0022 0'77 0'18
If
It will be seen from the abov~ tabl~ that West Bengal, with her mean density of population nearly three times that of India as a whole, has only 0'56 mile of roads per 1,000 of her pop~lation. This js the lowe.st of tbe States in India and compares unfavourably with the figure for India as a whole (0'75). West 13epgal, however, compares a little favourably with the other States in the length of sucll road mileage per squaJ;~ mile of area, which is pearly O·4l to the squ~re mile for West Bengal as against O:l9 for Inqia qS a whole. Only Bihar has a :qigh~r distributiop with 0·45.
It is unnecessary to hold forth on the many handicaps from which a land is liable to suffer that is not endowed with good roads, and on bad Foads (and consequently improper and insufficient drainage) public health measures or improvements become one of the first casualties.
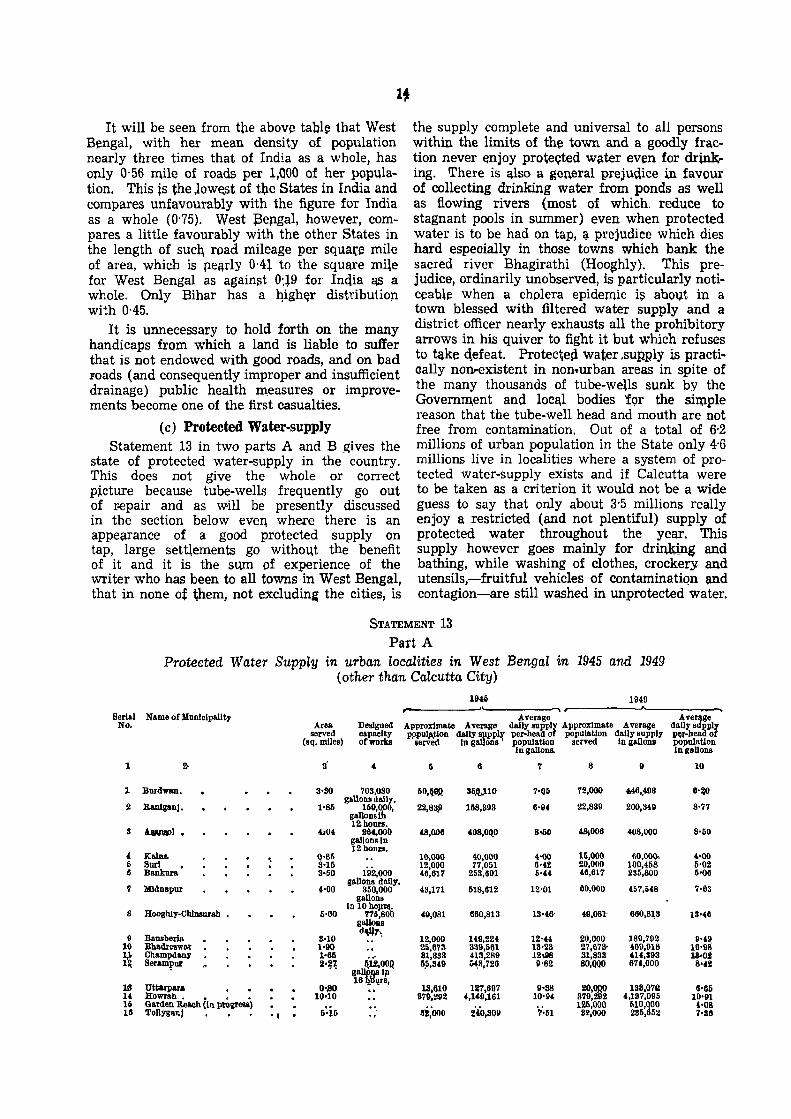
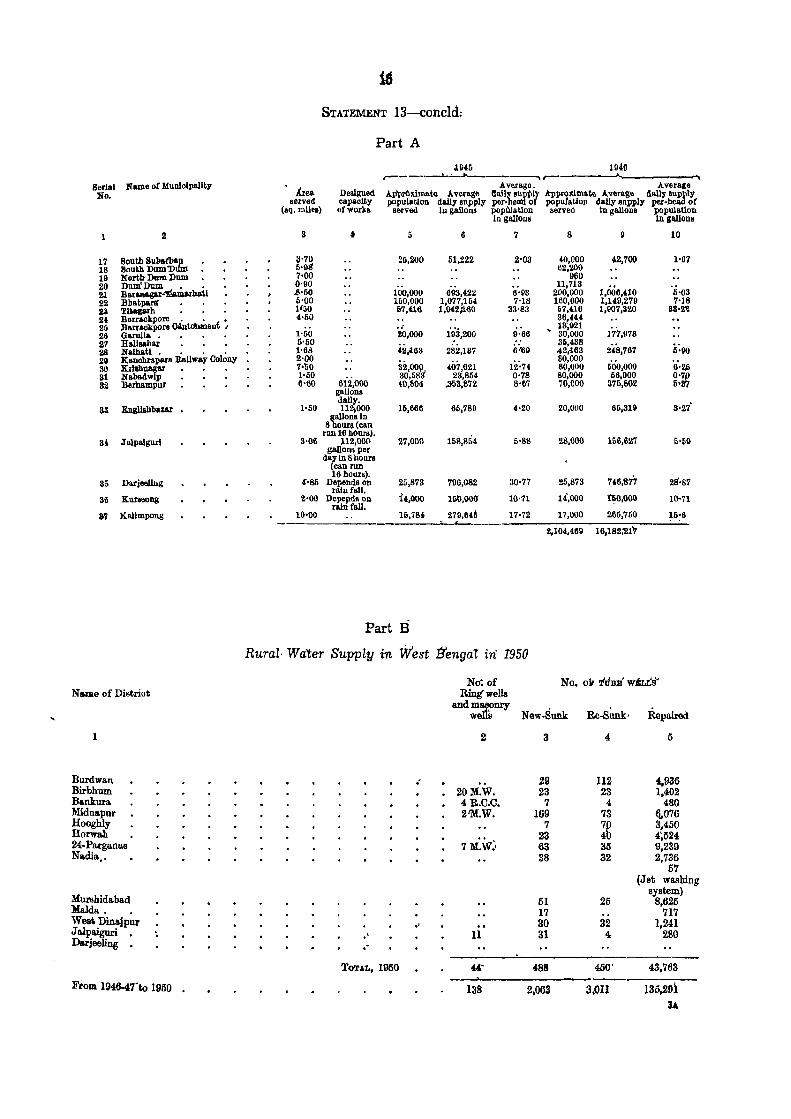
(c) Protected Water-supply Statement 13 in two parts A and B ,gives the
state of protected water-supply in the country. This does not give the whole or correct pjcture because tube-wells frequently go out of r-epair and as will be presently discussed in the section below even where there is an appearance of a good protected supply on tap, large sett~ements go without the benefit of it and it is the sum of experience of the writer who has been to all towns in West Bengal, that in none of them, not excludin~ the cities, is
the supply complete and universal to all persons within the limits of the town and a goodly fraction never ~njoy prote<;ted w~ter even for drink-ing. There is qlso a general prejudice in favour of collecting drinking water from ponds as well as flowing rivers (most of which. reduce to stagnant pools in summer) even when protected water is to be had on tap, a prejudice which dies hard especially in those towns which bank the sacred river Bhagirathi (Hooghly). This prejudice, ordinarily unobserved, is particularly noticeaQl~ When a chplera epidemic is abo-ut in a town blessed with filtered water supply and a district officer nearly exhausts all the prohibitory arrows in his quiver to fight it but which refuses to t&ke qefeat. Protectep. water ,SUIlRly is practically non.-existent in non.urban areas in spite of the many thousands of tube-wells sunk by the Governm,ent and locl:\l bodies 'for the simple reason that the tube-well head and mouth are not free from contamination. Out of a total of 6·2 millions of urban population in the State only 4'6 millions live in localities where a system of protected water-supply exists and if Calcutta were to be taken as a criterion it would not be a wide guess to say that only about 3'5 millions really enjoy a restricted (and not plentiful) supply of protected water throughout the year. This supply however goes mainly for drinking and bathing, while washing of clothes, crockery and utensils,-fruitful vehicles of contaminatiQn and contagion-are still washed in unprotected water.
STATEMENT 13
Part A
Berial No.
1
1
2
8
4 6 6
7
8
II 10 a UI U 16 15
Protected Water Supply in urban localities in West Bengal in 1945 and 1949 (other than Calcutta City)
19", 1949
N&me of MunIcIpality A.verage Area Designed Approximate Average dally supply Approximate A,\,erage
sel"Yed capacity p$}puWlon dally aWcPPl~ per-head of population dally supply (sq. miles) of works served In g ons population served In gallons
IngaJIona.
~ S· 4 I) 6 7 8 9
Bnrdwan. 3·30 708,080 60,~eQ ~10 7'Q6 72,000 MO,.408 gallons dally.
Rlmlganj. 1'86 160,0(10, 22,83,11 168,398 6·94 22,839 200,3411 gallonslh 12. hours.
A.ww>l • 4,04 264,OO() gallons In 12 hours.
48,006 408,OQ.0 8·$ 480,006 408,000
Kama 0,85 10,000 40,000 4'00 15,000 60.000, Snrl , 3·15 12,000 77,051 6'42 20,000 100,468 Banlrnra 8'60 192,000 46,617 258,691 5·" 46,617 235,800
lIlldnapur 4·00 gallons dally.
60,000 350,000 43,171 618,612 12'01 4.7,048 gallons
Hooghly·Oblnaurah • 6,00 In 10 hoJlf4.
775,800 gaUoRS
40,081 660,813 13'46' 49,081- 660,81,3
Bansberia 3·10 d¥J7 •.
12,000 149,224 12'44 20,000 189,792 .. Bh&dreawar 1,90 25.673 339,561 13'28 27,673> 469,918 Ohampdany l·M .- 31,833 413,289 12'1l18 31,838 414,a93-Serampur 2'!?~ I\l2,OOQ 6,5,849 :;~a,726 9'82 8O,QQO 61',000
g~rulP Uttarpara O',BG
16 ~ 'Vs, 1.8,610 127,697 9'88 20,~ 133,07e
Howrah • 10·10 879,:.'.92 4,1'9,161 10'94 879,2 2 4,187,095 Garden Reach (In progresS)
6:i6 ", ri;ooo 2'4'0,809 ';i·u 12 .. ,000 IIlO'aGO Tollnanj • , • 'I , .. S!,OOO 236, 52
~
AverIJge dallYSU~1I11 ~·hea 0 population In gallons
10
6'~
8'77
8·60
4'00 6'02 6'06
7'63
13'(6
9'49 16'98 l,"oi 8'(2
6'66 10'91 "08 7'311
Serial Name of Munlolpallty No.
2
17 80utb 811batbap 18 South Dum'Dtlm: 19 North Dum Dum • 20 Dnm'Dum • • 21 Baranagar"'!!alDlolbatl 22 Bhatpartr sa 'll ..... h • . • 24 Barraokpore. • • 25 B&rraokpore OAlitohln&ni , 26 Garulla. 27 Halluhar 28 Nathatl. • . • 29 Kanchrapara Railway Colony 30 KIlahuagar 31 Nabadwlp 32 B&rhampur
3S EnglIabbazar
3' J' alpaiguri
35 De.rjee11ng
36 Kuraeong
87 Kallmpong
Name of Distriot
1
Burdwan Birbhum Bankura. Midnapur Hooghly Horwah 24.Parganas Na.dia. ••
Murshida.bad MaJda.. • Willi Dinajpur Jalpaignri • Darjeeling •
FloUl 1946-4no 1950 •
STATEMENT 13-concld:
Area served
(sq. miles)
3
3'70 5'98' 7·00 0'90 .8'50 6'00 l'SO 4·60
De&!gned capacl,ty ofworka
1'50 6'SO 1'68 2'00 7'1;0 1'50 6'60 6ii,ooo
gallons dally.
1'50 112,000 gallons In
8 houra(can run iiI hOurs).
3'06 112,000 gallons per
daylnSbours (call run 16 hours).
{·SS Depends on rainfall.
2'00 D;:n:».n
10'00
Part A
1940 ~r---------~--------~ A verago. Average
Ap'proxlma.te Average flaily supPly A,}>prqxlm'&te Average dally supply population daily supply per-heat! of population daily supply per.heAd of
served In gallons poplllatlon served In gallons population
5
26,200
100,000 160,000 67,(16
. : W,OOO
42,i63
32,009 30,583' 40,804
15,666
27,000
6
61,222
693,422 1,077;164 1,942,1160
i~3,200 282,137
407,621 23,854
.353,872
65,789
158,854
796,082
160,000
279,64~
In gallons In iallons
7
2'03
6'93 7'18
33'83
9'66
6'59
12-74 0·78 8'67
4·20
5·88
30·77
10·71
17·72
8
40,000 62,200
9110 11,713
200,000 160,000 67,416 36r44.4 13,921
, 30,000 35,438 42(163 80,000 80,000 SO,ooo 70,000
20,000
28,000
25,873
14,000
17,000
42,700
1,006,410 1,149,279 1,907,320
177,978
248,767
0'00,000 66,000
375,802
65,319
156,627
746,877
~o,oOll
265,760
2,104,469 16,182;21'7
10
1-07
6·03 7-18
aa'2~
Part 13
Rural· Wa'ter Supply in West B'enga! hi 1950
N<t. of No. o¥ iUBE'riLLS" Ring wells
and m&30nry wens New.Sunk Re.s~· Repaired
2 3 4
.- 29 112 4,936 20M.W. 23 23 1,402 4 RC.C. 7 4 480 2'M.W. 169 73 fl.,076
7 ~€ 3,450 23 4~524
7M.W:' 63 35 9,289 38 32 2,736
57 (Jet w&shing
system) 51 25 8,625 17 717
.' 30 32 1,241 11 31 4 280
-. 'l'OTAL, 1950 44' 488 450' 43,763
138 2,063 3.011 135,2oi
3A
16
(d) Housing in crowded areas Notwithstanding the lack of drainage,
sewerage, ventilation in mudhouses, and planning in villages, the comparative absence of congestion in the rural areas make them still healthier places to live in than noxious and crowded urban areas. It is not however suggested that rural areas are less unhealthy, only that they are less noxious and foul of atmosphere than urban areas. This is perhaps a reason why in spite of all fruitful conditions of every kind of epidemic prevailing, the toll taken by epidemics, though appalling by civilised standards, is not really so tn the primitive setting by which its extent ought to be assessed. The sun, personal cleanliness and hygiene among the people, and the universal habit of bathing must account for a great many lives that .are claimed from disease and death while improvement in public measures must also come for its due share of praise. I
The strength of a chain lies in its weakest link and the efficiency of public health measures must be judged from the condition that obtains in very crowded areas.
In 1949 the State Statistical Bureau published a 'Report on a Sample Enquiry into the Living conditions in the Bustees of Calcutta and Howrah 1948-49 (Government of West Bengal, 1949) '. This report is full of meat in its analysis as well as tables and gives a very thorough idea of how about 1 in every 3 persons lives in Calcutta and
I Howrah (1 million in 3 million). As for nonbustee areas most rooms in Calcutta-except what are known as the European localities-are an average size of 10 feet by 12 or less and about 11 feet high, where kitchens, baths and lavatories are to be shared with other families. In the census of 1951, 710,579 living rooms were counted in the Municipal area of Calcutta consisting of 32 Wards, and the popUlation in this area Was 2'548 :million. To each living room therefore there are 3·5 persons and it should be remembered that a living room varies from one in which a man can barely lie down and stand up to that in the mansions of the very rich.
The mansions of the very rich usually contain few people and therefore this aritmnetical average masks the real congestion. It will not be hazardous to surmise that the average number of persons per living room throughout the cities of Calcutta and Howrah, taking the best with the worst, will be about the same as that found in bustee areas, with this difference. that other circumstances of ventilation, sanitation, water supp~y and amenities an~ .superior to non-bustee areas. The following extract from page 13 of the Report gives a horrjfying summ'ary of the results of the Inquiry.
"About 11·3 per cent. of the total bustees of Calcutta and 12 per cent. of those of Howrah have been surveyed. Only 12 per cent. of the resident families in the bustees of Calcutta are lessees and the rest are tenants; 24·6 per cent. of the total lessees do not live in the bustee. At Howrah the respective percentages are 12·3 and 11'5. The majority of the tenements are oneroomed, the percentage for Calcutta being 93'3 and that for Howrah 97·6. Only 31,2 per cent. of the lessees at Calcutta bustees have registered documents in support of their claims, the figure for Howrah is slightly higher, being 40. No case of eviction of lessees was found at Howrah but the lessees at Calcutta are not so fortunate, 3 per cent. have been already evicted and slightly more than 5 per cent. have been threatened with eviction notices, etc. Among the tenants of the bustees of Calcutta 32 per cent. are non-Bengalees while 16'6 per cent. come from East Bengal. But at Howrah 80·2 per cent. of the tenants of the bustees are non-Bengalees and only 1,2 per cent. hail from East Bengal. On an average, a lessee of a Calcutta bustee enjoys 62'5 per cent. and a tenant enjoys 26·6 per cent. more floor space than those of a Howrah bustee. The average monthly income of a lessee of Calcutta is more than double that of a lessee of Howrah and the average income of a tenant of Calcutta is nearly one and a half times as much as that of a tenant of Howrah; 75 per cent. of the huts of the bustees of Calcutta have pucca floor whereas the figure for Howrah is only 36·6 per cent. Pucca walled huts have been found in the bustees, the percentages for Calcutta and Howrah being 28 and 9, respectively. Thatched roof was found in only 3 per cent. cases both at Calcutta and at Howrah. As regards ventilation it appears that the bustees of Howrah are better off then those of Calcutta as is apparent from the percentage of badly ventilated huts, which is 24 for Calcutta and 6 for Howrah. Arrangement for water supply is bad in both the cases; 61·7 per cent. of the huts of Calcutta bustees and 83'6 per cent. of those of Howrah have no arrangement for supply of water; 15 per cent. of the huts have kitchen both at Calcutta and at Howrah, but the percentage for huts having no arrangements for cooking is 4 at Calcutta while the corresponding percentage for Howrah is 10. Drainage is equally unsatisfactory at the .two places, the percentage of bad drainage for Calcutta bustees is 42 while that for Howrah is 34; 17·3 per cent. of the huts of the bus tees ·of Calcutta and 15'5 per cent. of those of Howrah have no latrines."
The following from page 14 of the Report gives the distribution of the number of rooms occupied by lessees and tenants at Calcutta and Howrah. .
17.
II 1t will be seen fro;m the table that at Calcutta, a tenant family occupies on an aver~ge 1·10 rooms only, 92' 3 per cent. of them occupymg only a single room, whereas a lessee family lives in 2·73 rooms on an average, nearly 75 per cent. of them occupying more than two rooms. As a hut contains on an average 7 ·16 rooms, it is evident that the hut owner lets out the balance of 5'43 rooms which are occupied by a 5 tenant family. A bustee at Calcutta has, on an average, 6'38 huts having 52·12 room,s, wh~re 35·3 tenant families and 4,8 lessee fanllhes llve. At Howrah a tenant family occupies 1·03 rooms on an average, 97,6 per cent. of them living in a,sing~e room. A lessee family on the other hand hves m 2'43 rooms on an average, 70'5 per cent. of them occupying more than 2 rooms. As a hut contains 8·73 rooms on average, the hut owner lets out the balance of 6·30 rooms which are rented out to 6 tenant families.
A bustee at Howrah has 5·58 huts having 48'75 rooms on an average where 35·4 tenant families and 5'1 lessee families live."
The state of water supply in the bustees is analysed at pp. 18-19 of the report as:-
" The deplorable condition of the water-supply in the bustees will be at once evident. Out of 3,179 huts in the bustees of Calcutta, only 1,216 huts have some arrangement of water-supply, possessing 1,246 taps, 106 wells and 15 tube-wells among them. There are some very bad cases; 157 huts out of 159 in ward no. 18, 123 out of 135 in ward no. 21 and 264 out of 342 in ward no. 25 have no arrangement whatsoever for the supply of water. The more fortunately situated huts are in ward nos. 5, 8, 9, 11 and 23, where 42 out of 58 huts, 35 out of 46, 42 out of 59, 24 out of 26, and 13 out of 20 huts have some arrangement for the supply of water. It will be found that all of these bustees are small in comparison with most of the remaining ones."
"The condition at Howrah can be realised from the fact that in only 11 out of the 67 huts, there is some arrangement for water-supply."
"On an average 61'7 per cent. of the huts in the bustees of Calcutta have no arrangement for any water-supply; 54'6 per cent. of the bustee dwellers live in such huts. Dwellers who are more fortunate in having water-supply are served at the rate of 25'6 persons per j;ap; The difference among the wards is very pronounced; the proportion of huts having no water-supply varying ~rom 7'7 per cent. in ward no. 11 to 98·7 per cent. In ward no. 18.
many as 4·48 lakhs have to depend on street hydrants or ponds for their water-supply. At Howrah the corresponding figures are 15·7 thousands ahd .10'5 thousands, respectively."
Analysis of the percentage distribution of huts by 'nature 'of place of cooking is thus made:
"Separate kitchen is provided in only 15'5 per cent. of the huts in the bustees of Calcutta. In 70·0 per cent. of the huts cooking is done in some sort of verandah and in 10·4 per cent. of the huts it is done in the bed room. In 4·1 per cent. of the huts no cooking is done. The percentage of huts having a separate kitchen exceeds 30 in ward 31 only, 25 in wards 23*, 29 and 32 and is less than 5 in wards 8, 13* and 14. No separate kitchens were found in the sampled bustees in ward nos. 7*, 10* and 15*. Cooking is done in the verandah in more than 70 per cent. of the huts in wards 1, 3, 5, 14, 18,20,22, 25,26,27,28,29 and 30. In 25 per cent. of the huts in ward 23* there is no arrangement for cooking. In ward 15, the percentage is 22·7 and in ward 9, the percentage is 20'7.
" In the bustees of Howrah cooking is done in a separate kitchen in 14·9 per cent. of the huts, in verandah in 47·0 per cent. huts, in the bed room in 27·6 per cent. of the huts. In the remaining 10'5 per cent. huts there is no arrangement for any place for cooking. Thus, it will be found that whereas in 85'5 per cent. of the huts in the bustee of Calcutta, cooking is done either in a kitchen or in the verandah, the corresponding figure for Howrah is 61·9 only. The percentage of huts in Howrah where cooking is done in th(> bedroom is three times that at Calcutta and the percentage of huts at Howrah having no arrangement for cooking is two and half times as much as that at Calcutta."
Analysis of huts with or without latrines is made as follows:
"In the bustees of Calcutta 14·7 per cent. of the huts are without any latrines and 10·1 per cent. of the bustee dwellers live in these huts. Three types of latrines were found, viz., the " service" type, the "septic tank" type and "flushed" latrines connected with the Corporation's sewer system. The respective percentages are 63'5, 3·7 and 32'8, respectively, The ·service type is more common in wards 18, W, 21, 24, 25; 28, 29, 30, 31 and 32, the septic tank type in ward No.9 and the flushed type in the remaining wards. The percentage of huts not having any latrine varies from 50'7 per cent. in ward No.6 to nil in wards 7* and 14 and the percentage of people living in these huts ranges from 40·8 in
Thus it is found that out of about 8·20 lakhs ward no. 6 to nil in wards 7* and 14. On an averof people living in the bustees of Calcutta, as age a latrine is used by 23·0 persons, the number
* The percentage is subject to a large sampling error due to the small size of the sample.
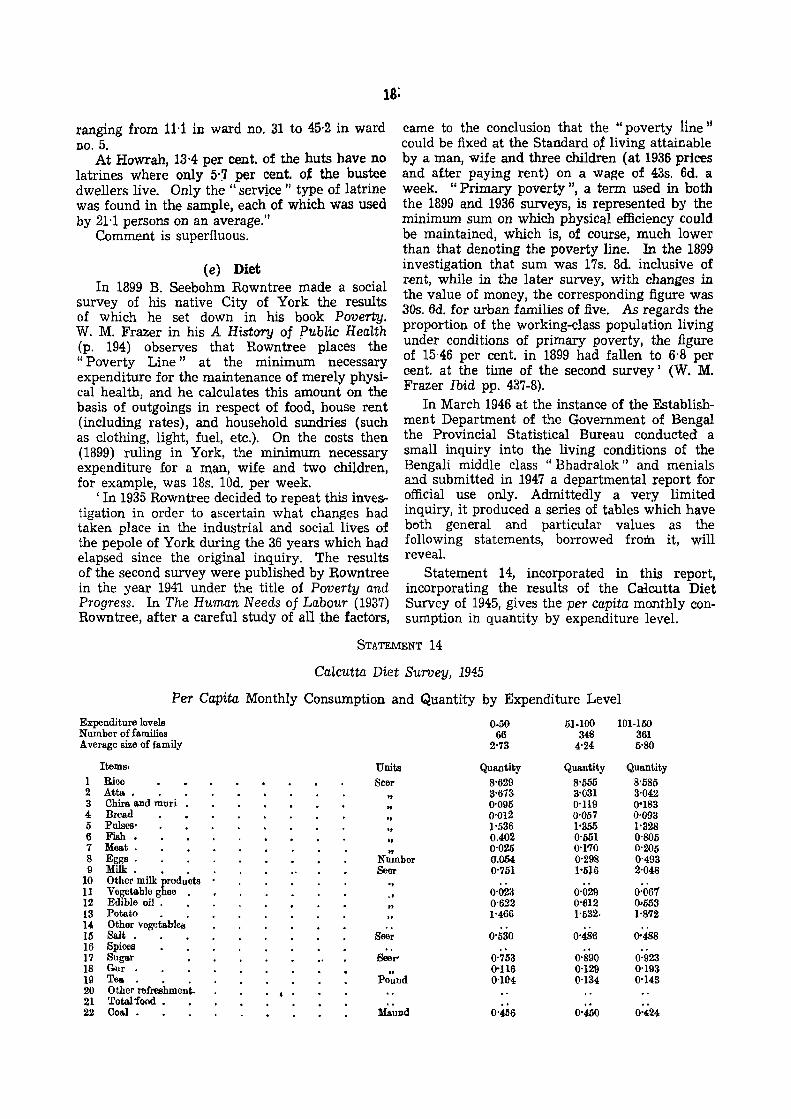
ranging from 11-1 in ward no. 31 to 45·2 in ward no. 5.
At Howrah, 13'4 per cent. of the huts have no latrines where only 5·J per cent. ot :the bustee dwellers live. Only the" service" type of latrine was found in the sample, each of which was used by 21'1 persons on an average."
Comment is superfluous.
(e) Diet In 1899 B. Seebohm Rowntree made a social
survey of his native City of York the results of which he set down in his book Poverty. W. M. Frazer in his A History of public Health (p. 194) observes that Rowntree places the U Poverty Line" at the minimum necessary expenditure for the maintenance of merely physical health, and he calculates this amount on the basis of outgoings in respect of food, house rent (including rates), and household sundries (such as clothing, light, fuel, etc.). On the costs then (1899) ruling in York, the minimum necessary expenditure for a man, wife and two children, for example, was 18s. 10d. per week.
I In 1935 Rowntree decided to repeat this inve&tigation in order to ascertain what changes had taken place in the industrial and social lives of the pepole of York during the 36 years which had elapsed since the original inquiry. The results of the second survey were published by Rowntree in the year 1941 under the title of Poverty and Progress. In The Human Needs of Labour (1937) Rowntree, after a careful study of an the factors,
came to the conclusion that the "poverty line !I could be fixed at the Standard ot living attainable by a man, wife and three children (at 1936 prices and after paying rent) on a wage of 43s. 6d. a week. "Primary poverty ", a term used in both the 1899 and 1936 surveys, is represented by the minimum sum on which physical efficiency could be maintained, which is, of course, much lower than that denoting the poverty line. In the 1899 investigation that sum was 17s. 3d. inclusive of rent, while in the later survey, with changes in the value of money, the corresponding figure was 30s. 6d. for urban families of five. As regards the proportion of the working-class population living under conditions of primary poverty, the figure of 15·46 per cent. in 1899 had fallen to 6·8 per cent. at the time of the second survey' (W. M. Frazer Ibid pp. 437-8).
In March 1946 at the instance of the Establishment Department of the Government of Bengal the Provincial Statistical Bureau conducted a small inquiry into the living conditions of the Bengali middle class "Bhadralok" and menials and submitted in 194,7 a departmental report for official use only. Admittedly a very limited inquiry, it produced a series of tables which have both general and particular values as the following statements, borrowed from it, will reveal.
Statement 14, incorporated in this report, incorporating the r.esults of the Calcutta Diet Survey of 1945, gives the per capita monthly consumption in quantity by expenditure level.
STATEMENT 14
Calcutta Diet Survey, 1945
Per Capita Monthly Consumption and Quantity by Expenditure Level
Expenditure levels 0·50 51·100 101-150 Number of families 66 348 361 Average size of family 2'73 4'24 5'80
Items. Units Quantity Quantity Quantity 1 Rice Seer 8'629 8-555 8-585 2 Atta •
" 3-673 3-031 3'042
3 Chira and muri .. 0'095 0'119 0·183 4 Bread
" 0'012 0'057 0'093
5 Pulses" .. 1'536 1'355 1'328 6 Fish • .. 0.402 0-551 0'805 7 Meat . .. 0-025 0-1'70 0'205 8 Eggs. Number 0.054 0'298 0'493 9 Milk . Seer 0'751 1'5~5 2'048
10 Other milk products ., .. 11 Vegetable ghee . .1 0'023 0'029 0'061 12 Edible oil .
" 0-622 0'612 ().o553
13 Potato 1'466 l'532· 1-8'72 14 Other vegP.tables .. ., .. -' 15 Srut • Soor 0'530 0'486 0·488 16 Spices .- .' .. 17 Sugar Beer- 0'753 0-890 0'923 18 Gur .. 0'116 0-129 0'193 19 Tea Pound 0'104 0'134 0'143 20 Other refreshment. , 21 Totalfood • .. .. 22 Coal • MauDd 0'456 0'450 0'424
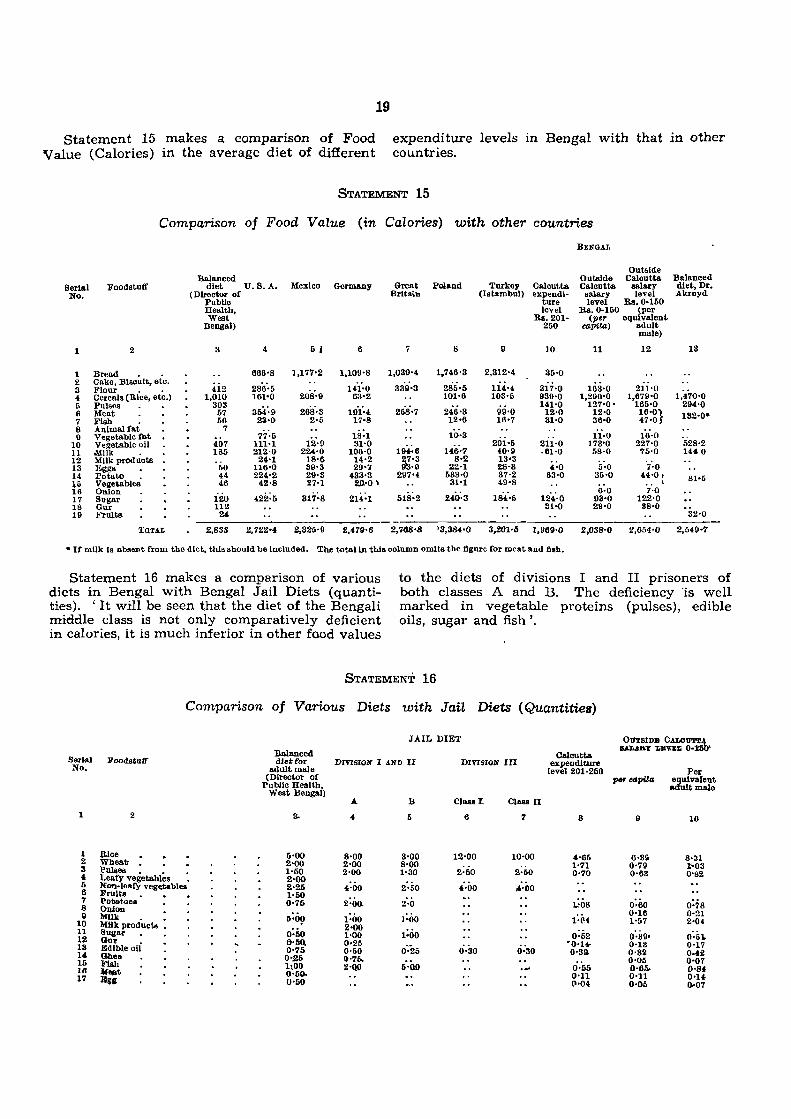
.19
Statement 15 makes a comparison of Food Value (Calories) in the average diet of different
expenditure levels in Bengal with that in other countries.
STATEMENT 15
Comparison of Food Value (in Calories) with other countries
Serial No.
1
1 2 3 4 5 6 7 8 I)
10 11 12 13 14 .5 16 17 18 19
Foodstuff
2
Bread • • Cake, Biscuit, etc. Flour . • Cereals (Rice, etc.) Pulses Meat Fish . Aulmalfat Vegetable fat. Vegetable oil i\{Uk • Milk products F..ggs Potato . Vegetables Onion Sugar Gur Fruits
TUl'AL
Balanced diet U. S. A. Mexico
(Director of Pllbllc Health, West
Dengal)
3
412 1,010
303 57 66
7
407 IS;;
50 44 46
120 112 lU
2,888
4
666'8
286'6 161'0
354"9 2:1-0
77'5 111'1 212'0 24'1
116'0 224'2 42'8
422:6
6 I
) ,177'2
12·9 22.4.'0
18'6 39'3 29·8 27'1
317:8
2,722'4 2,825'9
Germany
6
1,109'8
141'0 63'2
19'i'4 17·8
18-1 31'0
196·0 14·2 29-1
433·3 21)'0 1
214:1
Great Brita.",
7
l,OS9'4
339-3
Poland
8
1,746'3
286'6 101'6
246·3 12'6
10·3
Ho6·7 8·2
22'1 633·0 31'1
24.0·3
Turkey (Ist.ambul)
9
2,312'4
114'4 103'6
99'0 16'7
201'6 40'9 13'3 2:8'3 37·2 49'8
184"5
Calcutts eXf~~~I-
level B.a. 201-
250
10
35'0
3ii·o 939'0 141'0 12'0 31'0
211'0 .61'0
4.'0 63'0
2,479'6 2,748'8 )3,384'() 3,201'5 1.969·()
BENGA.L
Outside Outside Calcutts Calcutta ealary
salary level level Rs.0-160
Rs. 0-160 (per (per equivalent
capita) adult
11
163·0 1,290'0
127'0-12-0 36-0
11·0 173'0 58'0
5'0 36'0
6·0 93'0 29'0
male)
12
211'0 1,679'0
166'0 16'01 47'0
16·0 227'0 75'0
7'0 44'0 I ,
7·0 122'0 88'0
Balanced diet, Dr. Akroyd
13
1,470'0 294'0 132·0·
'528'2 144 0
2,038'0 2,654'0 2,549-7
• If mllk is absevt from the diet, this should be included. The total In this column omits the figure for meat and fish.
Statement 16 makes a comparison of various diets in Bengal with Bengal Jail Diets (quantities). 'It will be seen that the diet of the Bengali middle class is not only comparatively deficient in calories, it is much inferior in other food values
to the diets of divisions I and II prisoners of both classes A and B. The deficiency 'is well marked in vegetable proteins (pulses), edible oils, sugar and fish '.
STATEMENT 16
Comparison of Various Diets with Jail Diets (Quantities)
Sez}al Foodstuff No.
2
1 lLlce 2 Whe .. ~ 3 Pukes. • . 4 Leafy vegetables • ~ ~~il~"'fy veg'ltabJes 7 Potlatoea 8 Olllon 9 MIlk • •
10 M1ik producld • 11 Sugar • • 12 QUI' • III Edible 011 14 Gheo 16 Fish 16 If .. t 17 Hge
:Balanced diet for
adultmaJe (Director of
Public HeaJt.h, West Bengal)
S.
5'00 2'00 1'50 2'00 2'25 1'50 0'7(",
5:0\, 0:60 0·50, 0'75 0'.26 1:00 1)'60-0'60
JAIL DIET
Calcutta DIVISION I AND II DIVISION III expendlture
level 201·250
A B Class I. ClaBSn
.( 6 6 7 S
8·00 S'OO 12·00 10'00 4'66 2'00 8'00 1'71 2'00 1'30 2·50 2'50 0·70
4'00 2'50 4.'00 ,,·eo 2'00. 2'0 1.:08
1'00 ],'00 1:£'4 2'00 1:00 1·00 0'62 0·25
0"20 6:30 '0'14·
0'60 0'30 o·sa IH'I). 2'0.0 0'00 .... 0·65
0'11 (l'04
OUTSIDB CALOtJ'l"U ULAay LBV;XIi O-:mtr
Per 11M' eapittl equivalent
adult male
9 10
6·89 8'31 0·79 1"03 0'63 0'82
0,60 0:78 0'16 0·21 1-1,7 2'04
0·39, O·fil. 0'13 0'17 0'32 0.42 0'05 0'07 0'0';' 0'84 0'11 0'14 0'05 1).-07
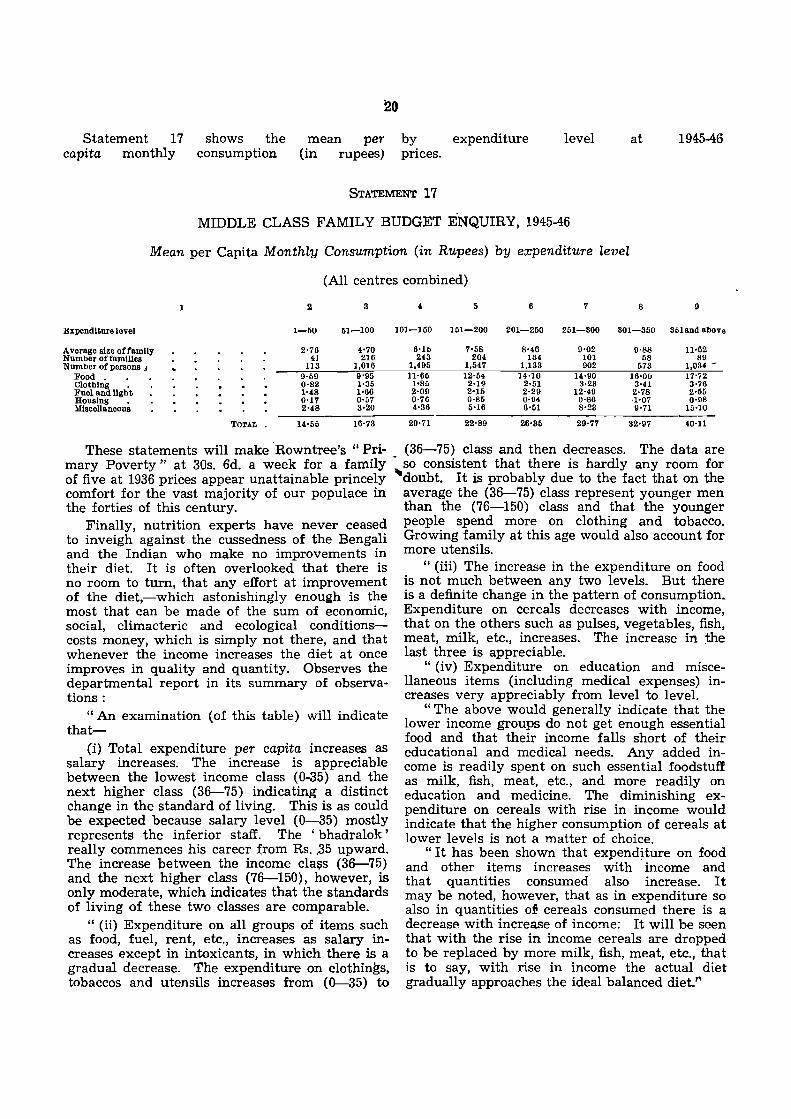
Statement 17 capita monthly
shows the consumption
20
mean per (in rupees)
by expenditure level at 1945-46 prices.
STATEMENT 17
MIDDLE CLASS FAMILY BUDGET ENQUIRY, 1945-46
Mean per Capita Monthly Consumption (in Rupees) by expenditure level
(All centres combined)
Expenditure level
Average size of family Number of families Number of persons J
Food. Clothing . Fuel and light HOWlIng . Miscellaneous
1
TOTAL
2
1-50
2'76 41
113 9·69 0'83 1·48 0'17 2'48
14'55
3
61-100
4'70 216
1,016 9'95 1'35 1'66 0'57 3'20
16'73
4 6 7 8 9
101-150 151-200 201-260 251-800 301-360 351and abOve
6'16 7·68 8'46 9'02 9'88 11·62 U3 204 184 101 68 89
1,495 1,547 1,133 902 573 1,034 -11'66 12'04 14'10 14'90 16'OU 17'72
1·85 2'19 2'51 3·23 3'41 3·76 2'09 2'16 2·29 12'49 2·78 2·66 0·76 0·85 0·9-i 0·86 '1'07 0·98 4'36 6'16 6'51 8·23 9'71 15·10 -------------------------------------20'71 22·89 26·35 29·77 32'97 40·11
These statements will make "Rowntree's "Pri- (36-75) class and then decreases. The data are mary Poverty" at 30s. 6d. a week for a family ~ so consistent that there is hardly any room for of five at 1936 prices appear unattainable princely ~doubt. It is probably due to the fact that on the comfort for the vast majority of our populace in average the (36-75) class represent younger men the forties of this century. than the (76-150) class and that the younger
Finally, nutrition experts have never ceased peopl~ spen~ more. on clothing and tobacco. to inveigh against the cussedness of the Bengali Growmg fa~lllly at thIS age would also account for and the Indian who make no improvements in more utensIls. their diet. It is often overlooked that there is " (iii) The increase in the expenditure on food no room to turn, that any effort at improvement is not much between any two levels. But there of the diet,-which astonishingly enough is the is a definite change in the pattern of consumption. most that can be made of the sum of economic, Expenditure on cereals decreases with income, social, climacteric and ecological conditions- that on the others such as pulses, vegetables, fish, costs money, which is simply not there, and that meat, milk, etc., increases. The increase in the whenever the income increases the diet at once last three is appreciable. improves in quality and quantity. Observes the " (iv) Expenditure on education and miscedepartmental report in its summary of observa- llaneous items (including medical expenses) in-tions : creases very appreciably from level to level.
"An examination (of this table) will indicate "The above would generally indicate that the that- lower income groups do not get enough essential
(i) Total expenditure per capita increases as salary increases. The increase is appreciable between the lowest income class (0-35) and the next higher class (36-75) indicating a distinct change in the standard of living. This is as could be expected because salary level (0-35) mostly represents the inferior staff. The' bhadralok ' really commences his career ~rom Rs. ,35 upward. The increase between the income cla~s (36-75) and the next higher class (76-150), however, is only moderate, which indicates that the standards of living of these two classes are comparable.
" (ii) Expenditure on all groups of items such as food, fuel, rent, etc., increases as salary increases except in intoxicants, in which there is a gradual decrease. The expenditure on clothings, tobaccos and utensils increases from (0-35) to
food and that their income falls short of their educational and medical needs. Any added income is readily spent on such essential foodstuff as milk, fish, meat, etc., and more readily on education and medicine. The diminishing expenditure on cereals with rise in income would indicate that the higher consumption of cereals at lower levels is not a matter of choice.
"It has been shown that expenditure on food and other items increases with . income and that quantities consumed also increase. It may be noted, however, that as in expenditure so also in quantities o:l! cereals consumed there is a decrease with increase of income: It will be seen that with the rise in income cereals are dropped to be replaced by more milk, fish, meat, etc., that is to say, with rise in income the actual diet gradually approaches the ideal balanced diet."
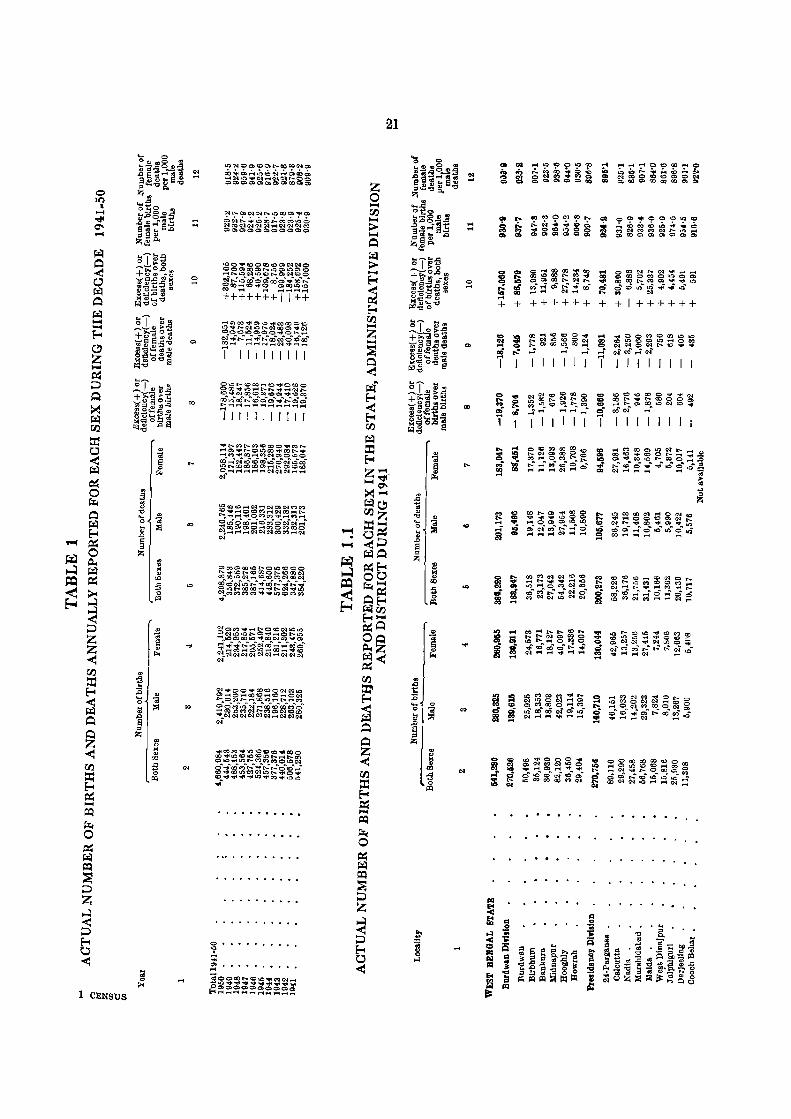
1 CENSUS
r:..
'" ;J ~
[I
"" ., '0 "2 ;:E1
...
lO'NOOCOOr;....Q)~l'No
OO~~.:.n~c:O~.:.,~COO ~~~~~~~~~g5
~l
...
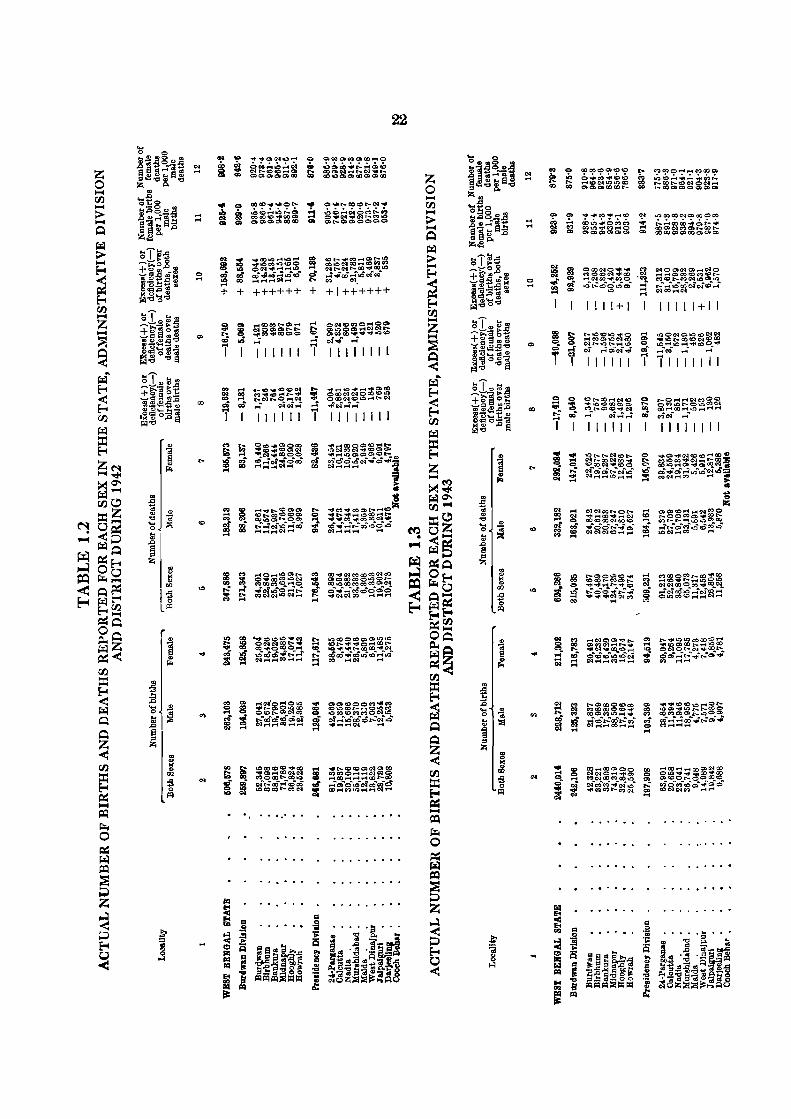
r
'I ... I'«
.. 0 aotC~"Qt--aD • ~cO~~r:..Q ~ ~ ~~8C:~~
~ ~ ~~~~~~ ! ~~~~~§~~ ~ ~ ~=~~~~ ~ ~~~~~~~ + + ++++++ + +1++++++
','
22
...
'"
1111+1
r:-.~COI.O~O ..... t;t)OtO~oo (N~IOf:'..f""i.o
ci ~~~c.f~
I III I I
11111 I
11111+11
1111 I III
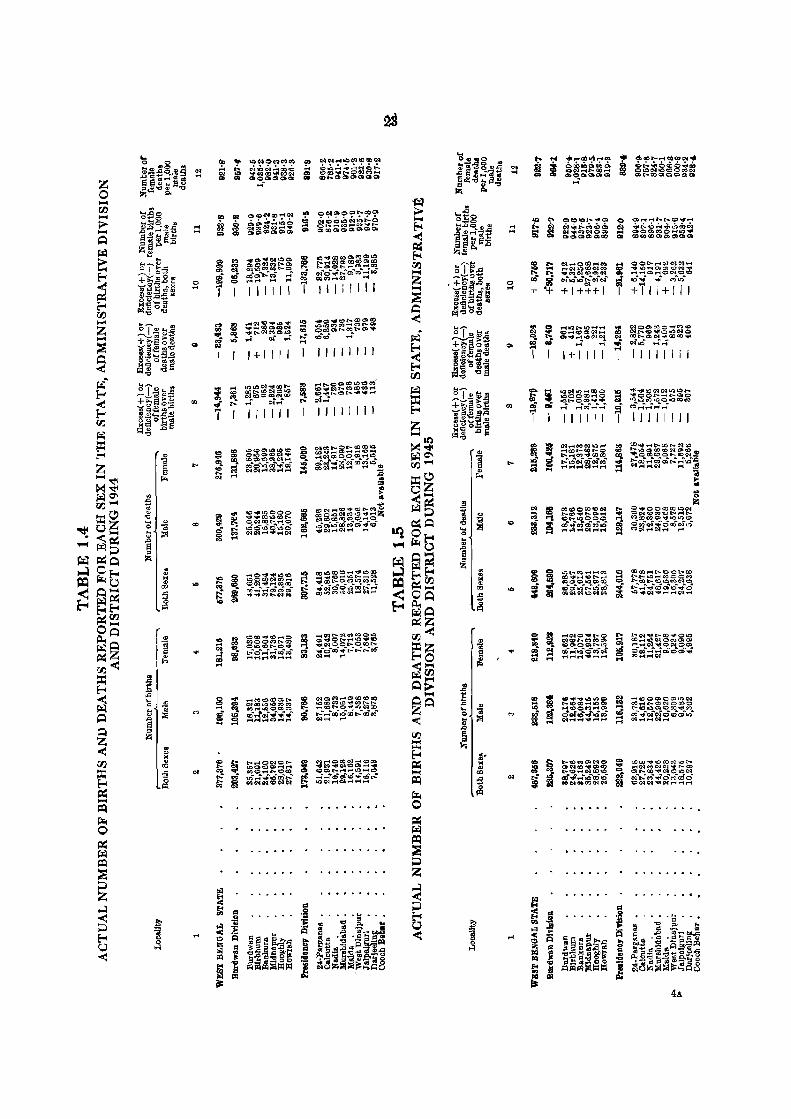
t(j "" ~~OC')V-I.oo
"'~ t;..",';' ~~~;i3~ Q.OQ~QQ:I .... -
00 NIN ...... .o~tCQ)C1 .:.. o~.!.t~:.,~'O.;..
I ~~:S~~~;:
. ,
.... ....
o ..
...
...
i i "1"'t~a6 .... CQ 6oocaa~& lQ~"",,t-.to" ~OGQQQ .....
1+1111
II II II
44.
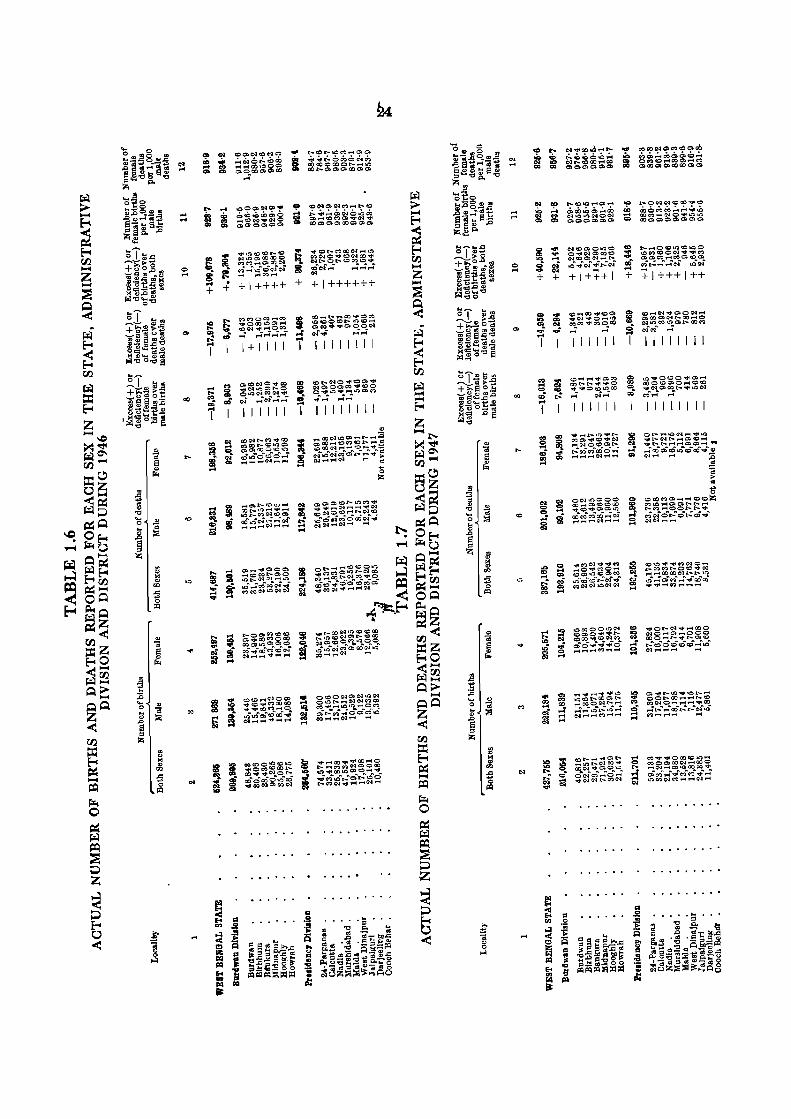
...
..
....
lOO~IN~'" OtDcCOO OO _eoC':l~INO ~Q~~~~
:5 .!:I ,0 .... o
I
...
..
t-oofOaQI""4c::D1""4 .a
~~~~~~ ~ ~OOO~O) ~
~O~CNCOOO""'=
ciJo~cQ~~~~ OOC¢,.....!e.lO~~1t:I OOO)CI:IQaOOc::D
~t""'fOC'Q..nCOlL':lO lOQ)COO(N"IItI'<'1ICQ ~"!.C':I ... "1.CQ.,.O~"!. c:Qt-,.....!I""4~ \OC'I
+1+++1++
111111 II
lO"IfIOC:OO.q.tQ:l1""'t OOOCOO)OI""'t¢lCO ~ .. (N ... c::Do) .. ~"'l.OC">I
"' .... .... I I I II I I I

...
..
+
~ .., "" ".: ...
00 .., 00 .,: ...
... .... .....
.,: ...
+
'" <0
<0 .., ... -.... .....
'" .. 0>
'" ....
... CO
~ .....
+
..... '" '" '" .....
<> 00 .... .,: ..
+
+
+
.., ~-..... ...
'" '" ....
,., o QO
o .....
! +
.... '" '" '" ..,
... o ..... 0"-
::: ... ... -..
+
"" 0> ...
... 0>
"". ;:;
'" ... !: . ..
o <Xl .... ~ +
.. <0 00
..,. ~ ... ...
'" 6 o 0>
+
.'I ... -... 00
0> ... "" '"
+
.... 0> QO
06:
o "" 0> ~
... 6 '" ... o .., .... atS
+
.., '" '" eN'
+
<0 .... ....
'" '" .... .... -
1
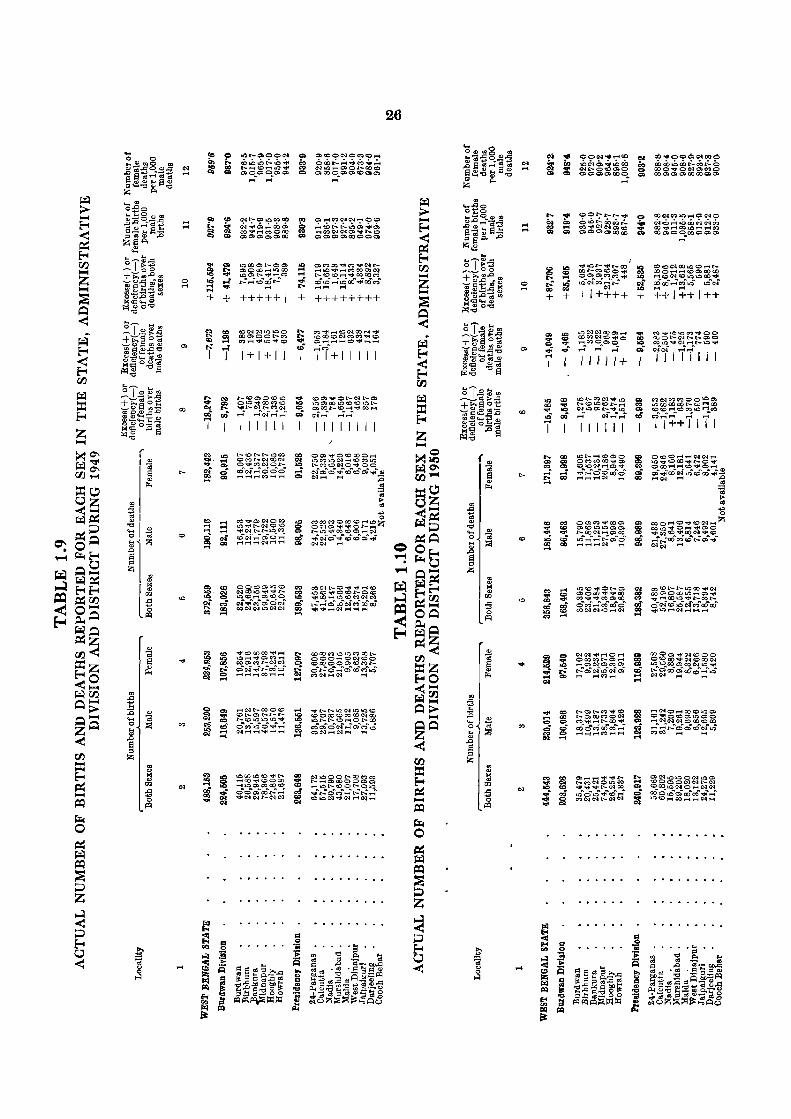
...
,..,
~~~Oo~ e ~~o~~~~~ ~~~~~~ ~ 6oo~~~~~~ ~~~~~~ ~ ~~~~o~~~ oo~o~~ Q Gooq~o~~Q - ....
<:-It-~I.QO':IOO
O-t~~~ooQ:. (Y,)..;t 1"""1 eQ 000 QOOOOOO
~ ~ ~~~;~~ ~ :;;f ~r-i'cO~';
+ + +++++1
1+1+11
l----ot-t-tQ«I cocot-O.JG()~ O'<tl~C"lOl'-
eOc-i''''';oo~o r-11-h·ooIi;Qr-'I..-1
II I I I I I I
26
,.., ,..,
c ,..,
<Xl
...
'"
....
OOo:lCQlQ.-(OC"iQ 0:.6~.Qoocn~~ 00 "<ifr-lcY:)lQr-'lr-1C1':1 00000::: .. 00000
f.CIccO;&OOlQCOI"""lt--00 O!""'lf""'l (OG1:IOOOO r"'iCCOlC:OlQlOClO"IItI OOOO ......... CQ .. IQ .. l/:;j"c:;I"
++1++1++
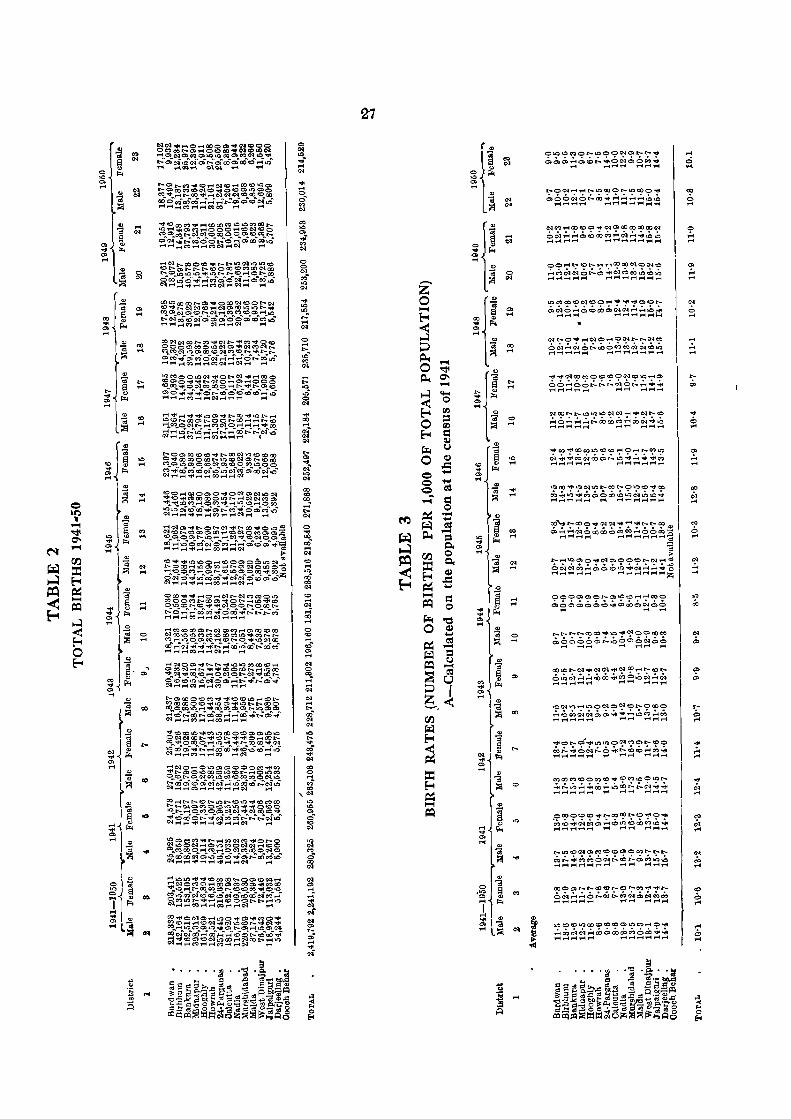
~o::I~-.::II.t--or.....Cl-.::ll_t...OO~OlQ.!:2
;J .. ~ .. qg .. ~~~~_~~~ .. ~ .. ~~q_g~~ 001"""llQoeoC"lOC'Q1"""I~QCOC)'o::tI= 1"""I1"""I1"""I-.::IIl""'ir-ll!'<':l.-t1""'tC'l ~
~~~lOlOOT'"""ltOOOO&LOQ'lm ~ .. ~ .. ~ .. ~ .. ~ .. ~~ .. 8 .. ~ .. g .. ~ .. ~~~ .. ~ OC'l~-.::II\O~cr.l~C\1l':\1O(OO)lQ C'lr-l....-4-.::111"""1r-1e¢1"""Il"""iCN ......
'" .,. '" ... -... .,.
'" oQ
'" ... -'" .,.
27
... ... 0> ...
o ....
OlQlQI;OOt-lOOOQ-tCtl('..o.t--<IfI QO~~ocO';""'6~oo~.,f.
~ "1""1 ..... 1"""1 .....t ............
t-O~"""'I"'1c:--tOIX)Ot-o.lQC(Jo ... QOO~os::.OO.,f.":"~~~~tO
...... 1""'1.,......... ......1""'t ...... r-4 ..................
~co"""(t)coC)"I:tIC\lOC()C()COoo~
o~~~o<OtOco.=.t~~.:,.~tO 1"'4,.....~,..... ........................ ~1"""1 ......
OO~r:..o:o"'"' ...... ~IX)O::OO10:0O'$tC ~o-:,;:.~o.;.~~~O-:'~.a~tO ...... .,...,................. r-("""r""'II""'''''''''''''r-4
C\lt-o""l:!l ...... C'I~ ...... I:C~t-.t--C'lCQ 6~..:..~6~roocQcQ~~ccaO ............ ,.....1"""1.,... ...... ,......jr-4'1""'t1"""lr-in
<o1I'o::tIQ.lOO~OfOCOO~COlQr-IC»
66;,ooi-i-,;,C:.oi-~~~ 1"""I1"""Ir-i"""...... ,....r-i ........... r-4
Qq';OOt--l':'-LQlQlOQqcq ....... "'It!cqt--co
~o..:..~~i-ooooco~oo;.~.o .-4.,....1"'"1.......... ,......jl""'l 1"""11"""I1""'t
<o1ICQ~OOeo:lQCO<Or-401"'"l.t-C:OLQ
;..~~~~oo~i-~..;~~.:,.~ ....-41"""11"""11"""1.-1 1"""I"""'''''''1''''''Ir-i1''''''l
IQC()""I!tt\Qcq'\Qr-..COl'-OlOCO~CQ
;:''';''~':''eQoocOaO.oOttO~':'' """1"""IY""'Ir-I1"""I r-I ~""'1""'t1"""l"""r-I
0000 0) O~CtllQ<::o""'" r-ICQO ~o';Oo,o,~~Qoocb~';o ... ... ....
t-- .... t-t-OOO:O~\Q~010~OO~ ~o~oo~.;.~o~O~o,o
1"""1 _1"""1 """',............ l"""i
1001 \Q''''',no001 O)O'(~ t- 0 000 ~~~~~~o~..;~~~;.~ ........... """',.....1""t ...... ,..... 1"""I1""'Ir-I
~CO""'o{~~lQoQ'lCQO)r--COO cr.,;....;,.6;.~6~~¢,COH~~ ,..... ...... 'P"'Ir-I'I"""'I ~ .................. ,...., ......
«IOO~c:OOO"il¢l~a:lCQlQOIO.t--
~ ;_.~,,:,,~oo~.coo t-~~':""; r-Il""'tf""'l1""'tr-l ..... ,..., ...... """"""r-i
OOOOCO(o'oo:fIl'-ooeQOOt-CO-.::llO"lfl ~eO~;,~o~cO~~oo~.o,,; '!""'(H'f""'{ ..... '!""'( ....-I 1""'11""'1 r"I!""'I1""'(
r:-..ll')CO~~CI:I~CO~QI!'I:)('oo.t--l'-
eOr:....;~~6~;..c:O,;..oc:Q'O,.Q 1""'11""t!""'4t-i!""'lr-l ...... r-Ir-4 ...... r"l1""'I
C()O)Cf)r:-..,t,-..oo-cgl"'-O ..... I!'I:)"d4~~ o;.~~o.;.~.;..o,~o;:.co«. ,.....1""t1""'l""'.-I ,.... ...... ""'''''''''1''''''4
~(OCOlQOOCOCO(COlOC'!) ..... O"'lfl ~~~tN~cD~oo~co6c:Q~..; ..... l""'Ir-I.-41"'"1 .,.....1""'IY""'I,.... ...... 1""'t
... o ....
<0 6 ...
.... ;. ....
'" ;. ....
'" .. ....
.... .. ....
.... b ....
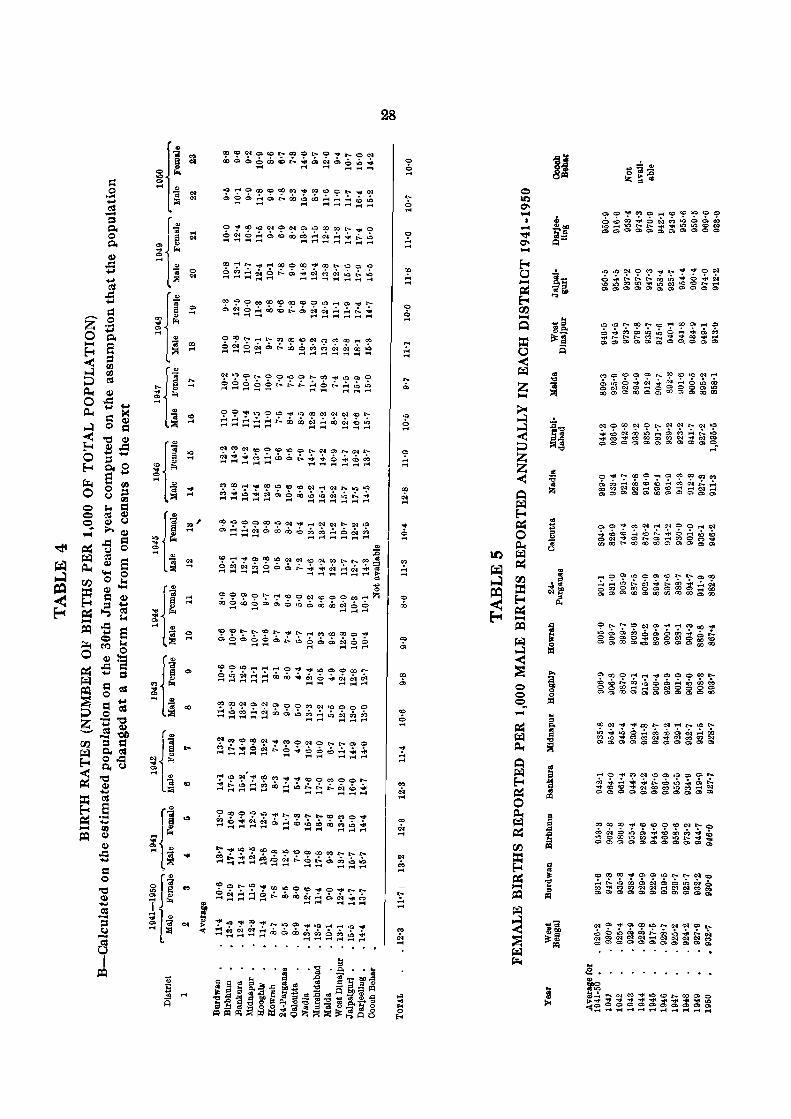
OO(Q<N:QtOc--~CC.t"-O'O:flr--o~ coGaocotD.;.....;.Q:.cN~o~ ..
1""'1 1""1 r-t ,...""'_
t.Q""'OOlCOQ()t'Q .. CQ(QO ..... ~~ ~6a.=.tot..ciJaO<i>r!t,:..;.tOlO
r""I 1""1 1""1 r-trlrll'""'il"""i
O .. Q)lQ~QCNO::II..QCO~t--'$O 6;.o.=.totOoocQ~~;..,fc.;.~ """r-t .... l"""I I""1l"""1l"""il"""il"""4l"""i ....
a),.... .... 'ootII"""4Q()OOO'otlCOl'-(Cc:»lO 6cQ.=.tc..6';'~";'Ct~O-J~';"tO 1"""i,.... ..... ,...1"""4 1"""4r-t1""'l.,...,,.... .... 1""'1
Q:ll.QOt---OOlQOt-CO"l:!tlOQO Q6606';'''';_';'''':''6i..~~~ .............. ..-.4.-1 ..... ,.... '1""'1""' ....
C"I~(N~O::'COlQOl:'-oQ\lO ..... C'l .... ~~.;,.co~oooi..~~6~o:C;" 1""1 I""""i ......... 1""1 1"""4rl'l""'l....trlr-ol
~COI""1 .. GOI.O(C(QQ\lI""'i~l:'-olQ"O ~~~.;~~6co~.Q;.~.;.~ 1""""11"""11""""1"""1"""4 rl 1""'I....tI""'il""t1""4r-t
COi.QCOo)OOlQ.Q\I~""01CNl'-~1..Q o~~~O~®tOcQcQ;"6O:t~
1"""41""4,..... I"""Irll""'ll""'lr-j1"""i
'" :0 C'oOl"""I"'IIttO)C1JlQOlC\1(C~COl'-""CQ~ 6;:';'~6aor::.~.;..;.~~".;.~ ..... 1""'11"""1......... ""rlI"""l1""""lI""""irl~
.., o
0000""''''' (COOl c:O OOt:Qt-IZ ci,6G06oo~~oooooO:t6b
..... ..... r1r-1t-1
28
Q
.; ....
00 .:. ...
'" .:. ...
...
.; ...
'" .:. ....
.,
.; ...
...
..:. ....
..,
.;, ...
'" . ~ ...", .... ~
COCQOO"'lflCOCOOCOC"l .... e;, eQ~~~o~coooc::,~tO ~8~~~~~~~~ot.:
I:OCQOO~OQlt)t- .... ~o ~.;...ooo~~OOtO;,o CO""COCOC'lC"t ..... lNo:I~O) OCbOOOOQ)OIoo)Oo:..
Qt;IQ"'lfla.COu)t-fNfN~c:...
~6J:,':oeO":'ootO~;';' ~g;~~~~~~~~~
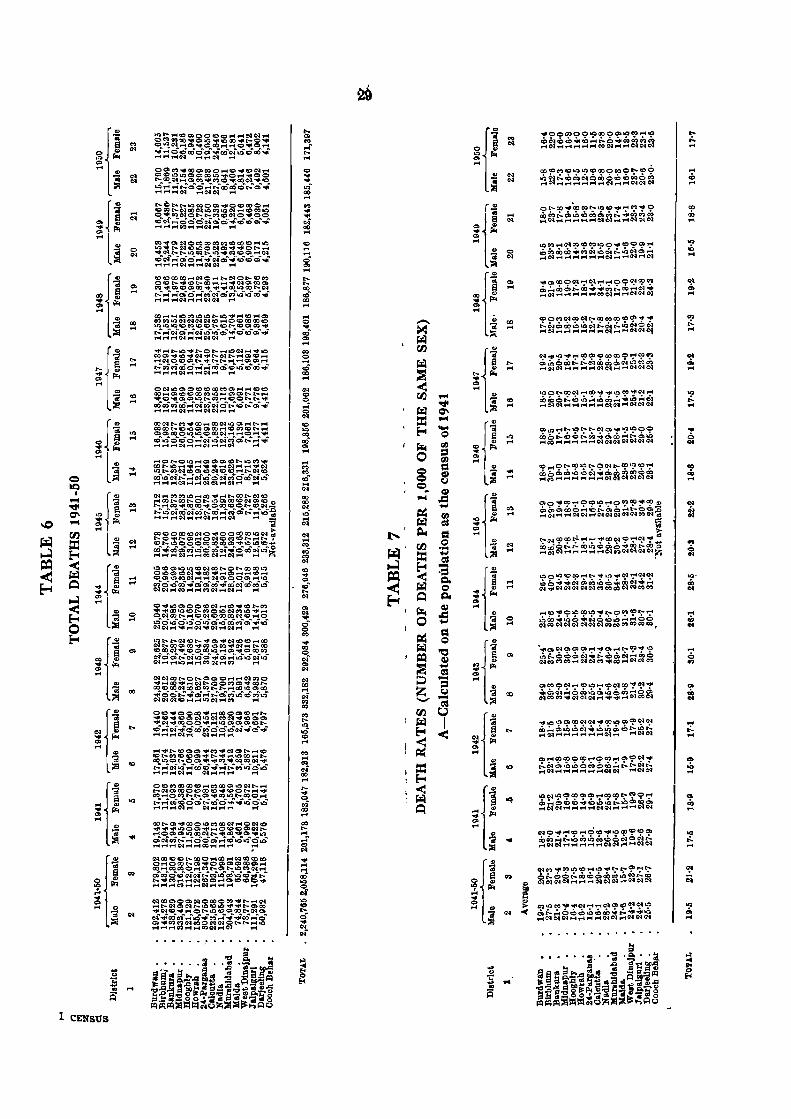
1 CENSUS
g~S~~g~~:g;;:;:~~Q .......... "' O~:-d-:;"~;:"~:-:"~:; !"""4 ~CN .... ,....~ ....
~*~~~g~~~~:!~g:S ~"'~"~~:"d:"~:"~~~:"~ 'I""'f,... .... ~ r4~~ ....
:O=~~~81gg~~:e~g:6 ~= .. ~~~~~ .. : .. ~~~~~~ ........ ,...CO .... r-iC'J.... ,...
Q.1T""(~=lQI""'lOO0d4 ..... ""'OO,t..c-1C:O .... CO.l'-GOt'-oQc:-.100HlOfDI:'IO(O Q)
~~~~~:-::~~:-~~-~ .. ~~ ....t .... .-IQ'I ........ C\I ......... c:;I ....:;
~~~ie~::!g~g;;~~~~~ CClr:--1QOOO~COOOc:D.lQU)CO.,..;;.
~ .. ;!~gf~~g~~¢!~ .. ~~\C)~
(X)t--O)",,"OOOlOCQOOc-troeOQ:lU) ~'ofS~lQoa"'r4QtQ(QQCNt.,..cOO)Q:l.lQao~t--..tIOO~Q)~lO
c)cNeti,;,,;ooa...1tDaQli$o.o .............. cNI ........ CO ........ ,.... !"" O1<tl~cDt--.aoO ...... (t) .... Ct)(t)CX)CO Or-tOO:H' ... 0I ..... 0CD~aClOQ~ ClO .... c:t:IeoOr-4CQl'-C1lt--lQO':I~1'""I
~~g~~ .. gi~~~ .. ~;git~ !"""4 ........ COl""'f .... OI............ ....
.. Q co , ..... .. .....
'" .... .... on 00 ..... co ... .... cO "" .....
'" ..... ..... 0'" 0> ..... .. ..... 00 <tS 00 ..... ..... '" .... ~ ... ..... '" o ..... <tS 00 .....
~ '" ..... '" ... '" ",
'" 00'
'" .....
....OOCOOOiQ«IQO>lQC') .... LO C>~~~ .. i:I~~6.:..~~c::,~ ...c~ .... f"'t .... ,...r-ICQCN .......... CNIN<N
.. ... ..
.... '" ...
IN Q .....
..
.:. ... ~ co .....
",.
ci> ... ... '" ... ... .:. ..,
..
.;. ...
'" .;. .....
'" Q ...
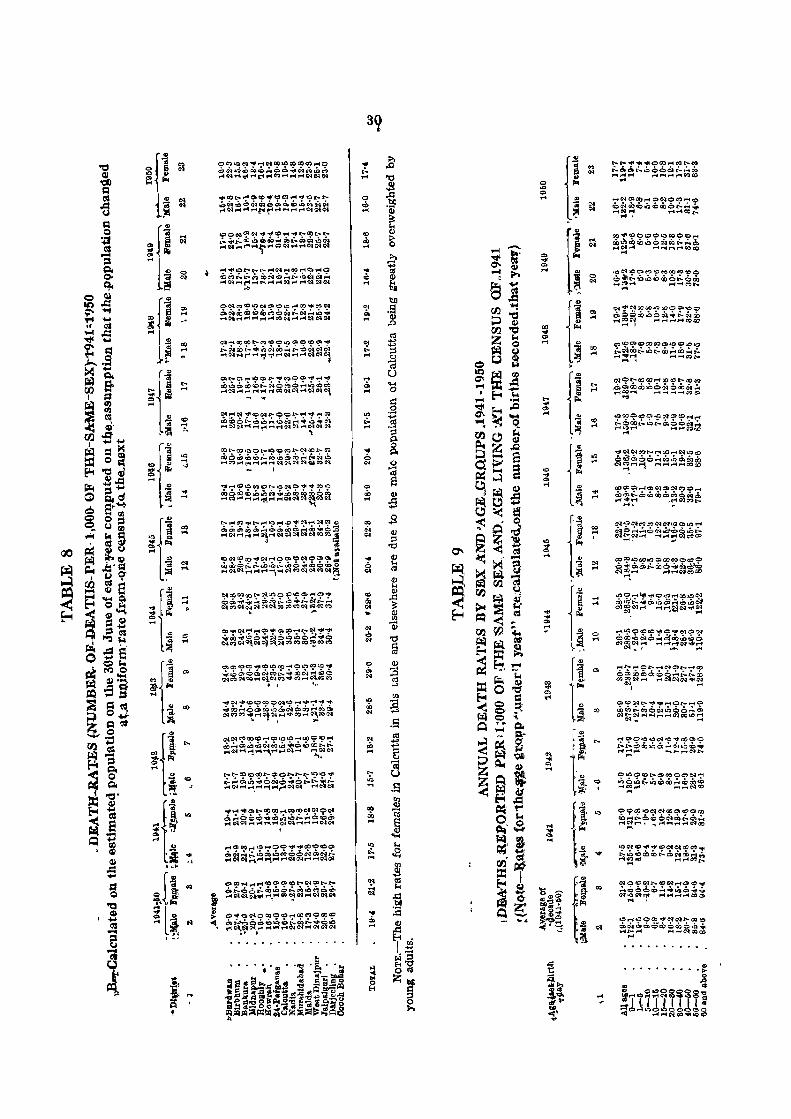
C?~~c:::'~~~'!J~~~~":'9 <:OG>l"IQ~CO-fQ-"oO"""'~t:QLQQ':I ,..,colN" ..... l"'trt~(;'f,I1""t .... I"'I~(N.1N
~"*'lQ,r..t-.['."~ .... ~1""1~1""'IO ~~t=.t-co~~th;...;...Q~O"~ 1""'I~ ..... r"'I"'I" ... I"""I~~ .... oQ.I~C'Ii
'""
Q11""lQJoO,t-..C'Oeo=lQ~QCX)"';t
~o..~t..~~~cO;,,~~~~c.:. T-4o:a~rl"'h;l""T""f~~r-tt'l~'
a;.r;..~l""'IkQQ)I:'oo~CQQQ:I"l'f4~~
~i:nQ~cO¢'':'' ~oe06.=.t~cC';' 1""'I~1""'t~ ......... .,.,.C(lQo.lC'lI"'l~~C'\
Qol!""'(Q-l'<:tI<Oo:It--QQt--'t""'t-.flT"41:0 cbtOQt...~~~cOiN~~.o,,;,~ """'c.1Q-1 ..... 1"""Ir ......... C'lC1.-t-::~~
ct:lc-.«)LQOt-lQfOeor..o:a~l:'-=-:'
c06crQrDi-eQ.Qc;~~~~~ r-ir:'QI"'1C"'11"'1I1""'1""t~:Nc:-tQ1~C'I
~~-.tIf,OCOCQOQolO:O"""~""'''~ ~oo~6Q,'»~&cNQt:C;"~a ~o::IO':-""tI""4'1~I"'o::fIoCt:lr004~~~
"11:111""4"'0r--cx)CC"'I:QCO~~O~ O':'Q/QrD~cO~J,;".!4=~C> .,...~I;'II""1"","""I""4C'lt:\lr-t.,..-tr-iC'1~
I
r;4~~~~~9~~~~'?~C? ~&f~~~~~~~~~!::~~
.. ... ....
... ,;. ..
...
.:, ..
'" .;. ....
t;:'-':"'~"1'~9~':""?t:-~ l'-oCtQt...~OQ~~r-I~ ,....,....... .....1""I1"'11"""1CQO) ...
~C:)t._C(l tXJ""'::o =.t-- rD (Q
.a&oooot06?t6~~~ .....-I;:f""'Ii ... ~,...,""""¢':~
tOe?~~O:Ut:/.I:'iI~~I""'f""'" t..6tO;"~';"~oeCC-1':" ~~1"""t 1""t!"""'l~OO
~~<?~~~~'1'9,?9 r..~¢:I~lOO"""o.~...oCO"ltl ""~,..J ,....,.,...,~Q\lr--
lOII""fIOQCO""OI-Nl'--02q) c;.cNa.c!»~G-J6&J6~..dI """""",.., 1""f"""CN~Q) ...
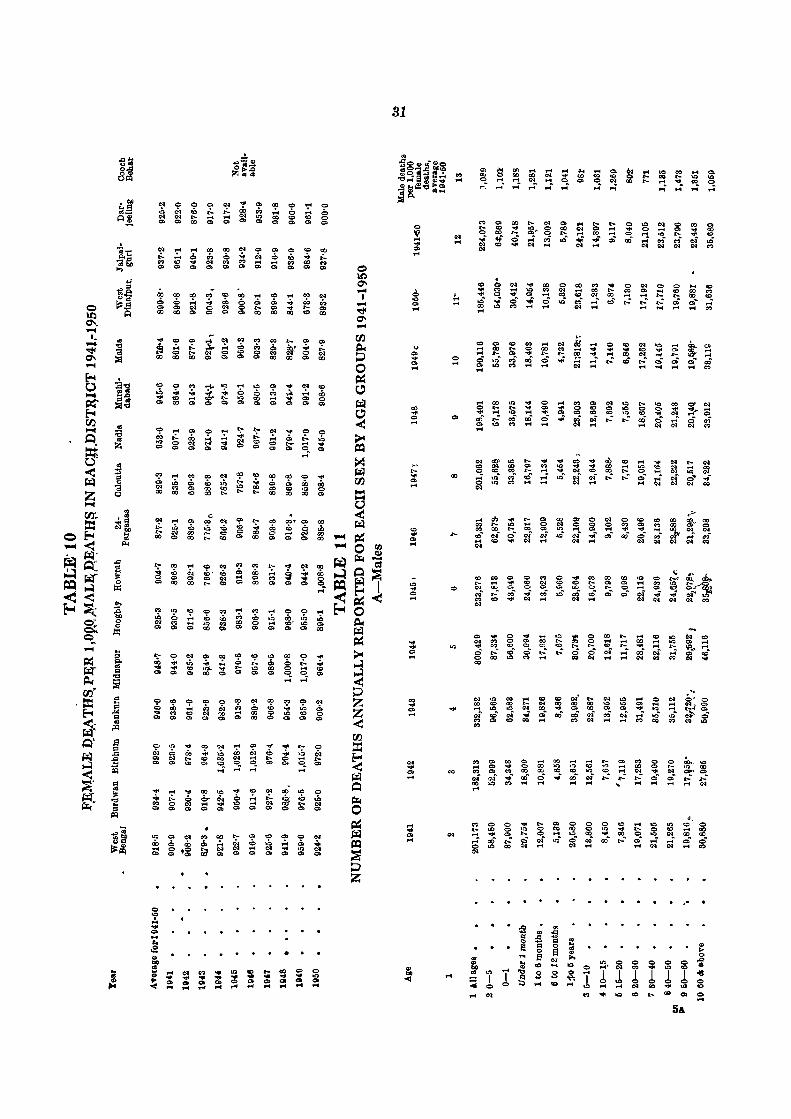
.. . ~ ..... "'",
~
~ ~ ~ 00 00 ~ Q Q G ~ ~
~ ~ 0 ~ 6 ~ ~ 0 ~ ~ ~ ~ ~ ~ ~ ~ ~ S S ~ ~ ~
M 00 00 ® ~ ~ ~ ~ ~ ~ ~
~ ~ ~ ~ ~ ~ ~ ! i 5 ~
m ~ Q ~ ~ " ~ ~ 0 0
~ ~ ~ ~ ~ ~ ~ ~ ~~~
00 0 ...
g ~ ;i: q 0 Q .... ,...;
9 ~ ~ ~ ~ ~ a ~ ~ ~ 0
~ ~ ~ ~ ~ ~ ~ ~ ~ ~ ~ ~ ~ ~ Q 0 ~ 0 = 0 ~ Q
~ ~ ...; "
• ~ Q ~ ® ~ ~ Q ~ ~ ~ ~
~ G 00 G ~ ~ ~ ~ ~ G ~ S ~.~ ~ ~ ~ S ~ ~ ~ ~
• " f ~ g ; ! ~ ! ~ ! ! !
81
o .., ... ... "" ...
6 '" '" ...
... '" ... '" ....
00 ... '" ....
-, ... ... '" ...
<CO .,. "" ...
'" ... "" ....
... ... '" ...
'" ... '" ....
.... ... 0> ....
...
o ....
, .
5&
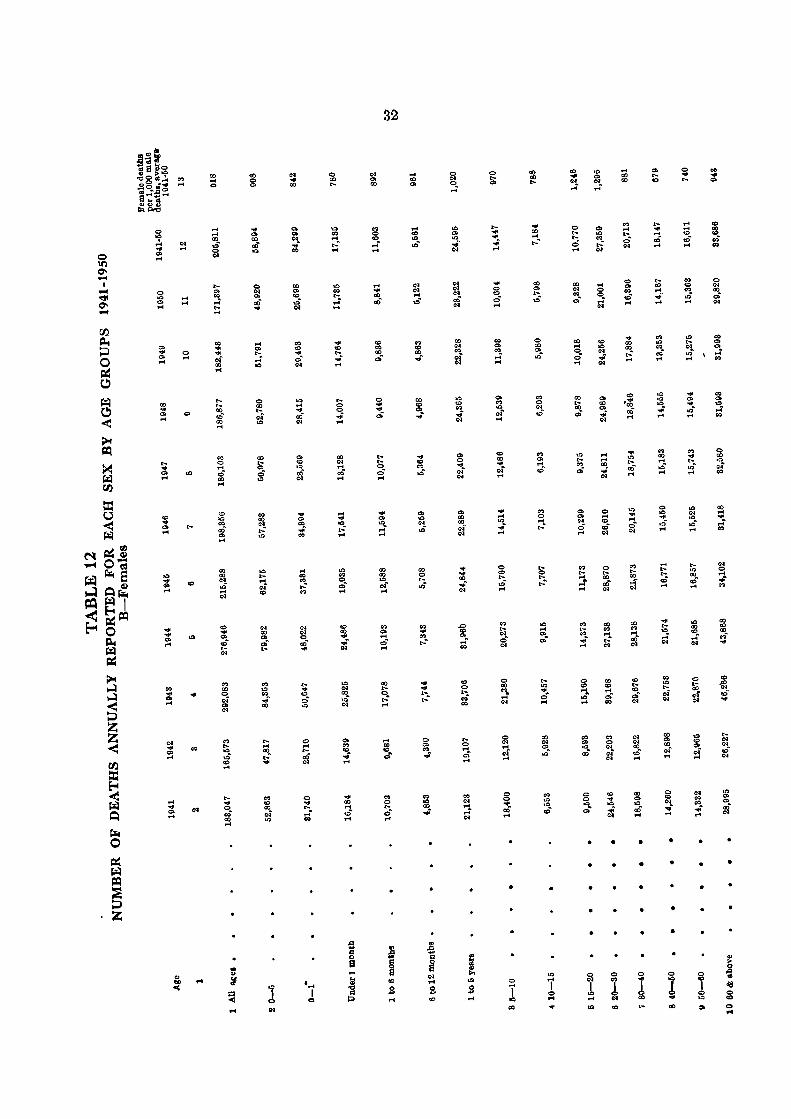
o '" '" ....
'" ... '" ....
00 ... '" ....
.... .... '" ....
'" ... '" ....
'" ... '" ....
... ... '" .. .. ... '" ....
:;;: '" ....
C>I ....
.... ..
o ....
'"
00
...
...
00 .... '"
tO) ., .... .... ...
'" ... ... ~ ...
.. o .... .,; QO ....
'" ... '" .,; .... C>I
.. 00 o ~ C>I
.. .... ...
.,; '" ....
.... ... o oi' QO ..
..
00 .... '" o ...
.. 00
"'. .... ...
.. '" .. ..;: 00
... .... 00 ..: ...
.. '" 00 oS ...
0> Q ... .... CO
'" '" '" ",. ...
... '" ., ..;:
'"
... ... '" o '"
o .... .... gf
o .... ... 0;
. ... I
c
o 00 ...
'" .. .... ..... ....
... '" t-..;: .. ... o o ..;: ....
.... ... '" ..: .. '" ., '" o ....
~ ... .... ...
"" ., '" ..;: ....
... 00 .... ..r ....
.. '" 00
.,
32
~ .... ....
... co ~ .... ....
00 00
'" .... ....
00 ... "'. ... ....
., o t-o ...
... '" '"
'" ... .... .,;
00
'" co ..;:
00 o ... .,;
.. ... '" ..:
... ... ..... ....
'" :2. ...
.. 1 ... .... S CD
... '" '" ..;: ...
'" '" ., ..;: ...
'" o .... ... ..
... ... 00 ... . ...
'" o t-:. ., .,
.... o ..... '" ..
.... ... ... ..;: .. ... '" '" o ....
'" '" .. .... ....
'" ., '" oS ....
'" :r ....
... .... '" .... .. o
'" .... '" ....
co ... '" o '"
~ ..... ... .. g ... oi' ...
•
'" I ..
... 00 .... ....
o 00
"'. '"
.. '" ..... ....
'" .... "'. '"
t
'" .... o ...
7 o .. ...
'" .... ... ....
o ... .... o .. 00
"" '" ",.
00 .... c,. o ...
0> co
"" o ....
'" o ~.
•
•
•
1 ... ..
.... o o Qj
Co 00
'" ..;: .. ... .... 00 ..;: ...
'" .... '" ", . .. '" ... 00 00 ..
00
'" .... '" co
'" ... '" ..;: .. •
o
1 "" '"
., ... t-o ""
to
'" ., ..r ..
'" ,e:; 00 ....
'" ... .... ~
"" "" 00 ..r ...
•
• •
• •
o
I
~ .... ..;: ...
'" '" .., .... ...
.. 00 .... ",. ...
.... ... ...
..r ...
~ .... ....
• •
•
•
I ... 00
... '" ... ",. ...
.. ... .... ", . ...
... '" 00 ..r ....
.. .. co
o ... 00 o ...
o 00
~ co
00 ... ... 0;
00 to
~. ....
•
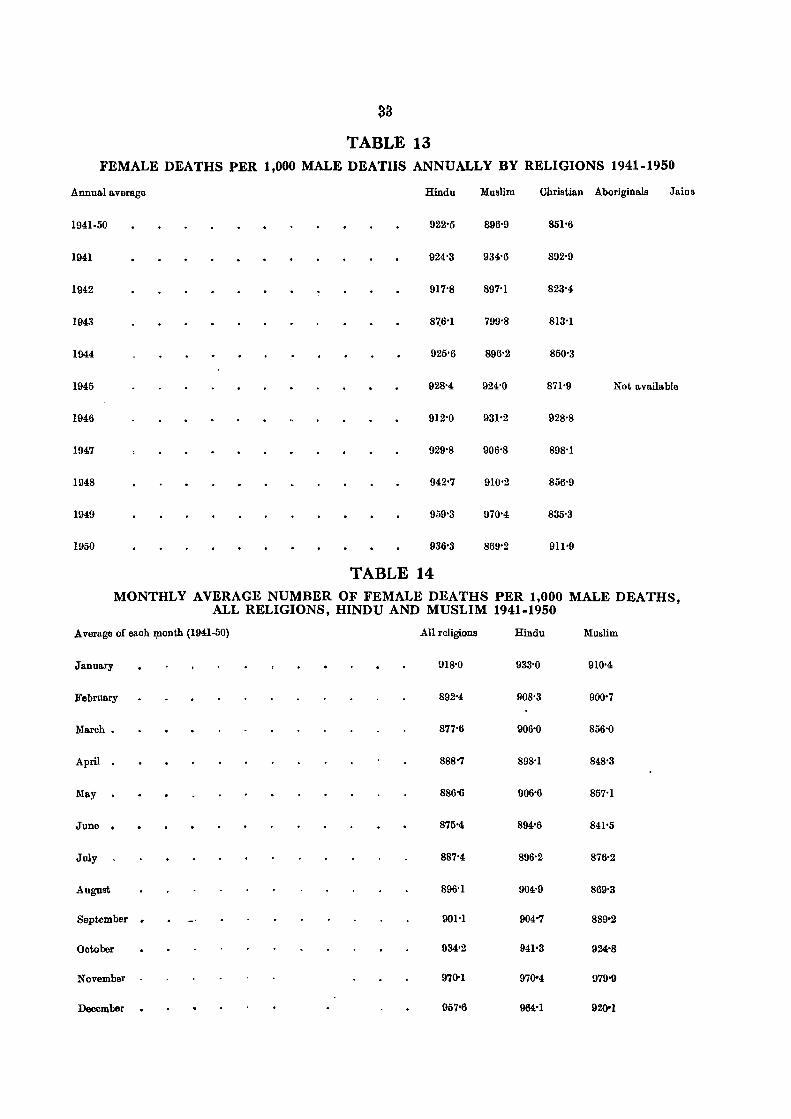
33
TABLE 13 FEMALE DEATHS PER 1,000 MALE DEATHS ANNUALLY BY RELIGIONS 1941-1950
Annual average Hindu Muslim Christian Aboriginals Jains
1941·50 922'5 896'9 851'6
1941 924:3 934'6 892'9
1942 917'8 897'1 823'4
1943 8~6'1 799'8 813'1
1944 925'6 896'2 850'3
1945 928'4 924'0 871'9 Not available
1946 912'0 931'2 928'8
1947 929'8 906'8 898'1
1948 942'7 910'2 856'9
1949 959'3 970'4 835'3
1950 936-3 869-2 911-9
TABLE 14 MONTHLY AVERAGE NUMBER OF FEMALE DEATHS PER 1,000 MALE DEATHS,
ALL RELIGIONS, HINDU AND MUSLIM 1941-1950
Average of each ~onth (1941.50) All religions Hindu Muslim
January 918-0 933-0 910-4
February 892'4 908-3 900'7
March. 877'6 906'0 856-0
April 888-7 898-1 848-3
May 886-6 906-6 857'1
June . 875'4 894-6 841'5
July 887'4 896-2 876'2
August 896'1 904'9 869-3
September . 901'1 904"7 889'2
October 934-2 941'3 924-8
November 970-1 97004 979-9
December 957'6 964'1 920'1
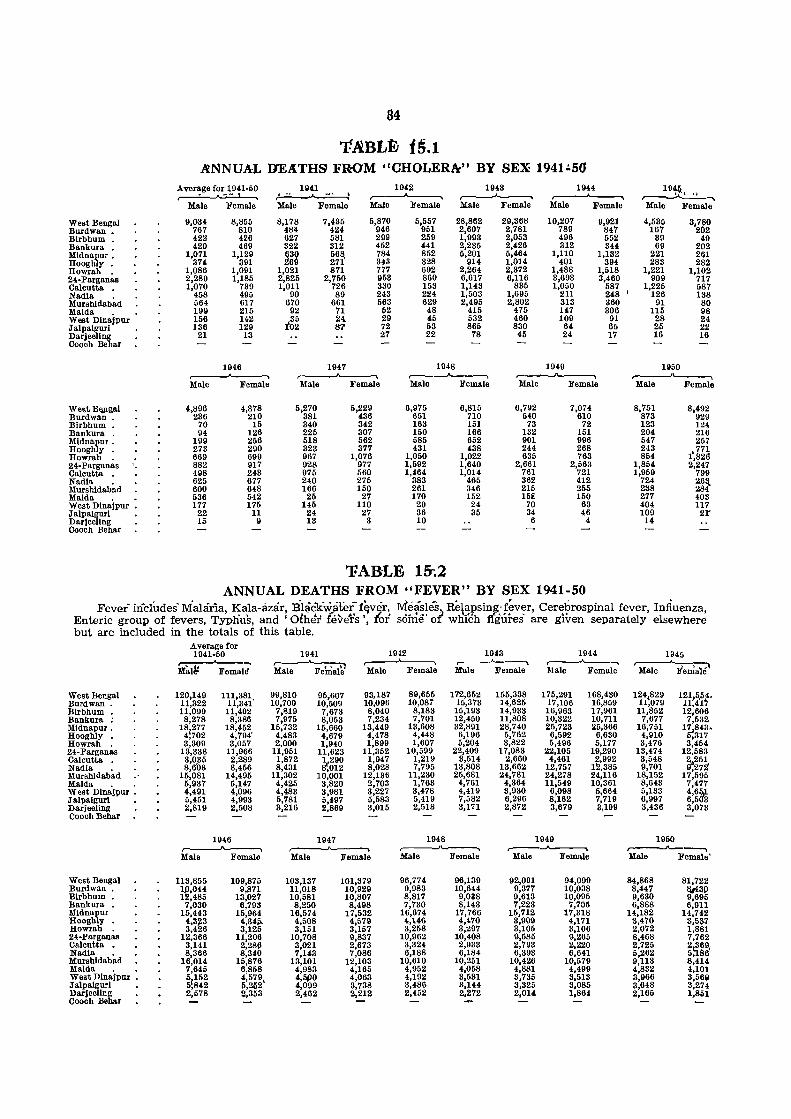
84
T-.N.BLfY 1S.1 ltNNUA:L DEATHS FROM "CHOLER&" BY SEX: 1941:.50
Average for 1941·50 1941 1942 1943 1944 1949-~ ~ ,...---A--, ~ ~-....
Male Female Male Female Male Female Male Female Male Female Male Female
9,034 8,855 8,178 7,435 5,870 5,557 28,862 29,368 10,207 9,921 4,535 3,7g0 767 810 481 424 946 951 2,607 2,781 789 847 167 22 42ll 426 627 581 299 259 1,993 2,053 496 552 39 49 420 469 322 312 452 441 2,235 2,426 312 344 69 202
1,071 1,129 ~:g m 784 852 5,201 5,464 1,110 1,132 221 261 374 391 343 328 914 1,014 401 394 283 282
1,086 1,091 1,021 871 777 692 2,264 2,372 1,488 1,518 1,221 1,102 2,289 1,185 2,825 2,750 953 860 6,617 6,116 3,693 3,460 909 717
739 726 330 153 835 587 587
West Bengal Burdwan. Birbhum • Baukura • Midnapur. Hooghly . Howrah . 24-Parganas Calcutta • Nadia • Murshidabad
1,070 458 495
l,On 90 89 243 224
1,143 1,050 1,225 1,503 1,695 211 248 ' 126 138
Maida • West Dinajpur Jalpaiguri Darjeeling Cooch Behar
WestB~gal Burdwan • Birbhum • Bankura . Midnapur. Hooghly • Howrah • 24-Parganas Calcutta • Nadia • Murshldabad Maida • West Dinajpur Jalpaiguri Darjeeling Cooch Behar
564 617 670 661 563 629 2,495 2,802 313 199 215 92 71 52 48 415 475 147 156 142 l5 24 29 45 532 460 109 136 129 02 87' 72 53 865 830 64
21 13 27 22 78 45 24
1946 1947 1948 1949 .....---'....._____, ~, ,....----...A------, r-~ Male Female Male Female Male Female Male Female
4,896 4,878 5,270 5,229 6,975 6,815 6,792 7,074 236 210 381 436 651 710 540 610
70 15 340 342 163 151 73 72 94 126 225 307 150 166 132 151
199 256 518 562 585 652 901 996 273 290 323 377 431 438 244 268 669 699 967 1,076 1,050 1,022 635 763 882 917 928 977 1,592 1,640 2,661 2,563 498 243 975 560 1,464 1,014 761 721 625 677 240 275 383 465 362 412 600 648 166 150 261 346 215 255 536 542 25 27 170 152 15~ 150 177 175 145 110 29 24 70 63
22 11 24 27 36 35 34 46 15 9 13 3 10 6 4
'FAB-LE 15-.2 ANNUAL DEATHS FROM "FEVER" BY SEX 1941-50
360 91 80 306 115 98
91 28 24 65 25 22 17 16 16
1950 .....---'~ Male Female
8,751 8,492 873 929 123 124 204 216 547 257 243 771 854 t,826
1,854 2,247 1,959 799
724 26~ 238 284 277 403 404 117 109 21' 14
Fever includes' Malaria, Kala-azar, Bl;icKwj.fer f~ver, Enteric group of fevers, Typnus, and' Other fevers', lot
MeaSleSi' Relapsing-fever, Cerebrospinal fever, Influenza sciIue' 0 wlii'ch ffgures are gIven separately elsewher~
but are included in the totals of this table. Average for 1941-50 1941 1942 1943 1944 1945
:r.t;'I6t ...... ,.----'---;-" ,....-----A-----. r-A-, 'Maie"' Feroa)e' Fernald Male Female' Male Female Male Female Male Female
West Bengal 120,149 111,381 99,810 95,607 93,187 89,655 172,652 155,338 175,291 168,430 1241829 121,5{4, Burdwan . 11,322 11,341' 10,700 10,509 10,096 10,087 15,373 14,625 17,106 16,859 11,079 11;4 '; Birbhum • 11,099 11,402 7,819 7,673 8,040 8,183 15,193 14,933 16,963 17,961 11,852 12,606 Bankura 8,278 8,386 7,975 8,058 7,234 7,701 12,450 11,808 10,322 10,711 7,677 7,532 Midnapur. 18,277 18,452 15,732 15,660 13,449 13,608 32,891 28,740 25,723 25,366 16,751 1}.843, Hooghly 4:702 4,794' 4,483 4,679 4,478 4,448 6,196 5,762 6,592 6,630 4,910 ,317 Howrah 3,309 3,057 2,000 1,940 1,899 1,607 5,204 3,822 5,496 5,177 3,476 3,454 24-Parganas 13,338 11,966 11,951 11,623 11,352 10,599 22,409 17,083 22,105 19,290 13,474 12,583 Calcutta 3,035 2,289 1,872 }.290 1,947 1,219 3,514 2,660 4,461 2,992 3,548 ~51 Nadia 8,608 8,456 8,431 ,012 8,028 7,795 13,808 13,662 12,757 12,385 9,701 , 7:t Murshldabad 15,081 14,495 11,302 10,001 12,136 11,230 25,681 24,781 24,278 24,116 18,152 17,595 Maida 5,937 5,147 4,425 3,820 2,703 1,763 4,761 4,364 11,549 10,361 8,643 7,477 West Dina'jpur : 4,491 4,096 4,483 3,981 3,227 3,478 4,419 3,930 6,098 5,664 5,133 4,6M Jalpalguri 5,451 4,993 5,781 5,497 5,583 5,419 7,582 6,296 8,162 7,719 6,997 6,5 3 Darjeeling 2,819 2,508 3,216 2,869 3,015 2,518 3,171 2,872 3,679 3,199 3,436 3,073 CoochBehar
1946 1947 1948 1949 1950 r---"------. ,.----...A------. r-~ r---~ .-----.A-----., Male Female Male Female Male Female Male Female Male Female'
West Bengal 113,855 109,875 103,137 101,379 96,774 96,139 92,091 94,099 84,868 81,722 Burdwan • l~,O44 9,871 11,018 10,929 9,983 10,644 9,377 10,038 8,447 &ti3(J Birbhum • 1 ,485 13,02' 10,581 10,807 8,817 9,038 9,613 10,095 9,630 9,695 Bankura 7,030 6,793 8,250 8,498 7,730 8,143 7,223 7,705 6,888 6,911 Midnapur' 15,443 15,964 16,574 17,532 16,674 17,766 15,712 17,318 14,182 14,742 Hooghly • 4,3~3 4,34f>. 4,508 4,579 4,146 4,470 3,909 4,171 3,470 3,537 Howrah • 3,426 3,125 3,151 3,157 3,258 3,297 3,105 3,106 2,072 1,881 24-Parganas 12,366 11,206 10,708 9,837 10,962 10,408 9,585 9,265 8,468 7,762 Calcutta 3,141 2,28(1 3,021 2,673 3,324 2,933 2,793 2,220 2,725 2~g91 Nadia 8,366 8,340 1,143 7,086 6,188 6,184 6,393 6,641 5,262 5, 6 Murshidabad 16,014 15,876 13,101 12,103 10,610 10,251 10,426 10,579 9,113 8,414 Maida 7,645 6,858 4,983 4,165 4,952 4,058 4,881 4,499 4,832 4,101 West Dinajpur : 5
1152 4,579, 4,~0 4,063 4,192 3,531 3,735 3,513 3,966 3,569
Jalpaiguri 5,842 5,252 4,099 3,738 3,486 !l,144 3,325 3,085 3,648 3,274 Darjeeling 2,578 2,353 2,462 2,212 2,452 2,272 2,014 1,864 2,165 1,851 Cooch Behar
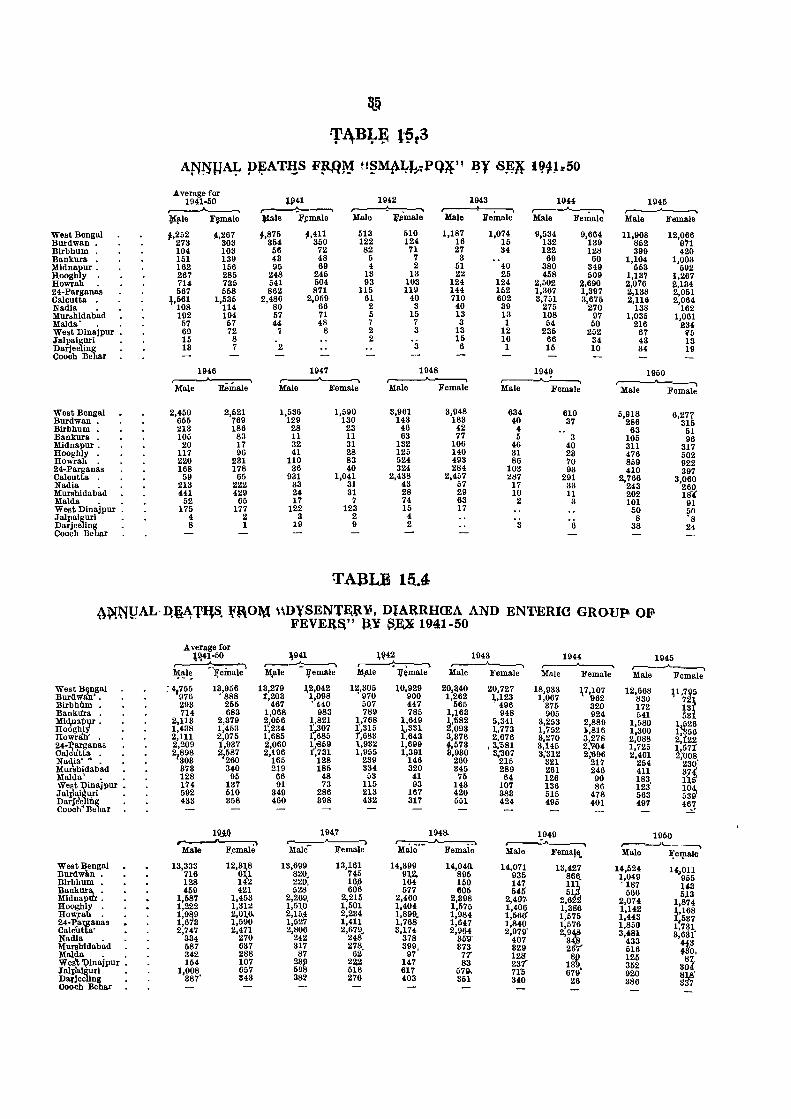
W~8tBengal Burdwan • Blrbhum . Bankura • Mldnapur. Rooghly • Howrah • 24-Parganas Calcutta • Nadia • Murshldabad Maida' . West Dinajpur Jalpalgurl Darjeeling Cooch Behar
West Bengal Burdwan . Birbhum . Bankura • Midnapur. Hooghly . Howrah • 24-Parganas Calcutta . Nadia . Murshldabad Maida . West Dinajpur Jalpalguri Darjeeling Cooch Behar
:tQ
T1\B~~ 1'53 • r
ANNlJ4 p~A'l1I!S Fll~M !!~M~ltJ.~PQX:'1 ~¥ B~}f 1~1:~~50 Average for
1Sl41 1942 1943 IOU 1941-50 ~ ~----. ~ r--~ r--~ ¥!,Ie F~male ~Ie l,llmale Male li'emale Male Female Male Female
1>,252 4,267 t,875 ~,411 513 510 1,187 1,074 9,534 9,664 273 303 354 350 122 124 16 15 132 139 104 103 56 72 82 71 27 34 122 128 151 139 43 48 5 7 3 .. 69 60 162 156 95 69 4 2 51 40 380 349 267 285 248 245 13 13 22 25 458 509 714 735 541 504 93 103 124 124 2,502 2,690 567 558 862 871 115 119 144 152 1,367 1,897
~,561 1,535 2,486 2,059 61 40 710 602 3,751 3,675 108 114 80 66 2 3 40 39 275 270 192 194 57 71 5 15 13 13 108 97 57 57 44 48 7 7 3 1 54 50 69 72 8 2 3 13 12 235 252 15 8 2 15 16 66 34 13 7 2 3 6 1 15 10
1946 1947 1948 1949 ,.---.-...."-~ ~ r---"----. ,--_,._~
Male Eemale Male Famale Male Female Male Female
2,450 2,521 1,536 1,590 3,961 3,948 634 610 655 769 129 130 143 183 40 37 213 186 28 23 46 42 4 105 83 11 11 63 77 5 3
20 17 32 31 132 106 46 40 117 96 41 28 125 140 31 23 220 231 110 83 524 493 86 70 168 178 36 40 324 284 103 93
59 65 931 1,041 2,438 2,457 287 291 213 222 33 3) 43 57 17 33 441 429 24 31 28 29 10 11
52 65 17 7 74 63 2 3 175 177 122 123 15 17
4 2 3 2 4 8 1 19 9 2 3 6
TABLE 15.11
1945 ,.--~
Male Female
11,908 852
12,066 071
399 420 1,104 1,003
553 592 1,137 1,267 2,076 2,184 2,138 2,051 2,116 2,064
138 162 1,035 1,061
216 234 67 i5 43 13 34 19
1950 r-----J'----.
Male Female
5,918 6,271 286 315
63 51 105 96 311 317 476 502 859 922 410 397
2,766 3,060 243 260 202 Hs' 101 91
50 50 8 '8
38 24
t'\~NUAL· Ir~4111s, Vft0M \\DYSEr,T1'E.~¥, DJA&RHffiA AND EN'{\ERIC GROUP Oli' ~. FEVE~&" RY S~ 1941-50
Average for \Q42 \\t41-50 \941 1943 1944 1945
Male ~Feinale I ~ ~ ~ ,---.A----.. r-----"----. )\ale :tremale M,ale li'~male Male Female Male Female Male Female ~ .. ,... ~.
West B9ngal :4,m 13,956 13,279 ],2,042 12,305 10,929 20,:140 20,727 18,933 ~7,l07 12,668 F,7~5 Burtlwan' • • 888 t,203 1,098 ' 970 900 1,262 :1.,123 1,067 962 830 Birbhnm • 293 255 467 ' 440 507 447 565 ·496 375 320 172 i3t Banku'ra 714 683 1,068 983 789 785 1,163 948 905 924 541 53 Midp'-P;t< . 2,113 2,379 21°56 1,821 1,768 1,649 ~,fi82 5,341 3,253 2,889 1,580 1~26 Hooghl 1,438 1,453 1,234 1' .. 307 f,315 1",331 ,093 1,773 1,752 1,816 1,300 I, 56 Rowra'ii' . 2,111 2,075 1,685 1,685 t,683 1,643 3,378 2,676 3,270 3,278 2,088
2'a22 24-~arganas 2,209 1,937 2,060 ll 0859 1,932 1,699 .,573 ,3,,'581 3,145 2,"04 1,725 1, 7t Calcu'tta . 21~g~ 21~~~ 2,i96 1,731 1,955 1,391 3,930 3;307 3;312 2,'696 2,401 Ji;'()08 Na<¥a' ~ • 165 128 239 146 260 215 321 217 254 230' Murshidabad 373 340 219 185 334 320 345 289 261 246 411 37~ Maida' 128 95 66 48 53 41 75 64 126 90 183 1\ West ~inaipur 174 137 91 73 ll5 93 143 107 136 86 123' ;g~ Jalpai uri 592 510 349 286 213 167 420 383 515 478 563 Darj.!ellfig 433 358 460 398 432 317 551 424 495 401 497 4~ Cooch<llehar
19..M 194.7 1948. 1949 1950 ~ r--A--, ~ r------:~ r-----"------.,
Male F,emale Male Female Male Female Male Fema~1l. Male lj'elpall; West Bengal 13,333 12,31,8 13,699 13,161 14,399 14,040. 14,071 13,427 14,524 l",Oll Burdwlm. 716 6~1 82O, 745 91,2, 895 93& 866, 1,049 955 Blrbhum • 128 1 2 220, 16,6 164 150 147 1~ , 187 143 Bankur:i: • 459 421 528 606 577 G05 545'
2,~ 2 566 513 MldnaP . 1,587 1,453 2,269, 2,215 2,460 2,398 2,497. 2,074 1,874 Hoogbly . 1,222 1,312 1,51,0 1,501 1,404 1,575 1,406 1,386 1,142 ;,168 Ho\\',!ah . 1,9~9 2,0],6. 2,15~ 2,234 1,899. 1,984 1,566' 1,575 1,443 1,537
24-~aftlanas 1,6 3 1,590 1,52 1,411 1,7613 1,647 1,840 1,576 1,850 1,731 Calcu.t a' 2,747 2,471 2,806 2,679 3,174 2,964 2,979' 2':g
3,481 3,631' Nadia 334 270 242 248'" 378 3m)' 407 433 'f3 Mursbtdabad 587 637 317 2~~. 399, 373 329 2 7' 516 43'0, Maida 342 288 87 97 77 128 1~, 125
Wes'qlinajpur : 154 107 23~ 2~ 147 83 237' 87. 352 304 JaIP'ai~i • l,gg~, 657 59 518 617 579. 71'5 679 920 ~W· DSfJee 'ng • 343 382 276 403 351 340 26 386
Cooch Behar
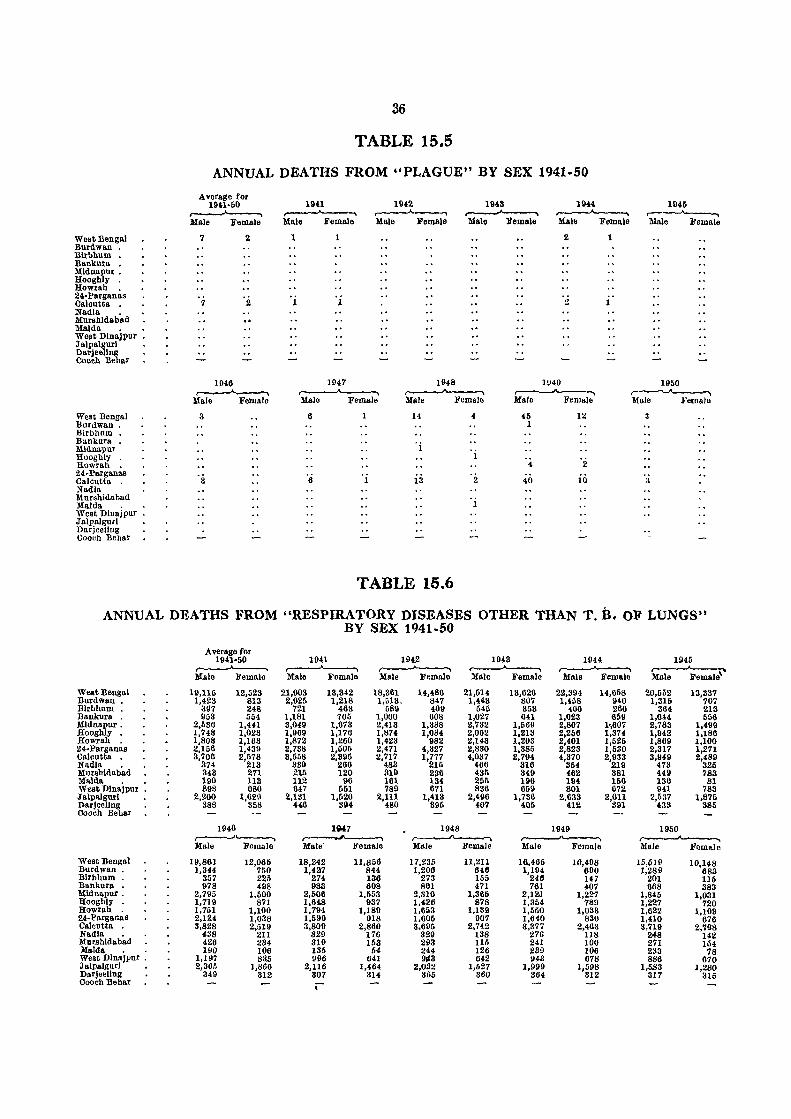
WostBengal Burdwan • Birbhum • Bankure. • Mldnapur. Hooghly . Howrah • 24· Parganas Caloutta . Nadia . Murshldabad Malda . West Dlnajpur Jalpalgurl Darjeellng Cooch Behar
West Bengal Burdwan . Birhhum . Bankura . 'M1dnapur Hooghly . Howrah . 24·Parganas Calcutta . Nadia Murshidabad Maida . West D1najpur Jalpalgurl DarjeeUng Cooch Behar
36
TABLE 15.5
ANNUAL DEATHS FROM "PLAGUE" BY SEX 1941-50
Average for 19'1·60 ~ Male Female
7 2
7
1946 ~
Male Female
3
'a
1941 ~ Male Female
1 1
1 1
1947
1942 ...-----A--. Male Female
11148
1948 ~ Male Female
19U ~ Male Female
2
2
lU49 ~ ~ ,--__..___"",\ Male Female Male Female Male Female
6 14 4 45 12 1
1 1 '2 4
6 1 ia '2 40 10
TABLE 15.6
1945 r---""-----, Male Female
1950 .--~ M.de J<'emale
'3
ANNUAL DEATHS FROM "RESPIRATORY DISEASES OTHER THAN T. B. OF LUNGS" BY SEX 1941.50
WcatBengal Burdwan • Blrhhum • Bankura . Midnapur. HOQghly . Homah . 24·Parganas Calcutta Nadia . Mursbldabad Maida . . West Dlnajpur • J alpalgurl • narjcellng Cooch Behar
West Bengal Burdwan . Blrbhum . Bankura • Midnapur. Hooghly . Howrah • 24· Pargac,as Calcutta Nadia . Mnrshld"bad Maida . . West Dlna!pur . J alpalguri • Darjeellng Cooch Behar
.Average for 1941·50
,...._A----. Male Female
19,115 1,423
397 953
2,536 1,748 1,808 2,156 3,706
374 343 190 S98
2,200 888
12,523 813 248 554
1,441 1,023 1,163 1,439 2,578
213 271 113 680
1,629 358
1946 .-----..-''----, Msle Female
19,861 1,344
857 978
2,795 1,7HI 1,751 2,124 3,828
488 426 190
I,HI? 2,365
349
12,065 750 225 498
1,500 871
1,100 1,0:18 2,519
211 234 106 836
1,866 312
1941
Male Female
21,003 2,025
721 1,181 3,049 1,969 1,872 2,738 3,568
339 215 112 647
2,131 446
13,342 1,218
463 705
1,673 1,176 1,260 1,505 2,895
266 120
96 551
1,520 394
1942 ~ Male Female
18,361 1,513.
589 1,000 2,413 1,874 1,428 2,471 2,717
483 819 161 789
2,111 480
14,486 847 4011 608
1,388 1,084
982 4,327 1,777
215 236 134 671
1,413 395
1943 ,...._.....__ ...... Male Female
21,614 1,443
646 1,027 2,732 2,062 2,143 2,830 4,037
466 435 255 836
2,496 407
13,626 807 853 641
1,569 1,213 1,203 1,385 2,794
316 349 196 659
1,736 405
1944 ~-.. Male Female
22,394 1,468
400 1,028 2,807 2,266 2,401 2,823 4,370
354 462 1114 801
2,633 412
}4,658 940 260 M9
1·,607 1,374 1,525 1,580 2,933
219 381 156 672
2,011 S91
11147 r--------.. Male' Female
1948 ~ Male Female
1949 ,---.-J"'___' Male Female
18,242 1,4117
274 988
2,506 1,6~ 1,794 1,599 3,809
829 819 135 996
2,116 807 ..
11,856 844 136 608
1,553 937
1,189 918
2,869 176 163
64 641
1,464 314
17,235 1,206
273 861
2,310 1,426 1,653 1,605 8,695
329 293 244 9113
2,032 365
11,211 646 155 471
1,365 878
1,139 907
2,742 138 115 126 642
1,627 360
111,465 1,194
246 761
2,12J 1,354 1,550 1,640 3,377
276 241 239 943
1,999 364
10,498 690 147 407
1,227 789
1,033 830
2,463 118 100 106 678
1,598 312
1945 ,...-------"" Male Female'
20,552 1,315
364 1,044 2,783 1,942 1,869 2,317 3,949
473 449 136 941
2,537 4.33
13,337 707 213 656
1,499 1,186 1,10Q 1,271 2,489
325 783 81
783 1,875
385
1950 ~ M8le Female
15,619 1,289
201 668
1,846 1,227 1,622 1,410 3,719
248 271 233 886
1,5.83 317
10,148 683 115 383
1,031 720
1,103 676
2,798 142 154
78 670
1,280 :115
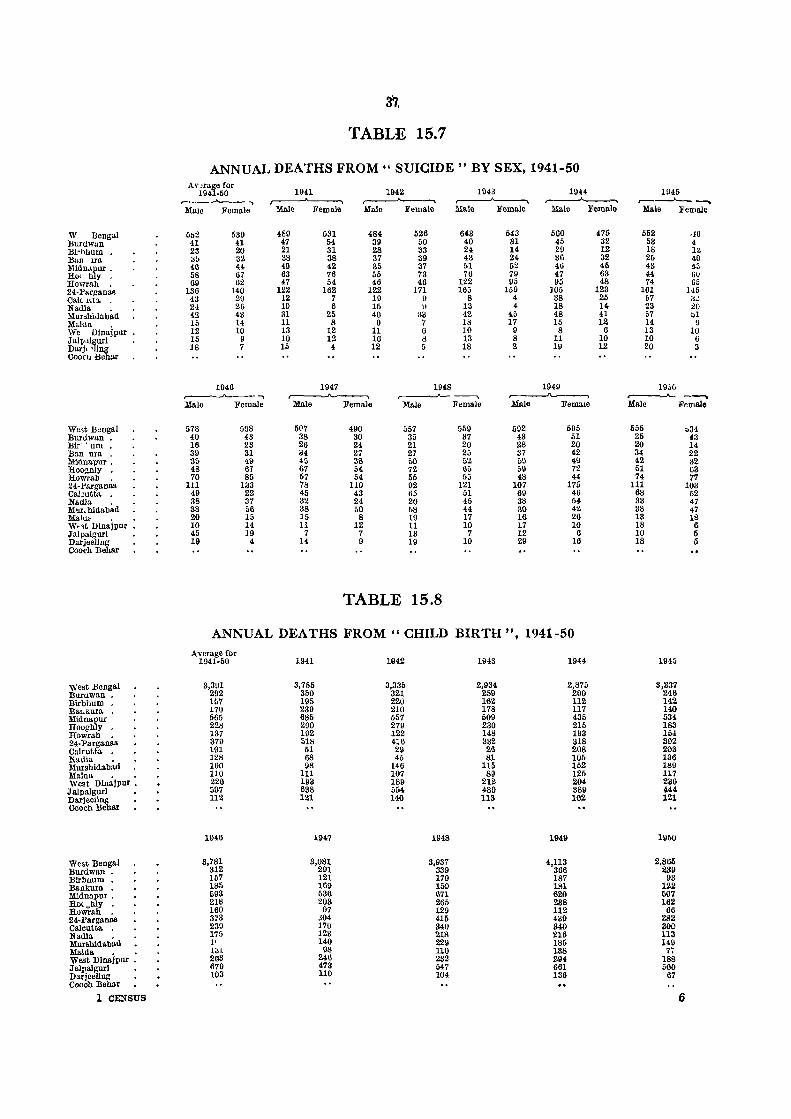
W Bengal Burdwun Bi-hbum • Ban IIa Midn"pur . Rot hly . Ramah 24·Parganas CaklHIl. Nadia Mur8bidab~d Malo.a We Dinajpur J"alpliguri Darjl '\]jng Cooell Behar
Weet B"ugal Burdwlln • Bir" urn . Ban ura Midnapur : Raognly • Rowrab • 24-l'arganas CalJutta • Nadia Mill. bidabad Malo.. W',t Dlnajpur • J"alpaJguri Darjeellng Cooch Bebar
West Bengal Burawan • Blrbhum • BaL.lmra • Midnapur IIooghly • Rawrab . 24· Parganas Calcutta • Nadia . Mursbidabad :Mo.ln.. • • West Dinajpur • J"nJpalguri Darjeeling Coach Bebar
West Bengal Burdwan . BlrbJlUm • BAnkura • Midnnpur • ROtgWy • Rowrlth • 24·PargaIUls Calcutta • Nadia • Mursbidabl'd :Mo.lda • • West Dlnajpur • J"alpaiguri Darjeellng Cooch Behar
1 CENSUS
37,
TABLE 15.7
ANNUAL DEATHS FROM" SUICIDE" BY SEX, 1941-50 A\' !rage for
1941-50 1941 1942 1943 1944 r-- -"--- .., ~ ~ ,-----'------, ~
Male Female :Mo.le Female Male Female Male Female Malo Female
5b2 530 489 531 484 526 643 543 500 475 41 41 47 54 39 50 40 81 45 82 23 20 21 31 28 33 24 14 29 12 ~b 32 38 38 37 ll9 43 24 36 32 46 4.4 49 42 85 37 51 52 46 45 68 67 63 76 55 73 76 79 47 63 69 62 47 54 46 46 122 95 95 48
186 140 122 162 122 171 163 159 105 123 43 29 12 7 19 9 8 4 38 25 24 26 10 6 15 \) 18 4 18 14 42- 43 31 25 40 lI3 42 45 48 n 16 14 11 8 0 7 18 17 15 12 12 10 13 12 11 6 10 9 8 6 15 9 10 12 16 8 13 8 11 10 18 7 15 4 12 5 18 2 19 12
1946 1947 1948 1949 ~...., ~ r---J'-- ----. ~ Male Female Male Female MnJe Female Male Female
578 508 507 490 557 559 592 595 40 43 38 30 35 37 43 51 16 23 26 24 21 20 28 20 39 31 34 27 27 25 37 42 35 49 45 38 50 52 5'.1 4\1 48 61 67 54 72 65 59 72 70 85 57 54 55 55 48 44
111 133 78 110 92 121 107 175 49 22 45 43 65 51 60 46 38 37 32 24 20 45 38 54 38 56 38 50 58 44 30 42 20 15 15 8 19 17 16 26 10 14 11 12 11 10 17 10 45 19 7 7 13 7 12 6 III 4 14 9 19 10 29 16
TABLE 15.8
ANNUAL DEATHS FROM" CHILD BIRTH It, 1941-50 Average for
1941 1941-50 1942 1943 1944
3,391 3,755 3,335 2,934 2,875 292 350 321 259 200 157 195 220 162 112 170 239 210 178 117 565 685 557 509 435 228 290 279 230 215 137 192 122 148 193 379 518 416 332 318 191 51 29 26 208 128 68 45 81 105 160 98 146 115 152 110 111 107 8G 125 226 193 189 212 204 537 688 554 480 389 112 121 140 113 102
1946 1947 1948 1949
3,781 3,081 8,937 4,113 312 291 339 306 157 121 179 187 lS5 169 15D 181 693 536 671 620 218 203 265 288 160 97 129 112 373 J04 415 439 239 170 840 340 175 123 211\ 216 l' 140 229 185 1~1 9l:! 110 138 203 246 232 294 670 473 547 661 lOB 110 104 136
1945 r------.A...- --..
Male Female
552 dO 53 4 18 lZ 26 40 43 13 44 GU 74 G5
101 145 57 ~~ 23 20 57 b1 14 9 13 10 10 6 20 3
193(, ~ ---. Male Femalo
555 h34 25 43 20 14 34 22 42- 32-51 uS 74 77
III 103 68 62 33 47 38 47 13 18 18 6 10 I) 18 I)
1945
3,237 246 142 140 534 183 154 392 203 136 189 117 236 444 121
1950
2.865 289
93 122 597 162
66 282 SO!) 113 149
17 188 500
67
6
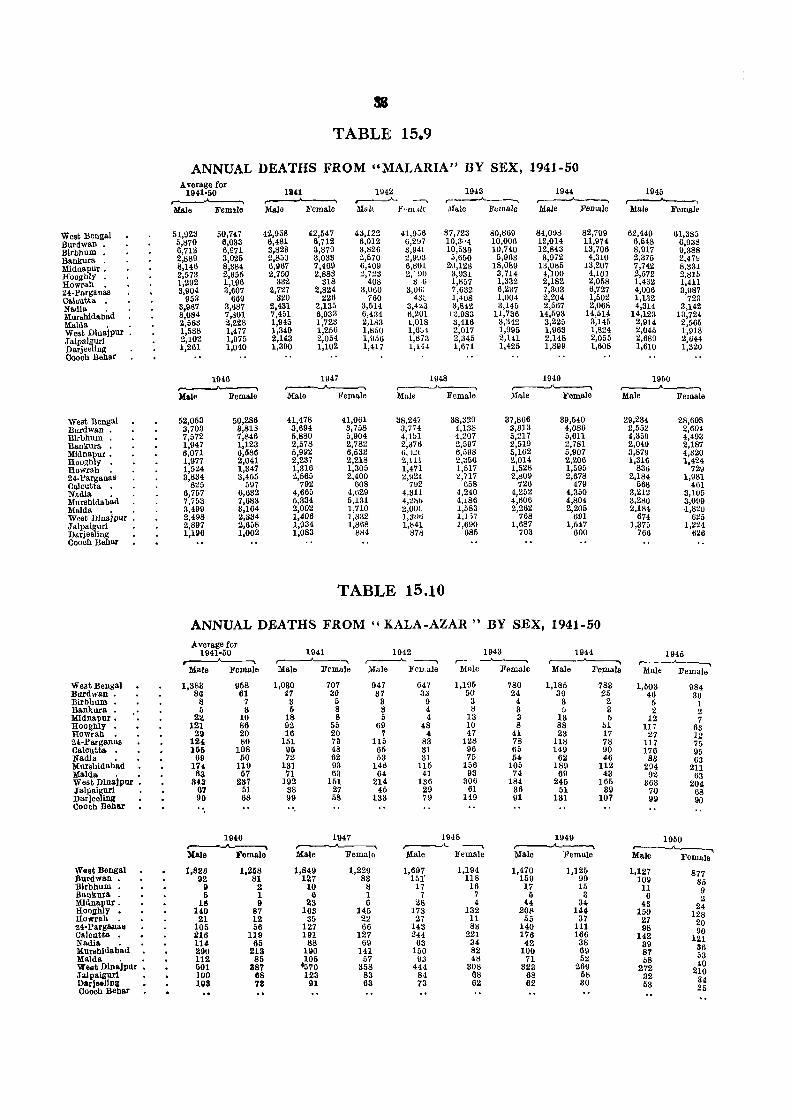
West Bengal Burdwan • BlrbhUm • Bankura • Midnapur. Hooghly . Howrah • 24·Parganas Calcutta • Nadia • Murshldabad Maida . West Dlnajpur Jalpaigurl Darjeeling Cooch Behar
West Bengal Burdwan • BIr]Jhum . Bankura • Mldnapur • Hooghly • Rowrah . 24· Parganas Calcutta . Nadia • Murshldabad Maida . West ])jnaj pur Jalpalguri Darjeeling Cooch Behar
West Bengal Burdwan • Birbhum • Bankura • MidI\apur • Hooghly Howrah 24·Parganas Calcutta • Nadia • Mursllidabad Maida • • West Dlnajpur • Jalpaiguri Darjeellng Coo~h Behar
We,tBongal BurdwaI\ • Blrbhum • Bankura . Mldnapur • HOOllhly • Uowrah • 2j,'Parganas Calcutta • Nadia . Murshidabad Maida. . W~st Dino.jpUr ,TaIpa.igurl Darje.Unll Cooch Behar
S8
TABLE 15.9
ANNUAL DEATHS FROM "MALARIA" BY SEX, 1941-50 Average for
1941 1943 1941'50 1942 1944 1945 ,....__""'-----I ,.----"- ....., ,..-__ .A.----,
,....---'----,
Male Female :Male Female Mal, F'·md( Male Female Male Female Male Female
51,923 50,747 42,958 42,547 43,122 41,9;;6 87,723 80,869 84,098 82,799 62,449 61,38:; 5,870 6,033 6,481 6,712 6,012 6,2U7 10,3"4 10,006 12,014 11,974 6,548 6,93S 6,713 6,971 3,823 3,879 3,826 3,94l 10,539 10,740 12,843 13,706 8,917 9,388 2,889 3,025 2,850 3,033 2,570 2,9~~ ;;,650 5,963 3,972 4,310 2,375 2,47\J 8,146 8,384 6,967 7,4!)9 6,40~ 6,801 20,12H 18,089 13,085 13,207 7,742 8,331 2,573 2,655 2,750 2,883 2,723 2,YVO 3,931 3,714 4,100 4,101 2,572 2,815 1,292 1,196 332 318 408 a G 1,857 1,332 2,182 2,058 1,462 1,411 3,904 3,607 2,727 2,824 3,060 3,U(l~ 7,632 6,237 7,303 6,727 4,006 3,987
953 669 320 226 760 4a~ 1,4U8 1,004 2,204 1,502 1.132 723 3,987 3,687 2,431 2,135 3,514 3,4~3 3,842 3,145 2,567 2,068 4,314 3,142 ii,0!!4 7,801 7,451 6,93 3 6,434 6,201 12,983 11,736 14,693 14,514 14,123 13,724 2,663 2,228 1,945 1,723 2,183 1,018 3,416 3,342 3,225 3,145 2,914 2,565 1,588 1,477 1,349 1,256 1,~50 1,6~4 2,017 1,995 1,963 1,824 2,045 1,918 2,102 1,975 2,143 2,054 1,956 1,~73 2,345 2,141 2,148 2,055 2,689 2,644 1,261 1,040 1,390 1,102 1,417 1,144 1,671 1,425 1,899 1,608 1,610 1,320
1946 1947 1948 1949 1950 ~ ~ r-----''-----.. ,-----....I~ r-----I...____..., Male Female Male Female Male Female Male Female
52,053 50,286 41,478 41,061 38,247 38,329 37,866 39,540 3,703 3,818 3,6M 3,758 3,77 4 4,138 3,613 4,086 7,572 7,846 5,880 5,904 4,151 4,207 5,217 5,611 1,947 1,123 2,578 2,782 2,a76 2,597 2,519 2,781 6,071 6,586 6,992 6,532 6, JLt 6,598 5,162 5,907 1,977 2,04.1 2,237 2,218 2,111 2,\\56 2,014 2,206 1,524 1,347 1,316 1,305 1,471 1,517 1,528 1,595 3,834 3,455 2,565 2,400 2,~24 ~,717 2,809 2,678
825 597 792 608 7~2 658 726 479 6,757 6,632 4,665 4,629 4,311 4,240 4,252 4,350 7,753 7,683 5,334 5,131 4,21>0 4,186 4,606 4,804 3,499 3,164 2,002 1,710 2,00( 1,583 2,262 2,205 2,498 2,334 1,406 1,332 1,3UO 1,1 ;7 768 691 2,897 2,658 1,934 1,868 1,841 1,690 1,687 1,547 1,1116 1,002 1,083 884 878 685 703 600
TABLE 15.10
ANNUAL DEATHS FROM" KALA-AZAR" BY SEX, 1941-50 Average for
1941·50 ~
Male Female
1,383 86
8 5
22 121
29 124 166
69 174
83 343
67 99
958 61
7 3
10 86 20 80
108 50
119 57
237 51 68
11146 ,--~
Male Female
1,826 92
II 5
15 UO
21 105 216 114 290 112 501 100 lOS
1,258 81
2 1 II
87 12 56
119 65
213 85
387 Cl8 73
1941 1942 1943 ..-----'----.. ,...---.A-------.. ,-- __,,____, 1944
r--~ Male Female Male Female Male Feu"le Male Female
1,030 47
3 5
18 92 16
151 95 72
131 71
192 38 99 ",
707 80
5 8 8
55 20 79 48 62 93 63
151 27 58
947 37
3 3 5
69 7
115 65 53
148 64
214 45
133
11147 .---A...--, Male Female
1,849 127
10 II
23 163
35 127 191
88 190 105
lfi70 123 III
1,229 83
8 1 6
145 22 66
127 69
141 57
358 83 63
647 33
9 4 4
48 4
83 31 31
115 41
136 29 79
1,195 50
3 8
13 10 47
128 96 75
156 93
306 61
149
1948 ,.......--A- ---, Male Female
1,697 151'
17 7
28 173
27 143 244
63 150
93 444 84 73
1,194 118 16
7 4
132 11 83
221 34 82 48
308 68 62
780 24
4 3 3 8
41 73 65 54
105 74
184 36 91
1,185 39
3 5
13 88 23
118 149
62 189 69
245 51
131
1949 ,..---.--..J\.. ______
Male Female
1,470 159
17 5
44 201'
55 140 176
42 100
71 323
68 62
1,125 99 15
3 34
144 37
111 166
38 69 52
269 58 30
783 25
2 3 5
51 17 78 90 46
112 43
165 39
107
Male Female
29,234 28,698 2,552 2,604 4,359 4,493 2,049 2,187 3,879 4,320 1,316 1,424
836 729 2,184 1,981
568 461 3,212 3,105 3,280 3,099 2,184 ·1,820
674 625 1,375 1,224
766 626
1945 ~ Male Female
1,503 46
5 2
12 117
27 117 176
83 294
92 363
70 99
1950
984 30
1 2 7
63 12 75 95 63
211 63
204, 68 90
r----.A....--.-.. Male Female
1,127 109 11
6 43
150 27 98
142 39 87 68
272 32 53
877 85 9 2
24 128
20 90
121 36 53 40
210 34 25
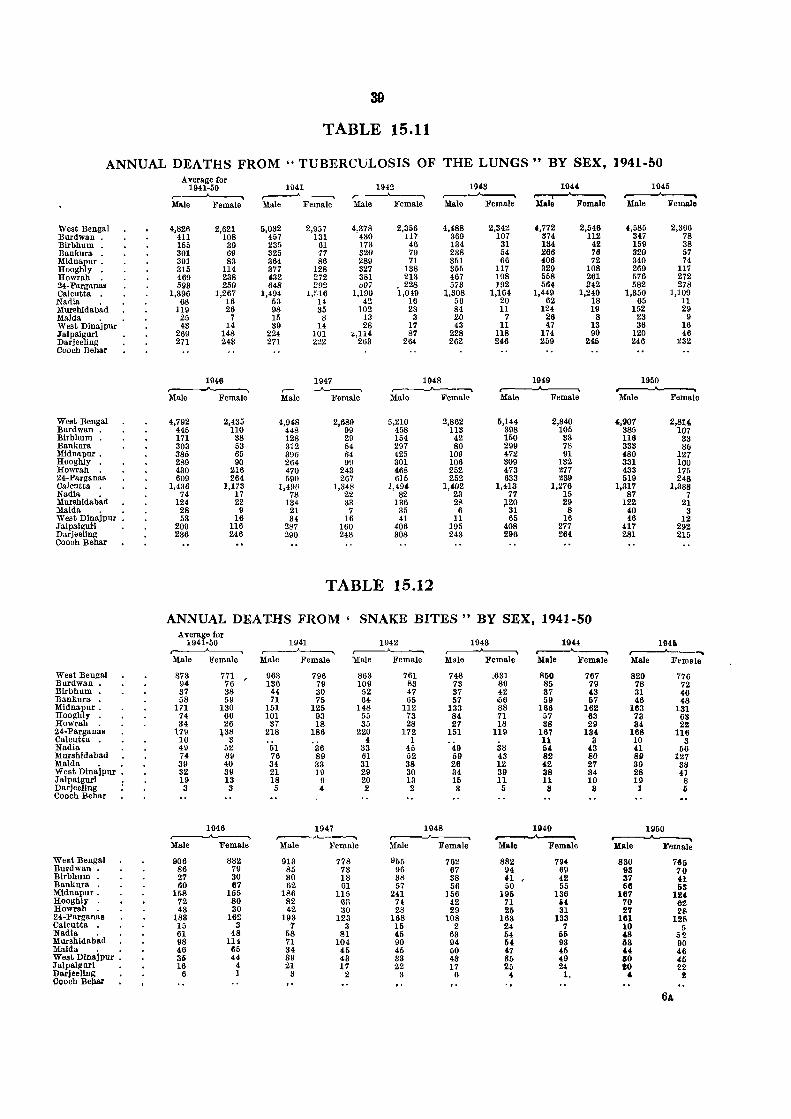
39
TABLE 15.11
ANNUAL DEATHS FROM" TUBERCULOSIS OF THE LUNGS" BY SEX, 1941-50 Average for
1941-50 1941 1942 1943 1944 1945 ~ r- -..A--_-, ~ ...-----'-----. Male Female Male Female Male Female Male J!'emale Male Female Male Female
West Bengal 4,82fl 2,621 5,032 2,957 4,378 2,356 4,488 2,342 ',772 2,546 4,585 2,366 Burdwan . 411 108 457 131 430 117 369 107 374 112 3(7 78 Birbhum . 155 39 235 61 173 46 134 31 134 42 159 38 Bankura 301 69 325 77 320 79 238 54 266 76 320 57 Mldnapur: 391 83 364 86 289 71 351 66 406 72 340 74 Rooghly • 315 114 377 128 327 J38 355 117 329 108 269 117 Rowrah 469 238 432 272 381 213 467 198 558 261 576 272 24-Parganas 593 250 648 292 097 • 228 573 192 564 242 582 278 Calcutt,a 1,396 1,267 1,494 1,f.16 1,1911 1,049 l,308 1,164 1,449 1,240 1,350 1,109 Na(lia 68 16 53 14 42 16 56 20 62 18 65 11 Murshidab~d 119 26 98 35 102 28 84 11 124 19 152 29 Maida 25 7 15 8 13 3 20 7 26 8 23 9 West Dlna:jpur 43 14 39 14 28 17 43 11 47 13 36 16 Jalpaiguri 269 148 224 lUI ~,114 87 228 118 174 90 120 46 Darjeeling 271 243 271 222 263 264 262 246 259 245 246 232 Cooch Behar
1946 1947 1948 1949 1950 ,,----A----, r- -'\....----;
,----_,.___ ____ ~ ~
Male Female Male Female Male Female Male Female Male Female
West Bengal 4,792 2,435 4,948 2,689 5,210 2,862 5,144 2,840 4,901 2,81' Burdwan . 445 110 448 99 458 113 398 105 385 107 Birbhum . 171 38 128 29 154 42 150 33 116 33 Bankura 303 53 312 54 297 80 299 78 333 86 Miduapur . 385 65 396 64 425 109 472 91 480 127 Rooghly 289 90 264 99 301 106 309 132 331 100 Howrah 430 216 470 243 468 252 473 277 433 175 24-Pargan~. 609 264 590 267 615 252 633 239 519 248 Calcutta . 1,436 1,173 1,496 1,348 1,494 1,402 1,413 1,276 1,317 1,388 Nadia 74 17 78 22 82 23 77 15 87 7 Murshldab~d 124 22 134 33 136 28 }-20 29 122 21 Maida 28 9 21 7 35 6 31 8 40 S West Dinajpur 53 16 34 16 41 11 65 16 46 12 JaJpalguH 209 116 287 160 406 195 408 277 417 292 Darjeeling 236 246 2110 248 308 243 296 26t 281 215 Cooch Behar
TABLE 15.12
ANNUAL DEA T-HS FROM • SNAKE BITES" BY SEX, 1941-50 Average for
1941-50 1941 1942 1943 1944 19410 ~ r--"---------- r---'-------o ...-----'-----. r--__'___"" Male Female Male Female Male Female Male Female Male Female Male Female
West Bengal 873 771 963 796 863 761 748 .631 850 767 820 776 Burdwan • 94 76 136 79 109 83 73 89 85 79 78 72 Blrbhum . 37 38 44 30 52 47 37 42 37 43 31 46 Banknra 58 59 71 75 64 65 57 <li6 59 57 46 48 Midnapnr: 171 130 151 125 148 112 133 88 166 162 163 131 Rooghly . 74 66 101 93 55 73 84 71 57 63 73 63 Rowrah 34 26 37 18 35 28 27 18 38 29 34 22 24-Parganas 179 l38 218 186 220 172 151 119 167 134 168 116 Calcutta 10 3 4 1 11 3 10 3 Nadia 49 52 51 36 33 45 49 38 54 43 H 56 Mnrshidabad 74 89 76 89 61 52 59 43 82 80 89 127 Maida 39 40 34 33 31 38 26 12 42 27 39 38 West Dinajpur : 32 39 21 19 29 30 34 39 38 34 28 41 Jalpaigurl 19 13 18 9 20 13 15 11 11 10 19 S Darjeeling 3 3 5 4, 2 2 3 5 3 3 1 5 Cooch Bebar
1946 1947 1948 11140 1950 ,-----....J....____, ,---_.J\,__~ ~
, ____ .11 _______
~ Male Female Male Female Male Female Male Female Male Female
West Bengal 906 882 913 778 965 762 882 794 830 765 Bnrdwan • 86 79 85 73 96 67 94 69 93 70 Birbhnm • 27 30 30 18 38 38 41 42 37 41 Banknra 60 67 62 61 57 56 50 55 5«1 58 Mldnapur. 158 155 186 115 241 156 195 136 167 12( Rooghly 72 80 82 (;:1 H 42 71 54 70 6ll Rowrab 43 30 42 30 28 29 25 31 27 28 24-Parganas 183 162 193 123 168 108 163 133 1«11 125 Calcutta 15 3 7 3 15 2 24 7 10 5 Nadia 61 48 58 81 45 63 54 5f> '8 50;! Murshidab~d 98 114 7.1 104 90 94 54 93 83 90 Maida 46 65 34 45 45 50 '7 '5 " 46 West Dinajpur : 85 44 89 43 33 43 85 49 SO '5 Jalpalgnri 16 4 21 17 22 17 25 24 10 22 Darjeellng 6 J 3 2 3 6 4 I, " !l Cooch Be)lar
64
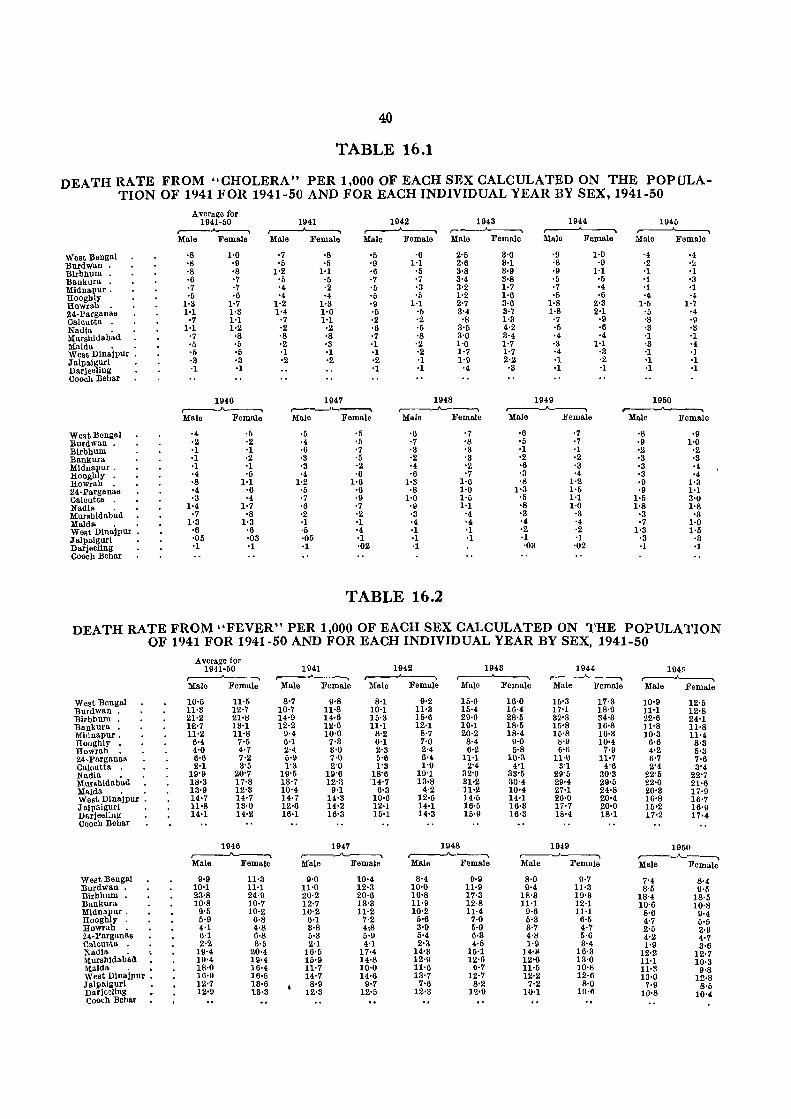
40
TABLE 16.1
DEATH RATE FROM "CHOLERA" PER 1,000 OF EACH SEX CALCULATED ON TH~ POPULATION OF 1941 FOR 1941-50 AND FOR EACH INDIVIDUAL YEAR BY SEX, 1941-50
West ]3engal Burdwan Blrbhum Bankura Jll1dnapur . Hooghly Howrah 24-Parganas Calcu~ta Nadia • Mursbldabad Maida West Dinajpur • Jalpalgurl Darjeeling Cooch Behar
West Bengal Burdwan . Blrbhum Bankura Mldnapur. Hooghly Rowrah 24-Parganas Calcutta Nadia . Mursllidabad Maida West Dlnajpur • Jalpalguri Darjeellng Cooell Behar
Average for 1941-60
,------'------Male Female
1'0 ·9 ·8 '7 ·7 -6
1·7 1·3 1'1 1·2
1946
·8 ·6 '6 ·3 ·1
r----..I'-----.. Male Female
·6 ·2 ·1 ·2 ·1 ·6
1·1 ·6 '4
1·7 -8
1-3 ·6 ·03 ·1
1942 1943 1944 r--_'-----.
1941 ~ Male Female Male Female Male Female Malo Female
·8 '6
1'1 ·6 ·2 ·4
1·3 1·6 1'1 '2 ·8 ·3 -I -2
1947
-5 ·9 -6 ·7 '6 ·6 ·9 ·6 ·2 ·6 ·7 '1 ·1 ·2 '1
r-----''''''''----.. Male Female
'6 1·1
'6 '7 '3 '5
1·1 '0 '2 '0 ·8 ·2 ·2 '1 '1
1948
2'5 2'6 3'8 3'4 3'2 1'2 2'7 3'4 '8
3'6 3'0 1'0 1'7 1'9 '4
,--....A-------.. Male Female
'6 ·7 ·3 ·2 '4 ·6
1·3 ·8
1'0 '9 -3 ·4 ·1 '1 ·1
TABLE 16.2
3'0 S'l 3·9 3·8 1·7 1'6 3'6 3·7 1·3 4·2 3·4 1·7 1'7 2·2 '3
·9 ·8 '9 '0 ·7 '0
1·8 1·8 ·7 '0 '4 ·3 ·4 ·1 ·1
1949 r----"-______
Male Female
-6 ·5 ·1 ·2 -6 '3 ·8
1·3 ·5 ·8 '3 '4 ·2 ·1 ·03
1·0 ·9
1·1 ·5 ·4 -6
2·3 2·1
·9 ·6 -4
1·1 ·3 ·2 ·1
1945 ~ Male Female
1950 ".--.---.J""'_____'_
Male Female
·8 -9 -2 -3 ·3 -3 '9 '9
1·5 1·8
·3 ·7
1·3 ·3 '1
-9 1-0
-2 '3 '4 '4
1'3 1'1 3'0 1'8
-3 1'0 1·5
·3 -I
DEATH RATE FROM "FEVER" PER 1,000 OF EACH SEX CALCULATED ON THE POPULATION OF 1941 FOR 1941-50 AND FOR EACH INDIVIDUAL YEAR BY SEX, 1941-50
West Bengal Burdwan . Blrbllum . Banlmra Millnapur . Rooghly Rowrah 24-parganas Calcutta Nadia . Mnrshidabad Maida West Dinajpur . Jalpnigurl Darjeel:ng Cooeh Behar
West Bengal Burdwan . Birbhum . Bankura Midnapur . Rooghly Rowrah 24-parganas Calcutta Nadia . Murshldabad Maida . _ West DlnajJlur _ Jalp •• igurl Darj~91lng cooeh Behar
Average for 1941-60 ~ Male Female
10·6 11·3 21·2 1£·7 11·2
6-4 4·0 6·6 2'1
19'9 1tl·3 13'9 14-7 11·8 14'1
11·5 12·7 21-8 13·1 11·8
7·5 4·7 7·2 3'6
20'7 17·8 12'3 14·7 13·0 14·2
1946 ,---....J------. Male Female
9·9 10'1 23·8 10·8
9·6 6·9 4·1 6·1 2·2
19·4 19'4 18·0 16·9 12·7 12-0
11·3 11'1 24·9 10·7 10·2
6·8 4·8 6·8 lH
20'4 19·4 16·4 16-5 13·6 1.3'3
1941 ~
1942 1943
Male Female Male Female Malo Female
1944 ~ Male Female
8·7 10·7 14·9 12·2
9'4 6'1 2·4. 5·1) 1'3
19-5 13·7 10'4 14'7 12·6 16'1
9·8 11·8 14-6 12·6 10·0
7·3 3·0 7·0 2'0
19'6 12'3
9'1 14'3 14·2 16'3
8'1 10'1 16'3 11'1
8'2 6'1 2'3 5'6 1'3
18'6 '14'7
6'3 10'6 12'1 15'1
1947 ,---....J,_____" Male Female
9·0 11·0 20·2 12·7 10·2
6'1 3-8 5-3 2·1
16·6 16'9 11·7 14·7
8·9 12·3
10'4 12·3 20'6 13'3 11·2
7·2 4,8 6-9 4'1
17·4 14·8 10·0 14·6
9·7 12·5
9·2 11·3 15-6 12·1
8·7 7'0 2'4 6'4 1'9
19'1 13'8
4·2 12-5 14·1 14'3
15'0 15·4 29·0 19-1 20·2
8·4 6·2
11·1 2'4
32'0 31·2 11·2 14·6 16·6 15·9
1948 ,.....--J'-~
Male Female
8'4 10·0 16'8 11·9 10'2
6'6 3'9 5'4 2'3
14'3 12'9 11'6 13'7
7'6 12'3
9·9 11·9 17·3 12·8 11·4
7·0 5·0 6·3 4·5
16·1 12·6
0·7 12·7
8'2 12-9
16·0 16·4 28·6 18-6 18·4
9·0 5·8
10·3 4'1
33-5 30·4 10-4 14'1 16·3 16·3
16·3 17'1 32-3 15'8 15·8
8·9 6'6
11·0 S'l
29'6 29'4 27-1 20·0 17-7 IS-4
17·3 18'9 34·3 16·8 16·3 10-4
7·9 11'7
4'6 30'3 29'6 24·8 20-4 20-0 18-1
1949 ,..-----..J~----.,
Male Female
8·0 9·4
18'3 11'1
9·6 6-3 3·7 4·8 1'9
14-l1 12-6 11·6 12·2
7·2 10'1
9·7 11·3 19'3 12·1 1]·1
6·5 4·7 5·6 3'4
16·3 13'0 10'8 12·6
8'0 10'6
194~
~ Male Female
10'9 11'1 22'6 11'8 10'3
6'6 4·2 6'7 2'4
22'5 22'0 20-3 16'8 16-2 17'2
12'6 12'8 24'1 11·8 11'4 8'3 6'3 7'6 3'4
22'7 21'6 17'9 16'7 16'9 17·4
1950 r---J'-~ Male Female
7'4 8·5
18'4 10'6 8'6 4·7 2·5 4'2 1'9
12·2 11·1 11·3 13·0
7'9 10-8
8·4 9·5
18·6 10'8
9·4 6'0 2'9 4·7 3·6
12·7 10·3
9·8 12·8
B·5 10·4
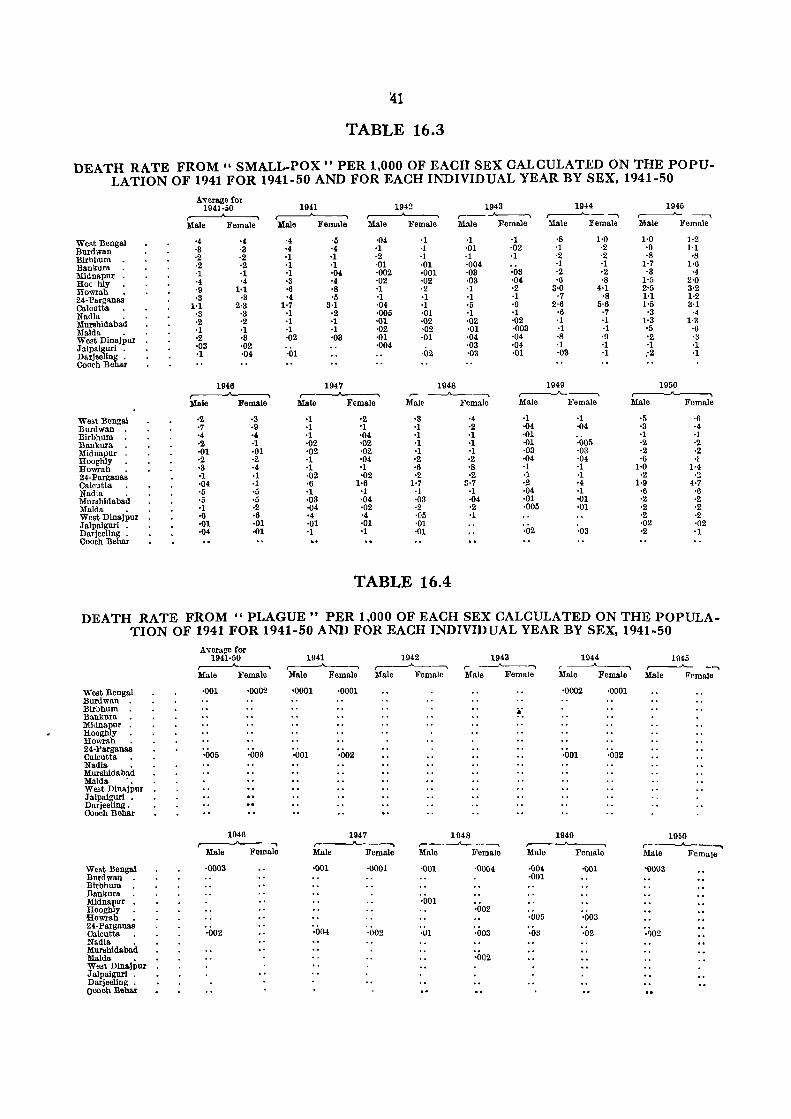
~1
TABLE 16.3
DEATH RATE FROM" SMALL.POX" PER 1.000 OF EACH SEX CALCULATED ON THE POPULATION OF 1941 FOR 1941-50 AND FOR EACH INDIVIDUAL YEAR BY SEX. 1941-50
We<t Bengal Burdwan B!rbhum Bankura Midnapur Roc hly Rowrah . 24· Parganas Calcutta Nadia . Murshidabad Maida . West Dinajpur Jalpalgnrl .
~~~~he~'!Lr
West Bengal Burdwan Blrbhum Bankura Midnapur Rooghly Rowrlth . 24· Pargana. Calcutta Nltdia . Murshldabad Maida . West Dlnajpur Jalpaiguri . Darjeellng • Cooch Behar
Average for 1941-50 ~ Male Female
·4 '4 ·3 ·3 ·2 ·2 ·2 ·2 '1 ·1 ·4 '4 ·9 1·1 ·3 ·3
1-1 2·3 ·3 ·3 ·2 '2 '1 '1 ·2 ·3 ·03 ·02 ·1 ·04
1946 ,..----''----.. :Male Female
·2 ·3 ·7 ·9 '4 ·4 ·2 ·1 ·01 ·01 ·2 ·2 ·3 ·4 ·1 ·1 ·04 ·1 ·5 ·5 ·5 ·5 ·1 ·2 ·6 ·6 ·01 ·01 ·04 ·01
1941 1942 1943 1944 1946 ~ ~ ,-- """"----. r-----"- - ....., ~ ----,
Male Female Male Female Male Female Male Female Male }<'emnle
·4 '0 ·04 ·1 ·1 ·1 '8 1·0 1·0 1·2 ·4 '4 ·1 ·1 ·01 '02 '1 ·2 ·9 1-1 ·1 ·1 ·2 ·1 '1 ·1 ·2 ·2 ·8 ·8 ·1 ·1 ·01 ·01 ·004 ·1 ·1 1·7 1·6 ·1 ·04 ·002 ·001 ·03 ·03 ·2 ·2 ·3 ,4 ·3 '4 ·02 ·02 ·03 ·04 ·6 ·8 1·5 2·0 ·6 ·8 ·1 ·2 '1 ·2 3·0 4·1 2·5 3·2 '4 ·5 ·1 ·1 ·1 ·1 ·7 ·8 1-1 1·2
1·7 8·1 ·04 '1 ·5 ·9 2·6 0·6 1·5 3·1 ·1 ·2 ·005 ·01 ·1 '1 ·6 ·7 ·3 ·4 ·1 ·1 ·01 ·02 ·02 '02 ·1 ·1 1·3 1·3 '1 ·1 ·02 ,02 ·01 ·003 ·1 ·1 ·5 ·6 ·02 '03 ·01 ·01 ·04 '04 ·8 ·9 '2 ·3
·004 ·03 ·04 ·1 ·1 ·1 ·1 ·01 ·02 ·03 ·01 ·03 ·1 ;2 ·1
1947 1948 1949 1950 ,-~ r-~ ,----..A------. ~
Male Female Male Female Male Female Male Female
'1 ·2 ·3 ·4 ·1 ·1 ·5 ·6 ·1 '1 ·1 ·2 ·04 '04 '3 ·4 ·1 '04 ·1 ·1 ·01 '1 ·1 '02 ·02 ·1 ·1 ·01 '()05 ·2 ·2 '02 ·02 '1 ·1 ·03 ·03 '2 ·2 ·1 ·04 ·2 ·2 ·04 ·04 ·6 ., '1 ·1 '6 '8 ·1 ·1 1·0 1'4 '02 ·02 ·2 ·2 ·1 '1 ·2 ·2 '6 1·6 1·7 3·7 ·2 ·4 1·9 4·7 '1 '1 ·1 ·1 ·04 ·1 ·6 ·6 ·03 ·04 ·03 ·04 ·01 ·01 ·2 ·2 ·04 '02 ·2 ·2 ·005 ·01 ·2 ·2 '4 '4 ·05 '1 ·2 ·2 '01 ·01 ·01 '02 ·02 ·1 '1 ·01 ·02 ·03 ·2 '1
TABLE 16.4
DEATH RATE FROM " PLAGUE" PER 1.000 OF EACH SEX CALCULATED ON THE POPULATION OF 1941 FOR 1941-50 AND FOR EACH INDIVIDUAL YEAR BY SEX. 1941-50
West Bengal Burdwan Blrbhum Bankura Midnapur Rooghly Rowrah . 24·Parganas Calcutta Nadia . Murshldabad Maida '. West Dinajpur J alpalgurl . Darjeeling . Cooch Behar
West Bengal Burdwatl Blrbhum Bankura Midnapur IIooghly Howrah • 24·Parganas Calcutta Nadia • Murshldabad Maida • West Dinajpur Jalpaigurl . Darjeellng . ooocb Behar
Average for 1941-50 ~ Male Female
·001 '0002
·005 ·003
1946 ~
Male Female
·0003
·002
1941 1942 1943 1944 1945 ~ ,...---'--........... ,.. _......A--...... r--~ r------'- --, Male Female Male Female Male Female Male Female Male li'emale
,0001 '0001 '0002 ·0001
~:
·001 '002 ·001 '002
1947 1948 1949 1950 r-~---.. ,....-~ ,..--~ r- ---.1'-- ----._ Male Female Male Female Male Female Male Female
·001 ·0001 '001 -0004 ·004 ·001 -0003 ·001
·001 ·002
·005 '003
·004 ·002 '(11 ·003 ·03 ·02 ·~02
·002

TABLE 16.5
DEATH RATE FROM "DYSENTERY, DIARRH<EA AND ENTERIC GROUP OF FEVERS" PER 1,000 OF EACH SEX CALCULATED ON THE POPULATION OF 194] BY SEX, 1941-50
Average for 1941·50 1941 1942 1943 1944 1945
,---A----.. ,---A----.. ~ ~ ~ Male Female Male Female Male Female Male Female Male Female Male Female
West Bengal 1·3 1'4 1·2 1·2 1·1 1·1 1·8 2·1 1·6 1·8 1·1 1·2 Burdwan 1·0 1·0 1·2 1·2 1·0 1·0 1·3 1·3 1·1 1·1 ·8 ·8 Birbhum ·6 ·6 ·9 ·8 1·0 ·9 1·1 ·9 ·7 ·6 ·3 ·3 Bankura 1·1 1'1 1·6 1·5 1'2 1·2 1·8 1·6 1'4 1·4 ·8 ·8 Midnapur 1·3 1·6 1·3 1·2 1·1 1·1 1·0 3·4 2·0 1'9 1·0 1'0 Hooghly 1'9 2'3 1·7 2·0 1·8 2·1 2·8 2·8 2·4 2·8 1'8 2·1 Howrah 2·5 3·2 2·0 2·6 2·0 2'0 H 4·1 3·9 5·0 2·5 3·2 24·Parganas 1·1 1·2 1'0 1·1 1·0 1·0 2'4 2·2 '1'6 1·6 '9 ·9 Calcutta 2·0 3'9 1·5 2·6 1'3 2·1 2·7 5·0 2·4 4·1 1·7 3·1 Nadia ·7 ·6 ·4 ·3 ·6 ·4 ·6 ·5 ·7 ·5 ·6 '6 Murshidabad ·5 ·4 ·3 ·2 '4 ·4 ·4 ·4 '3 '3 ·5 '5 Maida ·3 .'2 ·2 ·1 ·1 ·1 ·2 ·2 ·3 ·2 ·4 ·3 West Dlnalimr ·6 ·5 ·3 ·3 ·4 ·3 ·5 '4 ·4 ·3 '4 ·4 J alpaigurl • 1·3 1·3 ·8 ·7 '5 ·4 ·9 1·0 1-1 1·2 1·2 1'4 Darjeelin" . 2·2 2·0 2·3 2·3 2'2 1·8 2·8 2'4 2·5 2·3 2·4 2·6 Cooch Behar
1946 1947 1948 1949 1950 ,..------.',_________, r----~ .---...A-""_____' ,--....A---__
,.---......'~ Male Female Male Female Male Female Male Female Male Female
West Bengal 1·2 1·3 1·2 1'4 1·3 1'4 1·2 1'4 1'3 1·4 Burdwan ·7 ·7 ·8 ·8 ·9 1'0 1'1 1·1 1·1 1·1 Birbhum ·2 ·3 ·4 ·3 ·3 ·3 '4 ·3 ·4 ·3 Bankura ·7 ·7 ·8 1·0 ·9 ·9 '9 ·8 ·9 ·8 Midnapur 1·0 ·9 1·4 1·4 1'5 1'5 1·3 1·2 1·3 1·2 Hooghly 1·7 2·1 2·0 2·3 1·9 2·5 1·5 1·8 1-5 1·8 Howrah 2·4 3·1 2'6 3·4 2·3 3·0 1·7 2·3 1·7 2'3 24·Parganas ·8 1·0 ·8 ·9 ·9 1·0 ·9 1·0 '9 1·0 Calcutta 1·9 3·8 1·9 4·1 2·2 4·5 2·4 5·6 2·4 6·6 Nadia ·8 ·7 ·6 ·8 '9 1·0 1·0 1·1 1·0 1'1 Murshidabad ·7 ·8 ·4 ·3 '5 ·5 ·6 ·5 ·6 ·5 Maida ·8 ·7 ·2 ·1 ·2 '2 ·3 ·2 ·3 ·2 West Dlnajpur ·5 ·4 ·8 ·8 ·5 ·3 '8 ·7 1·1 1·1 Jalpaiguri . 2·2 1'7 1·3 1·3 1·3 1·5 1'6 1·8 2·0 2·1 Darjeeling _ 1·9 1'9 1·9 1·6 2·0 2·0 1·7 1·5 1'9 1·9 Cooch Behar
TABLE 16.6
DEATH RATE FROM "RESPIRATORY DISEASES OTHER THAN T. B. OF THE LUNGS" PER 1,000 OF EACH SEX CALCULATED ON THE POPULATION OF 1941 FOR 1941-50 AND FOR
EACH INDIVIDUAL YEAR BY SEX, 1941-50 Average for
1941·50 1941 1942 1943 1944 1945 ,---A----.. ,.--'------, r----"-----. r----"-----. ~ Male Female Male Female Male Female Male Female Male Female Male Female
West Bengal 1·7 1·3 1·8 1'4 1·6 1·5 1'9 1·4 1·9 1·5 1·8 1'4 Burdwan 1·4 '9 2·0 1'4 1·5 ·9 1'4 ·9 1·5 1·1 l·3 ·8 Birbhum ·8 ·5 .1'4 '9 1·1 ·8 1·0 ·7 -8 -5 -7 ·4 Bankura 1-5 -9 1·8 I-I 1·5 1-0 1-6 1-0 1.6 1-0 1-6 .p Midnapur 1'6 ·9 1-9 1'1 1-5 ·9 1-7 -1-0 1:7 1-0 1-7 1·0 Hooghly 2·4 1-6 2-7 1'8 2-5 1-7 2-8 1·9 3-l 2·2 2·6 1·9 Howrah 2·2 1·8 2-2 1-9 1-7 1-5 2-6 1-8 2-9 2-3 2·2 1-7 24· Parganas I-I -9 1·4 -9 1-2 2·6 1-4 -8 1-4 ·9 1·2 -8 Calcutta 2-6 3'9 2-5 3-6 1·9 2-7 2-8 4-3 S-O 4-6 3-4 3·8 Nadia -9 -5 -8 '7 1·1 -5 1-1 -8 ·8 ·5 I-I '5 Murshidabad ·4 ·3 ·3 '1 ·4 '3 -5 ·4 ·6 ·5 ·6 1·1 Maida 1·0 ·3 ·6 '2 ·8 ·3 1·3 '5 1'0 ·4 '7 ·2 West _Dinajpur 2·9 2·4 2·1 2'0 2'6 2·4 2'7 '2'4 '2·6 2'4 3·1 2'8 J alpaiguri . 4·8 4·2 4·6 3'9 4·6 3·7 6-4 4·5 '5·7 '0'2 5·6 4·9 Darjeeling . 1·9 2·0 2·2 2'2 2·4 2·2 2-0 2·3 '2·1 .2.2 2·2 2'2 Cooch Behar
1946 1947 1948 19'9 1950 ,.-----A-.-----, ,---~ ,---~ ~
,---....A--__
Male Female Male Female Male Female Male Female Male Female
West Bengal 1·7 1·2 1·6 1·2 1·5 1-2 1·4 1·1 1·4 1·0 Burdwan 1·3 ·8 1·4 ·9 1·2 ·7 1·2 ·8 1·3 ·8 Birbhum ·7 ·4 .1\ ·3 ·5 -3 ·5 ·3 ·4 ·2 Bankura 1·5 ·8 1·6 1·0 1·3 ·7 1·2 ·6 1·0 3 Midnapur 1·7 1·0 1·5 1·0 1-1 ·9 1·3 ·e 1-1 ·7 llooghly 2·3 1·4 2·? 1·5 1·9 1·4 1·8 1·2 1·7 1·1 Howrah 2,] 1·7 2·2 1·8 2·0 1·7 1·9 1·6 1'9 1·7 24· Parganas 1·1 ·6 ." ·6 ." . 5 'S '5 ·7 -4 Calcutta 3·3 3·8 3-3 4-4 3-2 4-2 2-3 3·8 2-e 4-3 Nadia 1'0 -5 -s -4 '8 -3 '6 -3 -6 '3 Mmshidabad -p -3 -4 -2 '4 -I -3 ·1 ·3 '2 :Malda -~ ·3 ·3 ·1 -6 ·3 ·6 -3 -5 .~
West Dlnajpur 3-n 3-0 3-3 2·3 3·1 2'3 3·1 2-4 2'9 2'4 J alpaigurl _ 6,) 4.-S 4-6 3-S 4-4 4-0 4·S 4-1 3-4 3-3 Darjeeling • 1-7 1·8 \-5 1·7 1.S 2·0 ]-S 1-1; 1'6 1'8 Cooch Behar
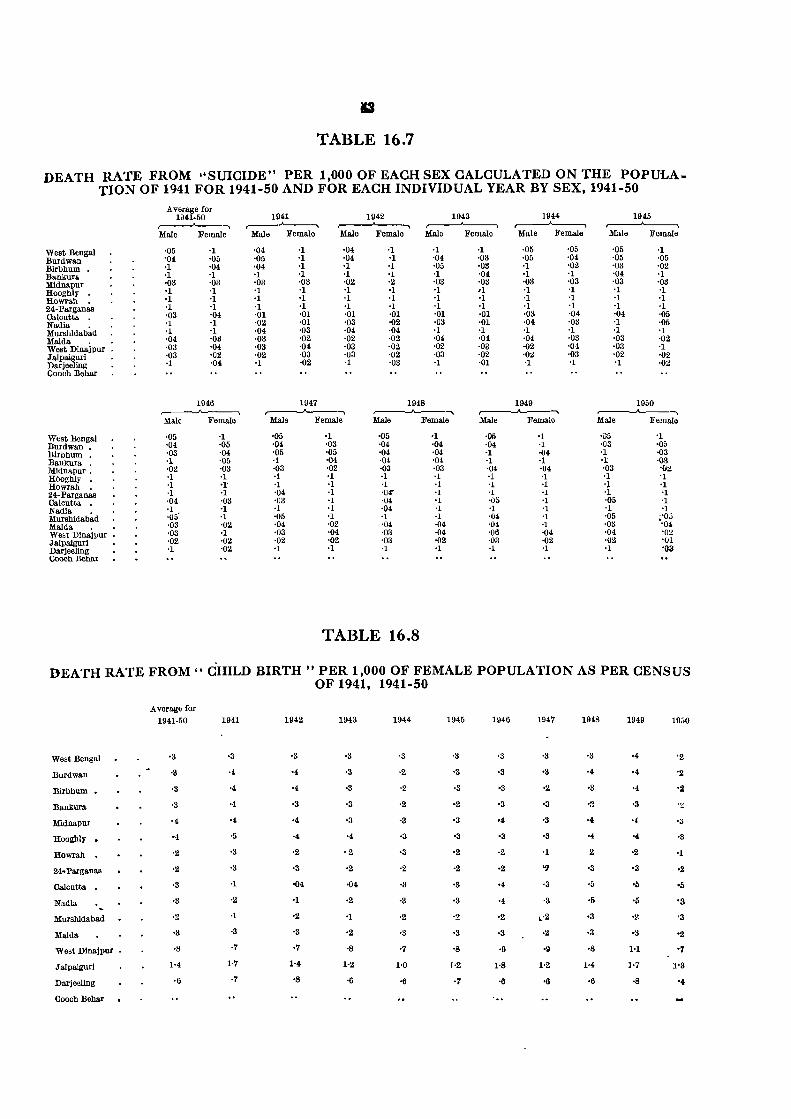
TABLE 16.7
DEATH RATE FROM "SUICIDE" PER 1,000 OF EACH SEX CALCULATED ON THE POPULA. TION OF 1941 FOR 1941-50 AND FOR EACH INDIVIDUAL YEAR BY SEX, 1941-50
Average for 1941 1941-60 1942 1943 1944 1945
,--.A--. ,---"---. -. ,--.A--. ,--.A--.
Male Female Male Female Male Female Male Female Male Female Male Female
West Bengal -05 -I -04 -I -04 -I -I -I -05 -05 -05 -I Burdwau -04 -05 -05 -1 -04 -I -04 -03 -05 -04 -05 -05 Birbhum -I -04 -04 -I -I -I -05 -03 -I -02 -03 -02 Bankura -I -1 -I -I -I -I -I -04 -I -1 -04 -I Mlduapur '03 -03 -03 -03 -02 -2 -03 -03 -03 -03 -03 -03 Rooghly -I -I -I -I -I '1 -I ,1 -1 -I -I -I Rowrah -I -I -I -I -I -I -I -I -I -I -I -1 24.Pargau';'; -I -I -I -I -I -I -I -I -I -I -1 -I Calcutta -03 -04 -01 -01 -01 -01 -01 -01 -03 -04 -04 -05 Nadia -I -I -02 -01 -03 -02 -03 -01 -04 -03 -I -05 Murshidabad -I -I -04 -03 -04 -04 -I -I -I -I -I -I MaIda -04 -03 -03 -02 -02 -02 -04 -04 -04 -03 -03 -02 West Diuajpur -03 -04 -03 -04 -03 -02 -02 -03 -02 -04 -03 -I Jalpaiguri -03 -02 -02 -03 -03 -02 -03 -02 -Oll -03 -02 -02 Darjeeling -I -04 -I -02 -I -03 -I -01 -I -I -I -02 Cooch Behar
1946 1947 1948 1949 1950 ,---....A----, ,...-----..A----, ,---....A...---. ,.---"---. r--....A----. Male Female Male Female Male Female Male Female Male Female
West Bengal -05 -I -05 -1 ·05 -1 -05 ·1 005 -1 Burdwan _ -04 -05 -04 -03 -04 -04 -04 -I -03 -05 llirbhum -03 -04 -05 -05 -04 -04 -I ·04 -I -03 Banknra -I -05 -I -04 -04 -04 -I -I -I: -03 Midnapnr: -02 -03 -03 -02 -03 -03 -04 -04 -03 -02 ROoghly -I -I -I -1 -I -1 -I -I -I -I Howrah -I -I- -I -I -I -I -I -I -I -I 24-Parga~ -I -I -04 -I -0<1" -I -I -I -I -I Calcutta -04 -03 -03 -I -04 '1 -05 -I -05 -I Nadia -I -I -I -I -04 -I -I -I -I -I Murshidab~d -05- -I -05 -I -I -I -04 -I -05 ;00,)
Malda -03 -02 -04 -02 -04 -04 -04 -I -03 -04 West Dinajpur - -03 -I -03 -04 -03 -04 -06 -04 -04 -02 Jalpaiguri -02 -02 -02 -02 -03 -02 -03 -02 -02 -01
Darjeeling -I -02 -I -I -I -I -I -I -1 -03 Cooch Behar
TABLE 16.8
DEATH RATE FROM" CHILD BIRTH" PER 1,000 OF FEMALE POPULATION AS PER CENSUS OF 1941, 1941-50
Average for
1941-50 1941 1942 1943 1944 1945 1946 1947 1948 1949 10:;0
West Bengal -3 '3 -s -3 -3 -3 -3 -3 -3 -4 -2
Bnrdwan -3 -4 '4 -3 -2 -3 '3 '3 -4 -4 -2
Birbhum -3 -4 -4 -3 -2 -3 ·3 -2 ·3 -4 -2
Bankura -3 -4 -3 -3 -2 '2 '3 -3 .~ -3 .~
Miduapur -4 -4 -4 -3 -3 '3 .4 -3 -4 -j -a
Rooghly . '4 -5 -4 -4 -3 -3 '3 -s -4 -4 -3
Rowrah -2 -3 -2 -2 -3 '2 -2 '1 2 ·2 '1
24-Parganas -2 ·3 ·3 '2 -2 ·2 ·2 "J -3 '3 '2
Calcutta ·3 ·1 -04 ·04 ·3 '3 '4 -3 -5 '0 '5
NadIa -3 ·2 '1 ·2 ·3 '3 ·4 -3 ·Ii ·5 '3
Murshidabad ·2 -I -2 '1 '2 '2 -2 ,-2 ·3 .t, '3
Malda -3 -3 ·3 '2 '3 -3 '3 ·2 ·3 '3 '2
West Diuajpur -8 -7 ·7 ·8 ·7 -8 -9 ·9 ·8 I-I '7
Jalpaiguri 1-4 1-7 1-4 1-2 1-0 1-2 1-8 1-2 1-4 ]·7 1'3
Darjeellng -6 -7 '8 ·6 '6 -7 -6 '6 -6 ·8 '4
Cooch Behar
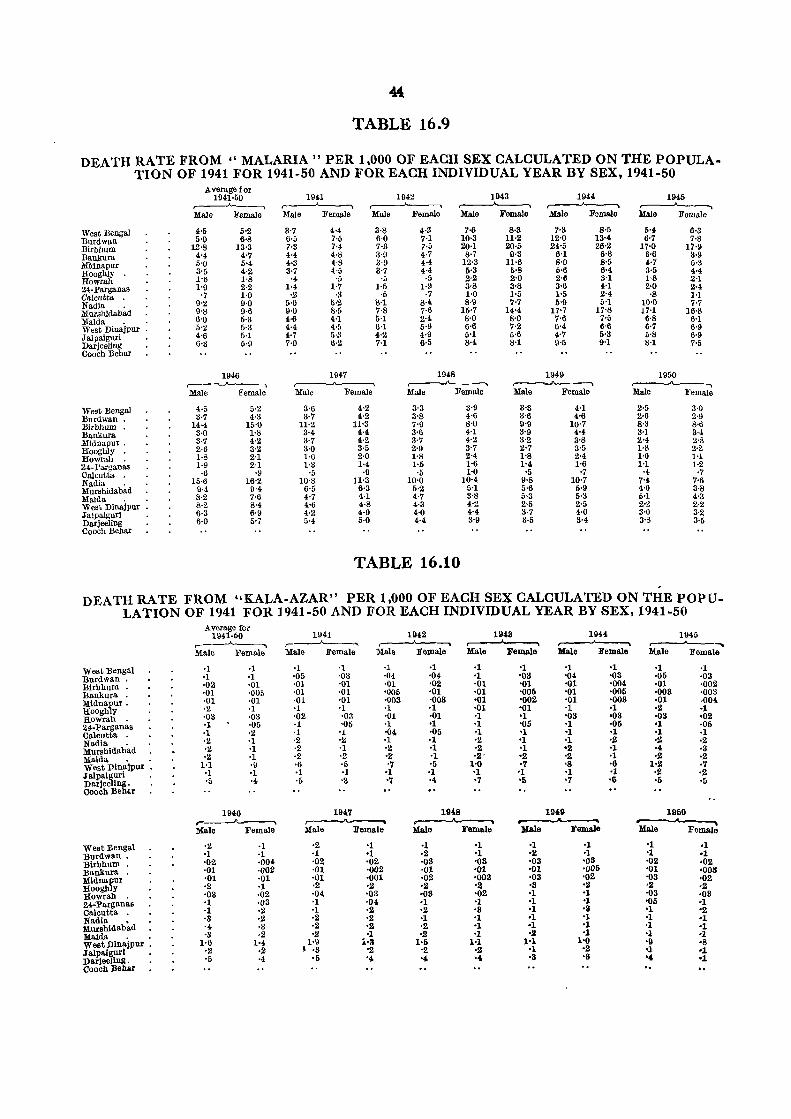
TABLE 16.9
DEATH RATE FROM "MALARIA" PER 1,000 OF EACH SEX CALCULATED ON THE POPULATION OF 1941 FOR 1941·50 AND FOR EACH INDIVIDUAL YEAR BY SEX, 1941-50
West Bengal Burdwan Blrbhnm Banl<ura Mldnapur Hooghly . Howrah 24-Parganas Calcutt& Nadia . Murshidabad MaIda West Dinajpur . Jalpaiguri Darjeeling Cooch Behar
West Bengal Burdwan . Birbhum Bankura Midnapur. Hooghly Howrah 24-Parganas Calcutta Nadia . Murshldabad Maida West Dinajpur Jalpaiguri Darjeeling Cooch Behar
DEATH RATE
Average for 1941·50
,..----A-----, Male Female
4'5 5'9
12'8 4'4 5'0 3'5 1'6 1'9
'7 9'2 9'S 0'0 5'2 4'6 6'3
5'2 6·8
13·3 4'7 5'4 4·2 1'8 2·2 1'0 g·O 9·6 5·3 5·3 5·1 5·9
1946 ,--.-~
Male Female
4·5 3·7
14·4 3·0 3·7 2·6 1·8 1·9
·6 15·6
9·4 8·2 ll·2 6·3 6·0
5·2 4·3
15·0 1'8 4·2 3·2 2·1 2·1
·9 16·2
9·4 7·6 8·4 6·9 5·7
1941 ~ Male FeIll&le
1942 ,~
MaJe )j'emaJe
11143 ~ Male Female
3'7 6·5 7·3 4·4 4·3 3·7
·4 1'4
• .2 5'0 9'0 4·6 4·4 4·7 7·0
4·4 7·5 7·4 4·8 H 4·5
·5 1·7
·3 5'2 8·5 4·1 4·5 5·3 6·2
3'8 6·0 7'3 3·9 3·9 ~'7
'0 1·5
·5 IH 7·8 5'1 6·1 4·2 7'1
1947 ~ Male Female
3'6 3'7
11'2 3'4 3'7 3·0 1·6 1·3
·5 10·8
6·5 4·7 4'6 4·2 5·4
4'2 4'2
11'3 4·4 4'2 3·5 2'0 1·4
·9 11·3
6·3 4·1 4·8 4·9 5·0
4·:1 7·1 7·5 4·7 4·4 4·4
·5 1·9
·7 8·4 7·6 2·4 6·9 4·9 6·5
7·6 10·3 20·1 8·7
12'3 5·3 2·2 3·8 I'D 8·9
15·7 8·0 6'6 5'1 8·4
1948 ,.---;---------. Male Female
3·3 3'8 7'9 3'6 3'7 2'9 l'S 1'5
'5 10'0
5·2 4·7 4·3 4·0 4·4
3·9 4·6 8'0 4·1 4'2 3'7 2'4 1·6 1·0
10'4 0'1 3·8 4·2 4'4 3'9
TABLE 16.10
8·3 11·2 20'0
9·3 11·6
5·8 2·0 3'8 1·5 7·7
14·4 8'0 7'2 5'6 8'1
3'3 3'6 9'9 3'9 3'2 2'7 1'8 1'4
'5 9'8 5'6 5'3 2·5 3·7 3·5
1944 r---'------> Male Female
7'3 12'0 24'5
6·1 8'0 5'6 2·6 3'6 1'5 5·9
IN 7'6 6'4 4·7 9·5
4·1 4'6
10·7 4·4 3·8 3·5 2·4 1'6
·7 10'7
5·9 5·3 2·5 4·0 3·4
8·5 13·4 26·2
6'8 g·5 6'4 3'1 4'1 2'4 5'1
17'8 7·5 6'6 5·3 9'1
1945 ,---A------.., lIfale Female
O'!l 6·7
17'0 3·6 !l·7 3·5 1·8 2'0 '8
10·0 17-1
6·8 6·7 5·8 8·1
6·3 7·8
17'9 3·9 5'3 4·4 2'1 2·4 1-1 7-7
16·8 6'1 6'9 6·9 7·5
1950 ,.-----...A-----.... Male Female
2·5 2·6 8·3 3-l 2·4 1·8 1·0 1-1
·4 7·4 4·0 5-1 2·2 3·0 3·8
3·0 2·9 8·6 3'4 2·8 2·2 1·1 1·2
·7 7·6 3'8 4'3 2·2 3'2 3'5
FROM "KALA·AZAR" PER 1,000 OF EACH SEX CALCULATED ON THE POPU~ LATION OF 1941 FOR J941·50 AND FOR EACH INDIVIDUAL YEAR BY SEX, 1941~50
Average for 1941 1941·50 1942 1943 1944 1945
~ ,---'------ ~ r----A----. Male Female Male Female Male Female Male Felllale Male Female Male Female
West Bengal ·1 ·1 -I ·1 ·1 ·1 ·1 -I '1 -I -I ·1 Burdwan • '1 ·1 '05 ·03 ·04 ·04 ·1 '03 '04 '03 '05 ·03 Birbhum . ·02 ·01 -01 '01 ·01 '02 ·01 '01 '01 -004 ·01 ·002 Bankura ·01 ·005 ·01 ·01 '005 -01 ·01 '005 -01 -005 ·003 ·003 Midnapur. ·01 ·01 ·01 '01 '003 '003 '01 '002 '01 -003 -01 -004 Hooghly ·2 ·1 '1 '1 ·1 -I ·01 '01 '1 -I ·2 ·1 Howrah ·03 ·03 ·02 '03 ·01 ·01 -1 '1 -03 '03 ,03 '02 24-Parganas ·1 ·05 ·1 ·05 '1 '1 ·1 -05 'I -05 'I ·05 Calcutta • ·1 ·2 ·1 'J. ·04 ·05 -I 'I 'I ·1 'I ·1 Nadia . ·2 ·1 ·2 '2 ·1 -1 ·2 'I 'I ·2 -2 -2 Murshidabad ·2 '1 ·2 '1 '2 ·1 '2 'I '2 '1 ,4 ·3 MaIda. ·2 ·1 ·2 '2 '2 '1 ,2' '2 '2 -I -2 ·2 West Dinajpur • 1·1 ·9 ·6 ·5 '7 '5 1'0 -7 '8 -6 1'2 ·7 Jalpaiguri . ·1 '1 ·1 '1 '1 -1 '1 -I 'I 'I ·2 ·2 Darjeeling . ·5 ·4 ·5 '3 '7 -4 '7 '5 '7 ,6 ·5 ·5 Cooch Behar
1946 11147 1948 1949 1950 ~ ~ ~ ~
Male Female Male Female Male Female Male Female Male Female
West Bengal ·2 ·1 ·2 -I ·1 '1 '1 'I -1 ·1 Burdwan. '1 ·1 ·1 '1 ,2 -1 -2 ·1 '1 .1 Bil:bhum • ·02 '004 '02 -02 ·08 '03 ,03 '03 '02 ·02 Banl<ura ·01 '002 ·01 -002 ·01 '01 -01 -00f) '01 '008 :Midna~m '01 ·01 ·01 '001 ,02 '003 '03 '02 '03 -02 JIoogh y ·2 ·1 ·2 ·2 ·2 -2 '3 -2 -2 -.2 Howrah • '03 ·02 ·04 '03 '08 '02 -I '1 '03 -03 24-I'arganas '1 ·03 ·1 ·04 -I -I -1 '1 -05 -1 Calcutta ·1 ·2 ·1 ·2 ·2 -3 '1 -3 -I '2 Nadia • '3 ·2 ·2 ·2 '1 -I ·1 '1 '1 ·1 Murshldabad '4 ·8 ·2 '2 ·2 '1 ·1 -I -1 '1 MaIda • • -1/ ·2 ·2 '1 ·2 '1 -2 ,1 '1 ·2 WestDinajpur • 1'6 1,4 1·9 1'3 1,5 I-I 1'1 1-0 -9 '8 Jalpaiguri • '2 ·2 I .3 '2 '2 ,2 ,I • .2 '1 '1 DarjeeIing . .f> ·4 -5 '4 '4 " -3 -3 ., '1 Cooch Behar
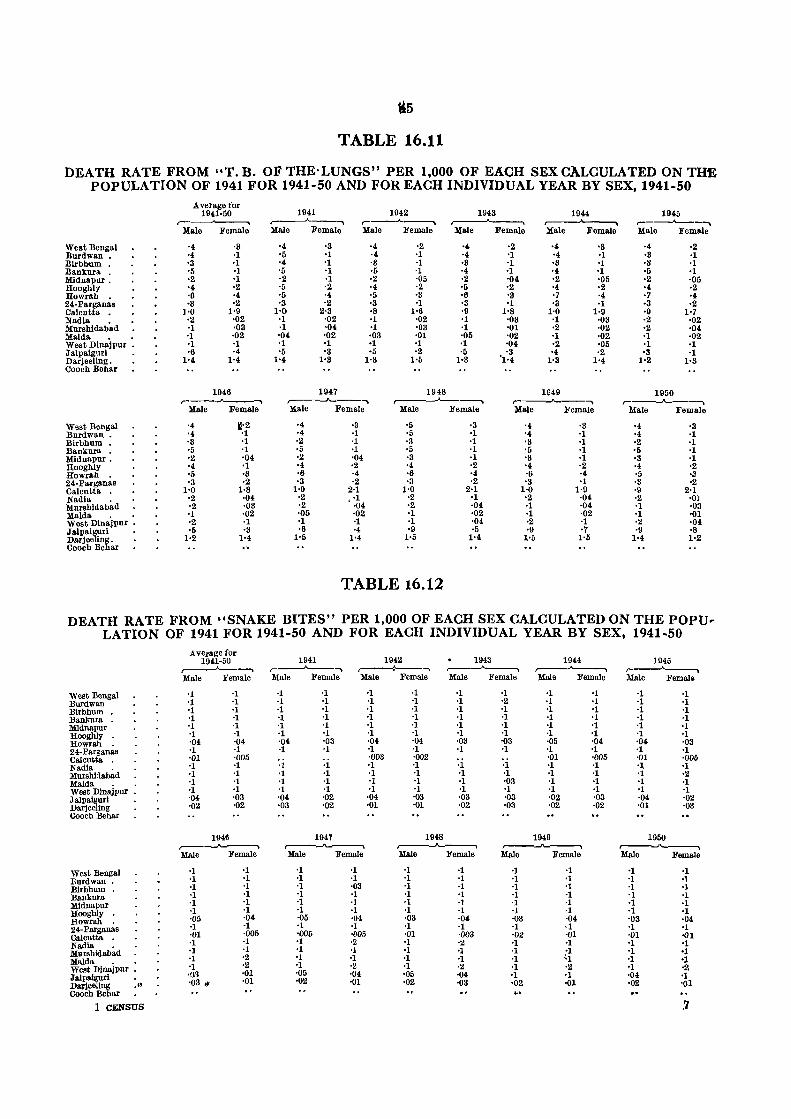
"5 TABLE 16.11
DEATH RATE FROM "T. B. OF THE-LUNGS" PER 1,000 OF EACH SEX CALCULATED ON THE POPULATION OF 1941 FOR 1941-50 AND FOR EACH INDIVIDUAL YEAR BY SEX, 1941-50
West Bengal Burdwan • Birbhum . Bankura . Midnapur. Hooghly Howrah • 24·Parganas Calcutta • Nadia • Murshidabad Maida • • West Dinajpur • Jalpaiguri Darjeellng. Cooch Behar
West Bengal Burdwan • Birbhum • Bankura • Mldnapur . Hooghly Howrah • 24· Parganas Calcutta . Nadia • Murshldabad Maida . • West Dinajpur • Jalpaiguri Darjeeling. Cooch Behar
Average for 1941-50 ~
Male Female
'4 ·3 ·4 ·1 '3 '1 '5 ·1 ·2 ·1 '4 ·2 '6 ·4 '3 ·2
]'0 ],9 '2 ·02 '1 ·03 '1 ·02 '1 ·1 ·6 ·4
1·4 1·4
1946 ,-__""___-,
Male Female
'4 1.\'2 '4 '1 '3 '1 '5 '1 '2 '04 '4 '1 '5 '3 '3 ·2
1'0 1·8 '2 ·04 '2 '03 '1 '02 '2 ·1 '5 ·3
1'2 1·4
1941 1942 1943 1944 1945 ..---'------, ,-__.____, ~ ,----"---. Male Female Male Female Male Female Male Female Male Female
·4 '3 ·4 ·2 ·4 ·2 ·4 '3 ·4 ·2 '5 '1 ·4 ·1 ·4 '1 '4 ·1 ·3 ·1 '4 '1 ·3 ·1 ·3 '1 '3 '1 ·3 ·1 '5 '1 ·5 ·1 ·4 '1 ., '1 ·5 ·1 '2 '1 '2 ·05 ·2 '04 ·2 ·05 ·2 ·05 '5 '2 ·4 '2 ·5 '2 ·4 ·2 ·4 ·2 '5 '4 ·5 ·3 ·6 '3 ·7 ·4 ·7 ·4 '3 '2 '3 '1 '3 '1 '3 '1 ·3 ·2
1'0 2'3 ·8 1'6 ·9 1'8 1·0 1·9 ·9 1·7 '1 '02 '1 ·02 '1 '03 ·1 ·03 ·2 ·02 ·1 '04 '1 ·03 ·1 '01 ·2 ·02 ·2 ·04 '04 '02 ·03 '01 ·05 '02 ·1 ·02 ·1 ·02 '1 '1 '1 '1 ·1 '04 ·2 '05 ·1 ·1 '5 '3 ·5 '2 ·5 '3 '4 ·2 ·3 ·1
1'4 1'3 1·3 1'0 1·3 '1'4 1-3 1'4 1·2 1·3
1947 1948 1949 1950 ,---.1'---'" ,------"-----. ,---"--..... r-..A..--..... Male Female Male Female Male Female Male Female
·4 ·3 '5 '3 '4 ·3 '4 '3 ·4 '1 ·5 ·1 '4 ·1 ·4 ·1 ·2 ·1 '3 '1 '3 ·1 ·2 '1 ·5 ·1 ·5 ·1 '5 ·1 '5 '1 ·2 '04 ·3 '1 '3 ·1 '3 '1 ·4 ·2 '4 '2 '4 ·2 ·4 '2 ·6 ·4 ·6 ·4 ·6 ·4 ·5 '8 ·3 ·2 ·3 ·2 '3 '1 ·3 ·2
1·0 2·1 1·0 2·1 1·0 1·9 ·9 2'1 ·2 , '1 ·2 ·1 '2 ·04 ·2 ,0) ·2 '04 ·2 ·04 ·1 ·04 ·1 ·03 '05 ·02 ·1 ·02 ·1 ·02 '1 '01 ·1 ·1 ·1 ·04 ·2 ·1 '2 ·04 '6 '4 ·9 ·5 '9 ·7 ·9 ·8
1·5 1'4 1·5 1·4 1·5 1·5 1'4 1'2
TABLE 16.12
DEATH RATE FROM "SNAKE BITES" PER 1,000 OF EACH SEX CALCULATED ON THE POPU .. LATION OF 1941 FOR 1941-50 AND FOR EACH INDIVIDUAL YEAR BY SEX, 1941-50
West Bengal Burdwan Birbhum Banknra Midnapur Hooghiy Howrah 24-Parganas Calcutta Nadia Murshidabad Maida . West DJnajpur Jalpalguri Darjeeling Cooch Behar
West Bengal Burdwan . Birbhnm Banknra Midnapur Hooghly Howrah 24· Parganas Calcutta Nadia . Murshidabad Malda West Dinajpur • Jalpalgurl Da;jeeling .0
Cooch Behar
1 CENSUS
Average for 1941-50
r----"-----> Male Female
'1 '1 '1 '1 '1 '1 '04 '1 '01 '1 '1 '1 '1 '04 '02
·1 ·1 ·1 ·1 '1 ·1 ·04 ·1 '005 ·1 ·1 '1 ·1 ·03 ·02
1946 ~~ Male Female
·1 '1 '1 '1 ·1 ·1 '05 '1 '01 '1 '1 '1 '1 .()~
'03 ..
'1 '1 ·1 ·1 ·1 '1 ·04 ·1 ·005 '1 '1 ·2 ·2 '01 '01
1941 ,...---A--..... Male Female
1942 ~ ..... Male Female
1943 ,..----A--..... Male Female
1944 ,...--_.______, Male Female
·1 ·1 ·1 ·1 ·1 ·1 '04 ·1
'1 '1 '1 '1 '04 '03
'1 '1 '1 '1 '1 '1 '03 '1
'1 '1 '1 '1 '02 '02
1947 r----A-~ Male Female
'1 '1 '1 ·1 ·1 ·1 ·05 '1 '006 '1 ·1 '1 '1 '05 '02
'1 ·1 '03 ·1 ·1 ·1 '04 ·1 ·005 ·2 '1 ·1 '2 '04 '01
·1 '1 ·1 ·1 '1 ·1 ·04 ·1 ·003 ·1 ·1 ·1 ·1
·04 ·01
·1 '1 '1 ·1 ·1 '1 ·04 '1 '002 '1 '1 '1 '1 '03 '01
'1 '1 ·1 ·1 ·1 ·1 ·03 ·1
·1 ·1 ·1 ·1 ·03 '02
1948 .---...A---, Male Female
·1 ·1 ·1 ·1 ·1 ·1 ·03 ·1 ·01 ·1 '1 ·1 '1 '05 ·02
·1 ·1 ·1 '1 '1 '1 ·04 ·1 ·003 ·2 .]
'1 ·2 ·04 '03
·1 ·2 '1 ·1 '1 '1 '03 '1
·1 ·1 '03 '1 '03 '03
·1 ·1 ·1 '1 ·1 ·1 ·05 '1 '01 ·1 ·1 '1 ·1 '02 ·02
1949 ,...--.......___...., Male Female
'1 '1 ·1 ·1 .}
·1 ·oa ·1 ·02 '1 ·1 ·1 '1 '1 '02
·1 '1 '1 ·1 ·1 ·1 ·04 ·1 '01 ·1 ·1 ;1 ·2 -] -01
'1 '1 '1 '1 '1 '1 '04 '1 '005 '1 '1 '1 ·1 ·03 '02
1945 ,...--"--..... Male Female
·1 ·1 ·1 ·1 ·1 '1 ·04 ·1 ·01 ·1 '1 ·1 ·1 '04 '01
1950
'1 '1 ·1 '1 '1 '1 '03 '1 '005 ·1 '2 '1 '1 '02 '03
,----''-----"'\ Male Fema10
'1 ·1 ·1 '1 ·1 ·1 '03 '1 '01 '1 '1 ·1 '1 '04 '02
.'1
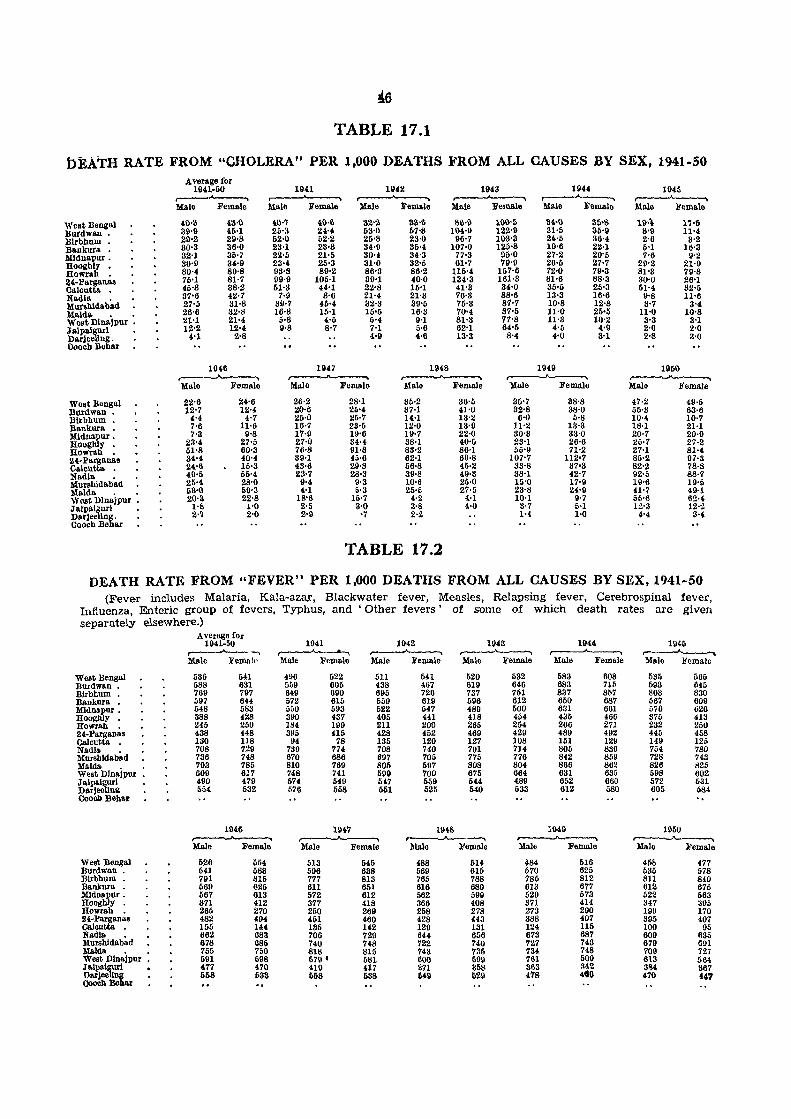
TABLE 17.1
bEATH RATE FROM "CHOLERA" PER 1,000 DEATHS FROM ALL CAUSES BY SEX, 1941-50
West Bengal Burdwan _ Blrbhum _ Bankura Mldnapur _ llooghly _ llowrab _ 24-Parganaa Caleutta Nadls. _ Murabldabad MaIds. _ -WeatD1Mjpur _ Jalpalgurl _ Darjeeling _ Coocb Bebar
West Bengal llurdwan _ lllrbbum _ llankura M1dnapur _ )iooghly , )iowrab _ 2,4-p .. rganas Calcutta _ Nadia _ Murahidabad MaIda We8t Dlnajpur -Jalpe.!gurl Darjeellng _ Cooch Behar
Average for 10'1·50
Male Female
40-3 43-1} 39-9 4&-1 29-2 29-8 30-3 36-0 32-1 35-7 30-0 34-9 80-4 89-S 76-1 81-7 46-S 38-Z 37-6 42-7 27-5 31-8 26-6 32-8 21-1 21-4 12-2 12-4
4-1 2-8
1946 ,-----"------. Male Female
22-6 lZ-7
4-4 7-6 7-3
23-4 61-8 34-4 24-6 49-5 25-4 6S-0 2,O-S
1-S 2-7
24-6 12,-4
4-7 11-6
9-8 27-5 60-3 40-4 15-3 55'4 28'0 60'3 22,'8 1'0 2'0
1941 ...----"-----.. M .. llI
41)·7 25'3 52·0 23-1 2lNi 23·4 93·8 90·9 51'3
7·9 39·7 16·8
6·S g·S
Fem.ale
41HI 24·4 52'2 23'8 21'0 25'3 89'2
105·1 44-1 8'6
46'4 16'1 Hi 8'7
Male
HI47 r---A--___. Male Femal&
26·2 20·6 25·0 16·7 17·9 27·0 76·8 39'1 43·6 23'7
\1-4 4'1
IS-6 Z'5 2-11
1042
Female
a:HI 67'8 23'0 36-4 34-3 32'5 86-2 40-0 15'1 21'3 39-6 16'3
0-1 5'6 4'6
Male
8t1-\) 104-0
96·7 107-0
77-3 61'7
116-4 134-3 41'3 76-3 76-3 70-4 81'3 62-1 13'3
tll{S ~ Male Female
35-2 37-1 14·1 12·0 19-7 38·1 83-2 62·1 56·8 SO-8 10·6 25·6
4-2 3,8 2·2
36-5 41'0 13-2 13·9 22'0 40·(i 86'1 69'8 45-2 49·3 25·0 27-1.
4-1 4·0
TABLE 17.2
Fem.ale
101)'1; 122'9 101l'3 126·8
96'0 7P'9
157-6 161'3 84'0 88-6 8'1-7 87'6 77-8 64-5 8'4
19U ,---A __ ......
Male Female
3~-0 35-8 31-5 35'9 24-1; 36'4 19·6 22-1 27·2 20'5 26'0 27-7 72-0 79'3 81-6 88'3 35'0 25'3 13-S 16'6 10·8 12'8 11-0 25'5 U-3 10'2 4'6 4'9 4'0 3'1
1949 ~ "Male Fem.ale
35'7 82'8 6'0
11-2 30'3 23'1 65'9
107-7 33'8 38'1 15'0 23'8 10'1
S-7 1-4
38-8 38'0
0·8 18'3 33·0 26'6 71'2
112'7 37'3 42-7 17-9 24'9
9'7 5'1 1'0
11145 ~ Male Female
19" 11-6 8'9 11'4 2-6 3-2, 6'1 16'3 7'6 9'2
20'2 21·0 81-S 79-8 30'0 26'1 61'4 32-6
9'8 11'6 3-7 3''''
n-o 10'8 3'3 3-1 2-0 2'0 2'8 3'0
11150 r------A------.. Male Female
47-2 55·8 10·4 18·1 20·7 25·7 27'1 85'2 82'2 92'5 19'6 41'7 55'6 12'3
4'4
49-5 63-6 10-7 21-1 20·9 27·2 81'4 ONl 78-8 88·7 111'0 49,1 62·4 12·2
:5-4
DEATH RATE FROM "FEVER" PER 1,000 DEATHS FROM ALL CAUSES BY SEX, 1941-50 (Fever includes Malaria, Kala-aza.r, Blackwater fever, Measles, Relapsing fever, Cerebrospinal fever,
Influenza, Enteric group of fevers, Typhus, and 'Other fevers' of some of which death rates are given separately elsewhere.)
WcstBengal Burdwan _ Blrbhum _ Bankura . :Mldnapur . Hoogbly _ llowrab _ 24-Parganas Calcutta . Nadia _ Murshldabad MaIda . West Dinajpur lalpa!guri De.rjeeUnK Coo(lb Behar
west :Bengal Burdwan _ llirbhum _ llankura . Mldnapur • lIooghly _ lIowrah _ 24-Parganas Calcutta • NadIa _ Murshidabad MaIda • • West Dlnajpur • J a.lplI!1!Urt I)l\I:jeeung (JOOCh :Behar
Average for 1941-50
,..----A--. Male FeIllll!t-
536 588 769 597 548 388 245 438 130 708 736 793 609 490 554
541 631 797 644 583 428 250 448 118 729 748 785 617 479 532
11146 ~ Male Female
&26 641 791 669 667 371 265 482 155 662 678 755 6111 477 658
554 683 816 1!26 613 412 270 494 141. 688 686 750 598 470 683
1941 ~ Male Female
496 559 6~9 572 550 390 184 395
94 739 670 810 748 574 576
513 596 777 611 572 377 250 451 185 706 740 818 579 • 4l1l 61)8
522 605 600 615 593 437 199 415
78 774 686 769 741 549 558
1942 r-------"------.. Male Female
1943 ~ Male Female
1944 r-----"-----.. Male Female
511 438 695 559 522 405 211 428 135 708 697 805 59U 5&7 561
545 638 813 651 612 418 269 460 142 729 748 815 581 417 638
541 467 726 619 547 441 200 452 120 740 705 597 700 559 526
520 619 737 696 489 418 265 469 127 701 775 808 675 544 040
11148 r~
lIWe Female
488 569 765 616 562 366 258 428 120 644 722 743 600 371 6411
614 615 788 680 599 408 278 443 131 656 740 735 599 858 029
532 1>46 761 612 500 454 254 429 108 714 776 804 664 480 633
583 683 837 650 631 435 266 489 151 805 842 866 631 652 612
1940 ~ Male Female
484 670 785 613 629 371 273 388 124 678 727 734 761 363 478
1'>16 625 812 677 573 414 290 407 115 687 743 748 500 a4~ 4GO
606 715 857 687 661 466 271 492 129 830 859 862 635 660 580
1945 ..-----'--...... Male Female
535 593 803 567 576 376 232 446 149 754 728 826 698 672 605
566 645 830 609 626 413 250 458 125 780 748 826 602 531 584
1960 ...----,1\-----,
Male Female
45S 686 811 612 522 347 199 395 100 609 670 709 613 al!!4-470
477 578 840 675 563 3115 170 407
95 635 691 727 564 367 447
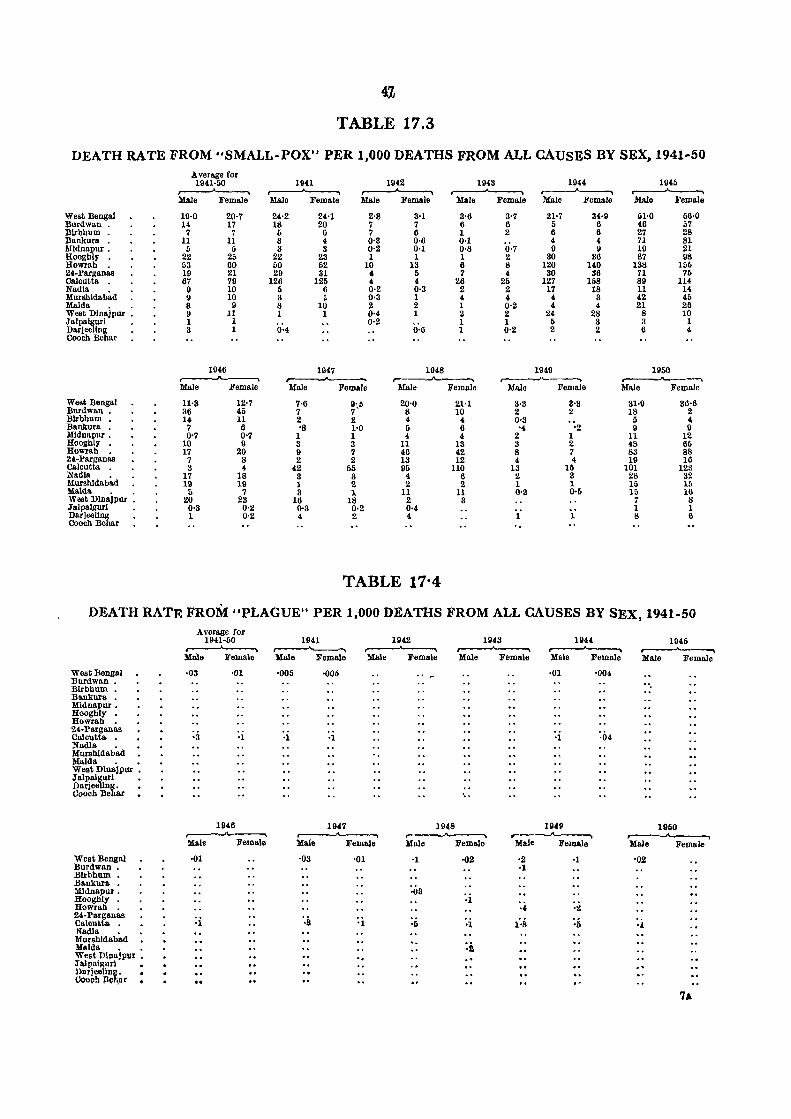
4,];
TABLE 17.3
DEATH RATE FROM "SMALL-POX" PER 1,000 DEATHS FROM ALL CAUSES BY SEX, 1941~50 A. vefage for 1941-60 1941 1942 11143 11144 11146 ~ ~ ~ ~ ,.-----'------, ~ Male Female Male Female Male Female Male Female Male Female Male Female
West Bengal 19-0 ZO-7 24-2 2·H 2-8 3-1 3-6 3-7 31-7 34-11 51·0 66-0 Burdwan _ 14 17 18 20 7 7 6 6 5 6 46 67 Blrbbum _ 7 7 I) 6 7 6 1 2 6 6 27 28 Bankura 11 11 3 • 0-3 0-6 0·1 4 4 71 81 M1dnapur : 6 6 3 3 0-2 0-1 o-s 0-7 II 9 19 21 Rooghly 22 25 22 23 1 1 1 2 30 S6 87 98 Rowrab 53 60 50 52 10 13 6 8 120 140 138 155 24-Parganas 19 21 29 31 4 6 7 4 30 36 71 71i Calcutta _ 67 79 126 125 4 4 26 25 127 168 89 114 Nadia 9 10 (; 6 0-2 0-3 2 2 17 18 11 14. Murs.bldabad 9 10 3 ~ 0-3 1 4 4 4 3 42 45 MaIda 8 9 8 10 2 2 1 0-2 4 4 21 26 West D1najpur : 9 11 1 1 0-4 1 2 2 24 28 8 10 Jalpaiguri 1 1 0-2 1 1 5 3 3 1 DarjeeUng 3 1 0-4 0-6 1 0-2 2 2 6 4 Coocb Bebar
1946 1947 1948 1949 1950 .......---...A------. ~ ~----, ,..----J'---.... .----"----, Male Female Male Female Male Female Male Female Male Femalo
West Bengal 11-3 12-7 7-6 9-5 20-0 21-1 3·3 3'3 31-9 36-6 Burdwan _ 36 45 7 7' 8 10 2 2 18 2 Blrbbum _ 14 11 2 2 4 4 0·3 5 4 Bankura 7 6 -s 1-0 Ii 6 '4 -2 II 9 M1dnapur : 0-7 0-7 1 1 4 4 2 1 11 12 Rooghly _ 10 9 3 3 11 IS 3 2 48 65 Rowrab _ 17 20 9 7 46 42 8 7 83 88 24-Parganas 7 8 2 2 13 12 4 4 19 16 Calcutta 3 4 42 55 95 110 13 16 101 123 Nadia 17 18 3 3 4 6 2 3 28 32 Mursblda.bad 19 19 1 2 2 2 1 1 15 15 MaIda 5 7 3 1 11 11 0'3 0-" 15 16 West Dlnajpur : 20 23 16 18 2 3 7 8 ;r alpalgurl 0·3 0·2 0·3 0·2 0·4 1 1 DarjeeUng 1 0·2 4 2 4 1 1 8 6 Coocb Behar
TABLE 17'4
DEATH RATE FROM "PLAGUE" PER 1.000 DEATHS FROM ALL CAUSES BY SEX, 1941~50
West Bengal Bnrdwan _ Blrbhum _ Bankura _ Midnapur _ Roogbly _ Rowrah _ 24-Pargana.s Calcutta _ Nadia _ Murshldabad Maida _ _ West Dlnajpur _ J" alpalgurl • Dsrjeellng _ Cooch Bebar
West Bengal Burdwan _ Blrbhum _ B .. nkura _ lI1ldnapur _ Roogbly _ Howrab _ 24-Parganas Calcutta . Nadia _ Murshldabad Maida _ _ West Dlnajpur _ J"a1paigurl • narjeellng_ (JooQh Be};." r
Average for 1941-50 11141 11142
.----'""---~ ~ MRle Female Male Female Male Female
1948 ...------'----. Male Female Male Female
-03 ·01
-3
1946 ,.--...A----,. Male Female
-I
·005 -005
1947 ~--.
Male Female
-03 ·01
'--
11l4S r-~ Male Female
-I -02
:03 -I
-0 '1
:i
-01
11149 ... ~ Male Female
-2 -I -I
-4 :2 1-8 :6
1945 .---'-~ Male Female
11150 ,...--___"_____' Male Female
'02
.!
7.
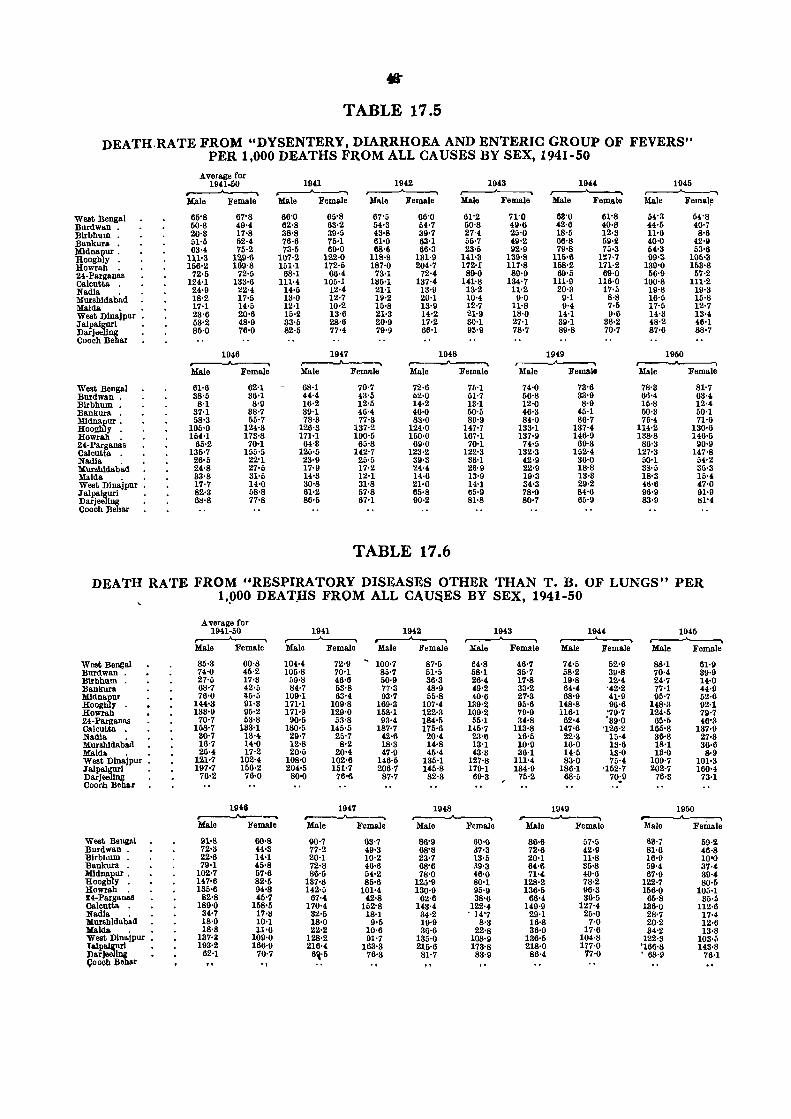
• TABLE 17.5
DEATH.RATE FROM "DYSENTERY, DIARRHOEA AND ENTERIC GROUP OF FEVERS" PER 1,000 DEATHS FROM ALL CAUSES BY SEX, 1941-50
Average for 19n-110 1941 1942 1943 1944 1946 ~ ~ ~ ~ r---'---..... Kale Female Male Female Kale Female lIIaIe Female Male Female Male Fema\e
West Bengal 66'8 67'8 66'0 65'8 67'0 66'0 61'2 71'0 63'0 61'8 54'3 54'8 Burdwan • 50·8 49·4 62'8 63·2 54'3 54·7 60·8 49·6 42·6 40·8 "·5 40'7 Blrbhum • 20'3 17·8 38'8 39·5 43'8 39'7 27'4 25·0 18·6 12'3 l1'6 8·6 Bankura 51·6 62·4 76·6 76·1 61'0 63·1 56'7 49·2 66'8 69·2 40·0 42·" l\IIdn~nr : 63·4 75·2 73-5 69·0 63'6 66·3 23'5 92·9 79'8 75·3 04'3 53'6 Hoog Y • 11.1-:1 1~1l'6 107·2 122·0 l18'8 131·1l 141'3 1S9·8 ll5'6 127'7 99'3 105'3 Rowrah • 156·2 169'8 151·1 172·5 187'0 204'7 172'1 ll7'8 158·2 171-2 139'0 153'8 24·Parganas 72·5 72'5 68·1 66'4 73'1 72·4 89'0 89'1l 611-{; 69·0 56'9 57·2 Calcutta . 124·1 133'6 111·4 105·J 135'1 137·4 141'8 134'7 l11·9 116·0 100'8 111·2 Nadia 24'9 22·4 14·5 12·4 21'1 13·9 13·2 11·2 20'3 17·6 11l'8 19'3 Mnrshldab~d 18·2 17·5 13'0 12·7 11l·2 20·1 10·4 9'0 9·1 8·8 16'5 15'8 lIIaIda 17·1 14·5 12'1 10·2 15'8 13'9 12'7 11'8 9'4 7·6 17·5 12'7 West Dlnajpnr 23'6 20'6 16·2 13'6 21'3 J4·2 21'9 18'0 14·1 9·6 14'3 13"
JalP~ 53·2 48'9 33'0 28·6 20'9 17·2 30·1 27·1 39·1 38·2 48·2 46'1 Darje 86'0 76'0 82'0 77·4 79'9 66'1 93'9 78'7 89'8 70·7 87'6 88'7 Cooch Be ar
1946 11147 1948 1S141l 1960 ~ ...-----J'--.... ~ ~ Male Female Male Female Male Female Male Female Male Female
West Bengal 61'6 62'1 68·1 70'7 72·6 76'1 74·0 73'6 78'3 81·7 Burdwan • 38'5 36'1 44'4 43·5 62·0 51·7 56·8 3S'9 66'4 63" Blrbhum • 8'1 8'9 16·2 12·5 14·2 13·1 12'0 8·9 15·8 12·4 Bankura 37·1 38'7 39·1 46·4 46·0 50·5 46'3 45·1 60'3 60·1 MJdnapur : 58·3 55'7 78'3 77·3 83·0 80'9 84'0 86'7 76'4 71'6 Rooghly • 105'0 124·3 126'3 137·2 124·0 147'7 133·1 137·4 114·2 130·6 Rowrah 154·J 173'8 17]'1 190'5 160·0 167-1 137·9 146'9 138·8 146·6 24· Parganas 65·2 70'1 64'3 65'8 69·0 70·1 74·5 69·3 86'3 90'9 Calcutta • 136·7 155·5 126'5 142·7 123·2 122'3 132'3 J52'4 127'3 147'8 Nadia 26·5 22'1 23'9 25·5 39·3 38'1 42'9 36'0 50'1 54·2 MllrShldab~d 24'8 27·5 17·9 17·2 24·4 26'9 22'9 18'8 38'5 35'S Maida 33'8 31'5 14·3 12'1 14·6 13'9 19·3 13'3 18'3 16'4 West Dlnajpur : 17·7 14'0 30'8 31'8 21·0 14-1 34·3 29·2 48'6 47'0 Jalpalgnri 82'3 58'8 61·2 57·8 65·8 65·9 78'0 84·6 96·9 111'9 Darieellng 68'8 77'8 86'5 67'1 90·2 81·S 80'7 65·9 83'9 81'4 Cooch Behar
TABLE 17.6
DEATH RATE FROM "RESPIRATORY DISEASES OTHER THAN T. B. OF LUNGS" PER 1,5)00 DEAT_HS FROM ALL CAU&ES BY SEX, 1941-50
West Bengal Burdwan . Blrbhum . Bankura Midnapur Roogbly . Rowrah 24· Parganas Calcutta Nadia • JIIurshldabad Maida West Dlnajpur • Jalpalgurl Darjeellng Coor.h Behu
West Bellgal Burdwan • '8lrblIUlD • '8ankura Mldnapur • Hooghly • Rowrah . U.Parganas Calcutta . Nadia . Murshldabad )(aida . • West Dlnajpnr • TaipalRurl Darjee1lng Qoocb Behar
Average for 1941·&0 ~ Male Female
85·3 74'0 27·5 6S·7 76'0
1"'3 133'9
70'7 15S'7
30'7 16'7 25'4
121-7 197'7
76·2
91·8 72'3 22'6 79·1
102·7 147·6 135'6
82'8 189'0
34'7 18'0 18·8
137-3 193·2
62'1
60'8 45·2 17'3 42'5 li5·5 91·3 95·2 53'8
188'1 18'4 14'0 17·2
102'4 156·2
76'0
60·8 44·3 14'1 45'8 57'6 82·5 94'8 46'7
158'5 17·8 10'1 11'6
109'0 166·9
70'7
11)43 1941 ~ )[ale Female
1942 ~ Male Female Male Female
1944 ~ Male Female
104·4 105·8
59·8 84·7
109·1 171·1 171·9
90·5 180·5
29'7 12·8 20-6
108·0 204·5 80'0
72·9 70·1 46·6 58·8 63'4
109'8 129'0
53'8 145'5
25'7 8·2
20'4 102'6 151'7
76·6
100·7 85'7 50·9 77·3 93·7
169·3 158·1 93'4
187-7 42'6 18·3 47·9
146·5 206'7
87·7
1947 ,--_..A..-----.
Male Female
90·7 77·2 20'1 72·8 86'5
137·8 142·5
67'4 170'4
32'5 18·0 22·2
128'2 216'4 6~'5
63·7 49·3 10·2 46·6 54·2 85·6
101'4 42'8
152'8 18'1
9'5 10·6 91'7
163'3 76'3
87·5 51·5 36·3 48·9 55·8
107'4 122'3 184·5 175·6
20'4 14·8 45'4
135'1 145·8
82·3
64'8 58'1 26'4 49'2 40'6
139'2 109'2
55'1 145'7
23'6 13'1 43'3
127'8 179'1
69'3
1948 ~ Male Female
86'9 6S'S 23'7 68'0 78'0
125'9 130·1)
62·6 143·4
34·2 19·9 36'6
135'0 215'6 81'7
60'0 37'3 l3'5 .'9'3 46'0 80'1 95·1) 38'6
122'4 . J4'7
8'3 22'8
108'9 173'8 83'9
46·7 35'7 17·8 33·2 27'3 95'6 79'9 34'8
113'8 16·5 10'9 36·1
111'4 134·9
75·2
74'5 58·2 19·8 64'4 68'9
148'8 116·1 62'4
147'6 22'3 16·0 14·5 83'0
186·1 68'5
1949 r------Jo-.--___
52·9 39·8 12·4 '42·2 41·9 96·6
'79·7 '39'0
'126·2 15·4 13·6 13·0 75·4
'152·7 70~9
Male Female
86'6 72'6 20'1 64·6 71·4
128·2 136·5
66·4 149·9
29·1 16·8 36·0
136·5 218·0
86·4
57·5 42'9 11·8 35·8 40·6 78·2 96·3 36·5
127'4 25·0
7·0 17·6
104·8 177·0
77·0
1945 r----'-------> Male Female
88'1 70·4 24'7 77·1 95'7
148'3 124·5
65'5 165'8
36'S 18'1 13'0
109'7 202'7
76'3
61'9 39·9 14·0 44'9 52·6 92·1 79·7 46'S
137·9 27·3 36·6 8·9
101'3 160·4
73·1
1950 r----A-____
Male Female
S3·, 81·6 16·9 59·4 67'"
122'7 156·0
65·8 136'0
28'7 20·2 84·2
122'3 '166'8 • 68'9
59·2 46·8 10-0 37'4 39·4 80·5
105·1 35·6
112·6 17'4 12·6 13·8
103·5 143·8
76·1
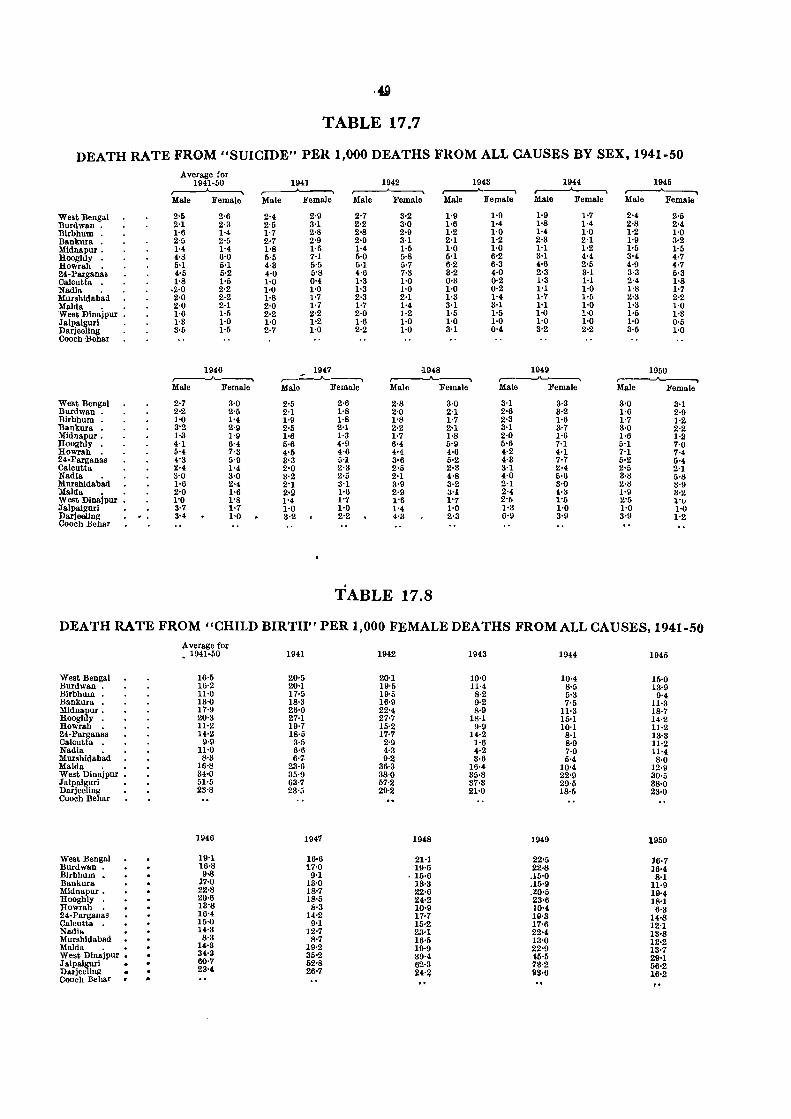
TABLE 17.7
DEATH RATE FROM "SUICIDE" PER 1,000 DEATHS FROM ALL CAUSES BY SEX,1941-50
West Bengal Burdwan • Blrbhum Bankura • Mldnapur . Hooghly . Howrah • 24·Parganas Oalcutta • Nadia Murshldabad Maida . West Blnajpur Jalpalgurl Darjeeling Oooch Behar
West Bengal Burdwan . Blrbhum Bankura . Midnapur. Hooghly . Howrah . 24· Parganas Oalcutta Nadia • Murshldabad Maida • • West Dinajpur • J"alpalguri Darjoollng Oooch llehar
Average for 1941-50 ~ Male Female
2·5 2·1 1·6 2'0 1·4 4·8 0·1 4'0 1'8
·2·0 2·0 2·0 1·6 1'3 3'0
2·6 2·3 1·4 2·5 1·4 6·0 0·1 0·2 1·5 2·2 2·2 2·1 1'0 1·0 1'5
1946 r----_,\,_~
Male Female
2·7 2·2 1'0 3'2 HI 4'1 0'4 4'3 2·4 3'0 1·6 2'0 1'0 3·7 3'4
3'0 2'5 1'4 2'9 1'9 6'4 7'3 5'9 1'4 3'0 2'4 1'6 1'8 1'7 1'0
1941 1944 ~
Male Female
1942 ~ Male Fwnale
1943 ,..---"----. Male Female Male Female
2·4 2'0 1·7 2·7 1·8 0'5 4·3 4'0 1·0 1·0 1·8 2·0 2·2 1'0 2·7
2·9 3·1 2·8 2·9 1·6 7·1 5·5 5'S 0·4 1·0 1·7 1·7 2·2 1·2 1·0
2'7 2·2 2·8 2·9 1'4 5'0 Ii-! 4'6 1'3 1·3 2·3 1·7 2·0 1'6 2·2
, 1947 ,..--_.....JI..------, Male Female
2·5 2'1 1·9 2'5 1·6 0·6 4'0 3'3 2'0 3'2 2'1 2'9 1'4 1·0 3·2
2·6 l·S 1·8 2'1 1'3 4'9 4·6 5'l 2'3 2'0 3'1 1'6 1"/ 1'0 2·2
3·2 3'0 2·9 3·1 1·5 5·8 5·7 7·3 1'0 1·0 2·1 1·4 1·2 1·0 1·0
·1948
1'9 1·6 1·2 2'1 1'0 0'1 6·2 3'2 0·3 1·0 1·3 3·1 1·5 1·0 3·1
r----"---. Malo Female
2·8 2'0 1'8 2·2 1·7 6·4 4'4 3'6 2·5 2'1 3·9 2·9 1'6 1·4 4·3
3·0 2'1 1·7 2·1 1·8 0'9 4·6 0·2 2·3 4'8 3·2 ll-1 1'7 1'0 2'3
TABLE 17.8
1·9 1·4 1·0 1·2 1·0 6·2 6·3 4·0 0·2 0·2 1·4 3·1 1·5 1·0 0'4
1·9 1'8 1'4 2·3 1'1 3·1 4·6 2·3 1·3 1'1 1·7 1'1 1·0 1'0 3·2
1949 r----''------." Male Female
3·1 2'6 2·3 3·1 2·0 0'6 4·2 4·3 3'1 4·0 2'1 2'4 2'5 1'3 6'9
3·3 3·2 1·6 3·7 1·6 7'1 4'1 7·7 2·4 0·6 3·0 i·3 1'0 1'0 3·9
1·7 1·4 1·0 2'1 1·2 4·4 2·5 3·1 1·1 1'0 1·5 1·0 1·0 1'0 2·2
1940 ,---A---...... Male Female
2'4 2·8 1·2 1'9 1·5 3'4 4·9 3·3 2'4 1'8 2·3 1'3 1'5 1·0 3·5
1950
2'0 2'4 1'0 3·2 1·5 4·7 4·7 0·3 1·8 1·7 2'2 1'0 1·3 0'0 1'0
r---.J'-~
Male Female
3'0 1·6 1·7 3·0 1·6 0'1 7'1 0·2 2·5 3·8 2·8 1·9 2'5 1'0 3·9
3·1 2'9 1·2 2·2 1·2 7'0 7'4 0·4 2'1 5·8 3'9 3·2 l'U 1·0 1·2
DEATH RATE FROM "CHILD BIRTH" PER 1,000 FEMALE DEATHS FROM ALL CAUSES, 1941-50 Average for
1941-50 1941 1942 1943 1944 1945
West Bengal 16·5 20·5 20'1 10·0 10·4 15·0 Burdwan . 16·2 20·1 19'5 11·4 8·5 13·9 Birbhwn 11·0 17·5 19'5 8·2 5·3 9'4 Bankura 13'0 18·3 16·9 9·2 7·5 11·3 Midnapur • 17·9 26·0 22'4 8·9 11·3 18·7 Hooghly . 20·3 27·1 27-7 18·1 15·1 14·2 Howrah 11·2 19·7 15'2 9'9 10'1 11·2 24· Pargan~s 14·2 18·5 17·7 14·2 8'1 13·3 Calcutta • 9·9 3·5 2'9 1·6 8·9 11·2 Nadia 11·0 6·6 4'3 4·2 7·0 11·4 Murshidab~d 8·3 6·7- 9·2 3·6 0·4 8'0 Maida 16·8 23·6 36·3 16·4 10·4 12·9 West Dinajpur • 34·0 35·9 38'0 35·8 22·9 30·5 J"alpaigurl 51·5 63·7 57'2 37·3 29·5 38'0 Darjeeling 23'8 23·5 29·2 21·0 18'0 23'0 Ococh Behar
1946 1947 1948 1949 1950
West Bengal 19'1 16'6 21'1 22'5 36·7 Burdwun . 16'8 17'0 19·6 22·8 l6·4 Blrbhum 9·8 9·1 . 10·6 .15'0 8'1 Bankura 17·0 lS'O lS'3 .15·9 11·9 M1dnapur. 22·8 18·7 22·6 .20'0 19'4 Hooghly 2(}'6 18·5 24·2 23'6 18'1 Howl'ah 13'8 8'S 10·9 10·4 6·8 24-Parganas 16'4 14·2 17-7 19·8 14·8 Calcutta 15·0 9'1 15·2 17·6 12'1 Nadi" 14·8 12·7 23'1 22·4 18·8 Murshldabad 8'S 8·7 16·5 13'0 12·2 Maida 14·8 19·2 19·9 22'9 13·7 West D1najpur • 34·3 35'2 39·4 ~6'5 29'1 Jalpalguri 60'7 52'S 62·3 73'2 66·2 Uarjeeillll! . 23'4 26'7 24'~ as'6 16'2 Oooch Behar •
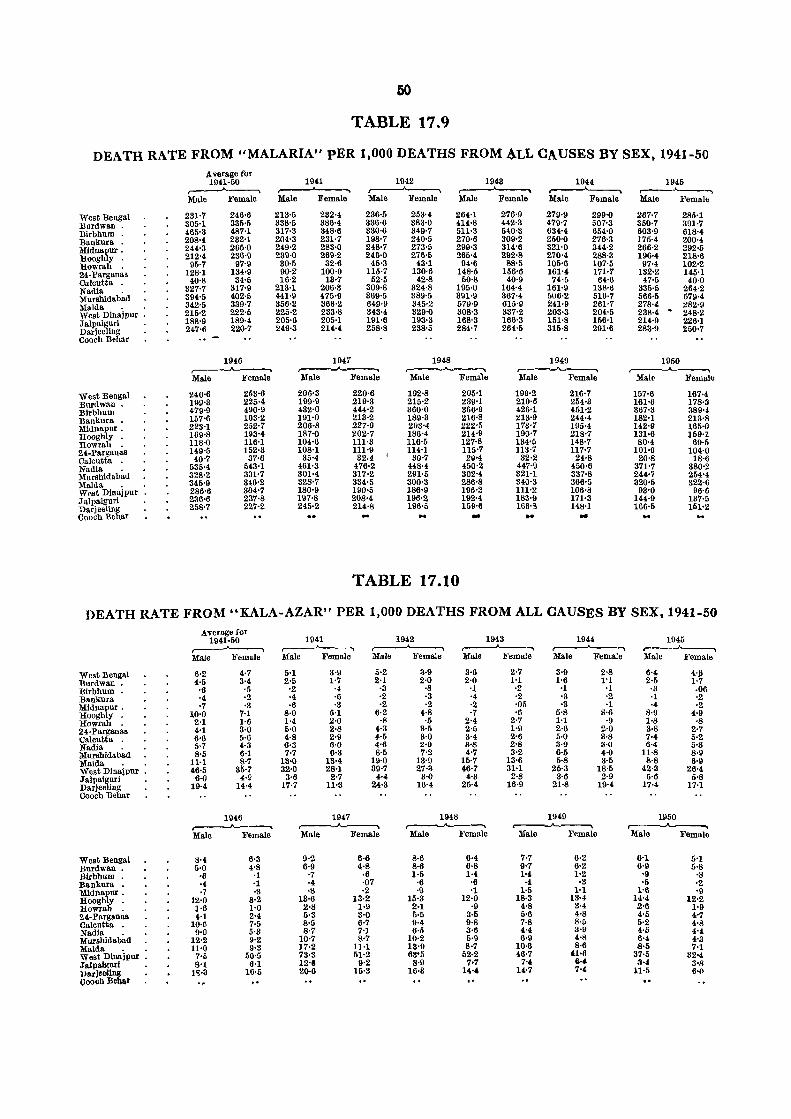
50
TABLE 17.9
DEATH RATE FROM "MALARIA" pER 1,000 DEATHS FROM ALL CAUSES BY SEX, 1941-50 .A verage for 1941-50 1941 1942 1943 19U 1945
,.-----A-----. "'" r--A ____
..------'-----> r----'----.. ,----"----, Male Female lIlale Female Male Female lIlale Female Male Female Male Female
West Bengal 231·7 246·6 213·5 232·4 236·5 253·4 264'1 276'9 279'9 299'0 267·7 285·1 Burdwan • 305·1 335·5 338'5 386·4 336·6 383·0 414·8 442·3 479·7 507'3 350·7 391-7 Birbhum . 465·3 487·1 317·3 348·6 330·6 349·7 511·3 540'3 634'4 654·0 603·9 618·4 Bankura . 208'4 232'1 204·3 231·7 198·7 240·5 270·6 309·2 250'0 276·3 175·4 200·4 Miduapur. 244·3 265·0 249·2 283·0 248·7 273·5 299·3 314'6 321'0 344·2 266·2 292·5 Hooghly 212·4 236·9 239·0 269·2 246·0 27~H 265·4 292·S 270'4 288·3 196·4 218·6 Howrah 95·7 97'9 30·5 32·6 45·3 43·1 94·6 88'5 105'6 107·5 97·4 102·2 24· Parganas 128·1 134·9 90-2 100·9 115·7 130·6 148·5 156'6 161·4 171·7 132·2 145·1 Calcutta 40'8 34·5 16·2 13·7 52·5 42·8 50'8 40'9 7401; 64·6 47·5 40'0 Nadia 327·7 317·9 213·1 206·3 309·8 324·8 195'0 164'4 161·9 138·6 335·5 264·2 Murshidabad 394·5 402·5 441·9 475'9 369'5 389·5 391'9 367'4 506·2 516'7 566·5 579·4 Maida 342'5 339·7 356·2 366·2 649·9 345·2 579·9 615'9 241·9 261·7 278'4 282·9 West Dinajpur . 215·2 222·5 225·2 233'8 343·4 329'0 308'3 337'2 203·3 204·5 238·4 . 248·2 Jalpaiguri 188'9 189·4 205·6 205·1 191·6 193·3 168'3 166'3 151·8 156'1 214·9 226·1 Darjeeling 247·6 220·7 249·3 214·4 258·8 238·5 284'7 264·5 315·8 291·6 283·9 250·7 Coach Behar
1946 1947 1948 1949 1950 ~ ~ ,.---_.Jo.---..... ,.-----...J'----. ~ l\lale Female Male Female Male Fema1e Male Female Mal~ Female
West Bengal 240·6 253·6 206·3 220·6 192·8 205'1 199·2 216·7 157'6 167·4 Burdwan • 199·3 225·4 199·9 219·3 215·2 239'1 219·6 254·3 161·6 178'3 Birbhum 479·9 490·9 432·0 444·2 360·0 366'9 426·1 451'2 367·3 389'4 Bankura • 157'6 103'2 191·0 213·2 189'3 216·8 213·9 244,,4 182-1 213·8 Mldnapur. 228'1 252·7 206·8 227·9 203'4 222-5 173·7 195·4 142·9 165'0 Hooghly 169·8 193'4 187'0 202'7 186'4 214·9 190·7 218·7 181-6 159'1 Howrah 118·0 116'1 104·6 111·3 116·5 127·8 134·5 148·7 80·4 69·5 24-Parganas 149'5 152·3 108'1 111·9 114·1 115·7 113·7 117·7 101·9 104·0 Calcutta 40·7 37·6 31>-4 32·4 30'7 21H 32·2 24·8 20'8 18'6 Nadia . 535·4 543'1 461'3 476'2 448·4 450·2 447·9 450·6 371'7 380-2 Murshidabad 328·2 331'7 301'4 317·2 291'0 302'4 321'1 337'8 244·7 254·4 Maida 345'9 346'2 328'7 334'5 300'3 286'8 340'3 366'0 320·5 322·6 West Dinajpur • 286'6 304'7 180'9 190'5 1.86·9 196'2 111·2 106·8 93'0 96·6 Jalpaiguri 236·6 237·8 197·8 208'4 196'2 192'4 183·9 171·3 144·9 137·5 Uarjeeling 258·7 227·2 245·2 214'8 196-5 159·6 166·g }'l8'1 166·5 101·2 Cooch Behar ... ... - ..
TABLE 17.10
DEATH RATE FROM "KALA-AZAR" PER 1,000 DEATHS FROM ALL CAUSES BY SEX, 1941-50
West Bengal Burdwan . Birbhum . Bankura Midnapur . Hooghly . Howrah 24-Parganas Calcutta Nadia Murshidabad Maida West Dinajpur • Jalpaiguri Darjeeling Cooch Behar
West Bengal Burdwan • Birbhum Bankura Mlduapur • Hooghly Rowrah 24-Parganas Calcutta Nadia . Murshidabad Maida • • West Dlnajpur . Jalpail(uri l>arjecllng Cooch Bebllr
Average for 1941-50 ~ Male Female
0·2 4·5 '6 '4 '7
10'0 2·1 4·1 6'6 5·7 8·5
11·1 46·5
6·0 19·4
4·7 3'4 ·5 ·2 ·3
7·1 1·6 3·0 5·6 4·3 6·1 8·7
35·7 4·9
14·4
1946 r-----"-----.. Male Female
8·4 5·0
·6 ·4 ·7
12·0 1·6 4·1
10·6 g·O
12·2 11·0
7·5 S-l
1<;-3
6·S 4·8
·1 ·1 ·3
8·2 1·0 2·4 7·5 5·8 9·2 9·3
50·5 6'1
16·5
1941 ,----"------0. Male Female
5·1 2·5
·2 ·4 ·6
8·0 1·4 5·0 4·8 6·3 7·7
13·0 32·0
3·6 17·7
3·9 1·7
·4 ·6 ·3
5·1 2·0 2·8 2·9 6·0 6·3
IS·4 28·1
2·7 1HI
1942 ,...----A-----, lIlale Female
5·2 2·1
·3 ·2 ·2
6·2 ·8
4·3 4·5 4'6 8·5
19·0 39·7
4'4 24·3
3·9 2·0
·8 ·3 ·2
4·8 ·5
3·5 3·0 2'9 7·2
13'9 27·3
3·0 16'4
1943 ...----A--..... Male Female
3·6 2·0 '1 '4 ·2 ·7
2·4 2·5 3'4 3'S 4'7
15·7 46·7
4·3 25·4
2'7 1'1
·2 '2 '05 '6
2·7 1'9 2'6 2'S 3·2
13·6 31·1 2·8
16·9
1944 ,..--A--..... Male Female
3·9 1'6
'1 '3 ·3
5·8 1'1 2·6 5,0 3·9 6·5 5·8
25·3 3·6
21·8
2·8 1'1
'1 -2 ·1
g'6 ·9
2·0 3·8 3'0 4·0 3·5
18·5 2·9
1Il-4
1947 ,.---_.Jo.-----.,
lIlale Female
1948 ,----...A----.
1949 ~
9·2 6·9
·7 ·4 ·8
13·6 2·8 5·3 8·5 8·7
10·7 17·2 73'3 12" 20·6
6·6 4-8
·6 '07 ·2
13·2 1·9 3·0 6·7 7'1 8-7
11·1 51·2
9·2 16·3
Male Female
8·6 8·6 1·5
·6 ·9
15·8 2-1 0·5 9·4 6·5
10·2 n·9 6S'5
S·9 16·S
6·4 6·8 1·4
·6 '1
12·0 ·9
3·5 9·8 3·6 5·9 8·7
52·2 707
14·4
Male Female
7·7 9·7 1'4
·4 1·5
18·3 4·8 5·6 7·8 4'4 6·9
10·6 46·7
7'4 14-7
1945 r---""_____' Male Female
6'4 2·5 ·3 ·1 ·4
8·9 1·8 3·8 7·4 6·4
n·8 8·S
42·3 5·6
17·4
4-jl 1·7 .06 ·2 ·2
4·9 ·8
2·7 5·2 O'S 8·9 6'9
26'4 6·8
17·1
1950 r---A-----, Male Female
5'1 5·8
'8 -2 '9
12'2 1'9 4'7 4'8 4'4 4'3 7'1
32-4 S-S 6·P
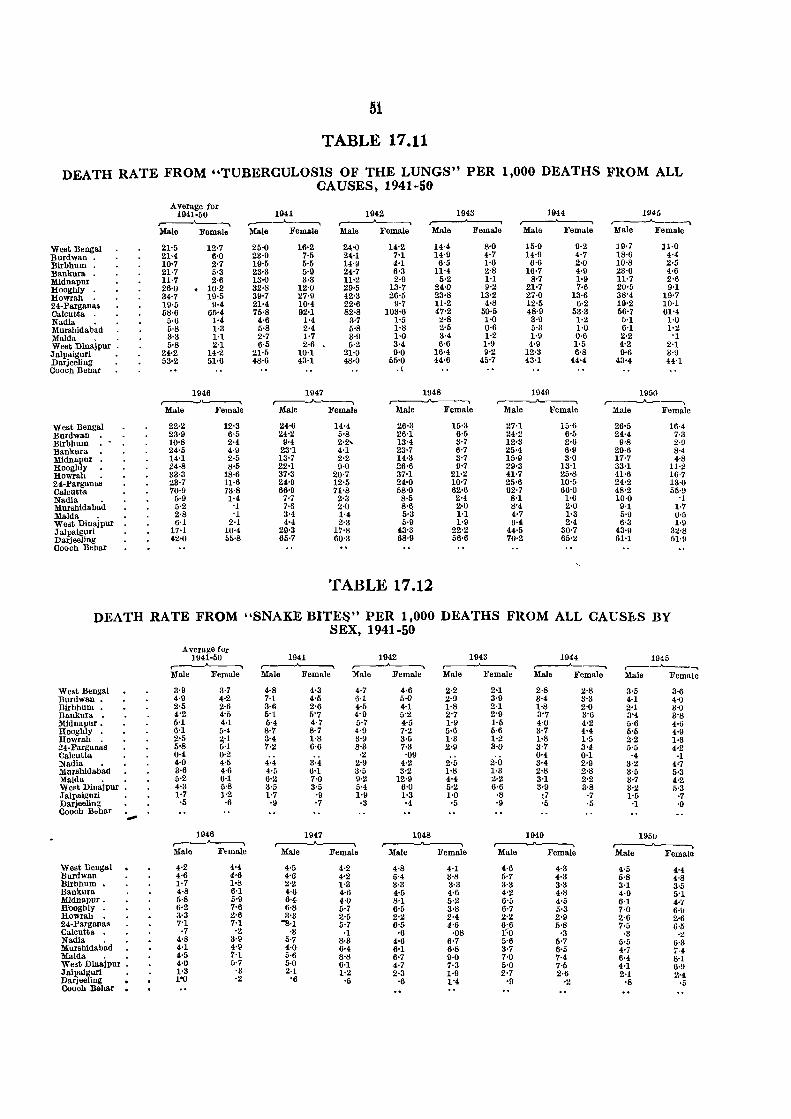
TABLE 17.11
DEATH RATE FROM "TUBERCULOSIS OF THE LUNGS" PER 1,000 DEATHS FROM ALL CAUSES, 1941-50
Average for 1941 1943 1944 1945 1941-50 1942
r---'-----., ,..---"------. ,..._____'______' ,----'---.. ,-------.-A..-----. Male Female Male Female Male Female Male Female Male Female Male Female
West Bengal 21·5 12·7 25·0 16·2 24-0 14·2 14·4 8·0 15·9 9·2 19·7 11·0 Burdwan . 21'4 6'0 23·9 7·5 24-1 7'1 14·9 4·7 14·9 4·7 18·6 4·4 Birbhum 10·7 2·7 19·5 5·5 14·9 4·1 6·5 1-6 6-6 2·0 10'8 2-5 Bankura 21·7 5·3 23·3 5·9 24·7 6·3 11·4 2·8 16·7 4·9 23'6 4-6 Midnapur 11·7 2·6 13·0 3·3 11·2 2·9 5·2 1·1 8-7 1·9 11·7 2'6 Hooghly 26-0 • 10-2 32-8 12·0 29·5 13'7 24'0 9·2 21·7 7-6 20'5 9·1 Howrah 34·7 19·5 39·7 27·9 42'3 26'5 23·8 13·2 27·0 13·6 3S'4 19·7 24-l'arganas 19-5 9·4 21·4 10·4 22·6 9'7 11·2 4·8 12·5 6·2 19'2 10-1 Oalcutta 58·6 65'4 75·8 92·1 82·8 103·6 47·2 50·5 48·9 53·3 56'7 61'4 Nadia 5·6 1-4 4·6 1'4 3·7 1·5 2·8 1·0 3·9 1·2 5'1 1·0 Murshidabad 5-8 1·3 5·8 2·4 5·8 1'8 2·5 0-6 5'3 1·0 6'1 1·2 Maida 3'3 1·1 2·7 1·7 3·9 1'0 3·4 1·2 1·9 0·6 2-2 '1 West Dinajpur • 5·8 2'1 6·5 2·6 5·2 3·4 6·6 1-9 4-9 1·5 4·2 2-1 Jalpaiguri 24·2 14·2 21·5 10'1 21·0 9'0 16·4 9·2 12·3 6-8 9'6 3-9 Darjeeling 53·2 51·6 4S·6 43·1 4S'0 55'0 44·6 45·7 43·1 44·4 43'4 44-1 Oooch Behar .(
1946 1947 1948 1949 195D r--.._)\,_~ r----1'---~ ,.......---....----, r-----J'---""\ ,...--._A...----., Male Female Male Female Male Female Male Female Male Female
West Bengal 22-2 12'3 24·6 14'4 26·3 15'3 27-1 15·6 26'5 16·4 Burdwan 23-9 6·5 24·2 5'S 26·i 6·5 24'2 6·5 24·4 7·3 Birbhum 10·8 2·4 9·4 2'~ lS·4 3-7 12-3 2·6 9-8 2·9 Bankura 24·5 4·9 23'1 4·1 23·7 6·7 25-4 6·9 29'6 8·4 Midnapur 14-1 2·5 13·7 2·2 14-3 3·7 15'9 3·0 17'7 4·8 Hooghly 24-8 8·5 22·1 9'0 26·6 9-7 29-3 13·1 33'1 11·2 Howrah 33·3 IS'6 37-3 20·7 37-1 21·2 41·7 25·8 41'6 16·7 24-l'arganas 23·7 n·6 24-9 12'5 24·0 10·7 25·6 10·5 24'2 13'0 Oalcutta 70·9 73'8 66'9 71'S 5S-0 62-6 62·7 66'0 48'2 55·9 Nadia 5-9 1·4 7-7 2-3 S·5 2·4 S'1 1-6 10·0 '1 Murshidabad 5·2 '1 7·6 2·0 8'(! 2·0 S'4 2·0 9'1 1·7 MaIda 2·S '1 3·4 1'4 5·3 1'1 4·7 1·3 5-9 0·5 West Dinajpur 6·1 2·1 4'4 2'3 5·9 1·9 9·4 2'4 6·3 1·9 Jalpaiguri 17·1 10-4 29·3 17'8 43'3 22·2 44·5 30·7 43'9 3~'8 Darjeeling 42'0 55'8 65·7 60'3 68·9 56·6 70·2 65-2 61'1 51·9 Oooch Behar
TABLE 17.12
DEATH RATE FROM "SNAKE BITES" PER 1,000 DEATHS FROM ALL CAUS],S BY SEX, 1941-50
AV'erage for 1941-50 1941 1942 1943 1944 1945
,...-----"--"", ,...-~ r---~ ....----'--.... r---"--~ ,----.A-__ ..., Male Female Male Female Male Female Male Female Male Female Male Female
West Bengal 3·9 3-7 4-S 4·3 4·7 4·6 2·2 2'1 2·S 2-S 3·5 3·6 Burdwan • 4·9 4·2 7-l 4'5 6·1 5·0 2·9 3'9 3·4 3'3 4·1 4·0 Birbhum • 2·5 2·6 3·6 2'6 4·5 4·1 1·8 2·1 1·8 2'0 2'1 a·o Bankura 4'2 4-5 5'1 5'7 4'9 5'2 2'7 2'9 3'7 3'6 3'4 3'8 Midnapur. 5-1 4-1 5'4 4·7 5·7 4·5 1·9 1-5 4-0 4·2 5·6 4-6 Hooghly 6-1 5-4 8·7 S'7 4·9 7·2 5·6 5·6 3·7 4-4 5'5 4·9 Howrah 2·5 11'1 3·4 1'8 3·9 3·5 1·3 1·2 1·8 1·5 2·2 1·5 24-l'arganas 5·8 5·1 7'2 6-6 8·3 7·3 2·9 3'0 3·7 3-4 5-5 4-2 Calcutta 0·4 0·2 ·2 '09 0-4 0·1 ·4 -I Nadia 4·0 4·5 4-4 3'4 2·9 4·2 2·5 2·0 3'4 2'9 3·2 4·7 Murshidabad 3·6 4·6 4·5 6-1 3·5 3·2 1·8 1-3 2·8 2'S 3'5 5-3 MaIda 5·2 6·1 6·2 7'0 9·2 12-9 4·4 2·2 3-1 2-2 3·7 4·2 West Dinajpur 4·3 5·8 3'5 3'5 5·4 6'0 5·2 6·6 3·9 3·8 3'2 5·3 Jalpaiguri 1·7 1·2 1-7 '9 1-9 1·3 1-0 ·8 :7 ·7 1·5 ·7 Darjeeling ·5 -6 -9 -7 -3 ·4 ·5 ·9 '5 ·5 ·1 ·9 Cooch Behar
-""" 1946 1947 1948 1949 1950
,----"--. ,---....J'---.. r--..J\....____, r-----J'----. ~ Male Female Male Female Male Female Male Female Male Female
West Bengal 4·2 4·4 4·5 4-2 4'S 4·1 4·6 4·3 4·5 4·4 Burdwan 4·6 4·6 4-6 4'2 5·4 3-g 5·7 4-3 0'8 4·8 Birbhum _ 1·7 l'S 2'2 1-3 3·3 3·3 3'3 3-3 3·1 3·5 Bankura 4·8 6-1 4·6 4·6 4·5 4·6 4'2 4·8 4·9 5'1 Midnapur • 5·8 5-9 6'4 4'0 8-1 5-2 6'5 4-5 6·1 4'-f Hooghly 6-2 7'6 6·8 5·7 6·5 3·8 6·7 5·3 7·0 6'~ Howrah 3·3 2'6 3'3 2·5 2·2 2·4 2'2 2-9 2·6 2'6 24-l'arganas 7'1 7'1 ·IH 5'7 6·5 4'6 6'6 5·8 7·5 6·5 Calcutta ·7 '2 '3 -I ·6 ·OS 1-0 ·3 ·3 '2 Nadia 4·8 3'9 5·7 8-3 4·6 6·7 5'6 5-7 0·5 6·3 Murshidab~d 4·1 4-9 4·0 6-4 6·1 6·8 3·7 6-5 4-7 ,-4 Maida 4·5 7·1 0·6 8'S 6·7 9·0 7-0 7·4 6·4 8·1 West Dinajpur 4'0 5-7 5'0 6·1 4·7 7-3 5-0 7·5 4·1 6'9 JaJpaiguri 1'3 '3 2·1 1'2 2·3 1·9 2-7 2·6 2·1 2'4 Darjeeling . 1'0 '2 '6 ·5 ·6 1'4 '0 ·2 ·8 .r. Oooch Behar .
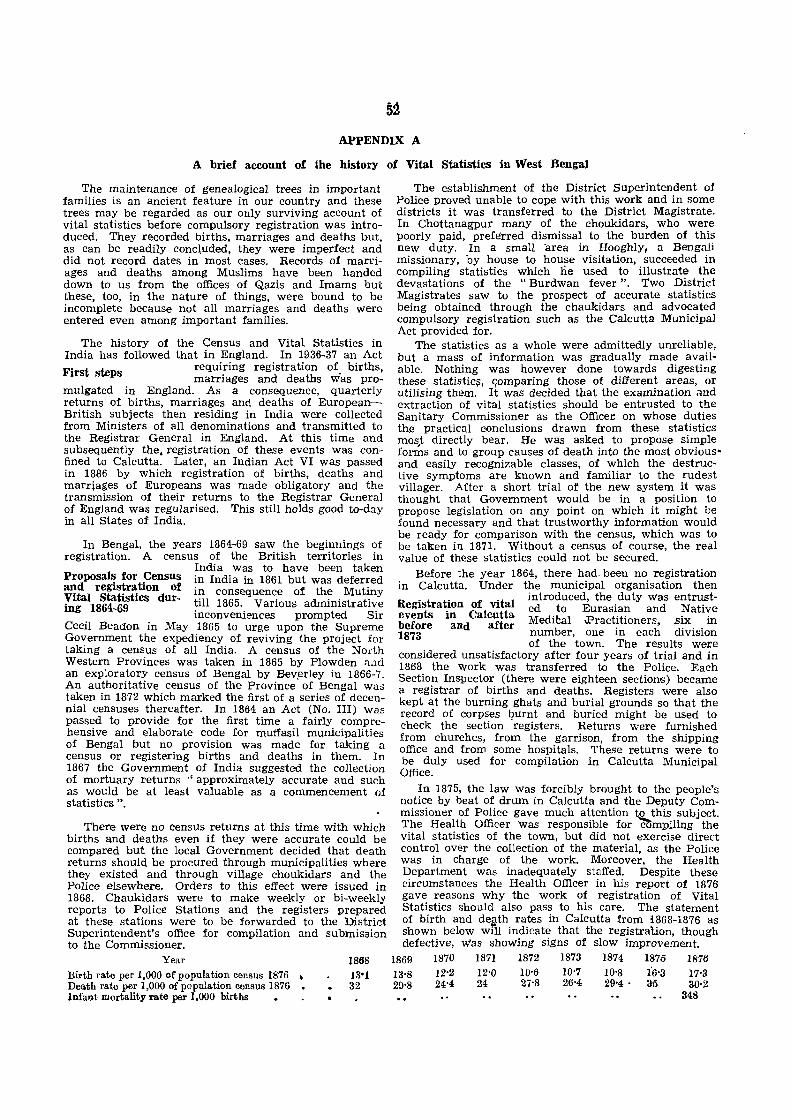
52
APPENDIX A
A brief account of the history of Vital Statistics in West Bengal
The maintenance of genealogical trees in important families is an ancient feature in our country and these trees may be regarded as our only surviving account of vital statistics before compulsory registration was introduced. They recorded births, marriages and deaths but, as can be readily concluded, they were imperfect and did not record dates in most cases. Records of man-iages and deaths among Muslims have been handed down to us from the offices of Qazis and Imams but these, too, in the nature of things, were bound to be incomplete because not all marriages and deaths were entered even among important families.
The history of the Census and Vital Statistics in India has followed that in England. In 1936-37 an Act First steps requi~ing registration of. births,
marrIages and deaths was promulgated in England. As a consequence, quarterly returns of births, marriages and deaths of European-British subjects then residing in India were collected from Ministers of all denominations and transmitted to the Registrar General in England. At this time and subsequently the, registration of these events was confined to Calcutta. Later, an Indian Act VI was passed in 1886 by which registration of births, deaths and marriages of Europeans was made obligatory and the transmission of their returns to the Registrar General of England was regularised. This still holds good to-day in all States of India.
In Bengal, the years 1864-69 saw the beginnings of registration. A census of the British territories in
Proposals for Census and registration of Vital Statistics during 1864-69
India Was to have been taken in India in 1861 but was deferred in consequence of the Mutiny till 1865. Various administrative inconveniences prompted Sir
Cecil Beadon in May 1865 to urge upon the Supreme Government the expediency of reviving the project ior taking a census of all India. A census of the North Western Provinces was taken in 1865 by Plowden :-l."1d
an exploratory census of Bengal by Bev,erley in 1866-7. An authoritative census of the Province of Bengal was taken in 1872 which marked the first of a series of decennial censuses thereafter. In 1864 an Act (No. III) was passed to provide for the first time a fairly comprehensive and elaborate code for muffasil municipalities of Bengal but no provision was made for taking a census or registering births and deaths in them. In 1867 the Government of India suggested the collection of mortuary returns "approximately accurate and such as would be at least valuable as a commencement of statistics" .
There were no Census returns at this time with which births and deaths even if they were accurate could be compared but the local Government decided that death returns should be procured through municipalities where they existed and through village choukidars and the Police elsewhere. Orders to this effect were issued in 1868. Chaukidars were to make weekly or bi-weekly reports to Police Stations and the registers prepared at these stations were to be forwarded to the District Superintendent's office for compilation and submission to the Commissioner.
Year 1868 Bi~th rate per 1,000 of population oensus 1876 , 13"1 Death rate per 1,000 of popUlation census 1876 " 32 Infant mortality rate per 1,000 births
The establishment of the District Superintendent of Police proved unable to cope with this work and in some districts it was transferred to the District Magistrate. In Chottanagpur many of the choukidars, who were poorly paid, preferred dismissal to the burden of this new duty. In a small area in HooghlYI a Bengali missionary, by house to house visitation, succeeded in compiling statistics which lie used to illustrate the devastations of the "Burdwan fever ". Two District Magistrates saw to the prospect of accurate statistics being obtained through the chaukidars and advocated compulsory registration such as the Calcutta Municipal Act provided for.
The statistics as a whole were admittedly unreliable, but a mass of information was gradually made available. Nothing was however done towards digesting these statistic~, ~omparing those of different areas, or utilising them. It was decided that the examination rtnd extraction of vital statistics should be entrusted to the Sanitary Commissioner as the Officer on whose duties the practical conclusions drawn from these statistics mos,t directly bear. He was asked to propose simple forms and to group causes of death into the most obvious· and easily recognizable classes, of which the destructive symptoms are known and familiar to the rude3t villager. After a short trial of the new system it was thought that Government would be in a position to propose legislation on any point on which it might be found necessary and that trustworthy information would be ready for comparison with the census, which was to be taken in 1871. Without a census of course, the real value of these statistics could not be secured.
Before the year 1864, there had- been no registration in Calcutta. Under the municipal organisation then
Registration of vital events in Calcutta before and after 1873
introduced, the duty was entrusted to Eurasian and Native Medit:al ,practitioners, .six in number, one in each division of the town. The results were
considered unsatisfactory after four years of trial and in 1868 the work was transferred to the Police. Each Section Inspector (there were eighteen sections) became a registrar of births and deaths. Registers were also kept at the burning ghats and burial grounds so that the record of corpses l?urnt and buried might be used to check the section registers. Returns were furnished from churches, from the garrison, from the shipping office and from some hospitals. These returns were to be duly used for compilation in Calcutta Municipal Office.
In 1875, the law was forcibly brought to the people's notice by beat of drum in Calcutta and the Deputy Commissioner of Police gave much attention to this subject. The Health Officer Was responsible for compiling the vital statistics of the town, but did not exercise direct control over the collection of the material, as the Poliee was in charge of the work. Moreover, the Health Department was inadequately staffed. Despite these circumstances the Health Officer in his report of 1876 gave reasons why the work of registration of Vital Statistics should also pass to his care. The statement of birth and death rates in Calcutta from i868-1876 as shown below wiil indicate that the registralion, though defective, was showing signs of slow improvement.
1869 1870 1871 1872 1873 1874 1875 1876 13'8 12'2 12'0 10'6 10'7 10·8 i6·3 17'3 29'8 24'4 24 27'8 26'4 29·4' 3-5 30'2
348
The results were far from satisfactory and the whole question was placed before the Government with the object of improving the existing machinery. But thE:! system continued till the Calcutta Municipal Act was passed in 1889 when the work of registration of vital events was restored to the municipal authorities. The revised Act of 1913 made no change in the administration regarding registration of births and deaths in Calcutta.
So much for Calcutta. It soon appeared that the Sanitary Commissioner was unable to devote sufficient
Compulsory Births and Deaths Registration Act of 1873 enforced in urban and rural areas of Bengal by Police
attention to this all-important branch of public health work. The Army Sanitary Commission in England commen ted very severely on the worthlessness of statistics presented in the Sanitary Commissioner's Report for
1872. The Sanitary Commissioner attributed the failure "mainly to bad agency, and secondly to want of interest on the part of local officers and the consequent absence of the necessary supervisors and urged that a compulsory system of registration should be introduced".
53
The Bengal Births and Deaths Registration Act (Act IV) was passed in 1873. This Act introduced a dual system which provided for the submission of returns from both "general circles" and "selected circles ". The returns for the general circles included the selected circles and related to the whole of Bengal. In the "selected circles" whether urban or rural, a higher degree of accuracy was sought to be obtained by the employment of special agencies under closer supervision. The "special circle" was to serve as an example bf the manner in which registration ought to be conducted. In modern parlance it would be regarded as a sample area for quality control. In 1877, this system of selected areas was condemned as costing more than it was worth and it was decided to dispense with all special agencies and tq_ collect vital statistics by the same machinery that was employed in the general circles.
Up to 1875, registration of births was undertaken in "selected circles" covering all but four districts. It was attempted for the first time in " general circles" in 1876 and proved a failure. The experiment was abandoned in 1878. Registration of births continued however in a few selected municipalities and in 1880 it was resumed in all first class municipalities and in certain towns. It was in this year that the Compulsory Vaccination Act was passed. By 1881, the Registration Act was in force in 101 towns. Both births and deaths statistics were quite unreliable, births statistics being more so than deaths. In many of these towns voluntary registration was almost unknown, while prosecutions were inadequate.
In 1886 registration of births was extended and a very important change of system was introduced by the
Government transferring the Transfer of regis- duty of registering both births tra~on.t Municipal and deaths in towns to municiau on es pal authorities. In many of these towns Act IV of 1873 was actually in force but the local authority had been unwilling to undertake the burden of registration which the police had hitherto borne. In some towns even the registration of vaccination under the Compulsory Vaccination Act (Act V of 1880) was performed by Police. In rural areas the system of registration by the Police of deaths remained unaltered.
1 CENSUS
The collection and recording of vital statistics, however, continued to be unsatisfactory under municipal
Retransfer of registration in municipalities to the town police 1892
authorities. Records of deaths in municipalitdtes appeared indeed to be in many cases less trustworthy than those of the rural circles.
The work of registration was, therefore, with effect from the 1st January, 1892, again transferred to the town police and it was directed that the municipal funds thus set free should be applied to the advancement of primary education. Birth registrfltion through agency of the police was at the same time introduced into rural as well as urban areas. This change-over from the local bodies to the Police seemed to effect an overall improvement in registration. In 1896 there were 527 prosecutions, 2,049 convictions, and Rs. 3,155 in fines were realised.
At this time births and deaths were thus registered through the town or village police all over Bengal except the South Lushai Hills, Chittagong Hill Tracts and the district of Angul. The statistics thus collected were from time to time checked by Magistrates, Subdivisional Officers, Police Officers and the Sanitary Commissioner and his subordinates including the superior officers of the vaccination staff. In 1899, the Government 01 Bengal passed orders so that station masters of all railway stations within the province but outside the municipal towns should be registrars of births an~ deaths and be responsible for ascertaining and reporting to the Civil Surgeons of their respective districts all births and deaths occurring on all railway lines and lands (including lands occupied by railway employees, etc., whether within or without the jurisdiction of the railway police). Station masters were to register events and send the return to the Civil Surgeon on the first day of every month. The Civil Surgeon was to show these figures separately in the monthly return and submit it to the Sanitary Commissioner. No change of this system was made for several years. During 1906-09 an experiment was made in the Galsi thana (Burdwan) to test the accuracy of rural registration.
In 1909 the Eastern Bengal and Assam Governments took up the question of improvement of registration in
Registration retransferred to Municillal Authorities 1913
compulsorily notifiable areas. The vaccination staff was to check the statistics and a reward of four annas was paid for every
conviction obtained. The results were unsatisfactory and the whole subject was reconsidered in 1912.
The work of registration lay outside the sphere of the ordinary duties of police, the public disliked going to the thana to report vital occurrences and the work of the police was not directly under the Sanitary Department. For these reasons, with the almost unanimous approval of district officers, registration was again transferred to the municipal authorities on the 1st April, 1913.
In 1916 the health officers of municipalities were made responsible for all round improvement of the registration of vital events and in the next year the Registration Act was extended to the Asansol Mining Settlement. In 1925 station masters of railway stations within a town were made reporters of births and deaths and required to submit their returns to the municipal registrar. In 1929 medical officers of hospitals situated in towns were asked to report births and deaths occurring within hospitals to municipal registrars. The above system of registration was followed in all municipalities and there has been no major change on this point in urban areas of the State.
8
54
For the rural areas the work of registration in 1913' was transferred in two subdivisions (Kalna and Chandpur) to the chaukidari panchayets to be assisted by munshi chaukidars and in 1915 this system was extended to Bogra and to the Lalbagh Subdivision. There were thus in 1915 four agencies in Bengal for the registration of vital occurrences, viz.-
(1) the Police and the village chaukidar (in most rural areas) ;
(2) the panchayets with their munshi chaukidars (in certain selected rural areas) ;
(3) the municipal staff (in urban areas) and (4) the station master of the railway station outside
municipal towns.
The above system continued till 1926 when thana health circles were established. Health Officers were
. appointed for each district and Rural P~bh<: Health sanitary inspectors for public Re-orgamsation of t . 1 Th' Bengal in 1926 heal h Clre es. IS p.r~cedure
became necessary as CIVII Surgeons could not COlle with the work of public health as well as medical duties and, therefore, the public health portion was transferred from the Civil Surgeon to the District Health Officer. The Bengal Births and Deaths.Registration Act, 1873 was now extended to all rural areas in Bengal. Every district was divided into a suitable number of registration units, such as union boards, panchayeti unions, railway stations and thanas. The work of registration was gradually transferred from the police to the hands of local bodies. Presidents of union boards, panchayeti unions, station masters and thana officers were by the District Magistrate appointed local registrars of births and deaths for their respective areas. Every village chaukidar was required to report at the local police station, chaukidari union dr union board office, all births and deaths occurring within his beat. Vital statistics were compiled according to the date of occurrence and regionally by thanas and not by subdivisions. The following sequence of dates was prescribed for the submission of vital statistics from one agency to the next:-
(A) District Boards (i) Chaukidars to the local registrars-
7th day of the succeeding month. (ii) Local registrars to Subdivisional Officer-
Not later than the 12th day of the succeeding month.
(iii) Sub divisional Officers to District Health Officer--
Not later than the 15th day of the succeeding month.
(iv) District Health Officers to Director of Public Health-
Not later than the 20th day of the succeeding month. The submission of district returns through Civil Surgeons was discontinued in 1928.
(B) Municipalities The Municipal Health Officer, or the Municipa1
Chairman as the case may be, should forward the returns direct to District Health Officers and not to Subdivisional Officers or Civil Surgeons.
Where the local registrars were ·thana officers, the dafadars were required to collect the chaukidars' hathchittas and hand them in at the first weekly parade of
the month which the thana officer was required to attend. All registers of births and deaths were preserved in the district room only for a period of thirty years.
Local authorities were entitled to charge for supplying copies of entries in the registers of births and deaths a fee of four annas for each extract in rural areas and eight annas in town. Registers and forms were supplied by Government free of cost. Thana and Circle Officers drew up estimates of annual requirements and sent them to their Subdivisional Officers for transmission to the District Health Officer who distributed the forms on indent from the Forms Department. A chaukidar used Form No. 2990 for births, No. 2998 for deaths and No. 3014 for Epidemic diseases. Bengal Form Nos. 2993 and 2999 were used by local registrars for birth and death registration respectively. Bengal Form No. 2996 was used by Local Registrars for supplying monthly returns and similarly Bengal Form No. 2997 was used by Subdivisional Officers and District Health Officer. For the prompt notification to the Ministry of Health in England of the prevalence of certain epidemic diseases every Tuesday, an innovation was introduced in 1920 requiring a telegraphic summary of the main featUres relating to the prevalence of plague, small-pox, cholera. influenza in Bengal during the week ending the previous Saturday. This information was supplied to the Government of India by the Director of Public Health. The District Health Officer collected such reports both from urban and rural areas and sent them to the Director of Public Health for the purpose. Incidentally, in 1894 Civil Surgeons used to notify any outbreak or existence of epidemic diseases in their district to their colleagues of neighbouring districts and the system of interprovincial exchange of epidemic information was introduced in 1922 but since 1926 these fUnctions were assumed by the District Health Officer.
But the compilation of vital statistics caused delay under the system and the matter was discussed at the Divisional Commissioners' Conference in 1931. A new system was adopted in some districts for trial so that registrars were required to submit their monthly returns of births and deaths direct to Sanitary Inspectors who compiled statistics for the thana and forwarded it direct to the District Health Officer and not through the Subdivisional Officer. The dates of submission of vital statistics by one. agency to the other were as follows :-
(a) By chaukidar to local registrars.
(b) By registrars to the Subdivisional Officer or Sanitary In-spectors as the case may be.
(c) By Sub divisional Officer or Sanitary .Inspector to District Health Officer.
(d) By District Health Officer to Director of Public Health.
7th day of the succeeding month.
Not later than 12th day of the succeeding month.
Not later than 17th day of the succeeding month.
Not later than 23rd day of the succeeding month.
In the case 'of municipalities, the monthly vital statistical returns were to be submitted to the District Health Officer not later than the 15th day of the succeeding month. This system continued up to 1943.
After the appointment of Sanitary Inspectors to health circles, local registrars in 1939 were required
55
to supply every month tq Sanitary Ins~ectors info::mation regarding all births and deaths. ThIS was consIdered necessary to enable Sanitary Inspectors properly to Look after the Sanitary measures of their .area. To enable District Magistrates to exercise control over the working of the Bengal Births and Deaths Registration Act in municipal and rural areas, District Magistrates were required to send quarterly reports showing the number of prosecutions. number of convictions, fines realised, etc., under the Act to the Director of Public Health. As a consequence the supervision of the Registration Act seemed to improve in this period.
Ever since the introduction of the system under Which the responsibility of registering births and deaths was
Registration transferred from union president to thana Sanitary Inspector 1944
placed upon Presidents of Union Boards, there were repeated complaints that vital statistics were late in reaching the Director of Public Health leading to delay in submitting the
provincial report to the Public Health Commissioner with the Government of India. As Presidents held office in an honorary capacity and for one reason or another. were often absent from their unions, the system was considered unsatisfactory. Under orders of the Government, dated the 4th January, 1944, District Magistrates were instructed to cancel the appointment of Presidents of Union Boards as registrars of births and deaths and to appoint the Thana Sanitary Inspectors in their place. The Sanitary Inspectors were asked to attend the fortnightly parades of chaukidars at the thana and take the figures of births and deaths direct from the hathchittas of chaukidars and at once compile the list and forward it to the District Health Officer. As both the Sanitary Inspector and District Health Officer were officers of the Public Health Organisation, they could see that vital statistics returns were compiled and forwarded! regularly and punctually thus effecting a considerable saving of time. This change was introduced with immediate effect. Later in July 1945, an additional health assistant was sanctioned to 11 Sanitary Inspectors to help them in compiling vital statistics.
Famine and epidemic had prevailed all over Bengal in 1943. It was the delay in submitting figures to White Hall in 1943 from the former agencies that this change from Union Presidents to Thana Sanitary Inspectors was made. Though. the returns were received earlier, they became less representative of the area, as the population of the new registration district increased ten times approximately. Some army Subdivisional Health Officers were appointed at subdivisional headquarters for the control of epidemics and later the Government decided to place each subdivision under a Health Officer as "Subdivisional Health Officer ". The Subdivisional Health Officers in addition to their public health duties, supervised the work of registration of vital statistics and were responsible for the normal administration of vital statistics registration of the area. In 1945, detailed instruction in connection with the registration work were issued by the Government to the local registrars, i.e., Thana Sanitary Inspectors for their guidance.
After 1947, all subdivisions were provided with Subdivisional Health Officers and a scheme for rural health centres was started. So far 103 union health centres have been created and it has been proposed that the Rural Medical Officer of Health will be the registrar of births and deaths for the union where the Union Health Centre is opened. In 1948 a pilot survey to determine the extent of incompleteness of registration of births and deaths was undertaken and its results were published in a Vital Statistics Special Report. A
summary of the Report and its CoI1ciusions is printed as an Appendix in this volume.
The existing method of registration and compil~tion of births and deaths in the State of West Bengal IS as follows :-
A-Registration
Throughout the State of West Bengal except the district of Cooch Behar the registration of births and
deaths within eight days of their Legislation date of occurrence is compulsory and it is administered in different areas according to the Act as mentioned below:-In rural areas .
Urban areas (except Calcutta & Howrah).
City of Calcutta and Howrah.
Bengal Births and Deaths Registration Act of 1873.
Bengal Births and Deaths Registration Act and Bengal Municipal Act of 1932 and rules issued thereunder.
Calcutta Municipal Act of 1951.
Cantonment areas Cantonment Acts and Bye-laws issued thereunder.
(i) Urban areas-In the municipalities (including Calcutta) municipal authorities are responsible fo: the
efficient management of registraAgency tion of vital events. Registrars of Births and Deaths are appointed by the Municipal Commissioners in Municipalities and by the Health Officer in Calcutta for the purpose. The father or mother is primarily responsible for reporting births and other persons who are required to report are the occupiers of the building in which such child is born, the medical practitioner or the midwife. In case of death it should be done by the nearest relatives present at the time of death or in attendance during the last illness of the deceased or in absence of such relation the. medical practitioner if any, who attended during the last illness. In the municipalities which have no registrars of deaths at burning ghats or burial grounds, the fuel contractors, ghat priests and doms of the burning ghats and munshis of burial grounds are to report deaths to the registrars periodically. Station Mastel·s of railway areas within municipalities are responsible for reporting vital events occul"!ing within th.eir a::eas. The family is primarily responSIble for reportmg bIrths and deaths in the municipal areas including Calcutta.
(ii) Rural areas-In rural areas village chaukidars are reporters of births and deaths occurring within their beats. They are provided with a double set of hathchittas of births and deaths for collection of village statistics. If they are illiterate (as they generally are) they may have the entries made by any literate person of the locality. The dafadars of the union collect one set of hathchittas 6f births and deaths from all chaukidars of the union and submit them at their weekly parades at Thana to the Sanitary Inspectors of Thanas who are the Registrars of Births and Deaths for the Thana areas. The Sanitary Inspector with a health assistant attends parades of dafadars at the thana and collects one set of hathchittas from the dafadars and retains the same for the purpose of registration; the other set of hathchittas is handed over to the dafadar for distribution amongst the chaukidars concerned for the purpose of collection of vital statistics, in the subsequent week.
The above procedure is not applicable in th~ Darjeeling district. In this district, the Thana Officers are Registrars o~ Births and Deaths and village mandals
8A
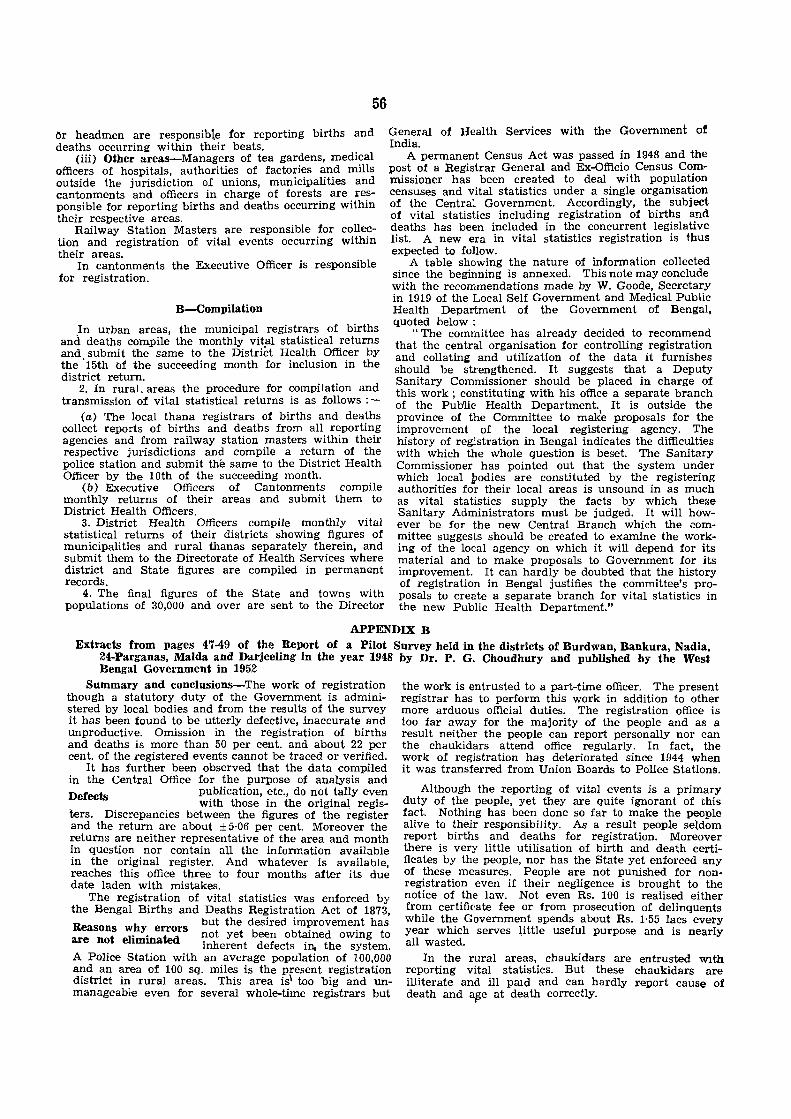
56
Or headmen are responsible for reporting births and deaths occurring within their beats.
General of Health Services with the Government of India.
(iii) Other areas-Managers of tea gardens, medical officers of hospitals, authorities of factories and mills outside the jurisdiction of unions, municipalities and cantonments and officers in charge of forests are responsible for reporting births and deaths occurring within their respective areas.
Railway Station Masters are responsible for collection and registration of vital events occurring within their areas.
A permanent Census Act was passed in 1948 and the post of a Registrar General and Ex-Officio Census Commissioner has been created to deal with population censuses and vital statistics under a single organisation of the Central Government. Accordingly, the subject of vital statistics including registration of births and deaths has been included in the concurrent legislative list. A new era in vital statistics registration is thus expected to follow.
In cantonments the Executive Officer is responsible for registration.
B-Compilation
In urban areas, the municipal registrars of births and deaths compile the monthly vit.al statistical returns and submit the same to the District Health Officer by the '15th of the succeeding month for inclusion in the district return.
2. In rural. areas the procedure for compilation and transmission of vital statistical returns is as follows :._
(a) The local thana registrars of births and deaths collect reports of births and deaths from all reporting agencies and from railway station masters within their respective jurisdictions and compile a return of the police station and submit the same to the District Health Officer by the 10th of the succeeding month.
(b) Executive Officers of Cantonments compile monthly returns of their areas and submit them to District Health Officers.
3. District Health Officers compile monthly vital statistical returns of their districts showing figures of municipalities and rural than as separately therein, and submit them to the Directorate of Health Services where district and State figures are compiled in permanent records.
4. The final figures of the State and towns with populations of 30,000 and over are sent to the Director
A table showing the nature of information collected since the beginning is annexed. This note may conclude with the recommendations made by W. Goode, Secretary in 1919 of the Local Self Government and Medical Public Health Department of the Government of Bengal, quoted below :
"The committee has already decided to recommend that the central organisation for controlling registration and collating and utilization of the data it furnishes should be strengthened. It suggests that a Deputy Sanitary Commissioner should be placed in charge of this work; constituting with his office a separate branch of the Pu1Jl.ic Health Department. It is outside the province of the Committee to mak'e proposals for the improvement of the local registering agency. The history of registration in Bengal indicates the difficulties with which the whole question is beset. The Sanitary Commissioner has pointed out that the system under which local podies are constituted by the registering authorities for their local areas is unsound in as much as vital statistics supply the facts by which these Sanitary Administrators must be judged. It will however be for the new Central Branch which the committee suggests should be created to examine the working of the local agency on which it will depend for its material and to make proposals to Government for its improvement. It can hardly be doubted that the history of registration in Bengal justifies the committee's proposals to create a separate branch for vital statistics in the new Public Health Department."
APPENDIX B Extracts from pages 47-49 of the Report of a Pilot Survey held in the districts of Burdwan, Bankura, Nadia,
24-Parganas, MaIda and Darjeeling in the year 1948 by Dr. P. G. Choudhury and published by the West Bengal Government in 1952
Summary and conclusions-The work of registration though a statutory duty of the Government is administered by local bodies and from the results of the survey it has been found to be utterly defective, inaccurate and unproductive. Omission in the registration of births and deaths is more than 50 per cent. and about 22 per cent. of the registered events cannot be traced or verified.
It has further been observed that the data compi:led in the Central Office for the purpose of analysis and Defects publication, etc., do not tally even
with those in the original, registers. Discrepancies between the figures of the register and the return are about ± 5·06 per cent. Moreover the returns are neither representative of the area and month in question nor contain aU the information available in the original register. And whatever is available, reaches this office three to four months after its due date laden with mistakes.
The registration of vital statistics was enforced by the Bengal Births and Deaths Registration Act of 1873, Reasons why errors but the desired improvement has are not el' . ted not yet been obtained owing to
ImIna inherent defects in. the system. A POlice Station with an average population of 100,000 and an area of 100 sq. miles is the present registration district in rural areas. This area isl too big and unmanageabl-e even for several whole-time registrars but
the work is entrusted to a part-time officer. The present registrar has to perform this work in addition to other more arduous official duties. The registration office is too far away for the majority of the people and as a result neither the people can report personally nor can the chaukidars attend office regularly. In fact, the work of registration has deteriorated since 1944 when it was transferred from Union Boards to Police Stations.
Although the reporting of vital events is a primary duty of the people, yet they are quite ignorant of this fact. Nothing has been done so far to make the people alive to their responsibility. As a result people seldom report births and deaths for registration. Moreover there is very little utilisation of birth and death certificates by the people, nor has the State yet enforced any of these measures. People are not punished for nonregistration even if their negligence is brought to the notice of the law. Not even Rs. 100 is realised either from certificate fee or from prosecution of delinquents while the Government spends about Rs. 1·55 lacs every year which serves little useful purpose and is nearly all wasted.
In the rural areas, chaukidars are entrusted WIth reporting vital statistics. But these chaukidars are illiterate and ill paid and can hardly report cause of death and a[5e at death correctly.
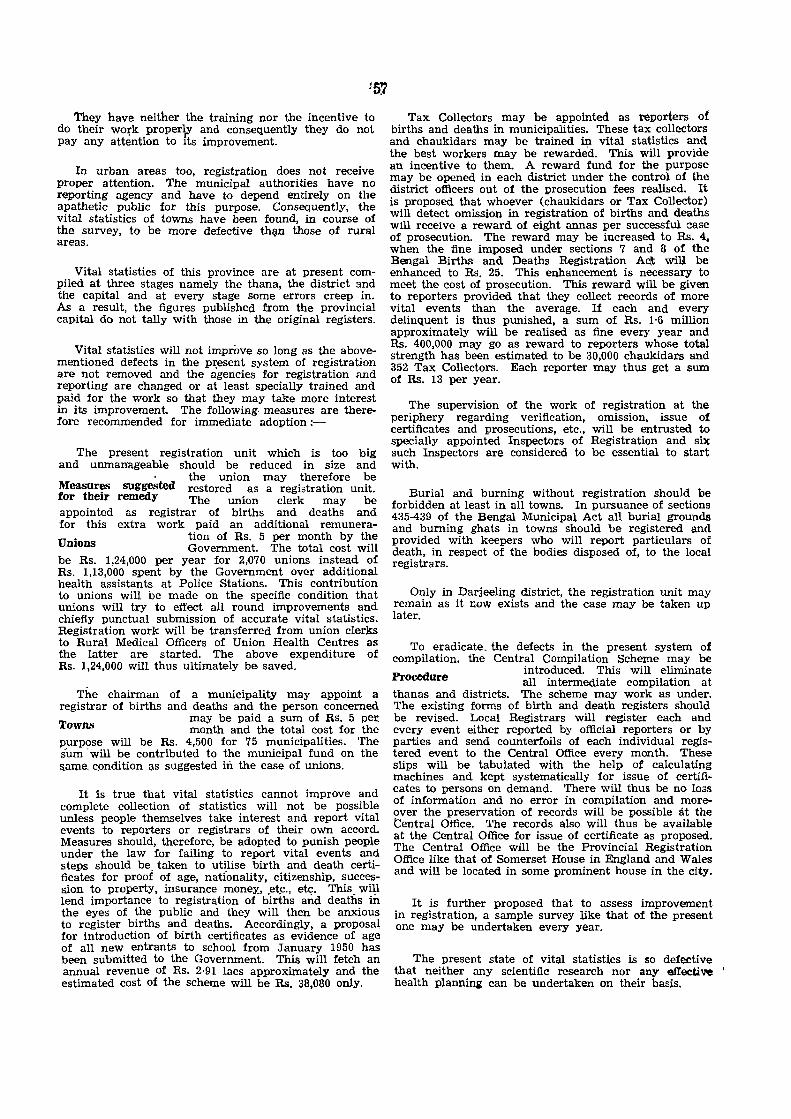
'l'hey have neither the training nor the incentive to do their work proper\y and consequently they do not pay any attention to its improvement.
In urban areas too, registration does not receive proper attention. The municipal authorities have no reporting agency and have to depend entirely on the apathetic public for this purpose. Consequently, the vital statistics of towns have been found, in course of the survey, to be more defective thliln those of rural areas.
Vital statistics of this province are at present compiled at three stages namely the thana, the district and the capital and at every stage some errors creep in. As a result, the figures published from the provincial capital do not tally with those in the original registers.
Vital statistics will not improve so long as the abovementioned defects in the pz:esent system of registration are not removed and the agencies for registration Rnd reporting are changed or at least specially trained and paid for the work so that they may take more interest in its improvement. The following· measures are therefore recommended for immediate adoption;-
The present registration unit which is too big and unmanageable should be reduced in size and
the union may therefore be Measur~ SUggested restored as a registration unit. for their remedy The union clerk may be appointed as registrar of births and deaths and for this extra work paid an additional remunera·
Unions tion of Rs. 5 per month by the Government. The total cost will
be Rs. 1,24,000 per year for 2,070 unions instead of Rs. 1,13,000 spent by the Government over additional health assistants at Police Stations. This contribution to unions will be made on the specific condition that unions will try to effect all round improvements and chiefiy punctual submission of accurate vital statistics. Registration work will be transferred from union clerks to Rural Medical Officers of Union Health Centres as the latter are started. The above expenditure of Rs. 1,24,000 will thus ultimately be. saved.
The chairman of a municipality may appoint a registrar of births and deaths and the person concerned
may be paid a sum of Rs. 5 per Towns month and the total cost for the purpose will be Rs. 4,500 for 75 municipalities. The sum' will be contributed to the municipal fund on the s_aIlle. c_ondition as suggested in the case of unions.
It is true that vital statistics cannot improve and complete collection of statistics will not be possible unless people themselves take interest and report vital events to reporters or registrars of their own accord. Measures should, therefore, be adopted to punish people under the law for failing to report vital events and steps should be_ taken to ut~lise birth and death certificates for proof of age, nationality, citizenship, succession to property, insurance money:, .etc., etc;. This. wi~l lend importance to registration of births and deaths in the eyes of the public and they will then be anxious to register births and deaths. Accordingly, a proposal for introduction of birth certificates as evidence of age of all new entrants to school from January 1950 has been submitted to the Government. This will fetch an annual revenue of Rs. 2·91 lacs approximately and the estimated cost of the scheme will be Rs. 38,080 only.
Tax Collectors may be appointed as reporters of births and deaths in municipalities. These tax collectors and chaukidars may be trained in vital statistics and the best workers may be rewarded. This will provide an incentive to them. A reward fund for the purpose may be opened in each district under the control of the district officers out of the prosecution fees realised. It is proposed that whoever (chaukidars or Tax Collector) will detect omission in registration of births and deaths will receive a reward of eight annas per successful case of prosecution. The reward may be increased to Rs. 4, when the fine imposed under sections 7 and 8 of the Bengal Births and Deaths Registration AcIt will be enhanced to Rs. 25. This enhancement is necessary to meet the cost of prosecution. This reward will be given to reporters provided that they collect records of more vital events than the average. If each and every delinquent is thus punished, a sum of Rs. 1·6 million approximately will be realised as fine every year and Rs. 400,000 may go as l'eward to reporters whose total strength has been estimated to be 30,000 chaukidars and 352 Tax Collectors. Each reporter may thus get a sum of Rs. 13 per year.
The supervision of the work of registration at the periphery regarding verification, omission, issue of certificates and prosecutions, etc., will be entrusted to specially appointed Inspectors of Registration and six such Inspectors are considered to be essential to start with.
Burial and burning without registration should be forbidden at least in all towns. In pursuance of sections 435-439 of the Bengal Municipal Act all burial grounds and burning ghats in towns should be registered and provided with keepers who will report particulars of death, in respect of the bodies disposed of, to the local registrars.
Only in Darjeeling district, the registration unit may remain as it now exists and the case may be taken up later.
To eradicate. the defects in the present system of compilation, the Central Compilation Scheme may be
Procedure introduced. This will eliminate all intermediate compilation at
thanas and districts. The scheme may work as under. The existing forms of birth and death registers should be revised. Local Registrars will register each and every event either reported by official reporters or by parties and send counterfoils of each individual registered event to the Central Office every month. These slips will be tabulated with the help of calculating machines and kept systematically for issue of certificates to persons on demand. There will thus be no 103s of information and no error in compilation and more. over the preservation of records will be possible at the Central Office. The records also will thus be available at the Central Office for issue of certificate as proposed. The Central Office will be the Provincial Registration Office like that of Somerset House in England and Wales and will be located in some prominent house in the city.
It is further proposed that to assess improvement in registration, a sample survey Uke that of the present one may be undertaken every year.
The present state of vital statistics is so defective that neither any scientific research nor any effective ' health planning can be undertaken on their basis.

IS8
Table 1
Births by unions, thanas and towns: comparison between the 1948 survey 'ftgures and those recorded in the originaL official registers
Total
Percent births Percent
Births of occurred omission Percento£ District o.nd Police Unions regd. Births verified in 1948 over detection
Sta.tion )948 verified as total over over detected dctec. regd. rcgd. during tion
survey
Distriot Burdwan-P. S. Kalwa 1 Kashigram 258 244 94·6 365 33'2 141·5 2 Khajurdibi 181 159 87·8 229 30'6 126'5 3 Srikhanda. 210 179 85·3 274 34'7 130·5 4 Alampur 199 164 82·4 251 34'7 126·1 5 Gidhgram 211 179 84'8 304 41.'1 144·1 6 Karui 191 174 91-1 256 31'8 133'6 7 Kara.jgram 214 179 83·6 289 38'1 135·0 8 Sribati 212 195 91'9 302 35·4 142'4 9 Singhi • 175 160 91·5 224 28·6 128'0
10 Agradwip . 162 143 88·3 285 49·8 176'9 11 Jagadanandapur 175 153. .87'4 261 41-4 149'1
TOTAL 2,188 1,929 88'2 3,039 36·5 138·9
District Bankllr_ 1 Manikba.zar 84 75 89·3 99 24·2 117·9 I',S. Sonamulcki 2 Hamirhati SO 76 95'0 91 16·5 113'8
3 Pearbera 92 SI 8S'0 126 35·7 136'9 4 Dhulai 147 135 91'S lS4 26·6 125-:! 5 Kochdihi 121 108 89·3 184 41·3 152-1 6 Nabason 128 128 100·0 164 22·0 128·1 7 Dihipara 138 131 94·9 168 22·0 121·7 8 Dhansimla 91 83 91·2 108 23'1 118·7 9 Panohal 78 68 87·2 120 43'3 153·8
10 Radhamohanpur 171 170 99·4 235 2j'7 137·4
TOTAL .. 1,130 1,055 93·1 1,479 28'3 130·9
24·Parganas-P. S. Baairhal 1 Ghorarash 249 210 84·3 322 34·S 129'8 2 Dhanyakuria 231 201 87·0 452 55·5 195'7 3 Chaita 226 201 88·9 410 51·0 181'4 4 Champapukur 356 286 80·3 510 43·9 143'3 5 Sangrampur 124 108 87-1 290 62·8 233·9 6 Sankchura 203 137 67-5 384 64·3 189'2 7 Itinda 282 215 76·2 525 59-0 186'2 8 PUa 271 253 93'4 523 51-6 [93'0
TOTAL 1,942 1,611 83'0 3,416 52·8 175·9
District Nadia-P. 8. Naba- I Bablari _ 136 67 49·3 166 59·6 122·0 dwip 2 Swarupganj 208 53 25·5 301 82·4 144·7
3 Mayapur 194 72 37-1 357 79·8 184·0
TOTAL 538 192 35·7 824 76'7 153·2
District MaIda- 1 Milki . 529 "875 70-9 700 46·4 132·3 P.8. Engli8h Bazar 2 Kazigram 196 152 77·6 199 23·6 101'5
3 Jodupur 123 58 47·2 142 59·2 115·4 4 Amriti 297 199 67·0 338 4H 113·8 5 Narhata 178 126 70·8 213 40·8 119'7 6 Mahadipur 143 78 54-5 183 57'4 128·0 7 Kotwali 148 69 46·6 151 54·3 102·0
TOTAL .1,614 1,057 65·5 1,926 45·1 119'3
TOW'lt8
District Burdw&n Katwa • • 70 66 80'0 292 80·8 417-1
District 24'PlW'gana8 . . J oynagar-MaziJpnr 270 246 9l-l 442 44·3 163·7
H(1.li§ahar . 186 94 .50·6 522 82·0 280·6
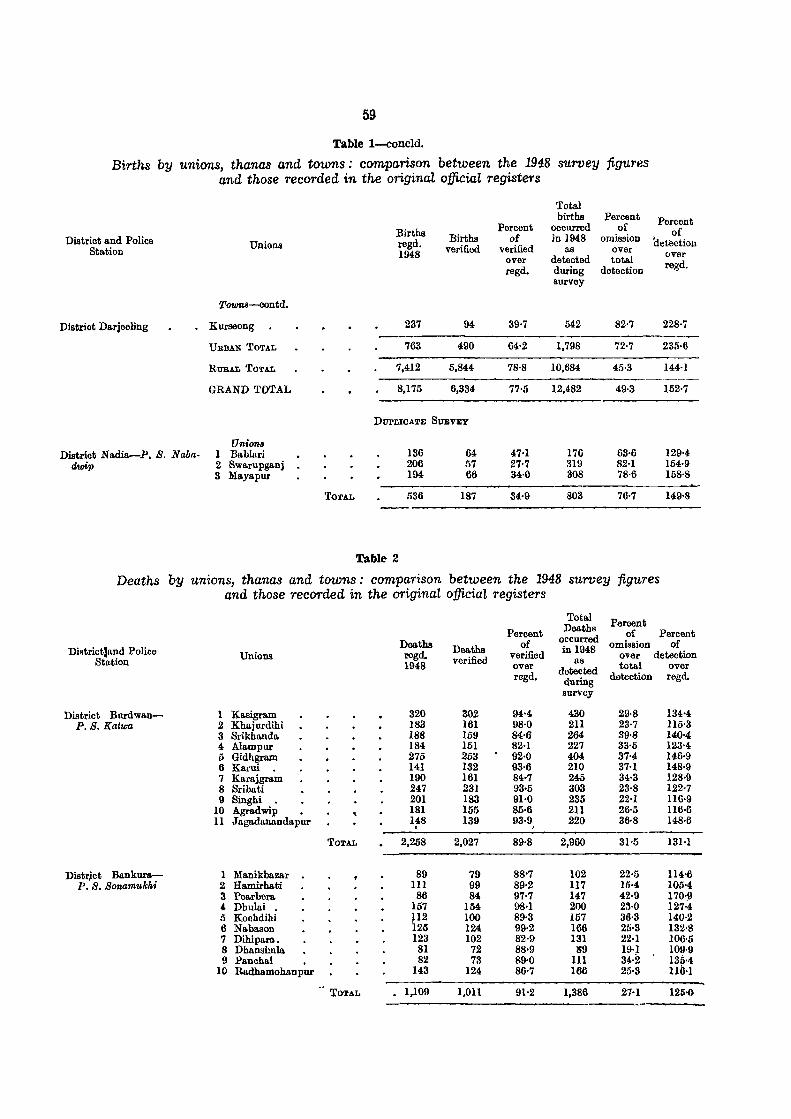
59
Table l~oncld.
Births by 'Unions, thanas and towns; com.parison between the 1948 and those recorded in the originaZ officiaZ registers
survey figures
Total births Percent Percent
Births Percent occurred of of District and Police Unions regd. Births of in 1948 omission 'detection
Station 1948 verified verified as over over over detected total regd. regd. during detection survey
Towns-contd.
District Darjeeling Kurseong 237 94 39·7 542 82·7 228·,
URBAN TOTAL 763 490 64·2 1,798 72·7 235·6
RURAL TOTAL 7,412 5,844 78·8 10,684 45·3 144·1
GRAND TOTAL 8,175 6,334 77·5 12,482 49·3 152·7
DUPLIOATE SURVEY
Unitm8 Distriot Nadia-P. S. Naha- l Bablari 136 64 47-1 176 63·6 129·4
dwip 2 Swarupganj 206 57 27-7 319 82-1 154·9 3 Mayapur 194 66 34·0 308 78·6 158·8
TOTAL 536 187 34·9 803 76·7 149·8
Table 2
Deaths by 'Unions, thanas and towns; comparison between the 1948 survey figures and those recorded in the original official registers
Total Percent Percent Deaths of Percent
Deaths of occurred omISSIon of District3and Police Unions regd. Deaths verified in 1948 detection
Station verified as over 1948 over detected total over
regd. during detection regd.
survey
District Burdwan- 1 Kasigram 320 302 94'4 430 29·8 134'4 P.S. Katwa 2 Khajurdihi 183 161 98·0 211 23·7 115·3
3 Srikhanda 188 159 84·6 264 39·8 140'4 4 Alampur 184 151 82·1 227 33'5 123'4 5 Gidhgram 275 253 92·0 404 37-4 146'9 6 Karui • 141 132 93·6 210 37-1 148·9 7 Karajgram 190 161 84·7 245 34·3 128·9 8 Sribati 247 231 93·5 303 23·8 122·7 9 Singhi. • 201 183 91·0 235 22-1 116·9
10 Agradwip • 181 155 85·6 211 26·5 116·6 11 Jagadanandapur 1~8 139 93·9 220 36·8 148·6 ,
TOTAL 2,258 2,027 89·8 2,960 31·5 13H
Distr,ict Bankura- 1 Manikbazar 89 79 88'7 102 22·5 114·6 P. S. SonamukM 2 Hamirhati III 99 89·2 117 15·4 105·4
3 Pea.rbera. 86 84 97·7 147 42·9 170·9 4 Dhulai 157 154 98·1 200 23·0 127:4 5 Kochdihi 112 100 89·3 157 36·3 140·2 6 Na.bason 125 124 99·2 166 21i·3 132·8 7 Dihipara. 123 102 82·9 131 22-1 106'5 8 Dhansimla 81 72 88·9 199 19·1 1011·9 9 Panehal 82 73 89·0 III 34·2 135·'"
10 Radhamohanpur 143 124 86·7 166 25·3 lliH
TOTAL 1,109 1,011 91·2 1,386 27-1 12f)o()

60.
Table 2-concld.
Deaths by unions, thanas and towns:' comparison between the ).948,. survey figures and those recorded in the originaL official registers
District and Polioe 8tu.tion Unions
District 24.Parg&llas- 1 Ghorarash e. S. BQ.8irliat .2 Dhanyakuria
3 Chaita • 4 Champapukur 5 S&Ilgrampur • ~ Sankchura 7 Itinda 8 Pifa.
District Nadia--P. 8. Naba. .1 .Ba.blari. dwip 2 Swarupganj •
3 Mayapur
Distrlct Malda-P. S. Engli8h I Milki Bazar 2 Kazigrnm
3 Jodupur 4 Amriti 5 Narhata 6 Mahadipur 7 Kotwali
Town8
District Burdwan . Katwa
District 24.Par!(anas Joynagar.Mazilpur HaJisahar. •
District Darjeeling Kurseong
URBAN TOTAL
RURAL TOTAL
TUTAL
TOTAL
TOTAL
Deaths regd. 1948
181 239 207 249
&0 168 203 205
1,532
76 1S3 160
419
202 122 112 140
86 68 74
804
243
94 102
255
694
6,1'22
GRAND TOTAL 6,816
DUPLlCA'l'lil I:!URVIlY UnWl'"
District. Nadia-P. S. Nata. I Bablari • '76 d.~'fip 2 Swarupg&llj 183
3 Mayapur 108
TOTAL 367
Deaths verified
156 202 169 197
57 121 148 175
1,225
24 31 68
123
150 87 60 95 46 40 37
515
184
83 43
S2
'392
4,901
5,293
24 '35 47
106
Percent of
verified over regd.
86·2 84·5 81·6 79·1 71·3 72·0 72'9 85·4
80·0
31·6 16·9 42·5
29·4
74·3 71·3 53·6 67·9 53·5 58·8 50·0
64·1
75·7
88·3 42·2
32·2
56·5
80·1
77·7
31·6 19·1 43·5
28·9
Total deaths
occurred in 1948
as detected during survey
222 370 305 298 152 232 329 334
2,242
108 251 223
582
235 U5 141 157
66 130
70
914
300
196 314
324
1,134
8,084
9,218
124 265 163
552
Percent of
omission over total
detection
29·7 45'4 44·6 33·9 62·5 47·8 55·0 47·6
45·4
77·8 87·6 69·5
78·9
36·2 24·3 57·4 39·5 30·3 69·2 47·1
43·7
38·7
57·7 86·3
74'7
65·4
39'4
42'6
80·6 86·8 71·2
80·8
Percent of
<;}etection over regd.
122'7 '154'8 147'3 120·0 190·0 138·1 162'1 162·9
146·3
142-1 137·2 139·4
139·0
116·3 94·3
125·9 112-1
76·7 191·2
94·6
113·7
123·5
208·5 307·8
127-1
163·4
132·0
135·2
163'2 144·8 150·9
150'4
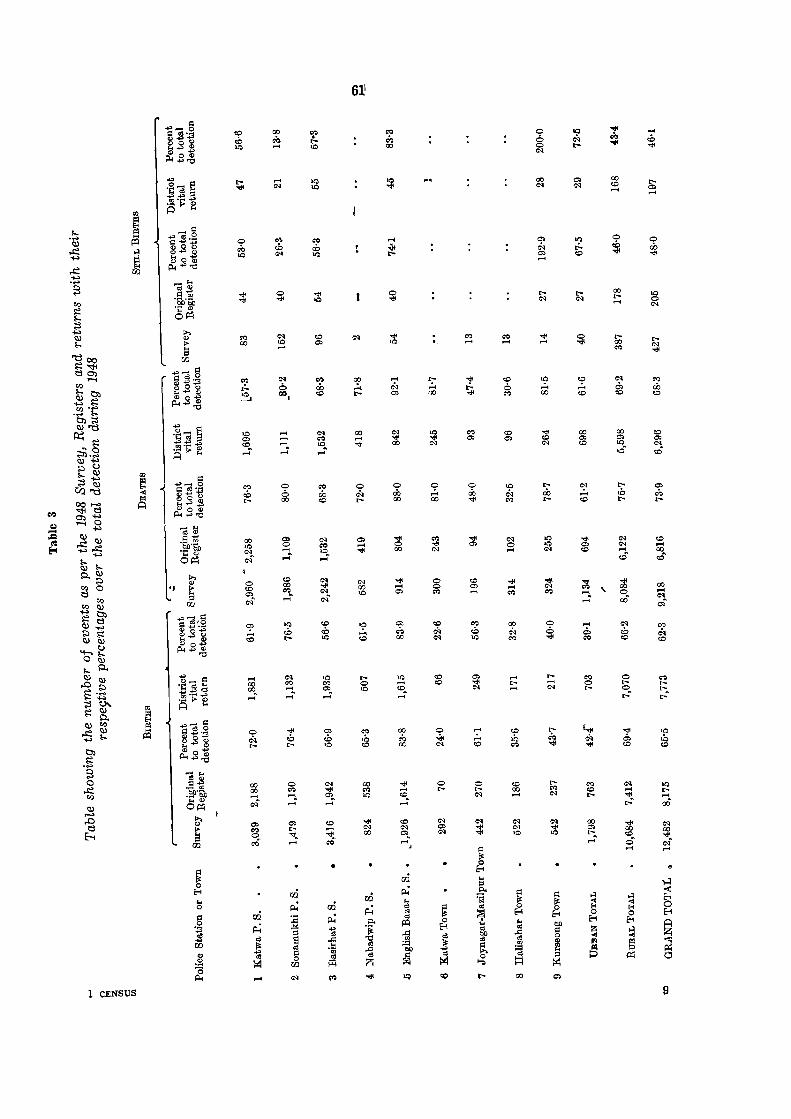
1 CENSUS
..... 00 00 ......
00 00 ..... (N.
.....
C'l 6 00,
..... ..... ...... .....
o "'" ..... ......
10 10
•
6].1
00 ..:.. t-
00 ..... "OJ!
o <N t-
to 10
o 00 00
10 ..... <0. -<
00 ~ 00
o ..:.. 00
<0 <0
"'" .....
C'l o .....
..... r.....
00
00 C'l
"'" ......
r-oo r-
10 10 C'l
00 C> <0
00 C> r-......
00 <0 ......
o ro r-.
<0 ..... 00 ...:;
10 r..... 00
9
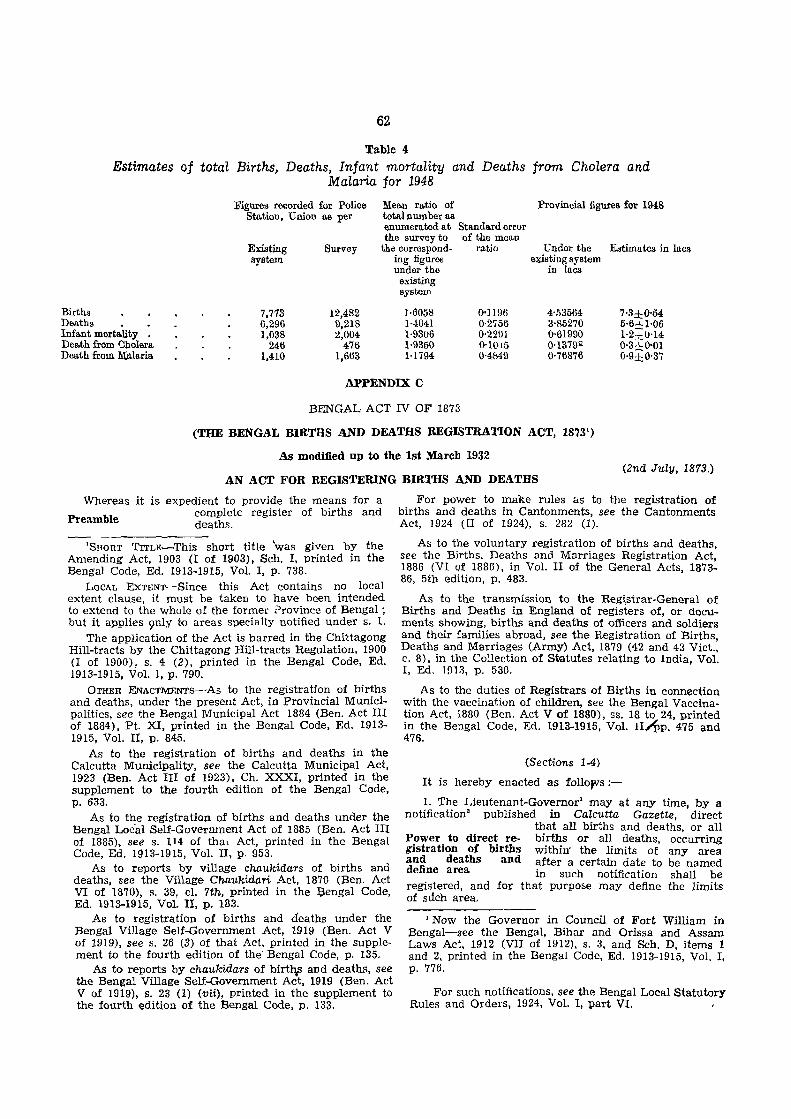
62
Table 4
Estimates oj total Births, Deaths, Infant mortality and Deaths from Cholera and M araria for 1948
Births Deaths • Infant mortality • Death from Cholera Dea.th from l\IIl.laria.
Figures recorded for Police Station, Union as per
Existing system
7,773 6,296 1,038
246 1,410
Survey
12,482 9,218 2,004
476 1,663
Mean ratio of total number 11.8
enumerated at Standard error the survey to of the mean
the correspond- ratio ing figuree under tho
existing system
1-6058 1·4641 1·9306 1·9350 1-1794
(}Oll96 0·2756 0·229] 0'10,.5 0·4849
Provincial figures for 1948
Under the Estimates in lucs existing system
in lacs
4'53564 3'R5270 0'61990 0'1379" 0'76876
7·3±O·54 5'6±1'06 1·2±0·14 0·3±O·0l 0·9±O·37
APPENDIX C
BENGAL ACT IV OF 1873
(THE BENGAL BIRTHS AND DEATHS REGISTRATION ACT, 18731)
As modified np to the 1st March 1932 (2nd July, 1873.)
AN ACT FOR REGISTERING BIRTHS AND DEATHS
Whereas it is expedient to provide the means for a
Preamble complete register of births and deaths.
'SnORT TITLE-This short title 'was given by the Amending Act, 1903 cr of 1903), Sch. I, printed in the Bengal Code, Ed. 1913~1915, Vol. I, p. 738.
LOCAL EXTENT- -Since this Act contains no local extent clause, it must be taken to have been intended to extend to the whole of the former ?rovince of Bengal; but it applies 9nly to areas specially notified under s. 1.
The application of the Act is barred in the Chittagong Hill-tracts by the Chittagong Hill-tracts Regulation, 1900 (l of 1900), s. 4 (2), printed in the Bengal Code, Ed. 1913-1915, Vol. I, p. 790.
OTHER ENACTMENTS--As to the registration of births and deaths, under the present Act, in Provincial Munici~ palities, see the Bengal Municipal Act 1884 (Ben. Act III of 1884), Pt. XI, printed in the Bengal Code, Ed. 1913~ 1915, Vol. II, p. 845.
As to the registration of births and deaths in the Calcutta Municipality, see the Calcutta Municipal Act, 1923 (Ben. Act III of 1923), Ch. XXXI, printed in the supplement to the fourth edition of the Bengal Code, p. 633.
As to the registration of births and deaths under the Bengal Loc'al Self-Government Act of 1885 (Ben. Act III of 1885), see s. 114 of that Act, printed in the Bengal Code, Ed. 1913-1915, Vol. II, p, 953.
As to reports by village chaukidars of births and deaths, see the Village Chaukidari Act, 1870 (Ben. Act VI of 1870), s. 39, cl. 7th, printed in the ]3engal Code, Ed. 1913~1915, Vol. II, p. 183.
As to registration of births and aeaths under the Bengal Village Self~Government Act, 1919 (Ben. Act V of 1919), see s. 26 (3) of that Act, printed in the supplement to the fourth edition of the' Bengal Code, p. 135.
As to reports by chaukidars of birtqs and deaths, see the Bengal Village Self~Government Act, 1919 (Ben. Act V of 1919), s. 23 (1) (vi.i) , printed in the supplement to the fourth edition of the Bengal Code, p. 133.
For power to make rules &s to the registration of births and deaths in Cantonments, see the Cantonments Act, 1924 (II of 1924), s. 282 (1).
As to the voluntary registration of births and deaths, see the Births, Deaths and Marriages Registration Act, 1886 (VI of 1886), in Vol. II of the General Acts, 1873~ 86, 5th edition, p. 483.
As to the transmission to the Reg~strar-General of Births and Deaths in England of registers of, or docu~ ments showing, births and deaths of officers and soldiers and their familie~ abroad, see the Registration of Births, Deaths and Marnages (Army) Act, 1879 (42 and 43 Vict., c. 8), in the Collection of statutes relating to India, Vol. I, Ed. If)lil, p. 530.
As to the duties of Registrars of Births in connection with the vaccination of children, see the Bengal Vaccination Act, 1880 (Ben. Act V of 1880), ss. 18 to 24, printed in the Bengal Code, Ed. 1913-1915, Vol. II,..,pp. 475 and 476.
(Sections 1-4)
It is hereby enacted as foll0r's:-
1. The Lieutenant-Governor' may at any time, by a notification' published in Calcutta Gazette, direct
Power to direct registration of births and deaths and define area
that all births and deaths, or all births or all deaths, occurring within' the limits of any area after a certain date to be named in such notification shall be
registered, and for that purp05e may define the limits of such area.
1 Now the Governor in Council of Fort William in Bengal-see the Bengal, Bihar and Orissa and Assam Laws Act, 1912 (VII of 1912), s. 3, and Sch. D, items 1 and 2, printed in the Bengal Code, Ed. 1913-1915, Vol. I, p. 776.
For such notifications, see the Bengal Local Statutory Rules and Orders, 1924, Vol. I, part VI.
63
From and after such date this Act shall apply to the whole of the area so defined.
2. The Magistrate of the district may, for the purpose of such registration, divide any such area into such and
. so many districts as he may ~ 3; g 1 S t rat e ~ay think fit, and may appoint one ~vu~e area mto or more persons to bc registrars dlstricts and may . . appoint registrars of Ulrths or of deaths, or of bIrths
and deaths, within such district, and may at any time for sufficient reason dismiss any such registrar and may fill up any vacancy in the office of registrar.
The Magistrate shall cause to be published a list containing the name and place uf office of every registrar Mag i s t rat e to in the area, and specifying the publish list of regis- hours of the day during which trars such registrar shall attend at :qis office for the purpose of registration.
3. Every registrar shall have an office within the district of which he is appointed registrar, and shall
Every registrar to have an office within his district
cause his name, with the addition of registrar of births (or of deaths, or of births and deaths according to his appointment)
for the district for which he is so appointed, and notice of the hours during which he will attend for the purpose of registration, to be affixed in sume conspicuous place on or near the outer door of his office.
4. The Magistrate shall cause to' be prepared a sufficient number of register-books for making entries
Magistrate to have register-books prepared and numbered
of all oirths or deaths or both, according to such forms as the LieJ.tenant-Governor2 may from time to time sanction; and the pageb 01 such books shall be
numbered progressively from the beginning to the end; and every place of entry shall ue also numbered progressively from the beginning to the end of the book, and every entry shall be divided from the following entry by a line.
(Sections 5-7)
5. Every registrar shall inform himself carefully of every birth, or of every death, or of both, according to
his appointment, which shall happen in his district, and shall register, as soun as conveniently may be after the event, without fee or reward, the particulars
Registrar to inform himself of, and. register, births and deaths
required to be registered, according to the forms mentioI;ted in the last preceding section, touching every SUc? bIrth or every such death, as the case may be, WhICh shall not have been already registered.
6. Every chaukidar or other village-watchman in any area to which this Act sheul apply, or, where there is no Ch ukida to bt· cnaukidar or other village-watchpa;ticula:S a:d a: man, such per'>o.n as the Magisreport to registrar tr~te may appomt, shall. be re-
qUIred to report every bIrth or death occurring within his beat tu such registrar and at such periods as the Magistrate may direct.
1 Now District Magistrate- -see the Code of Criminal Procedure, 1898 (Act V of 1898), s. 3 (2).
"Now the Governor in Council of Fort William in Bengal-see the Bengal Bihar and Orissa and Assam Laws Act, 1912 (VII of 1912), s. 3, and Sch. D, items 1 and 2, printed in the Bengal Code, Ed. 1913-1915, Vol. I, p. 776.
He shall obtain in writing, if possible, and if it is impossible for him to obtain in writinll he shall obtain verbally, from any person who b. bound to give information of the birth or death all particulars which are required to be known and registered and he shall report such particulars to the registrar.
Any chaukidar or other village-watchman or other person so appointed who wilfully or negligently refuses Penalty for neglect ?r omits to produce such writing,
If any, or to report such birth or death, shah be punishable at the discretion of the Magistrate with fine which may extend to two rupees.
7. The father or mother of every child born within sueh area, or in case of the death, illness, absence or Persons bound to inability of . the. fath.er. and give information of mother, the mIdWIfe aSSIsting at birth the birth of such child, shall
within eight days next after th~ day of every such birth, give information either personally or in writing, to the registrar of the' district or by means of the chaukidar or other village-watchman' or other person as provided in the last preceding section' according to the best of his or her knowledge and belief' of the several particulars hereby required to be know~ and registered touching the birth of such child.
Any person who refuses or neglects to give any information, which it is his duty to give under this Penalty fOl' neglect sectio~, sh.all be punishable at
. . the dIscretIOn of the Magistrate WIth fine which may extend to five rupees:
~rovided that not more than one person shall be pumshable at the discretion of the Mallistrate for such refusal or neglect to give information.
(Sections 8-10)
8. The nearest male relative of the deceased present at the death, or in attendance during the last illness
Persons bound to give information of death
of any person dying, within such area, or in the absence of any such relative, the occupier of the house, or, if the occupier be the
per'>on who shall have died, some male inmate of the house in which such death shall have happened shall :-vithin e~ght d~ys next after the day of such death, give mf<?rmahon eIther personally or in writing to the regIstrar of the district, or by means of the chaukidar or other village-watchman or other persun as provided in section 6, according to. the best of his knowledge and belief, of the several particulars hereby required to be known and registered touching the death of such person:
Provided that no person shall be bound to give the name of any female relative.
~ Or any sub-registrar appointed for a burning-ghat or bunal ground--see the Bengal Municipal Act, 1884 (Ben. Act III of 1884), s. 348, printed in the Bengal Code, Ed. 1913-1915, Vol. II, p. 845.
As to duty of Medical Officer-in-Charge of Hospital to give notice of death, see ibid., s. 349, printed ibid., p. 845
9A
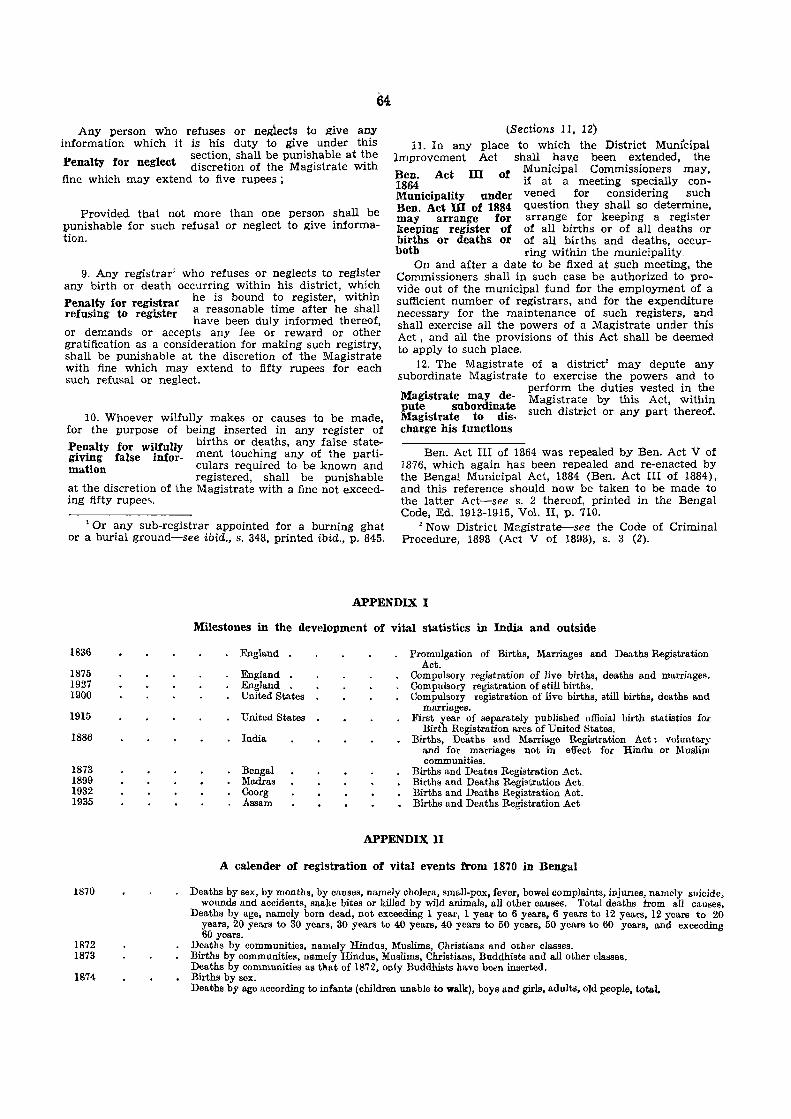
Any person who refuses or negiects to give any information which it is his duty to give under this
section, shall be punishable at the Penalty for neglect discretion of the Magistrate with fine which may extend to five rupees;
Provided that not more than one person shall be punishable for such refusal or neglect to give information.
9. Any registrar' who refuses or neglects to register any birth or death occurring within his district, which Penalty for registrar he is bound ~o register, within refusing to register a reasonable tur:-e after he shall
have been duly mformed thereof, or demands or accepts any fee or reward or other gratification as a consideration for making such registry, shall be punishable at the discretion of the Magistrate with fine which may extend to fifty rupees for each such refusal or neglect.
10. Whoever wilfully makes or causes to be made, for the purpose of being inserted in any register of Penalty for wilfuUy births or d~aths, any false stat:giving false inior- ment touchmg any of the parhmation culars required to be known and
registered, shall be punishable at the discretion of the Magistrate with a fine not exceeding fifty rupee..,.
'Or any sub-registrar appointed for a burning ghat or a burial ground-see ibid., s. 348, printed ibid., p. 845.
(8 ections 11, 12)
11. In any place to which the District Municipal Improvement Act shall have been extended, the Ben. Act ill of Municipal Commissioners may, 1864 if at a meeting specially conMunicipality under vened for considering such Ben. Act ill of 1884 question they shall so determine, may arrange for arrange for keeping a register keeping register of of all births or of all deaths or births or deaths or of all births and deaths, occur-both ring within the municipality.
On and after a date to be fixed at such meeting, the Commissioners shall in such case be authorized to provide out of the municipal fund for the employment of a sufficient number of registrars, and for the expenditure necessary for the maintenance of such registers, and shall exercise all the powers of a Magistrate under this Act, and all the provisions of this Act shall be deemed to apply to such place.
12. The Magistrate of a district' may depute any subordinate Magistrate to exercise the powers and to
Magistrate may depute subordinate Magistrate t.o discharg'e his functions
perform the duties vested in the Magistrate by this Act, within such district or any part thereo-f.
Ben. Act III of 1864 was repealed by Ben. Act V of 1876, which again has been repealed and re-enacted by the Bengal Municipal Act, 1884 (Ben. Act III of 1884), and this reference should now be taken to be made to the latter Act-see s. 2 thereof, printed in the Bengal Code, Ed. 1913-1915, Vol. II, p. 710.
2 Now District Magistrate--see the Code of Criminal Procedure, 1898 (Act V of 1898), s. 3 (2).
APPENDIX I
1836
1875 1927 1900
1915
1886
1873 1899 1932 1935
1870
1872 1873
1874
Milestones in the development of vital statistics in India and outside
England
England England • United States
United States
India
Bengal Madras Coorg Assam
Promulgation of Births, Marriages and Deaths Registration Act.
Compulsory registration of live births, deaths and marriages. Compulsory registration of still births. Compulsory registration of live births, still births, deaths and
marriages. First year of separately published official birth statistics for
Birth Registration area of United States. Births, Deaths and Marriage Registration Act: voluntary
and for marriages not in effect for Hindu or Muslim communities.
Births and Deaths Registration Act. Births and Deaths Registration Act. Births and Deaths RE'gistration Act. Births and Deaths Registration Act
APPENDIX n
A calender of registration of vital events from 1870 in Bengal
Deaths by sex, by months, by causes, namely cholera. small·pox, fever, bowel (lompJaints, injurIes, namely suicide, wounds and accidents, snake bites or killed by wild animals, all other causes. Total deaths from all oauses.
Deaths by age, namely born dead, not exceeding 1 year, 1 year to 6 years, 6 years to 12 years, 12 years to 20 years, 20 years to 30 years, 30 years to 40 years, 40 years to 50 years, 50 years to 60 years, and exceeding 60 years.
Deaths by communities, namely Hindus, Muslims, Christians and other classes. Births by communities, namely Hindus, Muslims, Christians, Buddhists and all other clatlSes. Deaths by communities as that of 1872, only Buddhists have been inserted. Births by sex. Deabhs by age according to infants (children unable to walk), boys and girls, adults, old people, total.
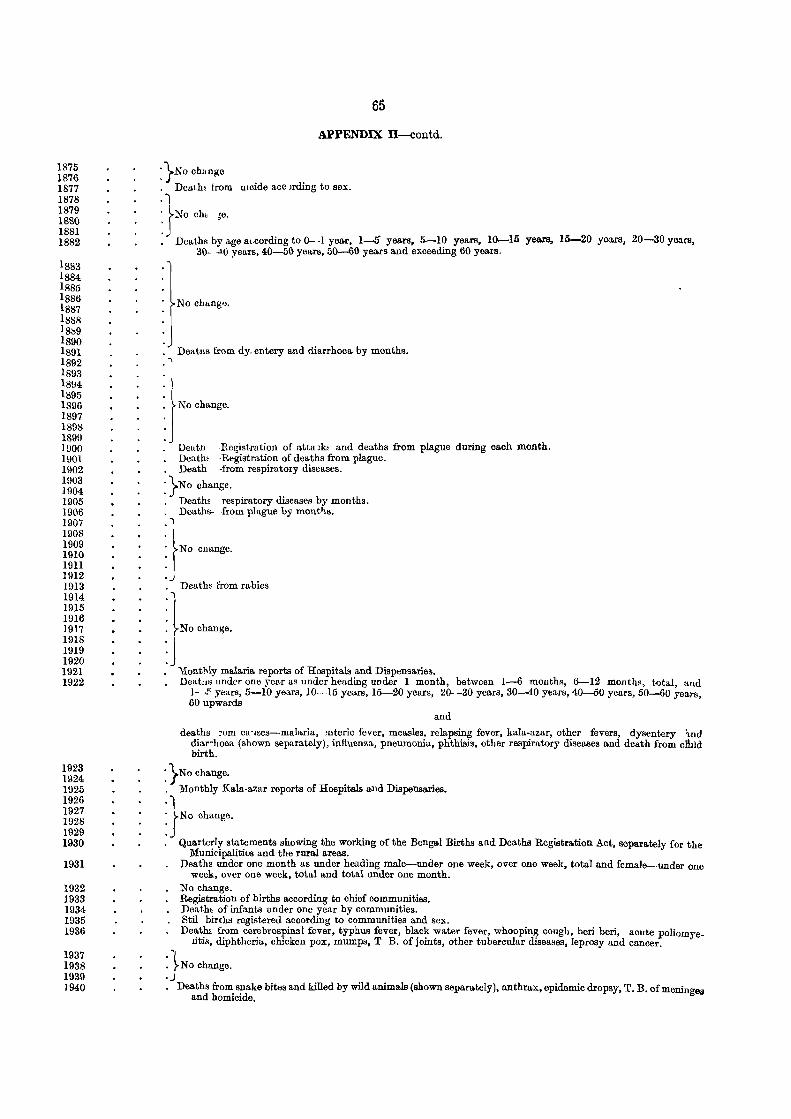
1875 1876 1877 1878 1879 188() 1881 1882
IS83 1884 IS85 1886 1887 1888 18b9 1890 1891 1892 1893 1894 1895 1896 1897 1898 1899 1900 1901 1902 1903 1904 1905 19(16 1907 1908 1909 1910 1911 1912 1913 1914 1915 1916 1917 1918 1919 1920 1921 1922
1923 1924 1925 1926 1927 1928 1929 1930
1931
1932 1933 1934 1935 1936
1937 1938 1939 1940
65
APPENDIX. II-contd.
:}NO change
. Death~ from Ulcide ace Jrding to sex.
}, 0" ,. • Deaths by age at.cording to 0- -1 year, 1-5 years, 5--10 years, 10--15 years, 15-20 yoars, 20-30 years,
30- -iO years, 40-50 years, 50--60 years and exceeding 60 years.
No chang.,.
Deatlls from dy. entery and diarrhoea. by months. i
\]"orumg,
Deatn -Rc~istration of atta lID and deaths from plague during each month. Deatb, -Registration of deaths from plague.
· Death -from respiratory diseases.
: }NO change.
· DeathE respiratory diseases by months. Deaths- -from plague by mont~s.
I
· I : rNO cnange.
: J Deaths from rabies_ .1
: ~NO change.
:J 'Ionthly malaria reports of Hospitals and Dispensaries. Deatus under one year as under heading under 1 month, betwcen 1-6 months, 6-12 months, total, and
I-p years, 5-10 years, 10-15 years, 15-20 years, 20- -30 years, 30--40 years, 40-50 years, 50-60 years, 60 upwards
and
deaths rom ca'lscs-malaria, ·mteric fever, measles, relapsing fever, kala-azar, other fevers, dysentery 1-nd diar-hoea (shown separately), infiuenzi1, pneumonia, phthisis, other respiratory diseases and dedth from cfuld birth.
: }No change. · Monthly Kala-azar reports of Hospitals and Dispensa.ries_
}, oh=g"
· Quarterly statements showing the working of the Bengal Births and Deaths Registra.tion Act, separa.tely for the MunicipalititJS and the rural a.reas.
· Deaths under one month as under heading male-under one week, over one week, total and female-under one week, over one week, total and total under one month.
No change. Registration of births according to chief communities. Death. of infants under one year by communities. StH births registered according to communities and sex. Deatlli from cerebrospinal fever, typhus fever, black water fever, whooping cough, beri beri, acute poliomye_
litis, diphtheria, chicken pox, mumps, T B. of joints, other tubercular diseases, leprosy and cancer.
: 1NO change. .J
Deaths from snake bites and killed by wild animals (shown separately), anthrax, epidemic dropsy, T. B. of meninges and homicide.
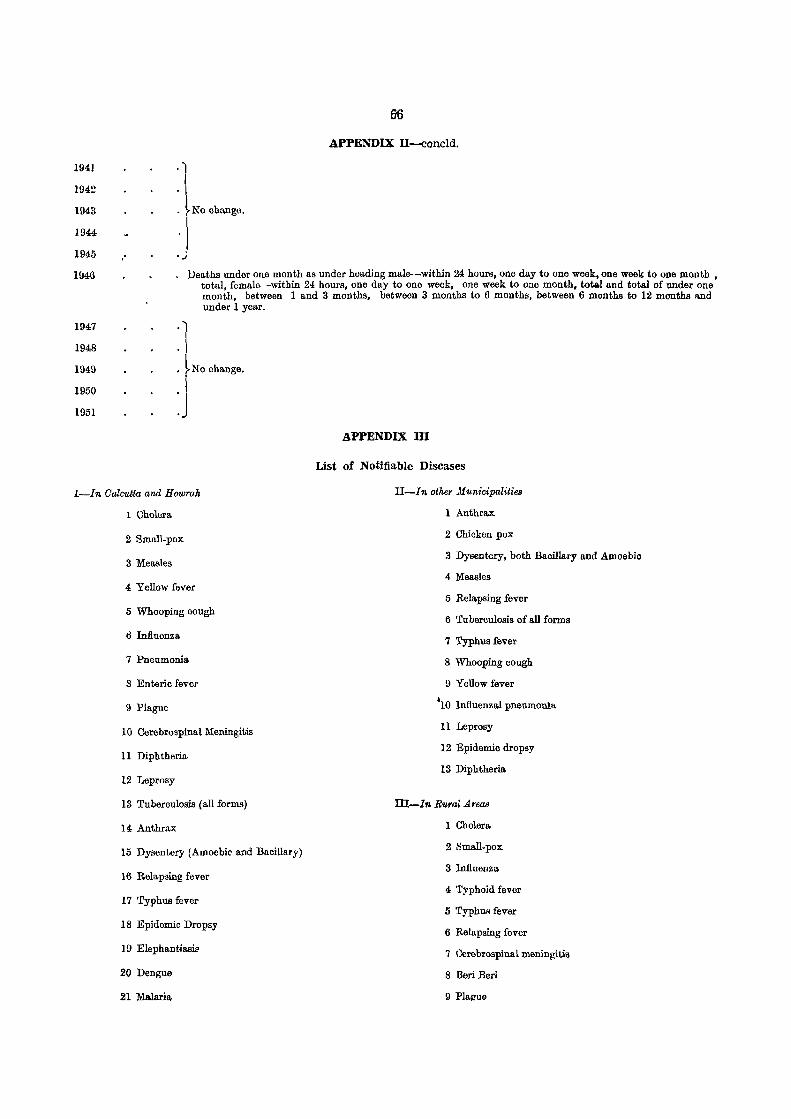
1941
194!:?
1943
1944
1945
194G
1947
1948
1949
1950
1951
. ") I
. I
APPENDIX II--concld.
Deaths under one month as under heading male- -within 24 hours, one day to one week, one week to one month , total, femalo- -within 24 hours, one day to one week, one week to one month, total and total of under one month, between 1 and 3 months, between 3 months to 6 months, between 6 months to 12 months and under 1 year .
• ~No change.
:J APPENDIX III
List of Notifiable Diseases
I-In Calcutta and Howrah II-In other Municipalitiea
1 Cholbra.
2 Small-pox
3 Measles
4 Yellow fever
5 Whooping cough
6 Influenza
7 Pneumonia
8 Enterie fever
9 Plague
10 CerebrospinalMeningitis
11 Diphtheria
12 Leprosy
13 Tuberculosis (all forms)
14 Anthrax
15 Dysentery (Amoebic and Bacillary)
16 Relapsing fever
17 Typhus fever
18 Epidemic Dropsy
19 Elephantiasie
20 Dengue
.21 Malaria
1 Anthrax
2 Chicken pox
3 Dysentery, both Bacillary and Amoebie
4 Measles
5 Relapsing fever
6 Tuberculosis of all forms
7 Typhus fever
8 Whooping cough
9 Yellow fever
'10 Influenzlll pneumonla
11 Leprosy
12 Epidemic dropsy
13 Diphtheria
Ill-Ira. Rural Area8
1 Chelera
2 Small-pox:
3 Influenza
4 Typhoid fevor
5 TyphW! fever
6 Relapsing fever
7 Cerebrospinal meningitis
8 Berl Berl
9 Plague
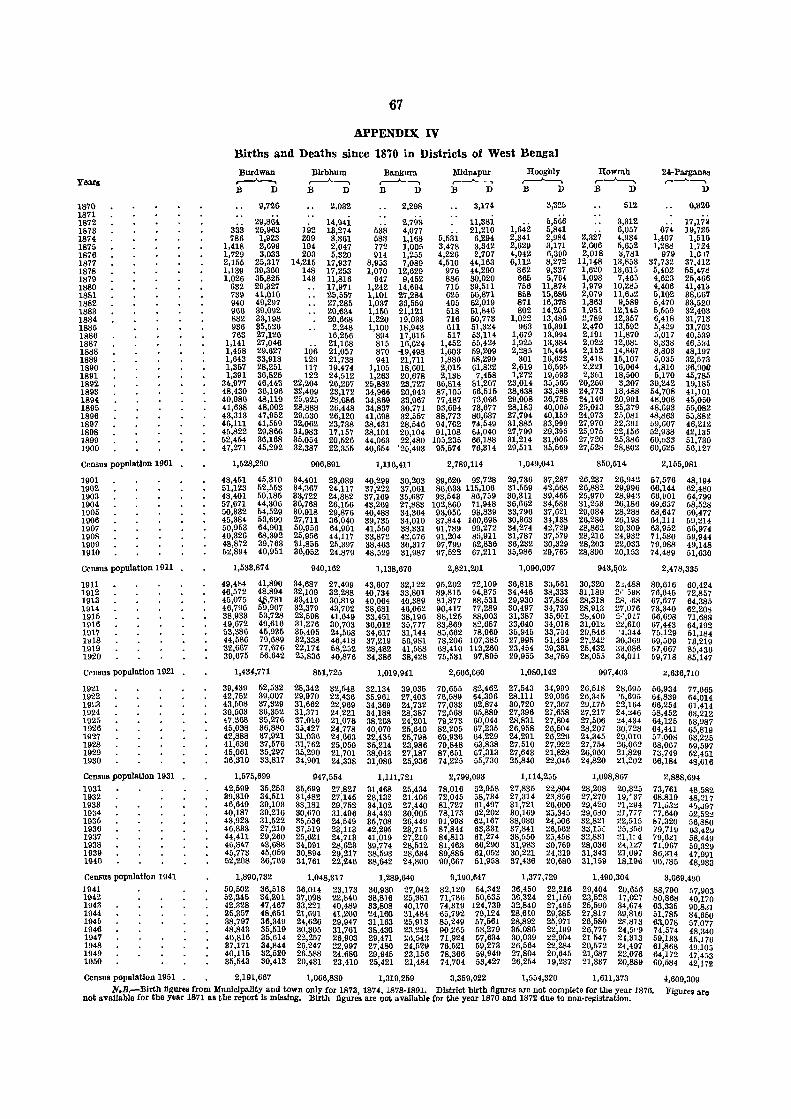
67
APPENDIX. IV
Births and Deaths since 1870 in Districts of West Bengal
Burdwan Blrbhum llankura Mldnapur Roogbly Rovrrah 24-Pargauas Years ,..----A---, ,.....--A--., r---'---. r---"---o r---"---o ,---'----, ,-----'----,
B D B D B D B D B D B D D
1870 9,726 2,032 2,298 3,174 <1,325 512 6,826 1871
14,94i 2,79i 6,666 17,173 1872 29,864 11,381 1,642
3,312 1873 338 26,963 192 13,274 638 4,077
6,5ii 21,210 6,841
2,327 6,057 674 19,725
1874 786 1,923 209 a,aOI 583 1,168 6,294 2,341 2,984 4,934 1,407 1,616 1875 1,418 2,G9\} 194 2,047 772 1,005 3,478 3,842 2,629 3,171 2,006 6,652 1,28!l 1,724 1876 1,729 3,033 203 6,320 914 1,255 4,226 2,707 4,042 6,390 2,018 ~,7!l1 979 l,G 17 1877 2,155 25,317 14,216 17,937 8,953 7,089 4,510 44,163 6,112 8,272 11,148 13,853 37,732 37,412 1878 1,139 39,300 148 17,253 1,070 12,629 976 44,290 862 9,337 1,620 IB,615 6,402 65,47!l 1879 1,026 35,825 143 11,816 947 9,452 886 30,020 666 5,764 1,098 7,465 4,623 26,466 1880 632 29,327 17,971 1,242 14,694 716 39,511 756 11,874 1,979 lO,2!l5 4,406 41,413 1881 739 41,010 25,557 1,101 27,284 u26 5u,871 858 15,686 2,079 11,6,)2 5,102 38,u67 1882 940 49,297 27,285 1,037 33,559 405 62,019 871 16,378 1,863 9,589 6,470 33,520 1883 966 39,092 20,634 1,150 21,121 518 61,846 802 14,206 1,951 12,145 5,559 32,403 1884 882 33,198 20,668 1,220 19,033 716 60,773 1,022 13,486 2,789 12,357 6,418 31,713 1885 936 35,526 2,248 1,100 18,943 611 51,324 963 16,391 2,470 13,592 5,429 31,703 1886 763 27,126 16,256 894 17,615 517 53,114 1,679 13,994 2,191 11,870 5,017 40,539 1887 1,141 27,046 21,168 815 16,624 1,452 65,424 1,925 13,384 2,022 12,68~ 8,~38 46,534 18S8 1,468 29,627 106 21,057 870 "i9,498 1,603 59,209 2,285 15,464 2,162 14,867 8,803 48,197 1889 1,643 33,918 129 21,738 941 21,711 1,886 68,299 301 16,623 2,418 15,107 6,035 32,573 1890 1,357 28,251 117 19,474 1,105 18,601 2,015 61,832 2,619 16,595 2,221 16,064 4,810 36,90a 1891 1,391 36,825 122 24,512 1,263 20,678 2,138 7,458 1,272 19,593 2,351 18,500 6,170 45,785 1892 34,977 46,443 22,204 26,297 25,882 23,727 60,814 81,207 23,014 35,565 20,250 3,307 39,242 19,185 1893 48,430 36,196 32,409 23,172 34,966 20,943 87,105 66,515 38,638 33,588 24,773 18,488 54,708 41,101 1894 40,980 48,119 25,925 2B,686 34,869 33,067 77,487 73,066 29,008 36,728 24,146 20,991 48,908 45,050 1895 41,638 48,002 28,888 26,448 34,837 30,771 93,694 73,677 28,183 40,005 25,013 25,379 48,693 55,082 1896 43,313 47,952 29,530 26,120 41,698 32,557 88,773 80,637 27,794 40,159 24,973 25,081 48,863 55,882 1897 46,111 41,559 32,062 23,738 38,431 28,546 94,762 74,549 31,885 33,999 27,970 22,391 b9,007 46,212 1898 45,822 29,866 31,983 17,157 38,101 20,104 91,108 64,040 27,799 29,395 25,975 22,156 52,938 42,135 1899 52,454 36,168 35,054 20,526 44,063 22,480 105,235 66,188 31,214 31,006 27,720 25,386 GO,b33 51,730 1900 47,271 45,292 32,387 22,355 40,654 '25,493 95,574 76,314 29,511 35,569 27,528 28,802 60,625 56,127
Census population 1901 1,528,290 906,891 1,116,411 2,789,114 1,049,041 850,5U 2,155,981
1901 48,451 45,310 34,401 23,089 40,299 30,203 89,620 92,728 29,736 37,287 26,237 26,942 67,576 48,194 1902 51,123 52,553 34,:167 24,117 37,222 37,061 86,033 115,106 31,559 42,568 26,882 29,996 66,144 62,480 1903 48,401 50,185 33,722 24,882 37,169 35,687 93,543 86,759 30,311 39,465 25,970 28,943 66,~01 64,799 1904 57,671 44,306 36,768 26,156 43,269 27,883 102,860 71,948 36,662 34,583 31,253 26,186 69,657 68,528 1905 50,332 54,529 30,918 29,876 40,488 34,364 93,056 93,839 33,796 37,621 29,084 28,288 68,647 60,477 1906 45,384 53,699 27,711 36,040 39,735 34,010 87,844 100,698 30,363 34,138 26,280 26,198 64,111 69,214 1907 50,953 64,901 50,953 64,901 41,550 38,B31 91,789 99,272 34,274 42,729 28,862 29,309 63,952 66,974 1908 40,326 68,392 25,956 44,117 33,872 42,576 91,204 85,911 31,787 37,579 28,216 24,932 71,580 59,941 1909 48,872 39,763 31,855 25,397 38,463 30,317 97,799 62,836 36,232 30,329 28,203 22,033 79,988 49,148 1910 52,894 40,951 36,052 24,879 48,529 31,987 97,522 67,211 35,986 29,765 28,890 20,153 74,4!l9 51,630
Census populatIon 1911 1,533,874 940,162 1,138,670 2,821,201 1,090,097 943,~02 2,478,335
1911 49,484 41,890 34,687 27,499 43,607 32,122 95,202 72,109 36,818 3a,661 30,320 2,,488 80,616 60,424 1912 46,572 48,894 32,109 32,288 40,734 33,801 89,815 94,875 34,446 38,333 31,189 2,~ jU~ 76,645 72,857 1913 45,075 "tl,781 33,419 30,819 40,064 40,389 81,877 88,531 29,930 37,824 28,318 .28, .68 67,677 64,385 1014 46,796 59,907 32,379 43,702 38,681 46,062 90,417 77,289 30,497 34,739 28,913 27,076 73,340 62,208 1915 38,933 53,728 22,598 41,649 33,451 38,196 88,126 88,003 31,387 35,601 28,400 2.~ ,917 66,698 71,688 1916 49,672 49,616 31,276 30,703 36,012 35,777 83,869 82,657 33,640 34,018 31,01:0 22,610 67,443 64,192 1917 03,386 45,935 36,405 24,568 34,617 31,144 85,662 78,969 35,945 33,704 29,84t1 '1,344 75,129 51,184 1u18 44,586 79,689 32,338 46,418 37,219 66,981 78,206 107,385 27,995 51,459 27,242 30,369 69,509 73,219 1!l19 32,667 77,676 22,174 58,252 28,482 41,588 68,410 113,260 23,454 39,351 25,432 ~~,086 57,667 8b,436 1920 39,675 56,642 25,836 40,876 34,386 38,428 75,531 97,895 29,955 3!l,759 2!l,055 34,011 59,718 85,147
Census populatIon 1921 1,434,771 851,725 1,019,941 2,666,660 1,080,142 997,403 :0,636,710
1921 39,439 52,532 28,342 32,548 32,134 39,035 70,655 82,462 27,543 34,999 26,518 28,695 66,934 77,665 1922 42,752 39.007 29,970 22,436 35,961 27,403 76,589 64,396 28,111 29,036 26,3{5 )5,69':' 64,839 64,014 19~3 43,608 37;329 31,662 22,969 34,369 24,732 77,033 62,874 30,720 27,367 29,175 22,164 66,254 01,414 1924 39,603 36,352 31,371 24,221 34,188 28,387 72,568 65,889 27,396 27,658 27,217 24,:l46 58,452 63,212 1925 47,368 35,276 37,010 21,076 38,2tl8 24,201 79,273 60,044- 28,831 27,804 27,506 l!4,434 64,125 58,987 1926 45,038 36,880 35,427 24,778 40,070 25,640 82,205 67,235 26,968 26,504 28,207 30,728 64,441 65,819 1927 42,888 37,921 31,036 24,663 32,43. 25,798 69,936 64,229 24,291 26,229 24,345 29,010 57,008 63,225 1928 41,636 37,676 31,762 25,059 35,214 23,986 79,848 63,838 27,510 27,922 27,754 26,002 68,067 69,597 1929 45,061 35,297 35,290 21,701 38,043 27,187 87,651 57,313 27,643 21,828 26,960 21,829 73,749 52,451 1930 36,310 33,817 34,901 24,338 31,086 25,936 74,225 55,730 25,840 22,045 24,820 21,202 66,184 48,616
Census populatIon 1931 1,575,699 947,554 1,111;721 2,799,093 1,114,255 l,U98,867 2,888,694 1931 42,599 35,253 35,699 27,827 31,468 25,434 78,016 G2,958 27,835 22,804 28,208 20,325 73,761 48,582 1932 39,310 34,611 31,482 27,145 28,132 21,406 72,045 58,734 27,314 23,856 27,270 19,'37 68,819 48,217 1933 46,649 39,103 38,181 29,752 34,102 27,440 81,727 61,497 31,721 26,000 29,420 ?l,lW4 71,o3~ 4'>,.;97 1934 40,187 39,216 30,070 31,496 34,433 30,005 78,173 62,202 30,169 25,345 29,630 ~J,777 77,640 52,522 1935 43,923 31,522 35,536 24,549 35,708 26,449 91,998 62,167 38,030 24,506 32,821 22,515 87,320 56,880 193!} 46,833 27,210 37,519 23,113 42,295 23,715 87,844 63,331 37,841 26,662 3o,15t 251356 79,719 63,429 1937 44,411 29,260 25,621 24,713 41,019 27,210 84,813 61,274 38,550 23,458 32,831 21,1: 4 79,6~1 58,449 1938 46,847 43,688 34,091 28,623 39,774 28,512 81,463 66,290 31,983 30,769 28,036 24,1~7 71,967 59,329 1939 45,773 45,059 30,894 29,217 38,593 28,634 89,885 61,052 30,221 24,319 31,343 21,097 86,314 47,991 1940 52,208 36,769 34,761 22,246 38,642 24,800 90,667 51,958 37,436 20,680 31,159 18,196 90,785 48,933
Census population 1941 1,890,732 1,048,317 1,289,640 S,190,M7 1,377,729 1,490,304 3,G69,4~0
1941 50,502 36,518 36,014 23,173 36,930 27,042 82,120 54,342 36,450 22,216 29,404 20,656 88,790 57,903 1942 52,M5 34,301 37,098 22,840 38,816 25,381 71,786 50,635 36,324 21,159 23,528 17,027 1>0,868 49,170 194~ 42,328 47,467 33,221 40,489 33,808 40,170 74,319 124,739 32,840 27,495 25,590 34,674 63,335 90,8Jl 1944 35,357 48,651 21,691 41,200 24,160 31,484 65,792 79,124 28.610 29,385 27,817 :\9,816 51,785 84,650 1945 38,797 36,349 24,626 29,947 31,163 25,913 85,249 57,561 28,892 25,971 26,580 2F.813 63,078 57,077 1946 48,843 35,519 30,305 31,761 38,430 23,234 P0.265 53,279 35,086 22,199 26,776 24,5"9 74,574 48,340 1947 40,816 35,614 22,257 26,903 29,471 ;:d,54!! 71,924 (;7,634 30,039 22,904 21547 21,313 59,133 45,176 1048 37,171 34,844 26,247 22,997 27,480 U,521l 76,521 69,273 26,564 22,284 20,572 24,497 61,868 49,105 1949 40,115 32,520 26.588 24.680 29,945 23,156 78,366 59,949 27,804 20,645 21,G87 22,076 64,172 47,4~3 1950 35,543 30,413 20,431 23,410 25,421 21,484 74,704 53,427 26,254 19,237 21,337 20,889 60,584 42,172
Census population 1951 2,191,667 1,066,889 1,319,259 3,359,022 1,554,320 1,611,373 4,609,309 N.B,-Birth llgnres from Munlclpallty and town ouly for 1873, 1874. 1878·1891. District birth llgures are not coroplete for the year 1876.
not available for the year 1871 as the report Is mlsslng_ Birth llgures are not available for the year 1870 and 1872 due to non-relZhtratlon. Figures are
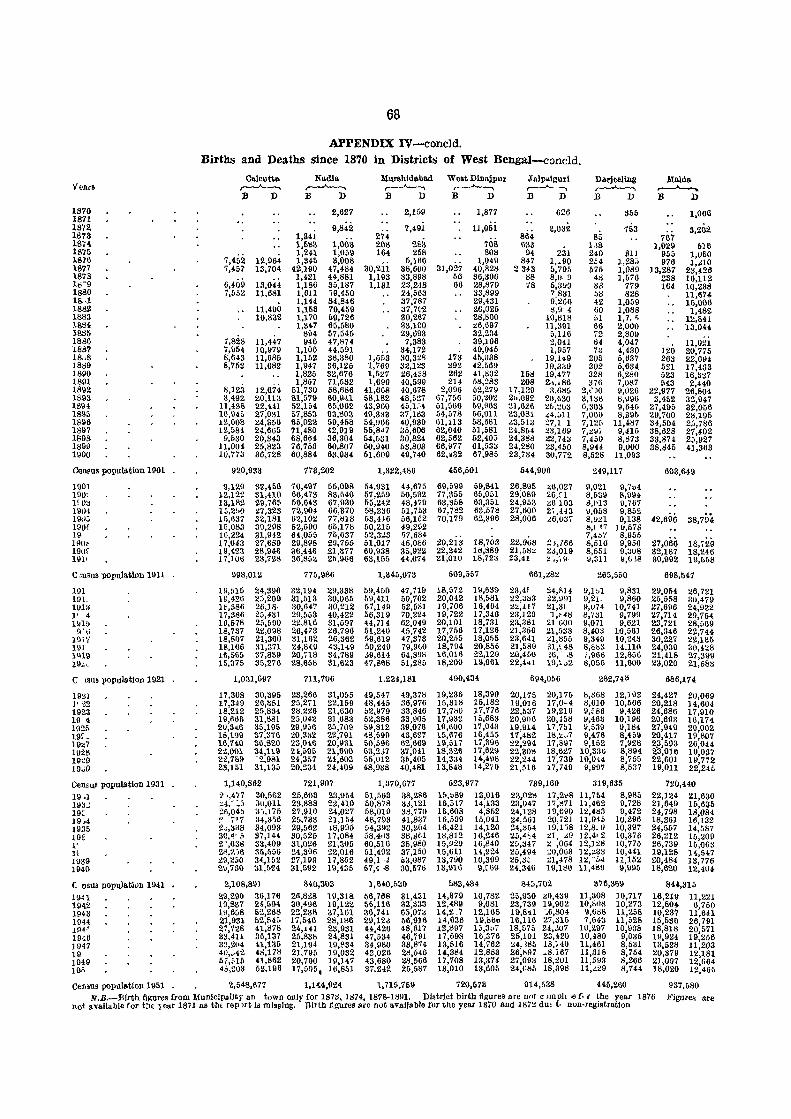
68
APPENDIX IV-concld. Births and Deaths since 1870 in Districts of West Bengal-concld.
Calcutta Nadia MllrlIhldabad West Dln~jpur Jalp.uguri Darjeelmg Malda Years ~ ~ ,..----A----, ~ r--"-- -, ~ ~
B D :s D B D B D B D B D :s D 1870 2,627 2,159 1,877 626 366 1,066 1871 1872 9,842
274-7,49i 11,051
864 2,U32 753 3,202
1873 1,341 1,ooi 2si
85 767 18740 1,(>83 208 708 633 1.IS 1,029 bIt) 1875
7,452 1,241 1,059 164 258 808 94 231 240 311 955 I,V50
1876 12,964 1,345 3,008 30.zii
5,166 31,027
1,049 847 1,_90 2E4 1,28;; 976 1,.1I0 1877 7,457 13,704 42.190 47,484 38,000 40.828 2343 5,795 675 1,089 13,287 23,426 1878
6,409 1,421 44,881 1,193 33,898 56 36,306 88 8.H·9 4d 1,576 238 16,112
1';-9 13,044 1,186 35,187 1,131 23.248 66 28.879 78 5,3~9 38 779 164 10,238 1880 7.552 11.681 1,611 ,9,450 24.563 33.899 7.831 bll 828 11,674 18,,1
11,490 1,144 84,846 37,787 29,481 9,266 42 1.059 15,006
1882 1,163 79,459 37,792 26.026 8,9 4 60 1.088 1.~82 1883 10.832 1.170 09,726 30,267 28.800 10,818 51 1,7. 'i 12,841 1884 1,347 65.[>80 33.100 :.6.697 11.391 66 2.000 13.044 1885
7,828 8114 &7.545 29,693 32.234 5,116 72 2,809
1886 11.447 946 47,874 7,383 39,196 2,041 64 4,047 120
11.021 1887 7,954 10.979 1,10~ 44.591
1.553 34,172
173 49,045 1.957 n 4,430 20,775
18,,8 8,643 11,68[> 1.152 38,380 30,328 45,038 19,149 205 6.637 263 22,694 18S9 8,752 11,682 1.947 36.126 1.769 32,123 ~92 42.569 19,339 302 5.634 521 17.433 1890 1.825 32.676 1,5~7 26,438 262 41.802 151l 19,477 328 6,280 523 16)~27 1891
8,123 1.857 71.,582 1,699 40,599 214 58,283 208 2.;.,86 376 7.087 543 2.410
1892 12,674 51.730 58.686 41.6G8 40.678 2.096 52,279 17,129 3,685 2,t'.}O 9,026 22,977 26.804 1893 3.492 20,113 81.5711 60,941 58.182 48,527 67,756 50.202 20,092 2u,530 3,1~S 8,~96 3,452 32,947 18\)4 11,438 22.441 52.154 65,062 43.9CO 45.1:4 51.566 59.963 21,626 l!5.::b~ 6.303 9,645 27,495 32.056 1895 10.945 27.031 57.853 63.803 49,3:13 37.183 54.578 56.011 23.081 .il4.i>l1 7,060 8.895 29.700 28.195 1896 12.608 24,3511 65.022 59.458 54.1166 40,931) 61.113 58,381 ~3.51a 27,1 1 7,120 11,487 34,504 26,786 1897 12,584 24,665 71,480 42.919 55,847 35,606 62,640 51,581 24.854 ~3.169 7,~9i 9.415 38,628 27,402 1898 9,530 20,843 68,664 36,304 54.531 30,824 62.562 52.40~ 24.388 22.74~ 7.450 8,873 38.874 2'>.927 1899 11,004 25.823 76.753 60,807 00,940 63,803 66,977 61,53~ 24.280 23.450 8,944 9.000 38.845 41,363 1900 10,773 36,728 60.884 63,934 61,609 49,740 62,432 67,985 23,734 30.772 8,528 11,093
Census popuilltion 1901 920,933 773,202 1,322,486 456,501 644.906 249.117 603,649
1901 9,129 32,456 70,497 55.098 54,931 44,675 69.599 59,841 26,895 ~6.027 9.021 9,704 190, 12.122 31,410 66,473 83,640 67.259 50.532 77.355 65,051 29.089 26.f1 8,6311 8,994 1['01l 13.182 29.765 56,6t3 67.930 55,242 48,479 63.a58 63,351 24.953 ~6103 8,1'13 9.767 19M 15.200 t7,323 72.904 66,370 58.236 51.753 67,782 63,578 27.600 2;,443 9,058 9,852
42,696 38,704 1911S 10.637 32,181 62.102 77,IJIB 53,416 56.162 70.179 62.396 28,006 ..::6,0:5; 8,9~1 9,138 190f 15,083 30.298 52.590 65,178 60,216 49.292 t),( t'i 10,573 19, 16.224 31.942 64,055 75.637 52,323 07,684
18,703 22,068 7,407 8,1155
27,066 18.720 190~ 17.043 27.689 29,898 29,755 51,017 45.086 20.213 21,766 8,616 9,950 100r 19,423 28.946 36.4406 21,377 60,938 35,922 22,242 18.889 21.68~ 2d,019 8,551 9,3U8 32,187 18,24(; 191> 17.1U6 23.728 36.85:0 25.906 63.155 44,074 21,010 18,723 23,41 2~), \-i 9,311 9.6-\8 30,992 11l,058
Consus population 1911 998.012 775,986 1.345.073 509,557 661,282 265,550 698.547
191 19,015 24,396 32.194 29,338 59.4bO 47.719 18,572 19,639 23,41 24,814 \)~lbl 9,831 29,054 26.721 191. 19,426 2:;,209 :n.513 30,065 59.411 50.702 20,042 18.581 22,~l:!3 22.991 9,ZI. 9.860 25,558 30,479 1111:1 18.386 26,18. 30.647 30.212 57,149 52,581 19,706 16.464 2:;,117 21.3( 9,074 10,741 27,696 24.922 l' 4 17.386 25,4al 29.553 40.422 56,319 70.224 19,722 17.346 23,129 'l,~41l 8,731 9,799 27,714 29,754 1~10 16.678 26.690 22,816 31.697 44,7)4 62.049 20.101 18,731 23,381 21600 9,071 9.621 23,721 28.569 n'ti 18,737 22,098 26,473 26)796 51,240 (5,742 17,756 17,126 ~1,356 21,533 8.403 10,561 26,846 22,744
1I111 18,807 21.360 31.162 26,362 59,619 47,373 20,255 18,055 23.641 ~1,l:l55 9.349 10.243 30,227 22,135 1111 18,166 31.371 24.849 43,149 50,249 79,960 18,794 20,855 21,589 31.~48 8,&b3 14.110 24,0311 30.428 1<\19 !6,565 37.839 20,718 34,789 39.614 64,898 16.016 22.129 20,450 1.6,- 18 1,966 12.856 21.418 27,399 19~. 15.376 35,276 28,658 31,623 47.868 51.286 18,1!00 19.961 22.441 19,~~2 <l.056 11.600 23.020 21,683
C 1SlIS popul&tlon 1921 1.031,697 711.706 1.224,181 490,434 694,056 282,748 686,174
19~j 17,308 30,395 23.266 31,055 49.547 49.378 19,236 18,390 20,175 20,175 8,368 12,192 24,427 20,069 1.' 22 17.3~9 26,381 25,271 22,159 48,445 36.976 15,318 15.182 19.016 17.0·4 8,610 10,566 20,218 14.604 1923 18,212 25.834 28.226 21.630 b2,979 33,846 17,780 17.776 22.5a7 19,216 9,f86 9,426 24,686 17.910 19 4 19.666 31,881 25,042 21.683 52,386 33,905 17,932 15.683 20,906 20,!5!! U,463 10.196 20,693 16.174 1925 2U.346 35.195 29,956 25,709 59,812 39.076 19,600 17,043 19.914 17 ,701 9,539 9,184 27,949 20,002 19L. 18.199 37.376 20.3~2 22,791 18.591l 43,627 15.676 16,455 17,482 18,>1<.7 9,476 8,459 20,417 19,807 19007 16,H{) 36,82{} 23,046 20,931 50.596 62.669 11l.517 17.396 22,294 17,897 9,152 7.928 2.3,593 26,044 1V28 2J!.OOl 34,119 2!,595 21,690 53,237 37.041 18,326 17,629 22.308 18,627 10,336 8.894 23,OJ6 19,037 19'~9 22.781l '2.981 24,357 24,803 55.\)12 35,405 14.334 14.498 22.244 17.739 10,044 8,755 22,601 19,772 11lJO 23,151 31,135 20.234 24,409 48,938 40,481 13.848 14,279 21,016 17,749 9.997 8.837 19,011 22,245
Cenfu$ population 1931 1.140.862 721.907 1.370,677 523.977 739.160 319,635 720,440
III ,1 ? ;.477 30,562 25.603 23.954 51,563 38,286 15.b89 13.016 23,028 17.2,,8 11,7&4 8,985 22,124 21,630 l~,SJ :o4/~;; 30,011 23,81:18 22,410 50.878 3d,121 16,517 14,133 23,047 17,l:l71 11,462 9.728 21,649 15,635 19~ 26.04" 3),175 27.910 24.027 58.019 38,770 16.608 4,852 24.128 19.690 12,4~3 9,472 24,798 18,084 19,4 ~ 7""7 34,356 25,733 21,154 48.793 41.837 16,5g9 15.041 24 t 561 20.721 11,945 10,296 18,261 16,132 1935 20,338 84.093 29,562 18,905 54,392 30.204 16.421 14.120 24,854 19.1>8 12.8.9 10,397 24,557 14.587 lOf 30,4' 5 37.144 30,525 17.084 58.4~3 3S.~61 HI.812 16.246 25.4t4 ~1, ~g 12.4' 2 10,376 26.212 15,209 I' 2,,638 33.409 :31,026 21,305 60,516 35,980 15.929 16,840 25.:.147 ~ ,064 12,1:!8 10.775 26,739 15.063 H 28,2;6 35.556 24,396 :12,016 51.492 37,150 15.611 14.224 26,494 20,063 12,~33 10.441 19,128 14,547 1939 20,2~0 34,152 27.193 17,862 49.14 1>3,087 13,790 10,399 26.3t 21,478 12. "1i4 11,152 20,484 13,776 11)40 2'J,730 31.524 31.592 19,435 57,~ ·8 30,576 13,916 9,\':,69 24.346 19,180 11.489 11,11115 18.620 12.404
C usus popuJativu 1941 2,108,891 1:14.0,303 1,640,531) 583.4084 845,702 375,1\1}\) 844,315
1941 20,290 36.176 26.828 19,318 56,768 31,431 14.379 10,782 25,IlBO zO.4~9 11,308 10,717 16,219 11,221 1942 19.837 24.594 30,496 19,122 55,116 33,333 12.489 9.081 23.739 19.902 10,808 10.273 12.804 6,750 19~3 1\1,658 52,268 22,231'1 37.161 36,741 6:>,013 14.2_7 12.165 19.841 :6,804 11.688 11,258 10,237 11,641 111~4 21.931 52,B4[:' 17.546 28.186 29,12.; 56.916 14.636 19,~fio 16,116 27.~15 7,643 11,528 16,536 26,791 JP4' 27,728 41,Hn 24,141 23.931 44,426 48,617 12,897 15,3t.7 18,575 24,J07 10,297 10,938 18,818 20,571 1916 33.411 36,137 25,838 24.831 47.534 46.191 17,698 16,376 25.101 23,420 10.480 9,035 19.924 19.256 1947 33.2(,4 41.135 21,194 19.834 34.980 33.874 13,816 14.762 ~4.185 18.; 40 11,461 8,531 13.528 11,203 19 40 .... 42 4S.178 21,795 19,032 42,026 28.646 14,384 12,883 26;i>97 _8.167 11.318 8,754 20,379 12,181 1949 57,[·16 41,862 20.790 19,147 43,680 28,566 17,708 13.374 27.09~ 18.201 11.593 8,266 21,097 12,664 19" 48,203 52.196 17.595, 16,801 37,242 25,587 13,010 13.605 24.1\1l5 18.398 11,.:29 8,744 18,020 12,465
Cen.us popul"tlou 1951 2,548,f.77 1,144,024 1,715.769 72.0,573 914,638 4~6,260 937,680 N.B.-lIirth figures from Munlcipallty an town only for 1873, 11l74, 1878-1891. District birth figures are not C Jmph ,e f. r the year 1876 Figures are
not, ll.valluhle for t;l( ~ eaf 1871 as tht rep"rt Is missIng. Ilirth figures are nut aValiable for the year 1870 and 187~ dUt t· nOll-registration
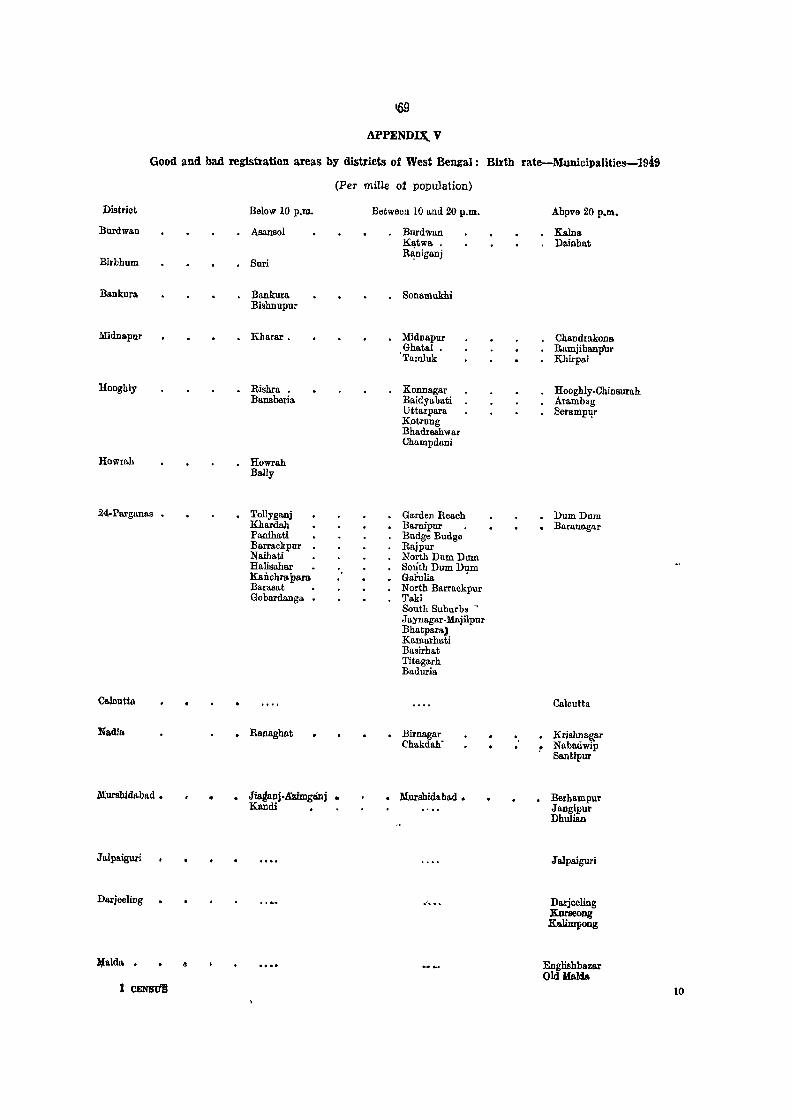
ArpEND~ V
Good and bad registration areas by districts of West Bengal: Birth rate-Municipalities-1949
(Per mine of population)
Distriot
Burdwan
Birbhum
Bankura
Midnapur
Hooghly
Howrah
24-Parganas •
Calcutta
Nadia
Murshidabad •
JaJpaiguri
Darjeelivg
~&lda •
1 CENSl111
Below 10 p.m.
Asansol
Suri
Bankura Bisbnupur
Kharar.
Rishra • Bansberia
Howrah Bally
Tollyganj Khardah Panihati Barrackpur Namati Halisahar Kanchra para Bara.sat • Gobardanga •
• Ranaghat
• Jiaganj.A'zimganj • Kandi
Between 10 and 20 p.m.
Burdwan Katwa. • R~niganj
• Sonamnkhi
Midnapur Ghatal .
'Tamluk
Konnagar Baidyabati Uttarpara Kotrung Bhadreshwar Champdani
Garden Reach Baruipur Budge Budge Raj pur North Dum Dum South Dum Dum GaruliB. ' North Barrackpur Taki South Suburbs ~ Jaynagar-MajiJpur Bhatpara) Kamarhati Basirhat Titagarh Baduria
, Birnagar Chakdah-
• Murshida bad •
"
Abpve 20 p.m.
KaIna Dainhat
Chandmkona Ramjibanpilr Khirpai
Hooghly·Chinsurah Arambag Serampqr
DumDum • Baranagar
Calcutta
• Krishnag,ar ! Nabadwip
Santipur
Berhampu'l' Jangipur Dhulian
Ja.lpaiguri
Da.rjceJing K1ll'Seong KaJimpong
Englishbazar Old Maida
10
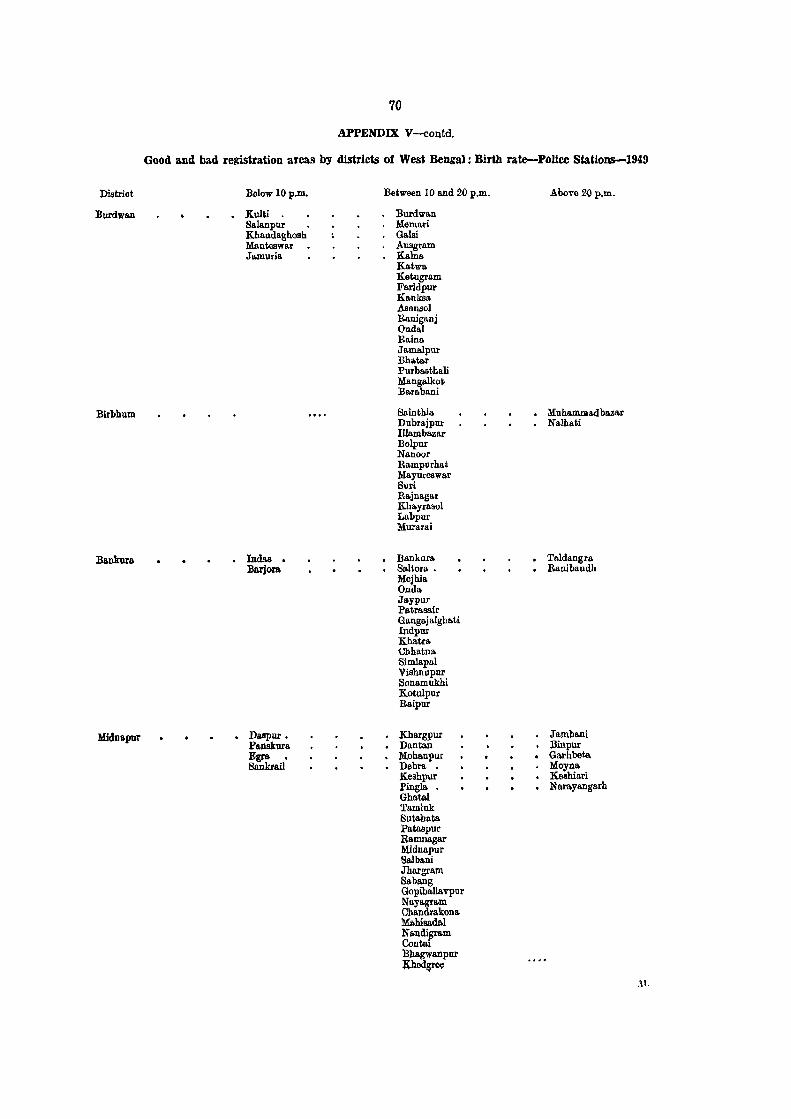
Distriot
Burdwa.n
Birbhum
Bankura
Midnapur
70
APPENDIX V-eontd.
Good and bad registration areas by districts of West Bengal: Birth rate-Police Stations-1949
Below 10 p.m.
Kulti Salanpur Khandaghosb Mantoowar Ja.muria
lnda.s • Barjora
Daspur • Panskura Egra • BanktaU
Between 10 a.nd 20 p.m.
Burdwan Memari Galsi Anagram KaIna Katwa Ketugram Faridpnr Kanksa Aeansol Raniganj Ondal Raina Jamalpur Bhat&r Pur baathali Manglillrot Barabani
Sainthia Dubrajpur Illambazar Bolpur Nanoor Rampurhat Mayureawar Surl Ra.jnagar Khayrasol Labpur MU1"arai
• Bankura Saltora • Mejhia. Onda Jaypur PQ.trasair Gangajalghati Indpur Kbatra Chhatna Simlapal Vishnupur Sonamukhi Kotulpur Raipur
• Khargpur Dantan
• Mobanpur Debra • Keshpur Pingla • GhataI Tamluk Butahate. Pataapur Ramnagar Midnapur SaJbani Jhargram Sabang Gopiballavpur Nayagram Chandrakona Mahisadal Nandigram Contai Bhagwanpur KbedglW
Above 20 p.m.
Muhamma.dbazar Nalhati
• Taldangra • Ranibaudh
Jamba.ni • Binpur • Garhbeta
Moyna. • Keahiari • Narayangarh
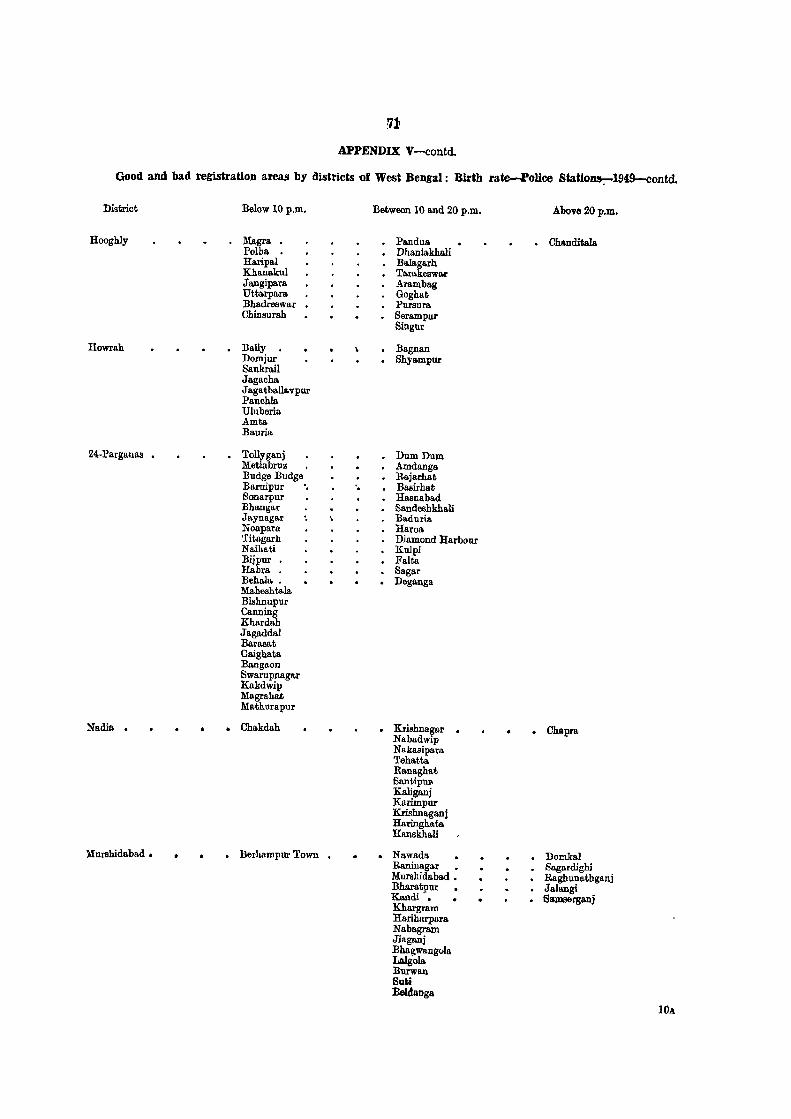
APPENDIX V--contd.
Good and bad registration areas by (listricts of West Bengal: Birth rate-Pollce StaHoJJSo:-1949-cOlltd.
District
Rooghly
Rowrah
24.Parganas ,
Nadia •
Murshidabad •
Below 10 p,m.
Magra • Polha • Raripal Kllanakul Jangipara Utta.rpara Bhadreswar Chinsurah
, Bally Domjur Sankrail Jagacha J agatballavpur Panchla Uluberia Amta Bauria
, Tollyganj Metiabruz Budge Budge Baruipur '. Sonarpur Bhangar Jaynagar Noapara Titagarh Naihati Bijpur • Habra. Beha.la. • Maheshtala Bishnupur Canning Khardah Jagaddal Barasat Ga.ighata Bangaon Swarupnagar Kakdwip Magrahat Mathurapur
• Chakdah
• Berhampur Town •
"
Between 10 and 20 p.m.
Pandua. Dhaniakha.li
• Ba.lagarh Tarakeswar Arambag Goghat Pursura Serampur Singur
, Bagnan • Sltya.mpur
DumDum Amdanga Rajarhat Basirhat Hasnabad Sandeshkhali Baduria Haroa Diamond Harbour Kulpi Falta Sagar
• Deganga
• Krishnagar • Nabadwip Nakasipara Tehatta. Ranaghat SantipUll Kaliganj Karimpur Krishnaganj Haringhato. Hanskha.li
• Nawada Raninagar • Murshidabad , Bharatpur Kandi • Khargram Hariharpara Nabagram Jiaganj Bhagwangl.lla Lalgola. Burwan BUA :Be1dPDga
Above 20 p.m.
• Chandita1a
• Chapra
• Domkal Sagardighi Raghunathganj Jalangi
• Samserganj
lOA
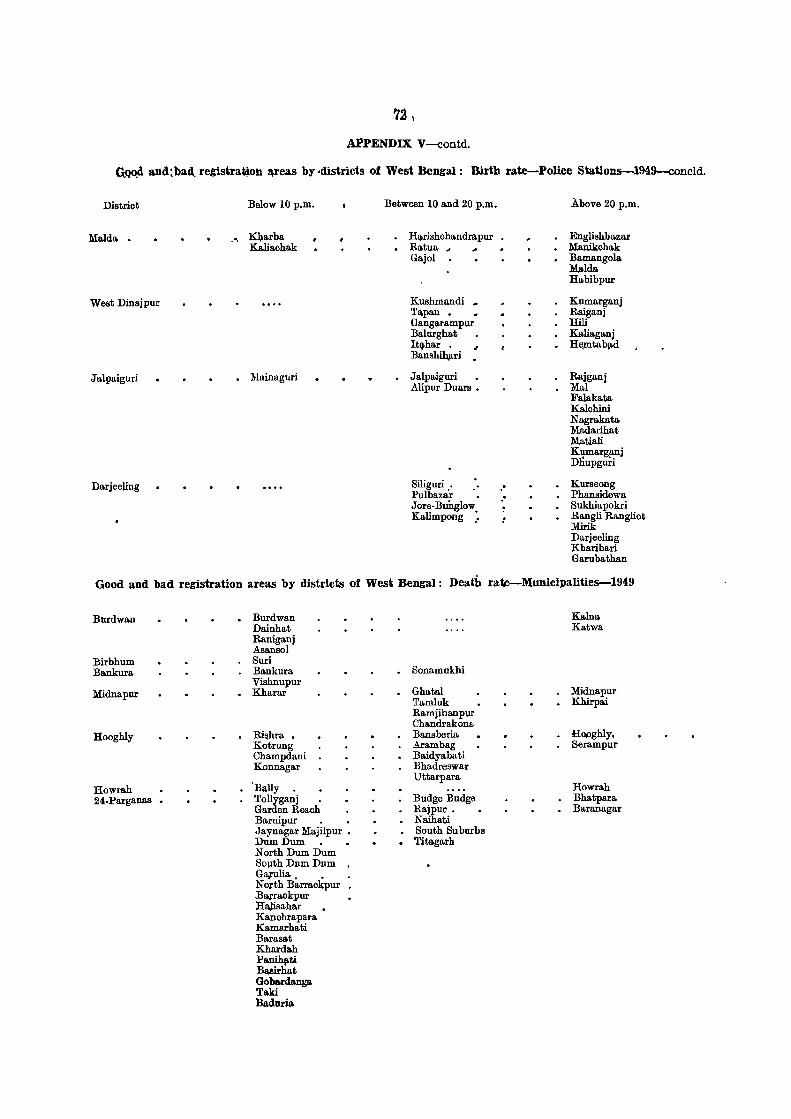
APPENDIX V-contd.
Qq~ and:bad.. registraijoh l\reas by ·districts of West Bengal: Birth rate-Police SbUons--1949-concld.
Distriot Below 10 p.m.
Malda. • "' Kharba. Kaliaohak
West Dinajpur
Jalpaiguri • Mainaguri
Darjeeling
Between 10 and 20 p.m.
Ha.rishohandrapur • Ratua. ..
Gajol
Kushmandi .. Tapan. .. Gangarampur Balurghat It~har. ~ Banshib"ari •
Jalpaiguri Alipur Duars •
Siliguri . Pulbazar • Jore-Bunglow Kalimpong ~
.'
.'
Above 20 p.m.
Englishbaza.r • Manikohak
Bamangola MaIda Habibpur
Kumarganj Raiganj Hili Kaliaganj He.mtabi\d
Rajganj Mal Falakata Kalohini Nagrakata Madarihat Matiali Kumarganj Dliupguii
Kurseong Phansidewa Sukhiapokri Rangli Rangliot Mirik Darjeeling Kharibari Garubathan
Good and bad registration areas by districts of West Bengal: Death rate-Municipalities-1949
Burdwan
Birbhum Bankura
Midnapur
Hooghly
Howrah 24-Parganas •
Burdwan Dainhat Raniganj Asansol Suri Bankura Vishnupur Kharar
Rishra • Kotrung Champdani Konnagar
"Bally . Tollyganj • Garden Reach Baruipur • Jaynagar M:ajilpur • DumDum • North Dum Dum SOjlth Dum Dum G8]'ulia. • NOl'th Barrackpur .Bal'fackpur Halisahar Kanchrapara Kamarhati Barasat Khardah Panihati Basirhat Gobardanga Taki Baduria
Sonamukhi
Ghatal Tamluk Ramjibanpur Chandrakona Bansberia Arambag Baidyabati Bhadreswar Uttarpara
Budge Budge Rajpur • Naihati South Suburbs
• 'l'i tagarh
Kalna Katwa
Midnapur Khirpai
HQIlghly. Serampur
Howrah Bhatpara Baranagar
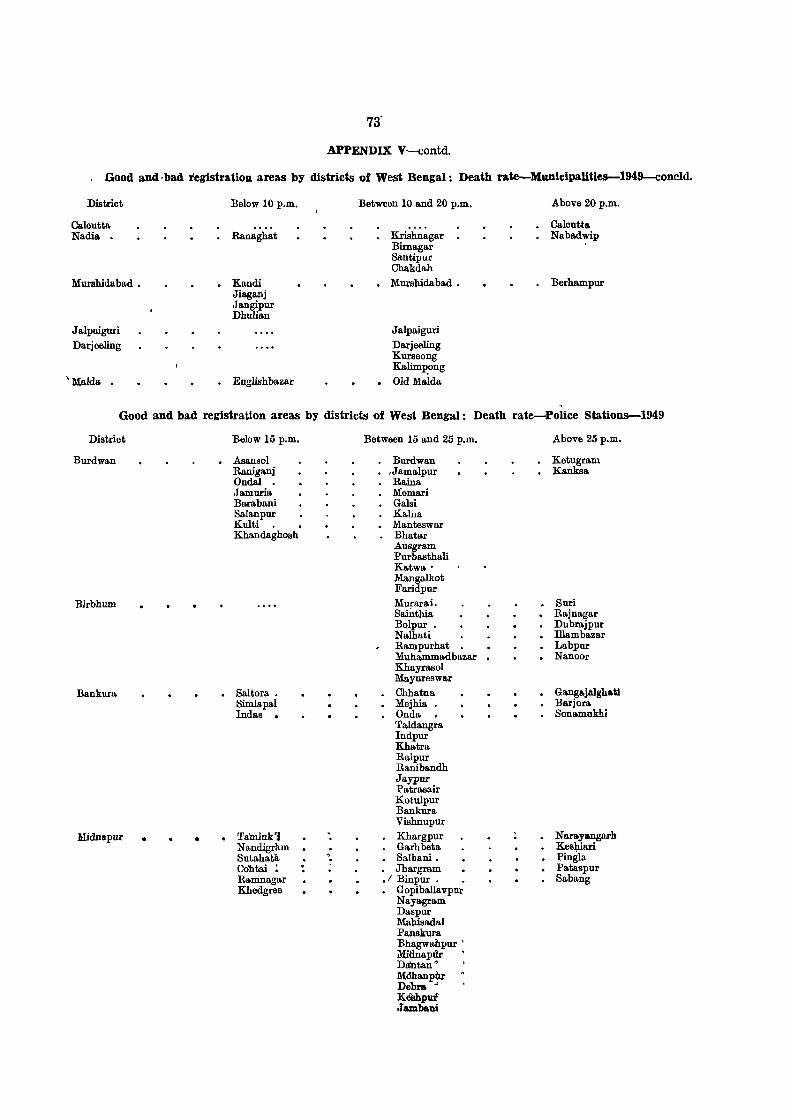
APPENDIX V-contd.
Good and·bad registration areas by districts of West Bengal: Death rate-Municipalltles-1949-concld.
District
Calcutta Nadia •
Murshidabad •
Jalpaiguri Darjeeling
'MaIda •
Below 10 p.m.
Ranaghat
• Kandi Jiaganj Jangipur Dhulian
• Englishbazar
Between 10 and 20 p.m.
Krishnagar Birnagar Santipur Chakdah Murshidabad •
Jalpaiguri Darjeeling Kurseong Kalimp_ong
• Old MaIda
Above 20 p.m.
Calcutta Nabadwip
Berhampur
Good and bad registration areas by districts of West Bengal: Death rate-Police Stations-1949
Distriot
Burdwan
Birbhum
Bankura
Midnapur • •
Below 15 p.m.
, Asansol Raniganj Ondal • Jamuria Barabani Salanpur Kulti . Khandaghosh
Saltora • Simlapal Indas •
Ta'mIuk~j Nandigram Sutahat1l. Cohtai ; Ramnagar Kbedgree
"
, , :
Between 15 and 25 p.m.
Burdwan ,Jamalpur Raina Memari Galsi Kalna Manteswar Bhatar Ausgram Purbasthali Katwa' Mangalkot Faridpur Murarai. Saillthia Bolpur • Nalhati Rampurhat • Muha=adbazar • Khayrasol Mayureswar Chhatna Mejhia . Onda • Taldangra Indpur Khatra Raipur Ranibandh Jaypur Patrasair Kotulpur Bankura Vishnupur Khargpur Garhbeta Salbani •
, Jhargram .1 Binpur . •
Gopiballavpur Nayagram Daspur Mahisadal Panskura Bhagwanpur ' Mitlnapdr ' D&:ntan· MdhanptJ.r Debra " Kil'shpui Jamba.ni
Above 25 p.m.
Ketugram Kanksa
Suri Rajnagar Dubrajpur Illambazar Labpur
• Nanoor
• Gangajalghati Barjora Sonamukhi
Narayangarb Kes\riari Pingla Pataspur Sabang
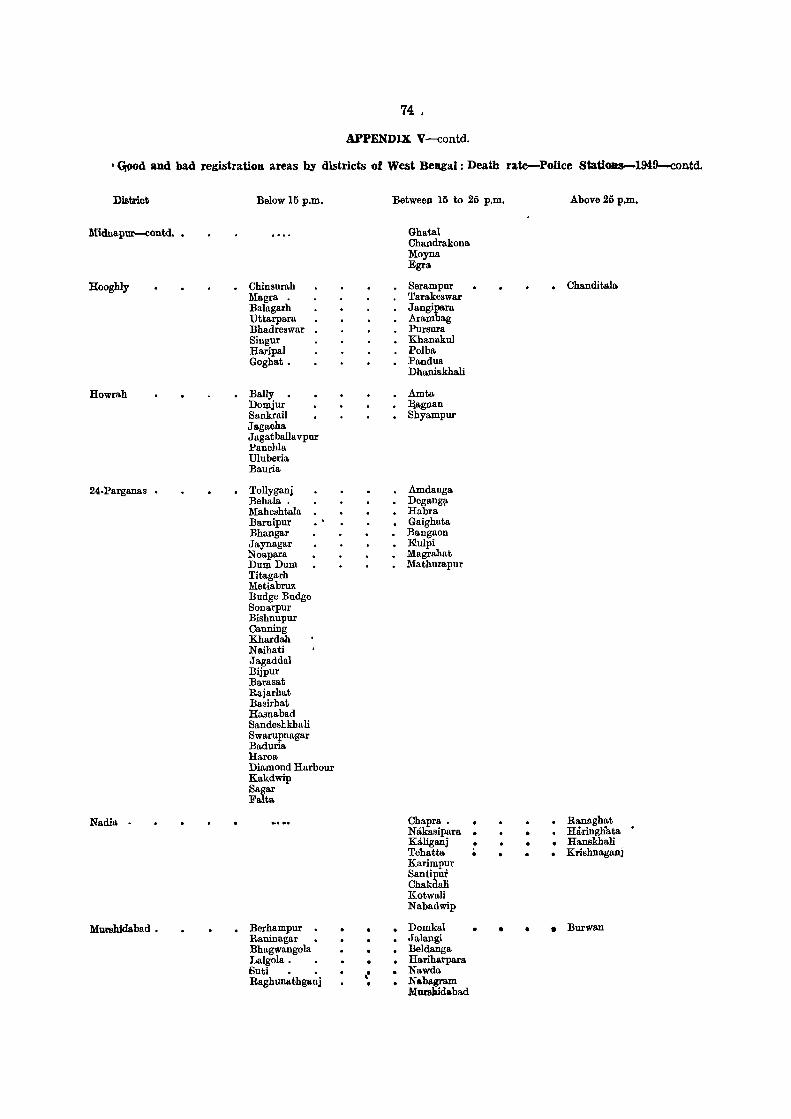
74 •
APPENDIX V-contd.
'~d and bad registration areas by districts of West Bengal; Death rate-Police StatiOllS-1949-contd.
District Below 15 p.m. Between 15 to 25 p.m. Above 25 p.m.
Midnapur-contd. Ghatal Chandrakona Moyna Egra
Hooghly Chinsurah Serampur · Chandi tala Magro. Tarakeswar Balagarh Jangipara Uttarpara Arambag Bhadreswar Pursura Singur Khanakul Haripal Polba Goghat. Pandua
Dhaniakhali
Howrah Bally Amta Domjur B.agnan Sankrail Shyampur Jagacha Jagatballavpur Panchla Uluberia Bauria
24.Parganas • . Tollyganj Amdanga Behala . Degang!l-Maheshtala Habra Baruipur Gaighata Bhangar · Bangaon Jaynagar · Rlulpi Noapara Magrahat DumDum Mathurapur Titagarh Metiabruz Budge Budge Sonarpur Bishnupur Canning Khardah Naihati Jagaddal Bijpur Barasat Rlj,jarhat Basirhat Hasnabad Sandeshkhali Swarupnagar Baduria Haroa Diamond Harbour Kakdwip Sagar Falte.
Nadia . Chapra . · Ranaghat Nakasipara • • Hiringh"ata Kaliganj • • Hanskhali Tehatta • · Krishnagan; Karimpur Santipur Chakdali Kotwali Nabadwip
Murshidabad • . Berhampur . · Domkal • • • • Burwan Ranina,gar · Jala,ngi Bhagwangola · Beldanga Lalgola. · Harihllrpara Suti ,. · Nawda Raghunathganj · Nabagram
Murshidllbad
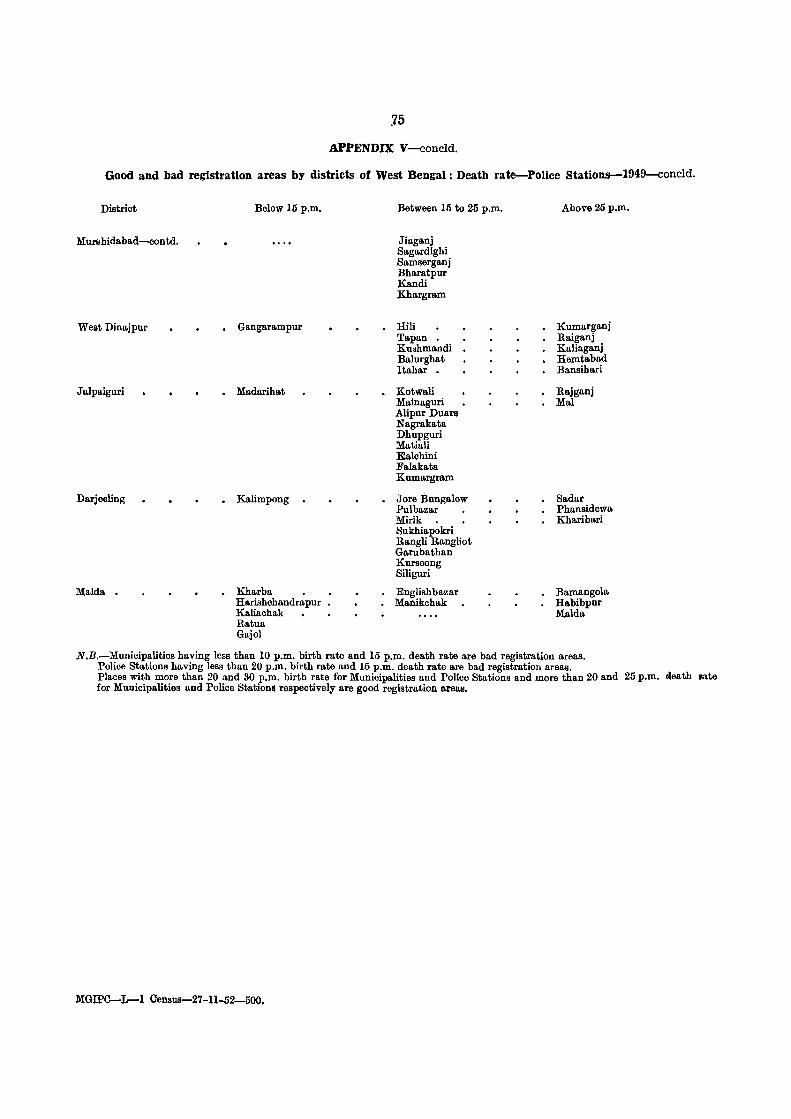
75
APPENDIX V-conc1d.
Good and bad registration areas by districts of West Bengal: Death rate-Police Stations-1949-concld.
District
Murshidabad-contd.
West Dinajpur
Jalpaiguri
Darjeeling
MaIda •
Below 15 p.m.
Gangarampur
• Madarihat
• Kalimpong
Kharba • Harishchandra pur Kaliachak Ratua Gajol
Between 15 to 25 p.m.
Jiaganj Sagardighi Samserganj Bharatpur Kandi Khargram
Hili Tapan • Kushmandi Balurghat Itahar •
Kotwali Mainaguri Alipur Duars Nagrakata Dhupguri Matiali Ealchini Falakata Kumargram
Jore Bungalow Pulbazar Mirik • Sukhiapokri Rangli Rangliot Gambathan Kurseong Siliguri
Englishbazar Manikchak
Above 25 p.m.
Kumarganj Raiganj Kaliaganj Hemtabad Bansihari
Rajganj Mal
Sadar Phansidewa Kharibari
Bamangola Habibpur MaIda
N.B.-Municipalities having less than 10 p.m. birth rate and 15 p.m. death rate are bad registration areas. Police Stations having less than 20 p.m. birth rate and 15 p.m. death rate are bad registration areas. Places with more than 20 and 30 p.m. birth rate for Municipalities and Police Stations and more than 20 and 25 p.m. oeath Bate for Municipalities and Police Station~ respectively are good registration areas.
MGIPC-L-l Census-27-11-52-500.