Embed Size (px)
Citation preview
ISSN(Online): 2319-8753 ISSN (Print): 2347-6710
International Journal of Innovative Research in Science, Engineering and Technology
(An ISO 3297: 2007 Certified Organization)
Vol. 5, Issue 6, June 2016
Copyright to IJIRSET DOI:10.15680/IJIRSET.2015.0506027 9694
Analytical Studies on Effect of Brick Elemental Properties on Static Pushover
Analysis of Multi-Storey Frame
Santhosh D., Sandhya Mohan P V, Sanjana Eric Fernandes, R. Prabhakara Assistant Professor, Department of Civil Engineering, M.S.Ramaiah Institute of Technology, Bangalore, Karnataka,
India
Student (8th semester), Department of Civil Engineering, M.S.Ramaiah Institute of Technology, Bangalore, Karnataka,
India
Student (8th semester), Department of Civil Engineering, M.S.Ramaiah Institute of Technology, Bangalore, Karnataka,
India
Head of Department, Department of Civil Engineering, M.S.Ramaiah Institute of Technology, Bangalore, Karnataka,
India
ABSTRACT: The current study deals with the analysis of the seismic behaviour of multi storey buildings and effect of brick elemental properties on static pushover analysis of multi storey frame. Three basic multi storey models were chosen- 5 storey, 10 storey and 15 storey buildings. Analysis was carried out considering both 2D and 3D frames. For each model, four types of brick elemental properties were further considered, which include- Shell, Membrane, Plate and Thick Plate. Also, analysis was done for different wall thickness in each case i.e.- 150mm and 230 mm. Static pushover analysis was done for the models using ETABS 9.7.4 and the Pushover curves were obtained. The study compared the results of seismic performance of multi storey frames for different brick elemental properties. Tables containing the results of pushover analysis, which included the number of hinge steps, displacement values, Base shear values, Collapse prevention, Immediateoccupancy, Life safety were obtained, for each case. The different results for different brick elemental properties and wall thickness were tabulated and compared. The primary objective of the study is to determine which brick elemental property is adequate and ideal comparatively. The comparison is based on the base shear value obtained for different cases, (maximum value ideal) and also the displacement values.
KEYWORDS: Pushover analysis, base shear, displacement, storey drift, Plastic hinges.
I. INTRODUCTION
Pushover Analysis predicts the structural response similar to that of the other 2 methods- response spectra and time history analysis since it incorporates p - Δ effects and material non linearity which is true in real structures. Performances of structures are normally predicted accurately by analysing carefully, the performance parameters obtained from pushover analysis results. The demand curve, capacity curve and the category of performance level it belongs to like Immediate occupancy, Life Safety or Collapse Prevention directly tells us if the structure is safe or about to collapse. Pushover analysis is a series of incremental static analysis carried out to develop a capacity curve for the building. This procedure needs the execution of a nonlinear static analysis of the structure that allows the monitoring of the

ISSN(Online): 2319-8753 ISSN (Print): 2347-6710
International Journal of Innovative Research in Science, Engineering and Technology
(An ISO 3297: 2007 Certified Organization)
Vol. 5, Issue 6, June 2016
Copyright to IJIRSET DOI:10.15680/IJIRSET.2015.0506027 9695
progressive yielding of the structure component. The building is subjected to a lateral load. The load magnitude increases until the building reaches the targeted displacement. This target displacement is determined to represent the top displacement when the building is subjected to design level ground excitation. Pushover analysis produces a pushover curve or capacity curve that presents the relationship between the base shear (V) and roof displacement (Δ). The Pushover curve depends on the strength and deformation capacities of the structure and describes how the structure behaves beyond the elastic limit Structural response to ground motion during earthquake cannot be accurately predicted because of the complexity of the structural properties and ground motion parameters. In pushover analysis, a set of lateral displacement is used directly as design condition. The displacement is an estimate of the maximum expected response of the structure during ground motion. The analysis is carried out upto failure, thus it enables determination of collapse load and ductility capacity. On a building frame, and plastic rotation is monitored, and lateral inelastic forces versus displacement response for the complete structure is analytically computed. This type of analysis enables weakness in the structure to be identified.
II. LITERATURE REVIEW
A large number of literatures available on the above topic were collected, systematically reviewed and some of the useful reviews are given here.Ms. Nivedita N. Raut & Ms. Swati D. Ambadkar [1] investigated the effect of the layout of masonry infill panels over the elevation of masonry in filled R/C frames on the seismic performance and potential seismic damage of the frame under strong ground motions using nonlinear static push-over analysis based on realistic and efficient computational models.They observed that the seismic performance of a masonry infill R/C adversely and significantly affected if the infill panels were discontinued in the ground story resulting in the structural configuration with an openstory, commonly termed as ‘weak’ story , at the ground levels.Madhusudan G. Kalibhat, Kiran Kamath, Prasad S. K, Ramya R. Pai [2] analysed a six storied steel building for different types of bracing system such as concentric (crossed X) bracing and eccentric (V-type) bracing using HSS sections. They observed that that steel frames with insufficient lateral stiffness can be retrofitted with braces. Braces are the viable solutions to provide both global lateral stiffness and strength of the frame. The provision of bracing enhances the base shear carrying capacity of frames and reduces roof displacement undergone by the structures.[2]S. I. Khan, Prof. P. O. Modani [12] studied the variation of load-displacement graph and checked the maximum base shear and displacement of RC frame using SAP 2000.
III. MODELLING AND ANALYSIS
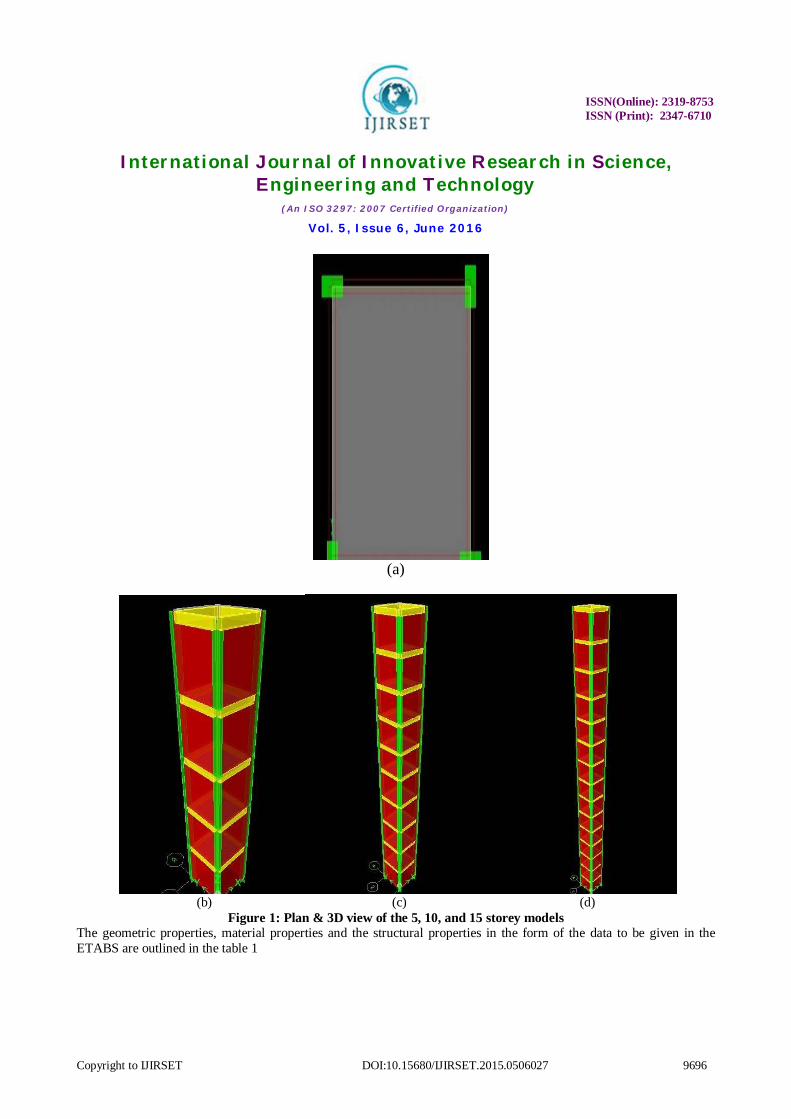
Scope of present work After understanding the literature, the objectives of the present investigation were carved. Analysis of the 3D models of the 5, 10 and 15 storey model for wall thickness of 200mm and 230mmlocated in zone 2 has been performed and overall seismic evaluation of the structures were carried out using the performance parameters obtained from the Pushover analysis using the software ETABS 9.7.4 for the cases given below: CASE 1: Brick infill as SHELL element CASE 2: Brick infill as MEMBRANE element CASE 3: Brick infill as PLATE element CASE 4: Brick infill as THICK PLATE element Structural details and material properties In the present study, 5,10 and 15 storey model with plan area 3m x 3m was considered. The typical floor height was taken as 3m giving a total height of the structure 15m, 30m and 45m respectively. Two cases of 150mm and 230mm wall thickness were considered. The beams, columns were assumed as concrete structure and the wall as brick masonry. The Plan & 3D view of RC frame with brick masonry walls of all the three models has been shown in the figure 1(a) and figure 1(b), 1(c) and 1(d) respectively.
ISSN(Online): 2319-8753 ISSN (Print): 2347-6710
International Journal of Innovative Research in Science, Engineering and Technology
(An ISO 3297: 2007 Certified Organization)
Vol. 5, Issue 6, June 2016
Copyright to IJIRSET DOI:10.15680/IJIRSET.2015.0506027 9696
(a)
(b) (c) (d)
Figure 1: Plan & 3D view of the 5, 10, and 15 storey models The geometric properties, material properties and the structural properties in the form of the data to be given in the ETABS are outlined in the table 1

ISSN(Online): 2319-8753 ISSN (Print): 2347-6710
International Journal of Innovative Research in Science, Engineering and Technology
(An ISO 3297: 2007 Certified Organization)
Vol. 5, Issue 6, June 2016
Copyright to IJIRSET DOI:10.15680/IJIRSET.2015.0506027 9697
Table 1: Geometric properties, Material properties and the Structural properties assigned to the models Spacing
In X-direction 3m
In Y-direction 3m
Support condition Fixed
Conventional Slab thickness 150mm
Infill wall thickness 200mm and 230mm
Column size 230mm*450mm
Beam size 230mm*450mm
Grade of concrete M25
Grade of steel Fe415
Modulus of elasticity of M25 25000000kN/m2
Poisson’s ratio 0.2
Coefficient of thermal expansion 9.900E-06
Shear modulus 10416666.7 kN/m2
Modelling and Analysis Modelling is an important stage in the analysis of multi storied buildings. The steps followed in modelling the structure are listed below: 1. Creating the basic computer model (without the pushover data) 2. Choosing the concrete frame design code preference. 3. Defining material properties 4. Evaluation of the sectional properties of the beams, columns, slabs using trial runs. 5. Positioning of the beams, columns, slabs and Infill walls. 6. Assigning boundary conditions- In all the models, base was considered to be fixed support. 7. Defining the static load cases- Dead load, live load, and seismic loadings as per IS 1893-2002 were considered. In order to have a realistic analysis, the structural properties and model details were arrived based on the previous literatures and is given in the table 2. User defined time period, seismic coefficients, factors and storey ranges were input in to the software. 8. Defining mass source as per IS 1893(Part 1): 2002
Table 2: Structural properties and Model details
Seismic details conforming to IS 1893(Part 1): 2002 Zone factor 0.1
Importance factor 1 Type of soil Type II (Medium
Reduction Factor 3
ISSN(Online): 2319-8753 ISSN (Print): 2347-6710
International Journal of Innovative Research in Science, Engineering and Technology
(An ISO 3297: 2007 Certified Organization)
Vol. 5, Issue 6, June 2016
Copyright to IJIRSET DOI:10.15680/IJIRSET.2015.0506027 9698
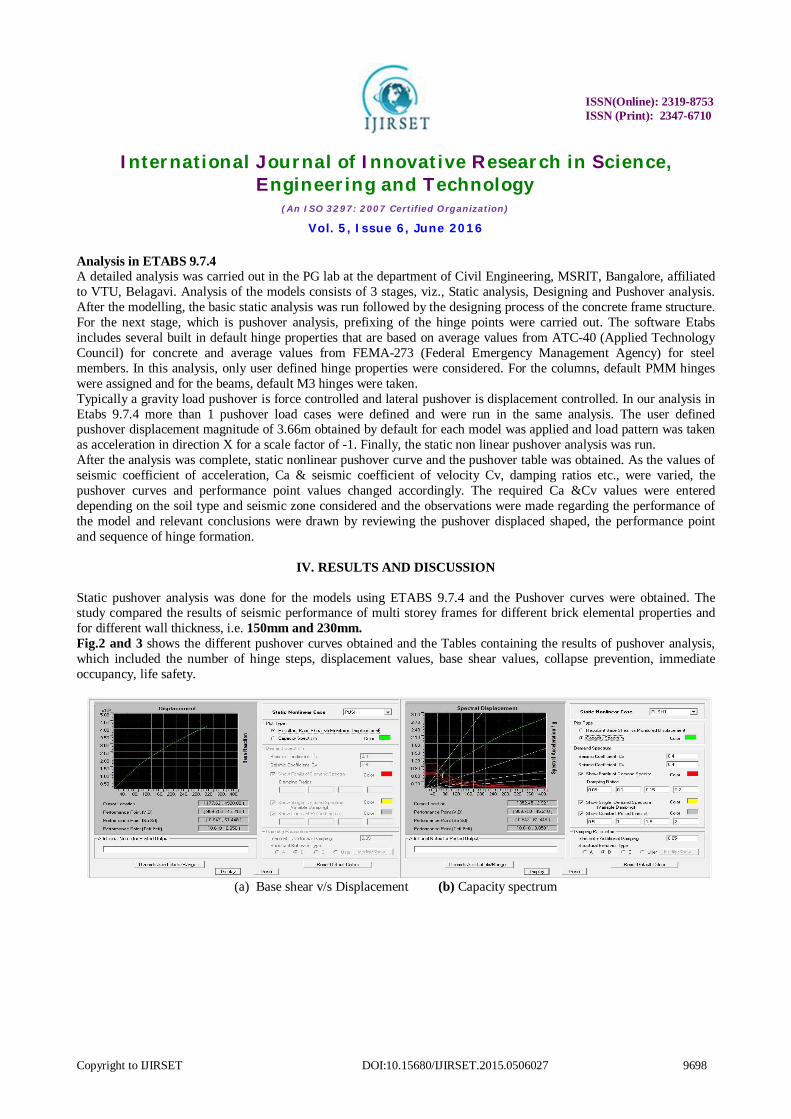
Analysis in ETABS 9.7.4 A detailed analysis was carried out in the PG lab at the department of Civil Engineering, MSRIT, Bangalore, affiliated to VTU, Belagavi. Analysis of the models consists of 3 stages, viz., Static analysis, Designing and Pushover analysis. After the modelling, the basic static analysis was run followed by the designing process of the concrete frame structure. For the next stage, which is pushover analysis, prefixing of the hinge points were carried out. The software Etabs includes several built in default hinge properties that are based on average values from ATC-40 (Applied Technology Council) for concrete and average values from FEMA-273 (Federal Emergency Management Agency) for steel members. In this analysis, only user defined hinge properties were considered. For the columns, default PMM hinges were assigned and for the beams, default M3 hinges were taken. Typically a gravity load pushover is force controlled and lateral pushover is displacement controlled. In our analysis in Etabs 9.7.4 more than 1 pushover load cases were defined and were run in the same analysis. The user defined pushover displacement magnitude of 3.66m obtained by default for each model was applied and load pattern was taken as acceleration in direction X for a scale factor of -1. Finally, the static non linear pushover analysis was run. After the analysis was complete, static nonlinear pushover curve and the pushover table was obtained. As the values of seismic coefficient of acceleration, Ca & seismic coefficient of velocity Cv, damping ratios etc., were varied, the pushover curves and performance point values changed accordingly. The required Ca &Cv values were entered depending on the soil type and seismic zone considered and the observations were made regarding the performance of the model and relevant conclusions were drawn by reviewing the pushover displaced shaped, the performance point and sequence of hinge formation.
IV. RESULTS AND DISCUSSION
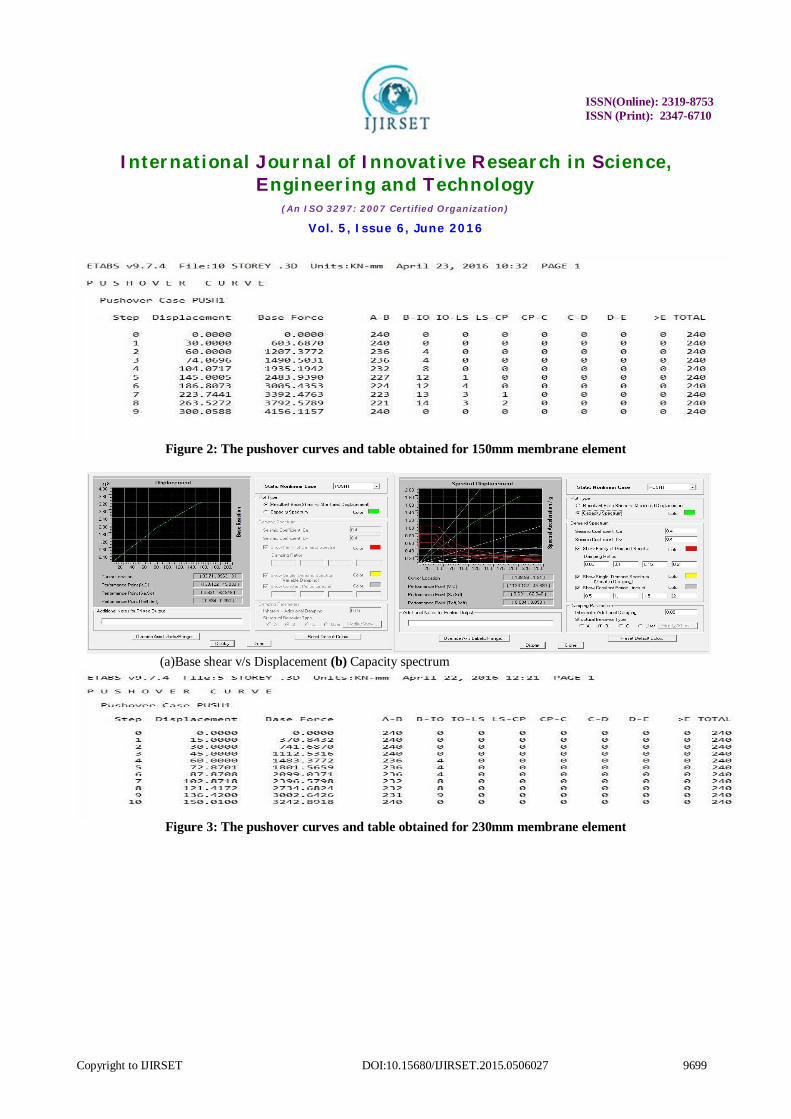
Static pushover analysis was done for the models using ETABS 9.7.4 and the Pushover curves were obtained. The study compared the results of seismic performance of multi storey frames for different brick elemental properties and for different wall thickness, i.e. 150mm and 230mm. Fig.2 and 3 shows the different pushover curves obtained and the Tables containing the results of pushover analysis, which included the number of hinge steps, displacement values, base shear values, collapse prevention, immediate occupancy, life safety.
(a) Base shear v/s Displacement (b) Capacity spectrum
ISSN(Online): 2319-8753 ISSN (Print): 2347-6710
International Journal of Innovative Research in Science, Engineering and Technology
(An ISO 3297: 2007 Certified Organization)
Vol. 5, Issue 6, June 2016
Copyright to IJIRSET DOI:10.15680/IJIRSET.2015.0506027 9699
Figure 2: The pushover curves and table obtained for 150mm membrane element
(a)Base shear v/s Displacement (b) Capacity spectrum
Figure 3: The pushover curves and table obtained for 230mm membrane element
ISSN(Online): 2319-8753 ISSN (Print): 2347-6710
International Journal of Innovative Research in Science, Engineering and Technology
(An ISO 3297: 2007 Certified Organization)
Vol. 5, Issue 6, June 2016
Copyright to IJIRSET DOI:10.15680/IJIRSET.2015.0506027 9700
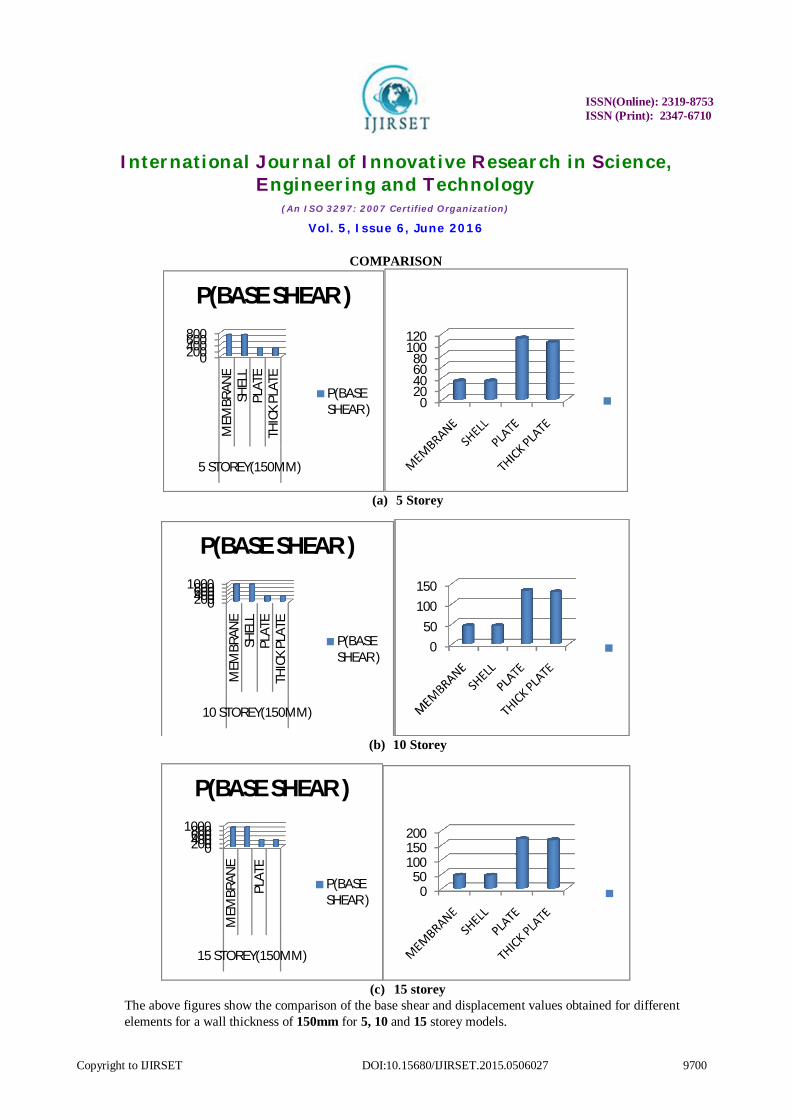
COMPARISON
(a) 5 Storey
(b) 10 Storey
(c) 15 storey
The above figures show the comparison of the base shear and displacement values obtained for different elements for a wall thickness of 150mm for 5, 10 and 15 storey models.
0200400600800
MEM
BRAN
ESH
ELL
PLAT
ETH
ICK
PLAT
E
5 STOREY(150MM)
P(BASE SHEAR )
P(BASE SHEAR ) 0
20406080
100120
02004006008001000
MEM
BRAN
ESH
ELL
PLAT
ETH
ICK
PLAT
E
10 STOREY(150MM)
P(BASE SHEAR )
P(BASE SHEAR )
050
100150
02004006008001000
MEM
BRAN
E
PLAT
E
15 STOREY(150MM)
P(BASE SHEAR )
P(BASE SHEAR )
050
100150200
ISSN(Online): 2319-8753 ISSN (Print): 2347-6710
International Journal of Innovative Research in Science, Engineering and Technology
(An ISO 3297: 2007 Certified Organization)
Vol. 5, Issue 6, June 2016
Copyright to IJIRSET DOI:10.15680/IJIRSET.2015.0506027 9701
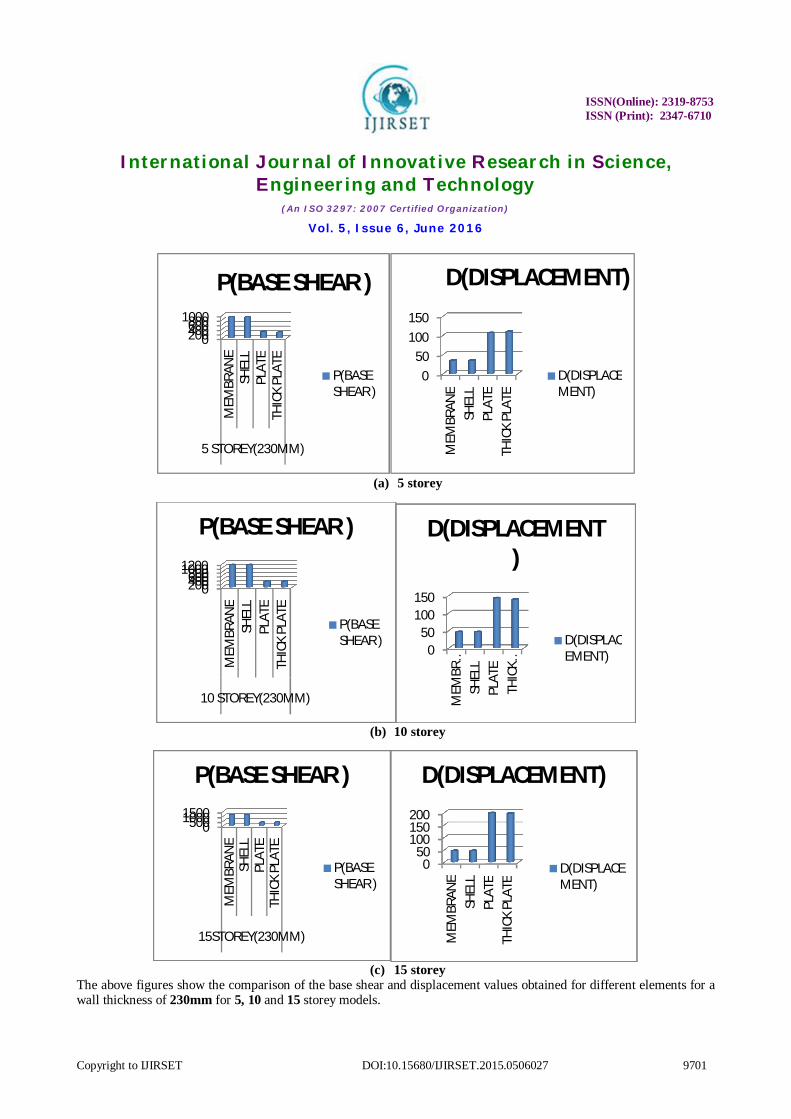
(a) 5 storey
(b) 10 storey
(c) 15 storey
The above figures show the comparison of the base shear and displacement values obtained for different elements for a wall thickness of 230mm for 5, 10 and 15 storey models.
02004006008001000
MEM
BRAN
ESH
ELL
PLAT
ETH
ICK
PLAT
E
5 STOREY(230MM)
P(BASE SHEAR )
P(BASE SHEAR )
050
100150
MEM
BRAN
ESH
ELL
PLAT
ETH
ICK
PLAT
E
D(DISPLACEMENT)
D(DISPLACEMENT)
020040060080010001200
MEM
BRAN
ESH
ELL
PLAT
ETH
ICK
PLAT
E
10 STOREY(230MM)
P(BASE SHEAR )
P(BASE SHEAR )
050
100150
MEM
BR…
SHEL
LPL
ATE
THIC
K …D(DISPLACEMENT
)
D(DISPLACEMENT)
050010001500
MEM
BRAN
ESH
ELL
PLAT
ETH
ICK
PLAT
E
15STOREY(230MM)
P(BASE SHEAR )
P(BASE SHEAR )
050
100150200
MEM
BRAN
ESH
ELL
PLAT
ETH
ICK
PLAT
E
D(DISPLACEMENT)
D(DISPLACEMENT)
ISSN(Online): 2319-8753 ISSN (Print): 2347-6710
International Journal of Innovative Research in Science, Engineering and Technology
(An ISO 3297: 2007 Certified Organization)
Vol. 5, Issue 6, June 2016
Copyright to IJIRSET DOI:10.15680/IJIRSET.2015.0506027 9702
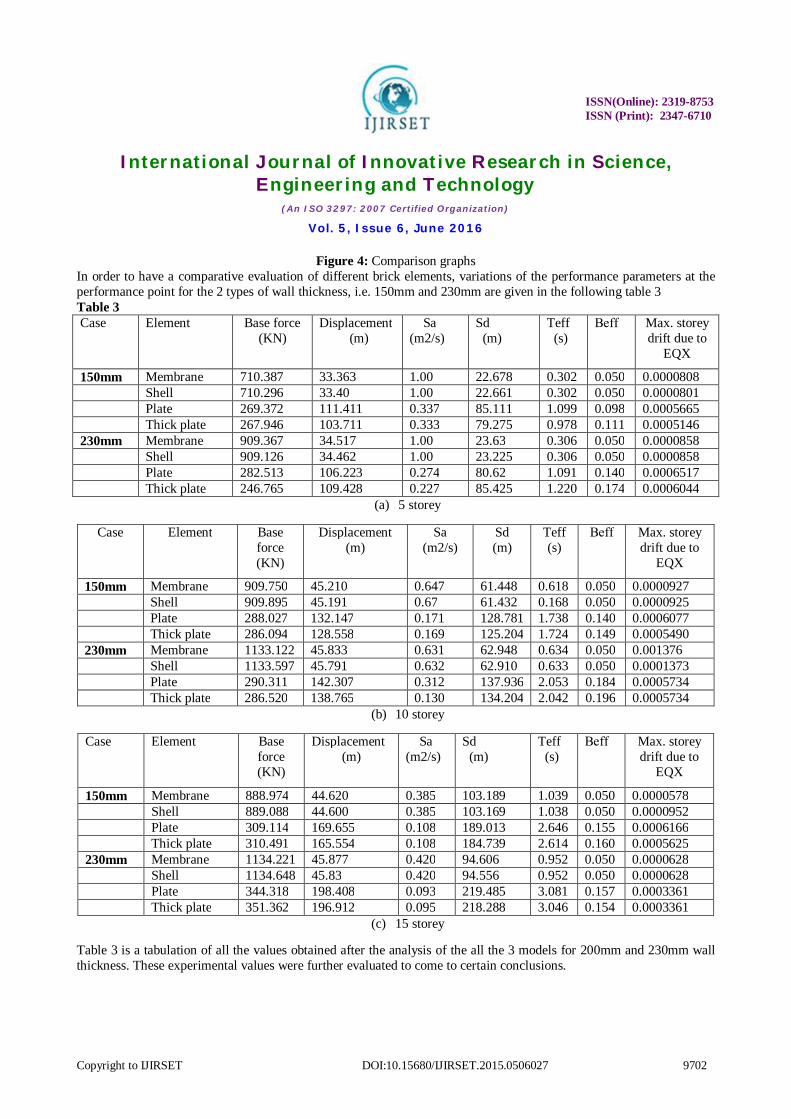
Figure 4: Comparison graphs In order to have a comparative evaluation of different brick elements, variations of the performance parameters at the performance point for the 2 types of wall thickness, i.e. 150mm and 230mm are given in the following table 3 Table 3 Case Element Base force
(KN) Displacement (m)
Sa (m2/s)
Sd (m)
Teff (s)
Βeff
Max. storey drift due to
EQX
150mm Membrane 710.387 33.363 1.00 22.678 0.302 0.050 0.0000808 Shell 710.296 33.40 1.00 22.661 0.302 0.050 0.0000801 Plate 269.372 111.411 0.337 85.111 1.099 0.098 0.0005665 Thick plate 267.946 103.711 0.333 79.275 0.978 0.111 0.0005146 230mm Membrane 909.367 34.517 1.00 23.63 0.306 0.050 0.0000858 Shell 909.126 34.462 1.00 23.225 0.306 0.050 0.0000858 Plate 282.513 106.223 0.274 80.62 1.091 0.140 0.0006517 Thick plate 246.765 109.428 0.227 85.425 1.220 0.174 0.0006044
(a) 5 storey
Case Element Base force (KN)
Displacement (m)
Sa (m2/s)
Sd (m)
Teff (s)
Βeff
Max. storey drift due to
EQX
150mm Membrane 909.750 45.210 0.647 61.448 0.618 0.050 0.0000927 Shell 909.895 45.191 0.67 61.432 0.168 0.050 0.0000925 Plate 288.027 132.147 0.171 128.781 1.738 0.140 0.0006077 Thick plate 286.094 128.558 0.169 125.204 1.724 0.149 0.0005490 230mm Membrane 1133.122 45.833 0.631 62.948 0.634 0.050 0.001376 Shell 1133.597 45.791 0.632 62.910 0.633 0.050 0.0001373 Plate 290.311 142.307 0.312 137.936 2.053 0.184 0.0005734 Thick plate 286.520 138.765 0.130 134.204 2.042 0.196 0.0005734
(b) 10 storey
Case Element Base force (KN)
Displacement (m)
Sa (m2/s)
Sd (m)
Teff (s)
Βeff
Max. storey drift due to
EQX
150mm Membrane 888.974 44.620 0.385 103.189 1.039 0.050 0.0000578 Shell 889.088 44.600 0.385 103.169 1.038 0.050 0.0000952 Plate 309.114 169.655 0.108 189.013 2.646 0.155 0.0006166 Thick plate 310.491 165.554 0.108 184.739 2.614 0.160 0.0005625 230mm Membrane 1134.221 45.877 0.420 94.606 0.952 0.050 0.0000628 Shell 1134.648 45.83 0.420 94.556 0.952 0.050 0.0000628 Plate 344.318 198.408 0.093 219.485 3.081 0.157 0.0003361 Thick plate 351.362 196.912 0.095 218.288 3.046 0.154 0.0003361
(c) 15 storey
Table 3 is a tabulation of all the values obtained after the analysis of the all the 3 models for 200mm and 230mm wall thickness. These experimental values were further evaluated to come to certain conclusions.
ISSN(Online): 2319-8753 ISSN (Print): 2347-6710
International Journal of Innovative Research in Science, Engineering and Technology
(An ISO 3297: 2007 Certified Organization)
Vol. 5, Issue 6, June 2016
Copyright to IJIRSET DOI:10.15680/IJIRSET.2015.0506027 9703
V. CONCLUSION
From the comparison of results, using Shell element as the brick elemental property gave the maximum value of Base shear and least values of displacement.Hence, shell element is comparatively ideal.
As the number of storeys were increased, there was a constant increase in the Base shear and Displacement values.
Using Plate and Thick Plate as brick elemental property gave smaller values of Base shear and hence is comparitively inadequate.
Pushover analysis is non-linear static analysis in which there are good reasons for advocating the use for demand prediction since in many cases it will provide much more relevant information that an elastic static or even dynamic analysis, but it would be counterproductive to advocate this method as a general solution technique for all cases.
Pushover analysis is a useful tool for assessing inelastic strength and deformation demands and for exposing design weaknesses.
The results of the nonlinear static pushover analysis quantitatively establish that the seismic performance of masonry infill R/C adversely and significantly affected with varying thickness.
ACKNOWLEDGEMENT
We sincerely thank management, CE, Principal and Head of Department of M.S.Ramaiah Institute of
Technology, Bangalore-560054, affiliated to VTU, Belgaum for all the technical guidance.
REFERENCES [1] Sahana Ponnamma T.D, Santhosh D.2, R. Prabhakar, (2015)-Comparative Study of Pushover Analysis of the Conventional Slab System with Outrigger and Flat Slab System with Outrigger-Vol. 4, Issue 8, August 2015. [2] D. Santhosh, (2014)- “Pushover analysis of RC frame structure using ETABS 9.7.1”, IOSR Journal of Mechanical and Civil Engineering, ISSN: 22781684, Volume 11, Issue 1 Ver. V, Feb. 2014. [3] Dr. Rehan A Khan (2014)- Performance based Seismic design of Reinforced Concrete Building- International Journal of Innovative Research in Science, Engineering and Technology-Vol.3,Issue 6,June 2014. [4] Tarek M Alguhane(2015)-Seismic Assessment of Old Existing RC Buildings with Masonry Infill in Madinah as per ASCE- Vol 9, No.1, 2015. [5] Ms.Nivedita N Raut & Ms. Swati D. Ambadkar(2013)-Pushover Analysis of Multistoried Building- Vol 13, Issue 4, Version 1, 2013. [6] Riza Ainul Hakeem ,Mohammed Sohaib,Samir A.Ashour (2014)-Seismic Assessment of an RC Building using Pushover Analysis-Vol 4, No 3, 2014. [7] Kiran Kamath, N. Divya and Asha U. Rao (2012) “A Study on Static and Dynamic Behaviour of Outrigger Structural System for Tall Buildings”, Bonfring International Journal of Industrial Engineering and Management Science, Vol. 2, No. 4, December 2012. [8] Mrugesh D. Shah and Sumant B. Patel (2011)- “ Nonlinear static analysis of R.C.C. frames (software implementation ETABS 9.7)”, National conference on recent trends in engineering & technology, B.V.M. Engineering college, V.V. Nagar, Gujrarat, India, May 2011 [9] Santhosh. D.and N. Jayaramappa (2014) “Nonlinear static analysis of RC frame structures”, IOSR journal of mechanical and civil engineering, ISSN: 2278-1684Vol. 11, Issue 02, Ver 2., pp 78-89 March april-2014. [10] Srividya, Kalayani Rao, Kavya and R. Prabhakara, “Cracking Load and Deflection of Infilled Frames Using Pushover Analyses”, Proceedings of international conferences on advances in Architecture and civil engineering, Vol.1, Paper ID sam209, June 2012