Embed Size (px)
Citation preview

Vol.8 August 2007● Annual Report of COE Research Projects ……………… 1● Report on the COE International Advanced School on “Wind Effects on Buildings and the Urban Environment” (COE-IAS2) ……………………………………………………… 8
● HKPU-TPU Workshop “Wind Effects on Structures and Urban Environment” ……………………………………………10
● Aerodynamic database of low-rise buildings Yong Quan ………………………………………………………12● Theoretical maxima for random load effects for buildings S.Nadaraja Pillai …………………………………………………13● Wind-speed profiles in tropical cyclones Le Truong Giang …………………………………………………14● Announcement ………………………………………………16
INDEX

August 2007 Page
Project 1: Wind Hazard MitigationDesign wind speeds
As part of our research on design wind speeds in Asia-Pacific region, we studied on vertical profiles of wind speeds under typhoon conditions. A wide range of observed wind speed records were collected both inside and outside the eye-walls of hurricanes. The gradient height in the eye wall region was reported to be around 500 - 700 m, which was lower than that in the outer vortex region. For our study on design wind speeds in Asia region, we analyzed wind speed records from Vietnam. Separate studies were conducted for typhoon and non-typhoon conditions. Meteorological data and information on wind induced damage in Asian countries were then shown on the COE website.
Development of universal equivalent static wind load distribution
The universal equivalent static wind load (hereafter referred to as the universal ESWL) that reproduces maximum load effect on all structural members of a large-span cantilevered roof was investigated. It was important to consider not only the background component but also the resonant component of response. Response analysis was conducted for a cantilevered truss roof. Roof mass was assumed to be 160 kg/m2, stiffness was determined as
1/300 of the span, and structural damping was assumed to be 1% for all eigen modes. The power spectral density of response axial force is shown in Figure 2 as an example. The contributions of structural members to resonant response component were different. Representative methods for estimating the ESWL were basically aimed
difficult to reproduce all maximum load effects on all structural members. Figure 3 shows the universal ESWL that reproduced the maximum axial force including the resonant component of response, and Figure 4 compares the largest axial force reproduced by the universal ESWL with the actual largest axial force. Universal ESWL showed a comparatively smooth distribution. The largest axial force reproduced by the universal ESWL showed high correlation with the actual largest axial force. It was
truss roofs including a resonant response component.
Annual Report of COE Research Projects
-3-3-3
-3
-2
-2-2
-2
-1
-1-1
-1-100
1Fixed end
Wind
Figure 1. Mean wind speed profiles (normalized by U10 wind speed) for eye wall winds and outer vortex winds (reproduced from Fig.1 (Powell et al., 2003) and Fig.9 (Franklin et al., 2000))
Figure 2. Power spectrum density of axial force
Figure 3. Universal ESWL Figure 4. Comparison of actual largest axial force and largest axial force reproduced by universal ESWL

August 2007 Page
Integrity Monitoring for wind-induced response of buildings using GPS technology
Based on the original plan, a hybrid system was made using GPS displacement and FEM analysis to estimate the
steel tower during a strong typhoon. The tip displacement obtained by GPS could be easily converted into member stresses based on the FEM analysis and the member stresses could be monitored in real time for integrity monitoring.
To transmit the information of the structure’s response, the real time monitoring system for displacement records obtained by GPS were put on the website of COE. This system contains 4 pages. Using this WEB system, people can not only monitor the building’s response but also download the data.
Wind load combinationTo determine wind load combination, the effects of
wind directions on combination factors were investigated from the viewpoint of axial forces on the columns for various aspect ratios of modeled objects. Results were reported on variations of correlation factors for different wind directions, differences between cases considering only quasi-static components and cases including resonant components. The effects of aspect ratio and side ratio were also studied.
Wind resistant design for low-rise buildings, wind resistant construction method considering practical situations in APEC countries
For our research on conventional construction systems that reflect supply conditions in individual countries, textbooks were collected from universities and technical colleges on building construction, and information was obtained on conventional construction systems for pitched roofs in each country. Books were collected on traditional construction systems, and information was obtained from overseas students on pitched roof systems. Research was conducted on climate data of wind speeds, especially combined with rainfall, frequencies of 10-minute averaged wind speeds and rainfall for every one or 6 hours (except for Japanese data), and their joint probability in each city.
Scenarios on wind induced damage among groups of buildings based on site investigations
A continuous study was conducted on scenarios of wind induced damage to groups of buildings based on site investigations carried just after the occurrence of
10 of them approached Japan and 2 of them landed. Typhoon 0713 caused huge damage in the Kyushu area and accompanying this typhoon was a tornado, which caused serious damage in Nobeoka, Miyazaki-Prefecture, including three deaths and overturned railway
Figure 5. Outline of GPS real time monitoring system

August 2007 Page
cars. Disasters induced by tornado and other gusts were also reported in Tokorozawa, Fujisawa and Saroma. The tornado in Saroma, Hokkaido caused nine deaths. Through these investigations, important items for mitigation of wind damage to buildings and urban environments were identified. These were countermeasures to flying debris, design of claddings, sudden increase in internal building pressures and subsequent accidents, design concept of temporal structures, and evaluation of crossing rate of line-like facilities such as railroads. These reminded us of the importance of prediction or forecasting, in order to protect human lives against gust disasters. Recommendations were announced by the program leader and accompanying members. Furthermore, contributing factors, climates, and observation records were studied for past wind induced disasters based on existing materials
agencies and academic societies.
Aerodynamic DatabaseAn aerodynamic database was developed that will
be available for wind resistant design of structural frames and claddings anywhere in the world. Several series of wind tunnel experiments were carried on low-rise buildings with flat, gable and hipped roofs. The aerodynamic characteristics were added to the database. 812 experiments have been conducted on 116 different models and they have been released on the COE website.
Project 2: Design Method for Natural/Cross-Ventilation
Natural ventilation is an energy-efficient technology that is being adopted to reduce energy consumption for heating and cooling of buildings. In order to effectively promote the utilization of cross-ventilation, it is important to establish a high-precision model for predicting
guideline for a cross-ventilation design method. The aim of research project 2 is to propose a guideline
for a cross-ventilation design method. The research is being performed by Dr. Tomonobu Goto and Dr. Cheng-Hu Hu as COE researchers, and Dr. Yukari Iino as a cooperative researcher under the leadership of Professor Masaaki Ohba. The main works in the research in 2007 are as follows:
We proposed a local dynamic similarity model that expresses the relative pressure balance between the cross-
dynamic pressure in the vicinity of an opening. Previous work has indicated that the model has higher prediction
orifice flow model even when the discharge coefficient greatly decreases with change in wind direction. In 2006, four types of wind tunnel experiments were carried out to investigate how strictly the requirements of the proposed model have to be met when the model is applied to
Figure 6. Aerodynamic database for low-rise buildings (Web pages 1/2)*
Figure 7. Aerodynamic database for low-rise buildings (Web pages 2/2)*
*http://www. wind.arch.t-kougei.ac.jp/info_center/windpressure/lowrise/mainpage.html

August 2007 Page
region, because it does not consider the effect on the discharge coefficient of recalculating flow generated by
over the opening and a wall hindering the diffusion of
or negligible. Thus, there are no substantial problems in applying the model when the direction or profile of the
opening.
Evaluation of thermal comfort in cross-ventilated environments
A field experiment to determine thermal comfort was conducted in a condominium in August, 2006. The thermal comfort of occupants in the cross-ventilation environment was investigated with 6 adult males, 3 adult females and a thermal mannequin in a sitting position on chairs. The occupants voted their feelings on airflow, warmth and chilliness and how they felt about their thermal comfort during the experiment. Also using infrared thermography at a frame time of 30 Hz, power spectrum analyses of skin surface temperatures under
were investigated. The power spectrum was calculated by the FFT method on all pixels in a time series of thermal images. It was found that under cross-ventilation, the fingers showed larger power at low frequency than the upper arms. Wet parts of uniforms on the chest showed larger power at low frequency. In airflows of the air-conditioning unit, the power in almost all classes was lower at low frequency than under cross-ventilation.
Analysis of airflow structure in cross-ventilated building by CFD techniques
Wind-induced ventilation is a phenomenon of very complicated turbulent flow because of the interaction of
steady methods, the unsteady CFD method gives more complete descriptions of flow fields around a cross-ventilated building. In 2006 the project aims to investigate the relationship between fluctuating wind pressure and
An LES code capable of generating fluctuating inflows
has been made and the code has been optimized for cross-ventilation study. When wind direction is normal to the opening, the standard deviation of the fluctuating flow rate is smaller because the ventilation stream is mainly
to the opening, the standard deviation of the fluctuating
To develop effective methods for utilizing cross-ventilation
For practical usage of cross-ventilation, in highly dense
enough ventilation flow rates when opening windows are attached to building walls. The use of night cross-
windows have high security performance and do not have large effects on gross building coverage ratio. The applicability of roof windows in highly dense city blocks for cross-ventilation was investigated. It was found that the wind passage between leeward wall and roof is very effective in achieving cross-ventilation flow rates, as shown in Figure 8.
Project 3: Indoor/Outdoor Air PollutionAir pollution in urban areas poses a serious threat to
human health. Dispersion of pollutants in city areas, street canyon and residential areas is an important area of research. Although various regulations have been put in force, the problem is still acute. Indoor air pollution is another area that needs to be addressed. Indoor air pollution, such as sick house syndrome, sick building syndrome and damp building syndrome are very common
Figure 8. Relation between cross-ventilation rate and building coverage ratio
August 2007 Page
building
Figure 10. Relationship between gross building coverage ratio and wind velocity ratio
problems. Hence, there is need for immediate measures and policy to control the air pollution menace, in both the inside and outside air environments.
The aim of Project 3 is to provide new knowledge for reducing air pollution and to propose risk assessment systems. This will contribute very much to safety and health, and especially to reducing environmental deterioration in developing countries where a large amount of pollutant is exhausted into the atmosphere.
The project is categorized in two areas: (i) outdoor air environment and (ii) indoor air environment.
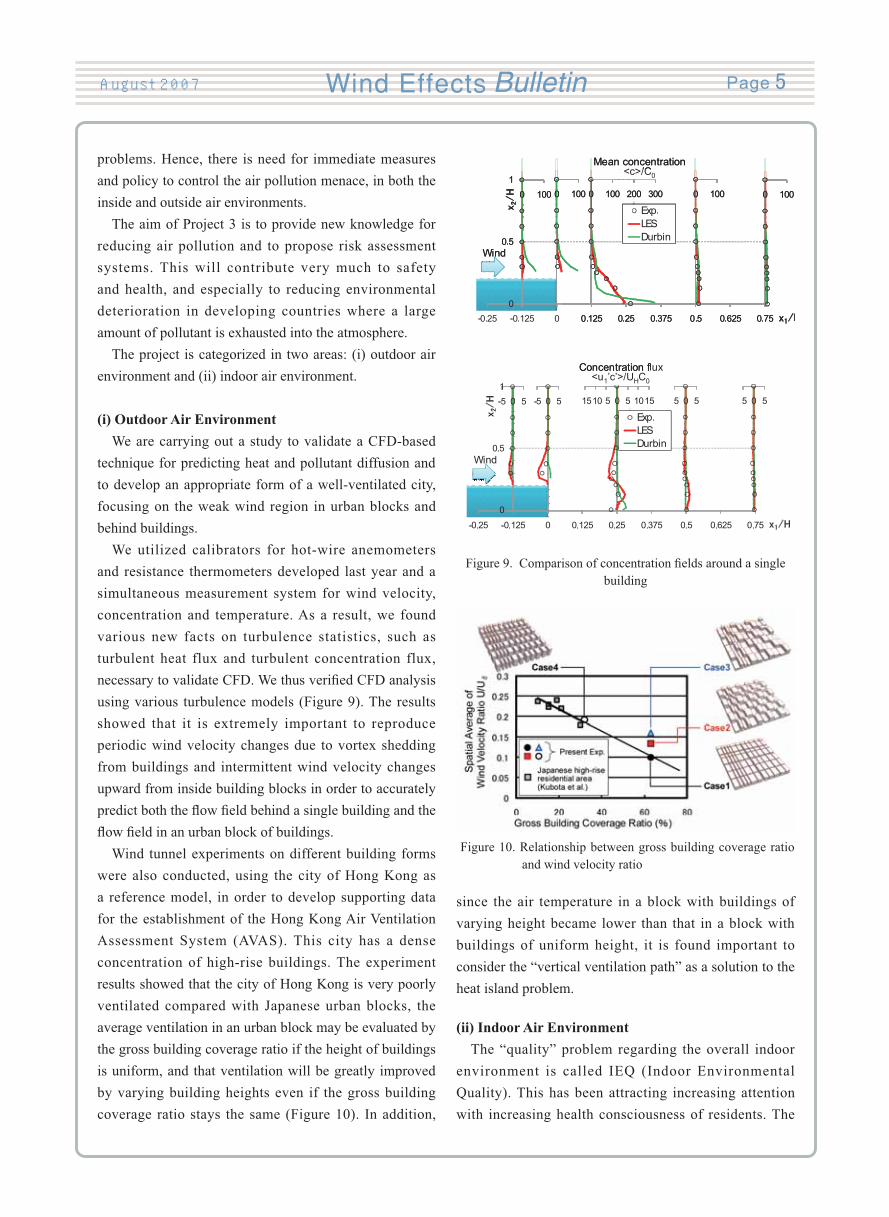
(i) Outdoor Air EnvironmentWe are carrying out a study to validate a CFD-based
technique for predicting heat and pollutant diffusion and to develop an appropriate form of a well-ventilated city, focusing on the weak wind region in urban blocks and behind buildings.
We utilized calibrators for hot-wire anemometers and resistance thermometers developed last year and a simultaneous measurement system for wind velocity, concentration and temperature. As a result, we found various new facts on turbulence statistics, such as turbulent heat flux and turbulent concentration flux,
using various turbulence models (Figure 9). The results showed that it is extremely important to reproduce periodic wind velocity changes due to vortex shedding from buildings and intermittent wind velocity changes upward from inside building blocks in order to accurately
Wind tunnel experiments on different building forms were also conducted, using the city of Hong Kong as a reference model, in order to develop supporting data for the establishment of the Hong Kong Air Ventilation Assessment System (AVAS). This city has a dense concentration of high-rise buildings. The experiment results showed that the city of Hong Kong is very poorly ventilated compared with Japanese urban blocks, the average ventilation in an urban block may be evaluated by the gross building coverage ratio if the height of buildings is uniform, and that ventilation will be greatly improved by varying building heights even if the gross building coverage ratio stays the same (Figure 10). In addition,
since the air temperature in a block with buildings of varying height became lower than that in a block with buildings of uniform height, it is found important to consider the “vertical ventilation path” as a solution to the heat island problem.
(ii) Indoor Air EnvironmentThe “quality” problem regarding the overall indoor
environment is called IEQ (Indoor Environmental Quality). This has been attracting increasing attention with increasing health consciousness of residents. The

August 2007 Page
0 [h] (0day) 4 [h] (1day) 48 [h] (2 day) 96 [h] (4 day) 168 [h] (7 day)
Figure 12. Fungal spore growths of Cladosporium cladosporioides
research project ‘Indoor Air Environment’ will be based
with overall IEQ control. Key words of this research project are Contamination Control and Public Health Engineering based on Computational Fluid Dynamics.
etc.; microbial contamination due to molds, fungi, etc.; and chemical compound contamination due to volatile organic compounds. Comprehensive research will be carried out on IEQ control from the physical, biological and chemical standpoints focusing on these areas.
Indoor Air Chemistry;Indoor ozone has received attention because of its well-
documented adverse effects on health. In addition to the inherently harmful effects of ozone, it can also initiate a series of reactions that generate potentially irritating oxidation products, including free radicals, aldehydes, organic acids and secondary organic aerosols (SOA). The overall goal of this work was to better understand ozone and terpene distributions within rooms. To this end, we developed a reliable method, using a cylindrical test chamber, to examine ozone and terpene reactions in the air phase and to estimate the corresponding second order rate constant (kb) and Fractional Aerosol Yield (Y), which represents the bi-molecular chemical reactions of ozone and terpene. The cylindrical test chamber is a duct cavity and consists of three sections (55 mm (diameter) × 2,500 mm (length)) and these are connected using a U-bend.
The inner boundaries for air passing through the chamber are made of electro-polished SUS 304 stainless steel.
These experiments focused on the heterogeneous reactions between ozone (or d-limonene) and the inner surface of the chamber and homogeneous reactions between ozone and limonene in the air phase.
study can be summarized as follows:(1)This work has produced a reliable method that enables
estimations of the second order rate constant (kb) for bi-molecular chemical reactions in the gas phase based on the concentrations measured along the streamline in the chamber.
(2)The kb values for ozone and limonene reactions were estimated to be between 1.3×10⁻¹ and 7.8×10⁻⁴ [1/ppm/sec]. The value was 3.8×10⁻³ [1/ppm/sec] on average
of kb reported by Atkinson.
0 [h] (0day) 24 [h] (1day) 48 [h] (2 day) 96 [h] (4 day) 168 [h] (7 day)
Figure 13. Fungal colony formation of Cladosporium cladosporioides
Figure 11. Schematic of cylindrical test chamber

August 2007 Page
Indoor Air Biology;The overall objective of this study was to develop a
numerical model based on logistic equations that predict fungal proliferation taking into account the influence of moisture, temperature and surface characteristics of building materials for various fungi, and a comprehensive IAQ prediction method based on CFD Simulation.
In the current year, a fungal spore slurry that strictly controlled the concentration of the spore and nutriment was made, and then two kinds of experiments were executed at the same time. The first experiment was performed to determine fungal proliferation growth on a glass plate, and the second to determine colony formation on a PDA medium. The basic experimental data from germination of spores to colony formation of fungi were obtained by integrating two experiment results. Figure 12 and Figure 13 show the experimental results when Cladosporium cladosporioides (NBRC 6348) is
targeted. As shown in Figure 14, it was confirmed that the Fungal spore growth and the colony formation of the microorganism were reproduced well by the logistic equation.
Indoor Air Physics;We have developed a grid library of virtual manikins
(VM) that represent human body scales for adult males and females as well as children. These virtual manikins are of two postures and are divided into 17 parts for the control of the thermal manikin, allowing the control and analysis of radiation heat transfer, surface temperature, and other factors in each part. Adopting this VM library,
of the human body were developed from CFD analysis (total 375 cases analyzed). These formulas can evaluate influence mean velocity, turbulent intensity of wind and the posture of Virtual Manikins on convective heat
(1) Child Model (2) Adult Male Model (3) Adult Female Model
(1) Time history of Fungal spore growths (2) Time history of Fungal colony formation Figure 14. Experimental results and approximation that uses logistic expression

August 2007 Page
Kenny C.S. Kwok – Hong Kong University of Science and Technology, Hong KongMasaru Matsumoto – Kyoto University, JapanGiovanni Solari – University of Genova, ItalyYukio Tamura – Tokyo Polytechnic University, Japan
Course BDavid Etheridge – University of Nottingham, UKShinsuke Kato – Institute of Industrial Science,Univ- ersity of Tokyo, JapanAkashi Mochida – Tohoku University, JapanWilliam Nazaroff – University of California,Berkeley, USAMasaaki Ohba – Tokyo polytechnic University, JapanMichael Schatzmann – University of Hamburg, GermanyCharles J. Weschler –UMDNJ/Robert Wood Johnson Medical School & Rutgers University, USARyuichiro Yoshie – Tokyo Polytechnic University, Japan
In the opening ceremony of COE-IAS2, Prof. Yukio Tamura of the Tokyo Polytechnic University welcomed
Report on the COE International Advanced School on “Wind Effects on Buildings and the Urban Environment” (COE-IAS2)
Date: March 5-9, 2007Venue: Tokyo International Forum, Tokyo, Japan
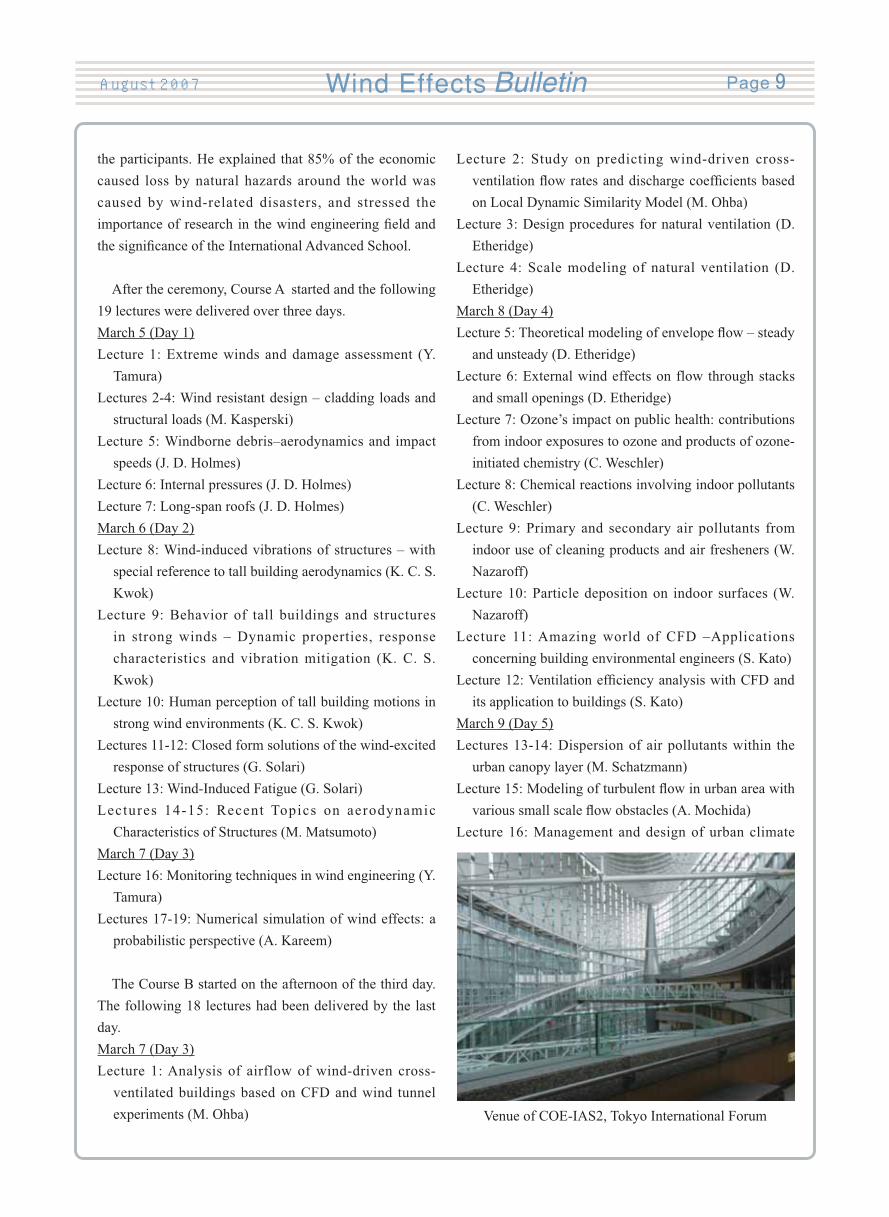
The COE International Advanced School on “Wind Effects on Buildings and the Urban Environment” (COE-IAS2) was held at the Tokyo International Forum by the 21st Century COE Program of the Tokyo Polytechnic
The last COE International Advanced School (COE-IAS1) was held in July 2006, and Prof. Robert N. Meroney and Prof. Siva Parameswaran were invited to lecture on a variety of subjects on Computational Fluid Dynamics (CFD) ranging from basic knowledge to application to wind engineering. This COE-IAS2 was composed of two courses, Course A for the structural field and Course B for the environmental field. Fifteen
wind load, natural ventilation, indoor environment and urban environment spoke on varying topics, from introductory lectures on each field to up-to-the-minute themes. The lecturers of the courses were as follows.Course A
John D. Holmes – JDH Consulting, AustraliaAhsan Kareem – University of Notre Dame, USAMichael Kasperski – Ruhr University, Germany
Lecturers of Course A: Holmes, Kareem, Kasperski, Kwok, Matsumoto, Solari, Tamura
Lecturers of Course B: Etheridge, Kato, Mochida, Nazaroff, Ohba, Schatzmann, Weschler, Yoshie
August 2007 Page
Venue of COE-IAS2, Tokyo International Forum
the participants. He explained that 85% of the economic caused loss by natural hazards around the world was caused by wind-related disasters, and stressed the
After the ceremony, Course A started and the following 19 lectures were delivered over three days.March 5 (Day 1)Lecture 1: Extreme winds and damage assessment (Y.
Tamura) Lectures 2-4: Wind resistant design – cladding loads and
structural loads (M. Kasperski)Lecture 5: Windborne debris–aerodynamics and impact
speeds (J. D. Holmes)Lecture 6: Internal pressures (J. D. Holmes)Lecture 7: Long-span roofs (J. D. Holmes)March 6 (Day 2)Lecture 8: Wind-induced vibrations of structures – with
special reference to tall building aerodynamics (K. C. S. Kwok)
Lecture 9: Behavior of tall buildings and structures in strong winds – Dynamic properties, response characteristics and vibration mitigation (K. C. S. Kwok)
Lecture 10: Human perception of tall building motions in strong wind environments (K. C. S. Kwok)
Lectures 11-12: Closed form solutions of the wind-excited response of structures (G. Solari)
Lecture 13: Wind-Induced Fatigue (G. Solari)Lectures 14-15: Recent Topics on aerodynamic
Characteristics of Structures (M. Matsumoto)March 7 (Day 3)Lecture 16: Monitoring techniques in wind engineering (Y.
Tamura)Lectures 17-19: Numerical simulation of wind effects: a
probabilistic perspective (A. Kareem)
The Course B started on the afternoon of the third day. The following 18 lectures had been delivered by the last day. March 7 (Day 3)Lecture 1: Analysis of airflow of wind-driven cross-
ventilated buildings based on CFD and wind tunnel experiments (M. Ohba)
Lecture 2: Study on predicting wind-driven cross-
on Local Dynamic Similarity Model (M. Ohba)Lecture 3: Design procedures for natural ventilation (D.
Etheridge)Lecture 4: Scale modeling of natural ventilation (D.
Etheridge)March 8 (Day 4)
and unsteady (D. Etheridge)Lecture 6: External wind effects on flow through stacks
and small openings (D. Etheridge)Lecture 7: Ozone’s impact on public health: contributions
from indoor exposures to ozone and products of ozone-initiated chemistry (C. Weschler)
Lecture 8: Chemical reactions involving indoor pollutants (C. Weschler)
Lecture 9: Primary and secondary air pollutants from indoor use of cleaning products and air fresheners (W. Nazaroff)
Lecture 10: Particle deposition on indoor surfaces (W. Nazaroff)
Lecture 11: Amazing world of CFD –Applications concerning building environmental engineers (S. Kato)
its application to buildings (S. Kato)March 9 (Day 5)Lectures 13-14: Dispersion of air pollutants within the
urban canopy layer (M. Schatzmann)
Lecture 16: Management and design of urban climate

August 2007 Page
HKPU-TPU Workshop “Wind Effects on Structures and Urban Environment”
Date: December 11, 2006Venue: Chung Sze Yuen Building, Hong Kong Polytechnic University, Hong Kong
The HKPU-TPU Workshop “Wind Effects on Structures and Urban Environment” was held at Hong Kong Polytechnic University on December 11, 2006. It was co-organized by Hong Kong Polytechnic University (HKPU) and the 21st century COE Program of Tokyo Polytechnic University (TPU). HKPU set “Mitigation of Urban Hazard” as an area of strategic development, and has been working energetically on wind effects on structure as one of the main projects to achieve its target. The workshop was proposed by Professor J.M. Ko, who is one of the advisory board members of the COE program. Its purpose was to exchange the latest knowledge on research works and to discuss future collaborations. Eight members from TPU participated in the workshop, including COE researchers and students.
At the beginning, Professor Ko welcomed all participants and explained the scope of the workshop. Then Professor Ohba read a message from Professor Tamura, who could not participate due to an accident.
After the speeches, 13 presentations were given by the participants, and stimulating discussions were held on those topics. The titles were as follows.
Session 1: Natural Wind and Wind Effects on Buildings
and Structures-(1)
“Characteristics of wind turbulence in Hong Kong”, Dr Michael Hui, Chief Engineer, Hong Kong Highways Department, Representative of HKPU's Collaborators
“Universal equivalent static wind load”, Dr. Shuyang Cao, COE Associate Professor, TPU
based on the heat balance analysis of outdoor space (A. Mochida)
Lecture 17: Simultaneous measuring technique of fluctuating velocity, temperature and concentration, and uncertainty in its measurand (R. Yoshie)
Lecture 18: Guide line for practical applications of CFD to prediction of wind environment and air quality around buildings (R. Yoshie)
In the closing ceremony, Prof. Yukio Tamura again thanked the participants. A total of 78 students, engineers and researchers, including 19 foreigners participated in the COE-IAS2. The 2007 COE International Advanced School thus ended successfully with the help of all those participants, lecturers and staff.

August 2007 Page
Participants
“Wind load combination and peak normal stress-probabilistic approach”, Mr. Nadaraja Pillai, PhD Candidate, TPU
“Development of a hybrid vibration experiment system for determining wind-induced responses of buildings with tuned dampers”, Dr. Masahiro Matsui, Associate Professor, Wind Engineering Research Center, TPU
Session 2: Natural Wind and Wind Effects on Buildings
and Structures-(2)
“Numerical and physical simulation of turbulent boundary layer”, Dr. Shuyang Cao, COE Associate Professor, TPU
“Estimation techniques for damping in buildings”, Dr. Akihito Yoshida, Lecturer, Wind Engineering Research Center, TPU
“Wind effects on long span cable-supported bridges”, Dr You-Lin Xu, Chair Professor/Director, Research Centre for Urban Hazards Mitigation, HKPU
Session 3: Wind Effects on Urban Environment-(1)
“Wind effects on human comfort and safety in dense urban areas”, Dr Wan-Ki. Chow, Chair Professor/Director, Research Centre for Fire Engineering, Department of Building Services Engineering, HKPU.
“High-precision method for predicting cross-ventilation flow rates”, Dr. Tomonobu Goto, COE Researcher, TPU
“Unsteady CFD modelling of flow simulations for venti lat ion studies”, Dr. Cheng-Hu Hu, COE Researcher, TPU
Session 4: Wind Effects on Urban Environment-(2)
“Experimental and numerical study on air ventilation in a built-up area with closely-packed high-rise buildings”,
Dr. Masaaki Ohba, Professor, Wind Engineering Research Centre, TPU
“Measurement of fungal proliferation and MVOC emission under various environmental conditions”, Mr. Yu Mizuno, PhD Candidate, TPU
“Indoor/outdoor air pollution study in HKPU”, Dr Frank Lee, Professor, Department of Civil and Structural Engineering, HKPU
Following the presentations and discussions, a closed meeting was held. Future collaborations were discussed among Professor Xu and his colleagues and the TPU members, and some topics were agreed to be potential collaborative research works. After the meeting, Professor Ko invited the TPU members to a dinner. In this relaxed atmosphere, more discussions were held on continuing collaborations.
As described above, this workshop was successful and the discussions were fruitful. At the end, we deeply thank Professor Ko, Professor Xu and their colleagues for their excellent management of the workshop.
A scene during presentations
A scene during closed meeting
August 2007 Page
Aerodynamic database of low-rise buildingsYong Quan, COE Researcher, TPU
Y. Tamura, M. Matsui, S. Cao, A. Yoshida, TPU
In order to afford aerodynamic data of low-rise buildings to engineers for structure design, an aerodynamic database was constructed based on a series of wind tunnel tests ind force coefficients and time series of wind pressure coefficients on measured taps on 812 test cases
were shown in this database. Based on these data, local wind pressures, surface wind forces and even dynamic responses of a low-rise building can be calculated. The aerodynamic database and corresponding information of wind tunnel tests can be inquired from the web page of http://www.wind.arch.t-kougei.ac.jp/w_it.html. The
The pressure measurement wind tunnel tests for the database were taken in a simulated suburban terrain corresponding to terrain categories III in AIJ (2004)[1],whose exponent of mean wind profile was 0.20 and turbulence density at height of 10 m was about 0.25. The testing wind velocity at height of 10 cm was about 7.4m/s, corresponding to 22.2m/s at height of 10m in full scale. The length scale, velocity scale and time scale of this test are 1/100, 1/3 and 3/100, respectively.
116 model cases with geometrical parameters in Table 1 were taken.
Wind pressures on taps arranged uniformly at the surfaces of the tested models were sampled synchronously with sampling frequency of 500hz and sampling period of 18 seconds, respectively, corresponding to 15 Hz and 10 minutes in full scale. Each test case was sampled 10 times.
Three types of data, contours of local wind pressure coefficients, graphs of surface wind force coefficients and time series of wind pressure coefficients on each measured taps, were shown for each model case in the database.
The local wind pressure coefficients can be used to design small non-structural component. Their mean, RMS, positive extreme and negative extreme values for different wind directions were shown in the database. The extreme values with exceedence risk of 22% were calculated with the Cook-Mayne method[2]. The duration time of the extreme values is 1 second.
The surface wind force coefficients can be used to design static structural component. Their mean, RMS, positive extreme and negative extreme values for different wind directions were shown in the database also. The calculating method of their statistical values is same as
The time series of wind pressure coefficients on each measured taps can be used to analyze the dynamic responses of low-rise buildings. They were saved as Matlab data format. They can be downloaded free from the website.
to use the data can be found in the website. Reference[1] AIJ: AIJ Recommendations for Loads on Buildings.
1994[2] N.J. Cook and J.R. Mayne, a novel working approach
to the assessment of wind loads for equivalent static design, Journal of Industrial Aerodynamics, 4(1979) 149-164
Table 1. Test model cases

August 2007 Page
parameter based on the spectral moments of random process. It is given by
(3)
Here is the power spectrum of the random function at the frequency n. For narrow band process = 0 and it increases as the bandwidth increases, reaches = 1 for the wide band process. 4. Theoretical maxima for any random process
For any random process X , the maxima can be calculated based on the mean, standard deviation and peak factor as shown below. The role of the peak factor is important in deciding the maximum value of any random processes.
The peak factor derived for the non-Gaussian, with any bandwidth parameter (0< <1) is given by
(4)
where gngb is the non-Gaussian peak factor and the bandwidth parameter .
Also
,
are the skewness and kurtosis of the given distribution and
.For the maxima during the period when N is large given
by S.O. Rice 5)
(5)
where T is the time period.Eqn (4) can be further reduced to the Davenport’s4)
peak factor by considering the Gaussian with narrowband
1. IntroductionC u r r e n t e s t i m a t i o n o f
theoretical maxima for random wind loads and load effects is based on the assumption that they are Gaussian distribution and narrow band process. However this assumption is erroneous in the case of low-rise building
structures because these random processes have been observed to be generally non-Gaussian. The peak factor derived here for the random process is based on the non-Gaussian peak factor derived by Kareem & Zhao1) and
Longuet-Higgins2).2. Probability Distribution Function
The non-Gaussianity can be well shown by Gram-Charlier distribution3). The function for non-Gaussian process given interms of standardized random data is given by
(1)
where is the standard Gaussian probability density function, , and the hermite polynomials . By using the above hermite polynomials the probability density function for the non-Gaussian processes derived3) and shown as
(2)
where, are the skewness and the kurtosis minus three of the distribution respectively. is the standard deviation. H3 and H4 are the hermite moments. For the further explanation the hermite moments of softening process ( >3) is considered.
3. Bandwidth parameterCartwright & Longuet-Higgins2) derived the bandwidth
Theoretical maxima for random load effects for buildingsS. Nadaraja Pillai, PhD Candidate, TPU
Y. Tamura, TPU

August 2007 Page
process. It becomes (6)
w h e r e . In the above Eqn (4), it can be reduced to the Cartwright & Longuet-Higgins2) Gaussian peak factor for the wideband process, if the skewness and kurtosis is zero.
(7)
If we consider the non-Gaussian with narrow band process then the Eqn (4) reduces to (8). This Eqn (8) is derived by Kareem & Zhao1).
(8)
5. Results and DiscussionThe application of the above peak factor can be shown
by considering the normal stress in the corner column of the low rise building model in Fig.1. The results show that the present Eqn (4) predicts the peak factor which is close to the experimental results. The derived peak factor can be applied to any random process irrespective of the distribution is Gaussian or non-Gaussian and with any spectral bandwidth parameter.
6. References1) A. Kareem, J. Zhao, “Analysis of Non-Gaussian surge
response of tension leg platforms under wind loads”, Journal of offshore mechanics and Artic Engineering, Vol. 116, (2004) 137-144.
2) D.E. Cartwright and M.S. Longue t -Higg ins , “Statistical Distribution of the maxima of a random function” Proc. Roy. Soc.A, Vol.237, (1956) 212-232.
3) M.K. Ochi, “Non-Gaussian random processes in ocean engineering”, Probabilistic Engineering mechanics, Vol.1, No.1, (1986) 28-39.
4) A.G. Davenport, “Note on the distribution of the largest value of a random function with application to gust loading”, Proceedings, Institution of Civil Engineers 28:187-196. (1964)
5) S.O. Rice “Mathematical Analysis of Random Noise”. Bell System Technical Journal 23, pp 282-332 and 24:46-156. Reprinted in N.Wax, Selected Papers on Random Noise and Stochastic Processes, New York: Dover, (1954)
6) S. Nadaraja Pillai, Y. Tamura, “Theoretical peak factor estimation for wind load effects on low-rise buildings”, JAWE, Vol.32 No.2(No.111), Japan, pp 225-226, May-Jun 2007.
Figure 1. Peak factor calculated for the normal stress of the low-rise building corner column for 160 samples (sorting based on experimental results)
Le Truong Giang, PhD Candidate, TPUY. Tamura, TPU
The understanding of wind profiles related to wind climate is required for sucesessfully describing vertical wind-speed profile. Recently, Tamura et al. [1] made extensively a review field data on vertical wind-speed profiles in tropical cyclone (also called hurricane or typhoon)
winds, which are carried out in past several decades. In
and discussed separately for eye-wall winds and outer-vortex winds. Main points are intruduced as below.
Above the sea, 331 profiles of lowest 3,000 m had obtained by GPS drop sondes from 15 hurricanes at Atlantic, Eastern and Central Pacific during years of 1997-1999. These data were analyzed by Powell et al.

August 2007 Page
Comparison between Eye-wall wind and Outer-vortex
Comparison between the wind-speed profiles in the Eye-wall and the Outer-vortex regions requires simultaneous measurements in these two regions. A interesting comparison were done by Franklin et al. (2000), in which using wind speeds at 700mb level (equal to
et al. (2003) seem to be the same source but different in number of individual profiles. The wind speed profile for the Eye-wall was compared with those for the Outer-vortex regions within 320km of the cyclone center as shown in Fig.1. The maximum wind speed in the Outer-vortex region appears at a somewhat higher elevation and is not as pronounced as that in the Eye-wall. It was interesting to remark that below 500 m there is no
the Eye-wall and the Outer-vortex regions.
An extensive discussion of other published papers relating to typhoon wind profiles, were also done by Tamura et al. [1] Unfortunately, in these papers, information on measurement time or position of observation sites were not clear, so it was not sure whether or not they related to Eye-wall winds. Hence, conclusions from those studies were hard to state for general feature of tropical cyclones.Concluding remarks
Wind-speed prof i les near the ground can be
Figure 1. Mean wind speed profiles (normalized by U10 wind speed) for Eye-wall winds and Outer-vortex winds
(2003) also Franklin et al. (2000) in which, all individual profiles were composed for gathering mean boundary layer (MBL) profile. The lower 200m of the profile shows a logarithmic increase mean wind speed with height, reaching a maximum at around 500-700m and decrease above these levels. Power law expression of these data shown well agreement with height up to 500m
=0.077). Other interesting point is that roughness lengths were decreased as if wind speeds at 10 m height (U10)increasing over 40 m/s, and this point is complicated and does not accord with current knowledge.
Above the land, only few observations had been carried out successfully. A reliable measurement of Typhoon Danas-2001 employed Doppler-radars was done by Hayashida et al. (2002). Results shown the mean wind speed increased with height, reached its maximum value at around 600m-700m, maintained a constant value up to 1,100m, and then slightly decreased with height up to 3,000m.Vertical profile of wind speed in the outer vortex region
Above the sea: the MBL obtained from more than 124 individual profiles in Outer-vortex region (320 km far from hurricanes center), was analyzed by Franklin et al. (2000). This result shown the maximum wind speed appears at higher levels than in the case of Eye-wall winds (see Figure 1).
Above the land, as discussed in last section, only several vertical profiles were obtained. Wilson (1979)
in which the distance from tropical cyclone center to observation site at the time of measure is about 150 km and the data were recorded by anemometers mounted on tower of 400 m height. The result shown a tendency that the 10 min- mean wind speeds increasing with height even above 400 m height (top of tower). The logarithmic
Recent observation of typhoon Utor-2001 at King’s Park Meteorogical Station, Hong Kong by employing Radiosonde ascent (Lau & Shun, 2002), shows the wind speed reaching its maximum at about 2km the decreasing. When the data of typhoon Utor-2001 were obtained, typhoon Utor had weakened into a severe tropical storm and made landfall at Guangdong about 200km from Hong Kong.

August 2007 Page
Announcement Future events are scheduled as follows.
International Symposium on Architectural Wind EngineeringDate: November 5-6, 2007Venue: Tokyo Polytechnic University, Atsugi, Kanagawa, Japan
The 4th Workshop on Regional Harmonization of Wind Loading and Wind Environmental Specifications in Asia-Pacific Economies (APEC-WW 2007)
Date: November 19-20, 2007 Venue: Tongji University, Shanghai, China
COE International Advanced School on Structural Wind Engineering (COE-IAS3)
Date: November 21-23, 2007 Venue: Tongji University, Shanghai, China
COE International Advanced School on Environmental Wind Engineering (COE-IAS4)
Date: December 6-8, 2007 Venue: Soongsil University, Seoul, Korea
The 3rd International Symposium on “Wind Effect on Buildings and Urban Environment” (ISWE3)
Date: March 4-5, 2008 Venue: Tokyo Station Conference, Tokyo, Japan
1583 Iiyama, Atsugi, Kanagawa, 243-0297, Japan Tel/Fax: 046-242-9540
http://www.wind.arch.t-kougei.ac.jp/COE
approximated by logarithmic-law or power-law for both in the Eye-wall region and the Outer-vortex region.
Above the sea, the average feature of the gradient heights is basically around 500 - 700m for the Eye-wall region and 900m or higher for the Outer-vortex region. There is not enough evidence to conclude that there is a very thin gradient height in tropical cyclone winds.
the wind-speed profiles in the Eye-wall and the Outer-vortex regions.References[1] Tamura.Y, Giang.L.T, Cao.S and Matsui.M, Wind
speed Profiles in Tropical Cyclones, 3rd Workshop on Regional Harmonization of Wind Loading and Wind Environmental Specifications in Asia-Pacific Economies (3rd APEC-WW), November 2-3, 2006

ISBN 4-902713-24-1


![University of Groningen Real-world influenza vaccine ... · &kdswhu srlqwhg wrzdugv vrph hiihfwlyhqhvv wkh uhgxfwlrq lq oderudwru\ frq¿uphg lqÀxhq]drxwfrphzdvqrwvwdwlvwlfdoo\vljql¿fdqw](https://img.pdfslide.net/doc/110x75/5e5fc77a89d54b408170d3bc/university-of-groningen-real-world-influenza-vaccine-kdswhu-srlqwhg-wrzdugv.jpg)