Embed Size (px)
Citation preview

1
Thailand Country Report 2012
on Wind Engineering Activities
Virote Boonyapinyoa
a Associate Professor, Department of Civil Engineering, Thammasat University
Rangsit Campus, Pathumthani 12120, Thailand
ABSTRACT: In this paper, Thailand county report 2012 on wind engineering is present.
First, Development of DPT Standard 1311-50 for wind load and response of buildings is
present. The DPT Standard is financially supported by Department of Public Works and
Town & Country Planning. The new standard is more accurate than the building code No.6
because it considers the wind speed zoning, surrounding terrain, building shapes, and
dynamic properties. Secondly, examples of wind load studies of buildings by TU-AIT wind
tunnel test are also presented. Finally, losses due to flood in Thailand in year 2011 are
shown.
KEYWORDS: Wind Loading Standard, DPT standard 1311-50, Thailand, Wind Tunnel
Test, Losses Due to Flood
1. INTRODUCTION
Although typhoon represents rare incident, Thailand experienced a number of wind disasters
from several tropical storms and one typhoon in the past 59 year’s history (1951-2009). After
the devastating cyclone and storm surge occurred in Myanmar in May 2008, and the
devastating floods in central Thailand in year 2011, wind-related disaster risk reduction
activities in Thailand become increasingly interesting to Thai people. In this paper, Thailand
county report 2012 on wind engineering is present. First, Development of DPT Standard
1311-50 for wind load and response of buildings is present. Secondly, examples of wind load
studies of buildings by TU-AIT wind tunnel test are also presented. Finally, losses due to
flood in Thailand in year 2011 are shown.
2. DEVELOPMENT OF DPT STANDARD 1311-50 FOR WIND LOAD
CALCULATION AND RESPONSE OF BUILDINGS
The wind load specified in the existing building code under the Building Control Act (BCA)
1979 is obsolete because it does not consider the terrain conditions and the typhoon influence
and then the wind pressures depend on only the height and apply the same value for whole
country. In addition, the code value is too low for very tall building, and for building in open
exposure, as well as buildings in the Southern part of Thailand which is prone to typhoon
attack [1, 2]. Therefore, the subcommittee on wind and earthquake effects on structures of
the Engineering Institute of Thailand published the wind loading standard for building design
in 2003 [3]. It considers the wind speed zoning, surrounding terrain, dynamic properties, and

2
building shapes. The standard is mainly based on the National Building Code of Canada
1995 [4].
However, the wind loading standard for building design in 2003 has been revised
again for up-to-date wind loading standard. At present, DPT standard 1311-50 (Fig. 1) for
wind loading calculation and response of buildings in Thailand is newly published by
Department of Public Works and Town & Country Planning [5-6]. To develop the new wind
loading standard for building design, an evaluation and comparison of wind load and
responses for building among several codes/standards, and wind tunnel test for pressure
measurement and overall wind load were studied by Boonyapinyo et al. [5], among others.
The new development of DPT standard 1311-50 [6] is mainly based on NBCC-2005 [7],
partly on AIJ-2004 [8] for across-wind and torsional load and response, and partly on
ASCE7-05 [9] for wind load combination for rigid structures and ideal of wind load for low-
rise building in table. The new development of DPT standard 1311-50 for wind loading
calculation and response of buildings over 2003 version includes the specified wind load and
response, reference wind speed map, natural frequency and damping of building, table for
design wind loads for main structures, secondary members and claddings for low-rise
buildings, wind tunnel test procedure, commentary, numerical examples, computer program
for calculation of wind load and response, and wind load on miscellaneous structures such as,
large billboards, cylinders, poles, structural member, two- and three-dimensional trusses. The
reference wind speed is based on the study of the wind climate in Thailand [5]. The wind
speed for the Southern Thailand reflects the influence of the rare event of the typhoons in the
region. The natural frequency and damping for building in Thailand are based on the
measurements of 50 buildings in Bangkok.
2.1 Wind load calculation procedure
Three different approaches for determining design wind loads on buildings and structures are
given in the standard as follows.
Figure 1. DPT standard 1311-50 Figure 2. Example of model in boundary-layer
long-wind tunnel of TU-AIT.
a. Simple procedure
The simple procedure is appropriate for use with the majority of wind loading applications,
including the structure and cladding of low and medium rise building and the cladding design

3
of high rise buildings. These are situations where the structure is relatively rigid. Thus,
dynamic actions of the wind do not require detailed knowledge of the dynamic properties of
the buildings and can be dealt with by equivalent static loads.
b. Detailed procedure
The detailed procedure is appropriated for buildings whose height is greater than 4 times their
minimum effective width or greater than 80 m and other buildings whose light weight, low
frequency and low damping properties make them susceptible to vibration
c. Wind tunnel test procedure
Wind tunnel testing is appropriate when more exact definition of dynamic response is needed
and for determining exterior pressure coefficients for cladding design on buildings whose
geometry deviates markedly from more common shapes for which information is already
available. Detail of wind tunnel test procedure is given in [5-6].
Figure 2 shows the boundary-layer long-wind tunnel that was jointly built by
Thammasat university (TU) and Asian Institute of Technology (AIT) at Thammasat
University. The test section is 2.5x2.5 m with 25.5 m in length. Wind speed is in the range of
0.5 to 20 m/s.
2.2 Specified external pressure or suction
The specified external pressure or suction due to wind on part or all of a surface of a building
shall be calculated from
p = IwqCeCgCp (1)
where
p = the specified external pressure acting statically and in a direction normal to the
surface either as a pressure directed to wards the surface or as a suction directed
away from the surface,
Iw = importance factor for wind load, as provided in Table 1,
q = the reference velocity pressure,
Ce = the exposure factor,
Cg = the gust effect factor,
CP = the external pressure coefficient, averaged over the area of the surface
considered
The net wind load for the building as a whole shall be the algebraic difference of the
loads on the windward and the leeward surfaces, and in some cases may be calculated as the
sum of the products of the external pressures or suctions and the areas of the surfaces over
which they are averaged
2.3 Reference velocity pressure
The reference wind pressure, q, is determined from reference (or design) wind speed, V by
the following equation:
(2)
where
= air density = 1.25 kg/m3
2__2 1
(in kg/m )2
q Vg

4
= acceleration due to gravity = 9.81 m/s2
V = design wind speed
50VV for serviceability limit state
50VTV F for ultimate (strength) limit state
50V = reference wind speed that is based on one-hour average wind speed at 10 m.
in open terrain in 50-years return period. 50V and typhoon factor ( FT ) are
shown in Table 1 and Figure 3.
Figure 3. Reference wind speed zone for Thailand.
Table 1. Reference wind speeds and typhoon factor
Zone Area 50V FT
Zone 1
Zone 2
Zone 3
Zone 4 A
Zone 4 B
Central region
Lower part of Northern region and East west border region
Upper part of Northern region
East coast of Southern peninsula
Petchaburi and West coast of Southern peninsula
25
27
29
25
25
1.0
1.0
1.0
1.2
1.08
3. EXAMPLES OF WIND LOAD STUDY BY TU-AIT WIND TUNNEL TEST
3.1 Wind load study for cladding design
g
2
1
4A
4B
3 3

5
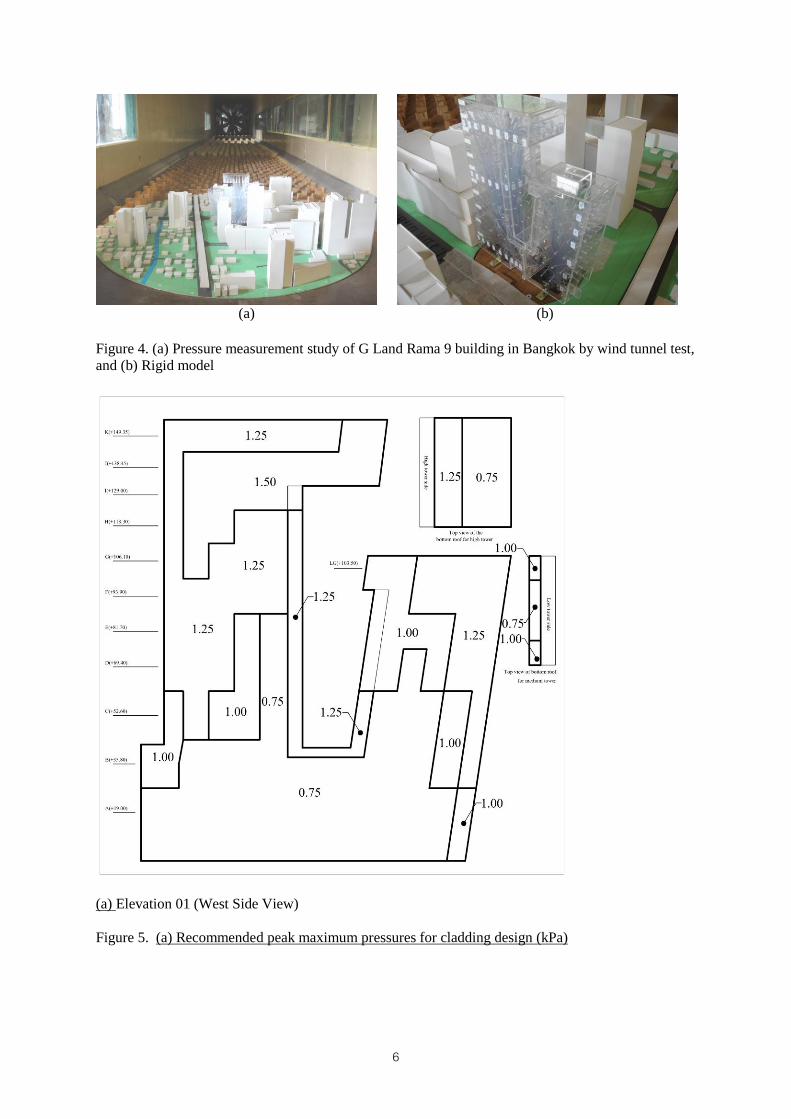
a. G Land Rama 9 building in Bangkok
Wind load study for cladding design of the G Land Rama 9 building was performed by TU-
AIT wind tunnel test as shown in Figure 4 [10]. The G Land Rama 9 building is composed of
high tower and medium tower as the G shape. The high tower and medium tower have 152.8
m and 105.7 m in roof height, respectively. This building has the following special
characteristics: a) close spacing of many high-rise buildings, and b) the irregular geometry of
the floor area. These special characteristics result in pressure distributions significantly
different from those specified in the building codes. Accordingly, the wind-tunnel tests are
essential to achieve the structural and cladding designs that are not overly costly and for
which the risk of wind damage is realized at the lever chosen for the design.
The studied building was specially constructed by an acrylic rigid model. The 1:400
scale models of studied building and its surrounding buildings within 400 m radius from the
studied building were mounted on a 2-m diameter turntable, allowing any wind direction to
be simulated by rotating the model to the appropriate angle in the wind tunnel. The studied
building model and its surroundings were tested in a boundary layer wind tunnel where the
mean wind velocity profile, turbulence intensity profile, and turbulence spectrum density
function of the winds approaching the study site are simulated for urban exposure based on
the ASCE7 Standard and ASCE Manual and Reports on Engineering Practice No. 67. In this
study, the wind load for cladding design obtained from a wind tunnel test were measured on a
direction-by-direction basis for 36 directions at 10-degree intervals, on the 1:400 scale model
of the building exposed to an approaching wind.
According to the DPT Standard 1311-50 [6], the reference velocity pressure, q, for the
design of main structure and cladding shall be based on a probability of being exceeded in
any one year of 1 in 50 (50-year return period) corresponding to reference wind speed of 25
m/s at the height of 10 m in open terrain. Because the proposed building is located in the
Central Bangkok with heavy concentrations of tall buildings, the exposure C (center of large
cities) was applied in this study, and the typhoon factor = 1.0. Then design wind speed is 25
m/s, and corresponding to design wind speed of 28.41 m/s at the 152.80 m roof height
(measure form the 1st floor to the top of the building) in the exposure C.
The results of recommended peak maximum pressures and peak minimum pressures
(negative or suctions) in kPa (1 kPa = 1,000 N/m2) for cladding design of walls of studied
building are presented graphically in Figure 5. The recommended peak maximum pressures
are generally in the range of 1,000 to 1,500 N/m2
(1.00 kPa to 1.50 kPa). The recommended
peak minimum pressures (negative or suctions) are in the range of 1,250 to 1,750 N/m2 (1.25
kPa to 1.75 kPa) in most part of the tower and in the range of 1,750 to 2,250 N/m2
(1.75 kPa
to 2.25 kPa) in some areas of edge zones of building walls. The largest peak maximum
pressure and peak minimum pressures (negative or suctions) are 1,420 and 2,972 N/m2,
respectively. It is found that the largest peak maximum pressure was observed at the level of
129.00 m. The largest minimum pressure (negative or suction) occurred at the level of 118.30
m.
It was found that: 1) the local peak maximum pressures in most part of the tower
obtained from wind tunnel test for studied building agree well in general with those based on
the ASCE7 standard [9] (Table //) ; DPT Standard [6] and NBCC Standard [7] (Table //), 2)
the local peak minimum pressures (suctions) in most part of the tower obtained from wind
tunnel test are slightly lower than those based on the ASCE7 standard; 3) the local peak
minimum pressures (suctions) in some areas of edge zone obtained from wind tunnel test are
slightly to moderately higher than those based on the ASCE7 standard.
6
(a) (b)
Figure 4. (a) Pressure measurement study of G Land Rama 9 building in Bangkok by wind tunnel test,
and (b) Rigid model
(a) Elevation 01 (West Side View)
Figure 5. (a) Recommended peak maximum pressures for cladding design (kPa)

7
(b) Elevation 01 (West Side View)
Figure 5. (Continued) (b) Recommended peak minimum pressures (negative or suctions) for cladding
design (kPa)
Table 2. Local peak maximum pressures and minimum pressures (suctions) based on DPT Standard
[6] and NBCC Standard [7]for high tower
Height (m.)
Net Pressure or Suction (N/m2)
Pressure Suction
Middle zone Edge zone
10 602 -1,266 -1,629
H/2 = 76.40 926 -1,266 -1,629
H = 152.80 1,354 -1,266 -1,629

8
Table 3. Local peak maximum pressures and minimum pressures (suctions) based on ASCE7
Standard [9] for high tower
Height (m.)
Net Pressure or Suction (N/m2)
Pressure
Suction
Middle zone Edge zone
10 434 -1,125 -2,129
H/2 = 76.40 730 -1,125 -2,129
H = 152.80 1,125 -1,125 -2,129
b. Circle II Building in Bangkok
In addition, wind load studies for cladding design of Circle II Building Project in Bangkok
were performed by TU-AIT wind tunnel test as shown in Figure 6 [11].
(a) (b)
Figure 6. (a) Pressure measurement study of Circle II Building in Bangkok by wind tunnel test, and
(b) Rigid model
3.2 Wind load study for overall fluctuating loads and dynamic response
a. Circle II Building in Bangkok
Wind load study for overall wind load and wind-induced response study for circle II
development project was performed by TU-AIT wind tunnel test as shown in Figure 7 [11].
Circle II development project located in Bangkok comprises 1 residence tower with 55
storeys. The project is development on Greenfield land of very narrow site. The area
surrounding the studied building generally consists of urban terrain. The studied building has
18.55 m width, 61.25 m depth, and 192 m mean height. This building has the following
special characteristics: a) the very flexible and high-rise building with the aspect ratio of
height / width of about 10.35 that exceeds the limitation of the wind load specification for
building design, b) the irregular geometry of the floor area, and c) close spacing of many
high-rise buildings. These special characteristics result in pressure distributions significantly
different from those specified in the building codes. Accordingly, the wind-tunnel tests are

9
essential to achieve structural designs that are not overly costly and for which the risk of wind
damage is realized at the lever chosen for the design.
(a) (b)
Figure 7. (a) Overall wind load study of circle II building in Bangkok by wind tunnel test, and (b)
high-frequency force balance model
The studied building was specially constructed by a light-weight rigid model, such as
balsa wood model, and the studied model was mounted on a high-frequency base balance.
The 1:400 scale models of studied building and its surrounding buildings within 400 m radius
from the studied building were mounted on a 2-m diameter turntable, allowing any wind
direction to be simulated by rotating the model to the appropriate angle in the wind tunnel.
The studied building model and its surroundings were tested in a boundary layer wind tunnel
where the mean wind velocity profile, turbulence intensity profile, and turbulence spectrum
density function of the winds approaching the study site are simulated. In this study, overall
wind load obtained from a wind tunnel test were measured on a direction-by-direction basis
for 36 directions at 10-degree intervals, on the 1:400 scale model of the building exposed to
an approaching wind.
According to the DPT Standard 1311-50 [6], the reference velocity pressure, q, for the
design of main structure and cladding shall be based on a probability of being exceeded in
any one year of 1 in 50 (50-year return period) corresponding to reference wind speed of 25
m/s at the height of 10 m in open terrain. Because the proposed building is located in the
urban terrain, the exposure C was applied in this study, and the typhoon factor = 1.0. Then
design wind speed is 25 m/s, and corresponding to design wind speed of 30.85 m/s at the 192
m roof height in the exposure C. For the serviceability design, the reference velocity
pressure, q, shall be based on 10-year return period corresponding to reference wind speed of
20.25 m/s at the height of 10 m in open terrain. Therefore, corresponding design wind speed
is 25 m/s at the 192 m roof height in the exposure C.
For strength consideration with natural frequency fo , damping ratio = 0.02 and V50,
the results for overall wind load study found that the peak base moments Mx of -1,791 MN-m,
My of -676 MN-m and torque Mz of 150 MN-m occur at wind direction 80 , 100 , and 190
degree, respectively. It should be noted that the peak base moment Mx is caused by the
alongwind loads, while the peak base moment My is caused by the acrosswind loads. The
peak equivalent static wind load at top floor along - X-, + Y- and + Z- directions are -202 kN
(-3,120 N/m2), 526 kN (2,461 N/m
2) and 4,968 kN-m (1,424 kN-m/m), respectively.
For serviceability consideration, natural frequency fo, four damping ratios, i.e., =
0.005, 0.01, 0.015, and 0.02, and V10 are considered. According to the DPT Standard 1311-
50 [6] and NBCC code [7], the recommended serviceability design for human comfort

10
criteria for the studied building is that the peak acceleration under a 10 year return period
should be less than 15 mg and 25 mg for residential buildings and commercial buildings,
respectively.
Other criteria have also been published that depend on the building’s lowest natural
frequency (not depend on types of buildings). The ISO criteria [12] can be expressed as a
peak acceleration not exceeding 412.0928.0 f (in % of g) once every 5 years, where f is the
lowest natural frequency in Hz. This results in a 5-year criteria of 1.93 % of g (or 19.3 mg)
when natural frequencies of studied building = fo. Then, based on the above various
standards, the recommendation for human comfort criteria for the studied building should be
below of 19.3 mg and (0.81/0.73)2*19.3 mg = 23.76 mg for 5- and 10-year return periods,
respectively.
(a) (b)
(c)
Figure 8. (a-b) Overall wind load study of Langsuan Block 3 building by wind tunnel test, and (c)
high-frequency force balance model
For serviceability consideration with economic design, the acceleration response of
the studied building shall consider the wind directionality factor. This factor accounts for
two effects: (1) The reduced probability of maximum winds coming from any given direction
and (2) the reduced probability of the maximum pressure coefficient occurring for any given
direction. ASCE-7 Standard [9] recommends a value of 0.85 for main wind force resisting

11
system of buildings. Therefore, this value is adopted only for calculation of acceleration
response with V10. The results indicate that the predicted peak accelerations occur at wind
direction 0 degree when considering wind directionality factor. When considering damping
ratio of 0.01 and wind directionality factor of 0.85 with V10, the predicted peak acceleration
of 17.9 mg is lower than the recommended criteria of 23.76 mg. Therefore, the studied
building is acceptable for human comfort criteria.
b. Langsuan Block 3 Building
In addition, wind load studies for overall fluctuating loads and dynamic response of Langsuan
Block 3 building Project were performed by TU-AIT wind tunnel test as shown in Figure 8
[13]. Block 3 tower has 143.5 m. high, 16.1 m width, and 49.8 m depth. Aspect ratio
(building slenderness) of the building is about 8.9 .
(a) (b)
(c) (d)
Figure 9. Example of flood: (a-b) at industrial area, (c) at resident area in Pathumthani, and (d) in
rural area
4. LOSS DUE TO FLOOD
According to the World Bank's damage survey [14], the devastating floods in central
Thailand in year 2011 as shown in Figure 9 have caused 1.36 trillion baht in estimated
damage and are likely to slash Thailand's economic growth to 2.4% in year 2011. Of the
estimated damage, around 660 billion baht involves property losses and 700 billion baht

12
comprises lost opportunities. The initial survey was jointly carried out with state and private
agencies. However, the impact from the floods would not be all negative as it would spur
spending.
Economic growth would continue next year as a result of rehabilitation and rebuilding
spending by both the public and private sectors.
The World Bank's damage survey and assessment covers four sectors: public
infrastructure such as transport and telecoms; manufacturing such as farming, tourism and
industry; social development such as education and public health; and the environment.
More details are shown in Figure 10 by ministry of industry and ministry of agriculture and
cooperatives.
Figure 10. Sectoral production share by flooded area.
The World Bank [14] has also made suggestions about flood management, including
construction of flood barriers around industrial estates, implementation of the royally initiated
water management projects and application of the flood control plan for the Mekong region
by the Japan International Cooperation Agency (Jica). The Japan External Trade
Organisation (Jetro) and Jica assure that Japan would not move its production bases out of
Thailand. This is because Thailand remains strong in terms of public infrastructure and a
skilled labour force, compared with other countries in the region. The government made the
signing of a memorandum of understanding on loans for development of a flood prevention
system for the country's industrial estates. Under the memorandum signed between the
Government Savings Bank (GSB) and the Industrial Estate Authority of Thailand, the bank
will provide 15 billion baht in soft loans to support the implementation of the flood
prevention plan going forward. Four industrial estates that were badly hit by the flooding,
Rojana Industrial Park, Bang Pa-in Industrial Estate, Nava Nakorn Industrial Estate and Bang
Kadi Industrial Park, have joined the loan scheme.
Thammasat University, Rangsit Campus was also severely damaged during the flood.
Figure 11 show the maximum level of flood at faculty of Engineering. The flood was taken
about 30 days at Thammasat University. Figure 12 show the examples of flood prevention by

13
old soil dam of Thammasat University, Rangsit Campus in October 2011 and Figure 13 show
the examples of flood prevention by the new concrete-sheet-pile and soil dam of Thammasat
University, Rangsit Campus in year 2012.
After the devastating floods in central Thailand in year 2011, wind-related disaster
risk reduction activities become increasingly interesting to Thai people.
(a) (b)
Figure 11. (a) Examples of flood at Thammasat University, Rangsit Campus , and (b) maximum level
of flood at faculty of engineering, Thammasat University, Rangsit Campus
Figure 12. Examples of flood prevention of Thammasat University, Rangsit Campus by old soil dam
in year 2011
5. CONCLUSIONS
Thailand county report 2012 on wind engineering is present. First, Development of DPT
Standard 1311-50 for wind load and response of buildings is present. The DPT Standard is
financially supported by Department of Public Works and Town & Country Planning. The
new standard is more accurate than the building code No.6 because it considers the wind
speed zoning, surrounding terrain, building shapes, and dynamic properties. Three different
approaches for determining design wind loads on building are given in the standard, namely,
the simple procedure for low-rise building, the detailed procedure for high-rise building, and
wind-tunnel test procedure. The standard includes the calculation of: (1) wind load of the

14
main wind resistant system and cladding; (2) lateral deflection; and (3) building motion in the
along-wind and across-wind directions.
(a) (b)
Figure 13. (a-b) Examples of flood prevention of Thammasat University, Rangsit Campus by new
concrete-sheet-pile and soil dam in year 2012.
Since the new development of DPT standard 1311-50, wind load standard and wind
load studies of buildings and bridges by TU-AIT wind tunnel test have been increasingly
interesting to Thai engineers.
After the devastating cyclone and storm surge occurred in Myanmar in May 2008, and
the devastating floods in central Thailand in year 2011, wind-related disaster risk reduction
activities become increasingly interesting to Thai people.
6. ACKNOWLEDGEMENTS
The new development of wind loading standard for building design in Thailand is financially
supported by Department of Public Works and Town & Country Planning. The author is the
project head.
7. REFERENCES
1. Lukkunaprasit, P., Pheinsusom, P., and Euasiriwam, N., (1995), Wind Loading for Tall Building
Design in Thailand, Proc. of 2nd
National Convention on Civil Engineering, Chiangmai, Thailand,
pp. 51-61(in Thai).
2. Boonyapinyo, V., (1998), Comparison between Wind and Earthquake Loads for High-Rise
Building Design in Thailand, Proc. of International Seminar on Earthquake Resistant Design of
Structures, Chiangmai, Thailand., pp. 416-432 (in Thai).
3. Engineering Institute of Thailand (2003), E.I.T. Standard 1018-46, Wind Loading Code for
Building Design (in Thai).
4. National Building Code of Canada (1995) issued by the Canadian Commission on Building and
Fire Codes, National Research Council of Canada, Ottawa, Canada.
5. Boonyapinyo, V., Lukkunaprasit, P., Chucheepsakul, S., Warnitchai, P., Poovarodom, N.,
Thepmongkorn, S., Limsamphancharoen, N., and Leelataviwat, S. (2007), Wind Loading for
Building Design in Thailand, Final Report, Submitted to Department of Public Works and Town
& Country Planning (in Thai);

15
6. DPT Standard (2007), DPT 1311-50: Wind Loading Calculation and Response of Buildings,
Department of Public Works and Town & Country Planning (in Thai).
7. National Building Code of Canada (2005) issued by the Canadian Commission on Building and
Fire Codes, National Research Council of Canada, Ottawa, Canada.
8. AIJ (2004), Recommendation for Loads on Buildings, Architectural Institute of Japan.
9. ASCE Standard (2005), ASCE7-05: Minimum Design Loads for Buildings and Other Structures,
American Society of Civil Engineers, New York.
10. Boonyapinyo, V., and Magteppong, N. (2012), Wind Load Study for G Land Rama 9 Building by
Wind Tunnel Test, Final Report, Thammasat University Research and Consultancy Institute (TU-
RAC), Submitted to Grand Canal Land Public Company Limited.
11. Boonyapinyo, V., and Magteppong, N. (2010), Wind Load Study for Circle II Development
Project by Wind Tunnel Test: Part 1 Over Wind Load Study and Part 2 Pressure Measurement
Study, Final Report, Thammasat University Research and Consultancy Institute (TU-RAC),
Submitted to Fragrant Group Ltd.
12. ISO 10137 (1992), International Organization for Standardization, Bases for Design of Structures
– Serviceability of Building against Vibration, Geneva.
13. Boonyapinyo, V., and Magteppong, N. (2012), Wind Load Study for Langsuan Block 3 Building
Project by Wind Tunnel Test: Part 1 Over Wind Load Study, Final Report, Thammasat University
Research and Consultancy Institute (TU-RAC), Submitted to Siam Sindhorn Co., Ltd.
14. Chantanusornsiri, W., Bangkok Post, Economy faces flood hit, World Bank estimates damage at
B1.4 trillion, 26 Nov. 2011.