Embed Size (px)
Citation preview

Published by the Stationery Office, Dublin, Ireland.
To be purchased from the:
Central Statistics Office, Information Section, Skehard Road, Cork.
Government Publications Sales Office, Sun Alliance House,Molesworth Street, Dublin 2,
or through any bookseller.
Prn 443. Price �15.00. July 2003.

© Government of Ireland 2003
Material compiled and presented byCentral Statistics Office.
Reproduction is authorised, except for commercialpurposes, provided the source is acknowledged.
ISBN 0-7557-1507-1

3
Table of Contents
General DetailsPage
Introduction 5Coverage of the Census 5Conduct of the Census 5Production of Results 5Publication of Results 6
Maps
Percentage change in the population of Electoral Divisions, 1996-2002 8Population density of Electoral Divisions, 2002 9
Tables
Table No.
1 Population of each Province, County and City and actual and percentage change,1996-2002 13
2 Population of each Province and County as constituted at each census since 1841 14
3 Persons, males and females in the Aggregate Town and Aggregate Rural Areas ofeach Province, County and City and percentage of population in the Aggregate TownArea, 2002 19
4 Persons, males and females in each Regional Authority Area, showing those in theAggregate Town and Aggregate Rural Areas and percentage of total population intowns of various sizes, 2002 20
5 Population of Towns ordered by County and size, 1996 and 2002 21
6 Population and area of each Province, County, City, urban area, rural area andElectoral Division, 1996 and 2002 58
7 Persons in each town of 1,500 population and over, distinguishing those within legallydefined boundaries and in suburbs or environs, 1996 and 2002 119
8 Persons, males and females in each Constituency, as defined in the Electoral(Amendment) (No. 2) Act, 1998 for elections to Dáil Éireann 124
9 Persons, males and females in each Local Electoral Area as defined in the relevantOrders made under the Local Government Act, 1994
125
10 Population in 1996 and 2002 of each County, City, rural area and Electoral Divisionwithin the Gaeltacht, as defined by the Gaeltacht Areas Orders, 1956 to 1982 129
11 Population of inhabited Islands off the coast, 1996 and 2002 133
12 Alphabetical list of Towns with their population, 1996 and 2002 135

4
AppendicesPage
1 2002 Census questionnaire 148
2 Administrative and Census Areas 161
3 Towns with Legally Defined Boundaries 167
4 Extensions to Towns and Boroughs since 1926 169
5 Population of Towns or Environs/Suburbs which are located in more than one County 171
6 Census 2002 publication schedule 173

5
General DetailsIntroduction
A Census of Population was taken on the night of Sunday, 28 April 20021, in accordance with the Statistics(Census of Population) Order 2001 (S.I. No. 491 of 2001)2. An extract from the census questionnaire isreproduced in Appendix 1.
This first volume of the detailed census report presents the population classified by sex for the different territorialdivisions of the country. The areas are those in force at the date of the 2002 Census of Population and aredefined in Appendices 2-5.
Subsequent census volumes will analyse the population by such characteristics as age, marital status,household composition, usual residence, occupation, etc.
Coverage of the Census
The census figures relate to the de facto population, i.e. the population recorded for each area represents thetotal of all persons present within its boundaries on the night of Sunday, 28 April 2002, together with all personswho arrived in that area on the morning of Monday, 29 April 2002, not having been enumerated elsewhere.Persons on board ships in port are included with the population of adjacent areas. The figures, therefore,include visitors present on census night as well as those in residence, while usual residents temporarily absentfrom the area are excluded from the census count.
A limited number of questions, relating mainly to demographic characteristics, were asked in respect of usualresidents who were temporarily absent from their households on census night. The responses to thesequestions enables a more precise picture to be built up on families and households by excluding visitors presenton census night and including residents who were temporarily absent.
Conduct of the Census
A temporary field force consisting of 5 Census Liaison Officers, 35 Regional Supervisors, 350 Field Supervisorsand some 4,000 part-time enumerators carried out the census enumeration. Blank census questionnaires weredistributed to every household and communal establishment in the State during the four weeks immediatelypreceding census night. Collection of completed questionnaires commenced on Monday, 29 April. Theenumerators examined the questionnaires at the time of collection to ensure that they were correctly completedand, where necessary, they assisted householders in their completion.
Production of Results
Each enumerator first prepared and returned to the Central Statistics Office (CSO) a summary of the populationin his/her enumeration area. These summaries formed the basis for the preliminary 2002 population results3.The completed questionnaires for individual households were subsequently transmitted to the CSO forprocessing.
The population summaries, dwelling listings and enumeration maps for individual enumeration areas werechecked for consistency and used to determine the boundaries of census towns and suburbs/environs of townswith legal boundaries. The capture and processing of the responses to questions on the census questionnaireproceeded concurrently.
1 The census originally planned for 29 April 2001 was postponed because of the Foot and Mouth disease situation pertaining at the time.2 The Statistics (Census of Population) Order, 2001 was made by the Minister of State at the Department of the Taoiseach in pursuance of
powers conferred on him by section 25 (1) of the Statistics Act, 1993 (No. 21 of 1993) and the Statistics (Delegation of MinisterialFunctions) Order, 1997 (S.I. 327 of 1997).
3 Census of Population of Ireland, 2002: Preliminary Report (Pn. 11897), July 2002.

6
Publication of Results
The planned publication schedule is set out in Appendix 6. The schedule consists of the Principal DemographicResults and Principal Socio-economic Results, which provide the main census results, primarily at nationallevel. More detailed data is provided in 13 subject matter reports. All of the tables published in these reportswill be made available on the Central Statistics Office web site (www.cso.ie) using Beyond 20/20 interactivesoftware. This software gives Internet users the ability to select and view data online and then download thesame data to their computers.
Further information
For further information contact:
Census Inquiries SectionCentral Statistics OfficeArdee RoadRathminesDublin 6
Phone (01) 4977144 Ext. 4284-4288LoCall 1890 313 414
Fax (01) 498 4268E-mail [email protected] www.cso.ie

TABLES

Census 2002 Areas13
Table 1 Population of each Province, County and City and actual and percentage change, 1996 and2002
Province, Countyor City
1996 2002 Actual change1996-2002
Percentagechange
1996-2002 Persons Persons Males Females
Leinster 1,924,702 2,105,579 1,038,015 1,067,564 180,877 9.4
Carlow 41,616 46,014 23,403 22,611 4,398 10.6Dublin 1,058,264 1,122,821 544,075 578,746 64,557 6.1of which
Dublin City 481,854 495,781 237,813 257,968 13,927 2.9Dún Laoghaire-Rathdown 189,999 191,792 91,337 100,455 1,793 0.9Fingal 167,683 196,413 97,409 99,004 28,730 17.1South Dublin 218,728 238,835 117,516 121,319 20,107 9.2
Kildare 134,992 163,944 82,735 81,209 28,952 21.4Kilkenny 75,336 80,339 40,540 39,799 5,003 6.6Laoighis 52,945 58,774 30,131 28,643 5,829 11.0Longford 30,166 31,068 15,794 15,274 902 3.0Louth 92,166 101,821 50,489 51,332 9,655 10.5Meath 109,732 134,005 67,733 66,272 24,273 22.1Offaly 59,117 63,663 32,185 31,478 4,546 7.7Westmeath 63,314 71,858 35,960 35,898 8,544 13.5Wexford 104,371 116,596 58,170 58,426 12,225 11.7Wicklow 102,683 114,676 56,800 57,876 11,993 11.7
Munster 1,033,903 1,100,614 550,118 550,496 66,711 6.5
Clare 94,006 103,277 52,063 51,214 9,271 9.9Cork 420,510 447,829 222,317 225,512 27,319 6.5of which
Cork City 127,187 123,062 59,263 63,799 -4,125 -3.2Cork County 293,323 324,767 163,054 161,713 31,444 10.7
Kerry 126,130 132,527 66,572 65,955 6,397 5.1Limerick 165,042 175,304 87,631 87,673 10,262 6.2of which
Limerick City 52,039 54,023 26,128 27,895 1,984 3.8Limerick County 113,003 121,281 61,503 59,778 8,278 7.3
Tipperary North 58,021 61,010 30,864 30,146 2,989 5.2Tipperary South 75,514 79,121 39,999 39,122 3,607 4.8Waterford 94,680 101,546 50,672 50,874 6,866 7.3of which
Waterford City 42,540 44,594 21,782 22,812 2,054 4.8Waterford County 52,140 56,952 28,890 28,062 4,812 9.2
Connacht 433,231 464,296 233,194 231,102 31,065 7.2
Galway 188,854 209,077 104,367 104,710 20,223 10.7of which
Galway City 57,241 65,832 31,015 34,817 8,591 15.0Galway County 131,613 143,245 73,352 69,893 11,632 8.8
Leitrim 25,057 25,799 13,324 12,475 742 3.0Mayo 111,524 117,446 59,149 58,297 5,922 5.3Roscommon 51,975 53,774 27,583 26,191 1,799 3.5Sligo 55,821 58,200 28,771 29,429 2,379 4.3
Ulster (part of) 234,251 246,714 124,837 121,877 12,463 5.3
Cavan 52,944 56,546 29,015 27,531 3,602 6.8Donegal 129,994 137,575 69,016 68,559 7,581 5.8Monaghan 51,313 52,593 26,806 25,787 1,280 2.5
State 3,626,087 3,917,203 1,946,164 1,971,039 291,116 8.0
Census 2002 Areas14
Table 2 Population of each Province and County as constituted at each census since 1841
CensusYear
Province
State Leinster Munster Connacht Ulster(part of)
Persons
1841 6,528,799 1,973,731 2,396,161 1,418,859 740,0481851 5,111,557 1,672,738 1,857,736 1,010,031 571,0521861 4,402,111 1,457,635 1,513,558 913,135 517,7831871 4,053,187 1,339,451 1,393,485 846,213 474,0381881 3,870,020 1,278,989 1,331,115 821,657 438,2591891 3,468,694 1,187,760 1,172,402 724,774 383,7581901 3,221,823 1,152,829 1,076,188 646,932 345,8741911 3,139,688 1,162,044 1,035,495 610,984 331,1651926 2,971,992 1,149,092 969,902 552,907 300,0911936 2,968,420 1,220,411 942,272 525,468 280,2691946 2,955,107 1,281,117 917,306 492,797 263,8871951 2,960,593 1,336,576 898,870 471,895 253,2521956 2,898,264 1,338,942 877,238 446,221 235,8631961 2,818,341 1,332,149 849,203 419,465 217,5241966 2,884,002 1,414,415 859,334 401,950 208,3031971 2,978,248 1,498,140 882,002 390,902 207,2041979 3,368,217 1,743,861 979,819 418,500 226,0371981 3,443,405 1,790,521 998,315 424,410 230,1591986 3,540,643 1,852,649 1,020,577 431,409 236,0081991 3,525,719 1,860,949 1,009,533 423,031 232,2061996 3,626,087 1,924,702 1,033,903 433,231 234,2512002 3,917,203 2,105,579 1,100,614 464,296 246,714
Males
1841 3,222,485 963,747 1,186,190 707,842 364,7061851 2,494,478 813,537 904,979 495,802 280,1601861 2,169,042 715,005 744,682 454,035 255,3201871 1,992,468 655,114 686,106 418,728 232,5201881 1,912,438 630,038 659,994 407,021 215,3851891 1,728,601 587,847 587,611 362,166 190,9771901 1,610,085 571,809 540,970 323,667 173,6391911 1,589,509 582,967 526,130 312,089 168,3231926 1,506,889 573,900 493,628 284,453 154,9081936 1,520,454 611,279 485,412 276,399 147,3641946 1,494,877 630,982 467,698 257,794 138,4031951 1,506,597 664,008 460,365 248,955 133,2691956 1,462,928 658,453 446,782 234,558 123,1351961 1,416,549 651,908 431,292 219,983 113,3661966 1,449,032 694,248 436,368 210,097 108,3191971 1,495,760 737,460 447,271 203,694 107,3351979 1,693,272 862,509 497,411 216,176 117,1761981 1,729,354 884,666 506,857 218,852 118,9791986 1,769,690 913,736 514,708 220,094 121,1521991 1,753,418 913,849 507,095 214,131 118,3431996 1,800,232 944,669 518,217 218,387 118,9592002 1,946,164 1,038,015 550,118 233,194 124,837
Females
1841 3,306,314 1,009,984 1,209,971 711,017 375,3421851 2,617,079 859,201 952,757 514,229 290,8921861 2,233,069 742,630 768,876 459,100 262,4631871 2,060,719 684,337 707,379 427,485 241,5181881 1,957,582 648,951 671,121 414,636 222,8741891 1,740,093 599,913 584,791 362,608 192,7811901 1,611,738 581,020 535,218 323,265 172,2351911 1,550,179 579,077 509,365 298,895 162,8421926 1,465,103 575,192 476,274 268,454 145,1831936 1,447,966 609,132 456,860 249,069 132,9051946 1,460,230 650,135 449,608 235,003 125,4841951 1,453,996 672,568 438,505 222,940 119,9831956 1,435,336 680,489 430,456 211,663 112,7281961 1,401,792 680,241 417,911 199,482 104,1581966 1,434,970 720,167 422,966 191,853 99,9841971 1,482,488 760,680 434,731 187,208 99,8691979 1,674,945 881,352 482,408 202,324 108,8611981 1,714,051 905,855 491,458 205,558 111,1801986 1,770,953 938,913 505,869 211,315 114,8561991 1,772,301 947,100 502,438 208,900 113,8631996 1,825,855 980,033 515,686 214,844 115,2922002 1,971,039 1,067,564 550,496 231,102 121,877
Note - The figures shown in this table for each census relate to the areas as defined at the date of that census.

Census 2002 Areas15
Table 2 (contd.) Population of each Province and County as constituted at each census since 1841
CensusYear
County
Carlow Dublin Countyand City Kildare Kilkenny Laoighis Longford Louth
Persons
1841 86,228 372,773 114,488 202,420 153,930 115,491 128,2401851 68,078 405,147 95,723 158,748 111,664 82,348 107,6621861 57,137 410,252 90,946 124,515 90,650 71,694 90,7131871 51,650 405,262 83,614 109,379 79,771 64,501 84,0211881 46,568 418,910 75,804 99,531 73,124 61,009 77,6841891 40,936 419,216 70,206 87,261 64,883 52,647 71,0381901 37,748 448,206 63,566 79,159 57,417 46,672 65,8201911 36,252 477,196 66,627 74,962 54,629 43,820 63,6651926 34,476 505,654 58,028 70,990 51,540 39,847 62,7391936 34,452 586,925 57,892 68,614 50,109 37,847 64,3391946 34,081 636,193 64,849 66,712 49,697 36,218 66,1941951 34,162 693,022 66,437 65,235 48,430 34,553 68,7711956 33,888 705,781 65,915 64,089 47,087 32,969 69,1941961 33,342 718,332 64,420 61,668 45,069 30,643 67,3781966 33,593 795,047 66,404 60,463 44,595 28,989 69,5191971 34,237 852,219 71,977 61,473 45,259 28,250 74,9511979 38,668 983,683 97,185 69,156 49,936 30,785 86,1351981 39,820 1,003,164 104,122 70,806 51,171 31,140 88,5141986 40,988 1,021,449 116,247 73,186 53,284 31,496 91,8101991 40,942 1,025,304 122,656 73,635 52,314 30,296 90,7241996 41,616 1,058,264 134,992 75,336 52,945 30,166 92,1662002 46,014 1,122,821 163,944 80,339 58,774 31,068 101,821
Males
1841 42,428 170,930 58,030 99,114 76,403 57,610 62,2971851 33,016 187,286 48,528 76,493 55,556 41,041 52,2571861 28,139 191,435 48,960 60,317 45,112 36,044 44,2411871 25,464 188,108 44,946 52,965 39,843 32,512 41,0331881 23,078 197,740 40,701 48,971 36,861 30,770 37,9891891 20,552 197,409 38,407 43,468 33,171 26,681 35,2421901 19,009 211,786 34,703 40,095 29,694 23,814 32,6661911 18,481 226,364 37,684 38,551 28,711 22,656 32,1911926 17,802 238,995 31,987 37,084 27,198 20,805 31,7491936 18,066 277,098 31,956 36,489 27,149 20,152 32,8291946 17,702 292,205 36,057 35,464 26,751 19,322 33,3991951 17,848 326,126 36,364 34,687 26,154 18,388 34,8861956 17,666 329,627 35,069 33,927 25,233 17,477 34,7881961 17,360 335,004 34,068 32,252 23,989 16,133 33,6271966 17,320 375,692 34,829 31,390 23,622 15,245 34,6641971 17,502 406,008 37,279 31,828 23,805 14,891 37,5111979 19,743 473,104 50,666 35,688 26,192 16,059 43,0611981 20,195 482,342 53,967 36,395 26,774 16,234 44,1251986 20,816 492,279 59,542 37,325 27,531 16,153 45,5301991 20,785 492,432 62,207 37,447 26,904 15,542 44,8231996 21,086 508,966 68,007 38,144 27,160 15,468 45,6412002 23,403 544,075 82,735 40,540 30,131 15,794 50,489
Females
1841 43,800 201,843 56,458 103,306 77,527 57,881 65,9431851 35,062 217,861 47,195 82,255 56,108 41,307 55,4051861 28,998 218,817 41,986 64,198 45,538 35,650 46,4721871 26,186 217,154 38,668 56,414 39,928 31,989 42,9881881 23,490 221,170 35,103 50,560 36,263 30,239 39,6951891 20,384 221,807 31,799 43,793 31,712 25,966 35,7961901 18,739 236,420 28,863 39,064 27,723 22,858 33,1541911 17,771 250,832 28,943 36,411 25,918 21,164 31,4741926 16,674 266,659 26,041 33,906 24,342 19,042 30,9901936 16,386 309,827 25,936 32,125 22,960 17,695 31,5101946 16,379 343,988 28,792 31,248 22,946 16,896 32,7951951 16,314 366,896 30,073 30,548 22,276 16,165 33,8851956 16,222 376,154 30,846 30,162 21,854 15,492 34,4061961 15,982 383,328 30,352 29,416 21,080 14,510 33,7511966 16,273 419,355 31,575 29,073 20,973 13,744 34,8551971 16,735 446,211 34,698 29,645 21,454 13,359 37,4401979 18,925 510,579 46,519 33,468 23,744 14,726 43,0741981 19,625 520,822 50,155 34,411 24,397 14,906 44,3891986 20,172 529,170 56,705 35,861 25,753 15,343 46,2801991 20,157 532,872 60,449 36,188 25,410 14,754 45,9011996 20,530 549,298 66,985 37,192 25,785 14,698 46,5252002 22,611 578,746 81,209 39,799 28,643 15,274 51,332

Census 2002 Areas16
Table 2 (contd.) Population of each Province and County as constituted at each census since 1841
CensusYear
County
Meath Offaly Westmeath Wexford Wicklow Clare Cork Countyand City
Persons
1841 183,828 146,857 141,300 202,033 126,143 286,394 854,1181851 140,748 112,076 111,407 180,158 98,979 212,440 649,3081861 110,373 90,043 90,879 143,954 86,479 166,305 544,8181871 95,558 75,900 78,432 132,666 78,697 147,864 517,0761881 87,469 72,852 71,798 123,854 70,386 141,457 495,6071891 76,987 65,563 65,109 111,778 62,136 124,483 438,4321901 67,497 60,187 61,629 104,104 60,824 112,334 404,6111911 65,091 56,832 59,986 102,273 60,711 104,232 392,1041926 62,969 52,592 56,818 95,848 57,591 95,064 365,7471936 61,405 51,308 54,706 94,245 58,569 89,879 355,9571946 66,232 53,686 54,949 91,855 60,451 85,064 343,6681951 66,337 52,544 54,463 90,032 62,590 81,329 341,2841956 66,762 51,970 54,122 87,259 59,906 77,176 336,6631961 65,122 51,533 52,861 83,308 58,473 73,702 330,4431966 67,323 51,717 52,900 83,437 60,428 73,597 339,7031971 71,729 51,829 53,570 86,351 66,295 75,008 352,8831979 90,715 57,342 59,885 96,421 83,950 84,919 396,1181981 95,419 58,312 61,523 99,081 87,449 87,567 402,4651986 103,881 59,835 63,379 102,552 94,542 91,344 412,7351991 105,370 58,494 61,880 102,069 97,265 90,918 410,3691996 109,732 59,117 63,314 104,371 102,683 94,006 420,5102002 134,005 63,663 71,858 116,596 114,676 103,277 447,829
Males
1841 92,494 72,651 70,383 97,918 63,489 144,109 420,5511851 70,813 55,284 56,095 86,938 50,230 103,953 318,1491861 55,800 45,513 46,218 69,104 44,122 82,541 269,6371871 48,437 38,307 39,804 64,199 39,496 73,442 256,0621881 44,315 37,106 36,478 60,928 35,101 71,058 246,0441891 39,224 33,777 33,927 54,935 31,054 63,138 219,9881901 34,757 31,065 31,880 51,756 30,584 57,386 202,2971911 33,934 29,804 31,910 51,568 31,113 53,877 197,5161926 33,082 27,566 30,151 48,570 28,911 50,071 183,1921936 32,501 27,555 29,039 48,577 29,868 47,957 179,6201946 34,950 29,311 29,058 46,611 30,152 45,350 171,1101951 34,980 28,306 28,737 45,945 31,587 43,473 170,8651956 34,830 27,591 28,102 44,210 29,933 40,868 167,9521961 33,826 27,188 27,183 42,128 29,150 38,904 164,7081966 34,877 27,007 27,101 42,270 30,231 38,667 170,0101971 36,977 27,029 27,544 43,768 33,318 39,002 176,7861979 46,704 29,792 30,557 48,974 41,969 43,945 199,1461981 48,957 30,290 31,388 50,336 43,663 45,366 202,3881986 52,931 30,819 32,048 51,782 46,980 46,913 206,4701991 53,291 29,892 31,006 51,444 48,076 46,367 204,5421996 55,340 30,003 31,599 52,432 50,823 47,789 209,1772002 67,733 32,185 35,960 58,170 56,800 52,063 222,317
Females
1841 91,334 74,206 70,917 104,115 62,654 142,285 433,5671851 69,935 56,792 55,312 93,220 48,749 108,487 331,1591861 54,573 44,530 44,661 74,850 42,357 83,764 275,1811871 47,121 37,593 38,628 68,467 39,201 74,422 261,0141881 43,154 35,746 35,320 62,926 35,285 70,399 249,5631891 37,763 31,786 31,182 56,843 31,082 61,345 218,4441901 32,740 29,122 29,749 52,348 30,240 54,948 202,3141911 31,157 27,028 28,076 50,705 29,598 50,355 194,5881926 29,887 25,026 26,667 47,278 28,680 44,993 182,5551936 28,904 23,753 25,667 45,668 28,701 41,922 176,3371946 31,282 24,375 25,891 45,244 30,299 39,714 172,5581951 31,357 24,238 25,726 44,087 31,003 37,856 170,4191956 31,932 24,379 26,020 43,049 29,973 36,308 168,7111961 31,296 24,345 25,678 41,180 29,323 34,798 165,7351966 32,446 24,710 25,799 41,167 30,197 34,930 169,6931971 34,752 24,800 26,026 42,583 32,977 36,006 176,0971979 44,011 27,550 29,328 47,447 41,981 40,974 196,9721981 46,462 28,022 30,135 48,745 43,786 42,201 200,0771986 50,950 29,016 31,331 50,770 47,562 44,431 206,2651991 52,079 28,602 30,874 50,625 49,189 44,551 205,8271996 54,392 29,114 31,715 51,939 51,860 46,217 211,3332002 66,272 31,478 35,898 58,426 57,876 51,214 225,512

Census 2002 Areas17
Table 2 (contd.) Population of each Province and County as constituted at each census since 1841
CensusYear
County
KerryLimerickCountyand City
TipperaryNorth
TipperarySouth
WaterfordCountyand City
GalwayCountyand City
Leitrim
Persons
1841 293,880 330,029 201,161 234,392 196,187 440,198 155,2971851 238,254 262,132 147,164 184,403 164,035 321,684 111,8971861 201,800 217,277 109,220 139,886 134,252 271,478 104,7441871 196,586 191,936 93,617 123,096 123,310 248,458 95,5621881 201,039 180,632 86,331 113,281 112,768 242,005 90,3721891 179,136 158,912 76,220 96,968 98,251 214,712 78,6181901 165,726 146,098 67,815 92,417 87,187 192,549 69,3431911 159,691 143,069 62,881 89,552 83,966 182,224 63,5821926 149,171 140,343 59,645 81,370 78,562 169,366 55,9071936 139,834 141,153 59,551 78,284 77,614 168,198 50,9081946 133,893 142,559 58,103 77,911 76,108 165,201 44,5911951 126,644 141,239 57,009 76,304 75,061 160,204 41,2091956 122,072 137,881 55,697 73,718 74,031 155,553 37,0561961 116,458 133,339 53,696 70,126 71,439 149,887 33,4701966 112,785 137,357 53,843 68,969 73,080 148,340 30,5721971 112,772 140,459 54,337 69,228 77,315 149,223 28,3601979 120,356 157,407 58,476 75,265 87,278 167,838 27,8441981 122,770 161,661 58,984 76,277 88,591 172,018 27,6091986 124,159 164,569 59,522 77,097 91,151 178,552 27,0351991 121,894 161,956 57,854 74,918 91,624 180,364 25,3011996 126,130 165,042 58,021 75,514 94,680 188,854 25,0572002 132,527 175,304 61,010 79,121 101,546 209,077 25,799
Males
1841 147,307 161,997 100,558 116,092 95,576 219,564 77,5011851 116,511 127,387 71,049 88,975 78,955 157,135 56,1111861 99,999 105,712 53,967 68,516 64,310 134,057 52,5621871 97,913 93,112 46,405 60,094 59,078 122,496 47,7241881 101,208 88,311 42,773 55,982 54,618 120,609 45,1901891 91,017 78,607 38,172 48,635 48,054 108,283 39,7151901 84,427 72,456 34,513 46,886 43,005 97,923 35,0981911 81,474 72,229 32,341 46,243 42,450 94,403 32,7591926 76,863 71,172 31,020 41,884 39,426 88,481 29,2471936 73,503 72,407 31,406 40,991 39,528 89,170 27,3371946 70,113 72,039 30,365 40,634 38,087 87,435 24,0651951 66,507 71,691 29,989 39,877 37,963 85,141 22,3741956 63,965 69,622 29,228 38,170 36,977 82,223 19,9861961 60,838 67,173 28,088 36,053 35,528 78,993 18,0311966 58,674 69,135 28,064 35,352 36,466 77,696 16,4441971 58,404 70,786 28,190 35,333 38,770 77,842 15,2691979 62,185 79,302 30,118 38,759 43,956 86,528 14,8781981 63,492 81,595 30,247 39,256 44,513 88,330 14,6991986 63,293 82,686 30,347 39,381 45,618 90,625 14,2051991 61,932 81,094 29,355 38,067 45,738 91,005 13,2031996 63,801 82,546 29,290 38,312 47,302 94,529 13,0442002 66,572 87,631 30,864 39,999 50,672 104,367 13,324
Females
1841 146,573 168,032 100,603 118,300 100,611 220,634 77,7961851 121,743 134,745 76,115 95,428 85,080 164,549 55,7861861 101,801 111,565 55,253 71,370 69,942 137,421 52,1821871 98,673 98,824 47,212 63,002 64,232 125,962 47,8381881 99,831 92,321 43,558 57,299 58,150 121,396 45,1821891 88,119 80,305 38,048 48,333 50,197 106,429 38,9031901 81,299 73,642 33,302 45,531 44,182 94,626 34,2451911 78,217 70,840 30,540 43,309 41,516 87,821 30,8231926 72,308 69,171 28,625 39,486 39,136 80,885 26,6601936 66,331 68,746 28,145 37,293 38,086 79,028 23,5711946 63,780 70,520 27,738 37,277 38,021 77,766 20,5261951 60,137 69,548 27,020 36,427 37,098 75,063 18,8351956 58,107 68,259 26,469 35,548 37,054 73,330 17,0701961 55,620 66,166 25,608 34,073 35,911 70,894 15,4391966 54,111 68,222 25,779 33,617 36,614 70,644 14,1281971 54,368 69,673 26,147 33,895 38,545 71,381 13,0911979 58,171 78,105 28,358 36,506 43,322 81,310 12,9661981 59,278 80,066 28,737 37,021 44,078 83,688 12,9101986 60,866 81,883 29,175 37,716 45,533 87,927 12,8301991 59,962 80,862 28,499 36,851 45,886 89,359 12,0981996 62,329 82,496 28,731 37,202 47,378 94,325 12,0132002 65,955 87,673 30,146 39,122 50,874 104,710 12,475

Census 2002 Areas18
Table 2 (contd.) Population of each Province and County as constituted at each census since 1841
CensusYear
County
Mayo Roscommon Sligo Cavan Donegal Monaghan
Persons
1841 388,887 253,591 180,886 243,158 296,448 200,4421851 274,499 173,436 128,515 174,071 255,158 141,8231861 254,796 157,272 124,845 153,906 237,395 126,4821871 246,030 140,670 115,493 140,735 218,334 114,9691881 245,212 132,490 111,578 129,476 206,035 102,7481891 219,034 114,397 98,013 111,917 185,635 86,2061901 199,166 101,791 84,083 97,541 173,722 74,6111911 192,177 93,956 79,045 91,173 168,537 71,4551926 172,690 83,556 71,388 82,452 152,508 65,1311936 161,349 77,566 67,447 76,670 142,310 61,2891946 148,120 72,510 62,375 70,355 136,317 57,2151951 141,867 68,102 60,513 66,377 131,530 55,3451956 133,052 63,710 56,850 61,740 122,059 52,0641961 123,330 59,217 53,561 56,594 113,842 47,0881966 115,547 56,228 51,263 54,022 108,549 45,7321971 109,525 53,519 50,275 52,618 108,344 46,2421979 114,019 54,189 54,610 53,720 121,941 50,3761981 114,766 54,543 55,474 53,855 125,112 51,1921986 115,184 54,592 56,046 53,965 129,664 52,3791991 110,713 51,897 54,756 52,796 128,117 51,2931996 111,524 51,975 55,821 52,944 129,994 51,3132002 117,446 53,774 58,200 56,546 137,575 52,593
Males
1841 194,198 127,016 89,563 120,814 145,821 98,0711851 133,264 86,411 62,881 86,610 124,723 68,8271861 125,636 79,841 61,939 77,503 115,875 61,9421871 120,877 70,647 56,984 70,479 106,080 55,9611881 119,421 66,657 55,144 64,637 100,671 50,0771891 107,498 58,000 48,670 56,772 91,478 42,7271901 97,564 51,233 41,849 50,087 86,444 37,1081911 96,345 48,522 40,060 47,743 84,627 35,9531926 86,778 43,281 36,666 43,550 78,100 33,2581936 83,213 41,308 35,371 41,446 73,924 31,9941946 75,073 38,845 32,376 38,121 70,269 30,0131951 73,345 36,626 31,469 36,187 67,964 29,1181956 68,879 34,078 29,392 33,177 62,664 27,2941961 63,844 31,477 27,638 30,277 58,501 24,5881966 59,829 29,782 26,346 28,803 55,606 23,9101971 56,402 28,294 25,887 27,819 55,424 24,0921979 58,489 28,475 27,806 28,302 62,629 26,2451981 58,987 28,653 28,183 28,338 63,962 26,6791986 58,729 28,351 28,184 28,202 65,906 27,0441991 55,981 26,694 27,248 27,314 64,817 26,2121996 56,371 26,695 27,748 27,281 65,520 26,1582002 59,149 27,583 28,771 29,015 69,016 26,806
Females
1841 194,689 126,575 91,323 122,344 150,627 102,3711851 141,235 87,025 65,634 87,461 130,435 72,9961861 129,160 77,431 62,906 76,403 121,520 64,5401871 125,153 70,023 58,509 70,256 112,254 59,0081881 125,791 65,833 56,434 64,839 105,364 52,6711891 111,536 56,397 49,343 55,145 94,157 43,4791901 101,602 50,558 42,234 47,454 87,278 37,5031911 95,832 45,434 38,985 43,430 83,910 35,5021926 85,912 40,275 34,722 38,902 74,408 31,8731936 78,136 36,258 32,076 35,224 68,386 29,2951946 73,047 33,665 29,999 32,234 66,048 27,2021951 68,522 31,476 29,044 30,190 63,566 26,2271956 64,173 29,632 27,458 28,563 59,395 24,7701961 59,486 27,740 25,923 26,317 55,341 22,5001966 55,718 26,446 24,917 25,219 52,943 21,8221971 53,123 25,225 24,388 24,799 52,920 22,1501979 55,530 25,714 26,804 25,418 59,312 24,1311981 55,779 25,890 27,291 25,517 61,150 24,5131986 56,455 26,241 27,862 25,763 63,758 25,3351991 54,732 25,203 27,508 25,482 63,300 25,0811996 55,153 25,280 28,073 25,663 64,474 25,1552002 58,297 26,191 29,429 27,531 68,559 25,787

Census 2002 Areas19
Table 3 Persons, males and females in the Aggregate Town and Aggregate Rural Areas of eachProvince, County and City and percentage of population in the Aggregate Town Area, 2002
Province, Countyor City
Aggregate Town Area Aggregate Rural Area Percentageof populationin AggregateTown AreaPersons Males Females Persons Males Females
Leinster 1,565,059 761,119 803,940 540,520 276,896 263,624 74.3
Carlow 22,433 11,135 11,298 23,581 12,268 11,313 48.8Dublin 1,095,797 530,476 565,321 27,024 13,599 13,425 97.6of which
Dublin City 495,781 237,813 257,968 – – – 100.0Dún Laoghaire-Rathdown 189,590 90,257 99,333 2,202 1,080 1,122 98.9Fingal 178,746 88,545 90,201 17,667 8,864 8,803 91.0South Dublin 231,680 113,861 117,819 7,155 3,655 3,500 97.0
Kildare 106,195 53,005 53,190 57,749 29,730 28,019 64.8Kilkenny 24,592 11,871 12,721 55,747 28,669 27,078 30.6Laoighis 19,443 9,909 9,534 39,331 20,222 19,109 33.1Longford 7,557 3,630 3,927 23,511 12,164 11,347 24.3Louth 65,340 31,814 33,526 36,481 18,675 17,806 64.2Meath 59,755 29,526 30,229 74,250 38,207 36,043 44.6Offaly 25,570 12,475 13,095 38,093 19,710 18,383 40.2Westmeath 31,451 15,280 16,171 40,407 20,680 19,727 43.8Wexford 37,903 18,381 19,522 78,693 39,789 38,904 32.5Wicklow 69,023 33,617 35,406 45,653 23,183 22,470 60.2
Munster 561,868 273,445 288,423 538,746 276,673 262,073 51.1
Clare 37,162 18,260 18,902 66,115 33,803 32,312 36.0Cork 275,025 133,752 141,273 172,804 88,565 84,239 61.4of which
Cork City 123,062 59,263 63,799 – – – 100.0Cork County 151,963 74,489 77,474 172,804 88,565 84,239 46.8
Kerry 44,957 21,454 23,503 87,570 45,118 42,452 33.9Limerick 88,847 43,262 45,585 86,457 44,369 42,088 50.7of which
Limerick City 54,023 26,128 27,895 – – – 100.0Limerick County 34,824 17,134 17,690 86,457 44,369 42,088 28.7
Tipperary, North 20,752 10,063 10,689 40,258 20,801 19,457 34.0Tipperary, South 32,202 15,754 16,448 46,919 24,245 22,674 40.7Waterford 62,923 30,900 32,023 38,623 19,772 18,851 62.0of which
Waterford City 44,594 21,782 22,812 – – – 100.0Waterford County 18,329 9,118 9,211 38,623 19,772 18,851 32.2
Connacht 150,414 71,592 78,822 313,882 161,602 152,280 32.4
Galway 87,837 41,843 45,994 121,240 62,524 58,716 42.0of which
Galway City 65,832 31,015 34,817 – – – 100.0Galway County 22,005 10,828 11,177 121,240 62,524 58,716 15.4
Leitrim 1,842 855 987 23,957 12,469 11,488 7.1Mayo 30,379 14,490 15,889 87,067 44,659 42,408 25.9Roscommon 10,621 5,210 5,411 43,153 22,373 20,780 19.8Sligo 19,735 9,194 10,541 38,465 19,577 18,888 33.9
Ulster (part of) 56,941 27,351 29,590 189,773 97,486 92,287 23.1
Cavan 9,502 4,589 4,913 47,044 24,426 22,618 16.8Donegal 32,788 15,708 17,080 104,787 53,308 51,479 23.8Monaghan 14,651 7,054 7,597 37,942 19,752 18,190 27.9
State 2,334,282 1,133,507 1,200,775 1,582,921 812,657 770,264 59.6

Census 2002 Areas20
Table 4 Persons, males and females in each Regional Authority Area, showing those in theAggregate Town and Aggregate Rural Areas and percentage of total population in towns ofvarious sizes, 2002
RegionalAuthority
Population Percentage of total population in
TotalAggregateTown Area
AggregateRural Area
Towns100,000 and
over
Towns10,000 to99,999
Towns 1,500to 9,999
Towns under1,500
Remainderof region
Persons
Border 432,534 143,858 288,676 – 22.3 11.0 13.6 53.2
Dublin 1,122,821 1,095,797 27,024 89.5 4.8 3.3 0.4 2.0
Mid-East 412,625 234,973 177,652 – 33.4 23.6 8.0 35.1
Midland 225,363 84,021 141,342 – 24.1 13.2 12.2 50.5
Mid-West 339,591 146,761 192,830 – 32.1 11.1 12.8 44.0
South-East 423,616 180,053 243,563 – 28.1 14.4 10.9 46.6
South-West 580,356 319,982 260,374 32.1 8.0 15.1 6.7 38.1
West 380,297 128,837 251,460 – 20.8 13.1 7.9 58.2
State 3,917,203 2,334,282 1,582,921 30.4 17.8 11.4 7.2 33.2
Males
Border 217,421 69,214 148,207 – 21.3 10.6 13.3 54.9
Dublin 544,075 530,476 13,599 89.2 4.9 3.4 0.4 2.1
Mid-East 207,268 116,148 91,120 – 32.8 23.3 8.0 36.0
Midland 114,070 41,294 72,776 – 23.4 12.8 12.0 51.8
Mid-West 170,558 71,585 98,973 – 31.1 10.9 12.6 45.4
South-East 212,784 88,041 124,743 – 27.2 14.1 10.8 47.9
South-West 288,889 155,206 133,683 31.3 7.7 14.7 6.7 39.6
West 191,099 61,543 129,556 – 19.6 12.6 7.7 60.0
State 1,946,164 1,133,507 812,657 29.6 17.4 11.3 7.2 34.6
Females
Border 215,113 74,644 140,469 – 23.3 11.4 13.9 51.4
Dublin 578,746 565,321 13,425 89.7 4.7 3.2 0.4 1.9
Mid-East 205,357 118,825 86,532 – 34.0 23.9 8.0 34.2
Midland 111,293 42,727 68,566 – 24.8 13.6 12.4 49.2
Mid-West 169,033 75,176 93,857 – 33.1 11.3 13.0 42.5
South-East 210,832 92,012 118,820 – 28.9 14.7 11.0 45.4
South-West 291,467 164,776 126,691 32.9 8.2 15.4 6.8 36.7
West 189,198 67,294 121,904 – 22.1 13.5 8.1 56.3
State 1,971,039 1,200,775 770,264 31.2 18.1 11.6 7.2 31.9

Census 2002 Areas21
Table 5 Population of Towns ordered by County and size, 1996 and 2002
Town Electoral Division, etc.( * = part of ED)
Ref. No.of ED
inTable 6
1996 2002Percentage
change1996-2002Persons Persons Males Females
Carlow County
Carlow Carlow Town – 11,721 13,218 6,490 6,728 12.8Carlow Urban 1 4,903 4,963 2,438 2,525 1.2Graique Urban 2 1,501 1,702 853 849 13.4Carlow Rural* 19 5,317 6,553 3,199 3,354 23.2
Environs of Carlow (pt.)(b) Total – 2,388 4,070 2,076 1,994 70.4Carlow Rural* 19 2,311 3,925 2,005 1,920 69.8Ballinacarrig* 12 77 145 71 74 88.3
Muinebeag Muinebeag (Bagenalstown) Urban 34 2,553 2,540 1,304 1,236 -0.5
Environs of Muinebeag Muinebeag (Bagenalstown) Rural* 33 142 188 103 85 32.4
Tullow Total – 2,364 2,417 1,162 1,255 2.2Tullow Urban 48 2,244 2,316 1,119 1,197 3.2Tullowbeg* 46 97 76 32 44 -21.6Tullow Rural* 47 23 25 11 14 8.7
Leighlinbridge Leighlinbridge* 32 508 646 331 315 27.2
Hacketstown Hacketstown* 4 628 614 327 287 -2.2
Borris Borris* 17 584 580 289 291 -0.7
Rathvilly Total – 458 500 259 241 9.2Rathvilly* 8 379 341 174 167 -10.0Rahill* 7 79 159 85 74 101.3
Tinriland Kellistown* 28 331 371 191 180 12.1
Ballon Total – 258 284 145 139 10.1Ballon* 14 239 269 136 133 12.6Rathrush* 40 19 15 9 6 -21.1
Graiguenamanagh-Tinnahinch (pt.)(b) Tinnahinch* 54 261 269 139 130 3.1
Bunclody-Carrickduff (pt.)(b) Cranemore* 23 243 251 120 131 3.3
Kernanstown Total – 277 244 121 123 -11.9Carlow Rural* 19 192 170 85 85 -11.5Johnstown* 27 85 74 36 38 -12.9
Clonegal (pt.)(b) Clonegall* 21 164 151 80 71 -7.9
Dublin County and City
Greater Dublin Area Total – 952,692 1004614 485,209 519,405 5.5
Dublin Dublin City – 481,854 495,781 237,813 257,968 2.9
Greater Dublin Suburbs Total – 470,838 508,833 247,396 261,437 8.1
Note 1 Towns with legally defined boundaries are listed in Appendix 3.
Note 2 The composition of Towns and Boroughs whose boundaries have been extended is shown in Appendix 4.
(b) Towns which are located in more than one County are listed in Appendix 5.

Census 2002 Areas22
Table 5 (contd.) Population of Towns ordered by County and size, 1996 and 2002
Town Electoral Division, etc.( * = part of ED)
Ref. No.of ED
inTable 6
1996 2002 Percentagechange
1996-2002Persons Persons Males Females
Dublin County and City (contd.)
Greater Dublin Suburbs inDun Laoghaire-Rathdown Total – 184,829 186,641 88,850 97,791 1.0
Ballinteer-Broadford 1 3,354 3,213 1,575 1,638 -4.2Ballinteer-Ludford 2 2,679 2,355 1,153 1,202 -12.1Ballinteer-Marley 3 2,763 2,602 1,275 1,327 -5.8Ballinteer-Meadowbroads 4 1,845 1,729 851 878 -6.3Ballinteer-Meadowmount 5 2,127 1,908 936 972 -10.3Ballinteer-Woodpark 6 4,230 4,312 2,103 2,209 1.9Ballybrack 7 3,731 3,433 1,692 1,741 -8.0Blackrock-Booterstown 8 2,283 2,888 1,291 1,597 26.5Blackrock-Carysfort 9 4,986 5,555 2,625 2,930 11.4Blackrock-Central 10 3,386 3,648 1,715 1,933 7.7Blackrock-Glenomena 11 1,795 1,839 820 1,019 2.5Blackrock-Monkstown 12 3,283 3,146 1,379 1,767 -4.2Blackrock-Newpark 13 2,374 2,272 1,057 1,215 -4.3Blackrock-Seapoint 14 1,518 1,403 649 754 -7.6Blackrock-Stradbrook 15 2,296 2,383 1,113 1,270 3.8Blackrock-Templehill 16 2,666 2,700 1,194 1,506 1.3Blackrock-Williamstown 17 2,444 2,723 1,278 1,445 11.4Cabinteely-Granitefield 18 2,666 2,407 1,192 1,215 -9.7Cabinteely-Kilbogget 19 3,465 3,258 1,631 1,627 -6.0Cabinteely-Loughlinstown* 20 737 1,387 681 706 88.2Cabinteely-Pottery 21 4,977 4,946 2,370 2,576 -0.6Churchtown-Castle 22 1,278 1,248 576 672 -2.3Churchtown-Landscape 23 1,273 1,224 576 648 -3.8Churchtown-Nutgrove 24 3,692 3,375 1,641 1,734 -8.6Churchtown-Orwell 25 2,004 1,957 895 1,062 -2.3Churchtown-Woodlawn 26 1,273 1,288 611 677 1.2Clonskeagh-Belfield 27 1,988 2,138 919 1,219 7.5Clonskeagh-Farranboley 28 1,638 1,485 688 797 -9.3Clonskeagh-Milltown 29 1,808 1,845 876 969 2.0Clonskeagh-Roebuck 30 1,789 1,791 812 979 0.1Clonskeagh-Windy Arbour 31 2,353 2,394 1,148 1,246 1.7Dalkey-Avondale 32 1,534 1,446 669 777 -5.7Dalkey-Bullock 33 1,809 1,762 792 970 -2.6Dalkey-Coliemore 34 1,463 1,445 654 791 -1.2Dalkey Hill 35 1,586 1,584 726 858 -0.1Dalkey Upper 36 2,262 2,168 1,019 1,149 -4.2Dundrum-Balally 37 5,564 5,086 2,532 2,554 -8.6Dundrum-Kilmacud 38 2,364 2,411 1,159 1,252 2.0Dundrum-Sandyford 39 5,203 4,862 2,332 2,530 -6.6Dundrum-Sweetmount 40 2,136 1,993 979 1,014 -6.7Dundrum-Taney 41 2,751 2,785 1,328 1,457 1.2Dun Laoghaire-East Central 42 2,000 2,144 1,028 1,116 7.2Dun Laoghaire-Glasthule 43 2,812 2,665 1,216 1,449 -5.2Dun Laoghaire-Glenageary 44 2,020 1,951 939 1,012 -3.4Dun Laoghaire-Monkstown Farm 45 2,135 2,115 1,033 1,082 -0.9Dun Laoghaire-Mount Town 46 1,881 1,619 755 864 -13.9Dun Laoghaire-Sallynoggin East 47 3,239 3,078 1,404 1,674 -5.0Dun Laoghaire-Sallynoggin South 48 1,473 1,388 650 738 -5.8Dun Laoghaire-Sallynoggin West 49 2,176 2,130 1,022 1,108 -2.1Dun Laoghaire-Sandycove 50 3,624 3,761 1,744 2,017 3.8Dun Laoghaire-Salthill 51 1,428 1,593 782 811 11.6Dun Laoghaire-West Central 52 1,988 2,003 880 1,123 0.8Foxrock-Beechpark 53 1,944 1,787 842 945 -8.1Foxrock-Carrickmines 54 5,747 6,050 2,949 3,101 5.3Foxrock-Deans Grange 55 2,658 2,609 1,280 1,329 -1.8Foxrock-Torquay 56 1,307 1,310 630 680 0.2Glencullen* 57 7,166 9,327 4,706 4,621 30.2Killiney North 58 3,943 3,558 1,727 1,831 -9.8Killiney South 59 6,962 7,042 3,323 3,719 1.1Shankill-Rathmichael* 60 1,841 2,587 1,266 1,321 40.5Shankill-Rathsallagh 61 3,366 3,485 1,680 1,805 3.5Shankill-Shanganagh* 62 3,651 3,659 1,808 1,851 0.2Stillorgan-Deerpark 63 3,024 2,915 1,349 1,566 -3.6Stillorgan-Kilmacud 64 3,894 4,003 1,904 2,099 2.8Stillorgan-Leopardstown 65 2,379 2,173 1,027 1,146 -8.7Stillorgan-Merville 66 2,803 2,847 1,316 1,531 1.6Stillorgan-Mount Merrion 67 2,418 2,446 1,115 1,331 1.2Stillorgan-Priory 68 1,577 1,869 890 979 18.5Tibradden 69 – 133 73 60 –

Census 2002 Areas23
Table 5 (contd.) Population of Towns ordered by County and size, 1996 and 2002
Town Electoral Division, etc.( * = part of ED)
Ref. No.of ED
inTable 6
1996 2002 Percentagechange
1996-2002Persons Persons Males Females
Dublin County and City (contd.)
Greater Dublin Suburbs inFingal Total – 77,331 93,011 45,975 47,036 20.3
Baldoyle* 4 6,731 6,371 3,135 3,236 -5.3Blanchardstown-Abbotstown* 8 1,019 2,442 1,137 1,305 139.6Blanchardstown-Blakestown* 9 14,596 24,139 12,141 11,998 65.4Blanchardstown-Coolmine 10 7,969 9,202 4,677 4,525 15.5Blanchardstown-Corduff 11 4,725 4,346 2,109 2,237 -8.0Blanchardstown-Delwood 12 4,235 4,589 2,279 2,310 8.4Blanchardstown-Mulhuddart* 13 1,085 1,804 887 917 66.3Blanchardstown-Roselawn 14 2,303 2,043 999 1,044 -11.3Blanchardstown-Tyrrelstown* 15 1,414 1,628 710 918 15.1Castleknock-Knockmaroon 16 11,095 14,859 7,344 7,515 33.9Castleknock Park* 17 4,780 4,514 2,239 2,275 -5.6Dubber 20 – 88 43 45 –Howth 24 9,008 8,706 4,250 4,456 -3.4Sutton 35 6,510 6,203 2,991 3,212 -4.7The Ward 41 – 360 185 175 –Turnapin 42 1,861 1,717 849 868 -7.7
Greater Dublin Suburbs inSouth Dublin Total – 208,678 229,181 112,571 116,610 9.8
Ballinascorney 1 – 235 129 106 –Ballyboden 2 5,260 5,285 2,579 2,706 0.5Bohernabreena* 3 1,605 2,924 1,438 1,486 82.2Clondalkin-Ballymount* 4 1,766 1,966 996 970 11.3Clondalkin-Cappaghmore* 5 1,745 1,577 742 835 -9.6Clondalkin-Dunawley* 6 9,190 10,656 5,127 5,529 16.0Clondalkin-Monastery 7 8,633 9,363 4,650 4,713 8.5Clondalkin-Moorfield 8 6,697 6,246 3,084 3,162 -6.7Clondalkin-Rowlagh 9 5,238 4,504 2,207 2,297 -14.0Clondalkin Village* 10 8,066 8,517 4,196 4,321 5.6Edmondstown* 11 4,565 5,552 2,709 2,843 21.6Firhouse-Ballycullen* 12 4,532 6,490 3,222 3,268 43.2Firhouse-Knocklyon 13 4,629 4,331 2,154 2,177 -6.4Firhouse Village 14 6,859 9,024 4,477 4,547 31.6Lucan-Esker* 15 7,364 20,776 10,391 10,385 182.1Lucan Heights* 16 5,767 5,673 2,782 2,891 -1.6Lucan-St. Helen’s* 17 6,690 6,823 3,410 3,413 2.0Palmerston Village 19 3,961 3,929 1,898 2,031 -0.8Palmerston West* 20 8,401 8,095 3,971 4,124 -3.6Rathfarnham-Ballyroan 22 2,903 2,679 1,292 1,387 -7.7Rathfarnham-Butterfield 23 3,323 3,222 1,532 1,690 -3.0Rathfarnham-Hermitage 24 4,284 4,468 2,163 2,305 4.3Rathfarnham-St. Enda’s 25 4,493 4,234 1,962 2,272 -5.8Rathfarnham Village 26 2,757 3,114 1,462 1,652 12.9Tallaght-Avonbeg 28 1,967 1,645 792 853 -16.4Tallaght-Belgard* 29 2,057 1,962 1,013 949 -4.6Tallaght-Fettercairn* 30 5,430 6,436 3,060 3,376 18.5Tallaght-Glenview 31 1,430 1,496 740 756 4.6Tallaght-Jobstown* 32 7,279 9,824 4,831 4,993 35.0Tallaght-Killinardan 33 4,970 4,700 2,223 2,477 -5.4Tallaght-Kilnamanagh 34 5,633 5,323 2,695 2,628 -5.5Tallaght-Kiltipper* 35 5,176 5,275 2,602 2,673 1.9Tallaght-Kingswood 36 4,539 4,250 2,131 2,119 -6.4Tallaght-Millbrook 37 4,508 3,917 1,963 1,954 -13.1Tallaght-Oldbawn 38 5,040 4,580 2,290 2,290 -9.1Tallaght-Springfield 39 7,803 7,787 3,918 3,869 -0.2Tallaght-Tymon 40 6,289 5,604 2,754 2,850 -10.9Templeogue-Cypress 41 3,253 3,079 1,543 1,536 -5.3Templeogue-Kimmage Manor 42 3,520 4,396 2,173 2,223 24.9Templeogue-Limekiln 43 4,261 3,874 1,852 2,022 -9.1Templeogue-Orwell 44 2,871 2,629 1,324 1,305 -8.4Templeogue-Osprey 45 3,029 2,798 1,385 1,413 -7.6Templeogue Village 46 1,728 1,607 738 869 -7.0Terenure-Cherryfield 47 2,341 2,228 1,083 1,145 -4.8Terenure-Greentrees 48 3,201 2,980 1,418 1,562 -6.9Terenure-St. James 49 3,625 3,108 1,470 1,638 -14.3

Census 2002 Areas24
Table 5 (contd.) Population of Towns ordered by County and size, 1996 and 2002
Town Electoral Division, etc.( * = part of ED)
Ref. No.of ED
inTable 6
1996 2002 Percentagechange
1996-2002Persons Persons Males Females
Dublin County and City (contd.)
Towns in Dun Laoghaire-Rathdown
Environs of Bray (pt.)(b) Total – 2,163 2,949 1,407 1,542 36.3Shankill-Shanganagh* 62 1,615 1,632 781 851 1.1Shankill-Rathmichael* 60 548 1,317 626 691 140.3
Glencullen Glencullen* 57 – 204 90 114 –
Towns in Fingal
Swords Total – 22,314 27,175 13,494 13,681 21.8Swords-Forrest* 36 7,768 8,894 4,340 4,554 14.5Swords-Glasmore* 37 6,975 7,569 3,809 3,760 8.5Swords-Lissenhall* 38 2,790 5,581 2,789 2,792 100.0Swords-Seatown* 39 2,481 2,559 1,269 1,290 3.1Swords Village 40 2,300 2,572 1,287 1,285 11.8
Malahide Total – 13,539 13,826 6,824 7,002 2.1Malahide West* 30 6,438 6,307 3,115 3,192 -2.0Malahide East* 29 5,179 5,236 2,578 2,658 1.1Swords-Seatown* 39 1,834 2,174 1,077 1,097 18.5Kinsaley* 26 88 109 54 55 23.9
Balbriggan Balbriggan Urban 3 5,743 6,631 3,286 3,345 15.5
Environs of Balbriggan Balbriggan Rural* 2 2,730 3,663 1,785 1,878 34.2
Skerries Total – 7,339 9,149 4,500 4,649 24.7Skerries 34 5,704 7,612 3,733 3,879 33.5Holmpatrick* 23 1,635 1,537 767 770 -6.0
Portmarnock Total – 9,145 8,376 4,190 4,186 -8.4Portmarnock North 31 5,582 5,071 2,542 2,529 -9.2Portmarnock South* 32 3,563 3,305 1,648 1,657 -7.2
Rush Total – 5,429 6,769 3,412 3,357 24.7Rush* 33 5,388 6,711 3,384 3,327 24.6Lusk* 28 41 58 28 30 41.5
Donabate Donabate* 19 1,868 3,854 1,908 1,946 106.3
Lusk Lusk* 28 2,287 2,456 1,220 1,236 7.4
Kinsealy-Drinan Kinsaley* 26 2,182 2,110 1,061 1,049 -3.3
Portrane Donabate* 19 1,924 1,726 890 836 -10.3
Loughshinny Holmpatrick* 23 614 663 344 319 8.0
Rivermeade Kilsallaghan* 25 621 558 274 284 -10.1
Ballyboghil Ballyboghil* 6 296 313 148 165 5.7
Garristown Garristown* 21 228 289 149 140 26.8
Naul Hollywood* 22 – 215 109 106 –
Oldtown Clonmethan* 18 – 162 81 81 –
Towns in South Dublin
Rathcoole Total – 2,784 2,499 1,290 1,209 -10.2Rathcoole* 21 2,735 2,459 1,270 1,189 -10.1Newcastle* 18 49 40 20 20 -18.4
Newcastle Newcastle* 18 1,289 1,160 581 579 -10.0
Saggart Saggart* 27 550 588 302 286 6.9
Brittas Total – 187 174 88 86 -7.0Saggart* 27 109 103 55 48 -5.5Ballinascorney* 1 78 71 33 38 -9.0

Census 2002 Areas25
Table 5 (contd.) Population of Towns ordered by County and size, 1996 and 2002
Town Electoral Division, etc.( * = part of ED)
Ref. No.of ED
inTable 6
1996 2002 Percentagechange
1996-2002Persons Persons Males Females
Kildare County
Naas Naas Urban 3 14,074 18,288 9,250 9,038 29.9
Celbridge Total – 12,289 16,016 8,035 7,981 30.3Celbridge* 34 10,704 13,979 7,029 6,950 30.6Donaghcumper* 37 1,585 2,037 1,006 1,031 28.5
Droichead Nua Total – 12,970 15,749 7,808 7,941 21.4Droichead Nua (Newbridge) Urban 66 6,586 7,684 3,802 3,882 16.7Morristownbiller* 78 6,384 8,065 4,006 4,059 26.3
Environs of Droichead Nua Total – 393 990 502 488 151.9Morristownbiller* 78 341 948 483 465 178.0Droichead Nua (Newbridge) Rural* 65 38 36 16 20 -5.3Oldconnell* 81 14 6 3 3 -57.1
Leixlip Total – 13,451 15,016 7,568 7,448 11.6Leixlip* 39 13,423 14,984 7,555 7,429 11.6Celbridge* 34 28 32 13 19 14.3
Maynooth Maynooth* 40 8,528 10,151 4,958 5,193 19.0
Athy Athy Town – 5,306 6,049 2,965 3,084 14.0Athy East Urban 1 2,291 2,862 1,391 1,471 24.9Athy West Urban 2 2,171 2,399 1,170 1,229 10.5Athy Rural* 4 844 788 404 384 -6.6
Kildare Kildare* 71 4,278 5,694 2,916 2,778 33.1
Clane Total – 3,126 4,417 2,196 2,221 41.3Clane* 62 3,058 4,353 2,164 2,189 42.3Balraheen* 33 68 64 32 32 -5.9
Sallins Total – 854 2,922 1,468 1,454 242.2Bodenstown* 59 531 2,194 1,103 1,091 313.2Naas Rural* 79 323 728 365 363 125.4
Kilcock Total – 1,825 2,740 1,310 1,430 50.1Kilcock* 38 1,815 2,733 1,308 1,425 50.6Cloncurry* 35 10 7 2 5 -30.0
Monasterevan Monasterevin* 27 2,302 2,583 1,234 1,349 12.2
Kill Kill* 72 1,711 2,246 1,132 1,114 31.3
Rathangan Total – 1,190 1,811 917 894 52.2Rathangan* 53 1,022 1,329 676 653 30.0Killinthomas* 49 168 299 141 158 78.0Thomastown* 54 – 183 100 83 –
Prosperous Downings* 64 814 1,523 746 777 87.1
Kilcullen Total – 1,604 1,483 726 757 -7.5Kilcullen* 70 1,037 915 446 469 -11.8Carnalway* 60 567 568 280 288 0.2
Derrinturn Total – 544 791 394 397 45.4Carbury* 44 457 582 288 294 27.4Windmill Cross* 55 87 209 106 103 140.2
Ballymore Eustace Ballymore Eustace* 56 719 786 380 406 9.3
Castledermot Total – 733 726 347 379 -1.0Castledermot* 13 649 598 283 315 -7.9Graney* 17 84 128 64 64 52.4
Coill Dubh (or Blackwood) Total – 682 592 305 287 -13.2Robertstown* 86 669 579 298 281 -13.5Timahoe South* 88 13 13 7 6 –
Brownstown Ballysax East* 57 462 500 254 246 8.2
Suncroft Ballysax West* 58 490 498 279 219 1.6
Allenwood Kilmeage North* 74 341 481 260 221 41.1

Census 2002 Areas26
Table 5 (contd.) Population of Towns ordered by County and size, 1996 and 2002
Town Electoral Division, etc.( * = part of ED)
Ref. No.of ED
inTable 6
1996 2002 Percentagechange
1996-2002Persons Persons Males Females
Kildare County (contd.)
Kilmeage Kilmeage South* 75 451 436 215 221 -3.3
Kilberry Total – 466 417 225 192 -10.5Kilberry* 22 457 412 221 191 -9.8Bert* 10 9 5 4 1 -44.4
Ballyoulster Total – 399 411 209 202 3.0Donaghcumper* 37 373 389 198 191 4.3Celbridge* 34 26 22 11 11 -15.4
Robertstown Robertstown* 86 206 375 186 189 82.0
Ballytore Total – 295 338 171 167 14.6Ballitore* 6 284 326 163 163 14.8Narraghmore* 29 11 12 8 4 9.1
Straffan Straffan* 41 341 332 178 154 -2.6
Milltown Total – 297 271 137 134 -8.8Feighcullen* 68 245 193 96 97 -21.2Morristownbiller* 78 52 78 41 37 50.0
Carragh Carragh* 61 – 242 128 114 –
Ladytown Total – – 242 125 117 –Ladytown* 77 – 212 109 103 –Carnalway* 60 – 30 16 14 –
Nurney Nurney* 30 – 239 130 109 –
Johnstown Cadamstown* 43 – 211 105 106 –
Maddenstown Total – 189 179 89 90 -5.3Kildare* 71 132 127 65 62 -3.8Ballysax West* 58 57 52 24 28 -8.8
Grangemore Gilltown* 69 – 171 76 95 –
Ballysax Ballysax East* 57 – 170 76 94 –
Ballyroe Grangemellon* 18 – 151 74 77 –
Kilkenny County
Kilkenny Kilkenny Borough – 8,507 8,591 4,178 4,413 1.0Kilkenny No. 1 Urban 1 4,546 4,857 2,342 2,515 6.8Kilkenny No. 2 Urban 2 3,961 3,734 1,836 1,898 -5.7
Environs of Kilkenny Kilkenny Rural* 50 10,189 12,144 5,840 6,304 19.2
Suburbs of Waterford Total – 1,615 2,142 1,014 1,128 32.6Kilculliheen* 106 1,506 2,042 960 1,082 35.6Aglish* 99 93 85 46 39 -8.6Rathpatrick* 111 16 15 8 7 -6.2
Thomastown Total – 1,581 1,600 779 821 1.2Thomastown* 84 1,181 1,217 593 624 3.0Jerpoint Church* 76 400 383 186 197 -4.2
Castlecomer-Donaguile Castlecomer* 26 1,380 1,482 698 784 7.4
Callan Callan Urban 5 1,224 1,325 639 686 8.3

Census 2002 Areas27
Table 5 (contd.) Population of Towns ordered by County and size, 1996 and 2002
Town Electoral Division, etc.( * = part of ED)
Ref. No.of ED
inTable 6
1996 2002 Percentagechange
1996-2002Persons Persons Males Females
Kilkenny County (contd.)
Graiguenamanagh-Tinnahinch (pt.)(b) Graiguenamanagh* 74 1,113 1,166 596 570 4.8
Mooncoin Total – 855 854 423 431 -0.1Pollrone* 109 503 484 240 244 -3.8Portnascully* 110 352 370 183 187 5.1
Ballyragget Total – 803 821 414 407 2.2Ballyragget* 25 796 813 409 404 2.1Ballyconra* 89 7 8 5 3 14.3
Piltown Pilltown* 19 716 778 388 390 8.7
Freshford Freshford* 47 632 756 389 367 19.6
Urlingford Urlingford* 98 689 739 377 362 7.3
Bennettsbridge Total – 601 735 378 357 22.3Bennettsbridge* 64 490 624 325 299 27.3Danesfort* 69 64 65 33 32 1.6Outrath* 53 47 46 20 26 -2.1
Moneenroe Total – 655 678 340 338 3.5Moneenroe* 30 561 606 300 306 8.0Clogh* 27 94 72 40 32 -23.4
Kilmacow Ullid* 113 599 566 284 282 -5.5
Johnstown Johnstown* 94 460 517 261 256 12.4
Slieverue Rathpatrick* 111 296 461 209 252 55.7
Gowran Gowran* 48 476 454 224 230 -4.6
Goresbridge Goresbridge* 73 407 401 195 206 -1.5
Clogh-Chatsworth Clogh* 27 272 320 149 171 17.6
Mullinavat Total – 275 309 160 149 12.4Killahy* 107 253 285 149 136 12.6Farnoge* 102 22 24 11 13 9.1
Paulstown Total – 221 292 146 146 32.1Shankill* 58 172 187 91 96 8.7Paulstown* 54 49 105 55 50 114.3
Lawcus Total – – 273 145 128 –Ennisnag* 70 – 161 86 75 –Stonyford* 83 – 112 59 53 –
Inistioge Inistioge* 75 260 266 137 129 2.3
Kilmoganny Kilmaganny* 11 247 236 122 114 -4.5
Kells Kells* 9 – 176 96 80 –
Environs of New Ross (pt.)(b) Rosbercon Rural* 37 140 115 60 55 -17.9
Laoighis County
Portlaoighise Portlaoighise (Maryborough) Urban 72 3,531 3,482 1,799 1,683 -1.4
Environs of Portlaoighise Total – 5,943 8,645 4,458 4,187 45.5Portlaoighise (Maryborough) Rural* 71 5,823 8,538 4,411 4,127 46.6Clondarrig* 51 98 94 41 53 -4.1Borris* 44 22 13 6 7 -40.9

Census 2002 Areas28
Table 5 (contd.) Population of Towns ordered by County and size, 1996 and 2002
Town Electoral Division, etc.( * = part of ED)
Ref. No.of ED
inTable 6
1996 2002 Percentagechange
1996-2002Persons Persons Males Females
Laoighis County (contd.)
Mountmellick Mountmellick Urban 66 2,325 2,525 1,268 1,257 8.6
Environs of Mountmellick Total – 587 836 422 414 42.4Mountmellick Rural* 65 380 356 178 178 -6.3Dangans* 54 198 467 239 228 135.9Graigue* 57 9 13 5 8 44.4
Portarlington (pt.)(b) Portarlington South* 70 2,162 2,756 1,377 1,379 27.5
Abbeyleix Abbeyleix* 1 1,259 1,383 684 699 9.8
Mountrath Mountrath* 67 1,298 1,331 661 670 2.5
Environs of Carlow (pt.)(b) Graigue Rural* 94 870 1,199 585 614 37.8
Stradbally Stradbally* 36 1,047 1,178 559 619 12.5
Rathdowney Total – 1,066 1,111 564 547 4.2Rathdowney* 26 1,016 1,054 534 520 3.7Rathsaran* 87 50 57 30 27 14.0
Durrow Durrow* 17 696 717 347 370 3.0
Clonaslee Clonaslee* 50 504 538 266 272 6.7
Ballylinan Ballylynan* 29 406 430 221 209 5.9
Borris-in-Ossory Borris-in-Ossory* 80 282 379 193 186 34.4
Ballinakill Ballinakill* 3 299 328 167 161 9.7
Castletown Castletown* 7 294 289 156 133 -1.7
Newtown Total – 207 245 118 127 18.4Doonane* 92 180 217 103 114 20.6Newtown* 95 27 28 15 13 3.7
Emo Emo* 55 231 220 117 103 -4.8
Ballyroan Ballyroan* 4 173 142 66 76 -17.9
Longford County
Longford Longford Town – 6,444 6,831 3,290 3,541 6.0Longford No. 1 Urban 1 2,989 2,841 1,380 1,461 -5.0Longford No. 2 Urban 2 709 711 367 344 0.3Longford Rural* 51 2,746 3,279 1,543 1,736 19.4
Environs of Longford Total – 540 726 340 386 34.4Caldragh* 43 291 328 156 172 12.7Longford Rural* 51 249 398 184 214 59.8
Granard Granard Urban 27 1,173 1,013 525 488 -13.6
Ballymahon Ballymahon* 4 790 827 400 427 4.7
Meathas Truim(or Edgeworthstown) Total – 737 726 343 383 -1.5
Meathas Truim* 30 728 687 323 364 -5.6Crosagstown* 20 9 39 20 19 333.3
Lanesborough-Ballyleague (pt.)(b) Rathcline* 55 596 575 281 294 -3.5
Newtownforbes Total – 470 561 273 288 19.4Newtown Forbes* 54 370 445 208 237 20.3Caldragh* 43 100 116 65 51 16.0
Drumlish Total – 274 277 130 147 1.1Drumlish* 48 226 235 102 133 4.0Breanrisk* 42 48 42 28 14 -12.5
Keenagh Kilcommock* 10 223 225 108 117 0.9

Census 2002 Areas29
Table 5 (contd.) Population of Towns ordered by County and size, 1996 and 2002
Town Electoral Division, etc.( * = part of ED)
Ref. No.of ED
inTable 6
1996 2002 Percentagechange
1996-2002Persons Persons Males Females
Louth County
Dundalk Dundalk Town – 25,762 27,385 13,250 14,135 6.3Dundalk Urban No. 1 4 2,383 2,490 1,205 1,285 4.5Dundalk Urban No. 2 5 1,114 1,064 554 510 -4.5Dundalk Urban No. 3 6 1,473 1,430 690 740 -2.9Dundalk Urban No. 4 7 5,613 6,527 3,210 3,317 16.3Castletown* 23 1,390 1,552 721 831 11.7Dundalk Rural* 27 13,664 14,206 6,812 7,394 4.0Haggardstown* 30 125 116 58 58 -7.2
Environs of Dundalk Total – 4,433 5,120 2,525 2,595 15.5Haggardstown* 30 3,698 4,287 2,114 2,173 15.9Castletown* 23 379 417 209 208 10.0Dundalk Rural* 27 283 347 165 182 22.6Dromiskin* 14 73 69 37 32 -5.5
Drogheda Drogheda Borough – 24,460 28,333 13,818 14,515 15.8Fair Gate 1 10,454 10,852 5,281 5,571 3.8St. Laurence Gate 2 3,423 3,566 1,707 1,859 4.2West Gate 3 5,868 6,412 3,175 3,237 9.3St. Mary’s* 47 2,959 4,738 2,287 2,451 60.1St. Peter’s* 41 1,756 2,765 1,368 1,397 57.5
Environs of Drogheda (pt.)(b) St. Peter’s* 41 36 554 291 263 1,438.9
Ardee Ardee Urban 9 3,440 3,564 1,740 1,824 3.6
Environs of Ardee Ardee Rural* 8 351 384 190 194 9.4
Dunleer Dunleer* 16 988 1,014 507 507 2.6
Dromiskin Dromiskin* 14 629 949 460 489 50.9
Clogherhead Clogher* 37 775 906 435 471 16.9
Castlebellingham/Kilsaran Castlebellingham* 10 792 721 358 363 -9.0
Tullyallen Total – 429 617 310 307 43.8St. Peter’s* 41 394 590 297 293 49.7Monasterboice* 39 35 27 13 14 -22.9
Carlingford Carlingford* 21 647 604 288 316 -6.6
Louth Louth* 33 401 514 263 251 28.2
Termonfeckin Termonfeckin* 42 530 503 251 252 -5.1
Tallanstown Total – 408 443 223 220 8.6Tallanstown* 18 315 344 170 174 9.2Mansfieldstown* 34 93 99 53 46 6.5
Collon Collon* 12 308 424 215 209 37.7
Knockbridge Total – 274 335 170 165 22.3Castlering* 22 141 214 108 106 51.8Castletown* 23 133 121 62 59 -9.0
Tinure Mullary* 40 – 296 154 142 –
Jenkinstown Total – 233 263 130 133 12.9Jenkinstown* 31 229 201 102 99 -12.2Ballymascanlan* 19 4 62 28 34 1,450.0
Omeath Drummullagh* 26 249 231 114 117 -7.2
Baltray Termonfeckin* 42 130 120 54 66 -7.7

Census 2002 Areas30
Table 5 (contd.) Population of Towns ordered by County and size, 1996 and 2002
Town Electoral Division, etc.( * = part of ED)
Ref. No.of ED
inTable 6
1996 2002 Percentagechange
1996-2002Persons Persons Males Females
Meath County
Navan (An Uaimh) Navan Town – 3,447 3,406 1,668 1,738 -1.2Navan Urban 2 2,747 2,802 1,357 1,445 2.0Navan Rural* 55 700 604 311 293 -13.7
Environs of Navan Total – 9,363 16,011 7,890 8,121 71.0Navan Rural* 55 9,328 15,974 7,873 8,101 71.2Ardbraccan* 49 35 37 17 20 5.7
Ashbourne Total – 4,999 6,362 3,230 3,132 27.3Donaghmore* 8 4,999 5,869 2,972 2,897 17.4Kilbrew* 11 – 493 258 235 –
Trim Trim Town – 1,740 1,447 729 718 -16.8Trim Urban 3 1,447 1,204 600 604 -16.8Trim Rural* 92 293 243 129 114 -17.1
Environs of Trim Trim Rural* 92 2,665 4,447 2,166 2,281 66.9
Laytown-Bettystown-Mornington Total – 3,678 5,597 2,705 2,892 52.2Julianstown* 45 2,034 3,252 1,561 1,691 59.9St. Mary’s* 47 1,644 2,345 1,144 1,201 42.6
Dunboyne Dunboyne* 9 3,080 5,363 2,647 2,716 74.1
Ceannanus Mór Ceannanus Mór (Kells) Town – 2,152 2,522 1,227 1,295 17.2Ceannanus Mór (Kells) Urban 1 1,970 2,362 1,148 1,214 19.9Ceannanus Mór (Kells) Rural* 26 182 160 79 81 -12.1
Environs of Ceannanus Mór Ceannanus Mór (Kells) Rural* 26 1,390 1,899 921 978 36.6
Ratoath Ratoath* 16 1,061 3,794 1,913 1,881 257.6
Dunshaughlin Dunshaughlin* 10 2,139 3,063 1,561 1,502 43.2
Duleek Total – 1,731 2,173 1,079 1,094 25.5Duleek* 44 1,260 1,716 833 883 36.2Ardcath* 43 471 457 246 211 -3.0
Environs of Drogheda (pt.)(b) Total – 786 2,133 1,060 1,073 171.4St. Mary’s* 47 767 2,119 1,055 1,064 176.3Julianstown* 45 19 14 5 9 -26.3
Athboy Total – 1,172 1,538 730 808 31.2Athboy* 70 932 1,265 598 667 35.7Grennanstown* 79 240 273 132 141 13.8
Enfield Innfield* 81 566 1,072 522 550 89.4
Oldcastle Oldcastle* 67 826 937 488 449 13.4
Slane Slane* 58 688 823 420 403 19.6
Ballivor Killaconnigan* 85 383 793 388 405 107.0
Stamullen Stamullin* 48 427 779 394 385 82.4
Summerhill Summerhill* 91 502 668 322 346 33.1
Gormanston Total – 435 504 315 189 15.9Stamullin* 48 413 486 305 181 17.7Julianstown* 45 22 18 10 8 -18.2
Longwood Castlerickard* 74 186 480 224 256 158.1

Census 2002 Areas31
Table 5 (contd.) Population of Towns ordered by County and size, 1996 and 2002
Town Electoral Division, etc.( * = part of ED)
Ref. No.of ED
inTable 6
1996 2002 Percentagechange
1996-2002Persons Persons Males Females
Meath County (contd.)
Julianstown/Whitecross Julianstown* 45 424 422 216 206 -0.5
Drumconrath Drumcondra* 4 351 389 189 200 10.8
Kentstown Kentstown* 54 324 355 177 178 9.6
Donore Duleek* 44 293 334 170 164 14.0
Kilcloon Total – 345 309 157 152 -10.4Culmullin* 7 221 192 97 95 -13.1Rodanstown* 17 124 117 60 57 -5.6
Kilmessan Kilmessan* 13 230 292 148 144 27.0
Clonard Ardnamullan* 69 – 248 131 117 –
Nobber Nobber* 38 242 245 122 123 1.2
Kilmainham Kilmainham* 29 – 237 106 131 –
Balreask Navan Rural* 55 265 221 110 111 -16.6
Rathmolyon Rathmolyon* 89 206 194 97 97 -5.8
Clonee Village Dunboyne* 9 – 173 88 85 –
Kildalkey Kildalkey* 84 149 137 76 61 -8.1
Offaly County
Tullamore Tullamore Urban 2 9,221 10,270 4,908 5,362 11.4
Environs of Tullamore Total – 818 828 416 412 1.2Tullamore Rural* 87 719 741 376 365 3.1Cappancur* 62 99 87 40 47 -12.1
Birr Birr Urban 1 3,355 3,590 1,729 1,861 7.0
Environs of Birr (pt.)(b) Total – 803 821 400 421 2.2Birr Rural* 5 795 814 395 419 2.4Eglish* 14 8 7 5 2 -12.5
Edenderry Edenderry Urban 42 3,591 4,216 2,133 2,083 17.4
Environs of Edenderry Total – 234 343 169 174 46.6Monasteroris* 45 109 162 81 81 48.6Edenderry Rural* 41 125 181 88 93 44.8
Clara Clara* 63 2,464 2,704 1,348 1,356 9.7
Banagher Banagher* 4 1,414 1,553 757 796 9.8
Portarlington (pt.)(b) Portarlington North* 78 1,158 1,245 615 630 7.5

Census 2002 Areas32
Table 5 (contd.) Population of Towns ordered by County and size, 1996 and 2002
Town Electoral Division, etc.( * = part of ED)
Ref. No.of ED
inTable 6
1996 2002Percentage
change1996-2002Persons Persons Males Females
Offaly County (contd.)
Ferbane Total – 1,270 1,198 577 621 -5.7Ferbane* 15 819 748 369 379 -8.7Gallen* 16 299 298 142 156 -0.3Moyclare* 29 152 152 66 86 –
Kilcormac (or Frankford) Kilcormac* 20 889 879 434 445 -1.1
Daingean Daingean* 65 679 777 395 382 14.4
Rhode Ballyburly* 35 476 705 342 363 48.1
Cloghan Cloghan* 7 477 523 264 259 9.6
Mucklagh Screggan* 83 342 521 256 265 52.3
Shinrone Shinrone* 56 479 488 239 249 1.9
Clonbullogue Clonbulloge* 38 329 390 197 193 18.5
Geashill Geashill* 68 363 344 165 179 -5.2
Moneygall Cullenwaine* 50 332 291 151 140 -12.3
Bracknagh Bracknagh* 37 281 259 142 117 -7.8
Belmont Total – 257 252 120 132 -1.9Lumcloon* 26 220 212 102 110 -3.6Moyclare* 29 37 40 18 22 8.1
Shannonbridge Shannonbridge* 31 266 248 136 112 -6.8
Ballycumber Ballycumber* 3 256 248 122 126 -3.1
Coolagary Total – 239 241 126 115 0.8Raheenakeeran* 80 211 209 113 96 -0.9Rathfeston* 81 28 32 13 19 14.3
Kinnitty Kinnitty* 22 249 226 117 109 -9.2
Killeigh Killeigh* 73 211 183 93 90 -13.3
Westmeath County
Athlone Athlone Town – 7,691 7,354 3,554 3,800 -4.4Athlone East Urban 1 4,517 4,092 1,974 2,118 -9.4Athlone West Urban 2 3,174 3,262 1,580 1,682 2.8
Environs of Athlone (pt.)(b) Total – 6,639 6,956 3,381 3,575 4.8Athlone East Rural* 3 5,448 5,749 2,771 2,978 5.5Moydrum* 14 1,191 1,207 610 597 1.3
Mullingar Total – 8,040 8,824 4,253 4,571 9.8Mullingar North Urban 90 4,274 5,366 2,571 2,795 25.5Mullingar South Urban 91 3,766 3,458 1,682 1,776 -8.2
Environs of Mullingar Total – 4,452 6,797 3,368 3,429 52.7Mullingar Rural* 89 4,243 6,530 3,240 3,290 53.9Castle* 60 94 185 86 99 96.8Hopestown* 76 74 45 23 22 -39.2Belvidere* 58 41 37 19 18 -9.8

Census 2002 Areas33
Table 5 (contd.) Population of Towns ordered by County and size, 1996 and 2002
Town Electoral Division, etc.( * = part of ED)
Ref. No.of ED
inTable 6
1996 2002 Percentagechange
1996-2002Persons Persons Males Females
Westmeath County (contd.)
Moate Moate* 12 1,452 1,520 724 796 4.7
Rochfortbridge Castlelost* 61 724 1,382 687 695 90.9
Kinnegad Kinnegad* 83 517 1,296 676 620 150.7
Castlepollard Total – 888 895 452 443 0.8Kinturk* 50 872 889 448 441 1.9Coolure* 28 16 6 4 2 -62.5
Kilbeggan Kilbeggan* 79 627 652 337 315 4.0
Killucan-Rathwire Killucan* 82 357 575 286 289 61.1
Tyrrellspass Total – 396 443 210 233 11.9Clonfad* 65 282 283 140 143 0.4Ballykilmore* 55 82 121 54 67 47.6Newtown* 93 32 39 16 23 21.9
Clonmellon Killua* 47 272 403 201 202 48.2
Delvin Total – 305 271 141 130 -11.1Delvin* 41 263 237 124 113 -9.9Rosmead* 52 42 34 17 17 -19.0
Ballynacargy Kilbixy* 80 263 260 132 128 -1.1
Ballymore Ballymore* 19 212 239 119 120 12.7
Raharney Total – 232 232 116 116 –Raharney* 96 173 197 98 99 13.9Riverdale* 51 30 8 4 4 -73.3Ballynaskeagh* 36 29 27 14 13 -6.9
Collinstown Collinstown* 39 212 229 120 109 8.0
Glassan Glassan* 9 198 216 105 111 9.1
Multyfarnham Multyfarnham* 92 – 153 80 73 –
Wexford County
Wexford Wexford Borough – 9,533 9,449 4,612 4,837 -0.9Wexford No. 1 Urban 4 1,889 1,846 895 951 -2.3Wexford No. 2 Urban 5 4,744 4,823 2,344 2,479 1.7Wexford No. 3 Urban 6 1,225 1,351 661 690 10.3Wexford Rural* 123 1,675 1,429 712 717 -14.7
Environs of Wexford Total – 6,329 7,786 3,725 4,061 23.0Wexford Rural* 123 5,974 7,502 3,590 3,912 25.6Ardcavan* 92 355 284 135 149 -20.0
Enniscorthy Enniscorthy Town – 3,788 3,764 1,826 1,938 -0.6Enniscorthy Urban 1 3,128 3,166 1,542 1,624 1.2Enniscorthy Rural* 21 660 598 284 314 -9.4
Environs of Enniscorthy Total – 3,852 5,200 2,489 2,711 35.0Enniscorthy Rural* 21 3,736 5,092 2,432 2,660 36.3Marshalstown* 30 116 108 57 51 -6.9
New Ross New Ross Town – 5,012 4,810 2,338 2,472 -4.0New Ross Urban 2 4,630 4,402 2,135 2,267 -4.9Rosbercon Urban 3 382 408 203 205 6.8

Census 2002 Areas34
Table 5 (contd.) Population of Towns ordered by County and size, 1996 and 2002
Town Electoral Division, etc.( * = part of ED)
Ref. No.of ED
inTable 6
1996 2002 Percentagechange
1996-2002Persons Persons Males Females
Wexford County (contd.)
Environs of New Ross (pt.)(b) New Ross Rural* 82 995 1,612 760 852 62.0
Gorey Gorey Urban 52 2,150 3,090 1,553 1,537 43.7
Environs of Gorey Total – 1,789 2,192 1,078 1,114 22.5Gorey Rural* 51 1,681 1,981 971 1,010 17.8Courtown* 49 108 211 107 104 95.4
Rosslare Rosslare* 118 929 1,145 520 625 23.3
Bunclody-Carrickduff (pt.)(b) Newtownbarry* 32 998 1,110 537 573 11.2
Ballygeary (or Rosslare Harbour) St. Helen’s* 119 1,023 1,038 477 561 1.5
Castlebridge Total – 783 1,013 513 500 29.4Ardcavan* 92 506 784 393 391 54.9Artramon* 94 277 229 120 109 -17.3
Ferns Ferns* 22 915 985 477 508 7.7
Taghmon Taghmon* 121 619 625 300 325 1.0
Courtown Harbour Total – 364 502 249 253 37.9Courtown* 49 274 349 176 173 27.4Ardamine* 39 90 153 73 80 70.0
Piercetown Total – 309 471 235 236 52.4Drinagh* 100 250 356 176 180 42.4Killinick* 109 59 67 39 28 13.6Rathaspick* 117 – 48 20 28 –
Kilmore Quay Kilmore* 111 406 417 208 209 2.7
Coolgreany Coolgreany* 48 356 398 196 202 11.8
Barntown Carrick* 99 410 394 199 195 -3.9
Ford Total – 235 378 168 210 60.9Killincooly* 57 140 237 104 133 69.3Ford* 50 95 141 64 77 48.4
Clonroche Clonroche* 19 407 339 167 172 -16.7
Campile Total – 396 335 167 168 -15.4Kilmokea* 80 339 280 136 144 -17.4Ballyhack* 67 57 55 31 24 -3.5
Camolin Kilcomb* 54 299 320 148 172 7.0
Kilrane St. Helen’s* 119 301 309 150 159 2.7
Duncannon Ballyhack* 67 318 303 159 144 -4.7
Fethard-on-Sea Fethard* 75 290 302 152 150 4.1
Ballycanew Ballycanew* 42 271 302 158 144 11.4
Oilgate Edermine* 20 262 265 139 126 1.1
Murntown Rathaspick* 117 184 243 121 122 32.1
Clongeen Clongeen* 72 – 224 116 108 –
Ballysimon Tinnacross* 37 – 217 108 109 –
Ballycullane Tintern* 89 – 207 92 115 –

Census 2002 Areas35
Table 5 (contd.) Population of Towns ordered by County and size, 1996 and 2002
Town Electoral Division, etc.( * = part of ED)
Ref. No.of ED
inTable 6
1996 2002 Percentagechange
1996-2002Persons Persons Males Females
Wexford County (contd.)
Ballyhack Ballyhack* 67 212 210 109 101 -0.9
Bridgetown Total – 246 183 87 96 -25.6Kilmore* 111 204 141 64 77 -30.9Bridgetown* 98 42 42 23 19 –
Adamstown Adamstown* 65 – 176 97 79 –
Newbawn Newbawn* 81 – 169 91 78 –
Danescastle Bannow* 97 – 168 82 86 –
Castle Ellis Total – – 165 83 82 –Castle Ellis* 17 – 56 29 27 –Castle Talbot* 18 – 109 54 55 –
Grahormac Kilscoran* 113 – 162 82 80 –
Clonegal (pt.)(b) Moyacomb* 31 36 42 23 19 16.7
Wicklow County
Bray Bray Town – 25,252 26,244 12,532 13,712 3.9Bray No.1 3 1,557 1,619 786 833 4.0Bray No.2 4 5,870 5,972 2,770 3,202 1.7Bray No.3 5 6,954 6,684 3,256 3,428 -3.9Rathmichael 6 2,516 2,450 1,157 1,293 -2.6Kilmacanoge* 35 8,355 9,519 4,563 4,956 13.9
Environs of Bray (pt.)(b) Kilmacanoge* 35 508 1,758 863 895 246.1
Greystones Total – 9,995 10,303 5,017 5,286 3.1Greystones 34 6,886 7,315 3,535 3,780 6.2Delgany* 32 3,109 2,988 1,482 1,506 -3.9
Environs of Greystones Total – 1,301 1,610 789 821 23.8Delgany* 32 868 1,159 560 599 33.5Kilcoole* 56 433 451 229 222 4.2
Arklow Arklow Town – 8,519 9,955 4,896 5,059 16.9Arklow No. 1 Urban 1 6,854 7,793 3,861 3,932 13.7Arklow No. 2 Urban 2 1,665 2,162 1,035 1,127 29.8
Environs of Arklow Kilbride 55 38 38 20 18 –
Wicklow Wicklow Urban 7 6,416 7,031 3,457 3,574 9.6
Environs of Wicklow Wicklow Rural* 66 874 2,324 1,167 1,157 165.9
Kilcoole Kilcoole* 56 2,694 2,826 1,405 1,421 4.9
Newtownmountkennedy Total – 2,528 2,521 1,304 1,217 -0.3Newcastle Upper* 61 2,167 2,162 1,111 1,051 -0.2Newcastle Lower* 60 361 359 193 166 -0.6
Blessington Total – 1,860 2,509 1,241 1,268 34.9Blessington* 10 1,851 2,184 1,068 1,116 18.0Burgage* 11 9 325 173 152 3,511.1
Enniskerry Enniskerry* 33 1,275 1,904 926 978 49.3

Census 2002 Areas36
Table 5 (contd.) Population of Towns ordered by County and size, 1996 and 2002
Town Electoral Division, etc.( * = part of ED)
Ref. No.of ED
inTable 6
1996 2002Percentage
change1996-2002Persons Persons Males Females
Wicklow County (contd.)
Rathnew Total – 1,437 1,441 715 726 0.3Wicklow Rural* 66 1,384 1,354 677 677 -2.2Glenealy* 54 53 87 38 49 64.2
Rathdrum Rathdrum* 63 1,234 1,387 683 704 12.4
Ashford Total – 1,215 1,356 665 691 11.6Glenealy* 54 951 1,052 520 532 10.6Killiskey* 57 264 304 145 159 15.2
Baltinglass Baltinglass* 9 1,127 1,260 613 647 11.8
Aughrim Aughrim* 39 745 871 438 433 16.9
Newcastle Newcastle Lower* 60 763 851 424 427 11.5
Kilmacanogue Kilmacanoge* 35 818 834 417 417 2.0
Dunlavin Dunlavin* 14 693 814 407 407 17.5
Carnew Carnew* 71 795 809 401 408 1.8
Tinahely Tinahely* 82 630 692 343 349 9.8
Avoca Total – 490 564 282 282 15.1Avoca* 40 294 301 149 152 2.4Ballyarthur* 44 196 263 133 130 34.2Cronebane* 48 – – – – –
Roundwood Total – 446 518 263 255 16.1Togher* 64 364 436 222 214 19.8Oldtown* 62 82 82 41 41 –
Kilpedder Newcastle Upper* 61 480 517 263 254 7.7
Glenealy Glenealy* 54 383 377 201 176 -1.6
Laragh Brockagh* 46 267 357 174 183 33.7
Shillelagh Shillelagh* 81 324 278 140 138 -14.2
Donard Donard* 13 162 201 103 98 24.1
Stratford Stratford* 26 – 151 78 73 –
Clare County
Ennis Ennis Town – 15,333 18,830 9,018 9,812 22.8Ennis No. 1. Urban 1 2,134 2,017 948 1,069 -5.5Ennis No. 2. Urban 2 2,066 2,339 1,151 1,188 13.2Ennis No. 3. Urban 3 345 497 210 287 44.1Ennis No. 4. Urban 4 1,518 1,488 688 800 -2.0Doora* 29 143 133 69 64 -7.0Ennis Rural* 32 9,076 12,305 5,928 6,377 35.6Spancelhill* 42 51 51 24 27 –Clareabbey* 26 – – – – –
Environs of Ennis Total – 2,393 3,221 1,618 1,603 34.6Clareabbey* 26 1,874 2,027 1,009 1,018 8.2Ennis Rural* 32 519 1,194 609 585 130.1
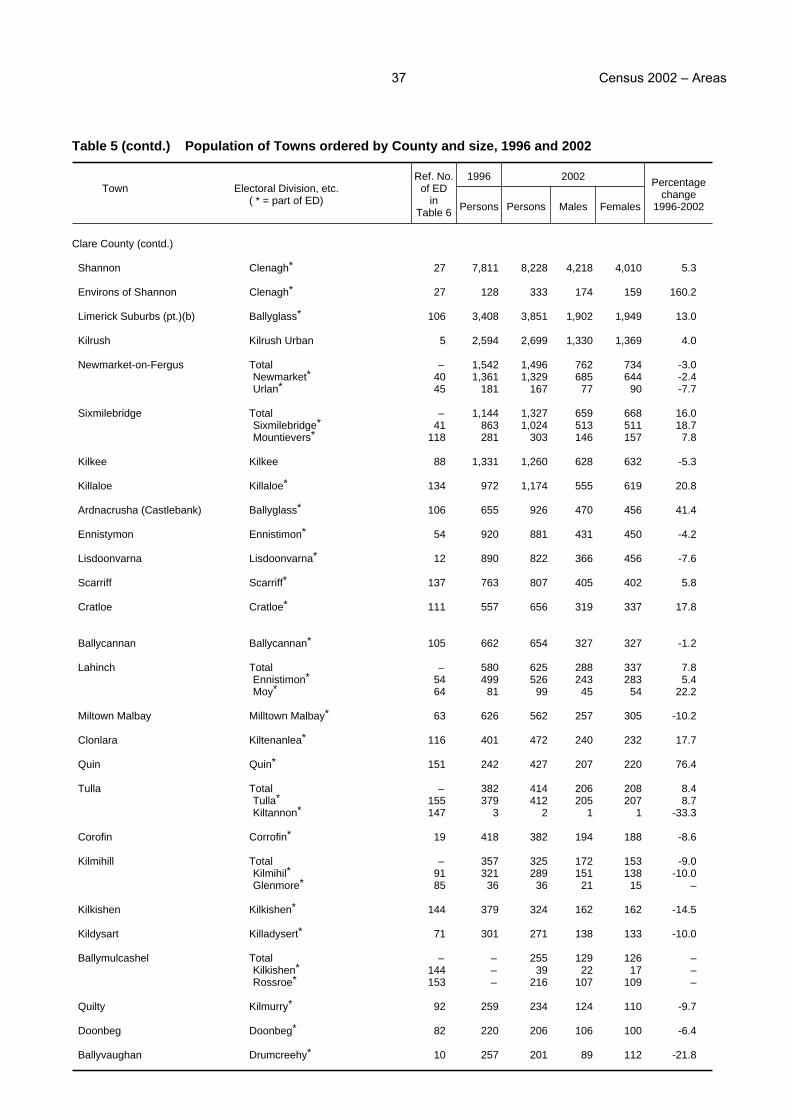
Census 2002 Areas37
Table 5 (contd.) Population of Towns ordered by County and size, 1996 and 2002
Town Electoral Division, etc.( * = part of ED)
Ref. No.of ED
inTable 6
1996 2002 Percentagechange
1996-2002Persons Persons Males Females
Clare County (contd.)
Shannon Clenagh* 27 7,811 8,228 4,218 4,010 5.3
Environs of Shannon Clenagh* 27 128 333 174 159 160.2
Limerick Suburbs (pt.)(b) Ballyglass* 106 3,408 3,851 1,902 1,949 13.0
Kilrush Kilrush Urban 5 2,594 2,699 1,330 1,369 4.0
Newmarket-on-Fergus Total – 1,542 1,496 762 734 -3.0Newmarket* 40 1,361 1,329 685 644 -2.4Urlan* 45 181 167 77 90 -7.7
Sixmilebridge Total – 1,144 1,327 659 668 16.0Sixmilebridge* 41 863 1,024 513 511 18.7Mountievers* 118 281 303 146 157 7.8
Kilkee Kilkee 88 1,331 1,260 628 632 -5.3
Killaloe Killaloe* 134 972 1,174 555 619 20.8
Ardnacrusha (Castlebank) Ballyglass* 106 655 926 470 456 41.4
Ennistymon Ennistimon* 54 920 881 431 450 -4.2
Lisdoonvarna Lisdoonvarna* 12 890 822 366 456 -7.6
Scarriff Scarriff* 137 763 807 405 402 5.8
Cratloe Cratloe* 111 557 656 319 337 17.8
Ballycannan Ballycannan* 105 662 654 327 327 -1.2
Lahinch Total – 580 625 288 337 7.8Ennistimon* 54 499 526 243 283 5.4Moy* 64 81 99 45 54 22.2
Miltown Malbay Milltown Malbay* 63 626 562 257 305 -10.2
Clonlara Kiltenanlea* 116 401 472 240 232 17.7
Quin Quin* 151 242 427 207 220 76.4
Tulla Total – 382 414 206 208 8.4Tulla* 155 379 412 205 207 8.7Kiltannon* 147 3 2 1 1 -33.3
Corofin Corrofin* 19 418 382 194 188 -8.6
Kilmihill Total – 357 325 172 153 -9.0Kilmihil* 91 321 289 151 138 -10.0Glenmore* 85 36 36 21 15 –
Kilkishen Kilkishen* 144 379 324 162 162 -14.5
Kildysart Killadysert* 71 301 271 138 133 -10.0
Ballymulcashel Total – – 255 129 126 –Kilkishen* 144 – 39 22 17 –Rossroe* 153 – 216 107 109 –
Quilty Kilmurry* 92 259 234 124 110 -9.7
Doonbeg Doonbeg* 82 220 206 106 100 -6.4
Ballyvaughan Drumcreehy* 10 257 201 89 112 -21.8

Census 2002 Areas38
Table 5 (contd.) Population of Towns ordered by County and size, 1996 and 2002
Town Electoral Division, etc.( * = part of ED)
Ref. No.of ED
inTable 6
1996 2002 Percentagechange
1996-2002Persons Persons Males Females
Clare County (contd.)
O’Briensbridge-Montpelier (pt.)(b) O’Briensbridge* 119 232 197 110 87 -15.1
Whitegate Drummaan* 130 200 193 90 103 -3.5
Feakle Total – 159 149 59 90 -6.3Ayle* 120 125 121 45 76 -3.2Feakle* 131 34 28 14 14 -17.6
Ardskeagh Kilseily* 115 – 149 75 74 –
Kilfenora Kilfenora* 56 – 128 59 69 –
Liscannor Liscannor* 60 – 108 49 59 –
Cork County and City
Cork Cork City – 127,187 123,062 59,263 63,799 -3.2
Cork Suburbs Total – 52,767 63,177 31,085 32,092 19.7Douglas* 86 13,960 15,286 7,535 7,751 9.5Ballincollig* 75 13,288 14,591 7,156 7,435 9.8Lehenagh* 96 5,737 7,969 3,924 4,045 38.9Rathcooney* 101 5,158 6,066 3,037 3,029 17.6Caherlag* 81 4,106 5,221 2,617 2,604 27.2Inishkenny* 92 3,835 4,563 2,108 2,455 19.0St. Mary’s* 103 3,021 4,088 2,023 2,065 35.3Riverstown* 102 2,138 3,506 1,751 1,755 64.0Carrigtohill* 249 517 599 283 316 15.9Whitechurch* 104 506 571 282 289 12.8Carrigrohane Beg* 84 271 494 251 243 82.3Bishopstown* 78 106 113 60 53 6.6Blarney* 80 85 101 53 48 18.8Monkstown Rural* 98 39 9 5 4 -76.9
Cobh Cobh Urban 2 6,468 6,767 3,372 3,395 4.6
Environs of Cobh Cobh Rural* 85 1,991 3,044 1,502 1,542 52.9
Carrigaline Total – 7,827 11,191 5,525 5,666 43.0Carrigaline (Cork r.a.)* 82 5,420 7,632 3,778 3,854 40.8Liscleary* 193 1,438 2,667 1,311 1,356 85.5Carrigaline (Kinsale r.a.)* 183 969 892 436 456 -7.9
Mallow Mallow Town – 6,434 7,091 3,394 3,697 10.2Mallow North Urban 6 3,311 3,996 1,914 2,082 20.7Mallow South Urban 7 3,123 3,095 1,480 1,615 -0.9
Environs of Mallow Mallow Rural* 235 1,334 1,846 906 940 38.4
Midleton Midleton Urban 8 3,266 3,798 1,821 1,977 16.3
Environs of Midleton Total – 2,943 4,159 2,066 2,093 41.3Midleton Rural* 260 2,434 3,410 1,678 1,732 40.1Cloyne* 252 487 729 381 348 49.7Carrigtohill* 249 22 20 7 13 -9.1
Youghal Youghal Town – 5,630 6,203 3,070 3,133 10.2Youghal Urban 10 5,630 6,203 3,070 3,133 10.2Youghal Rural* 325 – – – – –
Environs of Youghal Youghal Rural* 325 313 394 188 206 25.9

Census 2002 Areas39
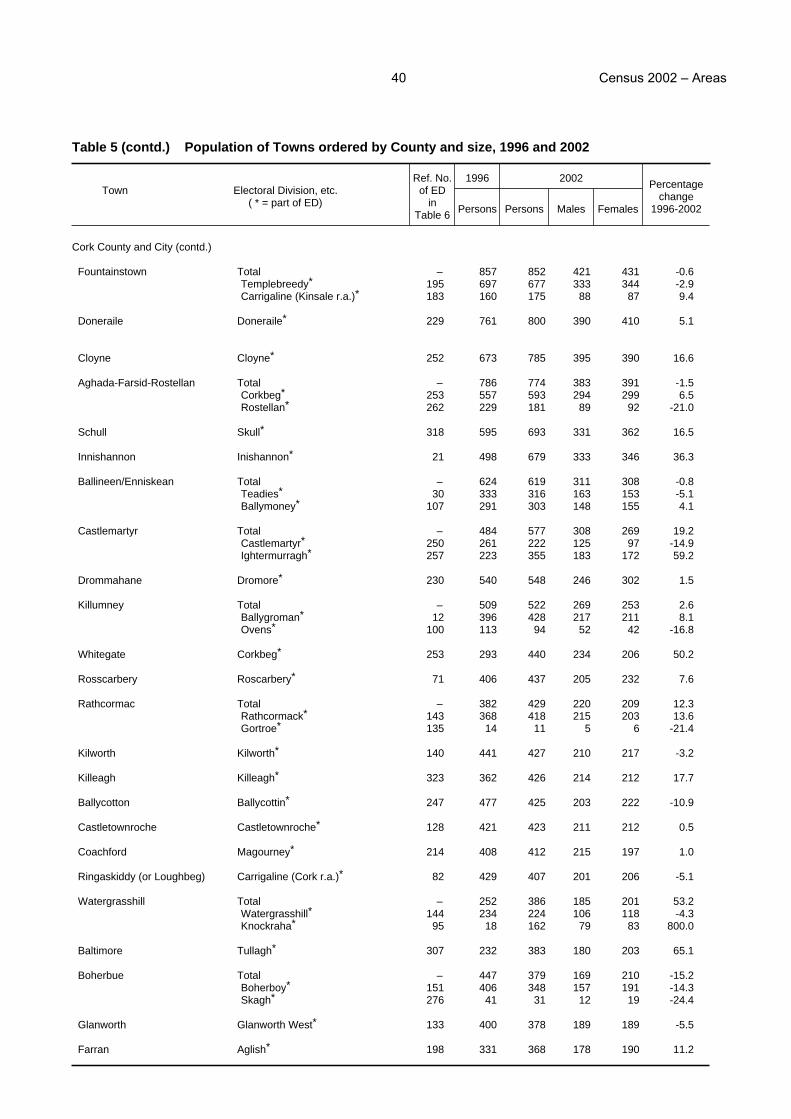
Table 5 (contd.) Population of Towns ordered by County and size, 1996 and 2002
Town Electoral Division, etc.( * = part of ED)
Ref. No.of ED
inTable 6
1996 2002 Percentagechange
1996-2002Persons Persons Males Females
Cork County and City (contd.)
Bandon Bandon 15 1,697 1,578 767 811 -7.0
Environs of Bandon Total – 3,054 3,583 1,741 1,842 17.3Ballymodan* 13 2,558 3,036 1,485 1,551 18.7Kilbrogan* 24 453 510 240 270 12.6Inishannon* 21 43 37 16 21 -14.0
Fermoy Fermoy Urban 3 2,310 2,270 1,092 1,178 -1.7
Environs of Fermoy Fermoy Rural* 131 2,159 2,534 1,213 1,321 17.4
Passage West Monkstown Urban 99 3,638 4,184 2,074 2,110 15.0
Environs of Passage West Monkstown Rural* 98 284 411 202 209 44.7
Clonakilty Clonakilty Urban 1 2,724 3,432 1,627 1,805 26.0
Environs of Clonakilty Clonakilty Rural* 60 226 266 124 142 17.7
Kinsale Kinsale Urban 4 2,007 2,257 1,137 1,120 12.5
Environs of Kinsale Kinsale Rural* 189 1,057 1,297 618 679 22.7
Mitchelstown Mitchelstown* 284 3,123 3,300 1,634 1,666 5.7
Bantry Bantry Urban 34 2,936 3,150 1,505 1,645 7.3
Tower Total – 1,841 3,032 1,498 1,534 64.7Matehy* 97 987 1,386 708 678 40.4Blarney* 80 838 1,633 780 853 94.9Carrigrohane Beg* 84 16 13 10 3 -18.8
Macroom Macroom Urban 5 2,457 2,836 1,377 1,459 15.4
Environs of Macroom Macloneigh* 213 117 149 69 80 27.4
Rathluirc (or Charleville) Rathluirc* 239 2,667 2,685 1,321 1,364 0.7
Blarney Blarney* 80 1,963 2,146 1,068 1,078 9.3
Skibbereen Skibbereen Urban 9 1,926 2,000 945 1,055 3.8
Kanturk Total – 1,666 1,651 786 865 -0.9Kanturk* 162 1,083 1,124 539 585 3.8Greenane* 161 583 527 247 280 -9.6
Dunmanway Total – 1,427 1,532 762 770 7.4Dunmanway North* 114 853 801 392 409 -6.1Dunmanway South* 115 574 731 370 361 27.4
Carrigtwohill Carrigtohill* 249 1,232 1,411 680 731 14.5
Crosshaven Templebreedy* 195 1,312 1,373 668 705 4.6
Millstreet Total – 1,226 1,289 637 652 5.1Drishane* 271 877 942 463 479 7.4Coomlogane* 266 349 347 174 173 -0.6
Newmarket Newmarket* 170 1,150 1,055 521 534 -8.3
Buttevant Buttevant* 224 1,070 987 467 520 -7.8
Castletownbere Killaconenagh* 52 926 875 425 450 -5.5
Census 2002 Areas40
Table 5 (contd.) Population of Towns ordered by County and size, 1996 and 2002
Town Electoral Division, etc.( * = part of ED)
Ref. No.of ED
inTable 6
1996 2002Percentage
change1996-2002Persons Persons Males Females
Cork County and City (contd.)
Fountainstown Total – 857 852 421 431 -0.6Templebreedy* 195 697 677 333 344 -2.9Carrigaline (Kinsale r.a.)* 183 160 175 88 87 9.4
Doneraile Doneraile* 229 761 800 390 410 5.1
Cloyne Cloyne* 252 673 785 395 390 16.6
Aghada-Farsid-Rostellan Total – 786 774 383 391 -1.5Corkbeg* 253 557 593 294 299 6.5Rostellan* 262 229 181 89 92 -21.0
Schull Skull* 318 595 693 331 362 16.5
Innishannon Inishannon* 21 498 679 333 346 36.3
Ballineen/Enniskean Total – 624 619 311 308 -0.8Teadies* 30 333 316 163 153 -5.1Ballymoney* 107 291 303 148 155 4.1
Castlemartyr Total – 484 577 308 269 19.2Castlemartyr* 250 261 222 125 97 -14.9Ightermurragh* 257 223 355 183 172 59.2
Drommahane Dromore* 230 540 548 246 302 1.5
Killumney Total – 509 522 269 253 2.6Ballygroman* 12 396 428 217 211 8.1Ovens* 100 113 94 52 42 -16.8
Whitegate Corkbeg* 253 293 440 234 206 50.2
Rosscarbery Roscarbery* 71 406 437 205 232 7.6
Rathcormac Total – 382 429 220 209 12.3Rathcormack* 143 368 418 215 203 13.6Gortroe* 135 14 11 5 6 -21.4
Kilworth Kilworth* 140 441 427 210 217 -3.2
Killeagh Killeagh* 323 362 426 214 212 17.7
Ballycotton Ballycottin* 247 477 425 203 222 -10.9
Castletownroche Castletownroche* 128 421 423 211 212 0.5
Coachford Magourney* 214 408 412 215 197 1.0
Ringaskiddy (or Loughbeg) Carrigaline (Cork r.a.)* 82 429 407 201 206 -5.1
Watergrasshill Total – 252 386 185 201 53.2Watergrasshill* 144 234 224 106 118 -4.3Knockraha* 95 18 162 79 83 800.0
Baltimore Tullagh* 307 232 383 180 203 65.1
Boherbue Total – 447 379 169 210 -15.2Boherboy* 151 406 348 157 191 -14.3Skagh* 276 41 31 12 19 -24.4
Glanworth Glanworth West* 133 400 378 189 189 -5.5
Farran Aglish* 198 331 368 178 190 11.2

Census 2002 Areas41
Table 5 (contd.) Population of Towns ordered by County and size, 1996 and 2002
Town Electoral Division, etc.( * = part of ED)
Ref. No.of ED
inTable 6
1996 2002Percentage
change1996-2002Persons Persons Males Females
Cork County and City (contd.)
Drimoleague Total – 339 363 175 188 7.1Bredagh* 288 226 245 120 125 8.4Dromdaleague South* 298 113 118 55 63 4.4
Ballymakeery Total – 294 337 166 171 14.6Slievereagh* 218 236 234 118 116 -0.8Ullanes* 219 58 103 48 55 77.6
Banteer Total – 257 327 143 184 27.2Banteer* 147 243 316 138 178 30.0Clonmeen* 156 14 11 5 6 -21.4
Timoleague Timoleague* 74 285 323 166 157 13.3
Crookstown Total – 345 320 167 153 -7.2Moviddy* 27 289 272 144 128 -5.9Warrenscourt* 220 56 48 23 25 -14.3
Model Village (or Dripsey) Total – 319 295 147 148 -7.5Dripsey* 87 270 249 128 121 -7.8Magourney* 214 49 46 19 27 -6.1
Shanagarry Ballycottin* 247 230 291 149 142 26.5
Durrus Durrus West* 37 204 283 136 147 38.7
Churchbay Templebreedy* 195 257 270 127 143 5.1
Courtmacsherry Courtmacsherry* 62 224 259 122 137 15.6
Conna Knockmourne* 141 209 258 130 128 23.4
Liscarroll Liscarroll* 234 279 256 119 137 -8.2
Knockglass Ightermurragh* 257 – 239 120 119 –
Killavullen Monanimy* 237 245 224 111 113 -8.6
Newtown Newtown* 171 184 224 114 110 21.7
Kildorrery Total – 229 215 100 115 -6.1Kildorrery* 280 203 191 87 104 -5.9Farahy* 279 26 24 13 11 -7.7
Bridebridge Total – 250 214 114 100 -14.4Castlelyons* 127 238 200 106 94 -16.0Kilcor* 136 12 14 8 6 16.7
Castlelyons Castlelyons* 127 164 211 118 93 28.7
Ballyclogh Kilmaclenine* 232 223 208 96 112 -6.7
Ballydehob Ballydehob* 310 227 206 101 105 -9.3
Ballingeary Total – 220 205 112 93 -6.8Bealanageary (Macroom r.a.)* 199 202 193 104 89 -4.5Bealanageary (Dunmanway r.a.)* 108 18 12 8 4 -33.3
Knocknagree Knocknagree* 274 193 204 96 108 5.7
Milford Milford* 168 208 204 90 114 -1.9
Unionhall Myross* 304 206 202 104 98 -1.9
Ballydesmond Williamstown* 177 201 193 94 99 -4.0
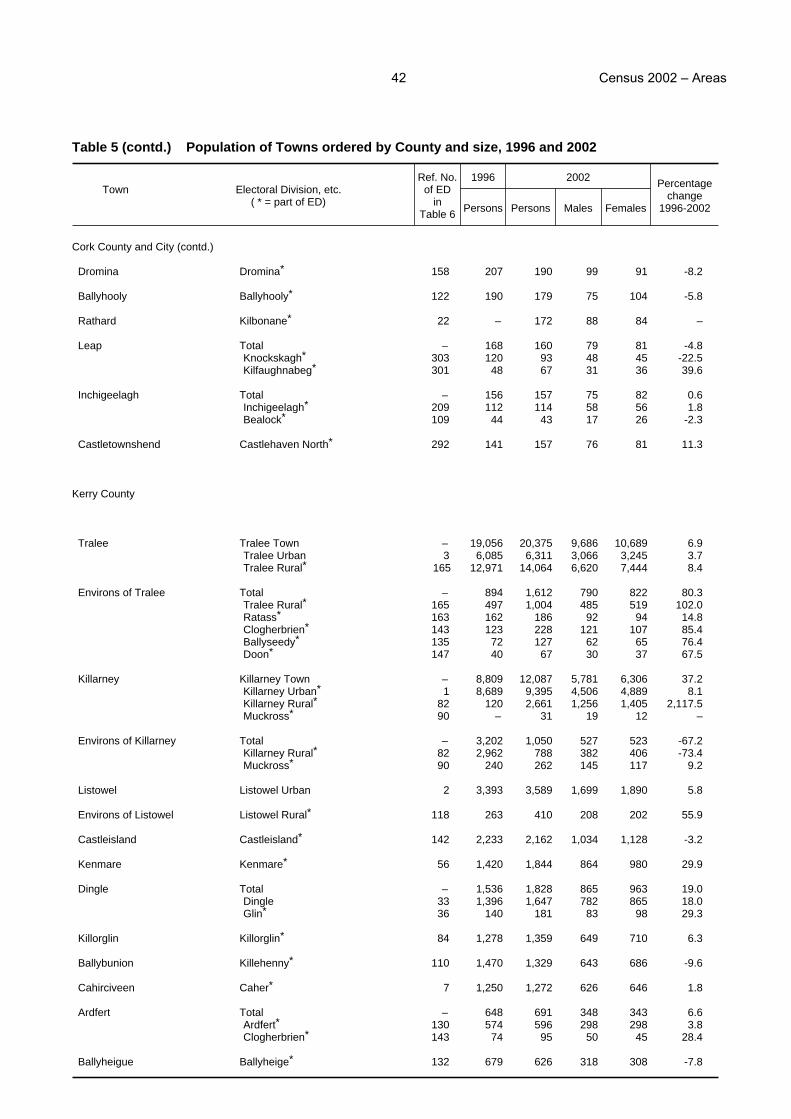
Census 2002 Areas42
Table 5 (contd.) Population of Towns ordered by County and size, 1996 and 2002
Town Electoral Division, etc.( * = part of ED)
Ref. No.of ED
inTable 6
1996 2002 Percentagechange
1996-2002Persons Persons Males Females
Cork County and City (contd.)
Dromina Dromina* 158 207 190 99 91 -8.2
Ballyhooly Ballyhooly* 122 190 179 75 104 -5.8
Rathard Kilbonane* 22 – 172 88 84 –
Leap Total – 168 160 79 81 -4.8Knockskagh* 303 120 93 48 45 -22.5Kilfaughnabeg* 301 48 67 31 36 39.6
Inchigeelagh Total – 156 157 75 82 0.6Inchigeelagh* 209 112 114 58 56 1.8Bealock* 109 44 43 17 26 -2.3
Castletownshend Castlehaven North* 292 141 157 76 81 11.3
Kerry County
Tralee Tralee Town – 19,056 20,375 9,686 10,689 6.9Tralee Urban 3 6,085 6,311 3,066 3,245 3.7Tralee Rural* 165 12,971 14,064 6,620 7,444 8.4
Environs of Tralee Total – 894 1,612 790 822 80.3Tralee Rural* 165 497 1,004 485 519 102.0Ratass* 163 162 186 92 94 14.8Clogherbrien* 143 123 228 121 107 85.4Ballyseedy* 135 72 127 62 65 76.4Doon* 147 40 67 30 37 67.5
Killarney Killarney Town – 8,809 12,087 5,781 6,306 37.2Killarney Urban* 1 8,689 9,395 4,506 4,889 8.1Killarney Rural* 82 120 2,661 1,256 1,405 2,117.5Muckross* 90 – 31 19 12 –
Environs of Killarney Total – 3,202 1,050 527 523 -67.2Killarney Rural* 82 2,962 788 382 406 -73.4Muckross* 90 240 262 145 117 9.2
Listowel Listowel Urban 2 3,393 3,589 1,699 1,890 5.8
Environs of Listowel Listowel Rural* 118 263 410 208 202 55.9
Castleisland Castleisland* 142 2,233 2,162 1,034 1,128 -3.2
Kenmare Kenmare* 56 1,420 1,844 864 980 29.9
Dingle Total – 1,536 1,828 865 963 19.0Dingle 33 1,396 1,647 782 865 18.0Glin* 36 140 181 83 98 29.3
Killorglin Killorglin* 84 1,278 1,359 649 710 6.3
Ballybunion Killehenny* 110 1,470 1,329 643 686 -9.6
Cahirciveen Caher* 7 1,250 1,272 626 646 1.8
Ardfert Total – 648 691 348 343 6.6Ardfert* 130 574 596 298 298 3.8Clogherbrien* 143 74 95 50 45 28.4
Ballyheigue Ballyheige* 132 679 626 318 308 -7.8

Census 2002 Areas43
Table 5 (contd.) Population of Towns ordered by County and size, 1996 and 2002
Town Electoral Division, etc.( * = part of ED)
Ref. No.of ED
inTable 6
1996 2002 Percentagechange
1996-2002Persons Persons Males Females
Kerry County (contd.)
Ballyduff Ballyduff* 97 649 614 314 300 -5.4
Tarbert Tarbert* 124 605 548 280 268 -9.4
Waterville-Spunkane Total – 466 538 258 280 15.5Emlagh* 15 296 368 184 184 24.3Loughcurrane* 19 170 170 74 96 –
Rathmore Rathmore* 91 470 450 227 223 -4.3
Fenit Ballynahaglish* 133 390 433 224 209 11.0
Spa Total – 394 424 215 209 7.6Ballynahaglish* 133 274 320 159 161 16.8Clogherbrien* 143 120 104 56 48 -13.3
Ballylongford Total – 499 405 199 206 -18.8Carrig* 101 267 209 109 100 -21.7Lislaughtin* 116 232 196 90 106 -15.5
Milltown Milltown* 88 332 332 161 171 –
Glenbeigh Glanbehy* 16 251 330 166 164 31.5
Newtownsandes Total – 370 326 185 141 -11.9Newtownsandes* 121 346 294 165 129 -15.0Leitrim* 115 24 32 20 12 33.3
Sneem Sneem* 60 296 285 136 149 -3.7
Lixnaw Lixnaw* 119 263 248 118 130 -5.7
Causeway Causeway* 102 261 251 118 133 -3.8
Gneevgullia Coom* 70 230 239 114 125 3.9
Abbeydorney Abbeydorney* 128 159 218 109 109 37.1
Brosna Brosna* 140 249 204 96 108 -18.1
Annascaul Total – 203 202 105 97 -0.5Ballinvoher* 26 190 188 99 89 -1.1Ballynacourty* 28 13 14 6 8 7.7
Castlegregory Castlegregory* 30 163 186 97 89 14.1
Knightstown Valencia* 25 191 172 101 71 -9.9
Beaufort Dunloe* 75 – 159 84 75 –
Kilgarvan Kilgarvan* 57 175 156 79 77 -10.9
Cromane Killorglin* 84 136 125 53 72 -8.1

Census 2002 Areas44
Table 5 (contd.) Population of Towns ordered by County and size, 1996 and 2002
Town Electoral Division, etc.( * = part of ED)
Ref. No.of ED
inTable 6
1996 2002Percentage
change1996-2002Persons Persons Males Females
Limerick County and City
Limerick Limerick City – 52,039 54,023 26,128 27,895 3.8
Limerick Suburbs (pt.)(b) Total – 23,690 29,124 14,387 14,737 22.9Ballycummin* 51 8,862 12,382 6,054 6,328 39.7Ballysimon* 52 7,027 8,380 4,226 4,154 19.3Limerick North Rural* 65 6,613 6,427 3,129 3,298 -2.8Limerick South Rural* 66 427 959 494 465 124.6Roxborough* 68 396 544 280 264 37.4Ballyvarra* 53 365 432 204 228 18.4
Newcastle West Total – 3,618 4,017 1,915 2,102 11.0Newcastle Urban 102 3,288 3,495 1,642 1,853 6.3Newcastle Rural* 101 330 522 273 249 58.2
Abbeyfeale Abbeyfeale* 78 1,486 1,683 832 851 13.3
Kilmallock Kilmallock* 41 1,231 1,362 685 677 10.6
Rathkeale Rathkeale Urban 128 1,546 1,362 639 723 -11.9
Castleconnell Castleconnell* 59 1,414 1,343 662 681 -5.0
Annacotty Total – 586 1,342 657 685 129.0Ballyvarra* 53 561 1,317 643 674 134.8Ballysimon* 52 25 25 14 11 –
Adare Total – 1,042 1,102 562 540 5.8Adare South* 3 1,021 1,077 552 525 5.5Adare North* 2 21 25 10 15 19.0
Croom Croom* 13 1,009 1,056 532 524 4.7
Patrickswell Patrickswell* 67 1,022 998 530 468 -2.3
Askeaton Total – 851 921 446 475 8.2Askeaton West* 108 453 516 257 259 13.9Askeaton East* 107 398 405 189 216 1.8
Kilfinane Kilfinnane* 39 766 779 372 407 1.7
Bruff Bruff* 28 700 695 347 348 -0.7
Cappamore Total – 665 684 329 355 2.9Cappamore* 57 654 680 327 353 4.0Doon West* 62 11 4 2 2 -63.6
Hospital Hospital* 38 723 621 310 311 -14.1
Caherconlish Caherconlish West* 55 636 616 286 330 -3.1
Glin Glin* 22 554 560 286 274 1.1
Pallaskenry Pallaskenry* 126 519 550 279 271 6.0
Drumcollogher Dromcolliher* 88 485 496 238 258 2.3
Foynes Shanagolden* 130 558 491 257 234 -12.0
Moroe Total – 435 464 245 219 6.7Glenstal* 63 307 316 162 154 2.9Clonkeen* 61 92 98 54 44 6.5Abington* 49 36 50 29 21 38.9

Census 2002 Areas45
Table 5 (contd.) Population of Towns ordered by County and size, 1996 and 2002
Town Electoral Division, etc.( * = part of ED)
Ref. No.of ED
inTable 6
1996 2002Percentage
change1996-2002Persons Persons Males Females
Limerick County and City (contd.)
Athea Total – 443 410 206 204 -7.4Rathronan* 104 362 352 177 175 -2.8Glenagower* 92 81 58 29 29 -28.4
Doon Doon South* 133 388 407 184 223 4.9
Oola Oola* 135 444 391 185 206 -11.9
Shanagolden Total – 412 373 202 171 -9.5Shanagolden* 130 266 251 136 115 -5.6Shanid* 131 146 122 66 56 -16.4
Pallas Grean Grean* 134 303 368 184 184 21.5
Ballingarry Ballingarry* 4 389 348 172 176 -10.5
Ballylanders Ballylanders* 70 318 333 163 170 4.7
Broadford Total – 271 300 148 152 10.7Broadford* 83 241 248 122 126 2.9Mountplummer* 100 30 52 26 26 73.3
Bruree Bruree* 29 261 299 151 148 14.6
Ardagh Ardagh* 79 328 270 127 143 -17.7
Mungret Ballycummin* 51 292 248 115 133 -15.1
Galbally Galbally* 73 246 235 115 120 -4.5
Mountcollins Mountcollins* 99 271 230 129 101 -15.1
Coonagh Limerick North Rural* 65 215 222 107 115 3.3
Glen Total – – 216 104 112 –Ballybricken* 50 – 190 92 98 –Ballysimon* 52 – 26 12 14 –
Knocklong Knocklong* 44 248 204 101 103 -17.7
Ballyagran Ballyagran* 5 215 185 94 91 -14.0
O’Briensbridge-Montpelier (pt.)(b) Castleconnell* 59 177 178 91 87 0.6
Carrigkerry Glensharrold* 94 – 173 87 86 –
Tipperary North
Thurles Thurles Urban 4 6,603 6,852 3,248 3,604 3.8
Environs of Thurles Thurles Rural* 79 336 573 272 301 70.5
Nenagh Nenagh Town – 5,645 6,121 2,967 3,154 8.4Nenagh East Urban 1 2,005 1,934 940 994 -3.5Nenagh West Urban 2 3,640 4,187 2,027 2,160 15.0
Environs of Nenagh Nenagh Rural* 48 268 333 159 174 24.3
Roscrea Roscrea* 59 4,170 4,578 2,239 2,339 9.8
Templemore Templemore Urban 3 2,115 2,159 1,109 1,050 2.1

Census 2002 Areas46
Table 5 (contd.) Population of Towns ordered by County and size, 1996 and 2002
Town Electoral Division, etc.( * = part of ED)
Ref. No.of ED
inTable 6
1996 2002Percentage
change1996-2002Persons Persons Males Females
Tipperary North (contd.)
Environs of Templemore Drom* 64 129 111 56 55 -14.0
Ballina Ballina* 27 598 1,185 591 594 98.2
Newport Total – 873 887 429 458 1.6Newport* 49 846 866 417 449 2.4Kilcomenty* 38 27 21 12 9 -22.2
Borrisokane Borrisokane* 8 850 832 409 423 -2.1
Borrisoleigh Borrisoleigh* 63 564 598 316 282 6.0
Littleton Littleton* 71 544 500 261 239 -8.1
Twomileborris Total – 325 474 245 229 45.8Twomileborris* 80 302 451 232 219 49.3Rahelty* 77 23 23 13 10 –
Cloughjordan Cloghjordan* 10 447 431 225 206 -3.6
Portroe Castletown* 34 411 401 194 207 -2.4
Holycross (pt.)(b) Holycross* 68 324 381 188 193 17.6
Templetuohy Templetouhy* 78 293 325 172 153 10.9
Toomevara Latteragh* 46 362 321 166 155 -11.3
Puckaun Knigh* 44 235 269 132 137 14.5
Silvermines Kilmore* 41 202 257 127 130 27.2
Reardnogy Abington* 24 – 159 83 76 –
Environs of Birr (pt.)(b) Riverstown* 21 35 25 13 12 -28.6
Tipperary South
Clonmel Clonmel Borough – 15,215 15,739 7,671 8,068 3.4Clonmel East Urban 85 3,515 4,121 1,994 2,127 17.2Clonmel West Urban 86 7,328 6,530 3,199 3,331 -10.9Clonmel Rural* 133 2,668 3,108 1,493 1,615 16.5Inishlounaght* 134 1,704 1,980 985 995 16.2
Environs of Clonmel (pt.)(b) Total – 371 393 196 197 5.9Inishlounaght* 134 351 356 179 177 1.4Clonmel Rural* 133 20 37 17 20 85.0
Carrick-on-Suir Carrick-on-Suir Town – 5,172 5,542 2,727 2,815 7.2Carrick-on-Suir Urban 83 4,168 4,313 2,129 2,184 3.5Carrickbeg Urban 82 1,004 1,229 598 631 22.4
Tipperary Tipperary Town – 4,640 4,546 2,224 2,322 -2.0Tipperary East Urban 87 2,947 2,830 1,390 1,440 -4.0Tipperary West Urban 88 1,693 1,716 834 882 1.4
Environs of Tipperary Tipperary Rural* 177 214 418 221 197 95.3
Cashel Cashel Urban 84 2,346 2,403 1,143 1,260 2.4
Environs of Cashel Cashel Rural* 96 341 367 172 195 7.6

Census 2002 Areas47
Table 5 (contd.) Population of Towns ordered by County and size, 1996 and 2002
Town Electoral Division, etc.( * = part of ED)
Ref. No.of ED
inTable 6
1996 2002 Percentagechange
1996-2002Persons Persons Males Females
Tipperary South (contd.)
Cahir Total – 2,236 2,794 1,400 1,394 25.0Kilcommon* 125 1,566 1,621 825 796 3.5Caher* 121 650 777 385 392 19.5Mortlestown* 127 20 396 190 206 1,880.0
Fethard Total – 1,397 1,388 692 696 -0.6Fethard 104 900 843 424 419 -6.3Peppardstown* 115 497 545 268 277 9.7
Ardfinnan Total – 848 779 386 393 -8.1Ardfinnan* 117 625 543 280 263 -13.1Tullaghmelan* 130 223 236 106 130 5.8
Killenaule Killenaule* 109 725 715 358 357 -1.4
Clogheen Clogheen* 122 518 550 270 280 6.2
Kilsheelan Kilsheelan* 137 461 497 259 238 7.8
Ballyclerahan Total – – 408 204 204 –Ballyclerahan* 132 – 303 150 153 –Lisronagh* 139 – 105 54 51 –
Mullinahone Mullinahone* 150 358 348 177 171 -2.8
Cappawhite Cappagh* 158 345 340 155 185 -1.4
Ballingarry Ballingarry* 141 315 314 149 165 -0.3
Bansha Bansha* 156 288 302 153 149 4.9
Ballyporeen Ballyporeen* 119 293 295 157 138 0.7
Emly Emly* 164 324 278 151 127 -14.2
Golden Golden* 166 262 268 135 133 2.3
Holycross (pt.)(b) Gaile* 105 123 229 109 120 86.2
Gortnahoo Buolick* 143 – 207 97 110 –
Newcastle Newcastle* 128 186 201 95 106 8.1
Dundrum Kilpatrick* 110 219 191 99 92 -12.8
Waterford County and City
Waterford Waterford City – 42,540 44,594 21,782 22,812 4.8
Tramore Total – 6,536 8,115 3,980 4,135 24.2Tramore* 83 5,777 7,138 3,518 3,620 23.6Islandikane* 73 759 977 462 515 28.7
Environs of Tramore Tramore* 83 – 190 100 90 –
Dungarvan Dungarvan Town – 7,175 7,220 3,517 3,703 0.6Dungarvan No. 1 Urban 1 4,440 4,495 2,195 2,300 1.2Dungarvan No. 2 Urban 2 2,735 2,725 1,322 1,403 -0.4
Environs of Dungarvan Dungarvan Rural* 29 – 232 115 117 –
Dunmore East Total – 1,430 1,750 1,005 745 22.4Killea* 75 1,193 1,394 843 551 16.8Rathmoylan* 81 237 356 162 194 50.2

Census 2002 Areas48
Table 5 (contd.) Population of Towns ordered by County and size, 1996 and 2002
Town Electoral Division, etc.( * = part of ED)
Ref. No.of ED
inTable 6
1996 2002Percentage
change1996-2002Persons Persons Males Females
Waterford County and City (contd.)
Portlaw Total – 1,176 1,183 569 614 0.6Portlaw* 10 978 904 438 466 -7.6Kilmeadan* 8 198 279 131 148 40.9
Lismore Lismore Urban 66 729 788 396 392 8.1
Environs of Lismore Lismore Rural* 65 366 394 202 192 7.7
Tallow Tallow* 69 802 845 419 426 5.4
Environs of Clonmel (pt.)(b) Total – 596 778 382 396 30.5St. Mary’s* 18 568 537 275 262 -5.5Kilmacomma* 16 28 241 107 134 760.7
Cappoquin Cappoquin* 58 780 756 373 383 -3.1
Kilmacthomas Kilmacthomas* 47 681 717 353 364 5.3
Passage East Faithlegg* 72 573 636 339 297 11.0
Ardmore Ardmore* 85 436 459 232 227 5.3
Ballinroad Clonea* 24 253 431 211 220 70.4
Ring Ringville* 34 289 332 174 158 14.9
Cheekpoint Faithlegg* 72 320 325 160 165 1.6
Stradbally Stradbally* 51 262 298 141 157 13.7
Lemybrien Total – 197 210 114 96 6.6Comeragh* 40 176 189 101 88 7.4Mountkennedy* 49 21 21 13 8 –
Aglish Total – – 193 107 86 –Dromana* 27 – 107 61 46 –Keereen* 30 – 86 46 40 –
Villierstown Dromana* 27 – 192 100 92 –
Kill Total – – 173 84 89 –Gardenmorris* 44 – 134 63 71 –Kilbarrymeaden* 46 – 39 21 18 –
Clashmore Total – – 161 76 85 –Ballyheeny* 86 – 70 36 34 –Clashmore* 87 – 91 40 51 –
Environs of Carrick-on-Suir Carrickbeg Rural* 4 45 44 19 25 -2.2
Galway County and City
Galway Galway City – 57,241 65,832 31,015 34,817 15.0
Galway Suburbs Ballintemple* 42 122 331 176 155 171.3
Ballinasloe Ballinasloe Urban 1 5,634 5,984 3,017 2,967 6.2
Environs of Ballinasloe (pt.)(b) Ballinasloe Rural* 5 20 117 55 62 485.0
Tuam Tuam Urban 216 3,487 3,104 1,520 1,584 -11.0

Census 2002 Areas49
Table 5 (contd.) Population of Towns ordered by County and size, 1996 and 2002
Town Electoral Division, etc.( * = part of ED)
Ref. No.of ED
inTable 6
1996 2002 Percentagechange
1996-2002Persons Persons Males Females
Galway County and City (contd.)
Environs of Tuam Total – 2,140 2,843 1,395 1,448 32.9Tuam Rural* 215 2,110 2,789 1,365 1,424 32.2Killererin* 204 30 54 30 24 80.0
Loughrea Loughrea Urban 128 3,335 4,004 1,881 2,123 20.1
Athenry Athenry* 101 1,614 2,154 1,043 1,111 33.5
Gort Gort* 90 1,182 1,776 902 874 50.3
Oranmore Total – 1,410 1,692 839 853 20.0Oranmore* 60 1,126 1,446 710 736 28.4Clarinbridge* 49 264 218 112 106 -17.4Ballintemple* 42 20 28 17 11 40.0
Clifden Clifden* 25 920 1,355 657 698 47.3
Portumna Portumna* 175 984 1,235 618 617 25.5
Oughterard Oughterard* 159 751 1,209 600 609 61.0
Moycullen Total – 601 883 433 450 46.9Tullokyne* 65 429 405 201 204 -5.6Moycullen* 59 172 478 232 246 177.9
Headford Headford* 198 574 703 342 361 22.5
Mount Bellew Mount Bellew* 146 547 667 353 314 21.9
Ballygar Killeroran* 144 546 642 321 321 17.6
Carraroe Crumpaun* 152 242 629 320 309 159.9
Dunmore Total – 445 594 279 315 33.5Dunmore South* 196 297 460 217 243 54.9Dunmore North* 195 126 109 50 59 -13.5Carrownagur* 187 22 25 12 13 13.6
Claregalway Total – – 562 271 291 –Carnmore* 46 – 185 98 87 –Claregalway* 48 – 377 173 204 –
Glenamaddy Glennamaddy* 72 394 457 220 237 16.0
Kinvara Kinvarra* 97 432 447 220 227 3.5
Craughwell Craughwell* 109 240 358 184 174 49.2
Eyrecourt Total – 337 354 162 192 5.0Eyrecourt* 168 330 349 160 189 5.8Meelick* 172 7 5 2 3 -28.6
Cloonboo Annaghdown* 40 265 351 180 171 32.5
Killimor Killimor* 169 256 345 179 166 34.8
Furbogh Furbogh* 51 – 319 149 170 –
Monivea Monivea* 211 298 300 151 149 0.7
Woodford Woodford* 134 298 280 129 151 -6.0
Ahascragh Ahascragh* 3 240 271 124 147 12.9
Kilronan Inishmore* 53 265 270 133 137 1.9

Census 2002 Areas50
Table 5 (contd.) Population of Towns ordered by County and size, 1996 and 2002
Town Electoral Division, etc.( * = part of ED)
Ref. No.of ED
inTable 6
1996 2002 Percentagechange
1996-2002Persons Persons Males Females
Galway County and City (contd.)
Roundstone Roundstone* 37 241 239 122 117 -0.8
Moylough Mount Bellew* 146 209 236 118 118 12.9
Lackaghbeg Lackaghbeg* 56 – 220 101 119 –
Spiddle Spiddle* 63 – 190 99 91 –
Clarinbridge Clarinbridge* 49 – 173 92 81 –
Cong (pt.)(b) Cloonbur* 150 48 36 17 19 -25.0
Leitrim County
Carrick-on-Shannon (pt.)(b) Carrick-on-Shannon* 15 1,532 1,842 855 987 20.2
Manorhamilton Manorhamilton* 52 1,008 927 479 448 -8.0
Mohill Mohill* 74 808 786 386 400 -2.7
Ballinamore Total – 782 687 318 369 -12.1Ballinamore* 1 613 527 245 282 -14.0Garadice* 6 169 160 73 87 -5.3
Drumshanbo Drumshanbo* 18 634 623 321 302 -1.7
Kinlough Total – 286 335 171 164 17.1Kinlough* 31 168 188 97 91 11.9Gubacreeny* 30 118 147 74 73 24.6
Dromahair Drumahaire* 39 346 312 158 154 -9.8
Carrigallen Total – 251 257 129 128 2.4Carrigallen West* 61 153 164 81 83 7.2Carrigallen East* 60 98 93 48 45 -5.1
Drumkeeran Drumkeeran* 40 220 242 122 120 10.0
Drumsna Drumsna* 19 143 173 92 81 21.0
Roosky (pt.)(b) Roosky* 77 34 11 7 4 -67.6
Mayo County
Ballina Ballina Town – 6,852 9,478 4,583 4,895 38.3Ardnaree South Urban* 1 2,124 2,367 1,092 1,275 11.4Ballina Urban* 2 4,728 4,627 2,246 2,381 -2.1Ardnaree North* 6 – 349 176 173 –Ardnaree South Rural* 7 – 939 470 469 –Ballina Rural* 10 – 1,196 599 597 –
Environs of Ballina Total – 1,154 169 86 83 -85.4Ardnaree South Rural* 7 814 148 75 73 -81.8Ardnaree North* 6 340 21 11 10 -93.8
Castlebar Castlebar Town – 6,585 10,287 4,908 5,379 56.2Castlebar Urban* 3 6,585 6,585 3,141 3,444 –Castlebar Rural* 74 – 3,702 1,767 1,935 –

Census 2002 Areas51
Table 5 (contd.) Population of Towns ordered by County and size, 1996 and 2002
Town Electoral Division, etc.( * = part of ED)
Ref. No.of ED
inTable 6
1996 2002 Percentagechange
1996-2002Persons Persons Males Females
Mayo County (contd.)
Environs of Castlebar Total – 1,947 1,084 509 575 -44.3Castlebar Rural* 74 1,947 914 420 494 -53.1Breaghwy* 72 – 170 89 81 –
Westport Westport Town – 4,253 5,314 2,447 2,867 24.9Westport Urban* 4 4,253 5,314 2,447 2,867 24.9Kilmeena* 144 – – – – –
Environs of Westport Westport Rural* 154 267 320 164 156 19.9
Claremorris Total – 1,914 2,101 959 1,142 9.8Claremorris* 89 1,879 2,054 932 1,122 9.3Crossboyne* 92 35 47 27 20 34.3
Ballinrobe Ballinrobe* 34 1,309 1,626 834 792 24.2
Swinford Swineford* 119 1,386 1,497 689 808 8.0
Ballyhaunis Ballyhaunis* 85 1,287 1,381 731 650 7.3
Kiltimagh Kiltamagh* 116 917 1,000 486 514 9.1
Belmullet Belmullet* 55 954 952 450 502 -0.2
Crossmolina Total – 1,103 935 468 467 -15.2Crossmolina North* 16 722 600 311 289 -16.9Crossmolina South* 17 381 335 157 178 -12.1
Foxford Total – 944 878 418 460 -7.0Toomore* 121 596 508 229 279 -14.8Sraheen* 32 348 370 189 181 6.3
Charlestown-Bellahy (pt.)(b) Total – 597 675 347 328 13.1Sonnagh* 118 347 409 203 206 17.9Kilbeagh* 112 250 266 144 122 6.4
Killala Killala* 25 657 650 325 325 -1.1
Knock Total – 575 595 220 375 3.5Knock North* 97 216 234 101 133 8.3Knock South* 98 303 298 95 203 -1.7Ballyhowly* 86 56 63 24 39 12.5
Keel-Dooagh Slievemore* 152 518 541 270 271 4.4
Newport Total – 567 527 244 283 -7.1Newport East* 148 487 437 207 230 -10.3Derryloughan* 135 80 90 37 53 12.5
Balla Balla* 67 316 443 209 234 40.2
Achill Sound Dooega* 136 277 355 167 188 28.2
Shrule Dalgan* 40 337 326 165 161 -3.3
Ballindine Ballindine* 84 233 297 142 155 27.5
Bangor Erris Bangor* 53 251 266 125 141 6.0
Ballycastle Ballycastle* 11 234 249 120 129 6.4
Kilkelly Total – 258 230 116 114 -10.9Kilkelly* 113 224 193 96 97 -13.8Urlaur* 123 34 37 20 17 8.8
Louisburgh Louisburgh* 147 150 207 87 120 38.0
Kilmaine Kilmaine* 44 – 184 93 91 –
Cong (pt.)(b) Cong* 38 149 149 77 72 –

Census 2002 Areas52
Table 5 (contd.) Population of Towns ordered by County and size, 1996 and 2002
Town Electoral Division, etc.( * = part of ED)
Ref. No.of ED
inTable 6
1996 2002Percentage
change1996-2002Persons Persons Males Females
Roscommon County
Roscommon Total – 3,915 4,489 2,200 2,289 14.7Roscommon Urban 106 1,432 1,623 784 839 13.3Roscommon Rural* 105 2,483 2,866 1,416 1,450 15.4
Boyle Boyle Urban 31 1,690 1,643 811 832 -2.8
Environs of Boyle Boyle Rural* 30 532 562 265 297 5.6
Castlerea Castlereagh* 65 1,790 1,788 872 916 -0.1
Environs of Athlone (pt.)(b) Athlone West Rural* 1 1,214 1,626 804 822 33.9
Ballaghaderreen Ballaghaderreen* 57 1,248 1,416 706 710 13.5
Strokestown Strokestown* 110 572 631 314 317 10.3
Elphin Elphin* 89 545 527 258 269 -3.3
Carrick-on-Shannon (pt.)(b) Danesfort* 37 336 395 199 196 17.6
Lanesborough-Ballyleague (pt.)(b) Cloontuskert* 81 388 368 200 168 -5.2
Frenchpark Frenchpark* 71 290 358 173 185 23.4
Ballinlough Ballinlough* 58 205 254 125 129 23.9
Clontuskert Cloontuskert* 81 262 236 107 129 -9.9
Ballyfarnan Ballyfarnan* 28 231 206 113 93 -10.8
Keadew Keadew* 39 – 194 91 103 –
Roosky (pt.)(b) Roosky* 104 186 187 113 74 0.5
Loughglinn Loughglinn* 73 186 182 81 101 -2.2
Environs of Ballinasloe (pt.)(b) Creagh* 11 69 118 59 59 71.0
Sligo County
Sligo Sligo Borough – 17,786 18,473 8,569 9,904 3.9Sligo East 1 5,961 5,568 2,603 2,965 -6.6Sligo North 2 5,041 5,745 2,659 3,086 14.0Sligo West 3 6,784 7,160 3,307 3,853 5.5
Environs of Sligo Total – 723 1,262 625 637 74.6Knockaree* 53 524 954 461 493 82.1Kilmacowen* 52 186 141 67 74 -24.2Calry* 41 13 13 7 6 –Drumcliff East* 47 – 154 90 64 –
Tubbercurry Tobercurry* 82 1,089 1,171 572 599 7.5
Strandhill Knockaree* 53 764 1,002 492 510 31.2
Ballymote Ballymote* 36 994 981 471 510 -1.3

Census 2002 Areas53
Table 5 (contd.) Population of Towns ordered by County and size, 1996 and 2002
Town Electoral Division, etc.( * = part of ED)
Ref. No.of ED
inTable 6
1996 2002Percentage
change1996-2002Persons Persons Males Females
Sligo County (contd.)
Ballisodare Total – 612 853 412 441 39.4Ballysadare East* 38 529 761 374 387 43.9Collooney* 46 83 92 38 54 10.8
Rosses Point Drumcliff West* 48 799 774 374 400 -3.1
Inniscrone Total – 692 668 334 334 -3.5Kilglass* 26 634 627 312 315 -1.1Castleconor West* 20 58 41 22 19 -29.3
Collooney Total – 573 619 306 313 8.0Collooney* 46 539 584 288 296 8.3Ballysadare East* 38 34 35 18 17 2.9
Ballincar Drumcliff West* 48 456 510 198 312 11.8
Cliffoney Total – 305 327 155 172 7.2Cliffony North* 44 205 230 112 118 12.2Cliffony South* 45 100 97 43 54 -3.0
Riverstown Riverstown* 59 266 273 146 127 2.6
Gurteen Total – 257 250 118 132 -2.7Kilfree* 9 151 155 75 80 2.6Cuilmore* 7 106 95 43 52 -10.4
Grange Total – – 225 105 120 –Cliffony South* 45 – 40 23 17 –Lissadill North* 57 – 185 82 103 –
Easky Total – 174 211 110 101 21.3Easky East* 24 98 138 70 68 40.8Easky West* 25 76 73 40 33 -3.9
Coolaney Coolaney* 73 – 167 88 79 –
Mullaghmore Cliffony North* 44 164 137 69 68 -16.5
Charlestown-Bellahy (pt.)(b) Achonry West* 63 78 78 33 45 –
Cavan CountyCavan Cavan Urban 1 3,509 3,538 1,697 1,841 0.8
Environs of Cavan Total – 2,114 2,560 1,211 1,349 21.1Cavan Rural* 48 1,981 2,387 1,118 1,269 20.5Moynehall* 73 133 173 93 80 30.1
Cootehill Cootehill Urban 51 1,461 1,399 704 695 -4.2
Environs of Cootehill Total – 361 345 174 171 -4.4Cootehill Rural* 50 192 176 91 85 -8.3Ashfield* 37 104 104 51 53 –Tullyvin East* 78 65 65 32 33 –
Bailieborough Bailieborough* 2 1,529 1,660 803 857 8.6
Kingscourt Kingscourt* 8 1,190 1,307 648 659 9.8
Belturbet Belturbet Urban 42 1,248 1,295 664 631 3.8
Virginia Virginia* 34 811 1,093 554 539 34.8
Ballyjamesduff Ballyjamesduff* 29 737 871 456 415 18.2

Census 2002 Areas54
Table 5 (contd.) Population of Towns ordered by County and size, 1996 and 2002
Town Electoral Division, etc.( * = part of ED)
Ref. No.of ED
inTable 6
1996 2002Percentage
change1996-2002Persons Persons Males Females
Cavan County (contd.)
Ballyconnell Ballyconnell* 15 433 572 280 292 32.1
Ballyhaise Ballyhaise* 39 435 530 276 254 21.8
Ballinagh Bellananagh* 41 401 502 246 256 25.2
Mullagh Mullagh* 10 403 479 235 244 18.9
Shercock Shercock* 11 380 454 215 239 19.5
Killeshandra Killashandra* 66 427 417 198 219 -2.3
Arva Arvagh* 36 327 357 183 174 9.2
Kilnaleck Kilnaleck* 68 253 305 139 166 20.6
Swanlinbar Swanlinbar* 26 191 223 120 103 16.8
Butlersbridge Butler’s Bridge* 44 185 182 76 106 -1.6
Blacklion Tuam* 88 153 166 83 83 8.5
Donegal County
Letterkenny Letterkenny Town – 7,606 7,965 3,692 4,273 4.7Letterkenny Urban 3 2,473 2,478 1,092 1,386 0.2Letterkenny Rural* 105 5,133 5,487 2,600 2,887 6.9
Environs of Letterkenny Total – 4,390 7,266 3,502 3,764 65.5Letterkenny Rural* 105 2,055 3,633 1,761 1,872 76.8Castlewray* 97 1,736 2,132 1,036 1,096 22.8Magheraboy* 106 424 445 210 235 5.0Ballymacool* 96 175 294 128 166 68.0Corravaddy* 99 – 339 164 175 –Gortnavern* 102 – 423 203 220 –
Buncrana Buncrana Urban 1 3,312 3,420 1,688 1,732 3.3
Environs of Buncrana Total – 1,493 1,851 924 927 24.0Buncrana Rural* 69 1,446 1,817 908 909 25.7Illies* 83 47 34 16 18 -27.7
Ballybofey-Stranorlar Total – 3,047 3,603 1,732 1,871 18.2Stranorlar* 147 2,966 3,338 1,597 1,741 12.5Knock* 142 81 94 52 42 16.0Dooish* 136 – 171 83 88 –
Ballyshannon Ballyshannon Urban 6 2,308 2,232 1,045 1,187 -3.3
Environs of Ballyshannon Total – 467 483 254 229 3.4Ballyshannon Rural* 5 415 385 200 185 -7.2Bundoran Rural* 7 52 71 38 33 36.5Carrickboy* 8 – 27 16 11 –
Donegal Donegal* 16 2,296 2,453 1,192 1,261 6.8
Bundoran Bundoran Urban 2 1,707 1,678 806 872 -1.7
Environs of Bundoran Bundoran Rural* 7 89 164 79 85 84.3

Census 2002 Areas55
Table 5 (contd.) Population of Towns ordered by County and size, 1996 and 2002
Town Electoral Division, etc.( * = part of ED)
Ref. No.of ED
inTable 6
1996 2002Percentage
change1996-2002Persons Persons Males Females
Donegal County (contd.)
Carndonagh Total – 1,580 1,673 794 879 5.9Carndonagh* 71 1,085 974 457 517 -10.2Glentogher* 81 427 638 307 331 49.4Glennagannon* 79 68 61 30 31 -10.3
Moville Total – 1,394 1,465 707 758 5.1Moville* 89 1,272 1,362 658 704 7.1Castlecary* 73 122 103 49 54 -15.6
Killybegs Killybegs* 57 1,408 1,396 689 707 -0.9
Lifford Clonleigh South* 134 1,275 1,395 659 736 9.4
Bunbeg-Derrybeg Magheraclogher* 37 1,400 1,388 697 691 -0.9
Ramelton Rathmelton* 124 978 1,051 528 523 7.5
Convoy Total – 907 1,028 477 551 13.3Convoy* 135 891 953 441 512 7.0Figart* 138 16 75 36 39 368.8
Raphoe Raphoe* 145 1,065 949 455 494 -10.9
Dungloe Dunglow* 47 1,042 946 460 486 -9.2
Falcarragh (or Cross Roads) Cross Roads* 32 961 852 412 440 -11.3
Milford Millford* 123 816 793 401 392 -2.8
Glenties Glenties* 52 738 789 376 413 6.9
Castlefin Castlefinn* 130 698 783 374 409 12.2
Muff Kilderry* 85 334 773 406 367 131.4
Newtowncunningham Total – 594 663 339 324 11.6Castleforward* 74 417 462 236 226 10.8Newtown Cunningham* 90 177 201 103 98 13.6
Ardara Total – 635 578 284 294 -9.0Ardara* 41 595 476 233 243 -20.0Glengesh* 50 40 102 51 51 155.0
Greencastle Total – 547 570 286 284 4.2Moville* 89 389 382 191 191 -1.8Greencastle* 82 158 188 95 93 19.0
Rathmullen Rathmullan* 125 491 514 238 276 4.7
St. Johnston St. Johnstown* 146 453 470 224 246 3.8
Mountcharles Tantallon* 25 428 432 212 220 0.9
Kilmacrennan Kilmacrenan* 120 363 430 204 226 18.5
Meenlaragh Gortahork* 36 440 430 217 213 -2.3
Killygordan Killygordan* 141 390 399 197 202 2.3
Clonmany Straid* 92 305 393 202 191 28.9
Brinlack Meenaclady* 38 – 381 191 190 –
Dunkineely Dunkineely* 17 395 353 176 177 -10.6

Census 2002 Areas56
Table 5 (contd.) Population of Towns ordered by County and size, 1996 and 2002
Town Electoral Division, etc.( * = part of ED)
Ref. No.of ED
inTable 6
1996 2002Percentage
change1996-2002Persons Persons Males Females
Donegal County (contd.)
Crocknamurleog Rosguill* 126 382 346 165 181 -9.4
Burtonport Rutland* 64 296 346 167 179 16.9
Fahan Fahan* 78 284 338 151 187 19.0
Manorcunningham Manorcunningham* 107 404 320 162 158 -20.8
Ballyliffin Total – 299 313 165 148 4.7Ballyliffin* 67 173 165 85 80 -4.6Straid* 92 126 148 80 68 17.5
Loughanure Annagary* 39 262 312 162 150 19.1
Creeslough Creeslough* 31 300 304 155 149 1.3
Bridge End Burt* 70 – 298 146 152 –
Dunfanaghy Dunfanaghy* 34 290 293 138 155 1.0
Rannafast Annagary* 39 299 279 143 136 -6.7
Pettigo (pt.)(b) Pettigoe* 24 320 275 142 133 -14.1
Tievebane Fahan* 78 236 267 134 133 13.1
Kildrum Killea* 86 – 267 125 142 –
Kilcar Total – 290 262 131 131 -9.7Kilcar* 55 150 125 59 66 -16.7Largymore* 58 140 137 72 65 -2.1
Glencolumbkille Total – 236 254 130 124 7.6Malinbeg* 62 190 201 101 100 5.8Kilgoly* 56 46 53 29 24 15.2
Carrowkeel Carrowkeel* 112 268 253 130 123 -5.6
Annagry Annagary* 39 205 247 127 120 20.5
Carrick Total – 257 245 127 118 -4.7Glencolumbkille* 49 239 195 105 90 -18.4Kilcar* 55 18 50 22 28 177.8
Burnfoot Total – 224 240 122 118 7.1Birdstown* 68 177 199 99 100 12.4Fahan* 78 47 41 23 18 -12.8
Ballintra Total – 217 216 98 118 -0.5Ballintra (Ballyshannon r.a.)* 4 159 192 86 106 20.8Ballintra (Donegal r.a.)* 11 58 24 12 12 -58.6
Culdaff Culdaff* 75 – 182 94 88 –
Laghy Laghy* 22 144 174 85 89 20.8
Carrigans Killea* 86 185 158 84 74 -14.6
Gortahork Gortahork* 36 152 155 72 83 2.0

Census 2002 Areas57
Table 5 (contd.) Population of Towns ordered by County and size, 1996 and 2002
Town Electoral Division, etc.( * = part of ED)
Ref. No.of ED
inTable 6
1996 2002Percentage
change1996-2002Persons Persons Males Females
Monaghan County
Monaghan Monaghan Town – 5,628 5,717 2,730 2,987 1.6Monaghan Urban 4 2,014 2,032 960 1,072 0.9Monaghan Rural* 63 3,614 3,685 1,770 1,915 2.0
Environs of Monaghan Monaghan Rural* 63 214 219 116 103 2.3
Carrickmacross Carrickmacross Urban 1 1,926 1,964 980 984 2.0
Environs of Carrickmacross Total – 1,691 1,868 879 989 10.5Carrickmacross Rural* 7 1,544 1,665 786 879 7.8Ballymackney* 5 96 129 55 74 34.4Loughfea* 18 51 74 38 36 45.1
Castleblayney Castleblayney Town – 1,884 1,712 811 901 -9.1Castleblayney Urban 2 1,015 960 473 487 -5.4Castleblayney Rural* 27 869 752 338 414 -13.5
Environs of Castleblayney Castleblayney Rural* 27 924 1,224 594 630 32.5
Clones Clones Town – 1,921 1,721 842 879 -10.4Clones Urban 3 1,335 1,105 536 569 -17.2Clones Rural* 36 586 616 306 310 5.1
Environs of Clones Clones Rural* 36 249 226 102 124 -9.2
Ballybay Ballybay Urban 22 474 437 213 224 -7.8
Environs of Ballybay Ballybay Rural* 21 678 627 278 349 -7.5
Emyvale Emyvale* 57 484 583 284 299 20.5
Bellanode Total – 391 330 167 163 -15.6Bellanode* 48 329 281 142 139 -14.6Tedavnet* 68 62 49 25 24 -21.0
Inniskeen Inishkeen* 15 362 310 140 170 -14.4
Glasslough Glaslough* 60 306 296 124 172 -3.3
Rockcorry Total – 260 287 140 147 10.4Dawsongrove* 39 228 268 130 138 17.5Lisnaveane* 44 32 19 10 9 -40.6
Newbliss Newbliss* 45 299 270 137 133 -9.7
Smithborough Drumsnat* 56 232 240 121 119 3.4
Scotstown Scotstown* 65 234 220 114 106 -6.0
Cabragh Total – – 201 106 95 –Drumsnat* 56 – 191 102 89 –Kilmore* 62 – 10 4 6 –

Census 2002 Areas58
Table 6 Population and area of each Province, County, City, urban area, rural area and ElectoralDivision, 1996 and 2002
District1996 2002 Change in population
1996-2002 Area*(hectares)
Persons Persons Males Females Actual Percentage
Leinster 1,924,702 2,105,579 1,038,015 1,067,564 180,877 9.4 1,977,423
Carlow County 41,616 46,014 23,403 22,611 4,398 10.6 89,790
Carlow Town 11,721 13,218 6,490 6,728 1,497 12.8 661
001 Carlow Urban 4,903 4,963 2,438 2,525 60 1.2 156002 Graigue Urban 1,501 1,702 853 849 201 13.4 52019 Carlow Rural (part) 5,317 6,553 3,199 3,354 1,236 23.2 453
Baltinglass No. 2 rural area 3,409 3,633 1,889 1,744 224 6.6 13,518
003 Clonmore 444 461 236 225 17 3.8 2,814004 Hacketstown 1,003 1,026 543 483 23 2.3 2,206005 Haroldstown 187 239 122 117 52 27.8 1,153006 Kineagh 266 287 145 142 21 7.9 1,803007 Rahill 427 393 208 185 -34 -8.0 1,642008 Rathvilly 584 700 357 343 116 19.9 1,272009 Tiknock 246 271 148 123 25 10.2 1,075010 Williamstown 252 256 130 126 4 1.6 1,553
Carlow rural area 24,560 27,184 13,963 13,221 2,624 10.7 65,426
011 Agha 244 266 140 126 22 9.0 1,232012 Ballinacarrig 776 847 449 398 71 9.1 1,614013 Ballintemple 427 423 221 202 -4 -0.9 2,834014 Ballon 418 466 224 242 48 11.5 980015 Ballyellin 353 352 178 174 -1 -0.3 1,579016 Ballymoon 228 258 135 123 30 13.2 1,410017 Borris 982 959 476 483 -23 -2.3 1,608018 Burton Hall 241 281 137 144 40 16.6 610019 Carlow Rural (part) 3,146 4,685 2,398 2,287 1,539 48.9 1,799020 Clogrenan 722 687 374 313 -35 -4.8 1,777021 Clonegall 715 808 407 401 93 13.0 2,336022 Corries 457 482 254 228 25 5.5 1,762023 Cranemore 719 724 373 351 5 0.7 3,655024 Fennagh 482 473 232 241 -9 -1.9 1,896025 Garryhill 594 594 299 295 – – 2,385026 Grangeford 308 283 152 131 -25 -8.1 1,416027 Johnstown 487 499 247 252 12 2.5 1,559028 Kellistown 768 864 443 421 96 12.5 2,001029 Kilbride 332 354 187 167 22 6.6 1,467030 Killedmond 318 367 200 167 49 15.4 1,880031 Killerrig 246 263 133 130 17 6.9 1,112032 Leighlinbridge 1,145 1,316 680 636 171 14.9 2,488033 Muinebeag (Bagenalstown) Rural 565 649 343 306 84 14.9 1,484034 Muinebeag (Bagenalstown) Urban 2,553 2,540 1,304 1,236 -13 -0.5 310035 Myshall 401 394 212 182 -7 -1.7 1,728036 Nurney 774 818 445 373 44 5.7 2,397037 Oldleighlin 349 406 204 202 57 16.3 1,935038 Rathanna 126 111 68 43 -15 -11.9 2,340039 Rathornan 353 325 166 159 -28 -7.9 1,996040 Rathrush 554 606 320 286 52 9.4 2,344041 Ridge 172 186 103 83 14 8.1 1,724042 Shangarry 429 490 249 241 61 14.2 2,005043 Sliguff 452 468 250 218 16 3.5 1,506044 Tankardstown 332 368 198 170 36 10.8 1,684045 Templepeter 310 342 171 171 32 10.3 1,510046 Tullowbeg 417 411 207 204 -6 -1.4 1,332047 Tullow Rural 421 503 265 238 82 19.5 1,391048 Tullow Urban 2,244 2,316 1,119 1,197 72 3.2 340
Idrone rural area 1,926 1,979 1,061 918 53 2.8 10,185
049 Ballymurphy 246 222 127 95 -24 -9.8 1,802050 Coonogue 192 187 98 89 -5 -2.6 1,523051 Glynn 332 343 188 155 11 3.3 2,265052 Kyle 281 270 139 131 -11 -3.9 1,684053 Marley 285 289 158 131 4 1.4 1,536054 Tinnahinch 590 668 351 317 78 13.2 1,375
* Area details provided by Ordnance Survey.

Census 2002 Areas59
Table 6 (contd.) Population and area of each Province, County, City, urban area, rural area andElectoral Division, 1996 and 2002
District1996 2002 Change in population
1996-2002 Area*(hectares)
Persons Persons Males Females Actual Percentage
Dublin County and City 1,058,264 1,122,821 544,075 578,746 64,557 6.1 92,066
Dublin City 481,854 495,781 237,813 257,968 13,927 2.9 11,761
Dublin City North 287,216 290,521 140,257 150,264 3,305 1.2 7,474
001 Arran Quay A 1,336 1,390 646 744 54 4.0 14002 Arran Quay B 1,963 3,089 1,587 1,502 1,126 57.4 72003 Arran Quay C 1,914 2,375 1,219 1,156 461 24.1 38004 Arran Quay D 3,264 3,675 1,832 1,843 411 12.6 34005 Arran Quay E 2,957 2,902 1,324 1,578 -55 -1.9 26006 Ashtown A 6,393 6,817 3,160 3,657 424 6.6 200007 Ashtown B 2,487 2,607 1,188 1,419 120 4.8 58008 Ayrfield 5,335 5,426 2,725 2,701 91 1.7 93009 Ballybough A 3,570 3,368 1,613 1,755 -202 -5.7 37010 Ballybough B 2,571 3,009 1,510 1,499 438 17.0 34011 Ballygall A 3,064 2,843 1,404 1,439 -221 -7.2 49012 Ballygall B 1,943 1,747 851 896 -196 -10.1 57013 Ballygall C 4,098 3,787 1,765 2,022 -311 -7.6 101014 Ballygall D 2,563 2,412 1,175 1,237 -151 -5.9 42015 Ballymun A 1,766 1,575 814 761 -191 -10.8 95016 Ballymun B 4,431 4,050 1,947 2,103 -381 -8.6 65017 Ballymun C 6,575 5,896 2,805 3,091 -679 -10.3 77018 Ballymun D 3,794 3,712 1,676 2,036 -82 -2.2 48019 Ballymun E 1,863 1,602 747 855 -261 -14.0 35020 Ballymun F 2,937 2,652 1,289 1,363 -285 -9.7 44021 Beaumont A 3,059 2,667 1,270 1,397 -392 -12.8 51022 Beaumont B 4,591 5,173 2,533 2,640 582 12.7 86023 Beaumont C 3,487 3,050 1,476 1,574 -437 -12.5 60024 Beaumont D 2,733 2,605 1,312 1,293 -128 -4.7 42025 Beaumont E 2,585 2,289 1,111 1,178 -296 -11.5 35026 Beaumont F 3,975 3,748 1,795 1,953 -227 -5.7 55027 Botanic A 2,800 2,914 1,287 1,627 114 4.1 129028 Botanic B 2,925 3,449 1,645 1,804 524 17.9 49029 Botanic C 2,144 2,195 1,046 1,149 51 2.4 29030 Cabra East A 5,033 5,396 2,512 2,884 363 7.2 141031 Cabra East B 3,839 3,661 1,727 1,934 -178 -4.6 44032 Cabra East C 3,442 3,638 1,850 1,788 196 5.7 46033 Cabra West A 1,751 1,700 836 864 -51 -2.9 49034 Cabra West B 2,760 2,645 1,299 1,346 -115 -4.2 43035 Cabra West C 3,184 2,937 1,423 1,514 -247 -7.8 57036 Cabra West D 2,731 2,865 1,418 1,447 134 4.9 60037 Clontarf East A 3,399 3,279 1,521 1,758 -120 -3.5 211038 Clontarf East B 6,345 6,458 2,973 3,485 113 1.8 348039 Clontarf East C 2,998 3,029 1,392 1,637 31 1.0 83040 Clontarf East D 2,737 2,772 1,322 1,450 35 1.3 66041 Clontarf East E 1,603 1,643 717 926 40 2.5 42042 Clontarf West A 3,347 3,487 1,633 1,854 140 4.2 72043 Clontarf West B 2,705 2,602 1,220 1,382 -103 -3.8 43044 Clontarf West C 3,102 3,372 1,621 1,751 270 8.7 104045 Clontarf West D 2,022 2,140 968 1,172 118 5.8 82046 Clontarf West E 2,475 2,394 1,077 1,317 -81 -3.3 33047 Drumcondra South A 3,758 3,857 1,867 1,990 99 2.6 105048 Drumcondra South B 1,282 1,377 628 749 95 7.4 34049 Drumcondra South C 3,498 3,504 1,515 1,989 6 0.2 76050 Edenmore 3,159 2,890 1,399 1,491 -269 -8.5 60051 Finglas North A 3,943 3,540 1,694 1,846 -403 -10.2 73052 Finglas North B 3,242 2,938 1,385 1,553 -304 -9.4 65053 Finglas North C 3,174 3,129 1,512 1,617 -45 -1.4 108054 Finglas South A 2,792 2,607 1,271 1,336 -185 -6.6 60055 Finglas South B 3,210 3,309 1,666 1,643 99 3.1 97056 Finglas South C 3,306 2,768 1,330 1,438 -538 -16.3 36057 Finglas South D 2,605 2,138 1,076 1,062 -467 -17.9 44058 Grace Park 6,214 5,986 2,820 3,166 -228 -3.7 125059 Grange A 5,322 7,301 3,646 3,655 1,979 37.2 164060 Grange B 2,329 2,138 1,046 1,092 -191 -8.2 117061 Grange C 4,301 3,673 1,869 1,804 -628 -14.6 45062 Grange D 4,918 4,330 2,094 2,236 -588 -12.0 67063 Grange E 3,327 2,930 1,445 1,485 -397 -11.9 54064 Harmonstown A 3,388 3,070 1,465 1,605 -318 -9.4 65065 Harmonstown B 2,776 2,585 1,254 1,331 -191 -6.9 54

Census 2002 Areas60
Table 6 (contd.) Population and area of each Province, County, City, urban area, rural area andElectoral Division, 1996 and 2002
District1996 2002 Change in population
1996-2002 Area*(hectares)
Persons Persons Males Females Actual Percentage
Dublin City (contd.)
Dublin City North (contd.)
066 Inns Quay A 3,235 3,373 1,948 1,425 138 4.3 32067 Inns Quay B 2,680 2,953 1,411 1,542 273 10.2 28068 Inns Quay C 1,748 2,359 1,160 1,199 611 35.0 28069 Kilmore A 2,726 2,943 1,439 1,504 217 8.0 83070 Kilmore B 3,260 3,006 1,425 1,581 -254 -7.8 46071 Kilmore C 1,779 1,676 772 904 -103 -5.8 53072 Kilmore D 2,611 2,337 1,149 1,188 -274 -10.5 50073 Mountjoy A 3,108 3,242 1,592 1,650 134 4.3 29074 Mountjoy B 1,994 2,725 1,481 1,244 731 36.7 23075 North City 2,391 3,942 1,967 1,975 1,551 64.9 56076 North Dock A 1,188 1,287 646 641 99 8.3 15077 North Dock B 3,655 3,628 1,846 1,782 -27 -0.7 336078 North Dock C 2,411 3,568 1,830 1,738 1,157 48.0 63079 Phoenix Park 1,002 1,468 685 783 466 46.5 739080 Priorswood A 1,615 1,564 788 776 -51 -3.2 174081 Priorswood B 3,353 3,298 1,599 1,699 -55 -1.6 43082 Priorswood C 3,790 3,633 1,663 1,970 -157 -4.1 87083 Priorswood D 3,026 2,846 1,407 1,439 -180 -5.9 82084 Priorswood E 3,126 2,883 1,419 1,464 -243 -7.8 40085 Raheny-Foxfield 3,000 2,712 1,304 1,408 -288 -9.6 59086 Raheny-Greendale 2,497 2,478 1,199 1,279 -19 -0.8 44087 Raheny-St. Assam 3,770 3,488 1,660 1,828 -282 -7.5 237088 Rotunda A 2,522 4,199 2,146 2,053 1,677 66.5 24089 Rotunda B 1,122 1,752 886 866 630 56.1 21090 Whitehall A 3,143 3,542 1,644 1,898 399 12.7 134091 Whitehall B 4,153 3,902 1,875 2,027 -251 -6.0 74092 Whitehall C 2,378 2,252 1,054 1,198 -126 -5.3 76093 Whitehall D 2,793 2,353 1,019 1,334 -440 -15.8 70
Dublin City South 194,638 205,260 97,556 107,704 10,622 5.5 4,287
094 Chapelizod 1,855 2,351 1,056 1,295 496 26.7 118095 Cherry Orchard A 1,398 2,161 1,371 790 763 54.6 107096 Carna 3,049 2,918 1,404 1,514 -131 -4.3 58097 Cherry Orchard C 3,941 3,728 1,771 1,957 -213 -5.4 145098 Crumlin A 3,952 3,862 1,799 2,063 -90 -2.3 55099 Crumlin B 3,330 3,197 1,582 1,615 -133 -4.0 74100 Crumlin C 2,345 2,338 1,095 1,243 -7 -0.3 49101 Crumlin D 4,119 4,119 1,968 2,151 – – 58102 Crumlin E 2,925 2,970 1,355 1,615 45 1.5 38103 Crumlin F 3,086 2,982 1,406 1,576 -104 -3.4 40104 Decies 3,264 2,933 1,436 1,497 -331 -10.1 33105 Drumfinn 3,987 3,799 1,821 1,978 -188 -4.7 81106 Inchicore A 2,145 2,041 1,000 1,041 -104 -4.8 100107 Inchicore B 1,983 1,849 903 946 -134 -6.8 82108 Kilmainham A 2,445 2,355 1,137 1,218 -90 -3.7 25109 Kilmainham B 1,172 1,159 546 613 -13 -1.1 81110 Kilmainham C 3,446 3,844 1,848 1,996 398 11.5 60111 Kimmage A 2,183 2,089 1,014 1,075 -94 -4.3 29112 Kimmage B 4,037 3,791 1,821 1,970 -246 -6.1 43113 Kimmage C 3,025 3,013 1,318 1,695 -12 -0.4 94114 Kimmage D 2,375 2,630 1,217 1,413 255 10.7 42115 Kimmage E 3,443 3,502 1,644 1,858 59 1.7 64116 Kylemore 3,065 2,805 1,324 1,481 -260 -8.5 58117 Mansion House A 3,139 4,269 2,067 2,202 1,130 36.0 65118 Mansion House B 770 990 542 448 220 28.6 64119 Merchants Quay A 1,513 1,824 909 915 311 20.6 17120 Merchants Quay B 2,356 3,449 1,761 1,688 1,093 46.4 23121 Merchants Quay C 2,079 2,639 1,287 1,352 560 26.9 33122 Merchants Quay D 2,060 2,084 955 1,129 24 1.2 22123 Merchants Quay E 1,463 1,660 801 859 197 13.5 23124 Merchants Quay F 2,296 2,264 977 1,287 -32 -1.4 29125 Pembroke East A 4,349 4,304 2,075 2,229 -45 -1.0 214126 Pembroke East B 3,524 3,595 1,623 1,972 71 2.0 68127 Pembroke East C 3,825 3,900 1,673 2,227 75 2.0 92128 Pembroke East D 4,383 4,471 1,964 2,507 88 2.0 181129 Pembroke East E 2,974 3,337 1,604 1,733 363 12.2 120

Census 2002 Areas61
Table 6 (contd.) Population and area of each Province, County, City, urban area, rural area andElectoral Division, 1996 and 2002
District1996 2002 Change in population
1996-2002 Area*(hectares)
Persons Persons Males Females Actual Percentage
Dublin City (contd.)
Dublin City South (contd.)
130 Pembroke West A 3,292 3,241 1,459 1,782 -51 -1.5 63131 Pembroke West B 2,615 3,140 1,530 1,610 525 20.1 72132 Pembroke West C 4,287 4,188 1,998 2,190 -99 -2.3 67133 Rathfarnham 4,520 4,446 2,081 2,365 -74 -1.6 121134 Rathmines East A 4,609 4,541 2,081 2,460 -68 -1.5 72135 Rathmines East B 4,510 5,020 2,138 2,882 510 11.3 122136 Rathmines East C 3,571 3,695 1,716 1,979 124 3.5 73137 Rathmines East D 2,848 2,962 1,400 1,562 114 4.0 36138 Rathmines West A 4,099 4,749 2,224 2,525 650 15.9 65139 Rathmines West B 3,338 3,526 1,690 1,836 188 5.6 33140 Rathmines West C 2,686 2,675 1,213 1,462 -11 -0.4 41141 Rathmines West D 3,051 3,275 1,520 1,755 224 7.3 37142 Rathmines West E 3,380 3,569 1,620 1,949 189 5.6 45143 Rathmines West F 2,977 2,929 1,364 1,565 -48 -1.6 44144 Royal Exchange A 2,267 3,569 1,834 1,735 1,302 57.4 44145 Royal Exchange B 1,613 1,936 1,020 916 323 20.0 22146 St. Kevin’s 3,497 4,601 2,376 2,225 1,104 31.6 62147 South Dock 3,307 3,764 1,768 1,996 457 13.8 106148 Terenure A 3,520 3,494 1,627 1,867 -26 -0.7 53149 Terenure B 3,514 3,445 1,596 1,849 -69 -2.0 52150 Terenure C 1,833 1,773 847 926 -60 -3.3 72151 Terenure D 872 872 426 446 – – 45152 Ushers A 845 1,679 818 861 834 98.7 71153 Ushers B 926 1,072 553 519 146 15.8 26154 Ushers C 2,571 2,708 1,280 1,428 137 5.3 38155 Ushers D 1,802 1,752 897 855 -50 -2.8 14156 Ushers E 1,894 1,935 926 1,009 41 2.2 21157 Ushers F 2,554 3,064 1,387 1,677 510 20.0 50158 Walkinstown A 1,999 1,893 935 958 -106 -5.3 103159 Walkinstown B 2,009 1,858 888 970 -151 -7.5 37160 Walkinstown C 2,341 2,263 1,055 1,208 -78 -3.3 48161 Wood Quay A 2,651 2,866 1,465 1,401 215 8.1 17162 Wood Quay B 3,539 3,538 1,750 1,788 -1 -0.0 30
Dún Laoghaire-Rathdown 189,999 191,792 91,337 100,455 1,793 0.9 12,695
001 Ballinteer-Broadford 3,354 3,213 1,575 1,638 -141 -4.2 55002 Ballinteer-Ludford 2,679 2,355 1,153 1,202 -324 -12.1 44003 Ballinteer-Marley 2,763 2,602 1,275 1,327 -161 -5.8 132004 Ballinteer-Meadowbroads 1,845 1,729 851 878 -116 -6.3 37005 Ballinteer-Meadowmount 2,127 1,908 936 972 -219 -10.3 37006 Ballinteer-Woodpark 4,230 4,312 2,103 2,209 82 1.9 93007 Ballybrack 3,731 3,433 1,692 1,741 -298 -8.0 66008 Blackrock-Booterstown 2,283 2,888 1,291 1,597 605 26.5 79009 Blackrock-Carysfort 4,986 5,555 2,625 2,930 569 11.4 128010 Blackrock-Central 3,386 3,648 1,715 1,933 262 7.7 109011 Blackrock-Glenomena 1,795 1,839 820 1,019 44 2.5 41012 Blackrock-Monkstown 3,283 3,146 1,379 1,767 -137 -4.2 82013 Blackrock-Newpark 2,374 2,272 1,057 1,215 -102 -4.3 47014 Blackrock-Seapoint 1,518 1,403 649 754 -115 -7.6 38015 Blackrock-Stradbrook 2,296 2,383 1,113 1,270 87 3.8 48016 Blackrock-Templehill 2,666 2,700 1,194 1,506 34 1.3 79017 Blackrock-Williamstown 2,444 2,723 1,278 1,445 279 11.4 114018 Cabinteely-Granitefield 2,666 2,407 1,192 1,215 -259 -9.7 57019 Cabinteely-Kilbogget 3,465 3,258 1,631 1,627 -207 -6.0 111020 Cabinteely-Loughlinstown 880 1,510 738 772 630 71.6 637021 Cabinteely-Pottery 4,977 4,946 2,370 2,576 -31 -0.6 168022 Churchtown-Castle 1,278 1,248 576 672 -30 -2.3 86023 Churchtown-Landscape 1,273 1,224 576 648 -49 -3.8 38024 Churchtown-Nutgrove 3,692 3,375 1,641 1,734 -317 -8.6 78025 Churchtown-Orwell 2,004 1,957 895 1,062 -47 -2.3 98026 Churchtown-Woodlawn 1,273 1,288 611 677 15 1.2 41027 Clonskeagh-Belfield 1,988 2,138 919 1,219 150 7.5 189028 Clonskeagh-Farranboley 1,638 1,485 688 797 -153 -9.3 37029 Clonskeagh-Milltown 1,808 1,845 876 969 37 2.0 52030 Clonskeagh-Roebuck 1,789 1,791 812 979 2 0.1 74

Census 2002 Areas62
Table 6 (contd.) Population and area of each Province, County, City, urban area, rural area andElectoral Division, 1996 and 2002
District1996 2002 Change in population
1996-2002 Area*(hectares)
Persons Persons Males Females Actual Percentage
Dún Laoghaire-Rathdown (contd.)
031 Clonskeagh-Windy Arbour 2,353 2,394 1,148 1,246 41 1.7 71032 Dalkey-Avondale 1,534 1,446 669 777 -88 -5.7 50033 Dalkey-Bullock 1,809 1,762 792 970 -47 -2.6 57034 Dalkey-Coliemore 1,463 1,445 654 791 -18 -1.2 54035 Dalkey Hill 1,586 1,584 726 858 -2 -0.1 120036 Dalkey Upper 2,262 2,168 1,019 1,149 -94 -4.2 58037 Dundrum-Balally 5,564 5,086 2,532 2,554 -478 -8.6 261038 Dundrum-Kilmacud 2,364 2,411 1,159 1,252 47 2.0 76039 Dundrum-Sandyford 5,203 4,862 2,332 2,530 -341 -6.6 248040 Dundrum-Sweetmount 2,136 1,993 979 1,014 -143 -6.7 54041 Dundrum-Taney 2,751 2,785 1,328 1,457 34 1.2 56042 Dún Laoghaire-East Central 2,000 2,144 1,028 1,116 144 7.2 48043 Dún Laoghaire-Glasthule 2,812 2,665 1,216 1,449 -147 -5.2 72044 Dún Laoghaire-Glenageary 2,020 1,951 939 1,012 -69 -3.4 60045 Dún Laoghaire-Monkstown Farm 2,135 2,115 1,033 1,082 -20 -0.9 35046 Dún Laoghaire-Mount Town 1,881 1,619 755 864 -262 -13.9 33047 Dún Laoghaire-Sallynoggin East 3,239 3,078 1,404 1,674 -161 -5.0 76048 Dún Laoghaire-Sallynoggin South 1,473 1,388 650 738 -85 -5.8 41049 Dún Laoghaire-Sallynoggin West 2,176 2,130 1,022 1,108 -46 -2.1 62050 Dún Laoghaire-Sandycove 3,624 3,761 1,744 2,017 137 3.8 96051 Dún Laoghaire-Salthill 1,428 1,593 782 811 165 11.6 57052 Dún Laoghaire-West Central 1,988 2,003 880 1,123 15 0.8 49053 Foxrock-Beechpark 1,944 1,787 842 945 -157 -8.1 68054 Foxrock-Carrickmines 5,747 6,050 2,949 3,101 303 5.3 256055 Foxrock-Deans Grange 2,658 2,609 1,280 1,329 -49 -1.8 100056 Foxrock-Torquay 1,307 1,310 630 680 3 0.2 97057 Glencullen 8,063 10,266 5,167 5,099 2,203 27.3 3,454058 Killiney North 3,943 3,558 1,727 1,831 -385 -9.8 217059 Killiney South 6,962 7,042 3,323 3,719 80 1.1 157060 Shankill-Rathmichael 3,545 4,435 2,148 2,287 890 25.1 1,460061 Shankill-Rathsallagh 3,366 3,485 1,680 1,805 119 3.5 103062 Shankill-Shanganagh 5,399 5,322 2,605 2,717 -77 -1.4 300063 Stillorgan-Deerpark 3,024 2,915 1,349 1,566 -109 -3.6 102064 Stillorgan-Kilmacud 3,894 4,003 1,904 2,099 109 2.8 88065 Stillorgan-Leopardstown 2,379 2,173 1,027 1,146 -206 -8.7 56066 Stillorgan-Merville 2,803 2,847 1,316 1,531 44 1.6 108067 Stillorgan-Mount Merrion 2,418 2,446 1,115 1,331 28 1.2 89068 Stillorgan-Priory 1,577 1,869 890 979 292 18.5 53069 Tibradden 678 711 363 348 33 4.9 1,358
Fingal 167,683 196,413 97,409 99,004 28,730 17.1 45,309
001 Airport 308 441 253 188 133 43.2 854002 Balbriggan Rural 3,454 4,501 2,226 2,275 1,047 30.3 2,546003 Balbriggan Urban 5,743 6,631 3,286 3,345 888 15.5 213004 Baldoyle 6,739 6,374 3,136 3,238 -365 -5.4 266005 Balgriffin 603 590 286 304 -13 -2.2 1,017006 Ballyboghil 702 859 426 433 157 22.4 1,945007 Balscadden 505 577 292 285 72 14.3 1,532008 Blanchardstown-Abbotstown 1,531 2,537 1,185 1,352 1,006 65.7 702009 Blanchardstown-Blakestown 15,131 24,404 12,177 12,227 9,273 61.3 767010 Blanchardstown-Coolmine 7,969 9,202 4,677 4,525 1,233 15.5 277011 Blanchardstown-Corduff 4,725 4,346 2,109 2,237 -379 -8.0 142012 Blanchardstown-Delwood 4,235 4,589 2,279 2,310 354 8.4 93013 Blanchardstown-Mulhuddart 1,245 1,833 908 925 588 47.2 183014 Blanchardstown-Roselawn 2,303 2,043 999 1,044 -260 -11.3 44015 Blanchardstown-Tyrrelstown 1,473 1,653 720 933 180 12.2 353016 Castleknock-Knockmaroon 11,095 14,859 7,344 7,515 3,764 33.9 711017 Castleknock-Park 4,840 4,561 2,262 2,299 -279 -5.8 254018 Clonmethan 492 605 316 289 113 23.0 1,695019 Donabate 4,320 6,141 3,094 3,047 1,821 42.2 2,386020 Dubber 577 838 409 429 261 45.2 1,771021 Garristown 1,060 1,162 596 566 102 9.6 3,584022 Hollywood 900 952 499 453 52 5.8 3,022023 Holmpatrick 3,248 3,328 1,675 1,653 80 2.5 2,587024 Howth 9,008 8,706 4,250 4,456 -302 -3.4 1,023025 Kilsallaghan 1,877 2,032 1,024 1,008 155 8.3 2,772026 Kinsaley 3,282 3,528 1,751 1,777 246 7.5 1,098

Census 2002 Areas63
Table 6 (contd.) Population and area of each Province, County, City, urban area, rural area andElectoral Division, 1996 and 2002
District1996 2002 Change in population
1996-2002 Area*(hectares)
Persons Persons Males Females Actual Percentage
Fingal (contd.)
027 Lucan North 340 338 155 183 -2 -0.6 952028 Lusk 3,740 4,131 2,051 2,080 391 10.5 4,239029 Malahide East 5,246 5,281 2,606 2,675 35 0.7 320030 Malahide West 6,444 6,315 3,121 3,194 -129 -2.0 264031 Portmarnock North 5,582 5,071 2,542 2,529 -511 -9.2 96032 Portmarnock South 3,706 3,338 1,663 1,675 -368 -9.9 531033 Rush 5,433 6,759 3,408 3,351 1,326 24.4 670034 Skerries 5,704 7,612 3,733 3,879 1,908 33.5 249035 Sutton 6,510 6,203 2,991 3,212 -307 -4.7 149036 Swords-Forrest 7,911 9,797 4,785 5,012 1,886 23.8 671037 Swords-Glasmore 7,088 7,679 3,872 3,807 591 8.3 438038 Swords-Lissenhall 3,222 6,081 3,057 3,024 2,859 88.7 1,881039 Swords-Seatown 4,425 4,919 2,439 2,480 494 11.2 355040 Swords Village 2,300 2,572 1,287 1,285 272 11.8 131041 The Ward 806 1,308 671 637 502 62.3 2,440042 Turnapin 1,861 1,717 849 868 -144 -7.7 86
South Dublin 218,728 238,835 117,516 121,319 20,107 9.2 22,301
001 Ballinascorney 514 657 349 308 143 27.8 2,421002 Ballyboden 5,260 5,285 2,579 2,706 25 0.5 119003 Bohernabreena 2,681 3,936 1,954 1,982 1,255 46.8 4,375004 Clondalkin-Ballymount 1,812 2,011 1,018 993 199 11.0 316005 Clondalkin-Cappaghmore 1,825 1,609 758 851 -216 -11.8 205006 Clondalkin-Dunawley 9,289 10,710 5,157 5,553 1,421 15.3 481007 Clondalkin-Monastery 8,633 9,363 4,650 4,713 730 8.5 388008 Clondalkin-Moorfield 6,697 6,246 3,084 3,162 -451 -6.7 209009 Clondalkin-Rowlagh 5,238 4,504 2,207 2,297 -734 -14.0 73010 Clondalkin Village 8,123 8,595 4,240 4,355 472 5.8 602011 Edmondstown 4,863 5,846 2,872 2,974 983 20.2 422012 Firhouse-Ballycullen 4,603 6,594 3,268 3,326 1,991 43.3 283013 Firhouse-Knocklyon 4,629 4,331 2,154 2,177 -298 -6.4 105014 Firhouse Village 6,859 9,024 4,477 4,547 2,165 31.6 235015 Lucan-Esker 7,451 20,807 10,408 10,399 13,356 179.3 645016 Lucan Heights 5,817 5,719 2,795 2,924 -98 -1.7 366017 Lucan-St. Helen’s 6,915 7,045 3,532 3,513 130 1.9 1,004018 Newcastle 2,374 2,355 1,221 1,134 -19 -0.8 3,200019 Palmerston Village 3,961 3,929 1,898 2,031 -32 -0.8 121020 Palmerston West 8,449 8,130 3,988 4,142 -319 -3.8 393021 Rathcoole 3,448 3,204 1,660 1,544 -244 -7.1 1,536022 Rathfarnham-Ballyroan 2,903 2,679 1,292 1,387 -224 -7.7 68023 Rathfarnham-Butterfield 3,323 3,222 1,532 1,690 -101 -3.0 71024 Rathfarnham-Hermitage 4,284 4,468 2,163 2,305 184 4.3 75025 Rathfarnham-St. Enda’s 4,493 4,234 1,962 2,272 -259 -5.8 111026 Rathfarnham Village 2,757 3,114 1,462 1,652 357 12.9 77027 Saggart 1,408 1,588 766 822 180 12.8 1,345028 Tallaght-Avonbeg 1,967 1,645 792 853 -322 -16.4 38029 Tallaght-Belgard 2,067 1,970 1,017 953 -97 -4.7 272030 Tallaght-Fettercairn 5,513 6,488 3,087 3,401 975 17.7 461031 Tallaght-Glenview 1,430 1,496 740 756 66 4.6 45032 Tallaght-Jobstown 7,294 9,838 4,837 5,001 2,544 34.9 277033 Tallaght-Killinardan 4,970 4,700 2,223 2,477 -270 -5.4 75034 Tallaght-Kilnamanagh 5,633 5,323 2,695 2,628 -310 -5.5 213035 Tallaght-Kiltipper 5,237 5,333 2,637 2,696 96 1.8 166036 Tallaght-Kingswood 4,539 4,250 2,131 2,119 -289 -6.4 181037 Tallaght-Millbrook 4,508 3,917 1,963 1,954 -591 -13.1 71038 Tallaght-Oldbawn 5,040 4,580 2,290 2,290 -460 -9.1 144039 Tallaght-Springfield 7,803 7,787 3,918 3,869 -16 -0.2 202040 Tallaght-Tymon 6,289 5,604 2,754 2,850 -685 -10.9 203041 Templeogue-Cypress 3,253 3,079 1,543 1,536 -174 -5.3 71042 Templeogue-Kimmage Manor 3,520 4,396 2,173 2,223 876 24.9 114043 Templeogue-Limekiln 4,261 3,874 1,852 2,022 -387 -9.1 114044 Templeogue-Orwell 2,871 2,629 1,324 1,305 -242 -8.4 45045 Templeogue-Osprey 3,029 2,798 1,385 1,413 -231 -7.6 139046 Templeogue Village 1,728 1,607 738 869 -121 -7.0 51047 Terenure-Cherryfield 2,341 2,228 1,083 1,145 -113 -4.8 44048 Terenure-Greentrees 3,201 2,980 1,418 1,562 -221 -6.9 65049 Terenure-St. James 3,625 3,108 1,470 1,638 -517 -14.3 64

Census 2002 Areas64
Table 6 (contd.) Population and area of each Province, County, City, urban area, rural area andElectoral Division, 1996 and 2002
District1996 2002 Change in population
1996-2002 Area*(hectares)
Persons Persons Males Females Actual Percentage
Kildare County 134,992 163,944 82,735 81,209 28,952 21.4 169,420
Athy Town 5,306 6,049 2,965 3,084 743 14.0 949
001 Athy East Urban 2,291 2,862 1,391 1,471 571 24.9 219002 Athy West Urban 2,171 2,399 1,170 1,229 228 10.5 170004 Athy Rural (part) 844 788 404 384 -56 -6.6 560
Naas Town 14,074 18,288 9,250 9,038 4,214 29.9 1,830
003 Naas Urban 14,074 18,288 9,250 9,038 4,214 29.9 1,830
Athy No. 1 rural area 14,748 16,307 8,353 7,954 1,559 10.6 51,846
004 Athy Rural (part) 821 904 512 392 83 10.1 2,856005 Ballaghmoon 204 222 117 105 18 8.8 1,088006 Ballitore 649 716 366 350 67 10.3 1,277007 Ballybrackan 433 475 242 233 42 9.7 1,241008 Ballyshannon 723 994 516 478 271 37.5 2,612009 Belan 177 188 109 79 11 6.2 1,083010 Bert 152 159 91 68 7 4.6 1,085011 Burtown 300 296 154 142 -4 -1.3 2,061012 Carrigeen 486 543 290 253 57 11.7 3,013013 Castledermot 1,154 1,123 559 564 -31 -2.7 1,930014 Churchtown 453 472 250 222 19 4.2 1,873015 Dunmanoge 462 468 239 229 6 1.3 1,451016 Fontstown 337 400 209 191 63 18.7 1,835017 Graney 433 544 273 271 111 25.6 2,660018 Grangemellon 525 547 274 273 22 4.2 1,836019 Harristown 305 343 177 166 38 12.5 2,087020 Inchaquire 181 186 98 88 5 2.8 1,223021 Johnstown 161 157 82 75 -4 -2.5 868022 Kilberry 608 589 313 276 -19 -3.1 1,696023 Kildangan 268 370 175 195 102 38.1 1,505024 Kilkea 426 369 184 185 -57 -13.4 1,823025 Kilrush 342 425 210 215 83 24.3 1,800026 Lackagh 514 582 302 280 68 13.2 2,556027 Monasterevin 2,820 3,152 1,514 1,638 332 11.8 2,739028 Moone 316 372 190 182 56 17.7 1,755029 Narraghmore 454 481 274 207 27 5.9 1,683030 Nurney 555 672 366 306 117 21.1 1,258031 Quinsborough 99 115 55 60 16 16.2 1,453032 Skerries 390 443 212 231 53 13.6 1,499
Celbridge No. 1 rural area 43,237 51,622 25,981 25,641 8,385 19.4 21,732
033 Balraheen 1,598 1,884 1,152 732 286 17.9 3,330034 Celbridge 11,143 14,333 7,204 7,129 3,190 28.6 1,760035 Cloncurry 923 1,174 570 604 251 27.2 3,400036 Donadea 435 573 300 273 138 31.7 2,058037 Donaghcumper 2,671 3,118 1,572 1,546 447 16.7 2,434038 Kilcock 2,238 3,243 1,573 1,670 1,005 44.9 1,641039 Leixlip 13,585 15,154 7,644 7,510 1,569 11.5 1,138040 Maynooth 9,286 10,837 5,301 5,536 1,551 16.7 3,369041 Straffan 1,358 1,306 665 641 -52 -3.8 2,602
Edenderry No. 2 rural area 7,419 9,038 4,590 4,448 1,619 21.8 28,092
042 Ballynadrumny 523 575 295 280 52 9.9 1,957043 Cadamstown 683 763 386 377 80 11.7 2,036044 Carbury 1,399 1,650 827 823 251 17.9 4,469045 Carrick 202 212 102 110 10 5.0 1,545046 Cloncurry 229 328 163 165 99 43.2 1,573047 Drehid 180 197 101 96 17 9.4 1,554048 Dunfierth 543 610 333 277 67 12.3 2,245049 Killinthomas 263 406 195 211 143 54.4 1,502050 Kilpatrick 650 788 390 398 138 21.2 2,053051 Kilrainy 405 501 253 248 96 23.7 2,159052 Lullymore 131 163 82 81 32 24.4 2,150053 Rathangan 1,339 1,533 774 759 194 14.5 1,445054 Thomastown 408 649 359 290 241 59.1 2,007055 Windmill Cross 464 663 330 333 199 42.9 1,397

Census 2002 Areas65
Table 6 (contd.) Population and area of each Province, County, City, urban area, rural area andElectoral Division, 1996 and 2002
District1996 2002 Change in population
1996-2002 Area*(hectares)
Persons Persons Males Females Actual Percentage
Kildare County (contd.)
Naas No. 1 rural area 50,208 62,640 31,596 31,044 12,432 24.8 64,971
056 Ballymore Eustace 1,385 1,584 796 788 199 14.4 1,705057 Ballysax East 2,373 2,315 1,281 1,034 -58 -2.4 2,071058 Ballysax West 937 1,026 549 477 89 9.5 1,447059 Bodenstown 1,458 3,193 1,613 1,580 1,735 119.0 2,800060 Carnalway 1,292 1,399 693 706 107 8.3 3,051061 Carragh 735 901 490 411 166 22.6 1,295062 Clane 4,012 5,179 2,573 2,606 1,167 29.1 1,888063 Donore 551 641 323 318 90 16.3 2,016064 Downings 1,399 2,090 1,031 1,059 691 49.4 1,609065 Droichead Nua (Newbridge) Rural 899 1,168 596 572 269 29.9 1,926066 Droichead Nua (Newbridge) Urban 6,586 7,684 3,802 3,882 1,098 16.7 280067 Dunmurry 308 356 180 176 48 15.6 1,609068 Feighcullen 539 549 267 282 10 1.9 1,102069 Gilltown 695 803 413 390 108 15.5 3,227070 Kilcullen 1,682 1,782 877 905 100 5.9 1,786071 Kildare 5,343 6,867 3,485 3,382 1,524 28.5 3,710072 Kill 2,178 2,993 1,523 1,470 815 37.4 1,941073 Killashee 256 258 132 126 2 0.8 1,387074 Kilmeage North 1,212 1,394 728 666 182 15.0 2,258075 Kilmeage South 1,063 1,121 558 563 58 5.5 1,764076 Kilteel 459 483 245 238 24 5.2 1,748077 Ladytown 559 778 403 375 219 39.2 2,011078 Morristownbiller 7,398 9,693 4,829 4,864 2,295 31.0 1,707079 Naas Rural 668 1,134 569 565 466 69.8 1,351080 Newtown 418 420 212 208 2 0.5 2,042081 Oldconnell 670 786 386 400 116 17.3 1,781082 Oughterard 593 668 353 315 75 12.6 1,590083 Pollardstown 226 286 150 136 60 26.5 1,085084 Rathernan 368 423 209 214 55 14.9 1,746085 Rathmore 877 1,045 509 536 168 19.2 2,431086 Robertstown 1,510 1,760 900 860 250 16.6 1,405087 Timahoe North 703 868 425 443 165 23.5 3,608088 Timahoe South 439 533 257 276 94 21.4 1,698089 Usk 417 460 239 221 43 10.3 1,896
Kilkenny County 75,336 80,339 40,540 39,799 5,003 6.6 207,169
Kilkenny Borough 8,507 8,591 4,178 4,413 84 1.0 373
001 Kilkenny No. 1 Urban 4,546 4,857 2,342 2,515 311 6.8 182002 Kilkenny No. 2 Urban 3,961 3,734 1,836 1,898 -227 -5.7 191
Callan rural area 5,796 6,271 3,193 3,078 475 8.2 25,158
003 Burnchurch 395 403 200 203 8 2.0 1,434004 Callan Rural 953 1,038 547 491 85 8.9 4,092005 Callan Urban 1,224 1,325 639 686 101 8.3 152006 Coolaghmore 280 325 163 162 45 16.1 2,603007 Dunamaggan 282 313 154 159 31 11.0 1,808008 Earlstown 186 188 94 94 2 1.1 1,245009 Kells 403 506 269 237 103 25.6 1,893010 Killamery 203 203 113 90 – – 1,296011 Kilmaganny 661 669 341 328 8 1.2 3,143012 Kilmanagh 427 462 253 209 35 8.2 2,288013 Mallardstown 275 268 134 134 -7 -2.5 1,511014 Scotsborough 149 146 75 71 -3 -2.0 1,476015 Tullaghanbrogue 358 425 211 214 67 18.7 2,217
Carrick-on-Suir No. 3 rural area 3,613 3,578 1,846 1,732 -35 -1.0 13,098
016 Boolyglass 146 135 72 63 -11 -7.5 1,259017 Fiddown 696 684 347 337 -12 -1.7 1,756018 Muckalee 118 148 76 72 30 25.4 1,210019 Pilltown 1,353 1,354 684 670 1 0.1 1,904020 Templeorum 341 347 175 172 6 1.8 1,724021 Tubbrid 358 349 190 159 -9 -2.5 2,130022 Tullahought 185 162 85 77 -23 -12.4 1,358023 Whitechurch 416 399 217 182 -17 -4.1 1,757

Census 2002 Areas66
Table 6 (contd.) Population and area of each Province, County, City, urban area, rural area andElectoral Division, 1996 and 2002
District1996 2002 Change in population
1996-2002 Area*(hectares)
Persons Persons Males Females Actual Percentage
Kilkenny County (contd.)
Castlecomer rural area 7,476 7,856 3,964 3,892 380 5.1 23,417
024 Attanagh 345 350 167 183 5 1.4 2,512025 Ballyragget 1,270 1,272 642 630 2 0.2 2,667026 Castlecomer 2,133 2,314 1,131 1,183 181 8.5 3,062027 Clogh 1,112 1,249 630 619 137 12.3 3,490028 Clogharinka 230 254 130 124 24 10.4 1,488029 Kilmacar 407 412 215 197 5 1.2 2,335030 Moneenroe 1,162 1,204 623 581 42 3.6 3,244031 Mothell 402 387 210 177 -15 -3.7 2,614032 Muckalee 415 414 216 198 -1 -0.2 2,005
Ida rural area 2,527 2,493 1,280 1,213 -34 -1.3 11,671
033 Brownsford 118 120 71 49 2 1.7 1,031034 Dysartmoon 254 237 127 110 -17 -6.7 1,089035 Jerpoint West 119 122 69 53 3 2.5 2,226036 Listerlin 331 298 143 155 -33 -10.0 1,598037 Rosbercon Rural 552 569 283 286 17 3.1 1,133038 Shanbogh 431 421 214 207 -10 -2.3 1,676039 The Rower 722 726 373 353 4 0.6 2,918
Kilkenny rural area 21,050 23,767 11,809 11,958 2,717 12.9 44,544
040 Ballinamara 238 266 143 123 28 11.8 1,744041 Ballybeagh 249 252 124 128 3 1.2 2,257042 Ballycallan 373 395 212 183 22 5.9 2,105043 Clara 532 547 282 265 15 2.8 2,136044 Coolcraheen 474 508 258 250 34 7.2 2,149045 Dunbell 474 483 258 225 9 1.9 2,345046 Dunmore 491 472 230 242 -19 -3.9 1,353047 Freshford 991 1,058 545 513 67 6.8 2,170048 Gowran 958 990 496 494 32 3.3 2,579049 Grange 737 811 419 392 74 10.0 1,917050 Kilkenny Rural 11,639 13,542 6,535 7,007 1,903 16.4 4,025051 Kilkieran 389 484 255 229 95 24.4 2,319052 Odagh 390 440 231 209 50 12.8 1,802053 Outrath 714 739 366 373 25 3.5 1,741054 Paulstown 378 500 264 236 122 32.3 1,448055 Rathcoole 308 378 204 174 70 22.7 2,470056 Rathealy 153 164 84 80 11 7.2 1,316057 St. Canice 471 473 236 237 2 0.4 2,099058 Shankill 578 672 349 323 94 16.3 2,698059 Tiscoffin 222 260 138 122 38 17.1 2,292060 Tullaroan 291 333 180 153 42 14.4 1,579
Thomastown rural area 11,282 12,117 6,224 5,893 835 7.4 43,656
061 Aghaviller 388 351 188 163 -37 -9.5 1,760062 Ballyhale 304 335 175 160 31 10.2 849063 Ballyvool 150 179 92 87 29 19.3 1,180064 Bennettsbridge 841 931 476 455 90 10.7 1,906065 Bramblestown 122 161 95 66 39 32.0 1,321066 Castlebanny 109 144 80 64 35 32.1 1,382067 Castlegannon 101 113 63 50 12 11.9 1,217068 Coolhill 233 261 129 132 28 12.0 1,655069 Danesfort 414 453 235 218 39 9.4 1,508070 Ennisnag 339 498 262 236 159 46.9 1,153071 Famma 213 267 133 134 54 25.4 1,860072 Freaghana 171 196 105 91 25 14.6 2,284073 Goresbridge 629 599 297 302 -30 -4.8 1,087074 Graiguenamanagh 1,581 1,636 842 794 55 3.5 3,207075 Inistioge 652 709 366 343 57 8.7 2,723076 Jerpoint Church 694 714 352 362 20 2.9 1,660077 Kilfane 255 273 149 124 18 7.1 1,574078 Kilkeasy 279 290 159 131 11 3.9 1,835079 Kiltorcan 119 141 77 64 22 18.5 994080 Knocktopher 432 399 210 189 -33 -7.6 1,573081 Pleberstown 168 167 83 84 -1 -0.6 1,478082 Powerstown 398 442 222 220 44 11.1 1,988083 Stonyford 443 487 250 237 44 9.9 1,601084 Thomastown 1,641 1,702 852 850 61 3.7 2,090085 Tullaherin 172 187 89 98 15 8.7 1,028086 Ullard 204 208 105 103 4 2.0 1,523087 Woolengrange 230 274 138 136 44 19.1 1,220

Census 2002 Areas67
Table 6 (contd.) Population and area of each Province, County, City, urban area, rural area andElectoral Division, 1996 and 2002
District1996 2002 Change in population
1996-2002 Area*(hectares)
Persons Persons Males Females Actual Percentage
Kilkenny County (contd.)
Urlingford rural area 4,198 4,211 2,177 2,034 13 0.3 21,447
088 Balleen 386 400 214 186 14 3.6 2,451089 Ballyconra 260 265 148 117 5 1.9 1,493090 Baunmore 153 155 87 68 2 1.3 1,741091 Clomantagh 279 291 142 149 12 4.3 1,813092 Galmoy 280 283 146 137 3 1.1 2,635093 Glashare 298 287 149 138 -11 -3.7 2,098094 Johnstown 894 921 467 454 27 3.0 1,980095 Lisdowney 189 187 107 80 -2 -1.1 2,037096 Rathbeagh 225 222 109 113 -3 -1.3 1,300097 Tubbridbrittain 305 271 126 145 -34 -11.1 1,980098 Urlingford 929 929 482 447 – – 1,919
Waterford No. 2 rural area 10,887 11,455 5,869 5,586 568 5.2 23,805
099 Aglish 847 886 466 420 39 4.6 1,647100 Ballincrea 261 274 144 130 13 5.0 1,701101 Dunkitt 873 935 477 458 62 7.1 1,676102 Farnoge 280 281 141 140 1 0.4 1,394103 Kilbeacon 169 177 96 81 8 4.7 1,324104 Kilbride 290 332 182 150 42 14.5 1,328105 Kilcolumb 484 547 284 263 63 13.0 1,922106 Kilculliheen (part) 1,613 2,145 1,017 1,128 532 33.0 880107 Killahy 652 696 381 315 44 6.7 1,927108 Kilmakevoge 374 391 207 184 17 4.5 1,341109 Pollrone 1,000 1,021 513 508 21 2.1 1,693110 Portnascully 883 951 488 463 68 7.7 1,764111 Rathpatrick 1,622 1,204 613 591 -418 -25.8 1,863112 Rossinan 667 709 396 313 42 6.3 1,839113 Ullid 872 906 464 442 34 3.9 1,506
Laoighis County 52,945 58,774 30,131 28,643 5,829 11.0 171,946
Abbeyleix rural area 12,018 12,569 6,442 6,127 551 4.6 51,397
001 Abbeyleix 2,164 2,379 1,199 1,180 215 9.9 4,066002 Aghmacart 242 257 137 120 15 6.2 1,889003 Ballinakill 648 682 347 335 34 5.2 1,981004 Ballyroan 647 631 311 320 -16 -2.5 2,234005 Blandsfort 321 319 153 166 -2 -0.6 2,052006 Caher 62 82 45 37 20 32.3 833007 Castletown 641 610 326 284 -31 -4.8 2,423008 Clash 256 279 156 123 23 9.0 1,514009 Clonkeen 561 619 311 308 58 10.3 2,625010 Colt 234 205 114 91 -29 -12.4 1,013011 Cuffsborough 248 245 125 120 -3 -1.2 1,976012 Cullahill 303 341 173 168 38 12.5 1,698013 Cullenagh 93 92 44 48 -1 -1.1 1,244014 Donaghmore 224 248 133 115 24 10.7 1,374015 Donore 377 394 195 199 17 4.5 2,317016 Dunmore 190 209 109 100 19 10.0 1,041017 Durrow 1,142 1,164 583 581 22 1.9 2,598018 Dysartgallen 226 219 115 104 -7 -3.1 2,079019 Fossy 104 94 50 44 -10 -9.6 1,654020 Grantstown 268 318 163 155 50 18.7 2,079021 Kilcoke 137 143 79 64 6 4.4 1,087022 Kildellig 171 197 108 89 26 15.2 1,713023 Killermogh 383 386 198 188 3 0.8 1,875024 Kilnaseer 293 304 155 149 11 3.8 1,663025 Raheen 304 350 179 171 46 15.1 1,993026 Rathdowney 1,275 1,285 661 624 10 0.8 1,800027 Timahoe 504 517 273 244 13 2.6 2,576
Athy No. 2 rural area 4,831 5,197 2,621 2,576 366 7.6 19,440
028 Ballyadams 252 291 149 142 39 15.5 1,746029 Ballylynan 772 780 401 379 8 1.0 1,426030 Barrowhouse 388 435 221 214 47 12.1 1,301031 Curraclone 179 182 95 87 3 1.7 1,275032 Killabban 306 305 157 148 -1 -0.3 1,271033 Luggacurren 276 298 139 159 22 8.0 2,426034 Moyanna 247 261 137 124 14 5.7 1,671

Census 2002 Areas68
Table 6 (contd.) Population and area of each Province, County, City, urban area, rural area andElectoral Division, 1996 and 2002
District1996 2002 Change in population
1996-2002 Area*(hectares)
Persons Persons Males Females Actual Percentage
Laoighis County (contd.)
Athy No. 2 rural area (contd.)
035 Rathaspick 216 229 129 100 13 6.0 1,532036 Stradbally 1,483 1,634 803 831 151 10.2 2,066037 Tankardstown 224 268 132 136 44 19.6 1,537038 Timogue 338 346 181 165 8 2.4 1,941039 Vicarstown 150 168 77 91 18 12.0 1,248
Mountmellick rural area 28,796 33,263 17,097 16,166 4,467 15.5 71,311
040 Arderin 206 198 107 91 -8 -3.9 2,393041 Ballybrittas 652 676 347 329 24 3.7 1,569042 Ballycarroll 296 286 157 129 -10 -3.4 1,026043 Ballyfin 500 547 289 258 47 9.4 3,515044 Borris 364 384 208 176 20 5.5 1,753045 Brisha 183 224 112 112 41 22.4 1,616046 Capard 52 47 30 17 -5 -9.6 1,556047 Cappalough 287 316 164 152 29 10.1 1,641048 Cardtown 154 157 82 75 3 1.9 2,527049 Castlecuffe 324 376 196 180 52 16.0 2,995050 Clonaslee 830 883 451 432 53 6.4 4,185051 Clondarrig 501 502 258 244 1 0.2 1,519052 Clonin 191 177 96 81 -14 -7.3 1,327053 Coolrain 267 262 130 132 -5 -1.9 1,192054 Dangans 426 689 352 337 263 61.7 1,239055 Emo 898 985 503 482 87 9.7 3,740056 Garrymore 127 142 79 63 15 11.8 1,193057 Graigue 201 200 106 94 -1 -0.5 1,298058 Jamestown 368 409 202 207 41 11.1 1,417059 Kilcolmanbane 504 513 271 242 9 1.8 2,001060 Kilmullen 375 509 268 241 134 35.7 1,399061 Kilmurry 179 174 84 90 -5 -2.8 935062 Lacka 251 273 156 117 22 8.8 2,281063 Marymount 94 98 51 47 4 4.3 1,408064 Meelick 309 297 149 148 -12 -3.9 1,692065 Mountmellick Rural 910 968 490 478 58 6.4 1,576066 Mountmellick Urban 2,325 2,525 1,268 1,257 200 8.6 227067 Mountrath 1,809 1,896 948 948 87 4.8 2,380068 Nealstown 74 83 50 33 9 12.2 1,922069 O’More’s Forest 416 420 215 205 4 1.0 2,035070 Portarlington South 2,630 3,260 1,629 1,631 630 24.0 1,156071 Portlaoighise (Maryborough) Rural 6,323 8,934 4,615 4,319 2,611 41.3 2,177072 Portlaoighise (Maryborough) Urban 3,531 3,482 1,799 1,683 -49 -1.4 205073 Rearymore 264 257 144 113 -7 -2.7 1,679074 Rosenallis 404 440 219 221 36 8.9 1,913075 Sallyford 373 464 250 214 91 24.4 1,970076 Shaen 820 831 427 404 11 1.3 2,359077 Tinnahinch 153 158 77 81 5 3.3 2,613078 Trumra 225 221 118 103 -4 -1.8 1,682
Roscrea No. 3 rural area 2,575 2,624 1,356 1,268 49 1.9 14,812
079 Ballybrophy 137 145 75 70 8 5.8 1,009080 Borris-in-Ossory 692 731 372 359 39 5.6 2,083081 Clonmore 212 202 106 96 -10 -4.7 1,527082 Errill 348 365 183 182 17 4.9 1,786083 Kyle 258 255 125 130 -3 -1.2 2,179084 Kyle South 288 287 149 138 -1 -0.3 2,494085 Moneenalassa 140 126 70 56 -14 -10.0 1,183086 Moneymore 113 123 69 54 10 8.8 1,004087 Rathsaran 387 390 207 183 3 0.8 1,547
Slievemargy rural area 4,725 5,121 2,615 2,506 396 8.4 14,986
088 Ardough 288 305 164 141 17 5.9 1,786089 Arless 256 282 140 142 26 10.2 1,600090 Ballickmoyler 563 548 266 282 -15 -2.7 1,390091 Ballylehane 179 177 94 83 -2 -1.1 668092 Doonane 527 570 288 282 43 8.2 1,404093 Farnans 194 168 101 67 -26 -13.4 1,245094 Graigue Rural 1,508 1,819 904 915 311 20.6 1,719095 Newtown 273 275 142 133 2 0.7 1,124096 Rossmore 406 397 201 196 -9 -2.2 1,251097 Shrule 254 277 148 129 23 9.1 1,211098 Turra 277 303 167 136 26 9.4 1,588

Census 2002 Areas69
Table 6 (contd.) Population and area of each Province, County, City, urban area, rural area andElectoral Division, 1996 and 2002
District1996 2002 Change in population
1996-2002 Area*(hectares)
Persons Persons Males Females Actual Percentage
Longford County 30,166 31,068 15,794 15,274 902 3.0 109,125
Longford Town 6,444 6,831 3,290 3,541 387 6.0 898
001 Longford No. 1 Urban 2,989 2,841 1,380 1,461 -148 -5.0 175002 Longford No. 2 Urban 709 711 367 344 2 0.3 166051 Longford Rural (part) 2,746 3,279 1,543 1,736 533 19.4 557
Ballymahon rural area 5,374 5,350 2,750 2,600 -24 -0.4 31,007
003 Agharra 358 331 174 157 -27 -7.5 1,899004 Ballymahon 1,559 1,548 757 791 -11 -0.7 3,274005 Cashel East 372 324 173 151 -48 -12.9 2,852006 Cashel West 565 538 295 243 -27 -4.8 6,267007 Doory 345 358 193 165 13 3.8 2,546008 Forgney 380 393 194 199 13 3.4 2,723009 Foxhall 373 431 222 209 58 15.5 1,877010 Kilcommock 598 581 303 278 -17 -2.8 3,170011 Kilglass 555 588 303 285 33 5.9 3,400012 Ledwithstown 269 258 136 122 -11 -4.1 2,999
Granard No. 1 rural area 7,436 7,387 3,825 3,562 -49 -0.7 32,557
013 Abbeylara 280 245 125 120 -35 -12.5 1,266014 Ballinalee 357 376 189 187 19 5.3 1,402015 Ballymuigh 256 255 136 119 -1 -0.4 1,264016 Bunlahy 166 167 92 75 1 0.6 1,090017 Columbkille 596 596 333 263 – – 2,377018 Coolamber 261 263 127 136 2 0.8 2,018019 Creevy 313 289 166 123 -24 -7.7 1,400020 Crosagstown 208 226 109 117 18 8.7 1,220021 Currygrane 109 126 74 52 17 15.6 970022 Dalystown 175 170 94 76 -5 -2.9 914023 Drummeel 111 127 64 63 16 14.4 840024 Firry 149 172 89 83 23 15.4 994025 Gelshagh 284 322 173 149 38 13.4 1,579026 Granard Rural 261 256 137 119 -5 -1.9 1,663027 Granard Urban 1,173 1,013 525 488 -160 -13.6 811028 Knockanbaun 124 132 68 64 8 6.5 934029 Lislea 163 142 68 74 -21 -12.9 888030 Meathas Truim 1,046 1,098 529 569 52 5.0 1,358031 Milltown 329 323 163 160 -6 -1.8 1,691032 Moatfarrell 124 158 83 75 34 27.4 894033 Moyne 319 321 170 151 2 0.6 1,798034 Mullanalaghta 301 292 148 144 -9 -3.0 2,268035 Newgrove 50 37 19 18 -13 -26.0 1,270036 Sonnagh 281 281 144 137 – – 1,648
Longford rural area 10,912 11,500 5,929 5,571 588 5.4 44,663
037 Aghaboy 492 509 267 242 17 3.5 1,496038 Ardagh East 529 529 262 267 – – 3,038039 Ardagh West 343 397 210 187 54 15.7 1,985040 Ballinamuck East 485 464 253 211 -21 -4.3 2,026041 Ballinamuck West 453 459 241 218 6 1.3 2,348042 Breanrisk 604 642 346 296 38 6.3 2,021043 Caldragh 1,127 1,269 670 599 142 12.6 2,109044 Cloondara 552 549 278 271 -3 -0.5 2,774045 Cloonee 599 618 301 317 19 3.2 2,311046 Corboy 361 395 202 193 34 9.4 2,084047 Drumgort 430 416 227 189 -14 -3.3 1,955048 Drumlish 799 828 412 416 29 3.6 2,012049 Killashee 235 234 116 118 -1 -0.4 2,181050 Killoe 306 284 150 134 -22 -7.2 1,537051 Longford Rural (part) 830 1,038 512 526 208 25.1 2,091052 Mountdavis 185 197 106 91 12 6.5 2,996053 Moydow 566 557 295 262 -9 -1.6 2,843054 Newtown Forbes 768 847 427 420 79 10.3 2,889055 Rathcline 1,248 1,268 654 614 20 1.6 3,967

Census 2002 Areas70
Table 6 (contd.) Population and area of each Province, County, City, urban area, rural area andElectoral Division, 1996 and 2002
District1996 2002
Change in population1996-2002 Area*
(hectares)
Persons Persons Males Females Actual Percentage
Louth County 92,166 101,821 50,489 51,332 9,655 10.5 83,199
Drogheda Borough 24,460 28,333 13,818 14,515 3,873 15.8 2,323
001 Fair Gate 10,454 10,852 5,281 5,571 398 3.8 151002 St. Laurence Gate 3,423 3,566 1,707 1,859 143 4.2 259003 West Gate 5,868 6,412 3,175 3,237 544 9.3 235041 St. Peter’s (part) 1,756 2,765 1,368 1,397 1,009 57.5 813047 St. Mary’s (part)* 2,959 4,738 2,287 2,451 1,779 60.1 865
Dundalk Town 25,762 27,385 13,250 14,135 1,623 6.3 2,468
004 Dundalk Urban No. 1 2,383 2,490 1,205 1,285 107 4.5 115005 Dundalk Urban No. 2 1,114 1,064 554 510 -50 -4.5 125006 Dundalk Urban No. 3 1,473 1,430 690 740 -43 -2.9 118007 Dundalk Urban No. 4 5,613 6,527 3,210 3,317 914 16.3 162023 Castletown (part) 1,390 1,552 721 831 162 11.7 225027 Dundalk Rural (part) 13,664 14,206 6,812 7,394 542 4.0 1,660030 Haggardstown (part) 125 116 58 58 -9 -7.2 63
Ardee No. 1 rural area 15,145 16,055 8,189 7,866 910 6.0 27,212
008 Ardee Rural 2,390 2,500 1,276 1,224 110 4.6 6,289009 Ardee Urban 3,440 3,564 1,740 1,824 124 3.6 476010 Castlebellingham 1,391 1,338 662 676 -53 -3.8 1,898011 Clonkeen 402 438 235 203 36 9.0 2,229012 Collon 1,029 1,188 626 562 159 15.5 2,812013 Dromin 429 461 237 224 32 7.5 1,549014 Dromiskin 1,561 1,956 968 988 395 25.3 2,167015 Drumcar 1,404 1,372 802 570 -32 -2.3 2,744016 Dunleer 1,677 1,787 898 889 110 6.6 2,507017 Stabannan 535 526 263 263 -9 -1.7 2,222018 Tallanstown 887 925 482 443 38 4.3 2,319
Dundalk rural area 19,104 20,533 10,397 10,136 1,429 7.5 35,478
019 Ballymascanlan 1,927 2,088 1,026 1,062 161 8.4 2,506020 Barronstown 547 621 318 303 74 13.5 1,765021 Carlingford 1,282 1,334 638 696 52 4.1 1,673022 Castlering 745 847 442 405 102 13.7 1,810023 Castletown (part) 1,305 1,409 730 679 104 8.0 1,918024 Creggan Upper 638 641 333 308 3 0.5 1,901025 Darver 458 518 261 257 60 13.1 2,131026 Drummullagh 815 903 482 421 88 10.8 2,428027 Dundalk Rural (part) 524 509 255 254 -15 -2.9 600028 Faughart 872 843 438 405 -29 -3.3 1,848029 Greenore 905 898 456 442 -7 -0.8 1,497030 Haggardstown (part) 4,222 4,778 2,358 2,420 556 13.2 2,081031 Jenkinstown 870 831 425 406 -39 -4.5 2,233032 Killanny 563 593 327 266 30 5.3 2,077033 Louth 1,010 1,196 628 568 186 18.4 2,216034 Mansfieldstown 424 454 239 215 30 7.1 1,650035 Rathcor 1,105 1,163 584 579 58 5.2 2,581036 Ravensdale 892 907 457 450 15 1.7 2,563
Louth rural area 7,695 9,515 4,835 4,680 1,820 23.7 15,718
037 Clogher 1,548 1,814 899 915 266 17.2 2,544038 Dysart 548 649 322 327 101 18.4 2,422039 Monasterboice 1,017 1,130 589 541 113 11.1 2,360040 Mullary 1,014 1,248 648 600 234 23.1 2,423041 St. Peter’s (part) 1,809 2,641 1,354 1,287 832 46.0 3,077042 Termonfeckin 1,759 2,033 1,023 1,010 274 15.6 2,892
* NOTE: The remainder of St. Mary’s is in Co. Meath.

Census 2002 Areas71
Table 6 (contd.) Population and area of each Province, County, City, urban area, rural area andElectoral Division, 1996 and 2002
District1996 2002
Change in population1996-2002 Area*
(hectares)Persons Persons Males Females Actual Percentage
Meath County 109,732 134,005 67,733 66,272 24,273 22.1 233,454
Ceannanus Mór (Kells) Town 2,152 2,522 1,227 1,295 370 17.2 111
001 Ceannanus Mór (Kells) Urban 1,970 2,362 1,148 1,214 392 19.9 107026 Ceannanus Mór (Kells) Rural (part) 182 160 79 81 -22 -12.1 4
Navan Town 3,447 3,406 1,668 1,738 -41 -1.2 199
002 Navan Urban 2,747 2,802 1,357 1,445 55 2.0 187055 Navan Rural (part) 700 604 311 293 -96 -13.7 12
Trim Town 1,740 1,447 729 718 -293 -16.8 70
003 Trim Urban 1,447 1,204 600 604 -243 -16.8 67092 Trim Rural (part) 293 243 129 114 -50 -17.1 3
Ardee No. 2 rural area 2,918 2,920 1,493 1,427 2 0.1 12,274
004 Drumcondra 1,310 1,310 668 642 – – 4,643005 Grangegeeth 457 465 229 236 8 1.8 2,632006 Killary 1,151 1,145 596 549 -6 -0.5 4,999
Dunshaughlin rural area 28,135 35,238 17,822 17,416 7,103 25.2 43,206
007 Culmullin 1,069 1,049 523 526 -20 -1.9 3,662008 Donaghmore 6,290 7,249 3,698 3,551 959 15.2 3,522009 Dunboyne 5,471 7,757 3,837 3,920 2,286 41.8 5,722010 Dunshaughlin 4,162 4,927 2,508 2,419 765 18.4 4,316011 Kilbrew 1,259 1,762 925 837 503 40.0 3,329012 Killeen 1,085 1,070 545 525 -15 -1.4 2,919013 Kilmessan 1,063 1,081 549 532 18 1.7 2,552014 Kilmore 1,347 1,329 682 647 -18 -1.3 3,767015 Rathfeigh 853 921 455 466 68 8.0 2,843016 Ratoath 3,064 5,581 2,814 2,767 2,517 82.1 3,787017 Rodanstown 1,116 1,112 567 545 -4 -0.4 2,964018 Skreen 1,356 1,400 719 681 44 3.2 3,823
Kells rural area 11,341 12,483 6,466 6,017 1,142 10.1 41,738
019 Ardagh 684 661 359 302 -23 -3.4 2,291020 Ballinlough 132 159 90 69 27 20.5 1,065021 Balrathboyne 433 406 218 188 -27 -6.2 1,556022 Boherboy 275 301 146 155 26 9.5 1,092023 Burry 192 217 110 107 25 13.0 1,493024 Carrickleck 497 497 272 225 – – 1,806025 Castlekeeran 304 343 172 171 39 12.8 1,615026 Ceannanus Mór (Kells) Rural (part) 2,019 2,640 1,320 1,320 621 30.8 2,015027 Cruicetown 273 312 167 145 39 14.3 2,075028 Girley 319 332 173 159 13 4.1 2,048029 Kilmainham 565 676 339 337 111 19.6 2,506030 Kilskeer 313 335 160 175 22 7.0 1,567031 Loughan 393 387 204 183 -6 -1.5 1,615032 Maperath 474 512 275 237 38 8.0 1,375033 Martry 616 652 334 318 36 5.8 1,672034 Moybolgue 175 199 101 98 24 13.7 1,121035 Moynalty 595 607 313 294 12 2.0 2,198036 Newcastle 378 384 208 176 6 1.6 1,777037 Newtown 336 380 206 174 44 13.1 1,369038 Nobber 619 619 321 298 – – 2,223039 Posseckstown 150 174 88 86 24 16.0 1,353040 Staholmog 358 394 195 199 36 10.1 1,700041 Teltown 883 929 487 442 46 5.2 2,520042 Trohanny 358 367 208 159 9 2.5 1,686

Census 2002 Areas72
Table 6 (contd.) Population and area of each Province, County, City, urban area, rural area andElectoral Division, 1996 and 2002
District1996 2002
Change in population1996-2002 Area*
(hectares)
Persons Persons Males Females Actual Percentage
Meath County (contd.)
Meath rural area 14,296 19,039 9,616 9,423 4,743 33.2 22,302
043 Ardcath 1,945 1,907 1,021 886 -38 -2.0 4,342044 Duleek 2,434 2,941 1,469 1,472 507 20.8 4,034045 Julianstown 3,999 5,806 2,848 2,958 1,807 45.2 4,979046 Mellifont 488 599 339 260 111 22.7 2,463047 St. Mary’s (part)* 3,529 5,457 2,715 2,742 1,928 54.6 2,953048 Stamullin 1,901 2,329 1,224 1,105 428 22.5 3,531
Navan rural area 22,972 29,958 15,095 14,863 6,986 30.4 38,066
049 Ardbraccan 1,764 1,823 962 861 59 3.3 3,866050 Ardmulchan 836 894 477 417 58 6.9 2,419051 Bective 812 866 441 425 54 6.7 2,029052 Castletown 869 902 465 437 33 3.8 3,460053 Donaghpatrick 1,338 1,481 770 711 143 10.7 4,252054 Kentstown 1,220 1,284 656 628 64 5.2 3,065055 Navan Rural (part) 11,732 18,020 8,903 9,117 6,288 53.6 5,911056 Painestown 1,005 1,083 539 544 78 7.8 3,293057 Rathkenny 496 537 286 251 41 8.3 2,226058 Slane 1,186 1,336 697 639 150 12.6 2,377059 Stackallan 546 586 292 294 40 7.3 2,126060 Tara 1,168 1,146 607 539 -22 -1.9 3,042
Oldcastle rural area 3,720 3,817 2,006 1,811 97 2.6 18,296
061 Crossakeel 324 307 148 159 -17 -5.2 2,017062 Crosskeys 273 261 145 116 -12 -4.4 1,619063 Killallon 225 230 122 108 5 2.2 2,535064 Killeagh 327 344 183 161 17 5.2 3,168065 Knocklough 175 180 98 82 5 2.9 1,669066 Moylagh 416 413 224 189 -3 -0.7 2,371067 Oldcastle 1,771 1,858 976 882 87 4.9 3,272068 Stonefield 209 224 110 114 15 7.2 1,645
Trim rural area 19,011 23,175 11,611 11,564 4,164 21.9 57,192
069 Ardnamullan 559 700 359 341 141 25.2 2,404070 Athboy 1,492 1,855 881 974 363 24.3 2,000071 Ballyboggan 448 489 234 255 41 9.2 2,817072 Ballyconnell 680 726 380 346 46 6.8 2,529073 Castlejordan 379 423 225 198 44 11.6 1,555074 Castlerickard 647 972 475 497 325 50.2 2,001075 Cloghbrack 373 371 200 171 -2 -0.5 2,461076 Clonmacduff 369 439 215 224 70 19.0 1,375077 Gallow 788 822 440 382 34 4.3 2,474078 Galtrim 610 616 317 299 6 1.0 2,095079 Grennanstown 883 909 454 455 26 2.9 2,492080 Hill of Down 438 461 236 225 23 5.3 2,072081 Innfield 1,465 1,992 978 1,014 527 36.0 3,423082 Kilbride 331 353 175 178 22 6.6 1,603083 Kilcooly 291 277 147 130 -14 -4.8 1,654084 Kildalky 581 597 311 286 16 2.8 2,616085 Killaconnigan 786 1,200 595 605 414 52.7 2,628086 Killyon 420 502 256 246 82 19.5 2,988087 Laracor 456 506 260 246 50 11.0 2,152088 Rahinstown 453 504 273 231 51 11.3 1,777089 Rathmolyon 1,115 1,104 554 550 -11 -1.0 3,940090 Rathmore 722 797 415 382 75 10.4 2,794091 Summerhill 950 1,118 557 561 168 17.7 1,766092 Trim Rural (part) 3,775 5,442 2,674 2,768 1,667 44.2 3,576
* NOTE: The remainder of St. Mary’s is in Co. Louth.

Census 2002 Areas73
Table 6 (contd.) Population and area of each Province, County, City, urban area, rural area andElectoral Division, 1996 and 2002
District1996 2002 Change in population
1996-2002 Area*(hectares)
Persons Persons Males Females Actual Percentage
Offaly County 59,117 63,663 32,185 31,478 4,546 7.7 198,981
Birr Town 3,355 3,590 1,729 1,861 235 7.0 641
001 Birr Urban 3,355 3,590 1,729 1,861 235 7.0 641
Tullamore Town 9,221 10,270 4,908 5,362 1,049 11.4 785
002 Tullamore Urban 9,221 10,270 4,908 5,362 1,049 11.4 785
Birr No. 1 rural area 15,309 15,445 7,866 7,579 136 0.9 72,558
003 Ballycumber 680 702 368 334 22 3.2 2,249004 Banagher 1,719 1,789 876 913 70 4.1 1,986005 Birr Rural 1,089 1,096 549 547 7 0.6 1,986006 Broughal 139 135 64 71 -4 -2.9 1,811007 Cloghan 824 856 436 420 32 3.9 2,808008 Clonmacnoise 325 316 166 150 -9 -2.8 1,935009 Derrinboy 225 257 139 118 32 14.2 2,098010 Derryad 249 258 127 131 9 3.6 2,972011 Doon 418 405 218 187 -13 -3.1 3,125012 Dromoyle 263 294 155 139 31 11.8 2,221013 Drumcullen 324 278 144 134 -46 -14.2 2,560014 Eglish 222 160 92 68 -62 -27.9 1,953015 Ferbane 1,190 1,122 550 572 -68 -5.7 2,398016 Gallen 640 627 317 310 -13 -2.0 2,953017 Hinds 278 281 139 142 3 1.1 1,922018 Huntston 342 372 198 174 30 8.8 2,043019 Kilcolman 363 382 203 179 19 5.2 2,458020 Kilcormac 1,298 1,296 648 648 -2 -0.2 2,161021 Killyon 234 249 134 115 15 6.4 2,244022 Kinnitty 530 503 264 239 -27 -5.1 3,377023 Knockbarron 142 157 79 78 15 10.6 1,446024 Lea 322 322 161 161 – – 3,236025 Letter 125 137 72 65 12 9.6 2,388026 Lumcloon 377 395 204 191 18 4.8 1,964027 Lusmagh 458 459 234 225 1 0.2 2,758028 Mounterin 196 198 95 103 2 1.0 2,436029 Moyclare 533 547 271 276 14 2.6 2,366030 Seirkieran 428 459 241 218 31 7.2 2,089031 Shannonbridge 387 353 193 160 -34 -8.8 2,386032 Shannonharbour 291 329 171 158 38 13.1 2,016033 Srah 698 711 358 353 13 1.9 2,213
Edenderry No. 1 rural area 8,605 10,120 5,176 4,944 1,515 17.6 32,844
034 Ballaghassaan 43 34 17 17 -9 -20.9 1,413035 Ballyburly 861 1,148 573 575 287 33.3 2,432036 Ballymacwilliam 411 468 246 222 57 13.9 2,016037 Bracknagh 782 848 455 393 66 8.4 4,882038 Clonbulloge 566 650 336 314 84 14.8 4,476039 Clonmore 296 345 168 177 49 16.6 1,711040 Croghan 419 458 243 215 39 9.3 3,332041 Edenderry Rural 582 730 384 346 148 25.4 3,612042 Edenderry Urban 3,591 4,216 2,133 2,083 625 17.4 793043 Esker 345 350 178 172 5 1.4 2,811044 Knockdrin 113 141 76 65 28 24.8 2,540045 Monasteroris 596 732 367 365 136 22.8 2,826
Roscrea No. 2 rural area 4,508 4,470 2,432 2,038 -38 -0.8 26,729
046 Aghancon 375 363 192 171 -12 -3.2 2,474047 Ballincor 106 138 71 67 32 30.2 1,072048 Barna 191 175 91 84 -16 -8.4 1,481049 Cangort 147 160 88 72 13 8.8 1,369050 Cullenwaine 626 649 330 319 23 3.7 2,408051 Dunkerrin 386 364 181 183 -22 -5.7 2,229052 Ettagh 415 419 220 199 4 1.0 2,425053 Gorteen 286 285 151 134 -1 -0.3 2,479054 Mountheaton 784 724 504 220 -60 -7.7 2,449055 Roscomroe 152 145 70 75 -7 -4.6 1,843056 Shinrone 781 797 395 402 16 2.0 2,136057 Templeharry 159 152 83 69 -7 -4.4 1,992058 Tulla 100 99 56 43 -1 -1.0 2,372

Census 2002 Areas74
Table 6 (contd.) Population and area of each Province, County, City, urban area, rural area andElectoral Division, 1996 and 2002
District1996 2002 Change in population
1996-2002 Area*(hectares)
Persons Persons Males Females Actual Percentage
Offaly County (contd.)
Tullamore rural area 18,119 19,768 10,074 9,694 1,649 9.1 65,424
059 Ballycommon 400 463 254 209 63 15.8 2,685060 Ballyshear 274 303 155 148 29 10.6 2,239061 Bawn 301 320 159 161 19 6.3 1,819062 Cappancur 1,163 1,254 629 625 91 7.8 4,977063 Clara 3,140 3,226 1,627 1,599 86 2.7 3,010064 Clonygowan 366 393 216 177 27 7.4 1,958065 Daingean 1,048 1,168 586 582 120 11.5 1,889066 Derrycooley 239 239 128 111 – – 2,043067 Durrow 566 661 325 336 95 16.8 2,084068 Geashill 1,020 1,212 578 634 192 18.8 3,559069 Gorteen 222 272 139 133 50 22.5 1,446070 Hammerlane 443 534 282 252 91 20.5 2,372071 Kilclonfert 296 301 165 136 5 1.7 2,811072 Kilcumreragh 413 456 231 225 43 10.4 2,058073 Killeigh 1,119 1,144 595 549 25 2.2 3,989074 Killooly 203 236 130 106 33 16.3 2,214075 Killoughy 493 570 300 270 77 15.6 2,673076 Mountbriscoe 169 198 110 88 29 17.2 1,703077 O’Dempsey 110 112 58 54 2 1.8 1,295078 Portarlington North 1,487 1,635 808 827 148 10.0 2,099079 Rahan 681 737 370 367 56 8.2 2,386080 Raheenakeeran 349 370 205 165 21 6.0 1,609081 Rathfeston 235 259 130 129 24 10.2 2,067082 Rathrobin 392 399 202 197 7 1.8 2,354083 Screggan 938 1,102 549 553 164 17.5 1,719084 Silverbrook 527 591 303 288 64 12.1 2,292085 Tinamuck 206 197 111 86 -9 -4.4 1,368086 Tinnycross 350 420 214 206 70 20.0 828087 Tullamore Rural 969 996 515 481 27 2.8 1,878
Westmeath County 63,314 71,858 35,960 35,898 8,544 13.5 182,486
Athlone Town 7,691 7,354 3,554 3,800 -337 -4.4 527
001 Athlone East Urban 4,517 4,092 1,974 2,118 -425 -9.4 261002 Athlone West Urban 3,174 3,262 1,580 1,682 88 2.8 266
Athlone No. 1 rural area 14,671 16,205 8,125 8,080 1,534 10.5 28,866
003 Athlone East Rural 5,728 6,433 3,121 3,312 705 12.3 1,202004 Auburn 486 534 272 262 48 9.9 2,007005 Ballybroder 205 250 123 127 45 22.0 1,189006 Bellanalack 358 431 217 214 73 20.4 1,408007 Carn 580 706 361 345 126 21.7 2,122008 Castledaly 607 658 338 320 51 8.4 3,069009 Glassan 745 816 417 399 71 9.5 1,531010 Kilcumreragh 361 396 217 179 35 9.7 1,634011 Killinure 324 337 191 146 13 4.0 2,071012 Moate 1,849 1,941 948 993 92 5.0 2,134013 Mount Temple 438 507 264 243 69 15.8 1,721014 Moydrum 1,986 2,136 1,096 1,040 150 7.6 2,793015 Muckanagh 153 158 87 71 5 3.3 1,079016 Tubbrit 569 635 348 287 66 11.6 2,837017 Umma 282 267 125 142 -15 -5.3 2,069
Ballymore rural area 1,935 2,061 1,088 973 126 6.5 12,365
018 Ardnagragh 384 400 210 190 16 4.2 1,572019 Ballymore 413 458 240 218 45 10.9 2,084020 Doonis 192 199 100 99 7 3.6 1,545021 Drumraney 191 232 121 111 41 21.5 1,299022 Noughaval 289 323 171 152 34 11.8 1,621023 Piercetown 114 98 54 44 -16 -14.0 1,353024 Templepatrick 234 222 120 102 -12 -5.1 1,515025 Winetown 118 129 72 57 11 9.3 1,376
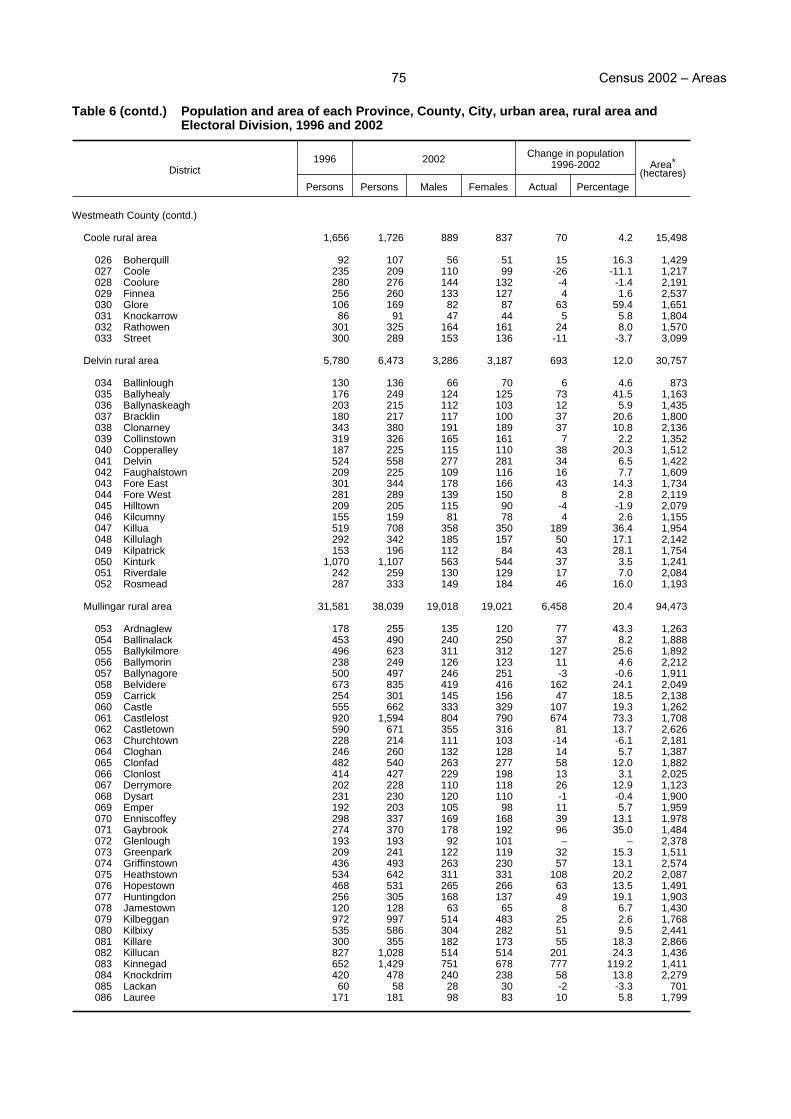
Census 2002 Areas75
Table 6 (contd.) Population and area of each Province, County, City, urban area, rural area andElectoral Division, 1996 and 2002
District1996 2002 Change in population
1996-2002 Area*(hectares)
Persons Persons Males Females Actual Percentage
Westmeath County (contd.)
Coole rural area 1,656 1,726 889 837 70 4.2 15,498
026 Boherquill 92 107 56 51 15 16.3 1,429027 Coole 235 209 110 99 -26 -11.1 1,217028 Coolure 280 276 144 132 -4 -1.4 2,191029 Finnea 256 260 133 127 4 1.6 2,537030 Glore 106 169 82 87 63 59.4 1,651031 Knockarrow 86 91 47 44 5 5.8 1,804032 Rathowen 301 325 164 161 24 8.0 1,570033 Street 300 289 153 136 -11 -3.7 3,099
Delvin rural area 5,780 6,473 3,286 3,187 693 12.0 30,757
034 Ballinlough 130 136 66 70 6 4.6 873035 Ballyhealy 176 249 124 125 73 41.5 1,163036 Ballynaskeagh 203 215 112 103 12 5.9 1,435037 Bracklin 180 217 117 100 37 20.6 1,800038 Clonarney 343 380 191 189 37 10.8 2,136039 Collinstown 319 326 165 161 7 2.2 1,352040 Copperalley 187 225 115 110 38 20.3 1,512041 Delvin 524 558 277 281 34 6.5 1,422042 Faughalstown 209 225 109 116 16 7.7 1,609043 Fore East 301 344 178 166 43 14.3 1,734044 Fore West 281 289 139 150 8 2.8 2,119045 Hilltown 209 205 115 90 -4 -1.9 2,079046 Kilcumny 155 159 81 78 4 2.6 1,155047 Killua 519 708 358 350 189 36.4 1,954048 Killulagh 292 342 185 157 50 17.1 2,142049 Kilpatrick 153 196 112 84 43 28.1 1,754050 Kinturk 1,070 1,107 563 544 37 3.5 1,241051 Riverdale 242 259 130 129 17 7.0 2,084052 Rosmead 287 333 149 184 46 16.0 1,193
Mullingar rural area 31,581 38,039 19,018 19,021 6,458 20.4 94,473
053 Ardnaglew 178 255 135 120 77 43.3 1,263054 Ballinalack 453 490 240 250 37 8.2 1,888055 Ballykilmore 496 623 311 312 127 25.6 1,892056 Ballymorin 238 249 126 123 11 4.6 2,212057 Ballynagore 500 497 246 251 -3 -0.6 1,911058 Belvidere 673 835 419 416 162 24.1 2,049059 Carrick 254 301 145 156 47 18.5 2,138060 Castle 555 662 333 329 107 19.3 1,262061 Castlelost 920 1,594 804 790 674 73.3 1,708062 Castletown 590 671 355 316 81 13.7 2,626063 Churchtown 228 214 111 103 -14 -6.1 2,181064 Cloghan 246 260 132 128 14 5.7 1,387065 Clonfad 482 540 263 277 58 12.0 1,882066 Clonlost 414 427 229 198 13 3.1 2,025067 Derrymore 202 228 110 118 26 12.9 1,123068 Dysart 231 230 120 110 -1 -0.4 1,900069 Emper 192 203 105 98 11 5.7 1,959070 Enniscoffey 298 337 169 168 39 13.1 1,978071 Gaybrook 274 370 178 192 96 35.0 1,484072 Glenlough 193 193 92 101 – – 2,378073 Greenpark 209 241 122 119 32 15.3 1,511074 Griffinstown 436 493 263 230 57 13.1 2,574075 Heathstown 534 642 311 331 108 20.2 2,087076 Hopestown 468 531 265 266 63 13.5 1,491077 Huntingdon 256 305 168 137 49 19.1 1,903078 Jamestown 120 128 63 65 8 6.7 1,430079 Kilbeggan 972 997 514 483 25 2.6 1,768080 Kilbixy 535 586 304 282 51 9.5 2,441081 Killare 300 355 182 173 55 18.3 2,866082 Killucan 827 1,028 514 514 201 24.3 1,436083 Kinnegad 652 1,429 751 678 777 119.2 1,411084 Knockdrim 420 478 240 238 58 13.8 2,279085 Lackan 60 58 28 30 -2 -3.3 701086 Lauree 171 181 98 83 10 5.8 1,799
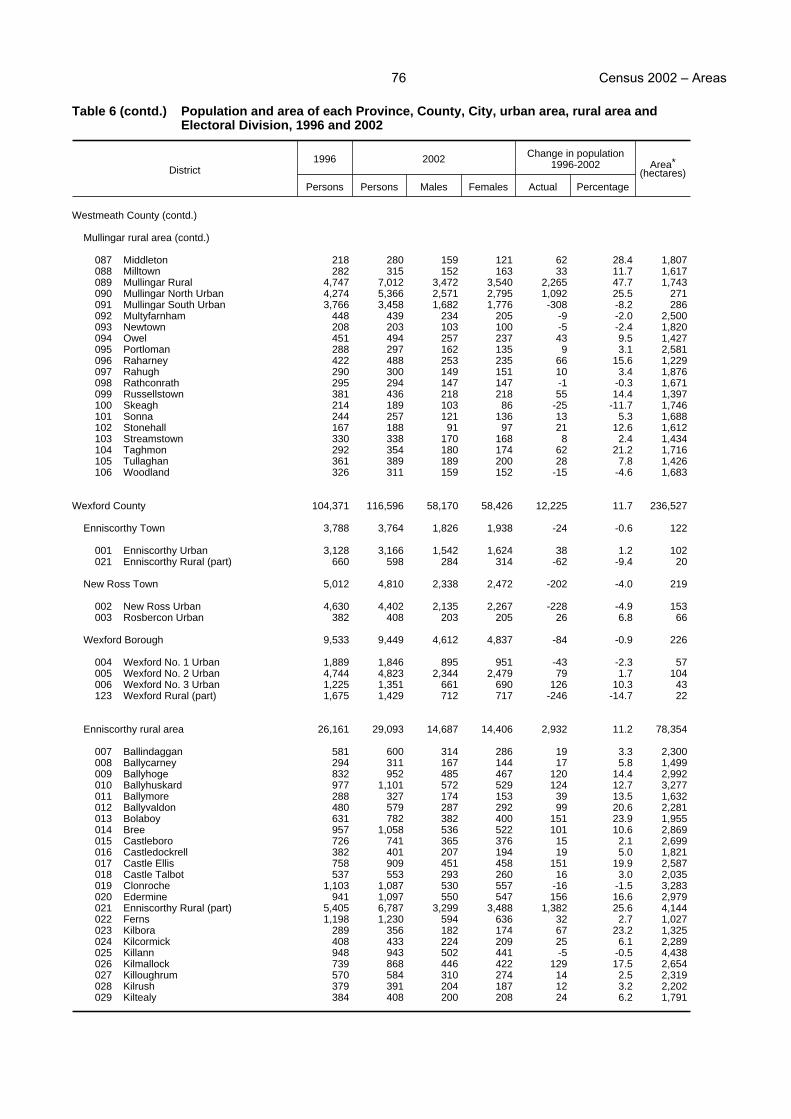
Census 2002 Areas76
Table 6 (contd.) Population and area of each Province, County, City, urban area, rural area andElectoral Division, 1996 and 2002
District1996 2002 Change in population
1996-2002 Area*(hectares)
Persons Persons Males Females Actual Percentage
Westmeath County (contd.)
Mullingar rural area (contd.)
087 Middleton 218 280 159 121 62 28.4 1,807088 Milltown 282 315 152 163 33 11.7 1,617089 Mullingar Rural 4,747 7,012 3,472 3,540 2,265 47.7 1,743090 Mullingar North Urban 4,274 5,366 2,571 2,795 1,092 25.5 271091 Mullingar South Urban 3,766 3,458 1,682 1,776 -308 -8.2 286092 Multyfarnham 448 439 234 205 -9 -2.0 2,500093 Newtown 208 203 103 100 -5 -2.4 1,820094 Owel 451 494 257 237 43 9.5 1,427095 Portloman 288 297 162 135 9 3.1 2,581096 Raharney 422 488 253 235 66 15.6 1,229097 Rahugh 290 300 149 151 10 3.4 1,876098 Rathconrath 295 294 147 147 -1 -0.3 1,671099 Russellstown 381 436 218 218 55 14.4 1,397100 Skeagh 214 189 103 86 -25 -11.7 1,746101 Sonna 244 257 121 136 13 5.3 1,688102 Stonehall 167 188 91 97 21 12.6 1,612103 Streamstown 330 338 170 168 8 2.4 1,434104 Taghmon 292 354 180 174 62 21.2 1,716105 Tullaghan 361 389 189 200 28 7.8 1,426106 Woodland 326 311 159 152 -15 -4.6 1,683
Wexford County 104,371 116,596 58,170 58,426 12,225 11.7 236,527
Enniscorthy Town 3,788 3,764 1,826 1,938 -24 -0.6 122
001 Enniscorthy Urban 3,128 3,166 1,542 1,624 38 1.2 102021 Enniscorthy Rural (part) 660 598 284 314 -62 -9.4 20
New Ross Town 5,012 4,810 2,338 2,472 -202 -4.0 219
002 New Ross Urban 4,630 4,402 2,135 2,267 -228 -4.9 153003 Rosbercon Urban 382 408 203 205 26 6.8 66
Wexford Borough 9,533 9,449 4,612 4,837 -84 -0.9 226
004 Wexford No. 1 Urban 1,889 1,846 895 951 -43 -2.3 57005 Wexford No. 2 Urban 4,744 4,823 2,344 2,479 79 1.7 104006 Wexford No. 3 Urban 1,225 1,351 661 690 126 10.3 43123 Wexford Rural (part) 1,675 1,429 712 717 -246 -14.7 22
Enniscorthy rural area 26,161 29,093 14,687 14,406 2,932 11.2 78,354
007 Ballindaggan 581 600 314 286 19 3.3 2,300008 Ballycarney 294 311 167 144 17 5.8 1,499009 Ballyhoge 832 952 485 467 120 14.4 2,992010 Ballyhuskard 977 1,101 572 529 124 12.7 3,277011 Ballymore 288 327 174 153 39 13.5 1,632012 Ballyvaldon 480 579 287 292 99 20.6 2,281013 Bolaboy 631 782 382 400 151 23.9 1,955014 Bree 957 1,058 536 522 101 10.6 2,869015 Castleboro 726 741 365 376 15 2.1 2,699016 Castledockrell 382 401 207 194 19 5.0 1,821017 Castle Ellis 758 909 451 458 151 19.9 2,587018 Castle Talbot 537 553 293 260 16 3.0 2,035019 Clonroche 1,103 1,087 530 557 -16 -1.5 3,283020 Edermine 941 1,097 550 547 156 16.6 2,979021 Enniscorthy Rural (part) 5,405 6,787 3,299 3,488 1,382 25.6 4,144022 Ferns 1,198 1,230 594 636 32 2.7 1,027023 Kilbora 289 356 182 174 67 23.2 1,325024 Kilcormick 408 433 224 209 25 6.1 2,289025 Killann 948 943 502 441 -5 -0.5 4,438026 Kilmallock 739 868 446 422 129 17.5 2,654027 Killoughrum 570 584 310 274 14 2.5 2,319028 Kilrush 379 391 204 187 12 3.2 2,202029 Kiltealy 384 408 200 208 24 6.2 1,791

Census 2002 Areas77
Table 6 (contd.) Population and area of each Province, County, City, urban area, rural area andElectoral Division, 1996 and 2002
District1996 2002 Change in population
1996-2002 Area*(hectares)
Persons Persons Males Females Actual Percentage
Wexford County (contd.)
Enniscorthy rural area (contd.)
030 Marshalstown 935 976 511 465 41 4.4 2,503031 Moyacomb 330 357 185 172 27 8.2 2,263032 Newtownbarry 1,812 1,878 945 933 66 3.6 2,431033 Rossard 372 356 195 161 -16 -4.3 3,059034 St. Mary’s 489 467 257 210 -22 -4.5 2,488035 The Harrow 431 432 216 216 1 0.2 1,531036 The Leap 767 821 431 390 54 7.0 2,549037 Tinnacross 678 757 383 374 79 11.7 2,568038 Tombrack 540 551 290 261 11 2.0 2,564
Gorey rural area 16,490 20,463 10,295 10,168 3,973 24.1 52,692
039 Ardamine 916 1,227 593 634 311 34.0 2,540040 Balloughter 388 418 217 201 30 7.7 2,225041 Ballybeg 340 381 194 187 41 12.1 2,406042 Ballycanew 675 795 405 390 120 17.8 1,838043 Ballyellis 240 294 162 132 54 22.5 1,268044 Ballygarrett 551 684 336 348 133 24.1 2,046045 Ballylarkin 522 596 306 290 74 14.2 1,769046 Ballynestragh 646 822 431 391 176 27.2 2,183047 Cahore 258 327 159 168 69 26.7 1,829048 Coolgreany 814 944 462 482 130 16.0 2,536049 Courtown 1,533 2,026 1,021 1,005 493 32.2 3,317050 Ford 357 405 198 207 48 13.4 1,509051 Gorey Rural 2,361 2,819 1,398 1,421 458 19.4 3,009052 Gorey Urban 2,150 3,090 1,553 1,537 940 43.7 170053 Huntingtown 172 202 115 87 30 17.4 1,201054 Kilcomb 635 764 365 399 129 20.3 2,509055 Kilgorman 425 517 256 261 92 21.6 1,719056 Killenagh 349 390 199 191 41 11.7 1,617057 Killincooly 300 416 205 211 116 38.7 985058 Kilnahue 241 286 150 136 45 18.7 1,589059 Limerick 478 514 271 243 36 7.5 2,110060 Monamolin 435 459 231 228 24 5.5 1,914061 Monaseed 408 481 246 235 73 17.9 2,261062 Rossminoge 319 453 234 219 134 42.0 1,641063 Wells 506 559 285 274 53 10.5 2,505064 Wingfield 471 594 303 291 123 26.1 3,996
New Ross rural area 14,630 15,924 8,102 7,822 1,294 8.8 50,920
065 Adamstown 430 457 247 210 27 6.3 1,393066 Ballyanne 643 681 366 315 38 5.9 2,212067 Ballyhack 1,180 1,258 661 597 78 6.6 2,243068 Barrack Village 92 100 49 51 8 8.7 1,277069 Barronstown 455 465 242 223 10 2.2 1,899070 Carnagh 419 433 217 216 14 3.3 1,737071 Carrickbyrne 530 542 277 265 12 2.3 1,800072 Clongeen 783 834 422 412 51 6.5 2,056073 Clonleigh 355 365 190 175 10 2.8 1,548074 Dunmain 191 202 115 87 11 5.8 1,101075 Fethard 789 862 439 423 73 9.3 1,599076 Horetown 410 471 236 235 61 14.9 2,108077 Inch 339 399 201 198 60 17.7 1,593078 Kilgarvan 280 292 148 144 12 4.3 1,493079 Killesk 531 541 267 274 10 1.9 2,129080 Kilmokea 745 686 348 338 -59 -7.9 1,711081 Newbawn 506 494 250 244 -12 -2.4 2,270082 New Ross Rural 1,408 2,052 980 1,072 644 45.7 1,700083 Oldcourt 510 595 298 297 85 16.7 2,018084 Old Ross 277 343 180 163 66 23.8 1,365085 Rathroe 643 612 315 297 -31 -4.8 2,427086 Rochestown 175 192 93 99 17 9.7 1,083087 Templeludigan 355 321 181 140 -34 -9.6 1,951088 Templetown 464 461 242 219 -3 -0.6 2,135089 Tintern 1,190 1,252 612 640 62 5.2 3,708090 Whitechurch 462 492 249 243 30 6.5 2,233091 Whitemoor 468 522 277 245 54 11.5 2,131

Census 2002 Areas78
Table 6 (contd.) Population and area of each Province, County, City, urban area, rural area andElectoral Division, 1996 and 2002
District1996 2002 Change in population
1996-2002 Area*(hectares)
Persons Persons Males Females Actual Percentage
Wexford County (contd.)
Wexford rural area 28,757 33,093 16,310 16,783 4,336 15.1 53,994
092 Ardcavan 1,565 1,912 952 960 347 22.2 2,217093 Ardcolm 738 765 359 406 27 3.7 2,234094 Artramon 578 543 282 261 -35 -6.1 1,450095 Aughwilliam 364 397 196 201 33 9.1 1,567096 Ballymitty 373 387 197 190 14 3.8 1,752097 Bannow 985 982 494 488 -3 -0.3 2,394098 Bridgetown 537 636 326 310 99 18.4 1,514099 Carrick 1,245 1,360 700 660 115 9.2 1,415100 Drinagh 977 1,149 569 580 172 17.6 1,787101 Duncormick 462 503 256 247 41 8.9 1,492102 Forth 501 725 352 373 224 44.7 1,528103 Glynn 278 354 174 180 76 27.3 1,068104 Harperstown 251 338 164 174 87 34.7 1,435105 Harristown 477 494 244 250 17 3.6 1,581106 Kilbride 228 244 122 122 16 7.0 1,025107 Kilcowan 412 458 229 229 46 11.2 1,465108 Killag 312 347 175 172 35 11.2 1,901109 Killinick 685 788 411 377 103 15.0 1,805110 Killurin 451 530 265 265 79 17.5 1,396111 Kilmore 1,800 1,913 963 950 113 6.3 2,632112 Kilpatrick 605 677 330 347 72 11.9 1,770113 Kilscoran 546 693 363 330 147 26.9 1,419114 Lady’s Island 527 582 309 273 55 10.4 1,360115 Mayglass 374 436 228 208 62 16.6 1,291116 Newcastle 362 411 222 189 49 13.5 850117 Rathaspick 1,108 1,431 714 717 323 29.2 2,067118 Rosslare 1,386 1,582 724 858 196 14.1 1,899119 St. Helen’s 1,698 1,775 841 934 77 4.5 1,177120 Tacumshin 349 385 196 189 36 10.3 1,723121 Taghmon 1,004 1,038 512 526 34 3.4 1,879122 Tomhaggard 484 561 266 295 77 15.9 1,616123 Wexford Rural (part) 6,747 8,332 3,994 4,338 1,585 23.5 1,306124 Whitechurch 348 365 181 184 17 4.9 1,979
Wicklow County 102,683 114,676 56,800 57,876 11,993 11.7 203,260
Arklow Town 8,519 9,955 4,896 5,059 1,436 16.9 664
001 Arklow No. 1 Urban 6,854 7,793 3,861 3,932 939 13.7 422002 Arklow No. 2 Urban 1,665 2,162 1,035 1,127 497 29.8 242
Bray Town 25,252 26,244 12,532 13,712 992 3.9 1,444
003 Bray No. 1 1,557 1,619 786 833 62 4.0 750004 Bray No. 2 5,870 5,972 2,770 3,202 102 1.7 232005 Bray No. 3 6,954 6,684 3,256 3,428 -270 -3.9 142006 Rathmichael (Bray) 2,516 2,450 1,157 1,293 -66 -2.6 31035 Kilmacanoge (part) 8,355 9,519 4,563 4,956 1,164 13.9 289
Wicklow Town 6,416 7,031 3,457 3,574 615 9.6 320
007 Wicklow Urban 6,416 7,031 3,457 3,574 615 9.6 320
Baltinglass No. 1 rural area 12,749 14,685 7,464 7,221 1,936 15.2 62,714
008 Ballinguile 93 114 61 53 21 22.6 2,554009 Baltinglass 1,694 1,963 967 996 269 15.9 1,957010 Blessington 2,716 3,126 1,544 1,582 410 15.1 6,384011 Burgage 637 1,003 506 497 366 57.5 2,413012 Donaghmore 324 356 175 181 32 9.9 1,762013 Donard 380 482 240 242 102 26.8 1,949014 Dunlavin 1,169 1,323 669 654 154 13.2 1,786015 Eadestown 134 154 84 70 20 14.9 1,689016 Hartstown 226 270 132 138 44 19.5 1,456017 Hollywood 524 639 340 299 115 21.9 2,989018 Humewood 268 286 144 142 18 6.7 1,718019 Imael North 217 207 108 99 -10 -4.6 4,871020 Imael South 223 242 119 123 19 8.5 2,259021 Kilbride 853 952 483 469 99 11.6 4,713

Census 2002 Areas79
Table 6 (contd.) Population and area of each Province, County, City, urban area, rural area andElectoral Division, 1996 and 2002
District1996 2002 Change in population
1996-2002 Area*(hectares)
Persons Persons Males Females Actual Percentage
Wicklow County (contd.)
Baltinglass No. 1 rural area (contd.)
022 Lackan 678 744 387 357 66 9.7 7,171023 Lugglass 127 150 75 75 23 18.1 3,782024 Rathdangan 373 389 229 160 16 4.3 2,443025 Rathsallagh 252 265 140 125 13 5.2 1,504026 Stratford 324 350 185 165 26 8.0 934027 Talbotstown 326 349 189 160 23 7.1 1,459028 The Grange 373 392 200 192 19 5.1 1,784029 Tober 365 419 205 214 54 14.8 1,953030 Togher 299 309 169 140 10 3.3 2,025031 Tuckmill 174 201 113 88 27 15.5 1,159
Rathdown No. 2 rural area 16,395 18,948 9,175 9,773 2,553 15.6 13,245
032 Delgany 4,350 4,489 2,213 2,276 139 3.2 1,225033 Enniskerry 2,118 2,801 1,343 1,458 683 32.2 3,250034 Greystones 6,886 7,315 3,535 3,780 429 6.2 378035 Kilmacanoge (part) 2,301 3,582 1,720 1,862 1,281 55.7 2,564036 Powerscourt 740 761 364 397 21 2.8 5,828
Rathdrum rural area 26,932 31,098 15,796 15,302 4,166 15.5 91,253
037 Altidore 275 298 156 142 23 8.4 1,930038 Arklow Rural 952 1,080 560 520 128 13.4 6,375039 Aughrim 999 1,177 588 589 178 17.8 2,683040 Avoca 745 773 385 388 28 3.8 1,470041 Ballinaclash 430 517 272 245 87 20.2 1,969042 Ballinacor 193 230 116 114 37 19.2 5,208043 Ballinderry 280 378 201 177 98 35.0 2,120044 Ballyarthur 538 606 314 292 68 12.6 1,879045 Ballycullen 204 249 132 117 45 22.1 1,395046 Brockagh 587 785 398 387 198 33.7 7,642047 Calary 246 262 128 134 16 6.5 3,414048 Cronebane 423 444 225 219 21 5.0 1,357049 Dunganstown East 583 640 312 328 57 9.8 2,550050 Dunganstown South 515 622 313 309 107 20.8 2,351051 Dunganstown West 324 430 217 213 106 32.7 2,531052 Ennereilly 311 368 199 169 57 18.3 1,976053 Glendalough 235 280 147 133 45 19.1 6,189054 Glenealy 2,287 2,453 1,178 1,275 166 7.3 3,985055 Kilbride 771 772 424 348 1 0.1 2,480056 Kilcoole 3,806 4,066 2,033 2,033 260 6.8 2,394057 Killiskey 720 873 439 434 153 21.2 2,384058 Knockrath 187 206 108 98 19 10.2 7,094059 Moneystown 243 261 130 131 18 7.4 1,396060 Newcastle Lower 1,636 1,806 930 876 170 10.4 2,511061 Newcastle Upper 3,108 3,261 1,682 1,579 153 4.9 2,726062 Oldtown 429 511 265 246 82 19.1 1,945063 Rathdrum 1,860 2,123 1,083 1,040 263 14.1 3,731064 Togher 706 788 412 376 82 11.6 2,137065 Trooperstown 200 249 141 108 49 24.5 2,022066 Wicklow Rural 3,139 4,590 2,308 2,282 1,451 46.2 3,409
Shillelagh rural area 6,420 6,715 3,480 3,235 295 4.6 33,620
067 Aghowle 211 212 110 102 1 0.5 1,656068 Ballingate 373 397 197 200 24 6.4 2,142069 Ballinglen 221 228 112 116 7 3.2 1,763070 Ballybeg 174 171 94 77 -3 -1.7 1,845071 Carnew 1,382 1,407 730 677 25 1.8 2,388072 Coolattin 238 266 139 127 28 11.8 1,566073 Coolballintaggart 384 398 218 180 14 3.6 4,069074 Coolboy 384 422 227 195 38 9.9 1,653075 Cronelea 187 187 101 86 – – 1,378076 Kilballyowen 239 253 130 123 14 5.9 1,759077 Killinure 322 346 177 169 24 7.5 1,721078 Kilpipe 307 339 178 161 32 10.4 2,954079 Money 113 121 62 59 8 7.1 1,480080 Rath 257 274 151 123 17 6.6 1,617081 Shillelagh 468 467 238 229 -1 -0.2 1,576082 Tinahely 1,160 1,227 616 611 67 5.8 4,053

Census 2002 Areas80
Table 6 (contd.) Population and area of each Province, County, City, urban area, rural area andElectoral Division, 1996 and 2002
District1996 2002 Change in population
1996-2002 Area*(hectares)
Persons Persons Males Females Actual Percentage
Munster 1,033,903 1,100,614 550,118 550,496 66,711 6.5 2,460,752
Clare County 94,006 103,277 52,063 51,214 9,271 9.9 344,232
Ennis Town 15,333 18,830 9,018 9,812 3,497 22.8 1,710
001 Ennis No. 1 Urban 2,134 2,017 948 1,069 -117 -5.5 70002 Ennis No. 2 Urban 2,066 2,339 1,151 1,188 273 13.2 45003 Ennis No. 3 Urban 345 497 210 287 152 44.1 29004 Ennis No. 4 Urban 1,518 1,488 688 800 -30 -2.0 50026 Clareabbey (part) – – – – – – 64029 Doora (part) 143 133 69 64 -10 -7.0 41032 Ennis Rural (part) 9,076 12,305 5,928 6,377 3,229 35.6 1,367042 Spancelhill (part) 51 51 24 27 – – 44
Kilrush Town 2,594 2,699 1,330 1,369 105 4.0 555
005 Kilrush Urban 2,594 2,699 1,330 1,369 105 4.0 555
Ballyvaghan rural area 2,649 2,622 1,255 1,367 -27 -1.0 28,996
006 Abbey 368 385 204 181 17 4.6 2,515007 Carran 98 82 37 45 -16 -16.3 3,559008 Castletown 72 77 38 39 5 6.9 2,518009 Derreen 116 124 58 66 8 6.9 1,890010 Drumcreehy 428 448 209 239 20 4.7 2,104011 Gleninagh 130 145 76 69 15 11.5 2,866012 Lisdoonvarna 980 917 413 504 -63 -6.4 1,297013 Mountelva 123 96 44 52 -27 -22.0 2,848014 Noughaval 117 112 60 52 -5 -4.3 2,607015 Oughtmama 137 135 66 69 -2 -1.5 3,865016 Rathborney 80 101 50 51 21 26.2 2,927
Corrofin rural area 3,098 3,102 1,630 1,472 4 0.1 24,840
017 Ballyeighter 48 46 24 22 -2 -4.2 936018 Boston 290 284 152 132 -6 -2.1 4,819019 Corrofin 919 982 513 469 63 6.9 3,418020 Glenroe 118 117 57 60 -1 -0.8 2,875021 Killinaboy 346 353 188 165 7 2.0 3,129022 Kiltoraght 189 181 96 85 -8 -4.2 1,917023 Muckanagh 288 267 140 127 -21 -7.3 3,292024 Rath 248 245 132 113 -3 -1.2 1,571025 Ruan 652 627 328 299 -25 -3.8 2,883
Ennis rural area 23,561 26,043 13,247 12,796 2,482 10.5 48,699
026 Clareabbey (part) 2,283 2,510 1,237 1,273 227 9.9 2,896027 Clenagh 8,533 9,056 4,662 4,394 523 6.1 5,823028 Crusheen 412 520 265 255 108 26.2 2,889029 Doora (part) 1,034 1,210 625 585 176 17.0 3,112030 Drumline 748 789 388 401 41 5.5 1,891031 Dysert 308 291 154 137 -17 -5.5 1,720032 Ennis Rural (part) 1,231 1,718 862 856 487 39.6 1,562033 Furroor 262 262 141 121 – – 3,737034 Kilcloher 611 677 359 318 66 10.8 2,530035 Killanniv 507 584 308 276 77 15.2 2,660036 Killone 409 492 255 237 83 20.3 1,597037 Kilnamona 628 699 358 341 71 11.3 2,634038 Kilraghtis 311 352 177 175 41 13.2 1,431039 Kinturk 302 278 140 138 -24 -7.9 1,884040 Newmarket 1,940 2,114 1,075 1,039 174 9.0 1,905041 Sixmilebridge 1,525 1,754 881 873 229 15.0 1,578042 Spancelhill (part) 431 494 267 227 63 14.6 1,790043 Templemaley 838 949 481 468 111 13.2 2,179044 Tomfinlough 479 518 276 242 39 8.1 2,193045 Urlan 769 776 336 440 7 0.9 2,688

Census 2002 Areas81
Table 6 (contd.) Population and area of each Province, County, City, urban area, rural area andElectoral Division, 1996 and 2002
District1996 2002 Change in population
1996-2002 Area*(hectares)
Persons Persons Males Females Actual Percentage
Clare County (contd.)
Ennistimon rural area 8,849 9,482 4,830 4,652 633 7.2 39,961
046 Annagh 522 528 283 245 6 1.1 2,814047 Ballagh 189 174 101 73 -15 -7.9 1,481048 Ballyea 547 617 309 308 70 12.8 3,071049 Ballysteen 320 330 179 151 10 3.1 1,750050 Ballyvaskin 250 275 138 137 25 10.0 2,082051 Cloghaun 158 202 94 108 44 27.8 1,688052 Cloonanaha 293 318 159 159 25 8.5 2,578053 Clooney 211 218 123 95 7 3.3 1,654054 Ennistimon 1,934 2,056 1,028 1,028 122 6.3 2,227055 Formoyle 192 175 94 81 -17 -8.9 2,397056 Kilfenora 372 361 191 170 -11 -3.0 2,499057 Killaspuglonane 218 259 122 137 41 18.8 1,416058 Killilagh 553 731 364 367 178 32.2 2,459059 Kilshanny 134 138 75 63 4 3.0 850060 Liscannor 314 352 173 179 38 12.1 1,355061 Lurraga 314 203 107 96 -111 -35.4 1,503062 Magherareagh 300 301 159 142 1 0.3 2,432063 Milltown Malbay 1,352 1,517 752 765 165 12.2 1,850064 Moy 542 603 307 296 61 11.3 2,566065 Smithstown 134 124 72 52 -10 -7.5 1,289
Killadysert rural area 4,336 4,193 2,168 2,025 -143 -3.3 33,577
066 Ballynacally 214 231 111 120 17 7.9 2,291067 Clondagad 408 419 212 207 11 2.7 2,641068 Coolmeen 288 250 127 123 -38 -13.2 2,296069 Kilchreest 431 408 214 194 -23 -5.3 4,193070 Kilfiddane 407 388 219 169 -19 -4.7 2,718071 Killadysert 749 773 406 367 24 3.2 6,337072 Killofin 393 323 167 156 -70 -17.8 4,016073 Kilmurry 304 287 142 145 -17 -5.6 1,854074 Liscasey 454 446 222 224 -8 -1.8 2,659075 Lisheen 441 469 250 219 28 6.3 2,483076 Rinealon 247 199 98 101 -48 -19.4 2,089
Kilrush rural area 10,681 10,344 5,437 4,907 -337 -3.2 62,537
077 Cahermurphy 217 210 110 100 -7 -3.2 1,766078 Cloonadrum 415 419 220 199 4 1.0 1,814079 Clooncoorha 343 327 179 148 -16 -4.7 2,191080 Cooraclare 541 512 269 243 -29 -5.4 2,255081 Creegh 448 453 230 223 5 1.1 2,040082 Doonbeg 629 596 313 283 -33 -5.2 2,148083 Drumellihy 428 399 222 177 -29 -6.8 2,619084 Einagh 276 276 144 132 – – 1,723085 Glenmore 401 380 202 178 -21 -5.2 3,312086 Kilballyowen 288 282 157 125 -6 -2.1 2,713087 Kilfearagh 319 294 149 145 -25 -7.8 1,949088 Kilkee 1,331 1,260 628 632 -71 -5.3 524089 Killard 265 260 133 127 -5 -1.9 1,738090 Killimer 482 495 250 245 13 2.7 2,920091 Kilmihil 638 576 318 258 -62 -9.7 2,235092 Kilmurry 747 739 389 350 -8 -1.1 1,739093 Kilrush Rural 526 556 302 254 30 5.7 5,906094 Knock 292 252 143 109 -40 -13.7 2,475095 Knocknaboley 356 320 170 150 -36 -10.1 3,254096 Knocknagore 213 228 114 114 15 7.0 2,082097 Moveen 83 86 47 39 3 3.6 982098 Moyarta 255 240 128 112 -15 -5.9 2,962099 Mullagh 267 239 137 102 -28 -10.5 1,682100 Querrin 177 166 83 83 -11 -6.2 2,443101 Rahona 374 396 201 195 22 5.9 2,466102 St. Martin’s 99 105 49 56 6 6.1 1,837103 Tullig 129 137 76 61 8 6.2 1,580104 Tullycreen 142 141 74 67 -1 -0.7 1,182
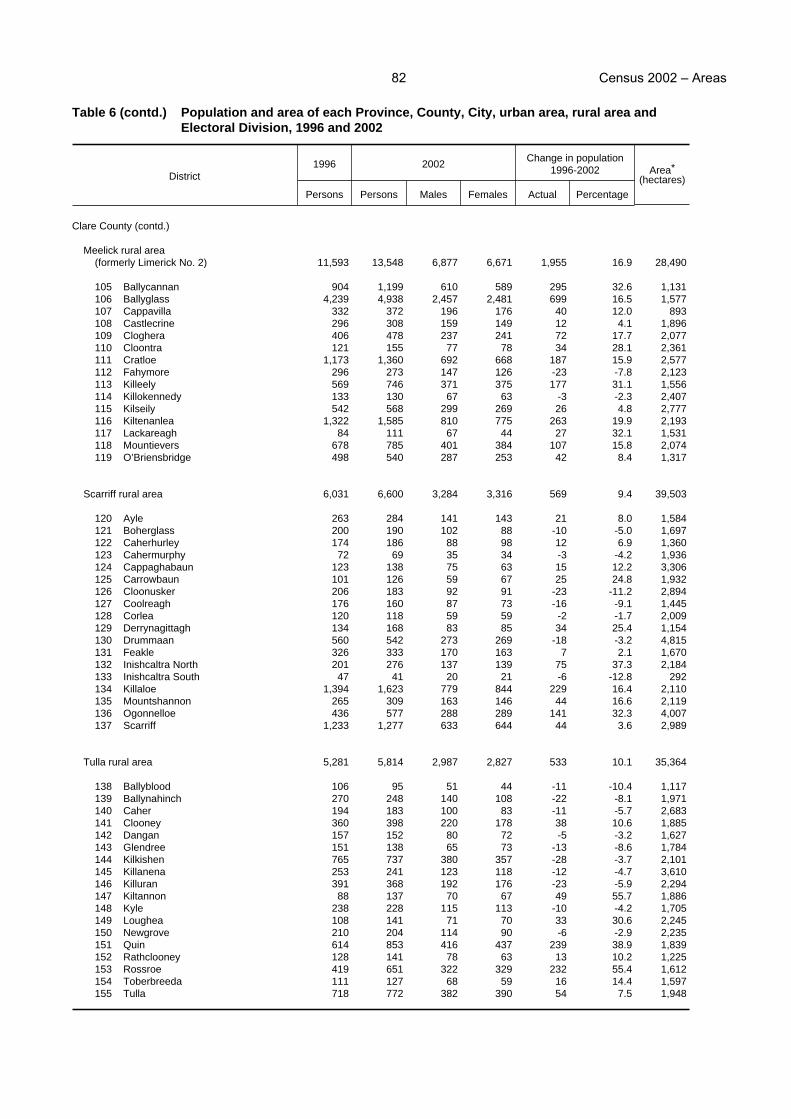
Census 2002 Areas82
Table 6 (contd.) Population and area of each Province, County, City, urban area, rural area andElectoral Division, 1996 and 2002
District1996 2002
Change in population1996-2002 Area*
(hectares)Persons Persons Males Females Actual Percentage
Clare County (contd.)
Meelick rural area(formerly Limerick No. 2) 11,593 13,548 6,877 6,671 1,955 16.9 28,490
105 Ballycannan 904 1,199 610 589 295 32.6 1,131106 Ballyglass 4,239 4,938 2,457 2,481 699 16.5 1,577107 Cappavilla 332 372 196 176 40 12.0 893108 Castlecrine 296 308 159 149 12 4.1 1,896109 Cloghera 406 478 237 241 72 17.7 2,077110 Cloontra 121 155 77 78 34 28.1 2,361111 Cratloe 1,173 1,360 692 668 187 15.9 2,577112 Fahymore 296 273 147 126 -23 -7.8 2,123113 Killeely 569 746 371 375 177 31.1 1,556114 Killokennedy 133 130 67 63 -3 -2.3 2,407115 Kilseily 542 568 299 269 26 4.8 2,777116 Kiltenanlea 1,322 1,585 810 775 263 19.9 2,193117 Lackareagh 84 111 67 44 27 32.1 1,531118 Mountievers 678 785 401 384 107 15.8 2,074119 O’Briensbridge 498 540 287 253 42 8.4 1,317
Scarriff rural area 6,031 6,600 3,284 3,316 569 9.4 39,503
120 Ayle 263 284 141 143 21 8.0 1,584121 Boherglass 200 190 102 88 -10 -5.0 1,697122 Caherhurley 174 186 88 98 12 6.9 1,360123 Cahermurphy 72 69 35 34 -3 -4.2 1,936124 Cappaghabaun 123 138 75 63 15 12.2 3,306125 Carrowbaun 101 126 59 67 25 24.8 1,932126 Cloonusker 206 183 92 91 -23 -11.2 2,894127 Coolreagh 176 160 87 73 -16 -9.1 1,445128 Corlea 120 118 59 59 -2 -1.7 2,009129 Derrynagittagh 134 168 83 85 34 25.4 1,154130 Drummaan 560 542 273 269 -18 -3.2 4,815131 Feakle 326 333 170 163 7 2.1 1,670132 Inishcaltra North 201 276 137 139 75 37.3 2,184133 Inishcaltra South 47 41 20 21 -6 -12.8 292134 Killaloe 1,394 1,623 779 844 229 16.4 2,110135 Mountshannon 265 309 163 146 44 16.6 2,119136 Ogonnelloe 436 577 288 289 141 32.3 4,007137 Scarriff 1,233 1,277 633 644 44 3.6 2,989
Tulla rural area 5,281 5,814 2,987 2,827 533 10.1 35,364
138 Ballyblood 106 95 51 44 -11 -10.4 1,117139 Ballynahinch 270 248 140 108 -22 -8.1 1,971140 Caher 194 183 100 83 -11 -5.7 2,683141 Clooney 360 398 220 178 38 10.6 1,885142 Dangan 157 152 80 72 -5 -3.2 1,627143 Glendree 151 138 65 73 -13 -8.6 1,784144 Kilkishen 765 737 380 357 -28 -3.7 2,101145 Killanena 253 241 123 118 -12 -4.7 3,610146 Killuran 391 368 192 176 -23 -5.9 2,294147 Kiltannon 88 137 70 67 49 55.7 1,886148 Kyle 238 228 115 113 -10 -4.2 1,705149 Loughea 108 141 71 70 33 30.6 2,245150 Newgrove 210 204 114 90 -6 -2.9 2,235151 Quin 614 853 416 437 239 38.9 1,839152 Rathclooney 128 141 78 63 13 10.2 1,225153 Rossroe 419 651 322 329 232 55.4 1,612154 Toberbreeda 111 127 68 59 16 14.4 1,597155 Tulla 718 772 382 390 54 7.5 1,948
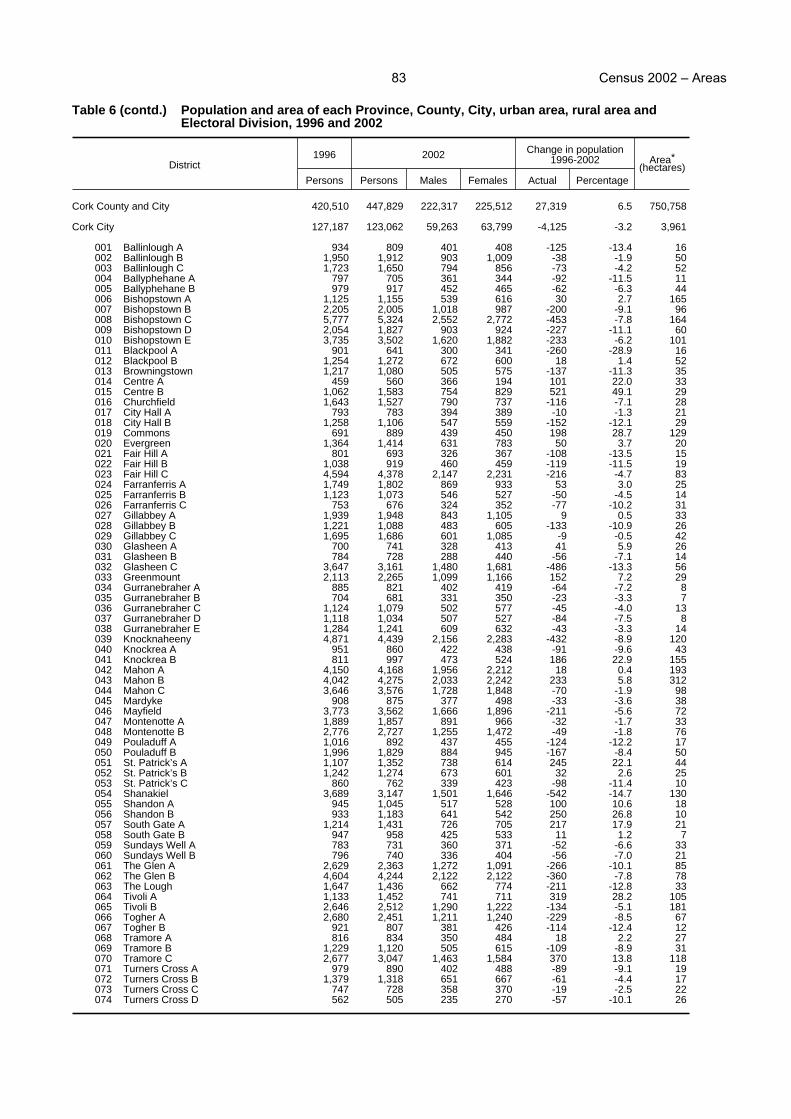
Census 2002 Areas83
Table 6 (contd.) Population and area of each Province, County, City, urban area, rural area andElectoral Division, 1996 and 2002
District1996 2002 Change in population
1996-2002 Area*(hectares)
Persons Persons Males Females Actual Percentage
Cork County and City 420,510 447,829 222,317 225,512 27,319 6.5 750,758
Cork City 127,187 123,062 59,263 63,799 -4,125 -3.2 3,961
001 Ballinlough A 934 809 401 408 -125 -13.4 16002 Ballinlough B 1,950 1,912 903 1,009 -38 -1.9 50003 Ballinlough C 1,723 1,650 794 856 -73 -4.2 52004 Ballyphehane A 797 705 361 344 -92 -11.5 11005 Ballyphehane B 979 917 452 465 -62 -6.3 44006 Bishopstown A 1,125 1,155 539 616 30 2.7 165007 Bishopstown B 2,205 2,005 1,018 987 -200 -9.1 96008 Bishopstown C 5,777 5,324 2,552 2,772 -453 -7.8 164009 Bishopstown D 2,054 1,827 903 924 -227 -11.1 60010 Bishopstown E 3,735 3,502 1,620 1,882 -233 -6.2 101011 Blackpool A 901 641 300 341 -260 -28.9 16012 Blackpool B 1,254 1,272 672 600 18 1.4 52013 Browningstown 1,217 1,080 505 575 -137 -11.3 35014 Centre A 459 560 366 194 101 22.0 33015 Centre B 1,062 1,583 754 829 521 49.1 29016 Churchfield 1,643 1,527 790 737 -116 -7.1 28017 City Hall A 793 783 394 389 -10 -1.3 21018 City Hall B 1,258 1,106 547 559 -152 -12.1 29019 Commons 691 889 439 450 198 28.7 129020 Evergreen 1,364 1,414 631 783 50 3.7 20021 Fair Hill A 801 693 326 367 -108 -13.5 15022 Fair Hill B 1,038 919 460 459 -119 -11.5 19023 Fair Hill C 4,594 4,378 2,147 2,231 -216 -4.7 83024 Farranferris A 1,749 1,802 869 933 53 3.0 25025 Farranferris B 1,123 1,073 546 527 -50 -4.5 14026 Farranferris C 753 676 324 352 -77 -10.2 31027 Gillabbey A 1,939 1,948 843 1,105 9 0.5 33028 Gillabbey B 1,221 1,088 483 605 -133 -10.9 26029 Gillabbey C 1,695 1,686 601 1,085 -9 -0.5 42030 Glasheen A 700 741 328 413 41 5.9 26031 Glasheen B 784 728 288 440 -56 -7.1 14032 Glasheen C 3,647 3,161 1,480 1,681 -486 -13.3 56033 Greenmount 2,113 2,265 1,099 1,166 152 7.2 29034 Gurranebraher A 885 821 402 419 -64 -7.2 8035 Gurranebraher B 704 681 331 350 -23 -3.3 7036 Gurranebraher C 1,124 1,079 502 577 -45 -4.0 13037 Gurranebraher D 1,118 1,034 507 527 -84 -7.5 8038 Gurranebraher E 1,284 1,241 609 632 -43 -3.3 14039 Knocknaheeny 4,871 4,439 2,156 2,283 -432 -8.9 120040 Knockrea A 951 860 422 438 -91 -9.6 43041 Knockrea B 811 997 473 524 186 22.9 155042 Mahon A 4,150 4,168 1,956 2,212 18 0.4 193043 Mahon B 4,042 4,275 2,033 2,242 233 5.8 312044 Mahon C 3,646 3,576 1,728 1,848 -70 -1.9 98045 Mardyke 908 875 377 498 -33 -3.6 38046 Mayfield 3,773 3,562 1,666 1,896 -211 -5.6 72047 Montenotte A 1,889 1,857 891 966 -32 -1.7 33048 Montenotte B 2,776 2,727 1,255 1,472 -49 -1.8 76049 Pouladuff A 1,016 892 437 455 -124 -12.2 17050 Pouladuff B 1,996 1,829 884 945 -167 -8.4 50051 St. Patrick’s A 1,107 1,352 738 614 245 22.1 44052 St. Patrick’s B 1,242 1,274 673 601 32 2.6 25053 St. Patrick’s C 860 762 339 423 -98 -11.4 10054 Shanakiel 3,689 3,147 1,501 1,646 -542 -14.7 130055 Shandon A 945 1,045 517 528 100 10.6 18056 Shandon B 933 1,183 641 542 250 26.8 10057 South Gate A 1,214 1,431 726 705 217 17.9 21058 South Gate B 947 958 425 533 11 1.2 7059 Sundays Well A 783 731 360 371 -52 -6.6 33060 Sundays Well B 796 740 336 404 -56 -7.0 21061 The Glen A 2,629 2,363 1,272 1,091 -266 -10.1 85062 The Glen B 4,604 4,244 2,122 2,122 -360 -7.8 78063 The Lough 1,647 1,436 662 774 -211 -12.8 33064 Tivoli A 1,133 1,452 741 711 319 28.2 105065 Tivoli B 2,646 2,512 1,290 1,222 -134 -5.1 181066 Togher A 2,680 2,451 1,211 1,240 -229 -8.5 67067 Togher B 921 807 381 426 -114 -12.4 12068 Tramore A 816 834 350 484 18 2.2 27069 Tramore B 1,229 1,120 505 615 -109 -8.9 31070 Tramore C 2,677 3,047 1,463 1,584 370 13.8 118071 Turners Cross A 979 890 402 488 -89 -9.1 19072 Turners Cross B 1,379 1,318 651 667 -61 -4.4 17073 Turners Cross C 747 728 358 370 -19 -2.5 22074 Turners Cross D 562 505 235 270 -57 -10.1 26

Census 2002 Areas84
Table 6 (contd.) Population and area of each Province, County, City, urban area, rural area andElectoral Division, 1996 and 2002
District1996 2002
Change in population1996-2002 Area*
(hectares)Persons Persons Males Females Actual Percentage
Cork County 293,323 324,767 163,054 161,713 31,444 10.7 746,797
Clonakilty Town 2,724 3,432 1,627 1,805 708 26.0 461
001 Clonakilty Urban 2,724 3,432 1,627 1,805 708 26.0 461
Cobh Town 6,468 6,767 3,372 3,395 299 4.6 230
002 Cobh Urban 6,468 6,767 3,372 3,395 299 4.6 230
Fermoy Town 2,310 2,270 1,092 1,178 -40 -1.7 132
003 Fermoy Urban 2,310 2,270 1,092 1,178 -40 -1.7 132
Kinsale Town 2,007 2,257 1,137 1,120 250 12.5 111
004 Kinsale Urban 2,007 2,257 1,137 1,120 250 12.5 111
Macroom Town 2,457 2,836 1,377 1,459 379 15.4 1,100
005 Macroom Urban 2,457 2,836 1,377 1,459 379 15.4 1,100
Mallow Town 6,434 7,091 3,394 3,697 657 10.2 649
006 Mallow North Urban 3,311 3,996 1,914 2,082 685 20.7 388007 Mallow South Urban 3,123 3,095 1,480 1,615 -28 -0.9 261
Midleton Town 3,266 3,798 1,821 1,977 532 16.3 162
008 Midleton Urban 3,266 3,798 1,821 1,977 532 16.3 162
Skibbereen Town 1,926 2,000 945 1,055 74 3.8 417
009 Skibbereen Urban 1,926 2,000 945 1,055 74 3.8 417
Youghal Town 5,630 6,203 3,070 3,133 573 10.2 508
010 Youghal Urban 5,630 6,203 3,070 3,133 573 10.2 490325 Youghal Rural (part) – – – – – – 18
Bandon rural area 16,478 17,963 9,143 8,820 1,485 9.0 41,410
011 Ballinadee 349 364 189 175 15 4.3 1,796012 Ballygroman 888 977 497 480 89 10.0 1,814013 Ballymodan 3,468 3,955 1,958 1,997 487 14.0 2,874014 Ballymurphy 654 672 362 310 18 2.8 1,489015 Bandon 1,697 1,578 767 811 -119 -7.0 80016 Baurleigh 223 264 147 117 41 18.4 1,281017 Bengour 244 234 123 111 -10 -4.1 1,656018 Boulteen 409 434 223 211 25 6.1 2,130019 Brinny 549 605 296 309 56 10.2 2,122020 Cashel 274 327 161 166 53 19.3 1,511021 Inishannon 1,177 1,424 729 695 247 21.0 2,004022 Kilbonane 774 885 460 425 111 14.3 1,999023 Kilbrittain 424 513 253 260 89 21.0 1,389024 Kilbrogan 1,368 1,500 748 752 132 9.6 3,577025 Knockavilly 332 367 198 169 35 10.5 1,481026 Knockroe 491 527 275 252 36 7.3 2,015027 Moviddy 1,111 1,107 576 531 -4 -0.4 3,101028 Murragh 341 368 208 160 27 7.9 1,844029 Rathclarin 462 526 276 250 64 13.9 2,262030 Teadies 748 745 380 365 -3 -0.4 1,928031 Templemartin 495 591 317 274 96 19.4 3,057

Census 2002 Areas85
Table 6 (contd.) Population and area of each Province, County, City, urban area, rural area andElectoral Division, 1996 and 2002
District1996 2002 Change in population
1996-2002 Area*(hectares)
Persons Persons Males Females Actual Percentage
Cork County (contd.)
Bantry rural area 8,168 8,684 4,330 4,354 516 6.3 43,427
032 Ahil 238 229 119 110 -9 -3.8 5,663033 Bantry Rural 974 952 472 480 -22 -2.3 3,235034 Bantry Urban 2,936 3,150 1,505 1,645 214 7.3 1,010035 Douce 260 234 126 108 -26 -10.0 3,724036 Durrus East 176 238 128 110 62 35.2 1,684037 Durrus West 495 621 309 312 126 25.5 2,110038 Glanlough 195 202 109 93 7 3.6 1,538039 Glengarriff 786 875 430 445 89 11.3 4,522040 Kealkill 369 400 202 198 31 8.4 3,037041 Kilcaskan 737 755 391 364 18 2.4 6,708042 Mealagh 255 295 153 142 40 15.7 2,904043 Scart 287 330 172 158 43 15.0 2,329044 Seefin 234 212 109 103 -22 -9.4 2,044045 Sheepshead 192 162 89 73 -30 -15.6 2,492046 Whiddy 34 29 16 13 -5 -14.7 427
Castletown rural area 4,173 4,192 2,198 1,994 19 0.5 30,078
047 Adrigole 470 479 263 216 9 1.9 6,259048 Bear 212 207 117 90 -5 -2.4 1,817049 Coulagh 546 519 276 243 -27 -4.9 4,133050 Curryglass 347 345 175 170 -2 -0.6 3,730051 Kilcatherine 739 766 408 358 27 3.7 6,096052 Killaconenagh 1,467 1,478 751 727 11 0.7 4,345053 Kilnamanagh 392 398 208 190 6 1.5 3,698
Clonakilty rural area 9,441 9,959 5,074 4,885 518 5.5 32,734
054 Abbeymahon 560 570 304 266 10 1.8 1,894055 Ardfield 542 609 315 294 67 12.4 1,795056 Argideen 347 320 171 149 -27 -7.8 1,627057 Butlerstown 367 393 196 197 26 7.1 1,745058 Cahermore 356 370 193 177 14 3.9 1,937059 Castleventry 199 221 109 112 22 11.1 1,305060 Clonakilty Rural 1,085 1,163 566 597 78 7.2 2,664061 Coolcraheen 551 559 278 281 8 1.5 1,689062 Courtmacsherry 445 539 270 269 94 21.1 969063 Derry 420 422 221 201 2 0.5 1,736064 Kilkerranmore 473 476 259 217 3 0.6 1,507065 Kilmaloda East 246 267 134 133 21 8.5 1,363066 Kilmaloda West 175 211 112 99 36 20.6 1,174067 Kilmoylerane 214 230 122 108 16 7.5 1,408068 Kilnagross 540 552 287 265 12 2.2 1,599069 Knocks 252 272 139 133 20 7.9 1,284070 Rathbarry 446 445 229 216 -1 -0.2 1,649071 Rosscarbery 801 862 416 446 61 7.6 1,075072 Rossmore 232 258 125 133 26 11.2 1,353073 Templeomalus 662 660 333 327 -2 -0.3 1,780074 Timoleague 528 560 295 265 32 6.1 1,181
Cork rural area 87,665 104,941 52,106 52,835 17,276 19.7 66,719
075 Ballincollig 13,760 15,119 7,430 7,689 1,359 9.9 3,162076 Ballygarvan 1,257 1,335 680 655 78 6.2 1,751077 Ballynaglogh 285 322 161 161 37 13.0 1,597078 Bishopstown (part) 106 113 60 53 7 6.6 139079 Blackpool 673 778 384 394 105 15.6 2,955080 Blarney 3,874 4,917 2,422 2,495 1,043 26.9 2,331081 Caherlag 4,157 5,270 2,640 2,630 1,113 26.8 3,166082 Carrigaline 7,025 9,343 4,615 4,728 2,318 33.0 2,484083 Carrignavar 889 997 518 479 108 12.1 3,303084 Carrigrohane Beg 1,666 1,691 861 830 25 1.5 2,320085 Cobh Rural 3,589 4,614 2,334 2,280 1,025 28.6 3,286086 Douglas 14,543 15,999 7,895 8,104 1,456 10.0 3,043

Census 2002 Areas86
Table 6 (contd.) Population and area of each Province, County, City, urban area, rural area andElectoral Division, 1996 and 2002
District1996 2002 Change in population
1996-2002 Area*(hectares)
Persons Persons Males Females Actual Percentage
Cork County (contd.)
Cork rural area (contd.)
087 Dripsey 1,275 1,323 687 636 48 3.8 2,580088 Dunderrow 1,200 1,323 654 669 123 10.2 2,116089 Firmount 433 489 250 239 56 12.9 2,027090 Glenville 322 339 178 161 17 5.3 2,071091 Greenfort 634 634 339 295 – – 2,031092 Inishkenny 4,184 4,914 2,297 2,617 730 17.4 1,779093 Killeagh 456 526 277 249 70 15.4 2,176094 Knockantota 387 598 302 296 211 54.5 1,735095 Knockraha 564 781 399 382 217 38.5 2,447096 Lehenagh 5,816 8,102 3,996 4,106 2,286 39.3 1,320097 Matehy 2,077 2,593 1,349 1,244 516 24.8 2,770098 Monkstown Rural 663 779 389 390 116 17.5 826099 Monkstown Urban 3,638 4,184 2,074 2,110 546 15.0 406100 Ovens 993 1,047 518 529 54 5.4 1,697101 Rathcooney (part) 5,711 6,593 3,298 3,295 882 15.4 3,134102 Riverstown 2,816 4,285 2,147 2,138 1,469 52.2 2,867103 St. Mary’s (part) 3,027 4,100 2,028 2,072 1,073 35.4 1,914104 Whitechurch 1,645 1,833 924 909 188 11.4 3,286
Dunmanway rural area 7,542 7,671 3,999 3,672 129 1.7 42,055
105 Aultagh 299 306 162 144 7 2.3 2,437106 Ballingurteen 492 501 265 236 9 1.8 2,383107 Ballymoney 743 779 394 385 36 4.8 2,299108 Bealanageary 211 239 126 113 28 13.3 4,258109 Bealock 293 284 152 132 -9 -3.1 2,842110 Carrigboy 401 410 213 197 9 2.2 2,978111 Castletown 373 387 217 170 14 3.8 1,926112 Coolmountain 476 430 236 194 -46 -9.7 3,624113 Drinagh 217 207 114 93 -10 -4.6 1,483114 Dunmanway North 1,236 1,161 583 578 -75 -6.1 2,228115 Dunmanway South 1,062 1,167 581 586 105 9.9 1,942116 Garrown 268 264 153 111 -4 -1.5 3,936117 Kinneigh 399 389 199 190 -10 -2.5 2,315118 Manch 448 477 259 218 29 6.5 2,484119 Milane 187 201 93 108 14 7.5 2,104120 Teerelton 437 469 252 217 32 7.3 2,816
Fermoy rural area 14,329 15,265 7,778 7,487 936 6.5 59,897
121 Aghern 176 198 98 100 22 12.5 1,555122 Ballyhooly 518 531 258 273 13 2.5 2,123123 Ballynoe 472 482 238 244 10 2.1 3,448124 Carrig 100 114 66 48 14 14.0 1,794125 Castlecooke 148 165 90 75 17 11.5 1,450126 Castle Hyde 630 659 340 319 29 4.6 1,993127 Castlelyons 886 918 473 445 32 3.6 2,294128 Castletownroche 790 793 399 394 3 0.4 2,421129 Coole 728 738 382 356 10 1.4 3,180130 Curraglass 340 346 176 170 6 1.8 2,376131 Fermoy Rural 2,764 3,110 1,487 1,623 346 12.5 2,089132 Glanworth East 364 392 207 185 28 7.7 2,186133 Glanworth West 781 811 419 392 30 3.8 1,969134 Gortnaskehy 262 263 142 121 1 0.4 2,114135 Gortroe 524 586 305 281 62 11.8 2,970136 Kilcor 327 338 177 161 11 3.4 2,520137 Kilcummer 233 240 134 106 7 3.0 2,364138 Kildinan 435 452 237 215 17 3.9 4,220139 Killathy 367 374 192 182 7 1.9 2,256140 Kilworth 914 926 474 452 12 1.3 3,387141 Knockmourne 765 840 449 391 75 9.8 3,502142 Leitrim 262 284 150 134 22 8.4 1,720143 Rathcormack 867 966 495 471 99 11.4 2,876144 Watergrasshill 676 739 390 349 63 9.3 3,090
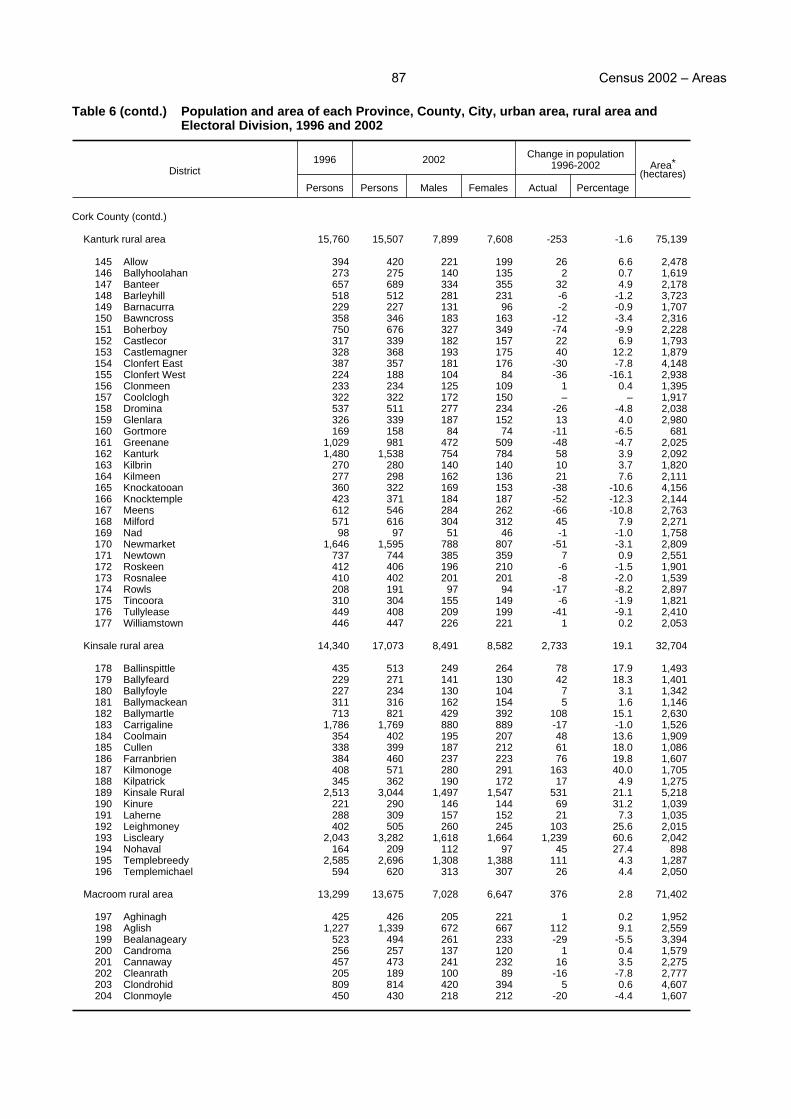
Census 2002 Areas87
Table 6 (contd.) Population and area of each Province, County, City, urban area, rural area andElectoral Division, 1996 and 2002
District1996 2002 Change in population
1996-2002 Area*(hectares)
Persons Persons Males Females Actual Percentage
Cork County (contd.)
Kanturk rural area 15,760 15,507 7,899 7,608 -253 -1.6 75,139
145 Allow 394 420 221 199 26 6.6 2,478146 Ballyhoolahan 273 275 140 135 2 0.7 1,619147 Banteer 657 689 334 355 32 4.9 2,178148 Barleyhill 518 512 281 231 -6 -1.2 3,723149 Barnacurra 229 227 131 96 -2 -0.9 1,707150 Bawncross 358 346 183 163 -12 -3.4 2,316151 Boherboy 750 676 327 349 -74 -9.9 2,228152 Castlecor 317 339 182 157 22 6.9 1,793153 Castlemagner 328 368 193 175 40 12.2 1,879154 Clonfert East 387 357 181 176 -30 -7.8 4,148155 Clonfert West 224 188 104 84 -36 -16.1 2,938156 Clonmeen 233 234 125 109 1 0.4 1,395157 Coolclogh 322 322 172 150 – – 1,917158 Dromina 537 511 277 234 -26 -4.8 2,038159 Glenlara 326 339 187 152 13 4.0 2,980160 Gortmore 169 158 84 74 -11 -6.5 681161 Greenane 1,029 981 472 509 -48 -4.7 2,025162 Kanturk 1,480 1,538 754 784 58 3.9 2,092163 Kilbrin 270 280 140 140 10 3.7 1,820164 Kilmeen 277 298 162 136 21 7.6 2,111165 Knockatooan 360 322 169 153 -38 -10.6 4,156166 Knocktemple 423 371 184 187 -52 -12.3 2,144167 Meens 612 546 284 262 -66 -10.8 2,763168 Milford 571 616 304 312 45 7.9 2,271169 Nad 98 97 51 46 -1 -1.0 1,758170 Newmarket 1,646 1,595 788 807 -51 -3.1 2,809171 Newtown 737 744 385 359 7 0.9 2,551172 Roskeen 412 406 196 210 -6 -1.5 1,901173 Rosnalee 410 402 201 201 -8 -2.0 1,539174 Rowls 208 191 97 94 -17 -8.2 2,897175 Tincoora 310 304 155 149 -6 -1.9 1,821176 Tullylease 449 408 209 199 -41 -9.1 2,410177 Williamstown 446 447 226 221 1 0.2 2,053
Kinsale rural area 14,340 17,073 8,491 8,582 2,733 19.1 32,704
178 Ballinspittle 435 513 249 264 78 17.9 1,493179 Ballyfeard 229 271 141 130 42 18.3 1,401180 Ballyfoyle 227 234 130 104 7 3.1 1,342181 Ballymackean 311 316 162 154 5 1.6 1,146182 Ballymartle 713 821 429 392 108 15.1 2,630183 Carrigaline 1,786 1,769 880 889 -17 -1.0 1,526184 Coolmain 354 402 195 207 48 13.6 1,909185 Cullen 338 399 187 212 61 18.0 1,086186 Farranbrien 384 460 237 223 76 19.8 1,607187 Kilmonoge 408 571 280 291 163 40.0 1,705188 Kilpatrick 345 362 190 172 17 4.9 1,275189 Kinsale Rural 2,513 3,044 1,497 1,547 531 21.1 5,218190 Kinure 221 290 146 144 69 31.2 1,039191 Laherne 288 309 157 152 21 7.3 1,035192 Leighmoney 402 505 260 245 103 25.6 2,015193 Liscleary 2,043 3,282 1,618 1,664 1,239 60.6 2,042194 Nohaval 164 209 112 97 45 27.4 898195 Templebreedy 2,585 2,696 1,308 1,388 111 4.3 1,287196 Templemichael 594 620 313 307 26 4.4 2,050
Macroom rural area 13,299 13,675 7,028 6,647 376 2.8 71,402
197 Aghinagh 425 426 205 221 1 0.2 1,952198 Aglish 1,227 1,339 672 667 112 9.1 2,559199 Bealanageary 523 494 261 233 -29 -5.5 3,394200 Candroma 256 257 137 120 1 0.4 1,579201 Cannaway 457 473 241 232 16 3.5 2,275202 Cleanrath 205 189 100 89 -16 -7.8 2,777203 Clondrohid 809 814 420 394 5 0.6 4,607204 Clonmoyle 450 430 218 212 -20 -4.4 1,607

Census 2002 Areas88
Table 6 (contd.) Population and area of each Province, County, City, urban area, rural area andElectoral Division, 1996 and 2002
District1996 2002 Change in population
1996-2002 Area*(hectares)
Persons Persons Males Females Actual Percentage
Cork County (contd.)
Macroom rural area (contd.)
205 Derryfineen 243 217 123 94 -26 -10.7 1,876206 Gortnatubbrid 438 426 222 204 -12 -2.7 4,036207 Gowlane 807 905 473 432 98 12.1 3,555208 Greenville 191 196 94 102 5 2.6 1,713209 Inchigeelagh 512 507 265 242 -5 -1.0 2,561210 Kilberrihert 455 494 257 237 39 8.6 5,148211 Kilcullen 675 660 346 314 -15 -2.2 3,447212 Kilnamartery 558 614 333 281 56 10.0 2,750213 Macloneigh 739 780 401 379 41 5.5 3,068214 Magourney 948 994 483 511 46 4.9 2,147215 Mashanaglass 387 432 223 209 45 11.6 1,581216 Mountrivers 527 548 288 260 21 4.0 3,553217 Rahalisk 441 430 244 186 -11 -2.5 4,697218 Slievereagh 747 760 390 370 13 1.7 4,730219 Ullanes 564 537 257 280 -27 -4.8 3,143220 Warrenscourt 715 753 375 378 38 5.3 2,647
Mallow rural area 18,971 19,654 9,897 9,757 683 3.6 67,786
221 Ardskeagh 351 390 201 189 39 11.1 1,944222 Ballyclogh 579 579 291 288 – – 2,620223 Ballynamona 698 778 393 385 80 11.5 4,101224 Buttevant 1,696 1,665 821 844 -31 -1.8 3,459225 Caherduggan 463 444 219 225 -19 -4.1 1,610226 Carrig 254 249 125 124 -5 -2.0 1,238227 Churchtown 650 682 341 341 32 4.9 3,979228 Clenor 303 313 169 144 10 3.3 2,039229 Doneraile 1,296 1,380 687 693 84 6.5 2,465230 Dromore 1,555 1,611 781 830 56 3.6 5,400231 Imphrick 266 269 134 135 3 1.1 2,396232 Kilmaclenine 645 629 323 306 -16 -2.5 2,398233 Kilshannig 803 838 448 390 35 4.4 5,761234 Liscarroll 568 555 269 286 -13 -2.3 1,901235 Mallow Rural 2,223 2,698 1,356 1,342 475 21.4 3,289236 Milltown 356 355 198 157 -1 -0.3 1,945237 Monanimy 617 632 310 322 15 2.4 3,574238 Rahan 782 762 404 358 -20 -2.6 3,887239 Rathluirc 3,023 3,021 1,496 1,525 -2 -0.1 1,879240 Shanballymore 538 487 261 226 -51 -9.5 2,199241 Skahanagh 128 141 76 65 13 10.2 2,357242 Springfort 551 541 276 265 -10 -1.8 2,079243 Streamhill 163 125 61 64 -38 -23.3 1,835244 Templemary 275 301 158 143 26 9.5 1,829245 Wallstown 188 209 99 110 21 11.2 1,602
Midleton rural area 18,558 21,133 10,674 10,459 2,575 13.9 44,664
246 Ballintemple 438 441 245 196 3 0.7 2,013247 Ballycottin 1,259 1,293 630 663 34 2.7 1,784248 Ballyspillane 244 283 143 140 39 16.0 1,331249 Carrigtohill 3,115 3,507 1,719 1,788 392 12.6 4,802250 Castlemartyr 845 873 466 407 28 3.3 2,326251 Clonmult 158 158 84 74 – – 1,349252 Cloyne 2,120 2,512 1,299 1,213 392 18.5 3,076253 Corkbeg 1,693 1,845 931 914 152 9.0 1,840254 Dangan 132 160 78 82 28 21.2 1,273255 Dungourney 428 479 253 226 51 11.9 2,350256 Garryvoe 527 536 264 272 9 1.7 1,548257 Ightermurragh 1,014 1,323 671 652 309 30.5 2,979258 Inch 342 382 221 161 40 11.7 2,224259 Lisgoold 581 609 302 307 28 4.8 2,875260 Midleton Rural 3,706 4,675 2,320 2,355 969 26.1 3,822261 Mogeely 343 362 189 173 19 5.5 1,779262 Rostellan 795 798 394 404 3 0.4 1,704263 Templebodan 384 399 217 182 15 3.9 2,985264 Templenacarriga 434 498 248 250 64 14.7 2,604

Census 2002 Areas89
Table 6 (contd.) Population and area of each Province, County, City, urban area, rural area andElectoral Division, 1996 and 2002
District1996 2002 Change in population
1996-2002 Area*(hectares)
Persons Persons Males Females Actual Percentage
Cork County (contd.)
Millstreet rural area 6,191 6,235 3,236 2,999 44 0.7 30,328
265 Caherbarnagh 591 565 298 267 -26 -4.4 4,796266 Coomlogane 956 927 485 442 -29 -3.0 4,861267 Crinnaloo 216 209 112 97 -7 -3.2 2,062268 Cullen 427 434 224 210 7 1.6 1,741269 Derragh 212 205 111 94 -7 -3.3 1,201270 Doonasleen 353 387 217 170 34 9.6 1,896271 Drishane 1,274 1,423 727 696 149 11.7 3,182272 Keale 329 307 164 143 -22 -6.7 1,991273 Kilcorney 305 290 148 142 -15 -4.9 2,141274 Knocknagree 668 635 327 308 -33 -4.9 2,620275 Rathcool 406 418 201 217 12 3.0 1,788276 Skagh 454 435 222 213 -19 -4.2 2,049
Mitchelstown No. 1 rural area 7,239 7,489 3,807 3,682 250 3.5 19,589
277 Ballyarthur 248 250 137 113 2 0.8 1,404278 Derryvillane 468 472 258 214 4 0.9 2,338279 Farahy 320 332 163 169 12 3.8 1,762280 Kildorrery 475 473 225 248 -2 -0.4 1,796281 Kilgullane 127 132 73 59 5 3.9 953282 Kilphelan 507 549 279 270 42 8.3 2,104283 Marshalstown 363 360 192 168 -3 -0.8 1,302284 Mitchelstown 4,400 4,621 2,316 2,305 221 5.0 6,145285 Templemolaga 331 300 164 136 -31 -9.4 1,785
Skibbereen rural area 10,506 10,856 5,554 5,302 350 3.3 46,980
286 Aghadown North 226 287 148 139 61 27.0 1,334287 Aghadown South 596 597 297 300 1 0.2 2,193288 Bredagh 600 613 306 307 13 2.2 1,783289 Caheragh 305 289 155 134 -16 -5.2 2,442290 Cape Clear 319 346 182 164 27 8.5 1,834291 Carrigbaun 375 369 200 169 -6 -1.6 2,056292 Castlehaven North 707 720 357 363 13 1.8 2,656293 Castlehaven South 359 396 211 185 37 10.3 1,891294 Cloghdonnell 372 364 193 171 -8 -2.2 2,320295 Cloonkeen 360 349 189 160 -11 -3.1 1,879296 Drinagh 338 323 163 160 -15 -4.4 1,778297 Dromdaleague North 240 235 123 112 -5 -2.1 2,464298 Dromdaleague South 450 494 240 254 44 9.8 2,032299 Garranes 365 371 196 175 6 1.6 2,129300 Gortnascreeny 411 418 232 186 7 1.7 2,765301 Kilfaughnabeg 514 520 251 269 6 1.2 1,198302 Killeenleagh 335 348 186 162 13 3.9 1,722303 Knockskagh 540 510 264 246 -30 -5.6 2,002304 Myross 639 643 327 316 4 0.6 1,486305 Shreelane 339 316 164 152 -23 -6.8 1,931306 Skibbereen Rural 1,144 1,146 562 584 2 0.2 3,365307 Tullagh 576 798 400 398 222 38.5 1,814308 Woodfort 396 404 208 196 8 2.0 1,906
Skull rural area 3,844 4,009 2,044 1,965 165 4.3 23,345
309 Ballybane 203 233 129 104 30 14.8 2,633310 Ballydehob 736 778 396 382 42 5.7 2,835311 Coolagh 182 187 86 101 5 2.7 1,603312 Crookhaven 222 250 126 124 28 12.6 2,455313 Dunbeacon 204 213 106 107 9 4.4 2,510314 Dunmanus 202 197 101 96 -5 -2.5 2,411315 Goleen 248 260 139 121 12 4.8 1,781316 Kilcoe 378 403 213 190 25 6.6 2,615317 Lowertown 219 206 105 101 -13 -5.9 1,227318 Skull 1,072 1,068 526 542 -4 -0.4 1,703319 Toormore 178 214 117 97 36 20.2 1,572
Youghal No. 1 rural area 3,597 3,807 1,961 1,846 210 5.8 14,770
320 Ardagh 455 461 227 234 6 1.3 3,187321 Clonpriest 766 799 421 378 33 4.3 2,938322 Kilcronat 118 114 60 54 -4 -3.4 2,077323 Killeagh 865 893 458 435 28 3.2 2,359324 Kilmacdonogh 662 739 394 345 77 11.6 2,490325 Youghal Rural (part) 731 801 401 400 70 9.6 1,719

Census 2002 Areas90
Table 6 (contd.) Population and area of each Province, County, City, urban area, rural area andElectoral Division, 1996 and 2002
District1996 2002
Change in population1996-2002 Area*
(hectares)Persons Persons Males Females Actual Percentage
Kerry County 126,130 132,527 66,572 65,955 6,397 5.1 473,465
Killarney Town 8,809 12,087 5,781 6,306 3,278 37.2 1,534
001 Killarney Urban 8,689 9,395 4,506 4,889 706 8.1 1,170082 Killarney Rural (part) 120 2,661 1,256 1,405 2,541 2117.5 357090 Muckross (part) – 31 19 12 31 – 7
Listowel Town 3,393 3,589 1,699 1,890 196 5.8 649
002 Listowel Urban 3,393 3,589 1,699 1,890 196 5.8 649
Tralee Town 19,056 20,375 9,686 10,689 1,319 6.9 1,219
003 Tralee Urban 6,085 6,311 3,066 3,245 226 3.7 400165 Tralee Rural (part) 12,971 14,064 6,620 7,444 1,093 8.4 819
Cahersiveen rural area 8,731 8,828 4,569 4,259 97 1.1 81,726
004 Bahaghs 228 208 109 99 -20 -8.8 3,913005 Ballinskelligs 407 358 180 178 -49 -12.0 3,061006 Ballybrack 114 119 55 64 5 4.4 3,205007 Caher 1,962 2,043 1,030 1,013 81 4.1 4,419008 Caherdaniel 385 335 168 167 -50 -13.0 2,146009 Canuig 164 149 81 68 -15 -9.1 3,298010 Castlequin 520 528 268 260 8 1.5 5,548011 Cloon 76 73 36 37 -3 -3.9 3,049012 Curraghbeg 181 187 98 89 6 3.3 3,560013 Darrynane 225 210 111 99 -15 -6.7 2,879014 Derriana 232 209 111 98 -23 -9.9 9,592015 Emlagh 809 830 432 398 21 2.6 3,686016 Glanbehy 935 1,054 527 527 119 12.7 6,207017 Killinane 290 271 144 127 -19 -6.6 5,162018 Lickeen 106 105 58 47 -1 -0.9 3,494019 Loughcurrane 331 315 150 165 -16 -4.8 2,873020 Mastergeehy 101 83 47 36 -18 -17.8 3,048021 Maum 175 257 139 118 82 46.9 4,126022 Portmagee 339 363 202 161 24 7.1 1,677023 St. Finan’s 165 137 80 57 -28 -17.0 1,481024 Teeranearagh 310 304 167 137 -6 -1.9 2,670025 Valencia 676 690 376 314 14 2.1 2,632
Dingle rural area 8,547 9,228 4,683 4,545 681 8.0 51,326
026 Ballinvoher 392 421 224 197 29 7.4 2,465027 Ballyduff 131 137 69 68 6 4.6 3,300028 Ballynacourty 212 219 124 95 7 3.3 2,229029 Brandon 139 133 75 58 -6 -4.3 2,336030 Castlegregory 805 870 458 412 65 8.1 2,527031 Cloghane 252 268 142 126 16 6.3 3,521032 Deelis 321 299 154 145 -22 -6.9 3,350033 Dingle 1,396 1,647 782 865 251 18.0 206034 Dunquin 174 212 109 103 38 21.8 1,903035 Dunurlin 396 422 218 204 26 6.6 1,952036 Glin 1,294 1,471 695 776 177 13.7 6,238037 Inch 172 171 82 89 -1 -0.6 2,083038 Kilmalkedar 555 549 290 259 -6 -1.1 2,009039 Kilquane 447 453 239 214 6 1.3 3,993040 Kinard 396 366 210 156 -30 -7.6 2,884041 Lack 295 274 142 132 -21 -7.1 2,301042 Marhin 203 243 122 121 40 19.7 1,415043 Minard 390 383 192 191 -7 -1.8 2,474044 Stradbally 191 230 123 107 39 20.4 1,863045 Ventry 386 460 233 227 74 19.2 2,277

Census 2002 Areas91
Table 6 (contd.) Population and area of each Province, County, City, urban area, rural area andElectoral Division, 1996 and 2002
District1996 2002
Change in population1996-2002 Area*
(hectares)Persons Persons Males Females Actual Percentage
Kerry County (contd.)
Kenmare rural area 6,425 7,198 3,675 3,523 773 12.0 80,300
046 Ardea 211 219 121 98 8 3.8 3,416047 Banawn 225 206 105 101 -19 -8.4 6,628048 Cappagh 259 312 166 146 53 20.5 4,054049 Castlecove 308 311 173 138 3 1.0 6,612050 Dawros 458 500 251 249 42 9.2 5,191051 Dromore 201 228 122 106 27 13.4 2,097052 Glanlee 214 204 93 111 -10 -4.7 6,184053 Glanlough 133 142 71 71 9 6.8 4,204054 Glanmore 284 264 135 129 -20 -7.0 7,349055 Greenane 234 255 126 129 21 9.0 3,190056 Kenmare 2,035 2,672 1,314 1,358 637 31.3 5,444057 Kilgarvan 547 599 315 284 52 9.5 6,774058 Loughbrin 182 187 94 93 5 2.7 6,248059 Reen 197 220 131 89 23 11.7 2,107060 Sneem 763 672 346 326 -91 -11.9 6,592061 Tahilla 174 207 112 95 33 19.0 4,210
Killarney rural area 26,558 26,097 13,370 12,727 -461 -1.7 101,381
062 Aghadoe 760 857 446 411 97 12.8 1,046063 Aglish 304 328 177 151 24 7.9 877064 Ballyhar 150 150 82 68 – – 870065 Brewsterfield 451 578 296 282 127 28.2 2,819066 Caragh 736 809 423 386 73 9.9 3,604067 Churchtown 356 391 204 187 35 9.8 2,696068 Clydagh 137 119 66 53 -18 -13.1 6,049069 Coolies 513 672 351 321 159 31.0 2,974070 Coom 1,926 1,897 986 911 -29 -1.5 7,092071 Curraghmore 304 294 161 133 -10 -3.3 5,266072 Currans 221 237 123 114 16 7.2 1,014073 Doocarrig 570 541 278 263 -29 -5.1 3,848074 Dromin 650 699 359 340 49 7.5 2,097075 Dunloe 619 727 379 348 108 17.4 4,107076 Flesk 350 376 189 187 26 7.4 5,846077 Headfort 561 541 273 268 -20 -3.6 1,831078 Kilbonane 370 435 222 213 65 17.6 1,600079 Kilcummin 1,450 1,534 794 740 84 5.8 3,855080 Kilfelim 252 232 122 110 -20 -7.9 1,159081 Kilgobnet 698 783 405 378 85 12.2 2,878082 Killarney Rural (part) 5,134 3,252 1,642 1,610 -1,882 -36.7 4,489083 Killeentierna 878 856 443 413 -22 -2.5 3,375084 Killorglin 3,267 3,517 1,742 1,775 250 7.7 3,614085 Kilnanare 719 795 401 394 76 10.6 3,713086 Knocknahoe 241 255 139 116 14 5.8 1,684087 Lahard 506 546 280 266 40 7.9 1,844088 Milltown 1,183 1,202 627 575 19 1.6 2,755089 Molahiffe 938 1,085 556 529 147 15.7 3,578090 Muckross (part) 645 661 340 321 16 2.5 9,370091 Rathmore 1,405 1,434 715 719 29 2.1 4,470092 Rockfield 264 294 149 145 30 11.4 961
Listowel rural area 19,275 18,774 9,721 9,053 -501 -2.6 66,750
093 Ardagh 671 645 347 298 -26 -3.9 1,548094 Astee 566 528 271 257 -38 -6.7 2,312095 Ballincloher 425 418 203 215 -7 -1.6 1,242096 Ballyconry 381 423 225 198 42 11.0 1,126097 Ballyduff 992 914 481 433 -78 -7.9 1,307098 Ballyegan 131 119 64 55 -12 -9.2 1,330099 Ballyhorgan 377 396 205 191 19 5.0 1,823100 Beal 188 160 78 82 -28 -14.9 802101 Carrig 439 396 199 197 -43 -9.8 1,111
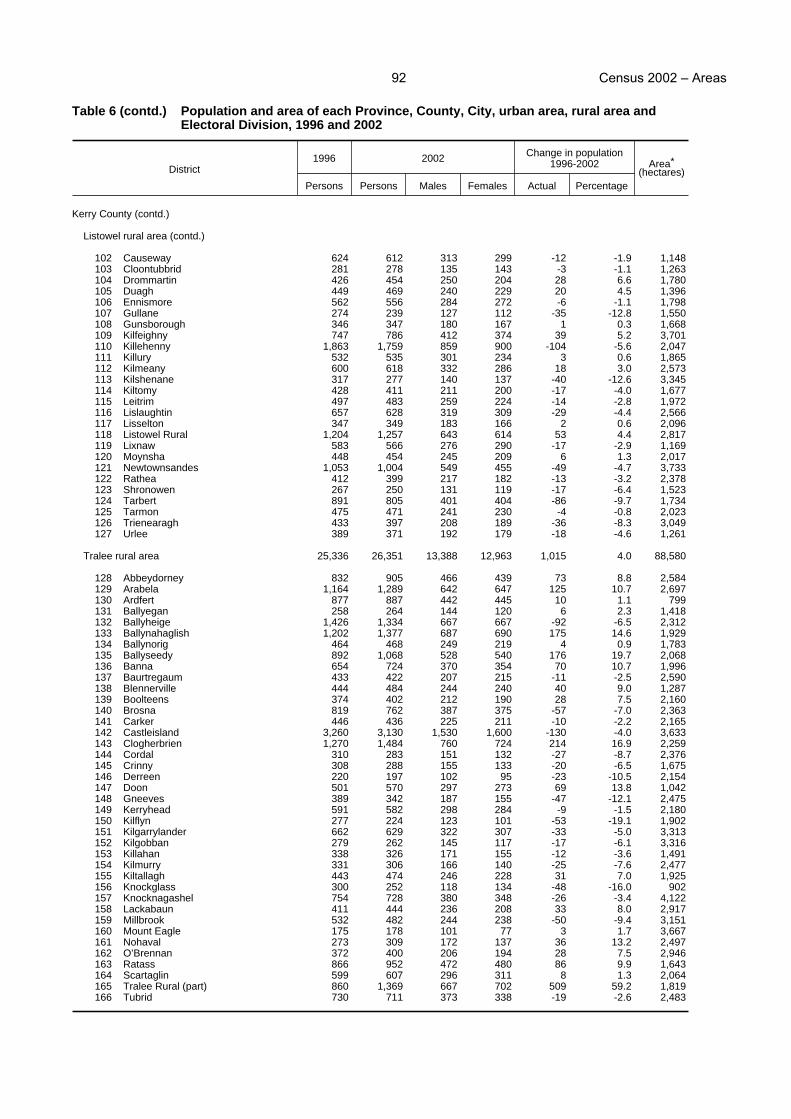
Census 2002 Areas92
Table 6 (contd.) Population and area of each Province, County, City, urban area, rural area andElectoral Division, 1996 and 2002
District1996 2002 Change in population
1996-2002 Area*(hectares)
Persons Persons Males Females Actual Percentage
Kerry County (contd.)
Listowel rural area (contd.)
102 Causeway 624 612 313 299 -12 -1.9 1,148103 Cloontubbrid 281 278 135 143 -3 -1.1 1,263104 Drommartin 426 454 250 204 28 6.6 1,780105 Duagh 449 469 240 229 20 4.5 1,396106 Ennismore 562 556 284 272 -6 -1.1 1,798107 Gullane 274 239 127 112 -35 -12.8 1,550108 Gunsborough 346 347 180 167 1 0.3 1,668109 Kilfeighny 747 786 412 374 39 5.2 3,701110 Killehenny 1,863 1,759 859 900 -104 -5.6 2,047111 Killury 532 535 301 234 3 0.6 1,865112 Kilmeany 600 618 332 286 18 3.0 2,573113 Kilshenane 317 277 140 137 -40 -12.6 3,345114 Kiltomy 428 411 211 200 -17 -4.0 1,677115 Leitrim 497 483 259 224 -14 -2.8 1,972116 Lislaughtin 657 628 319 309 -29 -4.4 2,566117 Lisselton 347 349 183 166 2 0.6 2,096118 Listowel Rural 1,204 1,257 643 614 53 4.4 2,817119 Lixnaw 583 566 276 290 -17 -2.9 1,169120 Moynsha 448 454 245 209 6 1.3 2,017121 Newtownsandes 1,053 1,004 549 455 -49 -4.7 3,733122 Rathea 412 399 217 182 -13 -3.2 2,378123 Shronowen 267 250 131 119 -17 -6.4 1,523124 Tarbert 891 805 401 404 -86 -9.7 1,734125 Tarmon 475 471 241 230 -4 -0.8 2,023126 Trienearagh 433 397 208 189 -36 -8.3 3,049127 Urlee 389 371 192 179 -18 -4.6 1,261
Tralee rural area 25,336 26,351 13,388 12,963 1,015 4.0 88,580
128 Abbeydorney 832 905 466 439 73 8.8 2,584129 Arabela 1,164 1,289 642 647 125 10.7 2,697130 Ardfert 877 887 442 445 10 1.1 799131 Ballyegan 258 264 144 120 6 2.3 1,418132 Ballyheige 1,426 1,334 667 667 -92 -6.5 2,312133 Ballynahaglish 1,202 1,377 687 690 175 14.6 1,929134 Ballynorig 464 468 249 219 4 0.9 1,783135 Ballyseedy 892 1,068 528 540 176 19.7 2,068136 Banna 654 724 370 354 70 10.7 1,996137 Baurtregaum 433 422 207 215 -11 -2.5 2,590138 Blennerville 444 484 244 240 40 9.0 1,287139 Boolteens 374 402 212 190 28 7.5 2,160140 Brosna 819 762 387 375 -57 -7.0 2,363141 Carker 446 436 225 211 -10 -2.2 2,165142 Castleisland 3,260 3,130 1,530 1,600 -130 -4.0 3,633143 Clogherbrien 1,270 1,484 760 724 214 16.9 2,259144 Cordal 310 283 151 132 -27 -8.7 2,376145 Crinny 308 288 155 133 -20 -6.5 1,675146 Derreen 220 197 102 95 -23 -10.5 2,154147 Doon 501 570 297 273 69 13.8 1,042148 Gneeves 389 342 187 155 -47 -12.1 2,475149 Kerryhead 591 582 298 284 -9 -1.5 2,180150 Kilflyn 277 224 123 101 -53 -19.1 1,902151 Kilgarrylander 662 629 322 307 -33 -5.0 3,313152 Kilgobban 279 262 145 117 -17 -6.1 3,316153 Killahan 338 326 171 155 -12 -3.6 1,491154 Kilmurry 331 306 166 140 -25 -7.6 2,477155 Kiltallagh 443 474 246 228 31 7.0 1,925156 Knockglass 300 252 118 134 -48 -16.0 902157 Knocknagashel 754 728 380 348 -26 -3.4 4,122158 Lackabaun 411 444 236 208 33 8.0 2,917159 Millbrook 532 482 244 238 -50 -9.4 3,151160 Mount Eagle 175 178 101 77 3 1.7 3,667161 Nohaval 273 309 172 137 36 13.2 2,497162 O’Brennan 372 400 206 194 28 7.5 2,946163 Ratass 866 952 472 480 86 9.9 1,643164 Scartaglin 599 607 296 311 8 1.3 2,064165 Tralee Rural (part) 860 1,369 667 702 509 59.2 1,819166 Tubrid 730 711 373 338 -19 -2.6 2,483

Census 2002 Areas93
Table 6 (contd.) Population and area of each Province, County, City, urban area, rural area andElectoral Division, 1996 and 2002
District1996 2002 Change in population
1996-2002 Area*(hectares)
Persons Persons Males Females Actual Percentage
Limerick County and City 165,042 175,304 87,631 87,673 10,262 6.2 276,002
Limerick City 52,039 54,023 26,128 27,895 1,984 3.8 2,035
001 Abbey A 3,605 4,226 2,060 2,166 621 17.2 276002 Abbey B 1,149 1,595 767 828 446 38.8 100003 Abbey C 699 628 265 363 -71 -10.2 12004 Abbey D 1,765 1,608 791 817 -157 -8.9 33005 Ballinacurra A 1,102 1,638 721 917 536 48.6 203006 Ballinacurra B 1,849 1,640 763 877 -209 -11.3 68007 Ballynanty 4,448 4,110 2,016 2,094 -338 -7.6 130008 Castle A 1,380 1,352 612 740 -28 -2.0 31009 Castle B 534 508 249 259 -26 -4.9 17010 Castle C 1,075 1,003 480 523 -72 -6.7 72011 Castle D 2,592 2,480 1,220 1,260 -112 -4.3 119012 Coolraine 1,973 1,951 926 1,025 -22 -1.1 52013 Custom House 416 503 245 258 87 20.9 17014 Dock A 667 1,879 991 888 1,212 181.7 18015 Dock B 855 793 355 438 -62 -7.3 15016 Dock C 1,191 1,068 433 635 -123 -10.3 28017 Dock D 745 1,015 439 576 270 36.2 69018 Farranshone 1,249 1,175 509 666 -74 -5.9 28019 Galvone A 1,844 1,701 791 910 -143 -7.8 80020 Galvone B 2,484 2,022 965 1,057 -462 -18.6 63021 Glentworth A 633 577 294 283 -56 -8.8 26022 Glentworth B 1,475 1,406 677 729 -69 -4.7 26023 Glentworth C 657 654 330 324 -3 -0.5 21024 John’s A 1,397 1,358 688 670 -39 -2.8 47025 John’s B 1,039 1,115 525 590 76 7.3 32026 John’s C 320 287 170 117 -33 -10.3 7027 Killeely A 1,555 1,559 765 794 4 0.3 61028 Killeely B 973 869 395 474 -104 -10.7 15029 Market 795 1,245 609 636 450 56.6 23030 Prospect A 1,010 904 442 462 -106 -10.5 17031 Prospect B 1,269 1,139 552 587 -130 -10.2 19032 Rathbane 2,337 1,984 954 1,030 -353 -15.1 57033 St. Laurence 1,239 1,184 677 507 -55 -4.4 80034 Shannon A 201 294 148 146 93 46.3 16035 Shannon B 607 819 461 358 212 34.9 18036 Singland A 1,676 1,868 912 956 192 11.5 32037 Singland B 3,234 3,866 1,931 1,935 632 19.5 107
Limerick County 113,003 121,281 61,503 59,778 8,278 7.3 273,967
Croom rural area 11,035 11,627 5,925 5,702 592 5.4 33,763
001 Abbeyville 241 259 134 125 18 7.5 1,349002 Adare North 519 580 290 290 61 11.8 1,794003 Adare South 1,768 2,012 1,030 982 244 13.8 2,196004 Ballingarry 713 699 349 350 -14 -2.0 1,769005 Ballyagran 559 550 296 254 -9 -1.6 1,663006 Ballygrennan 260 254 132 122 -6 -2.3 1,640007 Ballynabanoge 312 321 162 159 9 2.9 1,467008 Ballynoe 419 449 235 214 30 7.2 2,331009 Castletown 378 391 203 188 13 3.4 2,038010 Coolrus 401 395 203 192 -6 -1.5 1,961011 Crean 347 374 192 182 27 7.8 1,450012 Crecora 365 439 229 210 74 20.3 1,316013 Croom 1,600 1,564 773 791 -36 -2.2 1,816014 Dunnaman 519 554 287 267 35 6.7 1,807015 Fedamore 1,003 1,020 510 510 17 1.7 1,987016 Garrane 274 295 148 147 21 7.7 1,127017 Grange 398 469 246 223 71 17.8 1,637018 Kilfinny 263 260 135 125 -3 -1.1 1,492019 Kilpeacon 435 478 247 231 43 9.9 1,648020 Rathmore 261 264 124 140 3 1.1 1,275

Census 2002 Areas94
Table 6 (contd.) Population and area of each Province, County, City, urban area, rural area andElectoral Division, 1996 and 2002
District1996 2002 Change in population
1996-2002 Area*(hectares)
Persons Persons Males Females Actual Percentage
Limerick County (contd.)
Glin rural area 2,448 2,360 1,232 1,128 -88 -3.6 11,105
021 Fleanmore 212 199 96 103 -13 -6.1 1,584022 Glin 1,140 1,178 622 556 38 3.3 3,229023 Kilfergus 587 508 259 249 -79 -13.5 2,676024 Kilmoylan 509 475 255 220 -34 -6.7 3,616
Kilmallock rural area 14,578 14,864 7,630 7,234 286 2.0 50,903
025 Ardpatrick 399 388 206 182 -11 -2.8 2,098026 Athlacca 357 371 189 182 14 3.9 1,723027 Ballymacshaneboy 406 403 210 193 -3 -0.7 2,436028 Bruff 1,192 1,265 626 639 73 6.1 1,993029 Bruree 824 920 507 413 96 11.7 2,001030 Bulgaden 273 306 165 141 33 12.1 1,464031 Cahercorney 524 529 275 254 5 1.0 1,788032 Colmanswell 529 557 294 263 28 5.3 3,019033 Darragh 333 300 159 141 -33 -9.9 1,853034 Dromin 470 476 245 231 6 1.3 2,597035 Emlygrennan 622 633 327 306 11 1.8 2,536036 Glenbrohane 371 379 194 185 8 2.2 2,009037 Griston 250 263 134 129 13 5.2 1,610038 Hospital 1,186 1,143 570 573 -43 -3.6 2,216039 Kilfinnane 1,069 1,104 547 557 35 3.3 2,772040 Kilflyn 263 225 123 102 -38 -14.4 1,943041 Kilmallock 2,058 2,088 1,049 1,039 30 1.5 2,231042 Kilteely 443 457 234 223 14 3.2 1,785043 Knockainy 627 625 326 299 -2 -0.3 2,326044 Knocklong 758 799 399 400 41 5.4 1,876045 Particles 186 166 88 78 -20 -10.8 2,445046 Rockhill 370 301 155 146 -69 -18.6 1,710047 Tobernea 554 627 326 301 73 13.2 2,125048 Uregare 514 539 282 257 25 4.9 2,347
Limerick No. 1 rural area 43,996 50,547 25,332 25,215 6,551 14.9 43,366
049 Abington 609 733 370 363 124 20.4 2,203050 Ballybricken 1,238 1,391 699 692 153 12.4 2,970051 Ballycummin 9,907 13,435 6,568 6,867 3,528 35.6 2,031052 Ballysimon 8,222 9,675 4,899 4,776 1,453 17.7 3,059053 Ballyvarra 2,928 3,740 1,848 1,892 812 27.7 3,822054 Caherconlish East 453 458 235 223 5 1.1 1,980055 Caherconlish West 1,247 1,218 601 617 -29 -2.3 2,432056 Caherelly 182 228 123 105 46 25.3 1,145057 Cappamore 1,284 1,408 706 702 124 9.7 1,852058 Carrig 592 589 297 292 -3 -0.5 1,867059 Castleconnell 2,651 2,647 1,353 1,294 -4 -0.2 2,238060 Clarina 1,417 1,451 719 732 34 2.4 2,168061 Clonkeen 477 526 274 252 49 10.3 1,615062 Doon West 232 204 98 106 -28 -12.1 2,360063 Glenstal 918 919 578 341 1 0.1 3,312064 Kilmurry 686 761 407 354 75 10.9 2,617065 Limerick North Rural 7,102 6,932 3,380 3,552 -170 -2.4 1,429066 Limerick South Rural 751 980 505 475 229 30.5 607067 Patrickswell 1,580 1,574 810 764 -6 -0.4 1,255068 Roxborough 1,520 1,678 862 816 158 10.4 2,404
Mitchelstown No. 2 rural area 3,073 3,049 1,619 1,430 -24 -0.8 15,606
069 Anglesborough 350 351 180 171 1 0.3 2,501070 Ballylanders 591 606 322 284 15 2.5 1,253071 Cullane 376 364 208 156 -12 -3.2 1,872072 Duntryleague 331 301 157 144 -30 -9.1 1,661073 Galbally 509 524 271 253 15 2.9 1,607074 Kilbeheny 230 242 125 117 12 5.2 2,534075 Kilglass 282 287 162 125 5 1.8 1,286076 Knocknascrow 183 162 79 83 -21 -11.5 1,421077 Riversdale 221 212 115 97 -9 -4.1 1,471

Census 2002 Areas95
Table 6 (contd.) Population and area of each Province, County, City, urban area, rural area andElectoral Division, 1996 and 2002
District1996 2002 Change in population
1996-2002 Area*(hectares)
Persons Persons Males Females Actual Percentage
Limerick County (contd.)
Newcastle rural area 19,996 20,610 10,446 10,164 614 3.1 58,213
078 Abbeyfeale 1,989 2,263 1,100 1,163 274 13.8 1,487079 Ardagh 923 942 476 466 19 2.1 2,613080 Ballintober 370 345 184 161 -25 -6.8 1,579081 Ballynoe West 265 276 150 126 11 4.2 1,304082 Boola 156 155 82 73 -1 -0.6 1,022083 Broadford 786 846 430 416 60 7.6 2,891084 Caher 306 326 164 162 20 6.5 1,300085 Cleanglass 304 317 159 158 13 4.3 2,084086 Cloncagh 262 235 120 115 -27 -10.3 1,668087 Danganbeg 397 373 193 180 -24 -6.0 1,862088 Dromcolliher 927 976 498 478 49 5.3 2,618089 Dromtrasna 814 786 426 360 -28 -3.4 2,916090 Feenagh 351 315 170 145 -36 -10.3 1,419091 Garryduff 333 306 159 147 -27 -8.1 1,530092 Glenagower 459 472 237 235 13 2.8 1,813093 Glengort 701 737 377 360 36 5.1 3,225094 Glensharrold 428 446 232 214 18 4.2 1,945095 Kilmeedy 371 350 187 163 -21 -5.7 1,459096 Knockaderry 415 458 239 219 43 10.4 1,503097 Mahoonagh 518 463 242 221 -55 -10.6 1,293098 Monagay 1,042 1,018 531 487 -24 -2.3 3,509099 Mountcollins 564 546 308 238 -18 -3.2 1,761100 Mountplummer 329 298 155 143 -31 -9.4 2,100101 Newcastle Rural 1,085 1,305 667 638 220 20.3 2,600102 Newcastle Urban 3,288 3,495 1,642 1,853 207 6.3 1,633103 Port 554 560 293 267 6 1.1 3,751104 Rathronan 909 876 440 436 -33 -3.6 2,081105 Rooskagh 303 286 146 140 -17 -5.6 2,929106 Templeglentan 847 839 439 400 -8 -0.9 318
Rathkeale rural area 13,495 13,798 7,030 6,768 303 2.2 46,582
107 Askeaton East 701 718 339 379 17 2.4 1,461108 Askeaton West 751 881 444 437 130 17.3 1,795109 Aughinish 197 230 143 87 33 16.8 2,711110 Ballyallinan 361 359 192 167 -2 -0.6 2,313111 Ballynacarriga 557 586 300 286 29 5.2 2,095112 Castletown 374 399 191 208 25 6.7 2,194113 Craggs 231 267 132 135 36 15.6 1,388114 Croagh 531 671 328 343 140 26.4 2,235115 Dromard 562 674 338 336 112 19.9 2,699116 Dunmoylan East 432 442 234 208 10 2.3 2,156117 Dunmoylan West 106 94 51 43 -12 -11.3 871118 Iveruss 310 293 155 138 -17 -5.5 2,191119 Kilcornan 604 632 331 301 28 4.6 2,519120 Kildimo 576 597 293 304 21 3.6 1,354121 Kilscannell 433 466 240 226 33 7.6 2,084122 Lismakeery 418 403 214 189 -15 -3.6 2,121123 Loghill 700 674 342 332 -26 -3.7 2,901124 Mohernagh 150 128 64 64 -22 -14.7 605125 Nantinan 637 701 363 338 64 10.0 2,197126 Pallaskenry 1,005 1,009 553 456 4 0.4 1,388127 Rathkeale Rural 319 335 159 176 16 5.0 972128 Rathkeale Urban 1,546 1,362 639 723 -184 -11.9 607129 Riddlestown 421 440 224 216 19 4.5 2,194130 Shanagolden 1,087 981 516 465 -106 -9.8 1,735131 Shanid 486 456 245 211 -30 -6.2 1,796
Tipperary No. 2 rural area 4,382 4,426 2,289 2,137 44 1.0 14,429
132 Bilboa 402 381 200 181 -21 -5.2 2,594133 Doon South 1,157 1,210 611 599 53 4.6 3,021134 Grean 1,271 1,310 677 633 39 3.1 3,278135 Oola 1,136 1,063 551 512 -73 -6.4 3,251136 Templebredon 416 462 250 212 46 11.1 2,285

Census 2002 Areas96
Table 6 (contd.) Population and area of each Province, County, City, urban area, rural area andElectoral Division, 1996 and 2002
District1996 2002 Change in population
1996-2002 Area*(hectares)
Persons Persons Males Females Actual Percentage
Tipperary North 58,021 61,010 30,864 30,146 2,989 5.2 204,630
Nenagh Town 5,645 6,121 2,967 3,154 476 8.4 846
001 Nenagh East Urban 2,005 1,934 940 994 -71 -3.5 469002 Nenagh West Urban 3,640 4,187 2,027 2,160 547 15.0 377
Templemore Town 2,115 2,159 1,109 1,050 44 2.1 439
003 Templemore 2,115 2,159 1,109 1,050 44 2.1 439
Thurles Town 6,603 6,852 3,248 3,604 249 3.8 515
004 Thurles Urban 6,603 6,852 3,248 3,604 249 3.8 515
Borrisokane rural area 7,029 7,062 3,641 3,421 33 0.5 47,112
005 Aglishcloghane 261 292 149 143 31 11.9 2,633006 Ballingarry 615 583 312 271 -32 -5.2 4,059007 Ballylusky 261 267 147 120 6 2.3 2,311008 Borrisokane 1,129 1,171 590 581 42 3.7 2,080009 Carrig 193 186 95 91 -7 -3.6 1,232010 Cloghjordan 813 740 393 347 -73 -9.0 2,902011 Cloghprior 252 238 120 118 -14 -5.6 2,264012 Clohaskin 197 222 107 115 25 12.7 1,937013 Finnoe 155 158 80 78 3 1.9 1,610014 Graigue 304 267 134 133 -37 -12.2 1,849015 Kilbarron 553 576 292 284 23 4.2 4,699016 Lorrha East 338 329 173 156 -9 -2.7 2,993017 Lorrha West 337 319 173 146 -18 -5.3 2,995018 Mertonhall 172 168 84 84 -4 -2.3 1,644019 Rathcabban 223 222 118 104 -1 -0.4 1,876020 Redwood 168 143 73 70 -25 -14.9 2,224021 Riverstown 396 482 242 240 86 21.7 2,044022 Terryglass 451 504 256 248 53 11.8 3,648023 Uskane 211 195 103 92 -16 -7.6 2,112
Nenagh rural area 15,789 17,218 8,826 8,392 1,429 9.1 75,655
024 Abington 509 563 320 243 54 10.6 4,947025 Aghnameadle 272 271 135 136 -1 -0.4 2,634026 Ardcrony 441 451 247 204 10 2.3 1,651027 Ballina 1,058 1,720 873 847 662 62.6 2,595028 Ballygibbon 505 487 252 235 -18 -3.6 2,889029 Ballymackey 535 505 276 229 -30 -5.6 3,073030 Ballynaclogh 622 647 332 315 25 4.0 2,339031 Birdhill 537 588 304 284 51 9.5 2,317032 Burgesbeg 430 418 225 193 -12 -2.8 1,914033 Carrigatogher 611 641 320 321 30 4.9 2,113034 Castletown 1,148 1,223 613 610 75 6.5 4,268035 Derrycastle 311 349 174 175 38 12.2 2,273036 Dolla 246 215 113 102 -31 -12.6 2,873037 Greenhall 232 237 128 109 5 2.2 1,934038 Kilcomenty 526 579 302 277 53 10.1 2,150039 Kilkeary 482 532 268 264 50 10.4 2,476040 Killoscully 290 311 162 149 21 7.2 2,629041 Kilmore 551 581 300 281 30 5.4 3,651042 Kilnaneave 461 474 239 235 13 2.8 2,947043 Kilnarath 285 302 151 151 17 6.0 3,268044 Knigh 593 678 354 324 85 14.3 2,364045 Lackagh 28 20 14 6 -8 -28.6 1,669046 Latteragh 668 639 336 303 -29 -4.3 2,796047 Monsea 593 628 307 321 35 5.9 2,302048 Nenagh Rural 1,463 1,710 832 878 247 16.9 3,395049 Newport 1,536 1,643 813 830 107 7.0 2,907050 Templederry 202 180 96 84 -22 -10.9 2,322051 Youghalarra 654 626 340 286 -28 -4.3 2,959

Census 2002 Areas97
Table 6 (contd.) Population and area of each Province, County, City, urban area, rural area andElectoral Division, 1996 and 2002
District1996 2002 Change in population
1996-2002 Area*(hectares)
Persons Persons Males Females Actual Percentage
Tipperary North (contd.)
Roscrea No. 1 rural area 7,474 7,781 3,908 3,873 307 4.1 23,285
052 Borrisnafarney 225 247 134 113 22 9.8 2,621053 Borrisnoe 90 94 52 42 4 4.4 2,106054 Bourney East 302 287 143 144 -15 -5.0 2,242055 Bourney West 411 383 196 187 -28 -6.8 2,500056 Killavinoge 402 405 215 190 3 0.7 2,268057 Killea 321 330 181 149 9 2.8 2,728058 Rathnaveoge 250 271 127 144 21 8.4 1,837059 Roscrea 5,190 5,496 2,708 2,788 306 5.9 4,846060 Timoney 283 268 152 116 -15 -5.3 2,137
Thurles rural area 13,366 13,817 7,165 6,652 451 3.4 56,778
061 Ballycahill 451 393 203 190 -58 -12.9 2,052062 Ballymurreen 282 252 142 110 -30 -10.6 1,210063 Borrisoleigh 1,058 1,129 585 544 71 6.7 2,251064 Drom 902 920 484 436 18 2.0 4,710065 Foilnaman 293 293 157 136 – – 2,420066 Glenkeen 413 388 208 180 -25 -6.1 2,771067 Gortkelly 452 476 233 243 24 5.3 2,765068 Holycross 1,334 1,424 743 681 90 6.7 3,520069 Inch 405 421 216 205 16 4.0 1,483070 Kilrush 398 422 203 219 24 6.0 2,445071 Littleton 1,225 1,153 600 553 -72 -5.9 2,659072 Longfordpass 246 268 144 124 22 8.9 2,536073 Loughmoe 566 569 307 262 3 0.5 2,944074 Moyaliff 363 357 195 162 -6 -1.7 2,361075 Moycarky 520 533 271 262 13 2.5 1,555076 Moyne 492 484 249 235 -8 -1.6 3,281077 Rahelty 584 594 319 275 10 1.7 2,603078 Templetouhy 869 837 434 403 -32 -3.7 4,192079 Thurles Rural 1,582 1,858 920 938 276 17.4 3,860080 Twomileborris 602 728 375 353 126 20.9 2,391081 Upperchurch 329 318 177 141 -11 -3.3 2,769
Tipperary South 75,514 79,121 39,999 39,122 3,607 4.8 225,794
Carrick-on-Suir Town 5,172 5,542 2,727 2,815 370 7.2 898
082 Carrickbeg Urban 1,004 1,229 598 631 225 22.4 355083 Carrick-on-Suir Urban 4,168 4,313 2,129 2,184 145 3.5 543
Cashel Town 2,346 2,403 1,143 1,260 57 2.4 150
084 Cashel Urban 2,346 2,403 1,143 1,260 57 2.4 150
Clonmel Borough 15,215 15,739 7,671 8,068 524 3.4 1,181
085 Clonmel East Urban 3,515 4,121 1,994 2,127 606 17.2 276086 Clonmel West Urban 7,328 6,530 3,199 3,331 -798 -10.9 252133 Clonmel Rural (part) 2,668 3,108 1,493 1,615 440 16.5 532134 Inishlounaght (part) 1,704 1,980 985 995 276 16.2 121
Tipperary Town 4,640 4,546 2,224 2,322 -94 -2.0 335
087 Tipperary East Urban 2,947 2,830 1,390 1,440 -117 -4.0 163088 Tipperary West Urban 1,693 1,716 834 882 23 1.4 172
Carrick-on-Suir No. 1 rural area 1,628 1,784 937 847 156 9.6 9,673
089 Carrick-on-Suir Rural 403 485 255 230 82 20.3 1,578090 Garrangibbon 556 604 310 294 48 8.6 3,674091 Kilmurry 345 321 177 144 -24 -7.0 2,216092 Newtown 324 374 195 179 50 15.4 2,205
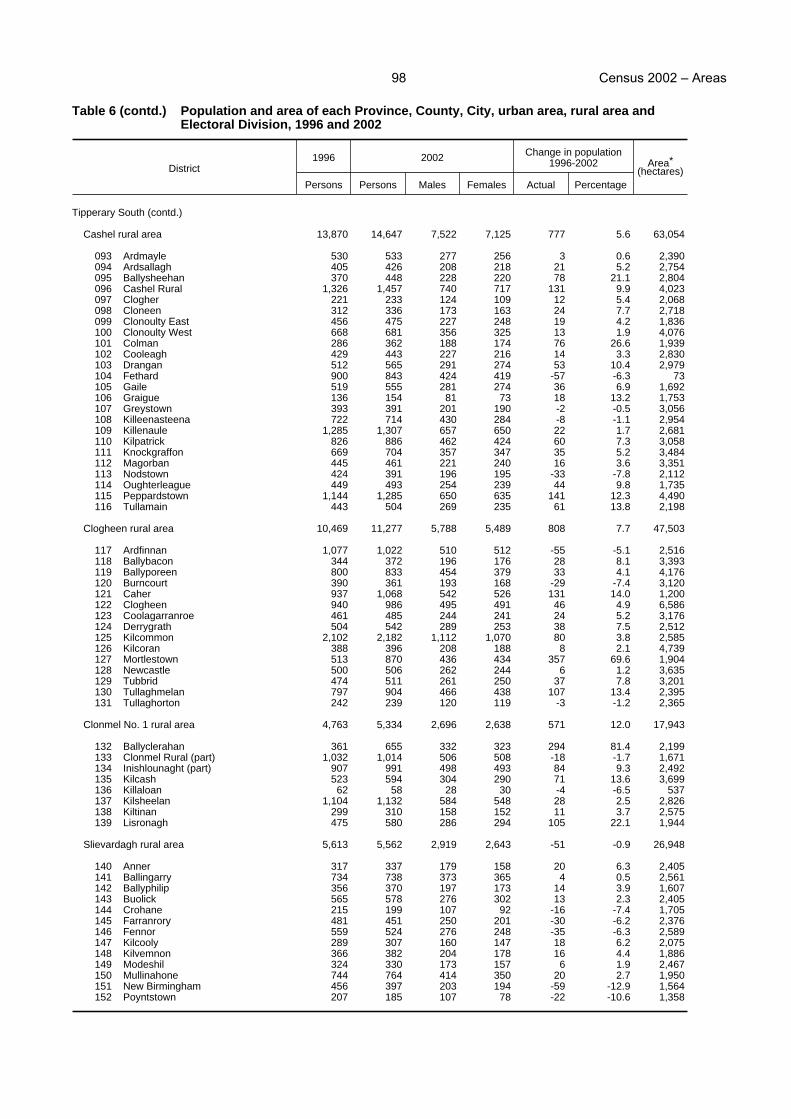
Census 2002 Areas98
Table 6 (contd.) Population and area of each Province, County, City, urban area, rural area andElectoral Division, 1996 and 2002
District1996 2002 Change in population
1996-2002 Area*(hectares)
Persons Persons Males Females Actual Percentage
Tipperary South (contd.)
Cashel rural area 13,870 14,647 7,522 7,125 777 5.6 63,054
093 Ardmayle 530 533 277 256 3 0.6 2,390094 Ardsallagh 405 426 208 218 21 5.2 2,754095 Ballysheehan 370 448 228 220 78 21.1 2,804096 Cashel Rural 1,326 1,457 740 717 131 9.9 4,023097 Clogher 221 233 124 109 12 5.4 2,068098 Cloneen 312 336 173 163 24 7.7 2,718099 Clonoulty East 456 475 227 248 19 4.2 1,836100 Clonoulty West 668 681 356 325 13 1.9 4,076101 Colman 286 362 188 174 76 26.6 1,939102 Cooleagh 429 443 227 216 14 3.3 2,830103 Drangan 512 565 291 274 53 10.4 2,979104 Fethard 900 843 424 419 -57 -6.3 73105 Gaile 519 555 281 274 36 6.9 1,692106 Graigue 136 154 81 73 18 13.2 1,753107 Greystown 393 391 201 190 -2 -0.5 3,056108 Killeenasteena 722 714 430 284 -8 -1.1 2,954109 Killenaule 1,285 1,307 657 650 22 1.7 2,681110 Kilpatrick 826 886 462 424 60 7.3 3,058111 Knockgraffon 669 704 357 347 35 5.2 3,484112 Magorban 445 461 221 240 16 3.6 3,351113 Nodstown 424 391 196 195 -33 -7.8 2,112114 Oughterleague 449 493 254 239 44 9.8 1,735115 Peppardstown 1,144 1,285 650 635 141 12.3 4,490116 Tullamain 443 504 269 235 61 13.8 2,198
Clogheen rural area 10,469 11,277 5,788 5,489 808 7.7 47,503
117 Ardfinnan 1,077 1,022 510 512 -55 -5.1 2,516118 Ballybacon 344 372 196 176 28 8.1 3,393119 Ballyporeen 800 833 454 379 33 4.1 4,176120 Burncourt 390 361 193 168 -29 -7.4 3,120121 Caher 937 1,068 542 526 131 14.0 1,200122 Clogheen 940 986 495 491 46 4.9 6,586123 Coolagarranroe 461 485 244 241 24 5.2 3,176124 Derrygrath 504 542 289 253 38 7.5 2,512125 Kilcommon 2,102 2,182 1,112 1,070 80 3.8 2,585126 Kilcoran 388 396 208 188 8 2.1 4,739127 Mortlestown 513 870 436 434 357 69.6 1,904128 Newcastle 500 506 262 244 6 1.2 3,635129 Tubbrid 474 511 261 250 37 7.8 3,201130 Tullaghmelan 797 904 466 438 107 13.4 2,395131 Tullaghorton 242 239 120 119 -3 -1.2 2,365
Clonmel No. 1 rural area 4,763 5,334 2,696 2,638 571 12.0 17,943
132 Ballyclerahan 361 655 332 323 294 81.4 2,199133 Clonmel Rural (part) 1,032 1,014 506 508 -18 -1.7 1,671134 Inishlounaght (part) 907 991 498 493 84 9.3 2,492135 Kilcash 523 594 304 290 71 13.6 3,699136 Killaloan 62 58 28 30 -4 -6.5 537137 Kilsheelan 1,104 1,132 584 548 28 2.5 2,826138 Kiltinan 299 310 158 152 11 3.7 2,575139 Lisronagh 475 580 286 294 105 22.1 1,944
Slievardagh rural area 5,613 5,562 2,919 2,643 -51 -0.9 26,948
140 Anner 317 337 179 158 20 6.3 2,405141 Ballingarry 734 738 373 365 4 0.5 2,561142 Ballyphilip 356 370 197 173 14 3.9 1,607143 Buolick 565 578 276 302 13 2.3 2,405144 Crohane 215 199 107 92 -16 -7.4 1,705145 Farranrory 481 451 250 201 -30 -6.2 2,376146 Fennor 559 524 276 248 -35 -6.3 2,589147 Kilcooly 289 307 160 147 18 6.2 2,075148 Kilvemnon 366 382 204 178 16 4.4 1,886149 Modeshil 324 330 173 157 6 1.9 2,467150 Mullinahone 744 764 414 350 20 2.7 1,950151 New Birmingham 456 397 203 194 -59 -12.9 1,564152 Poyntstown 207 185 107 78 -22 -10.6 1,358

Census 2002 Areas99
Table 6 (contd.) Population and area of each Province, County, City, urban area, rural area andElectoral Division, 1996 and 2002
District1996 2002 Change in population
1996-2002 Area*(hectares)
Persons Persons Males Females Actual Percentage
Tipperary South (contd.)
Tipperary No. 1 rural area 11,798 12,287 6,372 5,915 489 4.1 58,109
153 Ballycarron 207 229 116 113 22 10.6 1,799154 Ballygriffin 246 247 125 122 1 0.4 1,392155 Ballykisteen 598 577 301 276 -21 -3.5 1,554156 Bansha 799 858 435 423 59 7.4 2,400157 Bruis 249 255 141 114 6 2.4 1,591158 Cappagh 755 774 385 389 19 2.5 2,426159 Clonbeg 602 651 333 318 49 8.1 5,552160 Cullen 272 254 139 115 -18 -6.6 1,162161 Curraheen 328 286 156 130 -42 -12.8 2,363162 Donohill 590 620 321 299 30 5.1 3,367163 Drumwood 412 461 233 228 49 11.9 1,838164 Emly 670 612 318 294 -58 -8.7 2,224165 Glengar 259 245 133 112 -14 -5.4 3,238166 Golden 678 754 393 361 76 11.2 2,046167 Kilfeakle 439 448 236 212 9 2.1 2,232168 Killadriffe 496 532 280 252 36 7.3 3,057169 Kilmucklin 463 502 252 250 39 8.4 2,476170 Lattin 420 451 223 228 31 7.4 1,590171 Rathlynin 275 278 154 124 3 1.1 1,617172 Rodus 272 258 135 123 -14 -5.1 1,718173 Shronell 354 390 200 190 36 10.2 1,699174 Solloghodbeg 197 195 105 90 -2 -1.0 1,041175 Templeneiry 368 389 201 188 21 5.7 4,094176 Thomastown 337 373 190 183 36 10.7 1,907177 Tipperary Rural 1,512 1,648 867 781 136 9.0 3,726
Waterford County and City 94,680 101,546 50,672 50,874 6,866 7.3 185,871
Waterford City 42,540 44,594 21,782 22,812 2,054 4.8 4,158
001 Ballybeg North 3,716 3,040 1,432 1,608 -676 -18.2 65002 Ballybeg South 285 265 136 129 -20 -7.0 212003 Ballybricken West 215 184 82 102 -31 -14.4 7004 Ballymaclode 911 1,287 659 628 376 41.3 487005 Ballynakill 1,573 2,172 1,049 1,123 599 38.1 142006 Ballynaneashagh 23 17 10 7 -6 -26.1 178007 Ballytruckle 3,538 4,464 2,135 2,329 926 26.2 438008 Bilberry 510 472 228 244 -38 -7.5 53009 Centre A 660 731 353 378 71 10.8 17010 Centre B 251 253 119 134 2 0.8 5011 Cleaboy 2,573 2,640 1,316 1,324 67 2.6 69012 Custom House A 366 374 189 185 8 2.2 8013 Custom House B 388 338 179 159 -50 -12.9 18014 Farranshoneen 3,806 4,987 2,391 2,596 1,181 31.0 226015 Ferrybank 1,392 1,171 600 571 -221 -15.9 106016 Gracedieu 450 488 257 231 38 8.4 717017 Grange North 1,205 1,059 528 531 -146 -12.1 46018 Grange South 1,257 1,842 902 940 585 46.5 427019 Grange Upper 1,227 2,279 1,081 1,198 1,052 85.7 80020 Kilbarry 177 267 134 133 90 50.8 381021 Kingsmeadow 1,295 1,110 514 596 -185 -14.3 52022 Larchville 1,319 1,051 536 515 -268 -20.3 61023 Lisduggan 1,603 1,296 637 659 -307 -19.2 14024 Military Road 1,068 929 455 474 -139 -13.0 19025 Morrisson’s Avenue East 547 506 247 259 -41 -7.5 10026 Morrisson’s Avenue West 372 358 173 185 -14 -3.8 7027 Morrisson’s Road 720 628 307 321 -92 -12.8 6028 Mount Sion 864 793 403 390 -71 -8.2 19029 Newport’s Square 664 583 276 307 -81 -12.2 7030 Newtown 1,354 1,251 564 687 -103 -7.6 41031 Park 1,133 1,447 761 686 314 27.7 75032 Poleberry 1,036 1,001 482 519 -35 -3.4 46033 Roanmore 947 847 410 437 -100 -10.6 16034 Shortcourse 396 314 158 156 -82 -20.7 5035 Slievekeale 806 711 331 380 -95 -11.8 21036 The Glen 355 283 144 139 -72 -20.3 9037 Ticor North 2,831 2,618 1,324 1,294 -213 -7.5 57038 Ticor South 707 538 280 258 -169 -23.9 11

Census 2002 Areas100
Table 6 (contd.) Population and area of each Province, County, City, urban area, rural area andElectoral Division, 1996 and 2002
District1996 2002
Change in population1996-2002 Area*
(hectares)Persons Persons Males Females Actual Percentage
Waterford County 52,140 56,952 28,890 28,062 4,812 9.2 181,713
Dungarvan Town 7,175 7,220 3,517 3,703 45 0.6 553
001 Dungarvan No. 1 Urban 4,440 4,495 2,195 2,300 55 1.2 312002 Dungarvan No. 2 Urban 2,735 2,725 1,322 1,403 -10 -0.4 241
Carrick-on-Suir No. 2 rural area 3,937 4,172 2,110 2,062 235 6.0 22,161
003 Ballydurn 129 148 80 68 19 14.7 2,595004 Carrickbeg Rural 433 450 224 226 17 3.9 1,331005 Clonea 439 439 227 212 – – 1,889006 Fenoagh 178 203 96 107 25 14.0 1,242007 Glen 380 417 212 205 37 9.7 2,590008 Kilmeadan 424 612 308 304 188 44.3 2,531009 Mothel 371 395 210 185 24 6.5 2,092010 Portlaw 1,149 1,081 526 555 -68 -5.9 2,068011 Rathgormuck 191 173 86 87 -18 -9.4 4,137012 Ross 243 254 141 113 11 4.5 1,686
Clonmel No. 2 rural area 2,560 2,492 1,283 1,209 -68 -2.7 16,377
013 Ballymacarbry 368 410 206 204 42 11.4 2,552014 Graignagower 487 472 263 209 -15 -3.1 2,842015 Gurteen 307 276 159 117 -31 -10.1 4,936016 Kilmacomma 500 482 223 259 -18 -3.6 1,432017 Kilronan 128 161 74 87 33 25.8 1,062018 St. Mary’s 770 691 358 333 -79 -10.3 3,553
Dungarvan rural area 7,287 8,120 4,179 3,941 833 11.4 37,728
019 Ardmore 149 156 81 75 7 4.7 2,149020 Ballymacart 286 321 161 160 35 12.2 2,814021 Bohadoon 245 246 131 115 1 0.4 2,128022 Cappagh 312 342 177 165 30 9.6 1,487023 Carriglea 549 557 260 297 8 1.5 1,998024 Clonea 1,125 1,415 709 706 290 25.8 2,574025 Colligan 540 564 311 253 24 4.4 2,511026 Coumaraglin 215 225 125 100 10 4.7 2,811027 Dromana 463 485 254 231 22 4.8 1,544028 Dromore 183 208 121 87 25 13.7 1,866029 Dungarvan Rural 901 1,157 586 571 256 28.4 1,860030 Keereen 219 234 115 119 15 6.8 1,281031 Knockaunbrandaun 174 165 91 74 -9 -5.2 2,912032 Modelligo 228 251 131 120 23 10.1 1,920033 Mountstuart 57 57 29 28 – – 1,778034 Ringville 1,011 1,079 553 526 68 6.7 2,429035 Seskinan 420 446 229 217 26 6.2 2,581036 Whitechurch 210 212 115 97 2 1.0 1,085
Kilmacthomas rural area 5,613 6,193 3,179 3,014 580 10.3 26,152
037 Annestown 524 604 318 286 80 15.3 1,734038 Ballylaneen 204 218 107 111 14 6.9 1,552039 Carrigcastle 213 257 132 125 44 20.7 941040 Comeragh 410 449 233 216 39 9.5 2,395041 Dunhill 197 217 109 108 20 10.2 1,063042 Fews 226 246 131 115 20 8.8 1,957043 Fox’s Castle 371 392 209 183 21 5.7 2,063044 Gardenmorris 327 365 187 178 38 11.6 1,344

Census 2002 Areas101
Table 6 (contd.) Population and area of each Province, County, City, urban area, rural area andElectoral Division, 1996 and 2002
District1996 2002
Change in population1996-2002 Area*
(hectares)Persons Persons Males Females Actual Percentage
Waterford County (contd.)
Kilmacthomas rural area (contd.)
045 Georgestown 127 149 76 73 22 17.3 935046 Kilbarrymeaden 139 190 100 90 51 36.7 769047 Kilmacthomas 1,132 1,183 610 573 51 4.5 2,201048 Knockmahon 391 426 215 211 35 9.0 1,268049 Mountkennedy 331 359 180 179 28 8.5 2,609050 Newtown 368 435 217 218 67 18.2 2,211051 Stradbally 571 619 312 307 48 8.4 1,705052 Tinnasaggart 82 84 43 41 2 2.4 1,405
Lismore rural area 7,225 7,500 3,841 3,659 275 3.8 39,679
053 Ballyduff 249 257 137 120 8 3.2 1,816054 Ballyhane 384 404 194 210 20 5.2 1,850055 Ballyin 438 455 241 214 17 3.9 5,823056 Ballynamult 151 171 95 76 20 13.2 1,978057 Ballysaggartmore 311 315 172 143 4 1.3 3,462058 Cappoquin 1,229 1,232 645 587 3 0.2 4,782059 Castlerichard 451 493 233 260 42 9.3 2,898060 Drumroe 260 279 145 134 19 7.3 1,721061 Gortnapeaky 164 148 71 77 -16 -9.8 829062 Kilcockan 218 198 106 92 -20 -9.2 1,965063 Kilwatermoy East 120 119 60 59 -1 -0.8 1,124064 Kilwatermoy West 170 144 81 63 -26 -15.3 1,553065 Lismore Rural 812 863 447 416 51 6.3 3,169066 Lismore Urban 729 788 396 392 59 8.1 58067 Mocollop 196 210 103 107 14 7.1 2,571068 Modelligo 290 287 140 147 -3 -1.0 2,045069 Tallow 1,053 1,137 575 562 84 8.0 2,035
Waterford No. 1 rural area 15,538 18,356 9,308 9,048 2,818 18.1 24,649
070 Ballynakill (part) 349 327 159 168 -22 -6.3 887071 Drumcannon 362 382 189 193 20 5.5 1,331072 Faithlegg (part) 1,513 1,809 925 884 296 19.6 2,742073 Islandikane 1,359 1,670 825 845 311 22.9 2,446074 Kilbarry (part) 68 45 22 23 -23 -33.8 520075 Killea 1,435 1,665 978 687 230 16.0 1,360076 Killoteran 617 611 303 308 -6 -1.0 1,090077 Kilmacleague 233 295 152 143 62 26.6 1,444078 Kilmeadan 756 795 387 408 39 5.2 1,917079 Newcastle 299 399 215 184 100 33.4 1,740080 Pembrokestown 364 378 193 185 14 3.8 1,520081 Rathmoylan 669 849 409 440 180 26.9 1,598082 Reisk 841 879 442 437 38 4.5 2,606083 Tramore 6,123 7,684 3,808 3,876 1,561 25.5 1,643084 Woodstown 550 568 301 267 18 3.3 1,805
Youghal No. 2 rural area 2,805 2,899 1,473 1,426 94 3.4 14,414
085 Ardmore 679 694 343 351 15 2.2 1,255086 Ballyheeny 371 410 216 194 39 10.5 1,735087 Clashmore 388 385 199 186 -3 -0.8 1,865088 Glenwilliam 154 162 86 76 8 5.2 899089 Grallagh 175 178 91 87 3 1.7 1,922090 Grange 261 237 116 121 -24 -9.2 1,299091 Kinsalebeg 445 460 230 230 15 3.4 1,978092 Templemichael 332 373 192 181 41 12.3 3,461

Census 2002 Areas102
Table 6 (contd.) Population and area of each Province, County, City, urban area, rural area andElectoral Division, 1996 and 2002
District1996 2002 Change in population
1996-2002 Area*(hectares)
Persons Persons Males Females Actual Percentage
Connacht 433,231 464,296 233,194 231,102 31,065 7.2 1,771,318
Galway County and City 188,854 209,077 104,367 104,710 20,223 10.7 615,052
Galway City 57,241 65,832 31,015 34,817 8,591 15.0 5,057
001 Ballybaan 4,979 5,522 2,662 2,860 543 10.9 719002 Ballybrit 612 701 338 363 89 14.5 245003 Barna 7,031 10,822 5,039 5,783 3,791 53.9 675004 Castlegar 2,130 2,334 1,157 1,177 204 9.6 383005 Claddagh 2,747 2,856 1,343 1,513 109 4.0 74006 Dangan 4,901 4,923 2,192 2,731 22 0.4 157007 Eyre Square 3,463 4,066 2,049 2,017 603 17.4 93008 Knocknacarragh 1,341 1,567 737 830 226 16.9 208009 Lough Atalia 1,264 1,154 553 601 -110 -8.7 120010 Menlough 3,957 4,853 2,304 2,549 896 22.6 817011 Mervue 2,618 2,353 1,137 1,216 -265 -10.1 90012 Murroogh 1,850 2,219 1,092 1,127 369 19.9 293013 Newcastle 2,773 2,440 1,118 1,322 -333 -12.0 76014 Nuns Island 1,565 1,494 676 818 -71 -4.5 67015 Rahoon 2,152 2,340 1,117 1,223 188 8.7 489016 Renmore 1,779 1,664 824 840 -115 -6.5 87017 Rockbarton 1,901 1,867 863 1,004 -34 -1.8 72018 St. Nicholas 1,852 2,769 1,291 1,478 917 49.5 95019 Salthill 2,559 3,402 1,523 1,879 843 32.9 85020 Shantalla 2,062 1,974 928 1,046 -88 -4.3 55021 Taylors Hill 2,012 3,003 1,368 1,635 991 49.3 75022 Wellpark 1,693 1,509 704 805 -184 -10.9 82
Galway County 131,613 143,245 73,352 69,893 11,632 8.8 609,995
Ballinasloe Town 5,634 5,984 3,017 2,967 350 6.2 1,711
001 Ballinasloe Urban 5,634 5,984 3,017 2,967 350 6.2 1,711
Ballinasloe No. 1 rural area 8,064 8,169 4,228 3,941 105 1.3 49,230
002 Abbeygormacan 444 426 228 198 -18 -4.1 2,664003 Ahascragh 604 645 324 321 41 6.8 3,346004 Aughrim 521 546 275 271 25 4.8 2,478005 Ballinasloe Rural 558 588 294 294 30 5.4 1,880006 Ballymacward 289 288 151 137 -1 -0.3 1,748007 Clonfert 465 427 239 188 -38 -8.2 3,120008 Clontuskert 258 238 138 100 -20 -7.8 1,800009 Kellysgrove 339 343 190 153 4 1.2 2,325010 Kilconnell 620 674 338 336 54 8.7 2,865011 Killaan 540 524 268 256 -16 -3.0 3,371012 Killallaghtan 420 418 211 207 -2 -0.5 3,183013 Killoran 259 323 165 158 64 24.7 1,925014 Killure 705 714 368 346 9 1.3 3,668015 Kilmacshane 202 202 105 97 – – 3,028016 Kiltormer 612 605 295 310 -7 -1.1 2,627017 Kylemore 203 177 88 89 -26 -12.8 2,552018 Laurencetown 420 407 219 188 -13 -3.1 2,149019 Lismanny 246 261 140 121 15 6.1 2,223020 Oatfield 359 363 192 171 4 1.1 2,278
Clifden rural area 8,722 9,037 4,668 4,369 315 3.6 79,082
021 Ballynakill 466 506 272 234 40 8.6 4,643022 Bencorr 203 201 101 100 -2 -1.0 10,634023 Bunowen 425 448 244 204 23 5.4 2,990024 Cleggan 291 301 142 159 10 3.4 1,917025 Clifden 1,689 1,929 952 977 240 14.2 3,476026 Cushkillary 214 272 191 81 58 27.1 6,409027 Derrycunlagh 63 47 25 22 -16 -25.4 3,547028 Derrylea 261 230 129 101 -31 -11.9 4,228029 Doonloughan 86 109 67 42 23 26.7 1,432

Census 2002 Areas103
Table 6 (contd.) Population and area of each Province, County, City, urban area, rural area andElectoral Division, 1996 and 2002
District1996 2002 Change in population
1996-2002 Area*(hectares)
Persons Persons Males Females Actual Percentage
Galway County (contd.)
Clifden rural area (contd.)
030 Errislannan 275 259 133 126 -16 -5.8 2,063031 Illion 153 99 56 43 -54 -35.3 3,705032 Inishbofin 200 178 99 79 -22 -11.0 1,324033 Knockboy 906 831 400 431 -75 -8.3 3,623034 Moyrus 476 406 215 191 -70 -14.7 8,795035 Owengowla 334 341 191 150 7 2.1 5,442036 Rinvyle 1,095 1,365 666 699 270 24.7 5,534037 Roundstone 459 423 222 201 -36 -7.8 2,801038 Sillerna 459 444 230 214 -15 -3.3 2,358039 Skannive 667 648 333 315 -19 -2.8 4,161
Galway rural area 26,986 31,901 16,289 15,612 4,915 18.2 79,076
040 Annaghdown 1,290 1,551 806 745 261 20.2 4,867041 Aughrim 782 865 457 408 83 10.6 3,352042 Ballintemple (part) 971 1,096 579 517 125 12.9 1,516043 Ballynacourty 922 1,050 551 499 128 13.9 1,592044 Barna (part) 2,105 2,476 1,227 1,249 371 17.6 2,321045 Belleville 464 462 246 216 -2 -0.4 2,096046 Carnmore 1,582 1,989 1,037 952 407 25.7 1,931047 Carrowbrowne (part) 623 756 401 355 133 21.3 1,446048 Claregalway 1,102 1,635 806 829 533 48.4 2,633049 Clarinbridge 1,680 2,092 1,098 994 412 24.5 2,901050 Deerpark 905 1,069 568 501 164 18.1 1,849051 Furbogh 1,090 1,272 637 635 182 16.7 2,763052 Galway Rural (part) 157 131 77 54 -26 -16.6 1,068053 Inishmore 1,303 1,280 667 613 -23 -1.8 4,686054 Kilcummin 1,273 1,298 685 613 25 2.0 5,512055 Killannin 840 831 429 402 -9 -1.1 7,010056 Lackaghbeg 702 947 465 482 245 34.9 1,992057 Liscananaun 1,003 1,112 559 553 109 10.9 2,130058 Lisheenavalla 633 780 410 370 147 23.2 1,745059 Moycullen 1,020 1,402 690 712 382 37.5 2,712060 Oranmore 1,850 2,385 1,169 1,216 535 28.9 2,236061 Selerna 1,148 1,299 644 655 151 13.2 6,834062 Slieveaneena 587 649 333 316 62 10.6 5,795063 Spiddle 1,166 1,253 624 629 87 7.5 3,549064 Stradbally 611 854 437 417 243 39.8 1,636065 Tullokyne 1,177 1,367 687 680 190 16.1 2,904
Glennamaddy rural area 5,659 5,546 2,870 2,676 -113 -2.0 33,572
066 Ballinastack 297 326 167 159 29 9.8 1,673067 Ballymoe 422 431 220 211 9 2.1 2,180068 Ballynakill 475 408 208 200 -67 -14.1 2,984069 Boyounagh 263 275 145 130 12 4.6 1,584070 Creggs 408 384 195 189 -24 -5.9 3,370071 Curraghmore 171 168 91 77 -3 -1.8 2,051072 Glennamaddy 827 835 406 429 8 1.0 3,145073 Island 266 289 157 132 23 8.6 1,972074 Kilcroan 525 535 271 264 10 1.9 2,199075 Kiltullagh 193 181 98 83 -12 -6.2 1,590076 Raheen 453 442 242 200 -11 -2.4 2,294077 Scregg 221 210 113 97 -11 -5.0 1,937078 Shankill 330 308 160 148 -22 -6.7 1,883079 Templetogher 499 431 226 205 -68 -13.6 2,473080 Toberroe 309 323 171 152 14 4.5 2,237
Gort rural area 8,670 10,028 5,151 4,877 1,358 15.7 43,405
081 Ardamullivan 554 562 300 262 8 1.4 4,167082 Ardrahan 343 375 186 189 32 9.3 980083 Ballycahalan 193 176 98 78 -17 -8.8 2,995084 Beagh 487 547 273 274 60 12.3 3,584085 Cahermore 266 337 171 166 71 26.7 2,180086 Cappard 91 96 51 45 5 5.5 1,434087 Castletaylor 248 386 197 189 138 55.6 1,517088 Doorus 401 517 249 268 116 28.9 1,213

Census 2002 Areas104
Table 6 (contd.) Population and area of each Province, County, City, urban area, rural area andElectoral Division, 1996 and 2002
District1996 2002 Change in population
1996-2002 Area*(hectares)
Persons Persons Males Females Actual Percentage
Galway County (contd.)
Gort rural area (contd.)
089 Drumacoo 746 867 439 428 121 16.2 2,028090 Gort 1,450 1,809 918 891 359 24.8 1,121091 Kilbeacanty 262 274 149 125 12 4.6 1,850092 Killeely 673 975 514 461 302 44.9 2,687093 Killeenavarra 399 439 216 223 40 10.0 2,519094 Killinny 390 391 209 182 1 0.3 3,368095 Kiltartan 627 648 331 317 21 3.3 3,189096 Kilthomas 118 96 51 45 -22 -18.6 2,138097 Kinvarra 879 945 486 459 66 7.5 3,276098 Rahasane 224 241 132 109 17 7.6 1,570099 Skehanagh 319 347 181 166 28 8.8 1,589
Loughrea rural area 17,063 19,609 9,862 9,747 2,546 14.9 80,802
100 Aille 356 394 209 185 38 10.7 3,256101 Athenry 2,269 2,910 1,427 1,483 641 28.3 2,543102 Ballynagar 191 183 94 89 -8 -4.2 2,333103 Bracklagh 372 418 219 199 46 12.4 2,736104 Bullaun 191 182 101 81 -9 -4.7 1,362105 Cappalusk 320 324 173 151 4 1.2 2,994106 Castleboy 434 472 255 217 38 8.8 2,477107 Cloonkeen 251 274 146 128 23 9.2 2,085108 Colmanstown 111 104 53 51 -7 -6.3 989109 Craughwell 892 1,169 589 580 277 31.1 2,401110 Derrylaur 144 129 68 61 -15 -10.4 4,083111 Drumkeary 514 538 292 246 24 4.7 2,401112 Graigabbey 215 235 116 119 20 9.3 1,279113 Grange 667 677 341 336 10 1.5 3,546114 Greethill 514 654 320 334 140 27.2 2,317115 Kilchreest 302 303 157 146 1 0.3 2,355116 Kilconickny 337 469 250 219 132 39.2 1,565117 Kilconierin 286 311 166 145 25 8.7 1,949118 Killimor 338 321 168 153 -17 -5.0 2,635119 Killogilleen 402 490 257 233 88 21.9 2,525120 Kilmeen 528 544 281 263 16 3.0 3,029121 Kilreekill 292 278 138 140 -14 -4.8 2,248122 Kilteskill 246 266 131 135 20 8.1 2,068123 Kiltullagh 468 540 301 239 72 15.4 2,049124 Lackalea 163 220 112 108 57 35.0 1,241125 Leitrim 346 344 181 163 -2 -0.6 1,726126 Loughatorick 47 34 15 19 -13 -27.7 3,845127 Loughrea Rural 682 832 403 429 150 22.0 2,762128 Loughrea Urban 3,335 4,004 1,881 2,123 669 20.1 533129 Marblehill 349 363 194 169 14 4.0 3,566130 Mountain 207 246 128 118 39 18.8 2,432131 Movode 165 185 100 85 20 12.1 1,317132 Raford 308 320 161 159 12 3.9 1,571133 Tiaquin 351 397 201 196 46 13.1 2,232134 Woodford 470 479 234 245 9 1.9 2,352
Mount Bellew rural area 7,631 7,775 4,102 3,673 144 1.9 41,443
135 Annagh 346 340 179 161 -6 -1.7 2,308136 Ballynakill 531 514 262 252 -17 -3.2 3,364137 Caltra 332 333 192 141 1 0.3 1,514138 Castleblakeney 458 429 224 205 -29 -6.3 1,491139 Castleffrench 477 451 248 203 -26 -5.5 3,449140 Clonbrock 510 499 278 221 -11 -2.2 3,366141 Cloonkeen 344 303 164 139 -41 -11.9 2,119142 Cooloo 476 508 266 242 32 6.7 2,789143 Derryglassaun 723 744 391 353 21 2.9 2,820144 Killeroran 1,160 1,247 637 610 87 7.5 5,540145 Killian 368 304 164 140 -64 -17.4 2,662146 Mount Bellew 1,309 1,481 775 706 172 13.1 4,381147 Mounthazel 379 404 207 197 25 6.6 3,044148 Taghboy 218 218 115 103 – – 2,596

Census 2002 Areas105
Table 6 (contd.) Population and area of each Province, County, City, urban area, rural area andElectoral Division, 1996 and 2002
District1996 2002 Change in population
1996-2002 Area*(hectares)
Persons Persons Males Females Actual Percentage
Galway County (contd.)
Oughterard rural area 10,960 11,600 5,984 5,616 640 5.8 81,654
149 Camus 395 388 197 191 -7 -1.8 3,597150 Cloonbur 1,008 916 480 436 -92 -9.1 5,876151 Cong 536 512 273 239 -24 -4.5 9,282152 Crumpaun 2,167 2,266 1,144 1,122 99 4.6 3,452153 Cur 191 159 82 77 -32 -16.8 4,552154 Gorumna 1,320 1,290 669 621 -30 -2.3 3,024155 Kilcummin 129 118 72 46 -11 -8.5 6,006156 Letterbrickaun 190 220 123 97 30 15.8 5,811157 Letterfore 268 296 152 144 28 10.4 8,995158 Lettermore 811 812 421 391 1 0.1 1,632159 Oughterard 1,891 2,380 1,214 1,166 489 25.9 11,963160 Ross 113 111 61 50 -2 -1.8 5,082161 Turlough 545 477 251 226 -68 -12.5 6,324162 Wormhole 1,396 1,655 845 810 259 18.6 6,058
Portumna rural area 6,193 6,082 3,140 2,942 -111 -1.8 33,874
163 Abbeyville 295 270 135 135 -25 -8.5 1,791164 Ballyglass 185 179 87 92 -6 -3.2 1,381165 Coos 138 140 72 68 2 1.4 3,479166 Derrew 210 173 84 89 -37 -17.6 1,513167 Drummin 379 350 181 169 -29 -7.7 4,085168 Eyrecourt 548 532 261 271 -16 -2.9 1,758169 Killimor 690 674 350 324 -16 -2.3 2,437170 Kilmalinoge 231 223 108 115 -8 -3.5 2,009171 Kilquain 303 300 153 147 -3 -1.0 2,193172 Meelick 248 231 125 106 -17 -6.9 2,621173 Moat 140 158 82 76 18 12.9 1,122174 Pallas 427 399 217 182 -28 -6.6 2,068175 Portumna 1,837 1,920 1,001 919 83 4.5 4,844176 Tiranascragh 181 164 91 73 -17 -9.4 1,188177 Tynagh 381 369 193 176 -12 -3.1 1,385
Tuam rural area 26,031 27,514 14,041 13,473 1,483 5.7 86,146
178 Abbey East 595 597 302 295 2 0.3 2,183179 Abbey West 442 481 245 236 39 8.8 1,608180 Addergoole 502 497 266 231 -5 -1.0 2,492181 Annaghdown 965 1,075 553 522 110 11.4 2,248182 Ballinderry 230 292 152 140 62 27.0 1,295183 Ballinduff 350 513 251 262 163 46.6 1,481184 Ballynapark 612 665 358 307 53 8.7 2,058185 Beaghmore 244 244 131 113 – – 1,873186 Belclare 658 654 329 325 -4 -0.6 2,484187 Carrownagur 379 381 200 181 2 0.5 2,977188 Carrowrevagh 418 408 212 196 -10 -2.4 2,058189 Claretuam 897 943 504 439 46 5.1 2,932190 Clonbern 375 372 208 164 -3 -0.8 2,570191 Cloonkeen 390 417 219 198 27 6.9 2,045192 Cummer 573 706 355 351 133 23.2 1,555193 Donaghpatrick 438 483 249 234 45 10.3 1,615194 Doonbally 472 447 227 220 -25 -5.3 2,952195 Dunmore North 574 544 287 257 -30 -5.2 2,538196 Dunmore South 663 813 402 411 150 22.6 1,430197 Foxhall 612 563 294 269 -49 -8.0 3,226198 Headford 1,116 1,281 644 637 165 14.8 1,999199 Hillsbrook 660 639 332 307 -21 -3.2 2,343200 Kilbennan 336 339 187 152 3 0.9 1,415201 Kilcoona 408 475 218 257 67 16.4 1,992202 Killeany 383 456 227 229 73 19.1 1,997203 Killeen 533 598 296 302 65 12.2 2,263204 Killererin 671 675 344 331 4 0.6 2,227205 Killower 600 701 349 352 101 16.8 3,294206 Killursa 713 785 411 374 72 10.1 4,254207 Kilmoylan 618 700 385 315 82 13.3 2,256208 Kilshanvy 375 373 186 187 -2 -0.5 2,070209 Levally 367 338 167 171 -29 -7.9 2,026210 Milltown 569 538 287 251 -31 -5.4 2,793211 Monivea 548 564 295 269 16 2.9 2,074212 Moyne 644 645 342 303 1 0.2 2,056213 Ryehill 366 403 226 177 37 10.1 1,740214 Toberadosh 339 340 172 168 1 0.3 1,985215 Tuam Rural 2,909 3,465 1,709 1,756 556 19.1 3,496216 Tuam Urban 3,487 3,104 1,520 1,584 -383 -11.0 246

Census 2002 Areas106
Table 6 (contd.) Population and area of each Province, County, City, urban area, rural area andElectoral Division, 1996 and 2002
District1996 2002 Change in population
1996-2002 Area*(hectares)
Persons Persons Males Females Actual Percentage
Leitrim County 25,057 25,799 13,324 12,475 742 3.0 158,885
Ballinamore rural area 3,205 3,059 1,562 1,497 -146 -4.6 17,693
001 Ballinamore 1,016 997 480 517 -19 -1.9 1,820002 Cloverhill 326 311 161 150 -15 -4.6 1,937003 Corrala 211 211 115 96 – – 1,581004 Drumreilly North 189 150 80 70 -39 -20.6 1,276005 Drumreilly South 163 129 69 60 -34 -20.9 1,077006 Garadice 513 520 252 268 7 1.4 2,282007 Greaghglass 261 266 141 125 5 1.9 1,486008 Killygar 137 125 71 54 -12 -8.8 1,264009 Newtowngore 212 201 108 93 -11 -5.2 1,594010 Oughteragh 101 90 52 38 -11 -10.9 1,079011 Stralongford 76 59 33 26 -17 -22.4 2,297
Carrick-on-Shannon No. 1 rural area 6,117 6,669 3,342 3,327 552 9.0 27,427
012 Aghacashel 86 74 37 37 -12 -14.0 1,019013 Annaduff 176 164 86 78 -12 -6.8 1,196014 Barnameenagh 146 128 72 56 -18 -12.3 2,994015 Carrick-on-Shannon 2,148 2,663 1,260 1,403 515 24.0 2,426016 Drumreilly East 88 71 40 31 -17 -19.3 1,871017 Drumreilly West 107 110 63 47 3 2.8 2,822018 Drumshanbo 971 977 492 485 6 0.6 1,593019 Drumsna 499 532 285 247 33 6.6 2,173020 Gortnagullion 254 234 122 112 -20 -7.9 1,826021 Gowel 263 295 153 142 32 12.2 1,351022 Keshcarrigan 214 270 136 134 56 26.2 1,043023 Kiltubbrid 143 124 63 61 -19 -13.3 1,225024 Leitrim 587 618 319 299 31 5.3 2,294025 Moher 197 181 94 87 -16 -8.1 1,693026 Yugan 238 228 120 108 -10 -4.2 1,901
Kinlough rural area 1,656 1,912 1,022 890 256 15.5 14,945
027 Aghalateeve 88 94 50 44 6 6.8 1,380028 Aghanlish 142 132 70 62 -10 -7.0 2,362029 Aghavoghill 39 40 22 18 1 2.6 1,750030 Gubacreeny 377 463 247 216 86 22.8 2,423031 Kinlough 454 498 269 229 44 9.7 2,236032 Melvin 133 165 83 82 32 24.1 2,260033 Tullaghan 423 520 281 239 97 22.9 2,534
Manorhamilton rural area 6,724 6,769 3,541 3,228 45 0.7 60,741
034 Arigna 29 15 9 6 -14 -48.3 1,783035 Ballaghameehan 237 200 113 87 -37 -15.6 2,814036 Belhavel 265 257 131 126 -8 -3.0 2,166037 Cloonclare 175 184 96 88 9 5.1 1,989038 Cloonlogher 274 263 131 132 -11 -4.0 3,332039 Drumahaire 889 973 480 493 84 9.4 3,426040 Drumkeeran 488 523 274 249 35 7.2 2,803041 Garvagh 128 119 62 57 -9 -7.0 1,795042 Glenade 153 153 89 64 – – 2,849043 Glenaniff 170 160 85 75 -10 -5.9 3,333044 Glenboy 170 212 97 115 42 24.7 2,576045 Glencar 220 239 130 109 19 8.6 3,694046 Glenfarn 129 121 66 55 -8 -6.2 1,906047 Killanummery 326 346 181 165 20 6.1 2,079048 Killarga 88 100 56 44 12 13.6 3,294049 Kiltyclogher 255 254 133 121 -1 -0.4 3,166050 Lurganboy 342 363 199 164 21 6.1 2,966051 Mahanagh 285 265 154 111 -20 -7.0 3,397052 Manorhamilton 1,479 1,422 736 686 -57 -3.9 3,363053 Munakill 213 191 106 85 -22 -10.3 2,119054 Sramore 269 268 131 137 -1 -0.4 2,987055 St. Patrick’s 140 141 82 59 1 0.7 2,904

Census 2002 Areas107
Table 6 (contd.) Population and area of each Province, County, City, urban area, rural area andElectoral Division, 1996 and 2002
District1996 2002 Change in population
1996-2002 Area*(hectares)
Persons Persons Males Females Actual Percentage
Leitrim County (contd.)
Mohill rural area 7,355 7,390 3,857 3,533 35 0.5 38,079
056 Aghavas 300 284 159 125 -16 -5.3 1,630057 Beihy 349 306 166 140 -43 -12.3 2,229058 Breandrum 267 267 138 129 – – 1,662059 Bunnybeg 139 146 72 74 7 5.0 1,311060 Carrigallen East 260 281 155 126 21 8.1 1,402061 Carrigallen West 373 400 202 198 27 7.2 1,574062 Cashel 177 156 80 76 -21 -11.9 1,143063 Castlefore 194 227 116 111 33 17.0 1,408064 Cattan 274 261 132 129 -13 -4.7 1,667065 Cloone 364 321 164 157 -43 -11.8 1,804066 Corriga 182 172 89 83 -10 -5.5 1,239067 Drumard 228 229 113 116 1 0.4 1,268068 Drumdoo 315 319 157 162 4 1.3 1,557069 Drumod 424 511 271 240 87 20.5 2,218070 Fenagh 283 318 169 149 35 12.4 1,539071 Gortermone 284 296 155 141 12 4.2 1,655072 Keeldra 237 235 124 111 -2 -0.8 1,531073 Lisgillock 219 209 113 96 -10 -4.6 1,425074 Mohill 1,318 1,328 667 661 10 0.8 2,233075 Rinn 247 245 138 107 -2 -0.8 1,861076 Riverstown 269 249 136 113 -20 -7.4 2,183077 Roosky 425 404 212 192 -21 -4.9 1,858078 Rowan 227 226 129 97 -1 -0.4 1,682
Mayo County 111,524 117,446 59,149 58,297 5,922 5.3 558,831
Ballina Town 6,852 9,478 4,583 4,895 2,626 38.3 1,451
001 Ardnaree South Urban 2,124 2,367 1,092 1,275 243 11.4 170002 Ballina Urban 4,728 4,627 2,246 2,381 -101 -2.1 268006 Ardnaree North (part) – 349 176 173 349 – 82007 Ardnaree South Rural (part) – 939 470 469 939 – 232010 Ballina Rural (part) – 1,196 599 597 1,196 – 699
Castlebar Town 6,585 10,287 4,908 5,379 3,702 56.2 1,099
003 Castlebar Urban 6,585 6,585 3,141 3,444 – – 399074 Castlebar Rural (part) – 3,702 1,767 1,935 3,702 – 700
Westport Town 4,253 5,314 2,447 2,867 1,061 24.9 821
004 Westport Urban 4,253 5,314 2,447 2,867 1,061 24.9 812144 Kilmeena (part) – – – – – – 9
Ballina rural area 17,178 15,041 7,781 7,260 -2,137 -12.4 106,515
005 Ardagh 338 314 156 158 -24 -7.1 1,886006 Ardnaree North (part) 835 571 304 267 -264 -31.6 1,759007 Ardnaree South Rural (part) 1,367 748 380 368 -619 -45.3 1,710008 Attymass East 366 371 182 189 5 1.4 2,100009 Attymass West 247 223 110 113 -24 -9.7 2,008010 Ballina Rural (part) 1,966 1,087 562 525 -879 -44.7 2,692011 Ballycastle 690 675 332 343 -15 -2.2 6,374012 Ballysakeery 514 523 283 240 9 1.8 2,776013 Beldergmore 219 199 107 92 -20 -9.1 7,971014 Bunaveela 128 117 67 50 -11 -8.6 5,446015 Carrowmore 735 768 391 377 33 4.5 3,441016 Crossmolina North 1,039 924 473 451 -115 -11.1 2,828017 Crossmolina South 805 779 401 378 -26 -3.2 3,873018 Deel 564 551 297 254 -13 -2.3 4,307019 Derry 268 236 124 112 -32 -11.9 6,542020 Fortland 461 476 248 228 15 3.3 2,456021 Kilfian East 281 233 124 109 -48 -17.1 2,477022 Kilfian South 286 250 141 109 -36 -12.6 7,466023 Kilfian West 190 151 84 67 -39 -20.5 8,647024 Kilgarvan 724 749 395 354 25 3.5 5,506025 Killala 1,370 1,321 672 649 -49 -3.6 4,122026 Lackan North 377 350 186 164 -27 -7.2 3,485027 Lackan South 471 454 237 217 -17 -3.6 2,026028 Letterbrick 186 188 114 74 2 1.1 3,494029 Mount Falcon 1,145 1,178 609 569 33 2.9 3,783030 Rathoma 242 231 111 120 -11 -4.5 1,763031 Sallymount 486 464 232 232 -22 -4.5 2,938032 Sraheen 878 910 459 451 32 3.6 2,639

Census 2002 Areas108
Table 6 (contd.) Population and area of each Province, County, City, urban area, rural area andElectoral Division, 1996 and 2002
District1996 2002 Change in population
1996-2002 Area*(hectares)
Persons Persons Males Females Actual Percentage
Mayo County (contd.)
Ballinrobe rural area 11,342 11,923 6,176 5,747 581 5.1 69,535
033 Ballinchalla 227 236 128 108 9 4.0 4,736034 Ballinrobe 2,136 2,536 1,296 1,240 400 18.7 5,534035 Ballyovey 254 218 109 109 -36 -14.2 3,307036 Burriscarra 449 447 239 208 -2 -0.4 2,856037 Cappaghduff 343 341 175 166 -2 -0.6 4,721038 Cong 652 750 397 353 98 15.0 3,548039 Coonard 278 258 131 127 -20 -7.2 1,813040 Dalgan 1,018 1,037 549 488 19 1.9 3,533041 Hollymount 708 762 380 382 54 7.6 3,488042 Houndswood 566 553 296 257 -13 -2.3 3,281043 Kilcommon 659 657 336 321 -2 -0.3 3,967044 Kilmaine 944 943 492 451 -1 -0.1 4,009045 Neale 669 674 373 301 5 0.7 4,932046 Newbrook 530 522 260 262 -8 -1.5 3,718047 Owenbrin 285 245 129 116 -40 -14.0 5,718048 Portroyal 482 479 235 244 -3 -0.6 4,601049 Roslee 358 376 189 187 18 5.0 1,653050 Shrule 784 889 462 427 105 13.4 4,120
Belmullet rural area 8,339 7,927 4,002 3,925 -412 -4.9 73,715
051 An Geata Mór Thuaidh 898 883 445 438 -15 -1.7 4,330052 An Geata Mór Theas 993 929 489 440 -64 -6.4 4,195053 Bangor 464 463 223 240 -1 -0.2 4,668054 Barroosky 159 134 69 65 -25 -15.7 4,822055 Belmullet 1,884 1,880 921 959 -4 -0.2 4,530056 Glenamoy 270 248 134 114 -22 -8.1 5,799057 Glencastle 483 490 245 245 7 1.4 3,699058 Glenco 114 100 44 56 -14 -12.3 10,994059 Goolamore 194 168 80 88 -26 -13.4 3,642060 Knockadaff 470 389 213 176 -81 -17.2 3,308061 Knocknalower 867 847 426 421 -20 -2.3 4,641062 Muingnabo 363 309 145 164 -54 -14.9 6,330063 Muings 277 258 142 116 -19 -6.9 3,286064 Rathhill 873 804 411 393 -69 -7.9 4,133065 Sheskin 30 25 15 10 -5 -16.7 5,338
Castlebar rural area 13,920 12,952 6,651 6,301 -968 -7.0 58,485
066 Addergoole 675 709 375 334 34 5.0 5,261067 Balla 1,182 1,213 610 603 31 2.6 3,617068 Ballinafad 429 436 232 204 7 1.6 2,191069 Ballyhean 482 487 238 249 5 1.0 1,674070 Ballynagoraher 371 385 196 189 14 3.8 4,479071 Bellavary 861 914 469 445 53 6.2 3,319072 Breaghwy 1,215 1,361 693 668 146 12.0 2,415073 Burren 292 276 154 122 -16 -5.5 3,717074 Castlebar Rural (part) 3,420 2,180 1,059 1,121 -1,240 -36.3 3,337075 Clogher 502 488 258 230 -14 -2.8 2,039076 Cloonkeen 791 753 399 354 -38 -4.8 2,679077 Croaghmoyle 181 188 102 86 7 3.9 3,149078 Killavally 418 402 212 190 -16 -3.8 2,348079 Manulla 765 789 422 367 24 3.1 3,090080 Pontoon 425 381 219 162 -44 -10.4 4,962081 Strade 597 602 304 298 5 0.8 3,554082 Tawnynagry 405 366 191 175 -39 -9.6 3,536083 Turlough 909 1,022 518 504 113 12.4 3,118
Claremorris rural area 12,618 12,970 6,517 6,453 352 2.8 44,931
084 Ballindine 746 814 384 430 68 9.1 2,230085 Ballyhaunis 2,022 2,149 1,137 1,012 127 6.3 2,988086 Ballyhowly 442 438 205 233 -4 -0.9 2,181087 Bekan 748 732 387 345 -16 -2.1 3,520088 Caraun 333 339 182 157 6 1.8 2,286089 Claremorris 2,431 2,685 1,245 1,440 254 10.4 2,290090 Cloghermore 196 185 103 82 -11 -5.6 1,357091 Course 471 414 217 197 -57 -12.1 2,532

Census 2002 Areas109
Table 6 (contd.) Population and area of each Province, County, City, urban area, rural area andElectoral Division, 1996 and 2002
District1996 2002 Change in population
1996-2002 Area*(hectares)
Persons Persons Males Females Actual Percentage
Mayo County (contd.)
Claremorris rural area (contd.)
092 Crossboyne 405 493 261 232 88 21.7 1,390093 Culnacleha 491 460 254 206 -31 -6.3 2,922094 Garrymore 459 443 249 194 -16 -3.5 2,485095 Kilcolman 413 466 229 237 53 12.8 2,033096 Kilvine 623 585 308 277 -38 -6.1 2,670097 Knock North 685 670 332 338 -15 -2.2 2,676098 Knock South 741 734 310 424 -7 -0.9 2,726099 Loughanboy 371 354 189 165 -17 -4.6 2,377100 Mayo 408 426 225 201 18 4.4 2,690101 Murneen 420 399 209 190 -21 -5.0 2,378102 Tagheen 213 184 91 93 -29 -13.6 1,200
Swineford rural area 14,932 15,292 7,746 7,546 360 2.4 61,409
103 Aghamore 596 589 319 270 -7 -1.2 2,607104 Ballinamore 328 394 195 199 66 20.1 1,977105 Bohola 214 205 108 97 -9 -4.2 1,205106 Brackloon 592 573 309 264 -19 -3.2 3,061107 Callow 364 392 198 194 28 7.7 3,105108 Cloonmore 509 508 274 234 -1 -0.2 3,102109 Coolnaha 497 459 246 213 -38 -7.6 2,335110 Cuildoo 437 363 189 174 -74 -16.9 2,204111 Doocastle 470 402 221 181 -68 -14.5 3,631112 Kilbeagh 896 963 504 459 67 7.5 3,876113 Kilkelly 862 839 442 397 -23 -2.7 4,080114 Killedan 639 648 331 317 9 1.4 2,496115 Kilmovee 600 613 310 303 13 2.2 3,270116 Kiltamagh 1,239 1,386 693 693 147 11.9 1,892117 Meelick 553 517 271 246 -36 -6.5 2,463118 Sonnagh 1,147 1,206 553 653 59 5.1 3,950119 Swineford 2,529 2,724 1,315 1,409 195 7.7 4,016120 Toocananagh 359 351 186 165 -8 -2.2 1,616121 Toomore 1,263 1,312 640 672 49 3.9 3,556122 Tumgesh 363 325 167 158 -38 -10.5 2,884123 Urlaur 475 523 275 248 48 10.1 4,083
Westport rural area 15,505 16,262 8,338 7,924 757 4.9 140,870
124 Achill 1,024 958 485 473 -66 -6.4 3,569125 Aghagower North 618 735 362 373 117 18.9 2,249126 Aghagower South 171 140 80 60 -31 -18.1 2,306127 Aillemore 391 373 199 174 -18 -4.6 3,020128 Ballycroy North 338 315 169 146 -23 -6.8 8,343129 Ballycroy South 413 353 198 155 -60 -14.5 12,703130 Bundorragha 59 97 49 48 38 64.4 4,302131 Clare Island 219 199 117 82 -20 -9.1 2,291132 Clogher 652 743 395 348 91 14.0 2,207133 Corraun Achill 713 744 385 359 31 4.3 7,403134 Croaghpatrick 415 448 231 217 33 8.0 2,941135 Derryloughan 577 548 282 266 -29 -5.0 2,846136 Dooega 706 673 316 357 -33 -4.7 4,188137 Drummin 201 186 96 90 -15 -7.5 5,478138 Emlagh 280 267 148 119 -13 -4.6 2,635139 Erriff 121 107 63 44 -14 -11.6 8,264140 Glenhest 241 212 109 103 -29 -12.0 4,586141 Islandeady 895 915 487 428 20 2.2 4,202142 Kilgeever 142 127 78 49 -15 -10.6 6,173143 Kilmaclasser 490 539 272 267 49 10.0 2,353144 Kilmeena (part) 967 1,170 625 545 203 21.0 3,613145 Kilsallagh 390 442 223 219 52 13.3 3,684146 Knappagh 475 609 305 304 134 28.2 2,574147 Louisburgh 662 755 369 386 93 14.0 2,326148 Newport East 956 935 468 467 -21 -2.2 3,802149 Newport West 635 701 349 352 66 10.4 6,933150 Owennadornaun 97 96 46 50 -1 -1.0 2,812151 Slievemahanagh 372 398 210 188 26 7.0 5,868152 Slievemore 1,036 1,028 505 523 -8 -0.8 7,207153 Srahmore 128 113 54 59 -15 -11.7 8,625154 Westport Rural 1,121 1,336 663 673 215 19.2 1,367

Census 2002 Areas110
Table 6 (contd.) Population and area of each Province, County, City, urban area, rural area andElectoral Division, 1996 and 2002
District1996 2002 Change in population
1996-2002 Area*(hectares)
Persons Persons Males Females Actual Percentage
Roscommon County 51,975 53,774 27,583 26,191 1,799 3.5 254,804
Athlone No. 2 rural area 11,482 12,460 6,340 6,120 978 8.5 50,626
001 Athlone West Rural 1,794 2,262 1,120 1,142 468 26.1 1,954002 Ballydangan 630 623 323 300 -7 -1.1 3,200003 Ballynamona 422 493 234 259 71 16.8 1,992004 Caltragh 232 220 108 112 -12 -5.2 1,449005 Carnagh 486 567 290 277 81 16.7 3,184006 Carrowreagh 484 446 229 217 -38 -7.9 2,843007 Castlesampson 345 371 184 187 26 7.5 2,858008 Cloonburren 204 199 101 98 -5 -2.5 1,804009 Cloonown 206 210 103 107 4 1.9 1,126010 Crannagh 826 1,058 518 540 232 28.1 2,564011 Creagh 1,034 1,060 535 525 26 2.5 2,818012 Culliagh 219 197 100 97 -22 -10.0 1,590013 Drumlosh 294 304 159 145 10 3.4 1,265014 Dysart 207 213 117 96 6 2.9 2,384015 Kilcar 301 290 143 147 -11 -3.7 1,570016 Kiltoom 1,311 1,468 771 697 157 12.0 3,230017 Lecarrow 278 266 149 117 -12 -4.3 2,520018 Moore 282 260 143 117 -22 -7.8 2,028019 Rockhill 295 279 142 137 -16 -5.4 1,985020 Taghboy 362 386 210 176 24 6.6 1,813021 Taghmaconnell 276 268 145 123 -8 -2.9 1,914022 Thomastown 722 733 365 368 11 1.5 2,411023 Turrock 272 287 151 136 15 5.5 2,124
Boyle No. 1 rural area 9,053 8,946 4,628 4,318 -107 -1.2 51,977
024 Aghafin 152 138 77 61 -14 -9.2 1,771025 Altagowlan 70 60 34 26 -10 -14.3 1,021026 Aughrim East 222 206 102 104 -16 -7.2 2,050027 Aughrim West 172 176 92 84 4 2.3 1,851028 Ballyfarnan 261 234 130 104 -27 -10.3 757029 Ballyfermoyle 156 144 74 70 -12 -7.7 1,221030 Boyle Rural 993 970 485 485 -23 -2.3 2,610031 Boyle Urban 1,690 1,643 811 832 -47 -2.8 304032 Breedoge 262 264 145 119 2 0.8 1,907033 Cloonteen 220 255 132 123 35 15.9 1,814034 Creeve 158 149 87 62 -9 -5.7 1,420035 Croghan 274 256 132 124 -18 -6.6 2,395036 Crossna 172 172 102 70 – – 1,802037 Danesfort 538 583 302 281 45 8.4 1,328038 Estersnow 87 98 47 51 11 12.6 1,203039 Keadew 444 454 235 219 10 2.3 2,342040 Kilbryan 270 301 151 150 31 11.5 2,645041 Kilcolagh 82 85 46 39 3 3.7 1,135042 Killukin 218 226 123 103 8 3.7 1,252043 Killummod 110 90 48 42 -20 -18.2 1,218044 Kilmacumsy 205 183 92 91 -22 -10.7 1,888045 Kilmore 198 158 88 70 -40 -20.2 1,908046 Lisgarve 155 139 84 55 -16 -10.3 1,646047 Lough Allen 275 270 131 139 -5 -1.8 1,033048 Mantua 104 75 37 38 -29 -27.9 1,576049 Oakport 218 235 128 107 17 7.8 1,534050 Rockingham 373 379 196 183 6 1.6 3,104051 Rushfield 371 423 215 208 52 14.0 2,037052 Tivannagh 236 236 124 112 – – 2,137053 Tumna North 152 170 86 84 18 11.8 1,390054 Tumna South 215 174 92 82 -41 -19.1 1,678
Castlereagh rural area 13,697 13,927 7,224 6,703 230 1.7 66,626
055 Artagh North 744 802 427 375 58 7.8 3,764056 Artagh South 453 435 228 207 -18 -4.0 3,615057 Ballaghaderreen 2,140 2,319 1,175 1,144 179 8.4 4,461058 Ballinlough 958 948 493 455 -10 -1.0 5,079059 Ballintober 699 686 342 344 -13 -1.9 3,914060 Baslick 163 147 85 62 -16 -9.8 1,713061 Bellanagare 598 536 272 264 -62 -10.4 5,019062 Buckill 378 387 205 182 9 2.4 2,267063 Carrowduff 196 189 95 94 -7 -3.6 1,845064 Castleplunket 514 483 249 234 -31 -6.0 3,760065 Castlereagh 2,571 2,689 1,424 1,265 118 4.6 4,008066 Castleteheen 379 314 149 165 -65 -17.2 2,040067 Cloonfower 328 295 159 136 -33 -10.1 3,464

Census 2002 Areas111
Table 6 (contd.) Population and area of each Province, County, City, urban area, rural area andElectoral Division, 1996 and 2002
District1996 2002 Change in population
1996-2002 Area*(hectares)
Persons Persons Males Females Actual Percentage
Roscommon County (contd.)
Castlereagh rural area (contd.)
068 Coolougher 514 497 266 231 -17 -3.3 3,820069 Edmondstown 375 418 232 186 43 11.5 3,338070 Fairymount 367 350 191 159 -17 -4.6 3,352071 Frenchpark 722 793 409 384 71 9.8 3,332072 Kiltullagh 866 906 476 430 40 4.6 4,473073 Loughglinn 732 733 347 386 1 0.1 3,362
Roscommon rural area 17,743 18,441 9,391 9,050 698 3.9 85,575
074 Annaghmore 305 318 180 138 13 4.3 1,825075 Athleague East 332 340 194 146 8 2.4 2,778076 Athleague West 449 482 247 235 33 7.3 2,341077 Ballygarden 186 180 89 91 -6 -3.2 1,845078 Bumlin 315 335 173 162 20 6.3 2,424079 Cams 366 409 202 207 43 11.7 2,438080 Cloonfinlough 191 183 103 80 -8 -4.2 1,798081 Cloontuskert 959 973 480 493 14 1.5 3,020082 Cloonygormican 447 431 214 217 -16 -3.6 2,759083 Cloonyquin 304 289 158 131 -15 -4.9 2,117084 Creeve 138 131 75 56 -7 -5.1 1,388085 Cregga 178 161 82 79 -17 -9.6 1,463086 Drumdaff 386 363 180 183 -23 -6.0 2,082087 Dunamon 300 310 156 154 10 3.3 2,093088 Elia 129 112 62 50 -17 -13.2 1,162089 Elphin 699 711 358 353 12 1.7 1,519090 Fuerty 604 631 313 318 27 4.5 3,159091 Kilbride North 356 348 175 173 -8 -2.2 2,043092 Kilbride South 306 309 156 153 3 1.0 2,733093 Kilgefin 293 280 136 144 -13 -4.4 2,131094 Kilglass North 377 390 211 179 13 3.4 2,704095 Kilglass South 292 293 146 147 1 0.3 2,484096 Killavackan 182 182 102 80 – – 1,380097 Killukin 246 217 123 94 -29 -11.8 1,670098 Kilteevan 319 333 166 167 14 4.4 3,632099 Lackan 310 277 142 135 -33 -10.6 2,340100 Lismaha 356 330 166 164 -26 -7.3 2,502101 Lissonuffy 169 163 88 75 -6 -3.6 2,843102 Mote 587 610 328 282 23 3.9 3,279103 Ogulla 249 251 127 124 2 0.8 1,947104 Roosky 448 505 267 238 57 12.7 2,137105 Roscommon Rural 3,335 3,694 1,824 1,870 359 10.8 4,491106 Roscommon Urban 1,432 1,623 784 839 191 13.3 151107 Rosmoylan 193 173 91 82 -20 -10.4 1,895108 Rossmore 176 170 94 76 -6 -3.4 1,811109 Scregg 368 378 203 175 10 2.7 1,850110 Strokestown 873 943 473 470 70 8.0 1,809111 Termonbarry 366 398 213 185 32 8.7 1,639112 Tulsk 222 215 110 105 -7 -3.2 1,893
Sligo County 55,821 58,200 28,771 29,429 2,379 4.3 183,746
Sligo Borough 17,786 18,473 8,569 9,904 687 3.9 1,290
001 Sligo East 5,961 5,568 2,603 2,965 -393 -6.6 346002 Sligo North 5,041 5,745 2,659 3,086 704 14.0 427003 Sligo West 6,784 7,160 3,307 3,853 376 5.5 517
Boyle No. 2 rural area 4,277 4,165 2,222 1,943 -112 -2.6 33,033
004 Aghanagh 236 249 128 121 13 5.5 2,871005 Ballynashee 232 243 131 112 11 4.7 2,770006 Coolavin 390 393 206 187 3 0.8 3,228007 Cuilmore 592 510 273 237 -82 -13.9 2,682008 Drumrat 448 413 224 189 -35 -7.8 2,241009 Kilfree 447 465 238 227 18 4.0 1,737010 Killadoon 300 302 163 139 2 0.7 2,264011 Killaraght 411 413 213 200 2 0.5 4,167012 Kilmactranny 308 335 187 148 27 8.8 2,914013 Kilshalvy 298 262 145 117 -36 -12.1 2,193014 Shancough 154 134 73 61 -20 -13.0 1,966015 Templevanny 217 221 121 100 4 1.8 2,348016 Toomour 244 225 120 105 -19 -7.8 1,652

Census 2002 Areas112
Table 6 (contd.) Population and area of each Province, County, City, urban area, rural area andElectoral Division, 1996 and 2002
District1996 2002 Change in population
1996-2002 Area*(hectares)
Persons Persons Males Females Actual Percentage
Sligo County (contd.)
Dromore West rural area 6,446 6,468 3,343 3,125 22 0.3 39,482
017 Aughris 191 186 90 96 -5 -2.6 944018 Buncrowey 393 349 179 170 -44 -11.2 2,596019 Castleconor East 267 257 135 122 -10 -3.7 2,889020 Castleconor West 887 825 425 400 -62 -7.0 3,689021 Dromard East 203 161 81 80 -42 -20.7 1,292022 Dromard West 128 164 91 73 36 28.1 1,505023 Dromore 328 308 166 142 -20 -6.1 1,222024 Easky East 522 535 286 249 13 2.5 1,974025 Easky West 658 698 367 331 40 6.1 2,815026 Kilglass 1,132 1,245 615 630 113 10.0 2,366027 Mullagheruse 58 49 26 23 -9 -15.5 5,387028 Rathmacurkey 572 558 313 245 -14 -2.4 3,184029 Skreen 147 159 81 78 12 8.2 3,039030 Templeboy North 296 280 140 140 -16 -5.4 1,307031 Templeboy South 194 194 91 103 – – 2,908032 Toberpatrick East 222 219 103 116 -3 -1.4 1,077033 Toberpatrick West 248 281 154 127 33 13.3 1,288
Sligo rural area 20,267 21,945 10,947 10,998 1,678 8.3 58,731
034 Ballintogher East 388 430 231 199 42 10.8 2,657035 Ballintogher West 375 384 198 186 9 2.4 2,243036 Ballymote 1,417 1,405 705 700 -12 -0.8 2,518037 Ballynakill 259 283 144 139 24 9.3 2,012038 Ballysadare East 984 1,215 584 631 231 23.5 1,377039 Ballysadare West 320 319 157 162 -1 -0.3 1,958040 Bricklieve 214 216 102 114 2 0.9 1,499041 Calry 1,702 1,836 917 919 134 7.9 4,514042 Carney 664 707 356 351 43 6.5 2,265043 Carrickbanagher 518 561 289 272 43 8.3 1,901044 Cliffony North 721 760 386 374 39 5.4 1,983045 Cliffony South 542 618 311 307 76 14.0 1,966046 Collooney 1,107 1,255 626 629 148 13.4 2,674047 Drumcliff East 890 855 447 408 -35 -3.9 1,403048 Drumcliff West 2,029 1,929 890 1,039 -100 -4.9 1,452049 Drumcolumb 275 277 138 139 2 0.7 2,395050 Drumfin 300 338 174 164 38 12.7 1,830051 Glencar 215 210 108 102 -5 -2.3 1,401052 Kilmacowen 1,929 1,868 932 936 -61 -3.2 2,400053 Knockaree 2,044 2,833 1,388 1,445 789 38.6 2,383054 Lakeview 331 366 182 184 35 10.6 1,805055 Lisconny 383 367 199 168 -16 -4.2 1,589056 Lissadill East 433 507 254 253 74 17.1 1,739057 Lissadill North 787 969 475 494 182 23.1 1,945058 Lissadill West 490 483 251 232 -7 -1.4 1,675059 Riverstown 553 562 300 262 9 1.6 1,865060 Rossinver East 204 175 92 83 -29 -14.2 3,381061 Rossinver West 193 217 111 106 24 12.4 1,901
Tobercurry rural area 7,045 7,149 3,690 3,459 104 1.5 51,210
062 Achonry East 481 483 249 234 2 0.4 2,532063 Achonry West 651 625 313 312 -26 -4.0 3,160064 Aclare 325 309 154 155 -16 -4.9 2,467065 Annagh 201 165 90 75 -36 -17.9 1,360066 Banada 592 576 306 270 -16 -2.7 3,726067 Branchfield 67 55 29 26 -12 -17.9 1,565068 Breencorragh 172 154 81 73 -18 -10.5 3,783069 Carrownaskeagh 116 99 49 50 -17 -14.7 2,150070 Cartron 203 182 103 79 -21 -10.3 1,686071 Cloonacool 228 232 121 111 4 1.8 3,124072 Cloonoghill 307 307 167 140 – – 1,633073 Coolaney 396 457 241 216 61 15.4 2,365074 Glendarragh 157 145 78 67 -12 -7.6 3,729075 Kilmacteige 219 235 125 110 16 7.3 3,082076 Kilturra 198 205 113 92 7 3.5 1,621077 Leitrim 322 325 174 151 3 0.9 2,582078 Loughill 69 76 38 38 7 10.1 1,913079 Owenmore 97 104 49 55 7 7.2 1,607080 Streamstown 263 292 151 141 29 11.0 1,958081 Temple 242 229 117 112 -13 -5.4 1,383082 Tobercurry 1,739 1,894 942 952 155 8.9 3,784

Census 2002 Areas113
Table 6 (contd.) Population and area of each Province, County, City, urban area, rural area andElectoral Division, 1996 and 2002
District1996 2002 Change in population
1996-2002 Area*(hectares)
Persons Persons Males Females Actual Percentage
Ulster (part of) 234,251 246,714 124,837 121,877 12,463 5.3 808,731
Cavan County 52,944 56,546 29,015 27,531 3,602 6.8 193,188
Cavan Town 3,509 3,538 1,697 1,841 29 0.8 201
001 Cavan Urban 3,509 3,538 1,697 1,841 29 0.8 201
Bailieborough rural area 9,684 10,410 5,334 5,076 726 7.5 29,116
002 Bailieborough 2,660 2,844 1,406 1,438 184 6.9 4,620003 Carnagarve 437 487 268 219 50 11.4 2,159004 Crossbane 404 416 225 191 12 3.0 2,109005 Drumanespick 313 329 171 158 16 5.1 1,501006 Enniskeen 327 372 190 182 45 13.8 1,902007 Killinkere 360 364 196 168 4 1.1 2,229008 Kingscourt 1,876 2,019 1,016 1,003 143 7.6 1,964009 Lisagoan 314 319 165 154 5 1.6 1,435010 Mullagh 816 953 484 469 137 16.8 2,440011 Shercock 898 953 467 486 55 6.1 2,378012 Skeagh 362 397 212 185 35 9.7 2,248013 Taghart 493 521 290 231 28 5.7 2,184014 Termon 424 436 244 192 12 2.8 1,947
Bawnboy rural area 3,679 3,851 2,034 1,817 172 4.7 25,055
015 Ballyconnell 922 1,072 527 545 150 16.3 2,805016 Ballymagauran 271 270 136 134 -1 -0.4 1,590017 Bawnboy 494 541 302 239 47 9.5 3,079018 Benbrack 108 88 47 41 -20 -18.5 2,842019 Bilberry 178 167 93 74 -11 -6.2 1,205020 Carn 198 210 115 95 12 6.1 1,164021 Diamond 125 117 63 54 -8 -6.4 847022 Doogary 138 138 72 66 – – 936023 Kinawley 121 114 68 46 -7 -5.8 2,398024 Lissanover 263 269 142 127 6 2.3 1,733025 Pedara Vohers 148 154 85 69 6 4.1 1,337026 Swanlinbar 364 387 203 184 23 6.3 1,523027 Templeport 295 292 164 128 -3 -1.0 1,915028 Tircahan 54 32 17 15 -22 -40.7 1,681
Castlerahan rural area 5,361 6,423 3,357 3,066 1,062 19.8 17,922
029 Ballyjamesduff 1,219 1,401 730 671 182 14.9 2,156030 Castlerahan 621 695 382 313 74 11.9 2,859031 Kilbride 666 777 394 383 111 16.7 3,112032 Lurgan 326 390 207 183 64 19.6 1,502033 Munterconnaught 601 790 406 384 189 31.4 3,010034 Virginia 1,928 2,370 1,238 1,132 442 22.9 5,283
Cavan rural area 27,529 29,076 14,841 14,235 1,547 5.6 95,266
035 Ardue 493 643 332 311 150 30.4 2,553036 Arvagh 829 858 440 418 29 3.5 2,948037 Ashfield 295 323 163 160 28 9.5 1,754038 Ballintemple 440 475 248 227 35 8.0 1,681039 Ballyhaise 835 882 453 429 47 5.6 1,768040 Ballymachugh 615 651 352 299 36 5.9 3,602041 Bellananagh 948 1,080 549 531 132 13.9 1,502042 Belturbet Urban 1,248 1,295 664 631 47 3.8 458043 Bruce Hall 177 191 103 88 14 7.9 945044 Butler’s Bridge 344 356 160 196 12 3.5 782045 Canningstown 510 529 286 243 19 3.7 2,407046 Carrafin 317 333 177 156 16 5.0 2,397047 Castlesaunderson 212 228 118 110 16 7.5 1,914048 Cavan Rural 3,132 3,603 1,732 1,871 471 15.0 3,640049 Clonervy 673 752 398 354 79 11.7 1,805050 Cootehill Rural 824 861 432 429 37 4.5 3,552051 Cootehill Urban 1,461 1,399 704 695 -62 -4.2 182052 Corr 251 277 139 138 26 10.4 1,113053 Corraneary 404 390 206 184 -14 -3.5 2,394054 Crossdoney 453 477 251 226 24 5.3 2,378055 Crosskeys 587 614 310 304 27 4.6 1,939
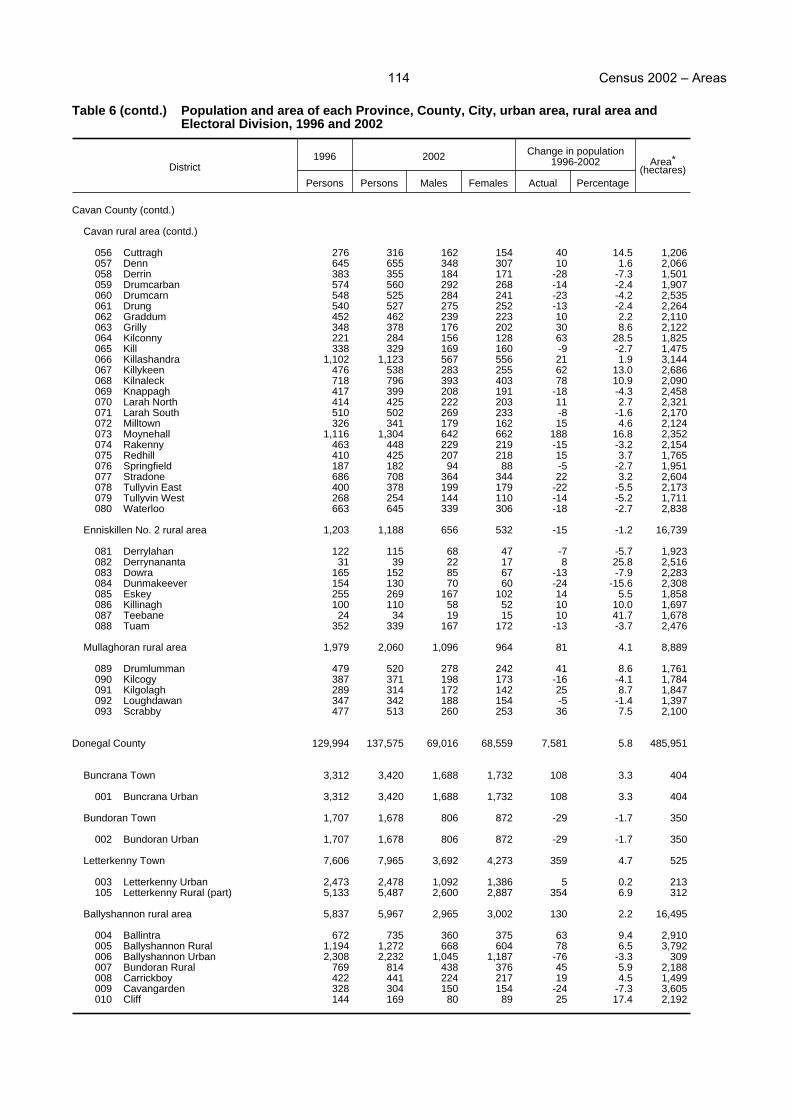
Census 2002 Areas114
Table 6 (contd.) Population and area of each Province, County, City, urban area, rural area andElectoral Division, 1996 and 2002
District1996 2002 Change in population
1996-2002 Area*(hectares)
Persons Persons Males Females Actual Percentage
Cavan County (contd.)
Cavan rural area (contd.)
056 Cuttragh 276 316 162 154 40 14.5 1,206057 Denn 645 655 348 307 10 1.6 2,066058 Derrin 383 355 184 171 -28 -7.3 1,501059 Drumcarban 574 560 292 268 -14 -2.4 1,907060 Drumcarn 548 525 284 241 -23 -4.2 2,535061 Drung 540 527 275 252 -13 -2.4 2,264062 Graddum 452 462 239 223 10 2.2 2,110063 Grilly 348 378 176 202 30 8.6 2,122064 Kilconny 221 284 156 128 63 28.5 1,825065 Kill 338 329 169 160 -9 -2.7 1,475066 Killashandra 1,102 1,123 567 556 21 1.9 3,144067 Killykeen 476 538 283 255 62 13.0 2,686068 Kilnaleck 718 796 393 403 78 10.9 2,090069 Knappagh 417 399 208 191 -18 -4.3 2,458070 Larah North 414 425 222 203 11 2.7 2,321071 Larah South 510 502 269 233 -8 -1.6 2,170072 Milltown 326 341 179 162 15 4.6 2,124073 Moynehall 1,116 1,304 642 662 188 16.8 2,352074 Rakenny 463 448 229 219 -15 -3.2 2,154075 Redhill 410 425 207 218 15 3.7 1,765076 Springfield 187 182 94 88 -5 -2.7 1,951077 Stradone 686 708 364 344 22 3.2 2,604078 Tullyvin East 400 378 199 179 -22 -5.5 2,173079 Tullyvin West 268 254 144 110 -14 -5.2 1,711080 Waterloo 663 645 339 306 -18 -2.7 2,838
Enniskillen No. 2 rural area 1,203 1,188 656 532 -15 -1.2 16,739
081 Derrylahan 122 115 68 47 -7 -5.7 1,923082 Derrynananta 31 39 22 17 8 25.8 2,516083 Dowra 165 152 85 67 -13 -7.9 2,283084 Dunmakeever 154 130 70 60 -24 -15.6 2,308085 Eskey 255 269 167 102 14 5.5 1,858086 Killinagh 100 110 58 52 10 10.0 1,697087 Teebane 24 34 19 15 10 41.7 1,678088 Tuam 352 339 167 172 -13 -3.7 2,476
Mullaghoran rural area 1,979 2,060 1,096 964 81 4.1 8,889
089 Drumlumman 479 520 278 242 41 8.6 1,761090 Kilcogy 387 371 198 173 -16 -4.1 1,784091 Kilgolagh 289 314 172 142 25 8.7 1,847092 Loughdawan 347 342 188 154 -5 -1.4 1,397093 Scrabby 477 513 260 253 36 7.5 2,100
Donegal County 129,994 137,575 69,016 68,559 7,581 5.8 485,951
Buncrana Town 3,312 3,420 1,688 1,732 108 3.3 404
001 Buncrana Urban 3,312 3,420 1,688 1,732 108 3.3 404
Bundoran Town 1,707 1,678 806 872 -29 -1.7 350
002 Bundoran Urban 1,707 1,678 806 872 -29 -1.7 350
Letterkenny Town 7,606 7,965 3,692 4,273 359 4.7 525
003 Letterkenny Urban 2,473 2,478 1,092 1,386 5 0.2 213105 Letterkenny Rural (part) 5,133 5,487 2,600 2,887 354 6.9 312
Ballyshannon rural area 5,837 5,967 2,965 3,002 130 2.2 16,495
004 Ballintra 672 735 360 375 63 9.4 2,910005 Ballyshannon Rural 1,194 1,272 668 604 78 6.5 3,792006 Ballyshannon Urban 2,308 2,232 1,045 1,187 -76 -3.3 309007 Bundoran Rural 769 814 438 376 45 5.9 2,188008 Carrickboy 422 441 224 217 19 4.5 1,499009 Cavangarden 328 304 150 154 -24 -7.3 3,605010 Cliff 144 169 80 89 25 17.4 2,192

Census 2002 Areas115
Table 6 (contd.) Population and area of each Province, County, City, urban area, rural area andElectoral Division, 1996 and 2002
District1996 2002 Change in population
1996-2002 Area*(hectares)
Persons Persons Males Females Actual Percentage
Donegal County (contd.)
Donegal rural area 11,273 11,683 5,904 5,779 410 3.6 64,172
011 Ballintra 560 508 258 250 -52 -9.3 4,039012 Binbane 179 177 92 85 -2 -1.1 4,696013 Bonnyglen 382 347 176 171 -35 -9.2 2,375014 Clogher 578 660 339 321 82 14.2 3,535015 Corkermore 282 260 138 122 -22 -7.8 2,589016 Donegal 3,415 3,724 1,827 1,897 309 9.0 3,149017 Dunkineely 803 801 409 392 -2 -0.2 2,130018 Eanymore 493 501 259 242 8 1.6 2,802019 Grousehall 88 85 39 46 -3 -3.4 2,549020 Haugh 167 216 107 109 49 29.3 1,582021 Inver 748 745 376 369 -3 -0.4 2,420022 Laghy 688 710 365 345 22 3.2 4,316023 Lough Eask 117 135 74 61 18 15.4 5,122024 Pettigoe 478 414 220 194 -64 -13.4 4,916025 Tantallon 1,437 1,534 771 763 97 6.8 3,022026 Tawnawully 264 258 128 130 -6 -2.3 3,410027 Templecarn 140 135 77 58 -5 -3.6 7,989028 Tullynaught 454 473 249 224 19 4.2 3,531
Dunfanaghy rural area 11,075 11,135 5,663 5,472 60 0.5 51,160
029 Ards 597 668 333 335 71 11.9 2,139030 Creenasmear 260 269 148 121 9 3.5 3,380031 Creeslough 634 648 340 308 14 2.2 2,181032 Cross Roads 2,272 2,207 1,111 1,096 -65 -2.9 9,419033 Doe Castle 209 205 113 92 -4 -1.9 1,467034 Dunfanaghy 790 855 418 437 65 8.2 3,949035 Dunlewy 648 694 375 319 46 7.1 9,267036 Gortahork 1,618 1,625 811 814 7 0.4 5,399037 Magheraclogher 2,709 2,666 1,334 1,332 -43 -1.6 9,876038 Meenaclady 1,338 1,298 680 618 -40 -3.0 4,083
Glenties rural area 18,699 18,525 9,415 9,110 -174 -0.9 107,599
039 Annagary 2,137 2,234 1,129 1,105 97 4.5 4,280040 Aran 602 543 285 258 -59 -9.8 1,805041 Ardara 1,145 1,029 510 519 -116 -10.1 3,675042 Crovehy 185 179 98 81 -6 -3.2 3,912043 Crowkeeragh 177 135 78 57 -42 -23.7 3,740044 Crownarad 269 296 145 151 27 10.0 1,776045 Dawros 719 658 323 335 -61 -8.5 3,764046 Doocharry 78 83 41 42 5 6.4 4,306047 Dunglow 1,790 1,871 928 943 81 4.5 3,625048 Fintown 293 312 169 143 19 6.5 3,313049 Glencolumbkille 767 720 380 340 -47 -6.1 4,521050 Glengesh 705 734 386 348 29 4.1 3,892051 Glenleheen 207 178 96 82 -29 -14.0 8,521052 Glenties 1,392 1,394 682 712 2 0.1 8,434053 Graffy 229 196 121 75 -33 -14.4 8,126054 Inishkeel 148 117 61 56 -31 -20.9 4,506055 Kilcar 663 661 330 331 -2 -0.3 1,649056 Kilgoly 418 391 212 179 -27 -6.5 5,352057 Killybegs 2,370 2,428 1,199 1,229 58 2.4 3,006058 Largymore 609 602 320 282 -7 -1.1 2,248059 Lettermacaward 702 666 351 315 -36 -5.1 4,243060 Maas 287 281 149 132 -6 -2.1 3,205061 Maghery 689 642 346 296 -47 -6.8 4,330062 Malinbeg 377 390 195 195 13 3.4 3,379063 Mulmosog 207 211 114 97 4 1.9 2,340064 Rutland 1,415 1,465 705 760 50 3.5 3,541065 Tieveskeelta 119 109 62 47 -10 -8.4 2,110
Inishowen rural area 26,217 28,408 14,309 14,099 2,191 8.4 88,433
066 Ardmalin 676 677 358 319 1 0.1 2,940067 Ballyliffin 1,174 1,171 561 610 -3 -0.3 3,207068 Birdstown 644 775 394 381 131 20.3 2,399069 Buncrana Rural 1,933 2,365 1,179 1,186 432 22.3 3,029070 Burt 943 1,178 602 576 235 24.9 3,881071 Carndonagh 1,833 1,761 865 896 -72 -3.9 3,988072 Carthage 1,136 1,013 516 497 -123 -10.8 2,476

Census 2002 Areas116
Table 6 (contd.) Population and area of each Province, County, City, urban area, rural area andElectoral Division, 1996 and 2002
District1996 2002 Change in population
1996-2002 Area*(hectares)
Persons Persons Males Females Actual Percentage
Donegal County (contd.)
Inishowen rural area (contd.)
073 Castlecary 557 542 264 278 -15 -2.7 2,054074 Castleforward 825 913 474 439 88 10.7 2,277075 Culdaff 797 841 435 406 44 5.5 2,599076 Desertegny 706 682 339 343 -24 -3.4 3,072077 Dunaff 676 653 336 317 -23 -3.4 2,729078 Fahan 1,209 1,316 645 671 107 8.9 2,989079 Glennagannon 576 606 305 301 30 5.2 2,056080 Gleneely 702 693 361 332 -9 -1.3 4,090081 Glentogher 752 980 475 505 228 30.3 4,193082 Greencastle 683 747 371 376 64 9.4 3,387083 Illies 688 738 371 367 50 7.3 4,881084 Inch Island 397 438 219 219 41 10.3 1,386085 Kilderry 963 1,367 711 656 404 42.0 3,088086 Killea 1,049 1,190 601 589 141 13.4 3,179087 Malin 568 556 281 275 -12 -2.1 2,790088 Mintiaghs 693 707 367 340 14 2.0 3,054089 Moville 2,136 2,279 1,133 1,146 143 6.7 1,834090 Newtown Cunningham 710 769 378 391 59 8.3 2,004091 Redcastle 598 638 336 302 40 6.7 2,952092 Straid 1,138 1,254 657 597 116 10.2 3,565093 Three Trees 467 551 281 270 84 18.0 2,841094 Turmone 356 309 154 155 -47 -13.2 2,591095 Whitecastle 632 699 340 359 67 10.6 2,902
Letterkenny rural area 11,468 14,811 7,387 7,424 3,343 29.2 40,604
096 Ballymacool 898 1,125 558 567 227 25.3 1,864097 Castlewray 2,348 2,942 1,461 1,481 594 25.3 2,226098 Church Hill 271 281 141 140 10 3.7 6,611099 Corravaddy 481 752 380 372 271 56.3 2,342100 Edenacarnan 449 616 313 303 167 37.2 2,735101 Gartan 189 184 97 87 -5 -2.6 6,246102 Gortnavern 635 978 498 480 343 54.0 1,266103 Killymasny 359 379 194 185 20 5.6 2,582104 Kincraigy 813 867 440 427 54 6.6 3,125105 Letterkenny Rural (part) 2,341 3,802 1,842 1,960 1,461 62.4 916106 Magheraboy 1,247 1,396 700 696 149 11.9 2,773107 Manorcunningham 732 713 368 345 -19 -2.6 1,791108 Seacor 93 84 48 36 -9 -9.7 2,417109 Templedouglas 612 692 347 345 80 13.1 3,710
Millford rural area 11,628 11,777 6,047 5,730 149 1.3 45,365
110 Ballyarr 415 356 192 164 -59 -14.2 1,609111 Carrickart 847 828 403 425 -19 -2.2 2,446112 Carrowkeel 816 844 440 404 28 3.4 2,825113 Cranford 640 611 316 295 -29 -4.5 2,766114 Fanad North 633 566 302 264 -67 -10.6 3,153115 Fanad West 530 481 265 216 -49 -9.2 2,407116 Glen 214 234 120 114 20 9.3 2,623117 Glenalla 369 360 185 175 -9 -2.4 2,355118 Greenfort 396 377 193 184 -19 -4.8 1,525119 Killygarvan 117 112 59 53 -5 -4.3 1,249120 Kilmacrenan 837 961 470 491 124 14.8 1,822121 Knockalla 297 244 135 109 -53 -17.8 1,758122 Loughkeel 247 251 129 122 4 1.6 2,417123 Millford 1,333 1,385 686 699 52 3.9 2,862124 Rathmelton 1,704 1,911 979 932 207 12.1 3,967125 Rathmullan 812 825 403 422 13 1.6 1,802126 Rosguill 831 812 433 379 -19 -2.3 2,181127 Rosnakill 239 244 133 111 5 2.1 1,114128 Termon 351 375 204 171 24 6.8 4,484

Census 2002 Areas117
Table 6 (contd.) Population and area of each Province, County, City, urban area, rural area andElectoral Division, 1996 and 2002
District1996 2002 Change in population
1996-2002 Area*(hectares)
Persons Persons Males Females Actual Percentage
Donegal County (contd.)
Stranorlar rural area 21,172 22,206 11,140 11,066 1,034 4.9 70,844
129 Altnapaste 413 369 198 171 -44 -10.7 7,578130 Castlefinn 1,231 1,322 640 682 91 7.4 2,459131 Cloghan 819 849 446 403 30 3.7 9,077132 Cloghard 608 624 328 296 16 2.6 2,157133 Clonleigh North 1,234 1,328 680 648 94 7.6 2,757134 Clonleigh South 1,943 2,004 967 1,037 61 3.1 2,347135 Convoy 1,980 2,093 1,052 1,041 113 5.7 4,276136 Dooish 619 773 396 377 154 24.9 2,118137 Feddyglass 438 405 211 194 -33 -7.5 1,910138 Figart 618 725 386 339 107 17.3 1,874139 Gleneely 1,222 1,267 636 631 45 3.7 6,008140 Goland 294 313 163 150 19 6.5 4,234141 Killygordon 1,074 1,018 505 513 -56 -5.2 2,213142 Knock 902 998 539 459 96 10.6 2,458143 Lettermore 333 334 176 158 1 0.3 3,916144 Meencargagh 96 97 49 48 1 1.0 3,060145 Raphoe 1,434 1,329 649 680 -105 -7.3 1,409146 St. Johnstown 1,121 1,128 557 571 7 0.6 2,348147 Stranorlar 3,736 4,176 2,029 2,147 440 11.8 4,136148 Treantaghmucklagh 576 564 289 275 -12 -2.1 2,579149 Urney West 481 490 244 246 9 1.9 1,930
Monaghan County 51,313 52,593 26,806 25,787 1,280 2.5 129,592
Carrickmacross Town 1,926 1,964 980 984 38 2.0 144
001 Carrickmacross Urban 1,926 1,964 980 984 38 2.0 144
Castleblayney Town 1,884 1,712 811 901 -172 -9.1 174
002 Castleblayney Urban 1,015 960 473 487 -55 -5.4 114027 Castleblayney Rural (part) 869 752 338 414 -117 -13.5 60
Clones Town 1,921 1,721 842 879 -200 -10.4 185
003 Clones Urban 1,335 1,105 536 569 -230 -17.2 71036 Clones Rural (part) 586 616 306 310 30 5.1 114
Monaghan Town 5,628 5,717 2,730 2,987 89 1.6 577
004 Monaghan Urban 2,014 2,032 960 1,072 18 0.9 192063 Monaghan Rural (part) 3,614 3,685 1,770 1,915 71 2.0 385
Carrickmacross rural area 9,649 10,210 5,263 4,947 561 5.8 26,439
005 Ballymackney 845 897 457 440 52 6.2 1,541006 Bocks 489 530 275 255 41 8.4 1,665007 Carrickmacross Rural 2,257 2,540 1,253 1,287 283 12.5 2,044008 Corracharra 217 250 128 122 33 15.2 1,282009 Crossalare 427 462 238 224 35 8.2 1,580010 Donaghmoyne 568 615 332 283 47 8.3 1,632011 Drumboory 401 446 238 208 45 11.2 1,883012 Drumcarrow 340 343 187 156 3 0.9 1,696013 Drumgurra 503 489 262 227 -14 -2.8 2,063014 Enagh 656 674 346 328 18 2.7 1,760015 Inishkeen 982 956 491 465 -26 -2.6 2,027016 Kilmurry 474 496 260 236 22 4.6 1,791017 Kiltybegs 549 539 289 250 -10 -1.8 1,693018 Loughfea 496 526 272 254 30 6.0 1,673019 Raferagh 445 447 235 212 2 0.4 2,109

Census 2002 Areas118
Table 6 (contd.) Population and area of each Province, County, City, urban area, rural area andElectoral Division, 1996 and 2002
District1996 2002
Change in population1996-2002 Area*
(hectares)
Persons Persons Males Females Actual Percentage
Monaghan County (contd.)
Castleblayney rural area 8,990 9,351 4,808 4,543 361 4.0 26,064
020 Annayalla 517 546 291 255 29 5.6 1,908021 Ballybay Rural 1,210 1,181 575 606 -29 -2.4 1,899022 Ballybay Urban 474 437 213 224 -37 -7.8 24023 Bellatrain 225 211 117 94 -14 -6.2 1,073024 Broomfield 600 652 328 324 52 8.7 2,004025 Carrickaslane 450 462 232 230 12 2.7 2,036026 Carrickatee 345 304 168 136 -41 -11.9 1,486027 Castleblayney Rural (part) 1,889 2,228 1,118 1,110 339 17.9 2,676028 Church Hill 529 569 302 267 40 7.6 2,461029 Creeve 522 538 295 243 16 3.1 2,498030 Cremartin 907 910 475 435 3 0.3 2,623031 Greagh 432 448 244 204 16 3.7 1,616032 Laragh 539 512 258 254 -27 -5.0 1,552033 Mullyash 351 353 192 161 2 0.6 2,208
Clones No. 1 rural area 5,304 5,435 2,782 2,653 131 2.5 25,946
034 Aghabog 314 303 162 141 -11 -3.5 2,176035 Anny 338 359 186 173 21 6.2 2,186036 Clones Rural (part) 869 868 432 436 -1 -0.1 2,734037 Cormeen 447 457 238 219 10 2.2 2,357038 Currin 557 530 271 259 -27 -4.8 2,488039 Dawsongrove 566 643 320 323 77 13.6 2,508040 Drum 193 182 98 84 -11 -5.7 1,626041 Drummully 98 102 56 46 4 4.1 981042 Killeevan 348 357 192 165 9 2.6 1,734043 Killynenagh 170 174 79 95 4 2.4 1,704044 Lisnaveane 362 385 211 174 23 6.4 2,205045 Newbliss 673 666 335 331 -7 -1.0 1,893046 St. Tierney 369 409 202 207 40 10.8 1,354
Monaghan rural area 16,011 16,483 8,590 7,893 472 2.9 50,063
047 Anketell Grove 941 954 498 456 13 1.4 2,514048 Bellanode 1,227 1,170 607 563 -57 -4.6 2,367049 Bragan 272 263 141 122 -9 -3.3 2,181050 Caddagh 442 440 235 205 -2 -0.5 2,233051 Castleshane 725 730 381 349 5 0.7 2,229052 Clones 458 464 249 215 6 1.3 1,922053 Clontibret 705 722 381 341 17 2.4 2,347054 Derrygorry 258 283 154 129 25 9.7 1,462055 Drumhillagh 600 612 307 305 12 2.0 2,375056 Drumsnat 937 930 481 449 -7 -0.7 1,465057 Emyvale 938 1,091 556 535 153 16.3 1,553058 Enagh 446 449 239 210 3 0.7 1,323059 Figullar 394 413 223 190 19 4.8 1,760060 Glaslough 708 726 336 390 18 2.5 2,303061 Killylough 537 558 299 259 21 3.9 1,757062 Kilmore 538 539 266 273 1 0.2 1,347063 Monaghan Rural (part) 1,207 1,284 669 615 77 6.4 2,484064 Rackwallace 729 777 413 364 48 6.6 2,351065 Scotstown 940 993 536 457 53 5.6 2,383066 Shanmullagh 215 210 109 101 -5 -2.3 1,374067 Sheskin 550 532 289 243 -18 -3.3 3,627068 Tedavnet 832 830 426 404 -2 -0.2 2,270069 Tehallan 829 891 451 440 62 7.5 1,711070 Tullycorbet 583 622 344 278 39 6.7 2,725
State 3,626,087 3,917,203 1,946,164 1,971,039 291,116 8.0 7,018,224

Census 2002 Areas119
Table 7 Persons in each town of 1,500 population and over, distinguishing those within legallydefined boundaries and in suburbs or environs, 1996 and 2002
Town
Total population(including suburbs or
environs)
Population within legallydefined boundary
Population of suburbs orenvirons
Percentagechange in
totalpopulation1996-20021996 2002 1996 2002 1996 2002
Greater Dublin Area 952,692 1,004,614 481,854 495,781 470,838 508,833 5.5
Other Cities 360,609 386,136 279,007 287,511 81,602 98,625 7.1
Cork City 179,954 186,239 127,187 123,062 52,767 63,177 3.5
Limerick City 79,137 86,998 52,039 54,023 27,098 32,975 9.9
Galway City 57,363 66,163 57,241 65,832 122 331 15.3
Waterford City 44,155 46,736 42,540 44,594 1,615 2,142 5.8
Towns 10,000 population and over 423,356 496,163 283,788 316,299 75,071 101,505 17.2
Dundalk 30,195 32,505 25,762 27,385 4,433 5,120 7.7
Drogheda 25,282 31,020 24,460 28,333 822 2,687 22.7
Bray 27,923 30,951 25,252 26,244 2,671 4,707 10.8
Swords 22,314 27,175 – – – – 21.8
Ennis 17,726 22,051 15,333 18,830 2,393 3,221 24.4
Tralee 19,950 21,987 19,056 20,375 894 1,612 10.2
Kilkenny 18,696 20,735 8,507 8,591 10,189 12,144 10.9
Sligo 18,509 19,735 17,786 18,473 723 1,262 6.6
Navan (An Uaimh) 12,810 19,417 3,447 3,406 9,363 16,011 51.6
Carlow 14,979 18,487 11,721 13,218 3,258 5,269 23.4
Naas 14,074 18,288 14,074 18,288 – – 29.9
Wexford 15,862 17,235 9,533 9,449 6,329 7,786 8.7
Clonmel 16,182 16,910 15,215 15,739 967 1,171 4.5
Droichead Nua 13,363 16,739 12,970 15,749 393 990 25.3
Celbridge 12,289 16,016 – – – – 30.3
Athlone 15,544 15,936 7,691 7,354 7,853 8,582 2.5
Mullingar 12,492 15,621 8,040 8,824 4,452 6,797 25.0
Letterkenny 11,996 15,231 7,606 7,965 4,390 7,266 27.0
Leixlip 13,451 15,016 13,451 15,016 – – 11.6
Malahide 13,539 13,826 – – – – 2.1
Killarney 12,011 13,137 8,809 12,087 3,202 1,050 9.4
Portlaoighise 9,474 12,127 3,531 3,482 5,943 8,645 28.0
Greystones 11,296 11,913 9,995 10,303 1,301 1,610 5.5
Castlebar 8,532 11,371 6,585 10,287 1,947 1,084 33.3
Carrigaline 7,827 11,191 – – – – 43.0
Tullamore 10,039 11,098 9,221 10,270 818 828 10.5
Balbriggan 8,473 10,294 5,743 6,631 2,730 3,663 21.5
Maynooth 8,528 10,151 – – – – 19.0

Census 2002 Areas120
Table 7 (contd.) Persons in each town of 1,500 population and over, distinguishing those withinlegally defined boundaries and in suburbs or environs, 1996 and 2002
Town
Total population(including suburbs or
environs)
Population within legallydefined boundary
Population of suburbs orenvirons
Percentagechange in
totalpopulation1996-20021996 2002 1996 2002 1996 2002
Towns 5,000 - 9,999 population 201,967 233,939 134,487 147,047 29,532 39,582 15.8
Arklow 8,557 9,993 8,519 9,955 38 38 16.8
Cobh 8,459 9,811 6,468 6,767 1,991 3,044 16.0
Ballina 8,762 9,647 6,852 9,478 1,910 169 10.1
Wicklow 7,290 9,355 6,416 7,031 874 2,324 28.3
Skerries 7,339 9,149 – – – – 24.7
Enniscorthy 7,640 8,964 3,788 3,764 3,852 5,200 17.3
Mallow 7,768 8,937 6,434 7,091 1,334 1,846 15.0
Shannon 7,939 8,561 7,811 8,228 128 333 7.8
Portmarnock 9,145 8,376 – – – – -8.4
Tramore 6,536 8,305 6,536 8,115 – 190 27.1
Midleton 6,209 7,957 3,266 3,798 2,943 4,159 28.2
Longford 6,984 7,557 6,444 6,831 540 726 8.2
Dungarvan 7,175 7,452 7,175 7,220 – 232 3.9
Thurles 6,939 7,425 6,603 6,852 336 573 7.0
Rush 5,429 6,769 – – – – 24.7
Youghal 5,943 6,597 5,630 6,203 313 394 11.0
New Ross 6,147 6,537 5,012 4,810 1,135 1,727 6.3
Nenagh 5,913 6,454 5,645 6,121 268 333 9.1
Ashbourne 4,999 6,362 – – – – 27.3
Ballinasloe 5,723 6,219 5,634 5,984 89 235 8.7
Cavan 5,623 6,098 3,509 3,538 2,114 2,560 8.4
Athy 5,306 6,049 5,306 6,049 – – 14.0
Tuam 5,627 5,947 3,487 3,104 2,140 2,843 5.7
Monaghan 5,842 5,936 5,628 5,717 214 219 1.6
Trim 4,405 5,894 1,740 1,447 2,665 4,447 33.8
Kildare 4,278 5,694 – – – – 33.1
Westport 4,520 5,634 4,253 5,314 267 320 24.6
Laytown-Bettystown-Mornington 3,678 5,597 – – – – 52.2
Carrick-on-Suir 5,217 5,586 5,172 5,542 45 44 7.1
Dunboyne 3,080 5,363 – – – – 74.1
Gorey 3,939 5,282 2,150 3,090 1,789 2,192 34.1
Buncrana 4,805 5,271 3,312 3,420 1,493 1,851 9.7
Bandon 4,751 5,161 1,697 1,578 3,054 3,583 8.6

Census 2002 Areas121
Table 7 (contd.) Persons in each town of 1,500 population and over, distinguishing those withinlegally defined boundaries and in suburbs or environs, 1996 and 2002
Town
Total population(including suburbs or
environs)
Population within legallydefined boundary
Population of suburbs orenvirons
Percentagechange in
totalpopulation1996-20021996 2002 1996 2002 1996 2002
Towns 3,000 - 4,999 population 82,294 99,473 41,772 45,813 9,294 11,512 20.9
Tipperary 4,854 4,964 4,640 4,546 214 418 2.3
Fermoy 4,469 4,804 2,310 2,270 2,159 2,534 7.5
Passage West 3,922 4,595 3,638 4,184 284 411 17.2
Roscrea 4,170 4,578 – – – – 9.8
Edenderry 3,825 4,559 3,591 4,216 234 343 19.2
Roscommon 3,915 4,489 – – – – 14.7
Birr 4,193 4,436 3,355 3,590 838 846 5.8
Ceannanus Mór 3,542 4,421 2,152 2,522 1,390 1,899 24.8
Clane 3,126 4,417 – – – – 41.3
Newcastle West 3,618 4,017 – – – – 11.0
Loughrea 3,335 4,004 3,335 4,004 – – 20.1
Portarlington 3,320 4,001 – – – – 20.5
Listowel 3,656 3,999 3,393 3,589 263 410 9.4
Ardee 3,791 3,948 3,440 3,564 351 384 4.1
Donabate 1,868 3,854 – – – – 106.3
Carrickmacross 3,617 3,832 1,926 1,964 1,691 1,868 5.9
Ratoath 1,061 3,794 – – – – 257.6
Clonakilty 2,950 3,698 2,724 3,432 226 266 25.4
Ballybofey-Stranorlar 3,047 3,603 – – – – 18.2
Kinsale 3,064 3,554 2,007 2,257 1,057 1,297 16.0
Mountmellick 2,912 3,361 2,325 2,525 587 836 15.4
Mitchelstown 3,123 3,300 – – – – 5.7
Bantry 2,936 3,150 2,936 3,150 – – 7.3
Dunshaughlin 2,139 3,063 – – – – 43.2
Tower 1,841 3,032 – – – – 64.7

Census 2002 Areas122
Table 7 (contd.) Persons in each town of 1,500 population and over, distinguishing those withinlegally defined boundaries and in suburbs or environs, 1996 and 2002
Town
Total population(including suburbs or
environs)
Population within legallydefined boundary
Population of suburbs orenvirons
Percentagechange in
totalpopulation1996-20021996 2002 1996 2002 1996 2002
Towns 1,500 - 2,999 population 101,277 113,957 24,962 25,022 3,351 3,819 12.5
Macroom 2,574 2,985 2,457 2,836 117 149 16.0
Castleblayney 2,808 2,936 1,884 1,712 924 1,224 4.6
Sallins 854 2,922 – – – – 242.2
Kilcoole 2,694 2,826 – – – – 4.9
Cahir 2,236 2,794 – – – – 25.0
Cashel 2,687 2,770 2,346 2,403 341 367 3.1
Kilcock 1,825 2,740 – – – – 50.1
Muinebeag 2,695 2,728 2,553 2,540 142 188 1.2
Ballyshannon 2,775 2,715 2,308 2,232 467 483 -2.2
Clara 2,464 2,704 – – – – 9.7
Kilrush 2,594 2,699 2,594 2,699 – – 4.0
Rathluirc (or Charleville) 2,667 2,685 – – – – 0.7
Monasterevan 2,302 2,583 – – – – 12.2
Newtownmountkennedy 2,528 2,521 – – – – -0.3
Blessington 1,860 2,509 – – – – 34.9
Rathcoole 2,784 2,499 – – – – -10.2
Lusk 2,287 2,456 – – – – 7.4
Donegal 2,296 2,453 – – – – 6.8
Tullow 2,364 2,417 – – – – 2.2
Templemore 2,244 2,270 2,115 2,159 129 111 1.2
Kill 1,711 2,246 – – – – 31.3
Carrick-on-Shannon 1,868 2,237 – – – – 19.8
Boyle 2,222 2,205 1,690 1,643 532 562 -0.8
Duleek 1,731 2,173 – – – – 25.5
Castleisland 2,233 2,162 – – – – -3.2
Athenry 1,614 2,154 – – – – 33.5
Blarney 1,963 2,146 – – – – 9.3
Kinsealy-Drinan 2,182 2,110 – – – – -3.3
Claremorris 1,914 2,101 – – – – 9.8
Skibbereen 1,926 2,000 1,926 2,000 – – 3.8
Clones 2,170 1,947 1,921 1,721 249 226 -10.3
Enniskerry 1,275 1,904 – – – – 49.3
Kenmare 1,420 1,844 – – – – 29.9
Bundoran 1,796 1,842 1,707 1,678 89 164 2.6

Census 2002 Areas123
Table 7 (contd.) Persons in each town of 1,500 population and over, distinguishing those withinlegally defined boundaries and in suburbs or environs, 1996 and 2002
Town
Total population(including suburbs or
environs)
Population within legallydefined boundary
Population of suburbs orenvirons
Percentagechange in
totalpopulation1996-20021996 2002 1996 2002 1996 2002
Towns 1,500 - 2,999 population (contd.)
Dingle 1,536 1,828 – – – – 19.0
Rathangan 1,190 1,811 – – – – 52.2
Castlerea 1,790 1,788 – – – – -0.1
Gort 1,182 1,776 – – – – 50.3
Dunmore East 1,430 1,750 – – – – 22.4
Cootehill 1,822 1,744 1,461 1,399 361 345 -4.3
Portrane 1,924 1,726 – – – – -10.3
Oranmore 1,410 1,692 – – – – 20.0
Abbeyfeale 1,486 1,683 – – – – 13.3
Carndonagh 1,580 1,673 – – – – 5.9
Bailieborough 1,529 1,660 – – – – 8.6
Kanturk 1,666 1,651 – – – – -0.9
Ballinrobe 1,309 1,626 – – – – 24.2
Thomastown 1,581 1,600 – – – – 1.2
Banagher 1,414 1,553 – – – – 9.8
Athboy 1,172 1,538 – – – – 31.2
Dunmanway 1,427 1,532 – – – – 7.4
Prosperous 814 1,523 – – – – 87.1
Moate 1,452 1,520 – – – – 4.7
Aggregate Town Area 2,122,195 2,334,282 1,245,870 1,317,473 669,688 763,876 10.0
Towns 1,000 - 1,499 population 71,878 79,462 4,955 4,793 1,044 1,021 10.6
Towns 500 - 999 population 96,749 104,602 – – – – 8.1
Towns under 500 population butwith at least 50 inhabitedhouses 82,919 98,126 – – – – 18.3
Remainder of country 1,252,346 1,300,731 – – – – 3.9
Aggregate Rural Area 1,503,892 1,582,921 4,955 4,793 1,044 1,021 5.3
State 3,626,087 3,917,203 1,250,825 1,322,266 670,732 764,897 8.0

Census 2002 Areas124
Table 8 Persons, males and females in each Constituency, as defined in the Electoral (Amendment)(No. 2) Act, 1998 for elections to Dáil Eireann
ConstituencyPopulation - 2002 Number of
membersPopulation per
memberPersons Males Females
Carlow - Kilkenny 122,720 62,054 60,666 5 24,544
Cavan - Monaghan 109,139 55,821 53,318 5 21,828
Clare 99,364 50,128 49,236 4 24,841
Cork East 90,845 45,575 45,270 4 22,711
Cork North - Central 108,565 53,026 55,539 5 21,713
Cork North - West 64,290 32,954 31,336 3 21,430
Cork South - Central 116,782 56,835 59,947 5 23,356
Cork South - West 67,347 33,927 33,420 3 22,449
Donegal North - East 73,961 36,911 37,050 3 24,654
Donegal South - West 63,614 32,105 31,509 3 21,205
Dublin Central 100,009 48,863 51,146 4 25,002
Dublin Mid-West 81,734 40,472 41,262 3 27,245
Dublin North 102,790 51,240 51,550 4 25,698
Dublin North - Central 84,341 39,995 44,346 4 21,085
Dublin North - East 67,053 32,796 34,257 3 22,351
Dublin North - West 62,376 29,957 32,419 3 20,792
Dublin South 117,018 56,460 60,558 5 23,404
Dublin South - Central 117,948 56,537 61,411 5 23,590
Dublin South - East 97,096 45,795 51,301 4 24,274
Dublin South - West 93,490 46,130 47,360 4 23,372
Dublin West 82,424 40,701 41,723 3 27,475
Dun Laoghaire 116,542 55,129 61,413 5 23,308
Galway East 90,707 46,411 44,296 4 22,677
Galway West 118,370 57,956 60,414 5 23,674
Kerry North 65,158 32,499 32,659 3 21,719
Kerry South 67,369 34,073 33,296 3 22,456
Kildare North 85,473 43,041 42,432 3 28,491
Kildare South 78,471 39,694 38,777 3 26,157
Laoighis - Offaly 122,437 62,316 60,121 5 24,487
Limerick East 114,652 56,570 58,082 5 22,930
Limerick West 64,565 32,996 31,569 3 21,522
Longford - Roscommon 84,842 43,377 41,465 4 21,210
Louth 101,821 50,489 51,332 4 25,455
Mayo 117,446 59,149 58,297 5 23,489
Meath 134,005 67,733 66,272 5 26,801
Sligo - Leitrim 83,999 42,095 41,904 4 21,000
Tipperary North 70,427 35,705 34,722 3 23,476
Tipperary South 71,125 35,864 35,261 3 23,708
Waterford 100,125 49,966 50,159 4 25,031
Westmeath 71,858 35,960 35,898 3 23,953
Wexford 116,596 58,170 58,426 5 23,319
Wicklow 118,309 58,689 59,620 5 23,662
State 3,917,203 1,946,164 1,971,039 166 23,598

Census 2002 Areas125
Table 9 Persons, males and females in each Local Electoral Area as defined in the relevant Ordersmade under the Local Government Act, 1994
Electoral Area Persons Males FemalesRepresentatives
assignedto area
Local Electoral Areas
Carlow
Borris 5,706 2,998 2,708 3Carlow No.1 6,625 3,293 3,332 3Carlow No.2 13,684 6,814 6,870 5Muinebeag 9,736 5,060 4,676 5Tullow 11,042 5,624 5,418 5
Dublin City
Artane 36,546 17,615 18,931 4Ballyfermot 26,940 13,223 13,717 3Ballymun - Whitehall 26,531 12,562 13,969 3Cabra - Glasnevin 44,841 21,102 23,739 5Clontarf 47,381 22,228 25,153 5Crumlin - Kimmage 50,091 23,593 26,498 5Donaghmede 46,184 22,571 23,613 5Finglas 33,870 16,418 17,452 4North Inner City 54,213 27,272 26,941 5Pembroke 29,153 13,208 15,945 3Rathmines 36,367 16,909 19,458 4South-East Inner City 31,576 15,678 15,898 3South-West Inner City 32,088 15,434 16,654 3
Dún Laoghaire-Rathdown
Ballybrack 41,946 20,354 21,592 6Blackrock 29,835 13,862 15,973 4Dundrum 37,828 18,239 19,589 6Dun Laoghaire 41,339 19,285 22,054 6Glencullen 21,221 10,525 10,696 3Stillorgan 19,623 9,072 10,551 3
Fingal
Balbriggan 33,387 16,656 16,731 4Castleknock 32,714 16,218 16,496 4Howth 21,283 10,377 10,906 3Malahide 26,319 13,058 13,261 4Mulhuddart 38,959 19,268 19,691 4Swords 43,751 21,832 21,919 5
South Dublin
Clondalkin 42,747 21,012 21,735 5Lucan 46,265 22,926 23,339 4Tallaght - Central 38,583 19,318 19,265 5Tallaght - South 48,211 23,689 24,522 5Terenure - Rathfarnham 63,029 30,571 32,458 7
Kildare
Athy 16,906 8,629 8,277 3Celbridge 19,475 9,807 9,668 3Clane 26,648 13,534 13,114 4Kildare 40,197 20,253 19,944 6Leixlip 25,856 12,886 12,970 4Naas 34,862 17,626 17,236 5
Kilkenny
Ballyragget 14,712 7,509 7,203 5Callan 10,011 5,159 4,852 3Kilkenny 24,628 11,964 12,664 7Pilltown 16,786 8,616 8,170 6Thomastown 14,202 7,292 6,910 5

Census 2002 Areas126
Table 9 (contd.) Persons, males and females in each Local Electoral Area as defined in the relevantOrders made under the Local Government Act, 1994
Electoral Area Persons Males FemalesRepresentatives
assignedto area
Local Electoral Areas (contd.)
Laoighis
Borris-in-Ossory 16,086 8,277 7,809 7Emo 9,354 4,733 4,621 4Luggacurren 8,097 4,148 3,949 4Mountmellick 8,265 4,229 4,036 4Portlaoighise 16,193 8,358 7,835 6
Longford
Ballymahon 8,532 4,393 4,139 6Drumlish 4,010 2,132 1,878 3Granard 6,979 3,589 3,390 5Longford 11,547 5,680 5,867 7
Louth
Ardee 18,816 9,644 9,172 5Drogheda East 22,154 10,959 11,195 5Drogheda West 16,340 8,012 8,328 4Dundalk Carlingford 22,187 10,947 11,240 6Dundalk South 22,970 11,245 11,725 6
Meath
Ceanannus Mór 24,468 12,515 11,953 6Dunshaughlin 31,836 16,099 15,737 6Navan 32,547 16,327 16,220 7Slane 23,008 11,651 11,357 5Trim 21,500 10,823 10,677 5
Offaly
Birr 13,943 7,155 6,788 5Edenderry 15,393 7,891 7,502 5Ferbane 11,094 5,659 5,435 4Tullamore 23,233 11,480 11,753 7
Westmeath
Athlone 21,708 10,733 10,975 7Coole 8,286 4,219 4,067 3Kilbeggan 11,770 6,034 5,736 4Mullingar East 13,262 6,675 6,587 4Mullingar West 16,832 8,299 8,533 5
Wexford
Enniscorthy 28,483 14,323 14,160 5Gorey 23,750 11,955 11,795 4New Ross 24,233 12,177 12,056 5Wexford 40,130 19,715 20,415 7
Wicklow
Arklow 22,843 11,567 11,276 5Baltinglass 14,685 7,464 7,221 3Bray 34,438 16,499 17,939 7Greystones 17,676 8,711 8,965 4Wicklow 25,034 12,559 12,475 5
Clare
Ennis 27,806 13,558 14,248 7Ennistimon 17,300 8,800 8,500 6Killaloe 14,078 7,096 6,982 4Kilrush 18,453 9,575 8,878 7Scarriff 8,889 4,534 4,355 3Shannon 16,751 8,500 8,251 5

Census 2002 Areas127
Table 9 (contd.) Persons, males and females in each Local Electoral Area as defined in the relevantOrders made under the Local Government Act, 1994
Electoral Area Persons Males FemalesRepresentatives
assignedto area
Local Electoral Areas (contd.)
Cork City
Cork North-Central 18,960 9,357 9,603 5Cork North-East 18,421 9,231 9,190 5Cork North-West 20,099 9,500 10,599 5Cork South-Central 20,409 9,695 10,714 5Cork South-East 25,434 12,080 13,354 6Cork South-West 19,739 9,400 10,339 5
Cork
Bandon 25,886 13,014 12,872 3Bantry 18,840 9,597 9,243 5Blarney 38,069 19,164 18,905 4Carrigaline 68,691 33,799 34,892 7Fermoy 23,991 12,144 11,847 4Kanturk 26,049 13,306 12,743 5Macroom 21,485 10,971 10,514 3Mallow 23,471 11,653 11,818 4Midleton 46,322 23,232 23,090 6Skibbereen 31,963 16,174 15,789 7
Kerry
Dingle 13,666 6,961 6,705 3Killarney 31,402 15,674 15,728 6Killorglin 22,301 11,438 10,863 5Listowel 26,231 13,408 12,823 6Tralee 38,927 19,091 19,836 7
Limerick City
Limerick No. 1 15,007 7,172 7,835 5Limerick No. 2 12,685 6,178 6,507 4Limerick No. 3 12,163 5,995 6,168 4Limerick No. 4 14,168 6,783 7,385 4
Limerick
Bruff 32,855 16,262 16,593 7Castleconnell 32,998 16,866 16,132 7Kilmallock 16,998 8,816 8,182 4Newcastle 19,653 9,944 9,709 5Rathkeale 18,777 9,615 9,162 5
Tipperary North
Borrisokane 8,000 4,140 3,860 3Nenagh 22,221 11,198 11,023 7Templemore 13,879 7,076 6,803 5Thurles 16,910 8,450 8,460 6
Tipperary South
Cahir 12,513 6,425 6,088 4Cashel 13,223 6,737 6,486 4Clonmel 21,589 10,636 10,953 7Fethard 17,667 9,005 8,662 6Tipperary 14,129 7,196 6,933 5
Waterford City
Waterford No. 1 10,313 5,096 5,217 4Waterford No. 2 18,768 9,138 9,630 5Waterford No. 3 15,513 7,548 7,965 6
Waterford
Dungarvan 16,558 8,288 8,270 7Kilmacthomas 7,387 3,781 3,606 3Lismore 9,016 4,631 4,385 4Suir 6,829 3,484 3,345 3Tramore 17,162 8,706 8,456 6

Census 2002 Areas128
Table 9 (contd.) Persons, males and females in each Local Electoral Area as defined in the relevantOrders made under the Local Government Act, 1994
Electoral Area Persons Males FemalesRepresentatives
assignedto area
Local Electoral Areas (contd.)
Galway City
Galway No. 1 29,144 14,111 15,033 7Galway No. 2 16,174 7,399 8,775 4Galway No. 3 20,514 9,505 11,009 4
Galway
Ballinasloe 21,207 10,956 10,251 5Connemara 33,895 17,352 16,543 7Loughrea 33,050 16,797 16,253 7Oranmore 22,753 11,675 11,078 4Tuam 32,340 16,572 15,768 7
Leitrim
Ballinamore 6,538 3,405 3,133 6Carrick-on-Shannon 7,565 3,798 3,767 6Dromahaire 5,754 2,987 2,767 5Manorhamilton 5,942 3,134 2,808 5
Mayo
Ballina 23,222 11,684 11,538 6Ballinrobe 10,883 5,635 5,248 3Belmullet 13,011 6,570 6,441 4Castlebar 25,382 12,701 12,681 6Claremorris 14,018 7,082 6,936 4Swinford 15,154 7,640 7,514 4Westport 15,776 7,837 7,939 4
Roscommon
Athlone 11,627 5,901 5,726 5Ballaghaderreen 7,698 3,979 3,719 4Boyle 8,946 4,628 4,318 5Castlerea 6,229 3,245 2,984 3Roscommon 11,217 5,649 5,568 5Strokestown 8,057 4,181 3,876 4
Sligo
Ballymote 10,906 5,595 5,311 5Dromore 6,468 3,343 3,125 3Sligo Drumcliff 14,629 7,068 7,561 6Sligo Strandhill 17,811 8,419 9,392 7Tobercurry 8,386 4,346 4,040 4
Cavan
Bailieborough 15,594 8,026 7,568 7Ballyjamesduff 13,671 7,142 6,529 6Belturbet 10,723 5,594 5,129 5Cavan 16,558 8,253 8,305 7
Donegal
Donegal 25,060 12,596 12,464 6Glenties 23,928 12,157 11,771 6Inishowen 31,828 15,997 15,831 6Letterkenny 27,045 13,180 13,865 5Millford 15,088 7,734 7,354 3Stranorlar 14,626 7,352 7,274 3
Monaghan
Carrickmacross 13,549 6,946 6,603 5Castleblayney 11,848 6,065 5,783 5Clones 10,318 5,274 5,044 4Monaghan 16,878 8,521 8,357 6

Census 2002 Areas129
Table 10 Population in 1996 and 2002 of each County, City, rural area and Electoral Division withinthe Gaeltacht, as defined by the Gaeltacht Areas Orders, 1956 to 1982
District(* = part of ED)
Ref. No. ofED in
Table 6
1996 2002
Persons Persons Males Females
Total Gaeltacht Areas 86,039 90,048 45,560 44,488
Cork County 3,591 3,530 1,837 1,693
Dunmanway rural area 188 219 114 105
Electoral DivisionBealanageary* 108 188 219 114 105
Macroom rural area 3,258 3,182 1,651 1,531
Electoral DivisionBealanageary 199 523 494 261 233Candroma 200 256 257 137 120Cleanrath* 202 166 150 77 73Derryfineen 205 243 217 123 94Gortnatubbrid 206 438 426 222 204Kilnamartery* 212 321 341 184 157Slievereagh 218 747 760 390 370Ullanes 219 564 537 257 280
Skibbereen rural area 145 129 72 57
Electoral DivisionCape Clear* 290 145 129 72 57
Donegal County 24,072 23,728 12,197 11,531
Donegal rural area 11 11 7 4
Electoral DivisionBinbane* 12 6 6 5 1Lough Eask* 23 5 5 2 3
Dunfanaghy rural area 8,779 8,696 4,425 4,271
Electoral DivisionCreenasmear* 30 31 44 24 20Creeslough* 31 62 65 35 30Cross Roads* 32 2,272 2,207 1,111 1,096Doe Castle* 33 40 34 21 13Dunfanaghy* 34 61 63 34 29Dunlewy 35 648 694 375 319Gortahork 36 1,618 1,625 811 814Magheraclogher 37 2,709 2,666 1,334 1,332Meenaclady 38 1,338 1,298 680 618
Glenties rural area 11,797 11,658 5,987 5,671
Electoral DivisionAnnagary 39 2,137 2,234 1,129 1,105Aran 40 602 543 285 258Ardara* 41 54 55 26 29Crovehy 42 185 179 98 81Crowkeeragh 43 177 135 78 57Doocharry 46 78 83 41 42Dunglow 47 1,790 1,871 928 943Fintown 48 293 312 169 143Glencolumbkille 49 767 720 380 340Glengesh* 50 160 164 87 77Glenleheen 51 207 178 96 82Glenties* 52 135 122 58 64Graffy 53 229 196 121 75Inishkeel 54 148 117 61 56Kilcar 55 663 661 330 331Kilgoly 56 418 391 212 179Largymore* 58 427 391 214 177Lettermacaward 59 702 666 351 315Maghery 61 689 642 346 296Malinbeg 62 377 390 195 195

Census 2002 Areas130
Table 10 (contd.) Population in 1996 and 2002 of each County, City, rural area and ElectoralDivision within the Gaeltacht, as defined by the Gaeltacht Areas Orders, 1956 to1982
District(* = part of ED)
Ref. No. ofED in
Table 6
1996 2002
Persons Persons Males Females
Donegal County (contd.)
Glenties rural area (contd.)
Electoral DivisionMulmosog* 63 144 143 77 66Rutland 64 1,415 1,465 705 760
Letterkenny rural area 65 66 41 25
Electoral DivisionChurch Hill* 98 43 52 33 19Gartan* 101 - - - -Seacor* 108 22 14 8 6
Millford rural area 2,719 2,609 1,363 1,246
Electoral DivisionCarrickart* 111 388 395 183 212Carrowkeel* 112 15 20 10 10Cranford* 113 317 291 154 137Fanad North* 114 591 503 265 238Fanad West* 115 236 230 121 109Greenfort* 118 16 20 9 11Knockalla* 121 128 111 63 48Loughkeel* 122 28 37 17 20Rosguill 126 831 812 433 379Termon* 128 169 190 108 82
Stranorlar rural area 701 688 374 314
Electoral DivisionAltnapaste* 129 181 166 88 78Cloghan* 131 512 508 281 227Meencargagh* 144 8 14 5 9
Galway County and City 35,983 40,267 20,106 20,161
Galway City 9,853 11,802 5,572 6,230
Electoral DivisionBallybrit* 2 66 60 29 31Barna* 3 4,772 5,825 2,749 3,076Castlegar* 4 1,035 1,046 484 562Knocknacarragh* 8 23 18 6 12Menlough 10 3,957 4,853 2,304 2,549St. Nicholas* 18 - - - -
Galway County 26,130 28,465 14,534 13,931
Clifden rural area 2,438 2,260 1,158 1,102
Electoral DivisionBencorr* 22 124 120 61 59Illion 31 153 99 56 43Knockboy 33 906 831 400 431Moyrus* 34 152 134 72 62Owengowla 35 334 341 191 150Roundstone* 37 102 87 45 42Skannive 39 667 648 333 315
Galway rural area 16,443 19,125 9,707 9,418
Electoral DivisionAnnaghdown 40 1,290 1,551 806 745Ballintemple* 42 195 196 103 93Barna* 44 2,093 2,465 1,220 1,245Carnmore 46 1,582 1,989 1,037 952Carrowbrowne (pt) 47 623 756 401 355Claregalway 48 1,102 1,635 806 829Furbogh 51 1,090 1,272 637 635Inishmore 53 1,303 1,280 667 613

Census 2002 Areas131
Table 10 (contd.) Population in 1996 and 2002 of each County, City, rural area and ElectoralDivision within the Gaeltacht, as defined by the Gaeltacht Areas Orders, 1956 to1982
District(* = part of ED)
Ref. No. ofED in
Table 6
1996 2002
Persons Persons Males Females
Galway County (contd.)
Galway rural area (contd.)
Electoral DivisionKilcummin 54 1,273 1,298 685 613Killannin 55 840 831 429 402Lackaghbeg* 56 132 147 81 66Lisheenavalla* 58 41 40 22 18Moycullen 59 1,020 1,402 690 712Selerna 61 1,148 1,299 644 655Slieveaneena 62 587 649 333 316Spiddle 63 1,166 1,253 624 629Tullokyne* 65 958 1,062 522 540
Oughterard rural area 7,249 7,080 3,669 3,411
Electoral DivisionCamus 149 395 388 197 191Cloonbur 150 1,008 916 480 436Cong 151 536 512 273 239Crumpaun 152 2,167 2,266 1,144 1,122Cur 153 191 159 82 77Gorumna 154 1,320 1,290 669 621Kilcummin 155 129 118 72 46Letterbrickaun* 156 34 31 19 12Lettermore 158 811 812 421 391Ross 160 113 111 61 50Turlough 161 545 477 251 226
Kerry County 8,145 8,531 4,314 4,217
Cahersiveen rural area 1,962 1,753 919 834
Electoral DivisionBahaghs* 4 20 16 7 9Ballinskelligs 5 407 358 180 178Ballybrack* 6 70 69 32 37Caherdaniel* 8 139 102 51 51Canuig* 9 160 147 80 67Darrynane* 13 172 161 85 76Derriana 14 232 209 111 98Emlagh* 15 354 329 173 156Loughcurrane* 19 20 16 10 6Mastergeehy 20 101 83 47 36St. Finan’s 23 165 137 80 57Teeranearagh* 24 122 126 63 63
Dingle rural area 6,183 6,778 3,395 3,383
Electoral DivisionBallyduff 27 131 137 69 68Brandon 29 139 133 75 58Cloghane 31 252 268 142 126Dingle 33 1,396 1,647 782 865Dunquin 34 174 212 109 103Dunurlin 35 396 422 218 204Glin 36 1,294 1,471 695 776Kilmalkedar 38 555 549 290 259Kilquane 39 447 453 239 214Kinard 40 396 366 210 156Marhin 42 203 243 122 121Minard 43 390 383 192 191Stradbally* 44 24 34 19 15Ventry 45 386 460 233 227
Mayo County 11,494 10,947 5,554 5,393
Ballina rural area 219 199 107 92
Electoral DivisionBeldergmore 13 219 199 107 92

Census 2002 Areas132
Table 10 (contd.) Population in 1996 and 2002 of each County, City, rural area and ElectoralDivision within the Gaeltacht, as defined by the Gaeltacht Areas Orders, 1956 to1982
District(* = part of ED)
Ref. No. ofED in
Table 6
1996 2002
Persons Persons Males Females
Mayo County (contd.)
Ballinrobe rural area 1,086 1,030 534 496
Electoral DivisionBallinchalla 33 227 236 128 108Ballyovey* 35 196 170 86 84Cappaghduff 37 343 341 175 166Owenbrin 47 285 245 129 116Portroyal* 48 35 38 16 22
Belmullet rural area 7,679 7,290 3,697 3,593
Electoral DivisionAn Geata Mór Thuaidh 51 898 883 445 438An Geata Mór Theas 52 993 929 489 440Barroosky 54 159 134 69 65Belmullet 55 1,884 1,880 921 959Glenamoy 56 270 248 134 114Glencastle 57 483 490 245 245Goolamore* 59 142 119 57 62Knockadaff 60 470 389 213 176Knocknalower 61 867 847 426 421Muingnabo 62 363 309 145 164Muings 63 277 258 142 116Rathhill 64 873 804 411 393
Castlebar rural area 67 53 30 23
Electoral DivisionTawnynagry* 82 67 53 30 23
Westport rural area 2,443 2,375 1,186 1,189
Electoral DivisionAchill 124 1,024 958 485 473Corraun Achill 133 713 744 385 359Dooega 136 706 673 316 357
Meath County 1,407 1,591 813 778
Kells rural area 321 362 187 175
Electoral DivisionTeltown* 41 321 362 187 175
Navan rural area 479 556 290 266
Electoral DivisionDonaghpatrick* 53 479 556 290 266
Trim rural area 607 673 336 337
Electoral DivisionAthboy* 70 57 59 26 33Kilbride* 82 213 219 108 111Rathmore* 90 337 395 202 193
Waterford County 1,347 1,454 739 715
Dungarvan rural area 1,347 1,454 739 715
Electoral DivisionArdmore* 19 62 68 34 34Ballymacart 20 286 321 161 160Ringville* 34 999 1,065 544 521

Census 2002 Areas133
Table 11 Population of inhabited Islands off the coast, 1996 and 2002
County Island Electoral Division(* = part of ED)
Ref. No. ofED in
Table 6
1996 2002
Persons Persons Males Females
Clare Inishmore (or Deer) Ballynacally* 66 1 1 - 1
Cork Ballycottin Ballycottin* 247 27 - - -
Bear Bear 48 212 207 117 90
Clear Cape Clear* 290 145 129 72 57
Dursey Kilnamanagh* 53 9 6 4 2
Garinish Kilcaskan* 41 1 - - -
Haulbowline Cobh Rural* 85 110 75 55 20
Horse Island Ballydehob* 310 - 3 1 2
Inchydoney Clonakilty Rural* 60 102 134 59 75
Inishbeg Skibbereen Rural* 306 19 13 6 7
Inishodriscol (or Hare) Aghadown South* 287 16 27 16 11
Long Skull* 318 9 12 9 3
Ringarogy Cape Clear* 290 76 88 45 43
Sherkin Cape Clear* 290 98 129 65 64
Spike Cobh Rural* 85 103 61 58 3
Whiddy Whiddy 46 34 29 16 13
Donegal Aran Aran 40 602 543 285 258
Aughnish Rathmelton* 124 3 3 1 2
Cruit Rutland* 64 70 61 26 35
Gola Island Magheraclogher* 37 - 5 4 1
Inishbofin Gortahork* 36 24 16 12 4
Inishfree Upper Maghery* 61 15 7 3 4
Island Roy Rosguill* 126 15 7 4 3
Tory Meenaclady* 38 169 133 68 65
Dublin City North Bull Clontarf East B* 38 22 17 10 7
Fingal Lambay Donabate* 19 8 6 3 3
Galway Annaghvaan Lettermore* 158 104 121 60 61
Furnace Gorumna* 154 59 56 34 22
Gorumna Gorumna* 154 1,057 1,015 515 500
Illaunmore Turlough* 161 1 1 1 -
Inchaghaun Lettermore* 158 3 3 2 1
Inishbarra Lettermore* 158 1 - - -
Inishbofin Inishbofin 32 200 178 99 79

Census 2002 Areas134
Table 11 (contd.) Population of inhabited Islands off the coast, 1996 and 2002
County Island Electoral Division(* = part of ED)
Ref. No. ofED in
Table 6
1996 2002
Persons Persons Males Females
Galway (contd.) Inisheer Inishmore* 53 274 262 148 114
Inishmaan Inishmore* 53 191 187 99 88
Inishmore Inishmore* 53 838 831 420 411
Inishnee Roundstone* 37 33 24 14 10
Inishtravin Owengowla* 35 3 1 1 -
Lettermore Lettermore* 158 503 497 265 232
Lettermullan Gorumna* 154 204 219 120 99
Mweenish Knockboy* 33 150 146 67 79
Omey Sillerna* 38 4 4 4 -
Rossroe Crumpaun* 152 23 19 10 9
Rusheennacholla Knockboy* 33 3 3 1 2
Kerry Beginish Castlequin* 10 2 - - -
Carrig Carrig* 101 13 10 6 4
Garinish Island Castlecove* 49 - 2 1 1
Skellig Rock Great St. Finan’s* 23 4 - - -
Rossmore Tahilla* 61 8 7 6 1
Tarbert Tarbert* 124 13 5 3 2
Valencia Valencia 25 676 690 376 314
Limerick Foynes Island Shanagolden* 130 - 5 4 1
Mayo Achill Total - 2,718 2,620 1,280 1,340Achill* 124 976 919 459 460Dooega 136 706 673 316 357Slievemore 152 1,036 1,028 505 523
Clare Clare Island* 131 136 127 73 54
Clynish Kilmeena* 144 5 5 3 2
Collan More Kilmeena* 144 - 3 3 -
Inishbiggle Achill* 124 48 39 26 13
Inishcottle Kilmeena* 144 7 4 1 3
Inishgort Kilmeena* 144 2 1 1 -
Inishlyre Kilmeena* 144 7 7 5 2
Inishnakillew Kilmeena* 144 6 5 3 2
Inishturk Clare Island* 131 83 72 44 28
Inisraher Westport Rural* 154 - 4 2 2
Island More Kilmeena* 144 - 1 1 -
Sligo Inishmulclohy(or Coney Island) Knockaree* 53 6 3 2 1

Census 2002 Areas135
Table 12 Alphabetical list of Towns with their population, 1996 and 2002
Town County in which situated
1996 2002 Change in population 1996-2002
Persons Persons Males Females Actual Percentage
A
Abbeydorney Kerry 159 218 109 109 59 37.1Abbeyfeale Limerick 1,486 1,683 832 851 197 13.3Abbeyleix Laoighis 1,259 1,383 684 699 124 9.8Achill Sound Mayo 277 355 167 188 78 28.2Adamstown Wexford – 176 97 79 – – Adare Limerick 1,042 1,102 562 540 60 5.8Aghada-Farsid-Rostellan Cork 786 774 383 391 -12 -1.5Aglish Waterford – 193 107 86 – – Ahascragh Galway 240 271 124 147 31 12.9Allenwood Kildare 341 481 260 221 140 41.1Annacotty Limerick 586 1,342 657 685 756 129.0Annagry Donegal 205 247 127 120 42 20.5Annascaul Kerry 203 202 105 97 -1 -0.5An Uaimh (see Navan)Ardagh Limerick 328 270 127 143 -58 -17.7Ardara Donegal 635 578 284 294 -57 -9.0Ardee* Louth 3,440 3,564 1,740 1,824 124 3.6Ardee Environs Louth 351 384 190 194 33 9.4Ardfert Kerry 648 691 348 343 43 6.6Ardfinnan Tipperary South 848 779 386 393 -69 -8.1Ardmore Waterford 436 459 232 227 23 5.3Ardnacrusha (Castlebank) Clare 655 926 470 456 271 41.4Ardskeagh Clare – 149 75 74 – – Arklow Town* Wicklow 8,519 9,955 4,896 5,059 1,436 16.9Arklow Environs Wicklow 38 38 20 18 – – Arva Cavan 327 357 183 174 30 9.2Ashbourne Meath 4,999 6,362 3,230 3,132 1,363 27.3Ashford Wicklow 1,215 1,356 665 691 141 11.6Askeaton Limerick 851 921 446 475 70 8.2Athboy Meath 1,172 1,538 730 808 366 31.2Athea Limerick 443 410 206 204 -33 -7.4Athenry Galway 1,614 2,154 1,043 1,111 540 33.5Athlone Town* Westmeath 7,691 7,354 3,554 3,800 -337 -4.4Athlone Environs Westmeath and
Roscommon 7,853 8,582 4,185 4,397 729 9.3Athy Town* Kildare 5,306 6,049 2,965 3,084 743 14.0Aughrim Wicklow 745 871 438 433 126 16.9Avoca Wicklow 490 564 282 282 74 15.1
B
Bagenalstown (see Muinebeag)Bailieborough Cavan 1,529 1,660 803 857 131 8.6Balbriggan* Fingal 5,743 6,631 3,286 3,345 888 15.5Balbriggan Environs Fingal 2,730 3,663 1,785 1,878 933 34.2Balla Mayo 316 443 209 234 127 40.2Ballaghaderreen Roscommon 1,248 1,416 706 710 168 13.5Ballina Town* Mayo 6,852 9,478 4,583 4,895 2,626 38.3Ballina Environs Mayo 1,910 169 86 83 -1,741 -91.2Ballina Tipperary North 598 1,185 591 594 587 98.2Ballinagh Cavan 401 502 246 256 101 25.2Ballinakill Laoighis 299 328 167 161 29 9.7Ballinamore Leitrim 782 687 318 369 -95 -12.1Ballinasloe Town* Galway 5,634 5,984 3,017 2,967 350 6.2Ballinasloe Environs Galway and
Roscommon 89 235 114 121 146 164.0Ballincar Sligo 456 510 198 312 54 11.8Ballindine Mayo 233 297 142 155 64 27.5Ballineen/Enniskean Cork 624 619 311 308 -5 -0.8Ballingarry Limerick 389 348 172 176 -41 -10.5Ballingarry Tipperary South 315 314 149 165 -1 -0.3Ballingeary Cork 220 205 112 93 -15 -6.8Ballinlough Roscommon 205 254 125 129 49 23.9Ballinroad Waterford 253 431 211 220 178 70.4Ballinrobe Mayo 1,309 1,626 834 792 317 24.2Ballintra Donegal 217 216 98 118 -1 -0.5Ballisodare Sligo 612 853 412 441 241 39.4Ballivor Meath 383 793 388 405 410 107.0Ballon Carlow 258 284 145 139 26 10.1Ballyagran Limerick 215 185 94 91 -30 -14.0Ballybay* Monaghan 474 437 213 224 -37 -7.8Ballybay Environs Monaghan 678 627 278 349 -51 -7.5
* Denotes a Town with a legally defined boundary.
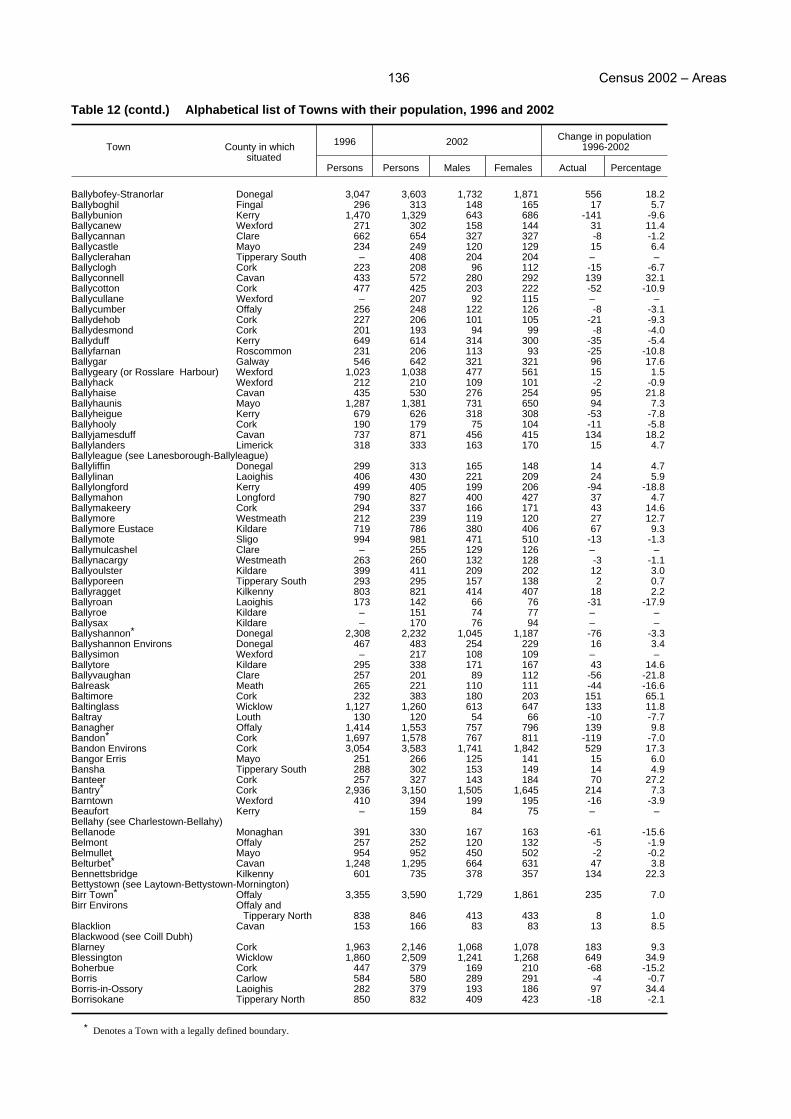
Census 2002 Areas136
Table 12 (contd.) Alphabetical list of Towns with their population, 1996 and 2002
Town County in which situated
1996 2002 Change in population 1996-2002
Persons Persons Males Females Actual Percentage
Ballybofey-Stranorlar Donegal 3,047 3,603 1,732 1,871 556 18.2Ballyboghil Fingal 296 313 148 165 17 5.7Ballybunion Kerry 1,470 1,329 643 686 -141 -9.6Ballycanew Wexford 271 302 158 144 31 11.4Ballycannan Clare 662 654 327 327 -8 -1.2Ballycastle Mayo 234 249 120 129 15 6.4Ballyclerahan Tipperary South – 408 204 204 – – Ballyclogh Cork 223 208 96 112 -15 -6.7Ballyconnell Cavan 433 572 280 292 139 32.1Ballycotton Cork 477 425 203 222 -52 -10.9Ballycullane Wexford – 207 92 115 – – Ballycumber Offaly 256 248 122 126 -8 -3.1Ballydehob Cork 227 206 101 105 -21 -9.3Ballydesmond Cork 201 193 94 99 -8 -4.0Ballyduff Kerry 649 614 314 300 -35 -5.4Ballyfarnan Roscommon 231 206 113 93 -25 -10.8Ballygar Galway 546 642 321 321 96 17.6Ballygeary (or Rosslare Harbour) Wexford 1,023 1,038 477 561 15 1.5Ballyhack Wexford 212 210 109 101 -2 -0.9Ballyhaise Cavan 435 530 276 254 95 21.8Ballyhaunis Mayo 1,287 1,381 731 650 94 7.3Ballyheigue Kerry 679 626 318 308 -53 -7.8Ballyhooly Cork 190 179 75 104 -11 -5.8Ballyjamesduff Cavan 737 871 456 415 134 18.2Ballylanders Limerick 318 333 163 170 15 4.7Ballyleague (see Lanesborough-Ballyleague)Ballyliffin Donegal 299 313 165 148 14 4.7Ballylinan Laoighis 406 430 221 209 24 5.9Ballylongford Kerry 499 405 199 206 -94 -18.8Ballymahon Longford 790 827 400 427 37 4.7Ballymakeery Cork 294 337 166 171 43 14.6Ballymore Westmeath 212 239 119 120 27 12.7Ballymore Eustace Kildare 719 786 380 406 67 9.3Ballymote Sligo 994 981 471 510 -13 -1.3Ballymulcashel Clare – 255 129 126 – – Ballynacargy Westmeath 263 260 132 128 -3 -1.1Ballyoulster Kildare 399 411 209 202 12 3.0Ballyporeen Tipperary South 293 295 157 138 2 0.7Ballyragget Kilkenny 803 821 414 407 18 2.2Ballyroan Laoighis 173 142 66 76 -31 -17.9Ballyroe Kildare – 151 74 77 – – Ballysax Kildare – 170 76 94 – – Ballyshannon* Donegal 2,308 2,232 1,045 1,187 -76 -3.3Ballyshannon Environs Donegal 467 483 254 229 16 3.4Ballysimon Wexford – 217 108 109 – – Ballytore Kildare 295 338 171 167 43 14.6Ballyvaughan Clare 257 201 89 112 -56 -21.8Balreask Meath 265 221 110 111 -44 -16.6Baltimore Cork 232 383 180 203 151 65.1Baltinglass Wicklow 1,127 1,260 613 647 133 11.8Baltray Louth 130 120 54 66 -10 -7.7Banagher Offaly 1,414 1,553 757 796 139 9.8Bandon* Cork 1,697 1,578 767 811 -119 -7.0Bandon Environs Cork 3,054 3,583 1,741 1,842 529 17.3Bangor Erris Mayo 251 266 125 141 15 6.0Bansha Tipperary South 288 302 153 149 14 4.9Banteer Cork 257 327 143 184 70 27.2Bantry* Cork 2,936 3,150 1,505 1,645 214 7.3Barntown Wexford 410 394 199 195 -16 -3.9Beaufort Kerry – 159 84 75 – – Bellahy (see Charlestown-Bellahy)Bellanode Monaghan 391 330 167 163 -61 -15.6Belmont Offaly 257 252 120 132 -5 -1.9Belmullet Mayo 954 952 450 502 -2 -0.2Belturbet* Cavan 1,248 1,295 664 631 47 3.8Bennettsbridge Kilkenny 601 735 378 357 134 22.3Bettystown (see Laytown-Bettystown-Mornington)Birr Town* Offaly 3,355 3,590 1,729 1,861 235 7.0Birr Environs Offaly and
Tipperary North 838 846 413 433 8 1.0Blacklion Cavan 153 166 83 83 13 8.5Blackwood (see Coill Dubh)Blarney Cork 1,963 2,146 1,068 1,078 183 9.3Blessington Wicklow 1,860 2,509 1,241 1,268 649 34.9Boherbue Cork 447 379 169 210 -68 -15.2Borris Carlow 584 580 289 291 -4 -0.7Borris-in-Ossory Laoighis 282 379 193 186 97 34.4Borrisokane Tipperary North 850 832 409 423 -18 -2.1
* Denotes a Town with a legally defined boundary.

Census 2002 Areas137
Table 12 (contd.) Alphabetical list of Towns with their population, 1996 and 2002
Town County in which situated
1996 2002 Change in population 1996-2002
Persons Persons Males Females Actual Percentage
Borrisoleigh Tipperary North 564 598 316 282 34 6.0Boyle* Roscommon 1,690 1,643 811 832 -47 -2.8Boyle Environs Roscommon 532 562 265 297 30 5.6Bracknagh Offaly 281 259 142 117 -22 -7.8Bray Town* Wicklow 25,252 26,244 12,532 13,712 992 3.9Bray Environs Dublin and
Wicklow 2,671 4,707 2,270 2,437 2,036 76.2Bridebridge Cork 250 214 114 100 -36 -14.4Bridge End Donegal – 298 146 152 – – Bridgetown Wexford 246 183 87 96 -63 -25.6Brinlack Donegal – 381 191 190 – – Brittas South Dublin 187 174 88 86 -13 -7.0Broadford Limerick 271 300 148 152 29 10.7Brosna Kerry 249 204 96 108 -45 -18.1Brownstown Kildare 462 500 254 246 38 8.2Bruff Limerick 700 695 347 348 -5 -0.7Bruree Limerick 261 299 151 148 38 14.6Bunbeg-Derrybeg Donegal 1,400 1,388 697 691 -12 -0.9Bunclody-Carrickduff Carlow and
Wexford 1,241 1,361 657 704 120 9.7Buncrana Town* Donegal 3,312 3,420 1,688 1,732 108 3.3Buncrana Environs Donegal 1,493 1,851 924 927 358 24.0Bundoran Town* Donegal 1,707 1,678 806 872 -29 -1.7Bundoran Environs Donegal 89 164 79 85 75 84.3Burnfoot Donegal 224 240 122 118 16 7.1Burtonport Donegal 296 346 167 179 50 16.9Butlersbridge Cavan 185 182 76 106 -3 -1.6Buttevant Cork 1,070 987 467 520 -83 -7.8
C
Cabragh Monaghan – 201 106 95 – – Caherconlish Limerick 636 616 286 330 -20 -3.1Cahir Tipperary South 2,236 2,794 1,400 1,394 558 25.0Cahirciveen Kerry 1,250 1,272 626 646 22 1.8Callan Kilkenny 1,224 1,325 639 686 101 8.3Camolin Wexford 299 320 148 172 21 7.0Campile Wexford 396 335 167 168 -61 -15.4Cappamore Limerick 665 684 329 355 19 2.9Cappawhite Tipperary South 345 340 155 185 -5 -1.4Cappoquin Waterford 780 756 373 383 -24 -3.1Carlingford Louth 647 604 288 316 -43 -6.6Carlow Town* Carlow 11,721 13,218 6,490 6,728 1,497 12.8Carlow Environs Carlow and
Laoighis 3,258 5,269 2,661 2,608 2,011 61.7Carndonagh Donegal 1,580 1,673 794 879 93 5.9Carnew Wicklow 795 809 401 408 14 1.8Carragh Kildare – 242 128 114 – – Carraroe Galway 242 629 320 309 387 159.9Carrick Donegal 257 245 127 118 -12 -4.7Carrickduff (see Bunclody-Carrickduff)Carrickmacross Town* Monaghan 1,926 1,964 980 984 38 2.0Carrickmacross Environs Monaghan 1,691 1,868 879 989 177 10.5Carrick-on-Shannon Leitrim and
Roscommon 1,868 2,237 1,054 1,183 369 19.8Carrick-on-Suir Town* Tipperary South 5,172 5,542 2,727 2,815 370 7.2Carrick-on-Suir Environs Waterford 45 44 19 25 -1 -2.2Carrigaline Cork 7,827 11,191 5,525 5,666 3,364 43.0Carrigallen Leitrim 251 257 129 128 6 2.4Carrigans Donegal 185 158 84 74 -27 -14.6Carrigtwohill Cork 1,232 1,411 680 731 179 14.5Carrowkeel Donegal 268 253 130 123 -15 -5.6Cashel Town* Tipperary South 2,346 2,403 1,143 1,260 57 2.4Cashel Environs Tipperary South 341 367 172 195 26 7.6Castlebar Town* Mayo 6,585 10,287 4,908 5,379 3,702 56.2Castlebar Environs Mayo 1,947 1,084 509 575 -863 -44.3Castlebellingham/Kilsaran Louth 792 721 358 363 -71 -9.0Castleblayney Town* Monaghan 1,884 1,712 811 901 -172 -9.1Castleblayney Environs Monaghan 924 1,224 594 630 300 32.5Castlebridge Wexford 783 1,013 513 500 230 29.4Castlecomer-Donaguile Kilkenny 1,380 1,482 698 784 102 7.4Castleconnell Limerick 1,414 1,343 662 681 -71 -5.0Castledermot Kildare 733 726 347 379 -7 -1.0Castle Ellis Wexford – 165 83 82 – – Castlefin Donegal 698 783 374 409 85 12.2Castlegregory Kerry 163 186 97 89 23 14.1
* Denotes a Town with a legally defined boundary.

Census 2002 Areas138
Table 12 (contd.) Alphabetical list of Towns with their population, 1996 and 2002
Town County in which situated
1996 2002 Change in population 1996-2002
Persons Persons Males Females Actual Percentage
Castleisland Kerry 2,233 2,162 1,034 1,128 -71 -3.2Castlelyons Cork 164 211 118 93 47 28.7Castlemartyr Cork 484 577 308 269 93 19.2Castlepollard Westmeath 888 895 452 443 7 0.8Castlerea Roscommon 1,790 1,788 872 916 -2 -0.1Castletown Laoighis 294 289 156 133 -5 -1.7Castletownbere Cork 926 875 425 450 -51 -5.5Castletownroche Cork 421 423 211 212 2 0.5Castletownshend Cork 141 157 76 81 16 11.3Causeway Kerry 261 251 118 133 -10 -3.8Cavan Town* Cavan 3,509 3,538 1,697 1,841 29 0.8Cavan Environs Cavan 2,114 2,560 1,211 1,349 446 21.1Ceannanus Mór (formerly Kells) Town*Meath 2,152 2,522 1,227 1,295 370 17.2Ceannanus Mór Environs Meath 1,390 1,899 921 978 509 36.6Celbridge Kildare 12,289 16,016 8,035 7,981 3,727 30.3Charlestown-Bellahy Mayo and
Sligo 675 753 380 373 78 11.6Charleville (see Rathluirc)Chatsworth (see Clogh-Chatsworth)Cheekpoint Waterford 320 325 160 165 5 1.6Churchbay Cork 257 270 127 143 13 5.1Clane Kildare 3,126 4,417 2,196 2,221 1,291 41.3Clara Offaly 2,464 2,704 1,348 1,356 240 9.7Claregalway Galway – 562 271 291 – – Claremorris Mayo 1,914 2,101 959 1,142 187 9.8Clarinbridge Galway – 173 92 81 – – Clashmore Waterford – 161 76 85 – – Clifden Galway 920 1,355 657 698 435 47.3Cliffoney Sligo 305 327 155 172 22 7.2Cloghan Offaly 477 523 264 259 46 9.6Clogh-Chatsworth Kilkenny 272 320 149 171 48 17.6Clogheen Tipperary South 518 550 270 280 32 6.2Clogherhead Louth 775 906 435 471 131 16.9Clonakilty Town* Cork 2,724 3,432 1,627 1,805 708 26.0Clonakilty Environs Cork 226 266 124 142 40 17.7Clonard Meath – 248 131 117 – – Clonaslee Laoighis 504 538 266 272 34 6.7Clonbullogue Offaly 329 390 197 193 61 18.5Clonee Village Meath – 173 88 85 – – Clonegal Carlow and
Wexford 200 193 103 90 -7 -3.5Clones Town* Monaghan 1,921 1,721 842 879 -200 -10.4Clones Environs Monaghan 249 226 102 124 -23 -9.2Clongeen Wexford – 224 116 108 – – Clonlara Clare 401 472 240 232 71 17.7Clonmany Donegal 305 393 202 191 88 28.9Clonmel Borough* Tipperary South 15,215 15,739 7,671 8,068 524 3.4Clonmel Environs Tipperary South
and Waterford 967 1,171 578 593 204 21.1Clonmellon Westmeath 272 403 201 202 131 48.2Clonroche Wexford 407 339 167 172 -68 -16.7Clontuskert Roscommon 262 236 107 129 -26 -9.9Cloonboo Galway 265 351 180 171 86 32.5Cloughjordan Tipperary North 447 431 225 206 -16 -3.6Cloyne Cork 673 785 395 390 112 16.6Coachford Cork 408 412 215 197 4 1.0Cobh Town* Cork 6,468 6,767 3,372 3,395 299 4.6Cobh Environs Cork 1,991 3,044 1,502 1,542 1,053 52.9Coill Dubh (or Blackwood) Kildare 682 592 305 287 -90 -13.2Collinstown Westmeath 212 229 120 109 17 8.0Collon Louth 308 424 215 209 116 37.7Collooney Sligo 573 619 306 313 46 8.0Cong Galway and
Mayo 197 185 94 91 -12 -6.1Conna Cork 209 258 130 128 49 23.4Convoy Donegal 907 1,028 477 551 121 13.3Coolagary Offaly 239 241 126 115 2 0.8Coolaney Sligo – 167 88 79 – – Coolgreany Wexford 356 398 196 202 42 11.8Coonagh Limerick 215 222 107 115 7 3.3Cootehill* Cavan 1,461 1,399 704 695 -62 -4.2Cootehill Environs Cavan 361 345 174 171 -16 -4.4Cork City* Cork 127,187 123,062 59,263 63,799 -4,125 -3.2Cork Suburbs Cork 52,767 63,177 31,085 32,092 10,410 19.7Corofin Clare 418 382 194 188 -36 -8.6Courtmacsherry Cork 224 259 122 137 35 15.6Courtown Harbour Wexford 364 502 249 253 138 37.9Cratloe Clare 557 656 319 337 99 17.8
* Denotes a Town with a legally defined boundary.

Census 2002 Areas139
Table 12 (contd.) Alphabetical list of Towns with their population, 1996 and 2002
Town County in which situated
1996 2002 Change in population 1996-2002
Persons Persons Males Females Actual Percentage
Craughwell Galway 240 358 184 174 118 49.2Creeslough Donegal 300 304 155 149 4 1.3Crocknamurleog Donegal 382 346 165 181 -36 -9.4Cromane Kerry 136 125 53 72 -11 -8.1Crookstown Cork 345 320 167 153 -25 -7.2Croom Limerick 1,009 1,056 532 524 47 4.7Crosshaven Cork 1,312 1,373 668 705 61 4.6Crossmolina Mayo 1,103 935 468 467 -168 -15.2Cross Roads (see Falcarragh)Culdaff Donegal – 182 94 88 – –
D
Daingean Offaly 679 777 395 382 98 14.4Danescastle Wexford – 168 82 86 – – Delvin Westmeath 305 271 141 130 -34 -11.1Derrinturn Kildare 544 791 394 397 247 45.4Derrybeg (see Bunbeg-Derrybeg)Dingle Kerry 1,536 1,828 865 963 292 19.0Donabate Fingal 1,868 3,854 1,908 1,946 1,986 106.3Donaguile (see Castlecomer-Donaguile)Donard Wicklow 162 201 103 98 39 24.1Donegal Donegal 2,296 2,453 1,192 1,261 157 6.8Doneraile Cork 761 800 390 410 39 5.1Donore Meath 293 334 170 164 41 14.0Dooagh (see Keel-Dooagh)Doon Limerick 388 407 184 223 19 4.9Doonbeg Clare 220 206 106 100 -14 -6.4Drimoleague Cork 339 363 175 188 24 7.1Dripsey (see Model Village)Drogheda Borough* Louth 24,460 28,333 13,818 14,515 3,873 15.8Drogheda Environs Louth and
Meath 822 2,687 1,351 1,336 1,865 226.9Droichead Nua* (formerly Newbridge) Kildare 12,970 15,749 7,808 7,941 2,779 21.4Droichead Nua Environs Kildare 393 990 502 488 597 151.9Dromahair Leitrim 346 312 158 154 -34 -9.8Dromina Cork 207 190 99 91 -17 -8.2Dromiskin Louth 629 949 460 489 320 50.9Drommahane Cork 540 548 246 302 8 1.5Drumcollogher Limerick 485 496 238 258 11 2.3Drumconrath Meath 351 389 189 200 38 10.8Drumkeeran Leitrim 220 242 122 120 22 10.0Drumlish Longford 274 277 130 147 3 1.1Drumshanbo Leitrim 634 623 321 302 -11 -1.7Drumsna Leitrim 143 173 92 81 30 21.0Dublin City* Dublin 481,854 495,781 237,813 257,968 13,927 2.9Dublin Greater Suburbs Dublin 470,838 508,833 247,396 261,437 37,995 8.1 Including Suburbs in Dún Laoghaire-Rathdown 184,829 186,641 88,850 97,791 1,812 1.0 Fingal 77,331 93,011 45,975 47,036 15,680 20.3 South Dublin 208,678 229,181 112,571 116,610 20,503 9.8Duleek Meath 1,731 2,173 1,079 1,094 442 25.5Dunboyne Meath 3,080 5,363 2,647 2,716 2,283 74.1Duncannon Wexford 318 303 159 144 -15 -4.7Dundalk Town* Louth 25,762 27,385 13,250 14,135 1,623 6.3Dundalk Environs Louth 4,433 5,120 2,525 2,595 687 15.5Dundrum Tipperary South 219 191 99 92 -28 -12.8Dunfanaghy Donegal 290 293 138 155 3 1.0Dungarvan Town* Waterford 7,175 7,220 3,517 3,703 45 0.6Dungarvan Environs Waterford – 232 115 117 – – Dungloe Donegal 1,042 946 460 486 -96 -9.2Dunkineely Donegal 395 353 176 177 -42 -10.6Dunlavin Wicklow 693 814 407 407 121 17.5Dunleer Louth 988 1,014 507 507 26 2.6Dunmanway Cork 1,427 1,532 762 770 105 7.4Dunmore Galway 445 594 279 315 149 33.5Dunmore East Waterford 1,430 1,750 1,005 745 320 22.4Dunshaughlin Meath 2,139 3,063 1,561 1,502 924 43.2Durrow Laoighis 696 717 347 370 21 3.0Durrus Cork 204 283 136 147 79 38.7
* Denotes a Town with a legally defined boundary.

Census 2002 Areas140
Table 12 (contd.) Alphabetical list of Towns with their population, 1996 and 2002
Town County in which situated
1996 2002 Change in population 1996-2002
Persons Persons Males Females Actual Percentage
E
Easky Sligo 174 211 110 101 37 21.3Edenderry* Offaly 3,591 4,216 2,133 2,083 625 17.4Edenderry Environs Offaly 234 343 169 174 109 46.6Edgeworthstown (see Meathas Truim)Elphin Roscommon 545 527 258 269 -18 -3.3Emly Tipperary South 324 278 151 127 -46 -14.2Emo Laoighis 231 220 117 103 -11 -4.8Emyvale Monaghan 484 583 284 299 99 20.5Enfield Meath 566 1,072 522 550 506 89.4Ennis Town* Clare 15,333 18,830 9,018 9,812 3,497 22.8Ennis Environs Clare 2,393 3,221 1,618 1,603 828 34.6Enniscorthy Town* Wexford 3,788 3,764 1,826 1,938 -24 -0.6Enniscorthy Environs Wexford 3,852 5,200 2,489 2,711 1,348 35.0Enniskean (see Ballineen/Enniskean)Enniskerry Wicklow 1,275 1,904 926 978 629 49.3Ennistymon Clare 920 881 431 450 -39 -4.2Eyrecourt Galway 337 354 162 192 17 5.0
F
Fahan Donegal 284 338 151 187 54 19.0Falcarragh (or Cross Roads) Donegal 961 852 412 440 -109 -11.3Farran Cork 331 368 178 190 37 11.2Farsid (see Aghada-Farsid-Rostellan)Feakle Clare 159 149 59 90 -10 -6.3Fenit Kerry 390 433 224 209 43 11.0Ferbane Offaly 1,270 1,198 577 621 -72 -5.7Fermoy Town* Cork 2,310 2,270 1,092 1,178 -40 -1.7Fermoy Environs Cork 2,159 2,534 1,213 1,321 375 17.4Ferns Wexford 915 985 477 508 70 7.7Fethard Tipperary South 1,397 1,388 692 696 -9 -0.6Fethard-on-Sea Wexford 290 302 152 150 12 4.1Ford Wexford 235 378 168 210 143 60.9Fountainstown Cork 857 852 421 431 -5 -0.6Foxford Mayo 944 878 418 460 -66 -7.0Foynes Limerick 558 491 257 234 -67 -12.0Frankford (see Kilcormac)Frenchpark Roscommon 290 358 173 185 68 23.4Freshford Kilkenny 632 756 389 367 124 19.6Furbogh Galway – 319 149 170 – –
G
Galbally Limerick 246 235 115 120 -11 -4.5Galway City* Galway 57,241 65,832 31,015 34,817 8,591 15.0Galway Suburbs Galway 122 331 176 155 209 171.3Carrigkerry Limerick – 173 87 86 – – Garristown Fingal 228 289 149 140 61 26.8Geashill Offaly 363 344 165 179 -19 -5.2Glanworth Cork 400 378 189 189 -22 -5.5Glassan Westmeath 198 216 105 111 18 9.1Glasslough Monaghan 306 296 124 172 -10 -3.3Glen Limerick – 216 104 112 – – Glenamaddy Galway 394 457 220 237 63 16.0Glenbeigh Kerry 251 330 166 164 79 31.5Glencolumbkille Donegal 236 254 130 124 18 7.6Glencullen Dún Laoghaire-
Rathdown – 204 90 114 – – Glenealy Wicklow 383 377 201 176 -6 -1.6Glenties Donegal 738 789 376 413 51 6.9Glin Limerick 554 560 286 274 6 1.1Gneevgullia Kerry 230 239 114 125 9 3.9Golden Tipperary South 262 268 135 133 6 2.3Goresbridge Kilkenny 407 401 195 206 -6 -1.5Gorey* Wexford 2,150 3,090 1,553 1,537 940 43.7Gorey Environs Wexford 1,789 2,192 1,078 1,114 403 22.5Gormanston Meath 435 504 315 189 69 15.9Gort Galway 1,182 1,776 902 874 594 50.3Gortahork Donegal 152 155 72 83 3 2.0Gortnahoo Tipperary South – 207 97 110 – – Gowran Kilkenny 476 454 224 230 -22 -4.6Grahormac Wexford – 162 82 80 – – Graiguenamanagh-Tinnahinch Carlow and
Kilkenny 1,374 1,435 735 700 61 4.4Granard* Longford 1,173 1,013 525 488 -160 -13.6
* Denotes a Town with a legally defined boundary.
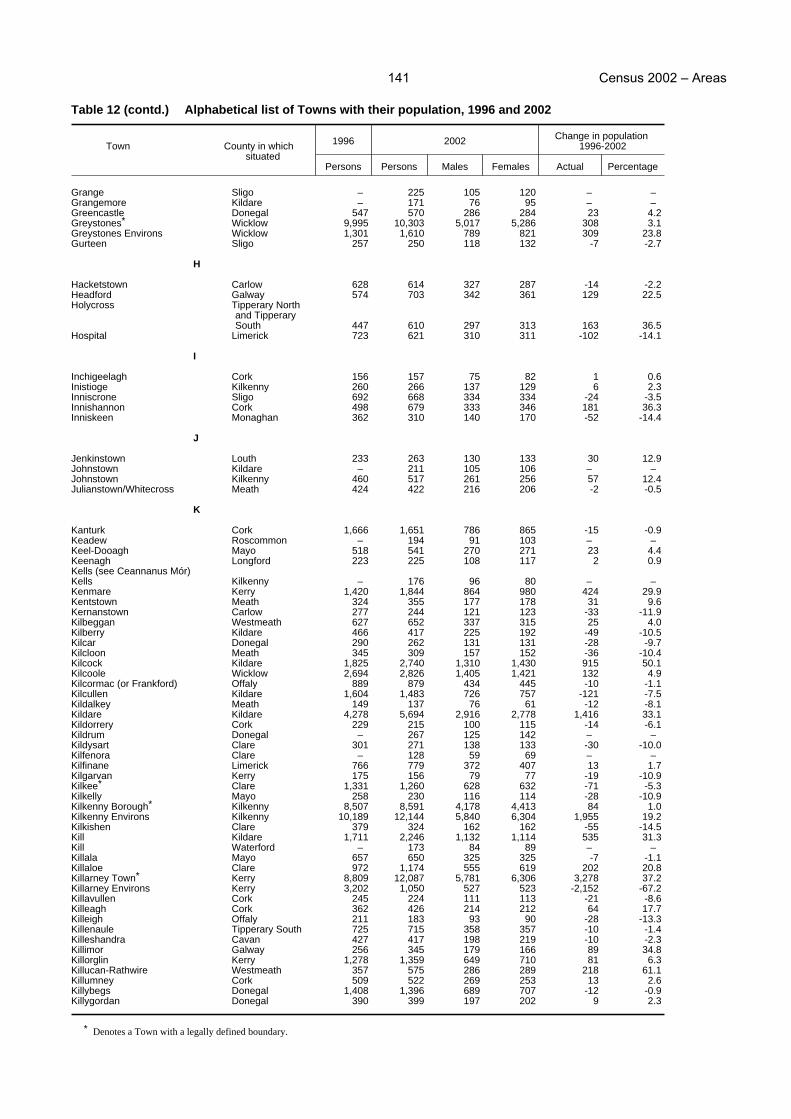
Census 2002 Areas141
Table 12 (contd.) Alphabetical list of Towns with their population, 1996 and 2002
Town County in which situated
1996 2002 Change in population 1996-2002
Persons Persons Males Females Actual Percentage
Grange Sligo – 225 105 120 – – Grangemore Kildare – 171 76 95 – – Greencastle Donegal 547 570 286 284 23 4.2Greystones* Wicklow 9,995 10,303 5,017 5,286 308 3.1Greystones Environs Wicklow 1,301 1,610 789 821 309 23.8Gurteen Sligo 257 250 118 132 -7 -2.7
H
Hacketstown Carlow 628 614 327 287 -14 -2.2Headford Galway 574 703 342 361 129 22.5Holycross Tipperary North
and TipperarySouth 447 610 297 313 163 36.5
Hospital Limerick 723 621 310 311 -102 -14.1
I
Inchigeelagh Cork 156 157 75 82 1 0.6Inistioge Kilkenny 260 266 137 129 6 2.3Inniscrone Sligo 692 668 334 334 -24 -3.5Innishannon Cork 498 679 333 346 181 36.3Inniskeen Monaghan 362 310 140 170 -52 -14.4
J
Jenkinstown Louth 233 263 130 133 30 12.9Johnstown Kildare – 211 105 106 – – Johnstown Kilkenny 460 517 261 256 57 12.4Julianstown/Whitecross Meath 424 422 216 206 -2 -0.5
K
Kanturk Cork 1,666 1,651 786 865 -15 -0.9Keadew Roscommon – 194 91 103 – – Keel-Dooagh Mayo 518 541 270 271 23 4.4Keenagh Longford 223 225 108 117 2 0.9Kells (see Ceannanus Mór)Kells Kilkenny – 176 96 80 – – Kenmare Kerry 1,420 1,844 864 980 424 29.9Kentstown Meath 324 355 177 178 31 9.6Kernanstown Carlow 277 244 121 123 -33 -11.9Kilbeggan Westmeath 627 652 337 315 25 4.0Kilberry Kildare 466 417 225 192 -49 -10.5Kilcar Donegal 290 262 131 131 -28 -9.7Kilcloon Meath 345 309 157 152 -36 -10.4Kilcock Kildare 1,825 2,740 1,310 1,430 915 50.1Kilcoole Wicklow 2,694 2,826 1,405 1,421 132 4.9Kilcormac (or Frankford) Offaly 889 879 434 445 -10 -1.1Kilcullen Kildare 1,604 1,483 726 757 -121 -7.5Kildalkey Meath 149 137 76 61 -12 -8.1Kildare Kildare 4,278 5,694 2,916 2,778 1,416 33.1Kildorrery Cork 229 215 100 115 -14 -6.1Kildrum Donegal – 267 125 142 – – Kildysart Clare 301 271 138 133 -30 -10.0Kilfenora Clare – 128 59 69 – – Kilfinane Limerick 766 779 372 407 13 1.7Kilgarvan Kerry 175 156 79 77 -19 -10.9Kilkee* Clare 1,331 1,260 628 632 -71 -5.3Kilkelly Mayo 258 230 116 114 -28 -10.9Kilkenny Borough* Kilkenny 8,507 8,591 4,178 4,413 84 1.0Kilkenny Environs Kilkenny 10,189 12,144 5,840 6,304 1,955 19.2Kilkishen Clare 379 324 162 162 -55 -14.5Kill Kildare 1,711 2,246 1,132 1,114 535 31.3Kill Waterford – 173 84 89 – – Killala Mayo 657 650 325 325 -7 -1.1Killaloe Clare 972 1,174 555 619 202 20.8Killarney Town* Kerry 8,809 12,087 5,781 6,306 3,278 37.2Killarney Environs Kerry 3,202 1,050 527 523 -2,152 -67.2Killavullen Cork 245 224 111 113 -21 -8.6Killeagh Cork 362 426 214 212 64 17.7Killeigh Offaly 211 183 93 90 -28 -13.3Killenaule Tipperary South 725 715 358 357 -10 -1.4Killeshandra Cavan 427 417 198 219 -10 -2.3Killimor Galway 256 345 179 166 89 34.8Killorglin Kerry 1,278 1,359 649 710 81 6.3Killucan-Rathwire Westmeath 357 575 286 289 218 61.1Killumney Cork 509 522 269 253 13 2.6Killybegs Donegal 1,408 1,396 689 707 -12 -0.9Killygordan Donegal 390 399 197 202 9 2.3
* Denotes a Town with a legally defined boundary.

Census 2002 Areas142
Table 12 (contd.) Alphabetical list of Towns with their population, 1996 and 2002
Town County in which situated
1996 2002 Change in population 1996-2002
Persons Persons Males Females Actual Percentage
Kilmacanogue Wicklow 818 834 417 417 16 2.0Kilmacow Kilkenny 599 566 284 282 -33 -5.5Kilmacrennan Donegal 363 430 204 226 67 18.5Kilmacthomas Waterford 681 717 353 364 36 5.3Kilmaine Mayo – 184 93 91 – – Kilmainham Meath – 237 106 131 – – Kilmallock Limerick 1,231 1,362 685 677 131 10.6Kilmeage Kildare 451 436 215 221 -15 -3.3Kilmessan Meath 230 292 148 144 62 27.0Kilmihill Clare 357 325 172 153 -32 -9.0Kilmoganny Kilkenny 247 236 122 114 -11 -4.5Kilmore Quay Wexford 406 417 208 209 11 2.7Kilnaleck Cavan 253 305 139 166 52 20.6Kilpedder Wicklow 480 517 263 254 37 7.7Kilrane Wexford 301 309 150 159 8 2.7Kilronan Galway 265 270 133 137 5 1.9Kilrush Town* Clare 2,594 2,699 1,330 1,369 105 4.0Kilsaran (see Castlebellingham/Kilsaran)Kilsheelan Tipperary South 461 497 259 238 36 7.8Kiltimagh Mayo 917 1,000 486 514 83 9.1Kilworth Cork 441 427 210 217 -14 -3.2Kingscourt Cavan 1,190 1,307 648 659 117 9.8Kinlough Leitrim 286 335 171 164 49 17.1Kinnegad Westmeath 517 1,296 676 620 779 150.7Kinnitty Offaly 249 226 117 109 -23 -9.2Kinsale Town* Cork 2,007 2,257 1,137 1,120 250 12.5Kinsale Environs Cork 1,057 1,297 618 679 240 22.7Kinsealy-Drinan Fingal 2,182 2,110 1,061 1,049 -72 -3.3Kinvara Galway 432 447 220 227 15 3.5Knightstown Kerry 191 172 101 71 -19 -9.9Knock Mayo 575 595 220 375 20 3.5Knockbridge Louth 274 335 170 165 61 22.3Knockglass Cork – 239 120 119 – – Knocklong Limerick 248 204 101 103 -44 -17.7Knocknagree Cork 193 204 96 108 11 5.7
L
Lackaghbeg Galway – 220 101 119 – – Ladytown Kildare – 242 125 117 – – Laghy Donegal 144 174 85 89 30 20.8Lahinch Clare 580 625 288 337 45 7.8Lanesborough-Ballyleague Longford and
Roscommon 984 943 481 462 -41 -4.2Lawcus Kilkenny – 273 145 128 – – Laragh Wicklow 267 357 174 183 90 33.7Laytown-Bettystown-Mornington Meath 3,678 5,597 2,705 2,892 1,919 52.2Leap Cork 168 160 79 81 -8 -4.8Leighlinbridge Carlow 508 646 331 315 138 27.2Leixlip* Kildare 13,451 15,016 7,568 7,448 1,565 11.6Lemybrien Waterford 197 210 114 96 13 6.6Letterkenny Town* Donegal 7,606 7,965 3,692 4,273 359 4.7Letterkenny Environs Donegal 4,390 7,266 3,502 3,764 2,876 65.5Lifford Donegal 1,275 1,395 659 736 120 9.4Limerick City* Limerick 52,039 54,023 26,128 27,895 1,984 3.8Limerick Suburbs Limerick and
Clare 27,098 32,975 16,289 16,686 5,877 21.7Liscannor Clare – 108 49 59 – – Liscarroll Cork 279 256 119 137 -23 -8.2Lisdoonvarna Clare 890 822 366 456 -68 -7.6Lismore* Waterford 729 788 396 392 59 8.1Lismore Environs Waterford 366 394 202 192 28 7.7Listowel Town* Kerry 3,393 3,589 1,699 1,890 196 5.8Listowel Environs Kerry 263 410 208 202 147 55.9Littleton Tipperary North 544 500 261 239 -44 -8.1Lixnaw Kerry 263 248 118 130 -15 -5.7Longford Town* Longford 6,444 6,831 3,290 3,541 387 6.0Longford Environs Longford 540 726 340 386 186 34.4Longwood Meath 186 480 224 256 294 158.1Loughanure Donegal 262 312 162 150 50 19.1Loughbeg (see Ringaskiddy)Loughglinn Roscommon 186 182 81 101 -4 -2.2Loughrea* Galway 3,335 4,004 1,881 2,123 669 20.1Loughshinny Fingal 614 663 344 319 49 8.0Louisburgh Mayo 150 207 87 120 57 38.0Louth Louth 401 514 263 251 113 28.2Lusk Fingal 2,287 2,456 1,220 1,236 169 7.4
* Denotes a Town with a legally defined boundary.

Census 2002 Areas143
Table 12 (contd.) Alphabetical list of Towns with their population, 1996 and 2002
Town County in which situated
1996 2002 Change in population 1996-2002
Persons Persons Males Females Actual Percentage
M
Macroom Town* Cork 2,457 2,836 1,377 1,459 379 15.4Macroom Environs Cork 117 149 69 80 32 27.4Maddenstown Kildare 189 179 89 90 -10 -5.3Malahide Fingal 13,539 13,826 6,824 7,002 287 2.1Mallow Town* Cork 6,434 7,091 3,394 3,697 657 10.2Mallow Environs Cork 1,334 1,846 906 940 512 38.4Manorcunningham Donegal 404 320 162 158 -84 -20.8Manorhamilton Leitrim 1,008 927 479 448 -81 -8.0Maryborough (see Portlaoighise)Maynooth Kildare 8,528 10,151 4,958 5,193 1,623 19.0Meathas Truim (or Edgeworthstown) Longford 737 726 343 383 -11 -1.5Meenlaragh Donegal 440 430 217 213 -10 -2.3Midleton Town* Cork 3,266 3,798 1,821 1,977 532 16.3Midleton Environs Cork 2,943 4,159 2,066 2,093 1,216 41.3Milford Cork 208 204 90 114 -4 -1.9Milford Donegal 816 793 401 392 -23 -2.8Millstreet Cork 1,226 1,289 637 652 63 5.1Milltown Kerry 332 332 161 171 – – Milltown Kildare 297 271 137 134 -26 -8.8Miltown Malbay Clare 626 562 257 305 -64 -10.2Mitchelstown Cork 3,123 3,300 1,634 1,666 177 5.7Moate Westmeath 1,452 1,520 724 796 68 4.7Model Village (or Dripsey) Cork 319 295 147 148 -24 -7.5Mohill Leitrim 808 786 386 400 -22 -2.7Monaghan Town* Monaghan 5,628 5,717 2,730 2,987 89 1.6Monaghan Environs Monaghan 214 219 116 103 5 2.3Monasterevan Kildare 2,302 2,583 1,234 1,349 281 12.2Moneenroe Kilkenny 655 678 340 338 23 3.5Moneygall Offaly 332 291 151 140 -41 -12.3Monivea Galway 298 300 151 149 2 0.7Montpelier (see O’Briensbridge Montpelier)Mooncoin Kilkenny 855 854 423 431 -1 -0.1Mornington (see Laytown-Bettystown-Mornington)Moroe Limerick 435 464 245 219 29 6.7Mount Bellew Galway 547 667 353 314 120 21.9Mountcharles Donegal 428 432 212 220 4 0.9Mountcollins Limerick 271 230 129 101 -41 -15.1Mountmellick* Laoighis 2,325 2,525 1,268 1,257 200 8.6Mountmellick Environs Laoighis 587 836 422 414 249 42.4Mountrath Laoighis 1,298 1,331 661 670 33 2.5Moville Donegal 1,394 1,465 707 758 71 5.1Moycullen Galway 601 883 433 450 282 46.9Moylough Galway 209 236 118 118 27 12.9Mucklagh Offaly 342 521 256 265 179 52.3Muff Donegal 334 773 406 367 439 131.4Muinebeag* (formerly Bagenalstown) Carlow 2,553 2,540 1,304 1,236 -13 -0.5Muinebeag Environs Carlow 142 188 103 85 46 32.4Mullagh Cavan 403 479 235 244 76 18.9Mullaghmore Sligo 164 137 69 68 -27 -16.5Mullinahone Tipperary South 358 348 177 171 -10 -2.8Mullinavat Kilkenny 275 309 160 149 34 12.4Mullingar* Westmeath 8,040 8,824 4,253 4,571 784 9.8Mullingar Environs Westmeath 4,452 6,797 3,368 3,429 2,345 52.7Multyfarnham Westmeath – 153 80 73 – – Mungret Limerick 292 248 115 133 -44 -15.1Murntown Wexford 184 243 121 122 59 32.1
N
Naas Town* Kildare 14,074 18,288 9,250 9,038 4,214 29.9Naul Fingal – 215 109 106 – – Navan (An Uaimh) Town* Meath 3,447 3,406 1,668 1,738 -41 -1.2Navan Environs Meath 9,363 16,011 7,890 8,121 6,648 71.0Nenagh Town* Tipperary North 5,645 6,121 2,967 3,154 476 8.4Nenagh Environs Tipperary North 268 333 159 174 65 24.3Newbawn Wexford – 169 91 78 – – Newbliss Monaghan 299 270 137 133 -29 -9.7Newbridge (see Droichead Nua)Newcastle South Dublin 1,289 1,160 581 579 -129 -10.0
* Denotes a Town with a legally defined boundary.

Census 2002 Areas144
Table 12 (contd.) Alphabetical list of Towns with their population, 1996 and 2002
Town County in which situated
1996 2002 Change in population 1996-2002
Persons Persons Males Females Actual Percentage
Newcastle Tipperary South 186 201 95 106 15 8.1Newcastle Wicklow 763 851 424 427 88 11.5Newcastle West Limerick 3,618 4,017 1,915 2,102 399 11.0Newmarket Cork 1,150 1,055 521 534 -95 -8.3Newmarket-on-Fergus Clare 1,542 1,496 762 734 -46 -3.0Newport Mayo 567 527 244 283 -40 -7.1Newport Tipperary North 873 887 429 458 14 1.6New Ross Town* Wexford 5,012 4,810 2,338 2,472 -202 -4.0New Ross Environs Kilkenny and
Wexford 1,135 1,727 820 907 592 52.2Newtown Cork 184 224 114 110 40 21.7Newtown Laoighis 207 245 118 127 38 18.4Newtowncunningham Donegal 594 663 339 324 69 11.6Newtownforbes Longford 470 561 273 288 91 19.4Newtownmountkennedy Wicklow 2,528 2,521 1,304 1,217 -7 -0.3Newtownsandes Kerry 370 326 185 141 -44 -11.9Nobber Meath 242 245 122 123 3 1.2Nurney Kildare – 239 130 109 – –
O
O’Briensbridge-Montpelier Clare andLimerick 409 375 201 174 -34 -8.3
Oilgate Wexford 262 265 139 126 3 1.1Oldcastle Meath 826 937 488 449 111 13.4Omeath Louth 249 231 114 117 -18 -7.2Oldtown Fingal – 162 81 81 – – Oola Limerick 444 391 185 206 -53 -11.9Oranmore Galway 1,410 1,692 839 853 282 20.0Oughterard Galway 751 1,209 600 609 458 61.0
P
Pallas Grean Limerick 303 368 184 184 65 21.5Pallaskenry Limerick 519 550 279 271 31 6.0Passage East Waterford 573 636 339 297 63 11.0Passage West* Cork 3,638 4,184 2,074 2,110 546 15.0Passage West Environs Cork 284 411 202 209 127 44.7Patrickswell Limerick 1,022 998 530 468 -24 -2.3Paulstown Kilkenny 221 292 146 146 71 32.1Pettigo (pt.) (a) Donegal 320 275 142 133 -45 -14.1Piercetown Wexford 309 471 235 236 162 52.4Piltown Kilkenny 716 778 388 390 62 8.7Portarlington Laoighis and
Offaly 3,320 4,001 1,992 2,009 681 20.5Portlaoighise* (formerly Maryborough) Laoighis 3,531 3,482 1,799 1,683 -49 -1.4Portlaoighise Environs Laoighis 5,943 8,645 4,458 4,187 2,702 45.5Portlaw Waterford 1,176 1,183 569 614 7 0.6Portmarnock Fingal 9,145 8,376 4,190 4,186 -769 -8.4Portrane Fingal 1,924 1,726 890 836 -198 -10.3Portroe Tipperary North 411 401 194 207 -10 -2.4Portumna Galway 984 1,235 618 617 251 25.5Prosperous Kildare 814 1,523 746 777 709 87.1Puckaun Tipperary North 235 269 132 137 34 14.5
Q
Quilty Clare 259 234 124 110 -25 -9.7Quin Clare 242 427 207 220 185 76.4
R
Raharney Westmeath 232 232 116 116 – – Ramelton Donegal 978 1,051 528 523 73 7.5Rannafast Donegal 299 279 143 136 -20 -6.7Raphoe Donegal 1,065 949 455 494 -116 -10.9Rathangan Kildare 1,190 1,811 917 894 621 52.2Rathard Cork – 172 88 84 – – Rathcoole South Dublin 2,784 2,499 1,290 1,209 -285 -10.2Rathcormac Cork 382 429 220 209 47 12.3Rathdowney Laoighis 1,066 1,111 564 547 45 4.2Rathdrum Wicklow 1,234 1,387 683 704 153 12.4Rathkeale Limerick 1,546 1,362 639 723 -184 -11.9Rathluirc (or Charleville) Cork 2,667 2,685 1,321 1,364 18 0.7
* Denotes a Town with a legally defined boundary.

Census 2002 Areas145
Table 12 (contd.) Alphabetical list of Towns with their population, 1996 and 2002
Town County in which situated
1996 2002 Change in population 1996-2002
Persons Persons Males Females Actual Percentage
Rathmolyon Meath 206 194 97 97 -12 -5.8Rathmore Kerry 470 450 227 223 -20 -4.3Rathmullen Donegal 491 514 238 276 23 4.7Rathnew Wicklow 1,437 1,441 715 726 4 0.3Rathvilly Carlow 458 500 259 241 42 9.2Rathwire (see Killucan-Rathwire)Ratoath Meath 1,061 3,794 1,913 1,881 2,733 257.6Reardnogy Tipperary North – 159 83 76 – – Rhode Offaly 476 705 342 363 229 48.1Ring Waterford 289 332 174 158 43 14.9Ringaskiddy (or Loughbeg) Cork 429 407 201 206 -22 -5.1Rivermeade Fingal 621 558 274 284 -63 -10.1Riverstown Sligo 266 273 146 127 7 2.6Robertstown Kildare 206 375 186 189 169 82.0Rochfortbridge Westmeath 724 1,382 687 695 658 90.9Rockcorry Monaghan 260 287 140 147 27 10.4Roosky Leitrim and
Roscommon 220 198 120 78 -22 -10.0Roscommon Roscommon 3,915 4,489 2,200 2,289 574 14.7Roscrea Tipperary North 4,170 4,578 2,239 2,339 408 9.8Rosscarbery Cork 406 437 205 232 31 7.6Rosses Point Sligo 799 774 374 400 -25 -3.1Rosslare Wexford 929 1,145 520 625 216 23.3Rosslare Harbour (see Ballygeary)Rostellan (see Aghada-Farsid-Rostellan)Roundstone Galway 241 239 122 117 -2 -0.8Roundwood Wicklow 446 518 263 255 72 16.1Rush Fingal 5,429 6,769 3,412 3,357 1,340 24.7
S
Saggart South Dublin 550 588 302 286 38 6.9St. Johnston Donegal 453 470 224 246 17 3.8Sallins Kildare 854 2,922 1,468 1,454 2,068 242.2Scarriff Clare 763 807 405 402 44 5.8Schull Cork 595 693 331 362 98 16.5Scotstown Monaghan 234 220 114 106 -14 -6.0Shanagarry Cork 230 291 149 142 61 26.5Shanagolden Limerick 412 373 202 171 -39 -9.5Shannon* Clare 7,811 8,228 4,218 4,010 417 5.3Shannon Environs Clare 128 333 174 159 205 160.2Shannonbridge Offaly 266 248 136 112 -18 -6.8Shercock Cavan 380 454 215 239 74 19.5Shillelagh Wicklow 324 278 140 138 -46 -14.2Shinrone Offaly 479 488 239 249 9 1.9Shrule Mayo 337 326 165 161 -11 -3.3Silvermines Tipperary North 202 257 127 130 55 27.2Sixmilebridge Clare 1,144 1,327 659 668 183 16.0Skerries Fingal 7,339 9,149 4,500 4,649 1,810 24.7Skibbereen Town* Cork 1,926 2,000 945 1,055 74 3.8Slane Meath 688 823 420 403 135 19.6Slieverue Kilkenny 296 461 209 252 165 55.7Sligo Borough* Sligo 17,786 18,473 8,569 9,904 687 3.9Sligo Environs Sligo 723 1,262 625 637 539 74.6Smithborough Monaghan 232 240 121 119 8 3.4Sneem Kerry 296 285 136 149 -11 -3.7Spa Kerry 394 424 215 209 30 7.6Spiddle Galway – 190 99 91 – – Spunkane (see Waterville-Spunkane)Stamullen Meath 427 779 394 385 352 82.4Stradbally Laoighis 1,047 1,178 559 619 131 12.5Stradbally Waterford 262 298 141 157 36 13.7Stratford Wicklow – 151 78 73 – – Straffan Kildare 341 332 178 154 -9 -2.6Strandhill Sligo 764 1,002 492 510 238 31.2Stranorlar (see Ballybofey-Stranorlar)Strokestown Roscommon 572 631 314 317 59 10.3Summerhill Meath 502 668 322 346 166 33.1Suncroft Kildare 490 498 279 219 8 1.6Swanlinbar Cavan 191 223 120 103 32 16.8Swinford Mayo 1,386 1,497 689 808 111 8.0Swords Fingal 22,314 27,175 13,494 13,681 4,861 21.8
* Denotes a Town with a legally defined boundary.

Census 2002 Areas146
Table 12 (contd.) Alphabetical list of Towns with their population, 1996 and 2002
Town County in which situated
1996 2002 Change in population 1996-2002
Persons Persons Males Females Actual Percentage
T
Taghmon Wexford 619 625 300 325 6 1.0Tallanstown Louth 408 443 223 220 35 8.6Tallow Waterford 802 845 419 426 43 5.4Tarbert Kerry 605 548 280 268 -57 -9.4Templemore Town* Tipperary North 2,115 2,159 1,109 1,050 44 2.1Templemore Environs Tipperary North 129 111 56 55 -18 -14.0Templetuohy Tipperary North 293 325 172 153 32 10.9Termonfeckin Louth 530 503 251 252 -27 -5.1Thomastown Kilkenny 1,581 1,600 779 821 19 1.2Thurles Town* Tipperary North 6,603 6,852 3,248 3,604 249 3.8Thurles Environs Tipperary North. 336 573 272 301 237 70.5Tievebane Donegal 236 267 134 133 31 13.1Timoleague Cork 285 323 166 157 38 13.3Tinahely Wicklow 630 692 343 349 62 9.8Tinnahinch (see Graiguenamanagh-Tinnahinch)Tinriland Carlow 331 371 191 180 40 12.1Tinure Louth – 296 154 142 – – Tipperary Town* Tipperary South 4,640 4,546 2,224 2,322 -94 -2.0Tipperary Environs Tipperary South 214 418 221 197 204 95.3Toomevara Tipperary North 362 321 166 155 -41 -11.3Tower Cork 1,841 3,032 1,498 1,534 1,191 64.7Tralee Town* Kerry 19,056 20,375 9,686 10,689 1,319 6.9Tralee Environs Kerry 894 1,612 790 822 718 80.3Tramore* Waterford 6,536 8,115 3,980 4,135 1,579 24.2Tramore Environs Waterford – 190 100 90 – – Trim Town* Meath 1,740 1,447 729 718 -293 -16.8Trim Environs Meath 2,665 4,447 2,166 2,281 1,782 66.9Tuam* Galway 3,487 3,104 1,520 1,584 -383 -11.0Tuam Environs Galway 2,140 2,843 1,395 1,448 703 32.9Tubbercurry Sligo 1,089 1,171 572 599 82 7.5Tulla Clare 382 414 206 208 32 8.4Tullamore Town* Offaly 9,221 10,270 4,908 5,362 1,049 11.4Tullamore Environs Offaly 818 828 416 412 10 1.2Tullow Carlow 2,364 2,417 1,162 1,255 53 2.2Tullyallen Louth 429 617 310 307 188 43.8Twomileborris Tipperary North 325 474 245 229 149 45.8Tyrrellspass Westmeath 396 443 210 233 47 11.9
U
Unionhall Cork 206 202 104 98 -4 -1.9Urlingford Kilkenny 689 739 377 362 50 7.3
V
Villierstown Waterford – 192 100 92 – – Virginia Cavan 811 1,093 554 539 282 34.8
W
Waterford City* Waterford 42,540 44,594 21,782 22,812 2,054 4.8Waterford Suburbs Kilkenny 1,615 2,142 1,014 1,128 527 32.6Watergrasshill Cork 252 386 185 201 134 53.2Waterville-Spunkane Kerry 466 538 258 280 72 15.5Westport Town* Mayo 4,253 5,314 2,447 2,867 1,061 24.9Westport Environs Mayo 267 320 164 156 53 19.9Wexford Borough* Wexford 9,533 9,449 4,612 4,837 -84 -0.9Wexford Environs Wexford 6,329 7,786 3,725 4,061 1,457 23.0Whitecross (see Julianstown/Whitecross)Whitegate Cork 293 440 234 206 147 50.2Whitegate Clare 200 193 90 103 -7 -3.5Wicklow Town* Wicklow 6,416 7,031 3,457 3,574 615 9.6Wicklow Environs Wicklow 874 2,324 1,167 1,157 1,450 165.9Woodford Galway 298 280 129 151 -18 -6.0
Y
Youghal Town* Cork 5,630 6,203 3,070 3,133 573 10.2Youghal Environs Cork 313 394 188 206 81 25.9
Towns of all sizes State 2,373,741 2,616,472 1,273,244 1,343,228 242,731 10.2
* Denotes a Town with a legally defined boundary.

APPENDICES

148
Appendix 1
2002 Census questionnaireThe attached extract is taken from the household form used in the 2002 Census. The household form covers 6persons and consists of 24 pages. The attached extract covers persons 1 and 2 only. The layouts for persons 4 to6 are identical to that for person 2.

161
Appendix 2
Administrative and Census AreasIntroduction
There are many different territorial divisions of the country of which the most important, from the point of view ofthe Census of Population, are described below. All the areas are as defined at the date of the 2002 Census andany subsequent revisions have not been taken into account.
Townlands
The enumeration of the census is carried out, in the first instance, by townlands in rural areas and by streets inurban areas. The townland is the smallest territorial division used for administrative purposes. Populationfigures in respect of townlands, of which there are about 51,000, have not been published since the census of1911. Townlands are not used as administrative areas within the boundaries of legally defined urban areas –Cities, and Towns - and for most other urban areas without legal boundaries it is not possible to compiletownland population figures as building development has completely obliterated the physical features by whichtownland boundaries were originally defined on Ordnance Survey maps.
Electoral Divisions (EDs)
The term District Electoral Division was changed to Electoral Division by Section 23 of the Local GovernmentAct, 1994. This change came into effect on 24 June 1996 (S.I. 196 of 1996 refers). Under the County Boroughof Dublin (Wards) Amendments Regulation, 1997, the name Cherry Orchard was amended to the name Carna(S.I. 43 of 1997 refers). The smallest administrative area for which population statistics are published is theElectoral Division. In rural areas each Electoral Division consists of an aggregation of entire townlands. Thereare 3,440 Electoral Divisions in the State and their populations are given in Table 6 of this publication.
Town and Rural Districts
Electoral Divisions are aggregated to give Towns1 (or Cities where appropriate) and Rural Districts which, inturn, build up to counties. The Rural Districts, which numbered 160, were abolished as administrative areas in1925 (in the case of Rural Districts in County Dublin, in 1930) but have been retained for census purposes asconvenient units of area, intermediate in size between Electoral Divisions and Counties. They are termed ruralareas in the present report. In the case of County Dublin, however, it is not possible to compile Rural Districtfigures because of extensive revisions that have taken place in the boundaries of Electoral Divisions over theyears. Population figures for Towns and rural areas are given in Table 6 of this volume.
Counties and Cities
Under the Local Government Act, 2001 (S.I. 591 of 2001), the areas formerly known as County Boroughs arenow called Cities. Areas formally known as Municipal Boroughs are now called Boroughs. The area ofTipperary North Riding and Tipperary South Riding are now known as Tipperary North and Tipperary South,respectively.
In the census reports the country is divided into 29 Counties and five Cities. Outside Dublin there are 26administrative counties (Tipperary North and Tipperary South each ranks as a separate county foradministrative purposes) and four Cities, i.e. Cork, Limerick, Waterford and Galway. In Dublin, four areas areidentified separately, i.e. Dublin City and the three Administrative Counties of Dún Laoghaire-Rathdown, Fingaland South Dublin.
The boundaries of the Cities are subject to periodic extensions to keep pace with building development and it isnot possible, therefore, to show comparable retrospective population figures over an extended period.Counties, on the other hand, have only been affected to a very minor extent by boundary changes and it ispossible to compare county populations (including the appropriate Cities) over a long period of time. This isdone in Table 2, which shows county population figures for each census year from 1841 to 2002.
1 A complete list of extensions to Town boundaries made by Government Orders is given in Appendix 4.

162
Appendix 2 (contd.)
Dáil Constituencies
For the purpose of elections to Dáil Éireann the country is divided into Constituencies which, under Article 16.4of the Constitution of Ireland, have to be revised at least once every twelve years with due regard to changes inthe distribution of the population. The Constituencies were last revised in 1998 and the Schedule to theElectoral (Amendment) (No. 2) Act, 1998 contains details of their composition. The 2002 population figures forthese areas are given in Table 8.
Local Electoral Areas
For the purpose of County Council and Corporation elections each county and city is divided into Local ElectoralAreas which are constituted on the basis of Orders made under the Local Government Act, 1941. In general,these areas are formed by aggregating Electoral Divisions. However, in a number of cases Electoral Divisionsare divided between Local Electoral Areas to facilitate electors. Population figures for Local Electoral Areas aregiven in Table 9. This table reflects the current composition of these local electoral areas as established byrelevant Statutory Instruments.
The boundaries between Counties Louth, Meath and Counties Carlow, Laois were altered, for electoralpurposes only, by the Local Government (Boundaries) (Town Elections) Regulations, 1994. Due to theseboundary changes, the sum of the number of persons in the Local Electoral Areas in each of these four countiesdoes not match the published population figures for these counties.
Towns
For census purposes towns fall into two types, namely those with and those without legally defined boundaries.
Towns with legally defined boundaries consist of:
(1) five Cities;(2) five Boroughs;(3) 75 Towns.
A list of all towns with legally defined boundaries is given in Appendix 3.
Under Section 62 of the Local Government Act, 1994 (S.I. 171 of 1994, the following six towns ceased to havetown status: Callan, Fethard, Newcastle West, Rathkeale, Roscommon and Tullow. The Towns ImprovementAct has now ceased under the Local Government Act, 2001 (S.I. 591 of 2001). Under this act the areas knownas Urban Districts are now called Towns, as are the 26 towns which were formally towns under the TownsImprovement Act.

163
Appendix 2 (contd.)
Towns without legally defined boundaries are called "census towns". Their boundaries are determined, forcensus purposes only, by the Central Statistics Office. There were 612 such towns in 2002.
(i) Towns with Legally Defined Boundaries
In the case of towns with legally defined boundaries it is necessary, for administrative purposes, tocompile population figures for the areas within these boundaries. However, many of these towns haveexpanded beyond their legally defined boundaries. As a result large numbers of persons in thecommunities for which these towns are the nuclei would be excluded if the coverage were confinedstrictly to legally defined boundaries. This problem tends to become more pronounced from one censusto the next as urban areas extend further into the surrounding countryside. Revisions of the legallydefined boundaries tend to lag behind these developments, as they are dependent on other factorsbesides the necessity of defining urban areas for Census of Population purposes.
Much of the census analysis is concerned with the overall size of population clusters and not simply withareas within legally defined boundaries. Consequently, where urban areas have extended beyond thelegally defined town boundary, the Central Statistics Office draws up new boundaries defining thesuburban areas of Cities/Boroughs and environs of other legal towns for census purposes.
Suburbs/environs are defined, in conformity with United Nations recommendations, as the continuationof a distinct population cluster outside its legally defined boundary in which no occupied dwelling is morethan 200 metres distant from the nearest occupied dwelling. New suburbs or environs are defined onlywhere there are at least twenty occupied dwellings outside the legal boundary within the new limit. Inapplying the 200-metre criterion, industrial, commercial and recreational buildings and facilities are notregarded as breaking the continuity of a built-up area.
Suburban areas for Dublin City and Cork City were defined for the first time at the 1951 Census. For the1956 Census all towns with legally defined boundaries were examined in co-operation with the LocalAuthorities concerned and where necessary, suburban areas or environs were defined for them forcensus purposes. The suburban boundaries were reviewed for each subsequent census. Acomprehensive review was carried out as part of the processing phase of the 2002 Census.
(ii) Census Towns
As in censuses since 1971, a census town is defined as a cluster of fifty or more occupied dwellings, nothaving a legally defined boundary, in which within a distance of 800 metres there is a nucleus of eitherthirty occupied houses on both sides of the road or twenty occupied houses on one side of the road. Acomplete review was carried out of the boundaries of existing and potential census towns as part of theprocessing phase of the 2002 Census. In this review the limits to existing census towns were extendedwhere appropriate using the 200-metre criterion as described for suburban areas above. 56 new censustowns were created for the 2002 Census. In addition, six towns, which ceased to be legally definedtowns, became census towns (see previous page).
For the censuses of 1926 to 1951 a census town was defined simply as a cluster of twenty or morehouses and the precise delimitation of the town was left to the discretion of the individual enumeratorconcerned. As part of the general review of towns for the 1956 Census, the boundaries for the censustowns were drawn up in consultation with the various Local Authorities applying uniform principles in allareas of the country. The definition of a census town was changed at the 1956 Census, from twentyhouses to twenty occupied houses; this definition was also applied at the 1961 and 1966 Censuses.
The population of towns is given in Tables 5, 7 and 12. Table 5 contains the total population of all towns and oftheir suburbs or environs where applicable, arranged in order of size within counties. An alphabetical list of alltowns in the country, with their populations, is given in Table 12. In Table 7, towns of 1,500 population and overare arranged in size groups based on total population. Total population in this context means the population ofthe towns, inclusive of suburbs or environs, if any.

164
Appendix 2 (contd.)
Dublin Area
The description Greater Dublin Area in the 2002 Census denotes Dublin City and its suburbs (i.e. GreaterDublin Suburbs). Various tables contain information on the population of Dublin City and individual towns(which are separately identified from Greater Dublin) as well as for the Aggregate Town and Aggregate RuralAreas of Dublin County and City.
Aggregate Town and Aggregate Rural Areas
In continuation of the definition used in reports of censuses since 1966, the population in the Aggregate TownArea, as shown in Tables 3, 4, and 7 of this volume and in the remaining volumes of the census report isdefined as those persons living in population clusters of 1,500 or more inhabitants. If a town with a legallydefined boundary has a suburban area or environs outside this boundary and if the total population made up ofthe population inside the legally defined boundary plus that in the suburbs or environs amounts to 1,500persons or over, this town (including its suburbs or environs) is classified as belonging to the Aggregate TownArea. Similarly, a census town with 1,500 inhabitants or over is classified as belonging to the Aggregate TownArea.
The population residing in all areas outside clusters of 1,500 or more inhabitants is classified as belonging to theAggregate Rural Area. It should be particularly noted that the term "Aggregate Rural Area" is not connectedwith that of rural area as described earlier. Whereas the Aggregate Rural Area is a statistical concept, the ruralarea is a former administrative unit of area. From Table 7 it may be seen that the Aggregate Town Areapopulation was 2,334,282 persons in 2002. Of this 1,317,473 resided within legally defined boundaries of townswhile 1,016,809 resided in the suburbs or environs of these towns or in census towns. Table 7 also shows thatthere were 5 towns with legally defined boundaries which were not large enough, even with the population oftheir environs, to be included in the Aggregate Town Area and that the total population in towns of all sizes,down to the lower limit of fifty occupied houses was 2,616,472 persons.
Gaeltacht Areas
The Gaeltacht Areas Orders, 1956, 1967, 1974 and 1982 defined the Gaeltacht as comprising 155 ElectoralDivisions or parts of Electoral Divisions in the counties of Cork, Donegal, Galway, Kerry, Mayo, Meath andWaterford. The population of these Electoral Divisions or parts thereof in 1996 and 2002 is given in Table 10.
Islands off the Coast
The population in 1996 and 2002 of inhabited islands off the coast is shown in Table 11. In some cases theareas of land concerned may not, strictly speaking, be considered as islands since they are connected to themainland by a causeway or bridge, or may be reached by land at low tide. However, they have been retainedunchanged in the present publication in order to provide continuity with previous censuses.
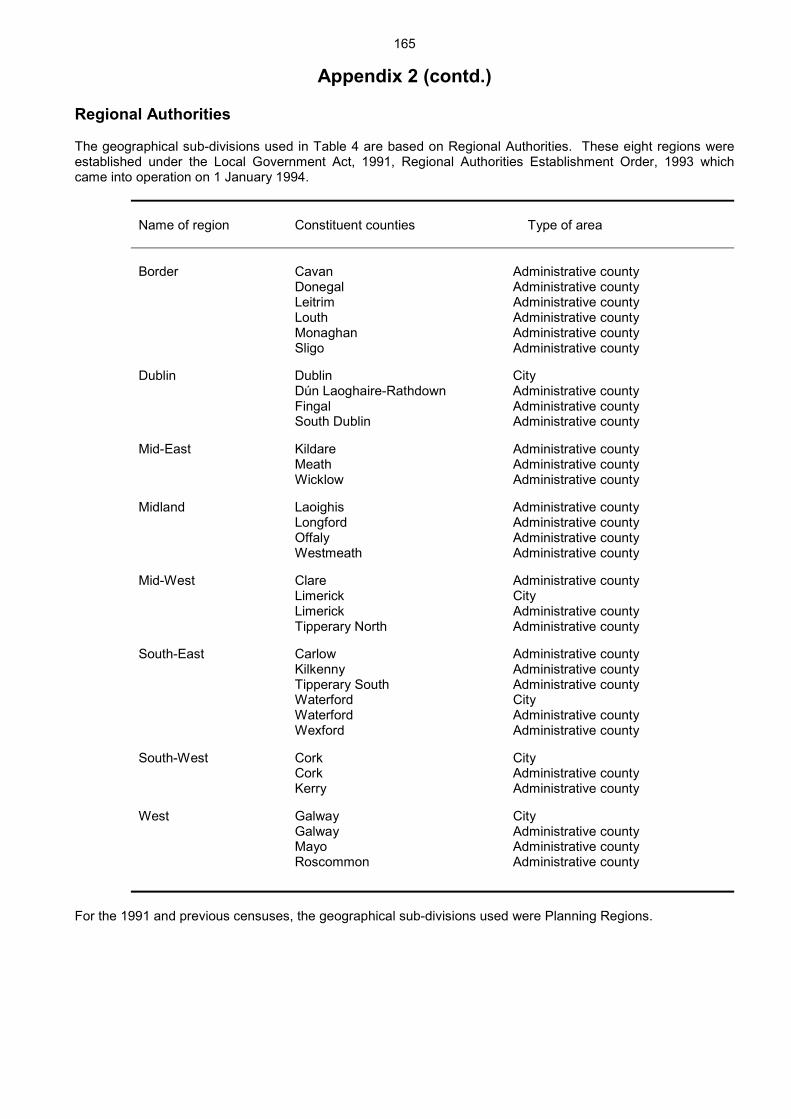
165
Appendix 2 (contd.)
Regional Authorities
The geographical sub-divisions used in Table 4 are based on Regional Authorities. These eight regions wereestablished under the Local Government Act, 1991, Regional Authorities Establishment Order, 1993 whichcame into operation on 1 January 1994.
Name of region Constituent counties Type of area
Border Cavan Administrative countyDonegal Administrative countyLeitrim Administrative countyLouth Administrative countyMonaghan Administrative countySligo Administrative county
Dublin Dublin CityDún Laoghaire-Rathdown Administrative countyFingal Administrative countySouth Dublin Administrative county
Mid-East Kildare Administrative countyMeath Administrative countyWicklow Administrative county
Midland Laoighis Administrative countyLongford Administrative countyOffaly Administrative countyWestmeath Administrative county
Mid-West Clare Administrative countyLimerick CityLimerick Administrative countyTipperary North Administrative county
South-East Carlow Administrative countyKilkenny Administrative countyTipperary South Administrative countyWaterford CityWaterford Administrative countyWexford Administrative county
South-West Cork CityCork Administrative countyKerry Administrative county
West Galway CityGalway Administrative countyMayo Administrative countyRoscommon Administrative county
For the 1991 and previous censuses, the geographical sub-divisions used were Planning Regions.

166
Appendix 2 (contd.)
Two further Regional Authorities to be known as Regional Assemblies were established in 1999 under the LocalGovernment Act, 1991, Regional Authorities Establishments Order, 1999 (S.I. 226 of 1999 refers). The twoassemblies are known as: (1) Border, Midland and Western Regional Assembly (BMW), and (2) South andEastern Regional Assembly (S&E). These assemblies are based on the Existing Regional Authority Structure.
Name of region Constituent Local Authorities
Border, Midland and Western RegionalAssembly
Cavan County Council
Donegal County CouncilGalway City CouncilGalway County CouncilLaois County CouncilLeitrim County CouncilLongford County CouncilLouth County CouncilMayo County CouncilMonaghan County CouncilOffaly County CouncilRoscommon County CouncilSligo County CouncilWestmeath County Council
Southern and Eastern Regional Assembly Carlow County CouncilClare County CouncilCork City CouncilCork County CouncilDublin City CouncilDún Laoghaire/Rathdown County CouncilFingal County CouncilKerry County CouncilKildare County CouncilKilkenny County CouncilLimerick City CouncilLimerick County CouncilMeath County CouncilSouth Dublin County CouncilNorth Tipperary County CouncilSouth Tipperary County CouncilWaterford County CouncilWaterford City CouncilWexford County CouncilWicklow County Council
Area Measurements
The measurement of area in hectares is shown in Table 6. The relevant area details have been provided byOrdnance Survey. The areas shown are exclusive of the areas of lakes, rivers and tideways.

167
Appendix 3
Towns with Legally Defined Boundaries
Cities County in which situated
Cork CorkDublin DublinGalway GalwayLimerick LimerickWaterford Waterford
Boroughs
Clonmel Tipperary SouthDrogheda LouthKilkenny KilkennySligo SligoWexford Wexford
Towns
Ardee LouthArklow WicklowAthlone WestmeathAthy KildareBalbriggan DublinBallina MayoBallinasloe GalwayBallybay MonaghanBallyshannon DonegalBandon CorkBantry CorkBelturbet CavanBirr OffalyBoyle RoscommonBray WicklowBuncrana DonegalBundoran DonegalCarlow CarlowCarrickmacross MonaghanCarrick-on-Suir Tipperary SouthCashel Tipperary SouthCastlebar MayoCastleblayney MonaghanCavan CavanCeannanus Mór (Kells) MeathClonakilty CorkClones MonaghanCobh CorkCootehill CavanDroichead Nua (Newbridge) KildareDundalk LouthDungarvan WaterfordEdenderry OffalyEnnis ClareEnniscorthy WexfordFermoy CorkGorey WexfordGranard LongfordGreystones WicklowKilkee Clare

168
Appendix 3 (contd.)
Towns County in which situated
Killarney KerryKilrush ClareKinsale CorkLeixlip KildareLetterkenny DonegalLismore WaterfordListowel KerryLongford LongfordLoughrea GalwayMacroom CorkMallow CorkMidleton CorkMonaghan MonaghanMountmellick LaoighisMuinebeag (Bagenalstown) CarlowMullingar WestmeathNaas KildareNavan (An Uaimh) MeathNenagh Tipperary NorthNew Ross WexfordPassage West CorkPortlaoighise (Maryborough) LaoighisShannon ClareSkibbereen CorkTemplemore Tipperary NorthThurles Tipperary NorthTipperary Tipperary SouthTralee KerryTramore WaterfordTrim MeathTuam GalwayTullamore OffalyWestport MayoWicklow WicklowYoughal Cork
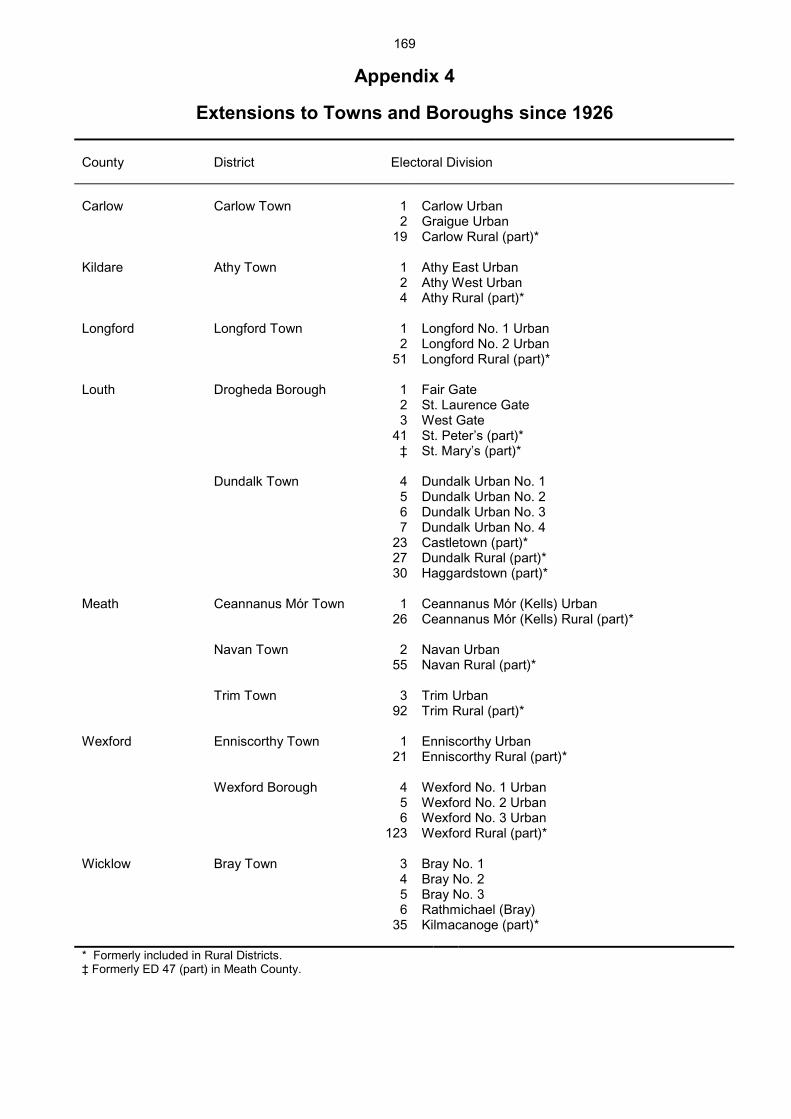
169
Appendix 4
Extensions to Towns and Boroughs since 1926
County District Electoral Division
Carlow Carlow Town 1 Carlow Urban2 Graigue Urban
19 Carlow Rural (part)*
Kildare Athy Town 1 Athy East Urban2 Athy West Urban4 Athy Rural (part)*
Longford Longford Town 1 Longford No. 1 Urban2 Longford No. 2 Urban
51 Longford Rural (part)*
Louth Drogheda Borough 1 Fair Gate2 St. Laurence Gate3 West Gate
41 St. Peter’s (part)*‡ St. Mary’s (part)*
Dundalk Town 4 Dundalk Urban No. 15 Dundalk Urban No. 26 Dundalk Urban No. 37 Dundalk Urban No. 4
23 Castletown (part)*27 Dundalk Rural (part)*30 Haggardstown (part)*
Meath Ceannanus Mór Town 1 Ceannanus Mór (Kells) Urban26 Ceannanus Mór (Kells) Rural (part)*
Navan Town 2 Navan Urban55 Navan Rural (part)*
Trim Town 3 Trim Urban92 Trim Rural (part)*
Wexford Enniscorthy Town 1 Enniscorthy Urban21 Enniscorthy Rural (part)*
Wexford Borough 4 Wexford No. 1 Urban5 Wexford No. 2 Urban6 Wexford No. 3 Urban
123 Wexford Rural (part)*
Wicklow Bray Town 3 Bray No. 14 Bray No. 25 Bray No. 36 Rathmichael (Bray)
35 Kilmacanoge (part)*
* Formerly included in Rural Districts.‡ Formerly ED 47 (part) in Meath County.

170
Appendix 4 (contd.)
County District Electoral Division
Clare Ennis Town 1 Ennis No. 1 Urban2 Ennis No. 2 Urban3 Ennis No. 3 Urban4 Ennis No. 4 Urban
26 Clareabbey (part)*29 Doora (part)*32 Ennis Rural (part)*42 Spancelhill (part)*
Cork Youghal Town 10 Youghal Urban325 Youghal Rural (part)*
Kerry Killarney Town 1 Killarney Urban82 Killarney Rural (part)*90 Muckross (part)*
Tralee Town 3 Tralee Urban165 Tralee Rural (part)*
Tipperary South Clonmel Borough 85 Clonmel East Urban86 Clonmel West Urban
133 Clonmel Rural (part)*134 Inishlounaght (part)*
Mayo Ballina Town 1 Ardnaree South Urban2 Ballina Urban6 Ardnaree North (part)*7 Ardnaree South Rural (part)*
10 Ballina Rural (part)*
Castlebar Town 3 Castlebar Urban74 Castlebar Rural (part)*
Westport Town 4 Westport Urban144 Kilmeena (part)*
Donegal Letterkenny Town 3 Letterkenny Urban105 Letterkenny Rural (part)*
Monaghan Castleblayney Town 2 Castleblayney Urban27 Castleblayney Rural (part)*
Clones Town 3 Clones Urban36 Clones Rural (part)*
Monaghan Town 4 Monaghan Urban63 Monaghan Rural (part)*
* Formerly included in Rural Districts.
Extensions to Boundaries
Extensions to the boundaries of the following towns have been formally approved since the last census:Killarney S.I. 451 of 2000 refersCastlebar S.I. 638 of 2001 refersBallina S.I. 601 of 2001 refersWestport S.I. 603 of 2001 refers

171
Appendix 5
Population of Towns or Environs/Suburbs which are located inmore than one County
Number of personsTown Counties Percentage change
1996-20021996 2002
Environs of Carlow CarlowLaoighis 3,258 5,269 61.7
Graiguenamanagh-Tinnahinch CarlowKilkenny 1,374 1,435 4.4
Bunclody-Carrickduff CarlowWexford 1,241 1,361 9.7
Clonegal CarlowWexford 200 193 -3.5
Environs of Bray DublinWicklow 2,671 4,707 76.2
Environs of New Ross KilkennyWexford 1,135 1,727 52.2
Portarlington LaoighisOffaly 3,320 4,001 20.5
Lanesborough-Ballyleague LongfordRoscommon 984 943 -4.2
Environs of Drogheda LouthMeath 822 2687 226.9
Environs of Athlone WestmeathRoscommon 7,853 8,582 9.3
Suburbs of Limerick ClareLimerick 27,098 32,975 21.7
O’Briensbridge-Montpelier ClareLimerick 409 375 -8.3
Holycross Tipperary NorthTipperary South 447 610 36.5
Environs of Clonmel Tipperary SouthWaterford 967 1171 21.1
Cong GalwayMayo 197 185 -6.1
Environs of Ballinasloe GalwayRoscommon 89 235 164.0

172
Appendix 5 (contd.)
Number of personsTown Counties Percentage change
1996-20021996 2002
Carrick-on-Shannon LeitrimRoscommon 1,868 2,237 19.8
Roosky LeitrimRoscommon 220 198 -10.0
Charlestown-Bellahy MayoSligo 675 753 11.6
Pettigo* DonegalFermanagh 320 275 -14.1
Environs of Birr OffalyTipperary North 838 846 1.0
* Population of that part of Pettigo located in Donegal County.

173
Appendix 6
Census 2002 Publication Schedule
Description Publication date
Preliminary Report 24 July 2002
Principal Demographic Results 19 June 2003
Volume 1 – Population Classified by Area 3 July 2003
Volume 2 – Ages and Marital Status 31 July 2003
Volume 3 – Household Composition and Family Units 28 August 2003
Principal Socio-economic Results 25 September 2003
Volume 4 – Usual Residence, Migration, Birthplaces and Nationalities 23 October 2003
Volume 5 – Principal Economic Status and Industries 13 November 2003
Volume 6 – Occupations 4 December 2003
Volume 7 – Education and Qualifications 15 January 2004
Volume 8 – Irish Traveller Community 29 January 2004
Volume 9 – Travel to Work, School and College 19 February 2004
Volume 10 – Disability and Carers 11 March 2004
Volume 11 – Irish Language 25 March 2004
Volume 12 – Religion 8 April 2004
Volume 13 – Housing 22 April 2004


![SUB CHAPTER G.4 F2 CLASSIFIED AND NON CLASSIFIED ...epr-reactor.co.uk/ssmod/liblocal/docs/V3/Volume 2... · The MCP[PICS] performs F2 and NC operating and monitoring functions. According](https://img.pdfslide.net/doc/110x75/5fa719ad5d46ab09e36056b3/sub-chapter-g4-f2-classified-and-non-classified-epr-2-the-mcppics-performs.jpg)