Embed Size (px)
Citation preview
Volume 10 Number 2 December 2020
https://journals.uj.ac.za/index.php/JCP
MI/login
ABOUT JCPMI
The Journal of Construction Project Management and Innovation is published bi-annually (twice per year) through the Sustainable Human Settlement and Construction Research Centre (SHSCRC) of the University of Johannesburg by the University of Johannesburg.
The Journal of Construction Project Management and Innovation is an open access journal that publishes all sorts of research on Construction project management; Project management; Design and construction management processes; Housing and infrastructure development; Stakeholder management; Project planning and project impact assessments; Design and implementation of labour-intensive projects; Procurement management; Management of construction companies; Industry development; Knowledge management in construction; Empowerment of women; Innovation; Project financing; Current and emerging infrastructure issues in developing countries as well as other issues. The goal of JCPMI is to broaden the knowledge of construction professionals and academicians by promoting free access and providing valuable insight to construction-related information, research and ideas. JCPMI is a bi-annual publication and all articles are peer-reviewed.
Submission of Manuscripts
Manuscript submission can be done using the link https://journals.uj.ac.za/index.php/JCPMI/login
For all other correspondence that cannot be sent by email, please contact the editorial office ([email protected], [email protected], [email protected]).
The Journal of Construction Project Management and Innovation will only accept manuscripts submitted online. Please read the Instructions for Authors before submitting your manuscript.
Editors-in-Chief
Prof. Wellington Didibhuku Thwala Professor of Construction Management Department of Construction Management and Quantity Surveying Faculty of Engineering and the Built Environment University of Johannesburg South Africa [email protected]
Prof. Clinton Ohis Aigbavboa Professor of Sustainable Human Settlement Department of Construction Management and Quantity Surveying Faculty of Engineering and the Built Environment University of Johannesburg South Africa [email protected]
Deputy Editors
Dr Zakari Mustapha Cape Coast Technical University, Cape Coast, Ghana [email protected]
Dr Ayodeji Oke Federal University of Technology, Akure, Ondo State, Nigeria [email protected]
Dr Titus Kwofie Kwame Nkrumah University of Science and Technology [email protected]
Dr Douglas Aghimien University of Johannesburg, Johannesburg, South Africa [email protected]
Editorial Board Prof. Peter Love Curtin University, Australia
Prof. Albert P.C. Chan The Hong Kong Polytechnic University, Hong Kong
Prof. Charles Egbu University of Salford, United Kingdom
Prof. Nicholas Chileshe University of South Australia, Australia
Prof. David Carmichael University of New South Wales, Australia
Prof. Scott Fee Minnesota State University, USA
Prof. A.C. Ogbonna Federal University of Technology, Akure, Nigeria
Dr E. Adinyira Kwame Nkrumah University of Science and Technology, Kumasi, Ghana
Dr David Daw North West University, South Africa
Prof. Joshua Ayarkwa Kwame Nkrumah University of Science and Technology, Kumasi, Ghana
Dr Geraldine Kikwasi Ardhi University, Tanzania
Dr De-Graft Owusu-Manu Kwame Nkrumah University of Science and Technology, Ghana
Prof. Frank Fugar Kwame Nkrumah University of Science and Technology, Kumasi, Ghana
Dr Lindile Ndabeni Tshwane University of Technology, South Africa
Prof. Alfred Talukhaba Tshwane University of Technology Pretoria, South Africa Dr Jian Zuo University of South Australia, Australia
Prof. Hamimah Adnan University Teknologi Mara, Malaysia
Prof. Jun Ying Liu Tianjin University, China
Prof. Low Sui Pheng National University of Singapore, Singapore
Dr Monty Sutrisna University of Salford, United Kingdom
Prof. John Smallwood Nelson Mandela Metropolitan University Port Elizabeth, South Africa
Prof. Christopher Harty University of Reading United Kingdom
Prof. Miklos Hajdu Szent István University Hungary
Editorial Policy and Submission Guidelines
Overview
As part of the process of ensuring quality, the Journal of Construction Project Management and Innovation (JCMPI) Editors subscribe to the open-access publishing code of the Academy of Science of South Africa (ASSAf).
Only papers with a clear focus on construction project management and innovations with relevance to the built environment are and will be published in the journal.
The JCPMI is an open-access journal that publishes research scholarly work on construction project management; project management; design and construction management processes; housing and infrastructure development; stakeholder management; project planning and project impact assessments; design and implementation of labour-intensive projects; procurement management; management of construction companies; industry development; knowledge management in construction; empowerment of women; innovation; project financing; current and emerging infrastructure issues in developing countries as well as other issues. The goal of the JCPMI is to broaden the knowledge of construction professionals and academicians by promoting free access and providing valuable insight to construction-related information, research and ideas.
The journal strives to ensure diversity in its publication by ensuring papers from different countries are represented in each issue and volume published.
Authors are encouraged to submit scholarly articles, review articles, practical library work, short communications, book reviews or letters to the editor.
Items that have been published elsewhere should be submitted only with permission of the original publisher, and this should be clearly indicated and the improvement to such publication annotated for ease of reference.
Editing Procedure (Peer Review Policy)
All submitted manuscripts are reviewed by an editor and members of the Editorial Board or at least two qualified outside reviewers. Authors cannot nominate reviewers. Only reviewers selected from the journal’s database with specialization in the subject area will be contacted to evaluate the manuscripts.
The review process will be double-blind review.
The feedback from reviewers is checked and reviewed by the journal editor assigned to the manuscript to ensure quality and relevance of the review comments, while all final review communications are sent to the authors by the Editor-in-Chief.
In submitting a revised manuscript, authors are mandated to submit a report detailing how they have responded to the reviewers’ comments. The journal editor checks to ensure that all recommended changes for
improvement of the article have been substantively attended to before initiating a follow-up blind reviewer process. After the peer reviewers have read and evaluated the manuscript, one of the following three recommendations for publication is made:
• Accept the manuscript for publication with minor revisions.
• Accept the manuscript for publication with major revisions.
• Reject the manuscript for publication.
After the editor receives the peer reviewers’ recommendations, they are forwarded to the author, who will then perform the necessary revisions and submit a new draft within a time frame determined by the editor. The editor then reviews the final draft to determine whether the manuscript is ready for publication, or if it requires further peer review. Once a manuscript is ready for publication, it is forwarded to the copy editor who will review the manuscript to correct spelling, punctuation, and grammatical errors, and to ensure that the text adheres to JCPMI’s formatting and style guidelines. Once the copy editor’s work is done, the managing editor performs a final review of the manuscript and publishes it.
It is the goal of the JCPMI to publish manuscripts within the shortest possible time after submission.
By submitting a manuscript to JCPMI, authors agree that journal editors have the right to check their manuscript via iThenticate. However, it is the responsibility of authors to check their papers for any plagiarism issue before submitting to the journal. But all submitted papers are by default checked for plagiarism using iThenticate on the OJS platform. Should the editors detect potential plagiarism issues, the paper will be temporarily suspended and send back to the authors.
Conflict of Interest Statement
The Editors-in-Chief are allowed to publish papers occasionally in the journal. Such publication must be relevant to the built environment, and the full review process should be followed and managed by one of the deputy editors. Similarly, the Deputy Editors are allowed to publish papers occasionally in the journal. Such publication must be relevant to the built environment and the full review process should be followed and managed by one of the Editors-in-Chief.
Copyright Policy
Authors who publish in the Journal of Construction Project
Management and Innovation agree to the following terms:
Authors retain copyright and grant the journal right of first publication with the work and allows others to share the work with an acknowledgement of the work’s authorship and initial publication in this journal.
Submission of a manuscript to JCPMI implies that the work described has not been published before (except in the form of an abstract or as part of a published lecture, or thesis); that it is not under consideration for publication elsewhere; that if and when the manuscript is accepted for publication, the author(s) still hold the copyright and retain publishing rights without restrictions. Authors or others are allowed to multiply the article as long as it is not for commercial purposes. Any use and or copies of this journal in whole or in part must include the customary bibliographic citation, including author attribution, date and article title.
Errata
All articles published in JCPMI are subject to an editorial review process. On acceptance, electronic proofs will be sent (email attachment) to the corresponding author as a PDF file. Page proofs are considered to be the final version of the manuscript. With the exception of typographical or minor clerical errors, no changes will be made in the manuscript at the proof stage. After publication, authors who notice any error must contact the Journal Manager who will determine the impact of the change and decide the necessary line of action to be taken.
Submission Guidelines
See guidelines:
https://journals.uj.ac.za/index.php/JCPMI/about/s
ubmissions
Institutional Affiliation
JCPMI is an institutional journal, and editors are accountable to the University of Johannesburg.
JCPMI is published bi-annually (twice per year) through the Sustainable Human Settlement and Construction Research Centre (SHSCRC) of the University of Johannesburg by the University of Johannesburg
JCPMI is an open-access journal, and pdf versions of all papers are available on the journal website https://journals.uj.ac.za/index.php/JCPMI/login
JCPMI is accredited by the South African Department of Higher Education and Training, and the journal editors will continue to seek and maintain the quality standards necessary for ongoing accreditation.
Instructions for Authors
Electronic submission of manuscripts is strongly
encouraged, provided that the text, tables, and figures are included in a single Microsoft Word file (preferably in Arial font).
The cover letter should include the corresponding author's full address and telephone/fax numbers and should be in an email message sent to the Editor, with the file, the name of which should begin with the first author's surname, as an attachment.
Article Types
Three types of manuscripts may be submitted:
Regular Articles
All portions of the manuscript must be typed 1.5 spacing, and all pages numbered starting from the title page. The font size must be 12.
Regular Articles
These should describe new and carefully confirmed findings, and experimental procedures should be given in sufficient detail for others to verify the work. The length of a full paper should be the minimum required to describe and interpret the work clearly. The length of a full paper should be between 4000 – 7000 words.
Review Process
Short Communications
A short communication is suitable for recording the results of complete small investigations or giving details of new models or hypotheses, innovative methods, techniques or apparatus. The style of main sections need not conform to that of full-length papers. Short communications are 2 to 4 printed pages (about 6 to 12 manuscript pages) in length.
Reviews
Submissions of reviews and perspectives covering topics of current interest are welcome and encouraged. Reviews should be concise and no longer than 4-6 printed pages (about 12 to 18 manuscript pages). Reviews are also peer-reviewed.
Review Process
All manuscripts are reviewed by an editor and members of the Editorial Board or qualified outside reviewers. Authors cannot nominate reviewers. Only reviewers randomly selected from our database with specialization in the subject area will be contacted to evaluate the manuscripts. The process will be blind review. Decisions will be made as rapidly as possible, and the journal strives to return reviewers’ comments to authors as quickly as possible. The editorial board will re-review manuscripts that are accepted pending revision. It is the goal of the JCPMI to publish manuscripts within the shortest possible time after submission.
Regular Articles
All portions of the manuscript must be typed in double spacing and all pages numbered, starting from the title page.
The Title should be a brief phrase describing the contents of the paper. The Title Page should include the authors' full names and affiliations, the name of the corresponding author along with phone, fax and email information. Present addresses of authors should appear as a footnote.
The Abstract should be informative and completely self-explanatory, briefly presenting the topic, stating the scope of the experiments, indicating significant data, and pointing out major findings and conclusions. The Abstract should be 100 to 300 words in length. Complete sentences, active verbs, and the third person should be used, and the abstract should be written in the past tense. Standard nomenclature should be used and abbreviations should be avoided. No literature should be cited. Following the abstract, about 3 to 10 key words that will provide indexing references should be listed.
A list of non-standard Abbreviations should be added.
In general, non-standard abbreviations should be used only when the full term is very long and used often. Each abbreviation should be spelled out and introduced in parentheses the first time it is used in the text.
The Introduction should provide a clear statement of the problem, the relevant literature on the subject, and the proposed approach or solution. It should be understandable to colleagues from a broad range of scientific disciplines.
Materials and methods should be complete enough to allow experiments to be reproduced. However, only truly new procedures should be described in detail; previously published procedures should be cited, and important modifications of published procedures should be mentioned briefly. Capitalize trade names and include the manufacturer's name and address. Subheadings should be used. Methods in general use need not be described in detail.
Results should be presented with clarity and precision. The results should be written in the past tense when describing findings in the authors’ experiments. Previously published findings should be written in the present tense. Results should be explained, but largely without referring to the literature. Discussion, speculation and detailed interpretation of data should not be included in the Results but should be put into the Discussion section.
The Discussion should interpret the findings in view of the results obtained in this and in past studies on this topic. State the conclusions in a few sentences at the end of the paper. The Results and Discussion sections can include sub-headings, and when appropriate, both sections can be combined.
The Acknowledgments of people, grants, funds, etc. should be brief.
Tables should be kept to a minimum and be designed to be as simple as possible. Tables are to be typed in double-spacing throughout, including headings and footnotes. Each table should be on a separate page, numbered consecutively in Arabic numerals and supplied with a heading and a legend. Tables should be self-explanatory without reference to the text. The details of the methods used in the experiments should preferably be described in the legend instead of in the text. The same data should not be presented in both table and graph form or repeated in the text.
Figure legends should be typed in numerical order on a separate sheet. Graphics should be prepared using applications capable of generating high resolution GIF, TIFF, JPEG or PowerPoint before pasting in the Microsoft Word manuscript file. Tables should be prepared in Microsoft Word. Use Arabic numerals to designate figures and upper-case letters for their parts (Figure 1). Begin each legend with a title and include sufficient description so that the figure is understandable without reading the text of the manuscript. Information given in legends should not be repeated in the text.
References: In the text, a reference identified by means
of an author‘s name should be followed by the date of the reference in parentheses. When there are more than two authors, only the first author‘s name should be mentioned, followed by ’et al ‘. In the event that an author cited has had two or more works published during the same year, the reference, both in the text and in the reference list, should be identified by a lower case letter like ’a‘ and ’b‘ after the date to distinguish the works.
Examples:
Aigbavboa (2012), Aigbavboa et al. (2012), (Thwala, 2000), (Aigbavboa and Thwala, 2012), (Aigbavboa, 2008; Lesito, 2007a, b; Aigbavboa, 2010, 2011), (Thwala et al., 2001)
References should be listed at the end of the paper in alphabetical order. Articles in preparation or articles submitted for publication, unpublished observations, and personal communications should not be included in the reference list but should only be mentioned in the article text (e.g., A. Kingori, University of Nairobi, Kenya, personal communication). Journal names are abbreviated according to Chemical Abstracts. Authors are fully responsible for the accuracy of the references.
Examples:
Aigbavboa CO (2010). Residential satisfaction in low-income housing: a South Africa perspective. Journal of Construction Project Management and Innovation. 1(2): 14 – 20.
Aigbavboa CO, Lesito K (2012). ICT benefit in South Africa Construction Journal of Construction Project Management and Innovation. 2(2): 75 – 81.
Short Communications
Short Communications are limited to a maximum of two figures and one table. They should present a complete study that is more limited in scope than is found in full-length papers. The items of manuscript preparation listed above apply to Short Communications with the following differences: (1) Abstracts are limited to 300 words; (2) instead of a separate Materials and Methods section, experimental procedures may be incorporated into Figure Legends and Table footnotes; (3) Results and Discussion should be combined into a single section.
Proofs and Reprints: Electronic proofs will be sent (email attachment) to the corresponding author as a PDF file. Page proofs are considered to be the final version of the manuscript. With the exception of typographical or minor clerical errors, no changes will be made in the manuscript at the proof stage.
Fees and Charges
No fee is paid for the publication of article(s) in
JCPMI. Authors’ submissions are only required
to meet the peer review process.
Copyright: © 2018, Sustainable Human Settlement and Construction Research Centre and the Department of Construction Management and Quantity Surveying, University of Johannesburg.
All rights reserved. In accessing this Journal, you agree that you will access the contents for your own personal use but not for any commercial use. Any use and or copies of this Journal in whole or in part must include the customary bibliographic citation, including author attribution, date and article title.
Submission of a manuscript implies: that the work described has not been published before (except in the form of an abstract or as part of a published lecture, or thesis); that it is not under consideration for publication elsewhere; that if and when the manuscript is accepted for publication, the authors agree to automatic transfer of the copyright to the publisher.
Disclaimer of Warranties
In no event shall the management of the Journal of Construction Project Management and Innovation be liable for any special, incidental, indirect, or consequential damages of any kind arising out of or in connection with the use of the articles or other material derived from the JCPMI, whether or not advised of the possibility of damage, and on any theory of liability.
This publication is provided “as is” without warranty of any kind, either expressed or implied, including, but not limited to, the implied warranties of merchantability, fitness for a particular purpose, or non-infringement. Descriptions of, or references to, products or publications does not imply endorsement of that product or publication. While every effort is made by JCPMI management to see that no inaccurate or misleading data, opinion or statements appear in this publication, they wish to make it clear that the data and opinions appearing in the articles and advertisements herein are the responsibility of the contributor or advertiser concerned. JCPMI management makes no warranty of any kind, either express or implied, regarding the quality, accuracy, availability, or validity of the data or information in this publication or of any other publication to which it may be linked.
Table of Contents
Volume 10 Number 2 December 2020
PREDICTING RURAL STEM TEACHERS’ ACCEPTANCE OF MOBILE LEARNING IN THE FOURTH INDUSTRIAL REVOLUTION
David Mutambara, Anass Bayaga 14-29
TRANSFORMING SOUTH AFRICA’S UNIVERSITIES OF TECHNOLOGY: A ROADMAP THROUGH 4IR LENSES
FACILITATING COMMUNITY PARTICIPATION THROUGH CROWDSOURCING IN URBAN PLANNING PROCESSES: AN EXPLORATORY STUDY
Lindelwa Sinxadi 51-64
STRATEGIC ALLIANCE IN THE CONSTRUCTION INDUSTRY: BARRIERS FACING ITS IMPLEMENTATION IN AN EMERGING MARKET
Funmilayo Iyabo Bodunde, Ebunoluwa Bimbola Akinrata, Ayodeji Emmanuel Oke, Ayotunde Babalola 65-78
Muthoni Masinde, Peter A. Roux 30-50
IN THE NIGERIAN CONSTRUCTION INDUSTRY
Lekan D. Ojo, Bolarinwa Ibrahim, Ayodeji E. Oke, Akinsanmi S. Akindeinde 1-13
ARTICLES
MITIGATING STRATEGIES OF THREATS OF QUANTITY SURVEYING PROFESSION
Journal of Construction Project Management and Innovation, 10 (2): 1-13, 2020
ISSN 2223-7852 © Sustainable Human Settlement and Construction Research Centre DOI: https://doi.org/10.36615/jcpmi.v10i2.364
1
Lekan D. OJO1,2*, Bolarinwa IBRAHIM1, Ayodeji E. OKE1, and Akinsanmi S.
AKINDEINDE1
1Department of Quantity Surveying, Federal University of Technology, Akure, Ondo State, Nigeria
2Department of Architecture and Civil Engineering, City University of Hong Kong, Hong Kong
Email: [email protected]*; [email protected]; [email protected];
ABSTRACT Quantity surveying (QS) profession had faced numerous challenges in recent decades than when it was first introduced in developing countries. In addition, opportunities via technology advancement to the profession were also perceived as threats. This, therefore, inform the need to investigate the possible mitigating strategies to the threats confronting the profession in the Nigerian construction industry as an attempt to proffer solutions. Therefore, opinions of quantity surveyors in construction firms, consulting firms and government establishments of Lagos State, Nigeria were collected through a survey. The mitigating strategies garnered from extant literature were used to elicit the opinions of the respondents. One hundred and twelve (112) copies of questionnaires were administered, while the retrieved copies were used to analyse with both descriptive and inferential statistics. Mean score and Standard Deviation (SD) were used to rank the opinions of the respondents, and factor analysis was used to group the mitigating strategies into concise form for ease of discussion. The results of the analysis show that the mitigating strategies identified in the study are significant to mitigating the threats in the QS profession. The factor analysis conducted grouped the mitigating strategies into four major groups, namely practice, knowledge, progressive learning and ethics. These groupings were discussed within the context of the study and in relation with previous researches. This study proffers possible solutions to the threats to the QS profession that had been publicised in many studies. Keywords: Construction industry, Growth and Development, Mitigating Strategies, Quantity Surveying Profession, Threats.
1. INTRODUCTION Quantity Surveying (QS) profession had faced some hiccups in its development despite its notable landmark in the construction industry (Smith, 2011). Wao (2015) revealed that the name “quantity surveying” emanated from the role of quantifying the amount of construction resources such as materials, labour, and equipment. The profession has different names in different countries. In the United States of America (USA), the professional practising quantity surveyors are often referred to as project engineers, cost engineers/planners or estimators while other countries referred to the professionals as building economists (Wao, 2015). In order to provide the best value to project owners, the roles of quantity surveyors
MITIGATING STRATEGIES OF THREATS TO QUANTITY SURVEYING PROFESSION IN THE
NIGERIAN CONSTRUCTION INDUSTRY
Ojo et al. JCPMI, 10(2): 1-13
2
encompass the preparation of cost estimates of projects and ensuring that construction activities are executed in a manner that satisfies project owner’s needs (Wao and Flood, 2016).
The pattern of practising QS in Nigeria is similar to the UK and other Commonwealth countries (Dada and Jagboro, 2012). In 1969, a group of trained and qualified Nigerians, who had been practising in the UK returned to Nigeria and perceived the urgent need to develop the profession. Therefore, a parallel body to the Royal Institution of Chartered Surveyors (RICS) of the UK called the Nigerian Institute of Quantity Surveyors (NIQS) was founded (NIQS, 2004). As of 2001, the services required of the QS profession were cost-planning, site-planning, procurement advice, life-cycle costing, arbitration and technical auditing, which was termed as high-fee generating services (Boon, 2001). The above-named services are also similar to the submission of Onwusoye (2013). Other QS services advocated in later years include risk management, Value Management (VM); legal and environmental services (Cartlidge, 2006). For instance, Oke and Aigbavboa (2017) revealed that since the introduction of VM into Nigeria in the 1990s, the application of VM on construction projects in the Nigerian construction industry remain minimal (Oke and Ogunsemi, 2013). Considering the year of VM introduction into the Nigerian construction industry, Ojo and Ogunsemi (2019) opined that VM ought to have been fully embraced into the Nigerian construction process. This shows the drag in the level of improving the services and skills of quantity surveyors in Nigeria.
The QS profession had faced a lot of challenges that threaten its existence, growth and success over the years (Frei, 2010). Considering the revolution in QS primitive services, Olatunji et al. (2010) revealed in their study in particular that, the advent of Building Information Modeling (BIM) could be viewed as a threat to the traditional services of quantity surveyors and other construction-related disciplines. Meanwhile, the adoption of BIM should only redefine services of professionals (not only quantity surveyors) in the built environment and not serve as a threat (Chiu and Lai, 2016). On the part of Kadiri and Ayodele (2013), the threats to the QS profession hinge on the incursion of other professionals into the services rendered by quantity surveyors. Also, the shortfall in the quality of QS education with seasoned teaching of the profession’s software at tertiary levels is also identified as threats to the sustainability of QS profession (Oyediran and Odusami, 2005; Ojo et al., 2019). This made Mogbo (1998) suggested overhauling of QS curriculum in the tertiary institutions to meet the requirement in the built industry. Frei and Mbachu (2009) also stated that for QS to remain relevant in this world of continual change, urgent and far-reaching strategic transformation is required.
Ogunsina et al. (2018) listed numerous challenges confronting the Nigerian QS profession. Without scanning and discerning future directions and actively preparing for any impending changes, the QS profession stands at risk of receiving changes as threats rather than opportunities (Porth, 2003; Mbachu and Nkado, 2006). Port (2003) further explained that it is expedient for quantity surveyors to zoom into the perceived opportunities in the construction industry to minimise the imminent threats. Previous researches had investigated the threats to the QS profession in Nigeria, but little attention has been given to empirically proffer means of mitigating the threats. This study, therefore, filled the gap by assessing the mitigating strategies to the threats to the QS profession.
2. PREVIOUS STUDIES QS is an indispensable profession in the actualisation of construction projects. The profession had received wide acceptance in the developed countries but with misconceptions in some developing countries. The profession has been misinterpreted with land surveying and estate surveying (Ogunsemi, 2015). To clear the air on the misconception on what QS is, Ogunsemi
Ojo et al. JCPMI, 10(2): 1-13
3
(2015) defined QS as a profession concerned with financial probity and achieving value for money in the conceptualisation, planning and execution of construction projects.
Frei (2010) and Kadiri and Ayodele (2013) reported that the QS profession had been confronted with many challenges recently. Wao (2005) also stated that the profession had faced numerous challenges in its development compared to when it first came into existence Ogunsina et al. (2018) assessed the factors confronting the practice of QS profession in Nigeria. Olatunji et al. (2010) also revealed the fear of QS profession extinction in the face of technology. Therefore, it becomes necessary to investigate the mitigating strategies to the threats to the practice of the QS profession in developing countries.
Traditionally, when the designs of the proposed project are almost completed, quantity surveyors are summoned for the preparation of bills of quantities and other documentation for procurement purpose (Matipa et al., 2008). Estimations were also conceptual and based on limited project information, laborious and time-consuming. But, the advent of technology lessened the burden a lot (Cartlidge, 2006), and thus helped in achieving the client’s objective with a greater level of accuracy (Doyle and Hughes, 2000). Automation of bills of quantities with QS Software reduces error and misunderstandings that evolves with design changes (Ashcraft, 2007), and speed up the time for generating construction quantities and other documents (Ashworth and Hogg, 2007). The advent of Building Information Modelling (BIM) also proffered solutions to major drawbacks in the built environment (Hasan and Rasheed, 2019; Usman et al., 2019) and also for her professionals. The need to accustom with technology advancement is a step to mitigating issues confronting QS profession. To be effective in providing professional services, QS firms should also adapt to offer emerging, innovative value-added services (Ojo, 2018). The profession must restructure traditional practices to involve technological advances that are better aligned to ameliorate the new challenges. Thus, successful change management will be critical to enable practices to adapt to the new socio-cultural, political, legal and environmental exposure, as preparations are made to take practices offshore.
The required change in the QS profession may be unattainable without the provision of adequate training and lifelong learning practice. Training and education give knowledge which makes an employee have awareness of innovations in construction practice (Hillary, 2004). According to Oke and Aigbavboa (2017), training is an essential element for the development of construction professionals necessary for improving the awareness and application of innovative methodologies. This is also corroborated by Olawumi et al. (2016) that training and education are essential drivers for addressing skill shortfalls in the construction industry. In a study by Owolana and Booth (2016), it was revealed that such training that portrays lifelong learning practices is rare in the construction industry of many developing countries. Thus, the need for QS firms and other construction-related organisations to invest in training and education of staff becomes very important.
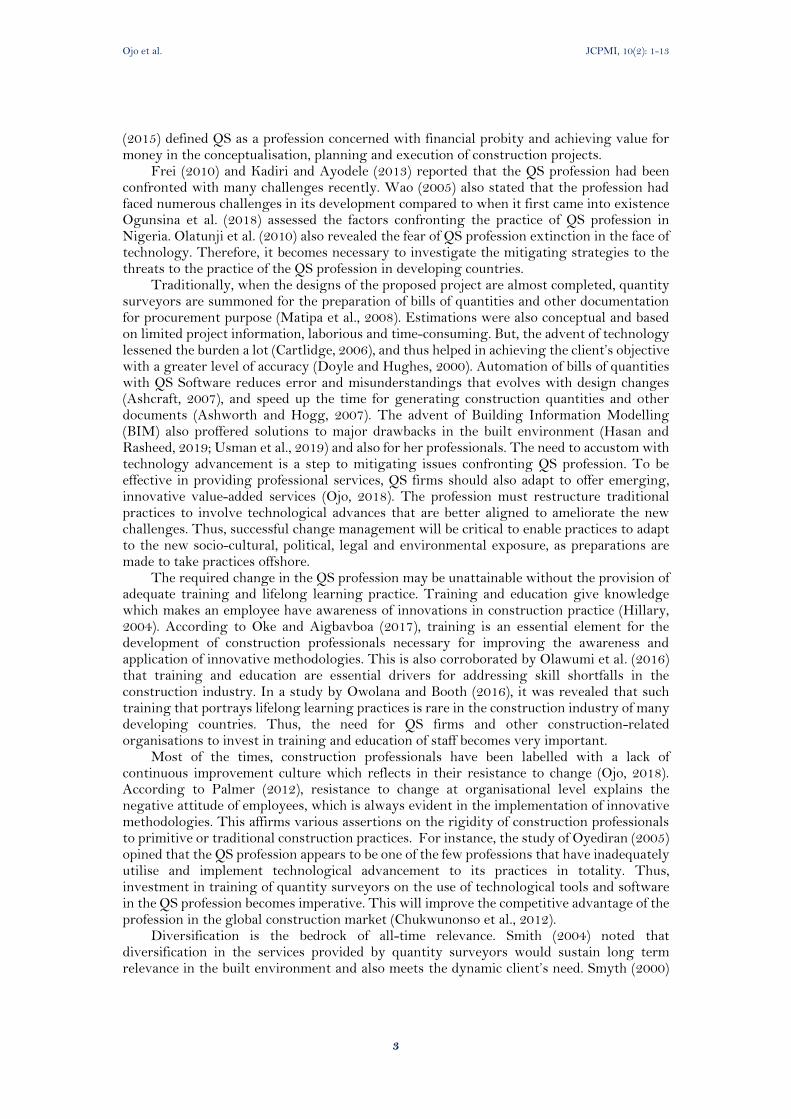
Most of the times, construction professionals have been labelled with a lack of continuous improvement culture which reflects in their resistance to change (Ojo, 2018). According to Palmer (2012), resistance to change at organisational level explains the negative attitude of employees, which is always evident in the implementation of innovative methodologies. This affirms various assertions on the rigidity of construction professionals to primitive or traditional construction practices. For instance, the study of Oyediran (2005) opined that the QS profession appears to be one of the few professions that have inadequately utilise and implement technological advancement to its practices in totality. Thus, investment in training of quantity surveyors on the use of technological tools and software in the QS profession becomes imperative. This will improve the competitive advantage of the profession in the global construction market (Chukwunonso et al., 2012).
Diversification is the bedrock of all-time relevance. Smith (2004) noted that diversification in the services provided by quantity surveyors would sustain long term relevance in the built environment and also meets the dynamic client’s need. Smyth (2000)
Ojo et al. JCPMI, 10(2): 1-13
4
submitted that QS firms that spread its service tentacle into project management, construction management, risk management and civil engineering works would remain relevant in the global competitive construction market. In light of this, QS practitioners are such that should embrace change, familiarise with innovative practices and carve out territories for specialisation and diversification. Ganiyu et al. (2012) stated that diversification always has a positive and negative effect on professionals. Therefore, the available medium of diversification can be publicised to quantity surveyors via chapters’ monthly meetings, seminars and workshop organised by the institute. For instance, Continuing Professional Development (CPD) is a requirement for members of most professional associations, rather than relying solely on their employers; practitioners need to also take responsibility for their own professional development to enhance lifelong learning and relevance. Therefore, professional institutes must ensure that the activities that culminates into the allotted CPD are such that identified the essential skill shortfall and emerging areas of practice in the profession (Schostak et al., 2010). This will encourage organisations to invest in the development of their staff, and each staff could also spare percentage of the meagre salaries for self-development.
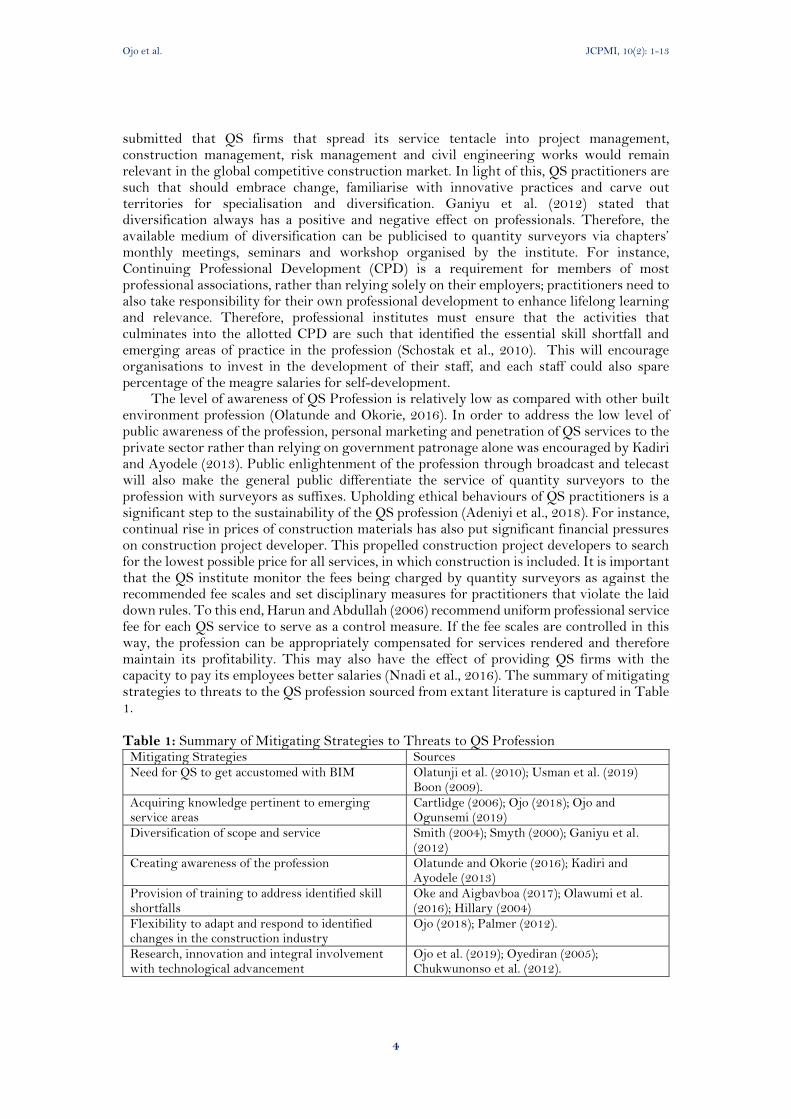
The level of awareness of QS Profession is relatively low as compared with other built environment profession (Olatunde and Okorie, 2016). In order to address the low level of public awareness of the profession, personal marketing and penetration of QS services to the private sector rather than relying on government patronage alone was encouraged by Kadiri and Ayodele (2013). Public enlightenment of the profession through broadcast and telecast will also make the general public differentiate the service of quantity surveyors to the profession with surveyors as suffixes. Upholding ethical behaviours of QS practitioners is a significant step to the sustainability of the QS profession (Adeniyi et al., 2018). For instance, continual rise in prices of construction materials has also put significant financial pressures on construction project developer. This propelled construction project developers to search for the lowest possible price for all services, in which construction is included. It is important that the QS institute monitor the fees being charged by quantity surveyors as against the recommended fee scales and set disciplinary measures for practitioners that violate the laid down rules. To this end, Harun and Abdullah (2006) recommend uniform professional service fee for each QS service to serve as a control measure. If the fee scales are controlled in this way, the profession can be appropriately compensated for services rendered and therefore maintain its profitability. This may also have the effect of providing QS firms with the capacity to pay its employees better salaries (Nnadi et al., 2016). The summary of mitigating strategies to threats to the QS profession sourced from extant literature is captured in Table 1. Table 1: Summary of Mitigating Strategies to Threats to QS Profession
Mitigating Strategies Sources Need for QS to get accustomed with BIM Olatunji et al. (2010); Usman et al. (2019)
Boon (2009). Acquiring knowledge pertinent to emerging service areas
Cartlidge (2006); Ojo (2018); Ojo and Ogunsemi (2019)
Diversification of scope and service Smith (2004); Smyth (2000); Ganiyu et al. (2012)
Creating awareness of the profession Olatunde and Okorie (2016); Kadiri and Ayodele (2013)
Provision of training to address identified skill shortfalls
Oke and Aigbavboa (2017); Olawumi et al. (2016); Hillary (2004)
Flexibility to adapt and respond to identified changes in the construction industry
Ojo (2018); Palmer (2012).
Research, innovation and integral involvement with technological advancement
Ojo et al. (2019); Oyediran (2005); Chukwunonso et al. (2012).
Ojo et al. JCPMI, 10(2): 1-13
5
International knowledge and ties Goodman and Schaps (2008); Rahman et al. (2014)
Increased continuing programme development by the professional body
Schostak et al. (2010).
Conversant in construction cost management Ashworth and Hogg (2007); Cartildge (2006); Uniformity in the professional service fee Nnadi et al. (2016); Harun and Abdullah
(2006) Trustworthy and credibility Adeniyi et al. (2018)
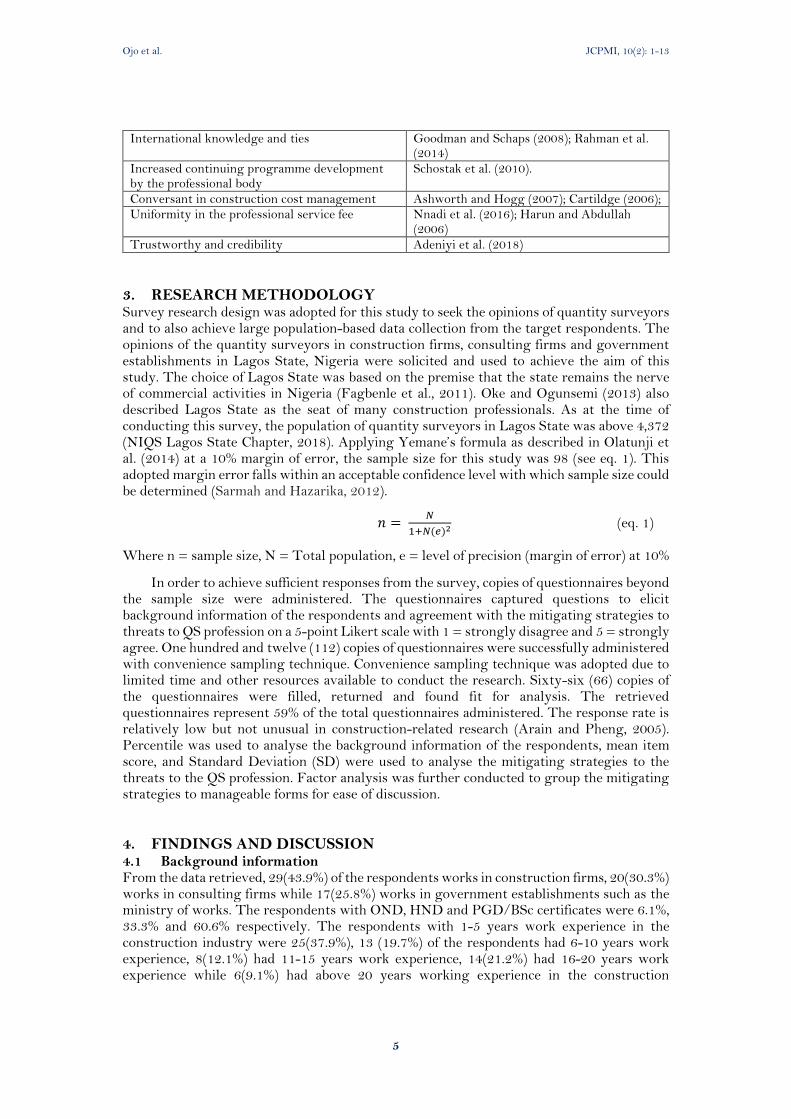
3. RESEARCH METHODOLOGY Survey research design was adopted for this study to seek the opinions of quantity surveyors and to also achieve large population-based data collection from the target respondents. The opinions of the quantity surveyors in construction firms, consulting firms and government establishments in Lagos State, Nigeria were solicited and used to achieve the aim of this study. The choice of Lagos State was based on the premise that the state remains the nerve of commercial activities in Nigeria (Fagbenle et al., 2011). Oke and Ogunsemi (2013) also described Lagos State as the seat of many construction professionals. As at the time of conducting this survey, the population of quantity surveyors in Lagos State was above 4,372 (NIQS Lagos State Chapter, 2018). Applying Yemane’s formula as described in Olatunji et al. (2014) at a 10% margin of error, the sample size for this study was 98 (see eq. 1). This adopted margin error falls within an acceptable confidence level with which sample size could be determined (Sarmah and Hazarika, 2012).
𝑛 = 𝑁
1+𝑁(𝑒)2 (eq. 1)
Where n = sample size, N = Total population, e = level of precision (margin of error) at 10%
In order to achieve sufficient responses from the survey, copies of questionnaires beyond the sample size were administered. The questionnaires captured questions to elicit background information of the respondents and agreement with the mitigating strategies to threats to QS profession on a 5-point Likert scale with 1 = strongly disagree and 5 = strongly agree. One hundred and twelve (112) copies of questionnaires were successfully administered with convenience sampling technique. Convenience sampling technique was adopted due to limited time and other resources available to conduct the research. Sixty-six (66) copies of the questionnaires were filled, returned and found fit for analysis. The retrieved questionnaires represent 59% of the total questionnaires administered. The response rate is relatively low but not unusual in construction-related research (Arain and Pheng, 2005). Percentile was used to analyse the background information of the respondents, mean item score, and Standard Deviation (SD) were used to analyse the mitigating strategies to the threats to the QS profession. Factor analysis was further conducted to group the mitigating strategies to manageable forms for ease of discussion.
4. FINDINGS AND DISCUSSION 4.1 Background information From the data retrieved, 29(43.9%) of the respondents works in construction firms, 20(30.3%) works in consulting firms while 17(25.8%) works in government establishments such as the ministry of works. The respondents with OND, HND and PGD/BSc certificates were 6.1%, 33.3% and 60.6% respectively. The respondents with 1-5 years work experience in the construction industry were 25(37.9%), 13 (19.7%) of the respondents had 6-10 years work experience, 8(12.1%) had 11-15 years work experience, 14(21.2%) had 16-20 years work experience while 6(9.1%) had above 20 years working experience in the construction
Ojo et al. JCPMI, 10(2): 1-13
6
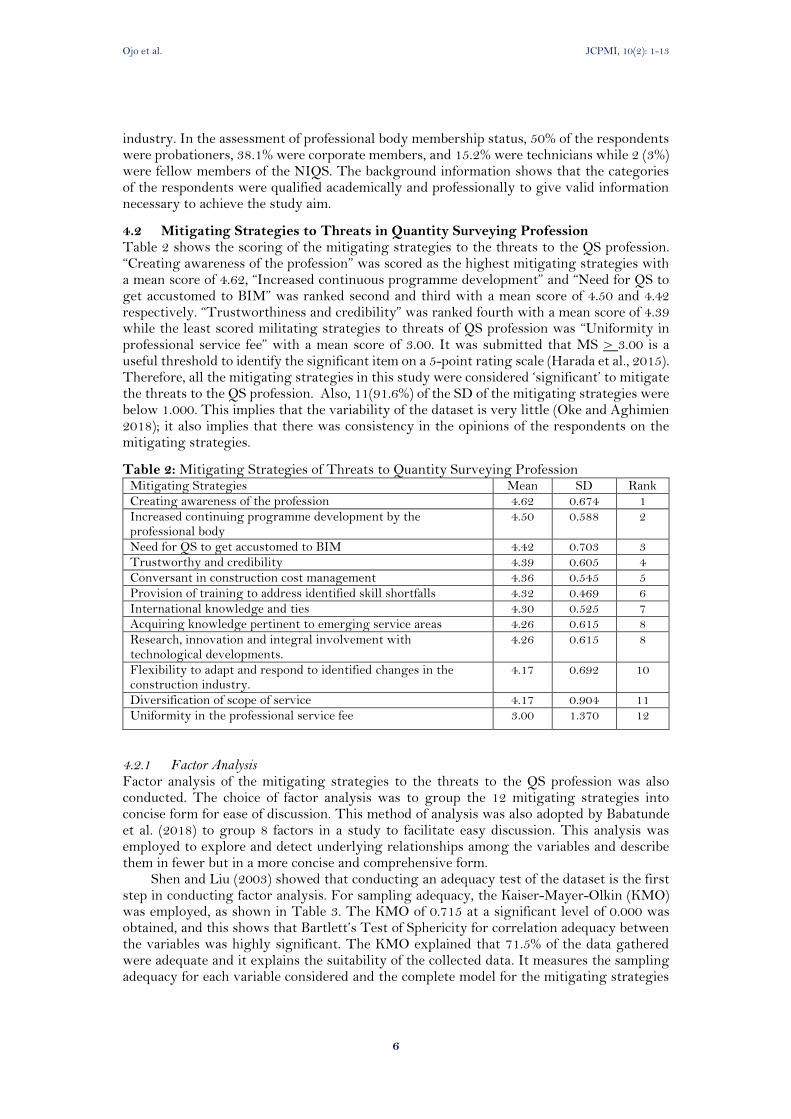
industry. In the assessment of professional body membership status, 50% of the respondents were probationers, 38.1% were corporate members, and 15.2% were technicians while 2 (3%) were fellow members of the NIQS. The background information shows that the categories of the respondents were qualified academically and professionally to give valid information necessary to achieve the study aim.
4.2 Mitigating Strategies to Threats in Quantity Surveying Profession Table 2 shows the scoring of the mitigating strategies to the threats to the QS profession. “Creating awareness of the profession” was scored as the highest mitigating strategies with a mean score of 4.62, “Increased continuous programme development” and “Need for QS to get accustomed to BIM” was ranked second and third with a mean score of 4.50 and 4.42 respectively. “Trustworthiness and credibility” was ranked fourth with a mean score of 4.39 while the least scored militating strategies to threats of QS profession was “Uniformity in professional service fee” with a mean score of 3.00. It was submitted that MS > 3.00 is a useful threshold to identify the significant item on a 5-point rating scale (Harada et al., 2015). Therefore, all the mitigating strategies in this study were considered ‘significant’ to mitigate the threats to the QS profession. Also, 11(91.6%) of the SD of the mitigating strategies were below 1.000. This implies that the variability of the dataset is very little (Oke and Aghimien 2018); it also implies that there was consistency in the opinions of the respondents on the mitigating strategies.
Table 2: Mitigating Strategies of Threats to Quantity Surveying Profession Mitigating Strategies Mean SD Rank Creating awareness of the profession 4.62 0.674 1 Increased continuing programme development by the professional body
4.50 0.588 2
Need for QS to get accustomed to BIM 4.42 0.703 3 Trustworthy and credibility 4.39 0.605 4 Conversant in construction cost management 4.36 0.545 5
Provision of training to address identified skill shortfalls 4.32 0.469 6 International knowledge and ties 4.30 0.525 7 Acquiring knowledge pertinent to emerging service areas 4.26 0.615 8 Research, innovation and integral involvement with technological developments.
4.26 0.615 8
Flexibility to adapt and respond to identified changes in the construction industry.
4.17 0.692 10
Diversification of scope of service 4.17 0.904 11 Uniformity in the professional service fee 3.00 1.370 12
4.2.1 Factor Analysis Factor analysis of the mitigating strategies to the threats to the QS profession was also conducted. The choice of factor analysis was to group the 12 mitigating strategies into concise form for ease of discussion. This method of analysis was also adopted by Babatunde et al. (2018) to group 8 factors in a study to facilitate easy discussion. This analysis was employed to explore and detect underlying relationships among the variables and describe them in fewer but in a more concise and comprehensive form.
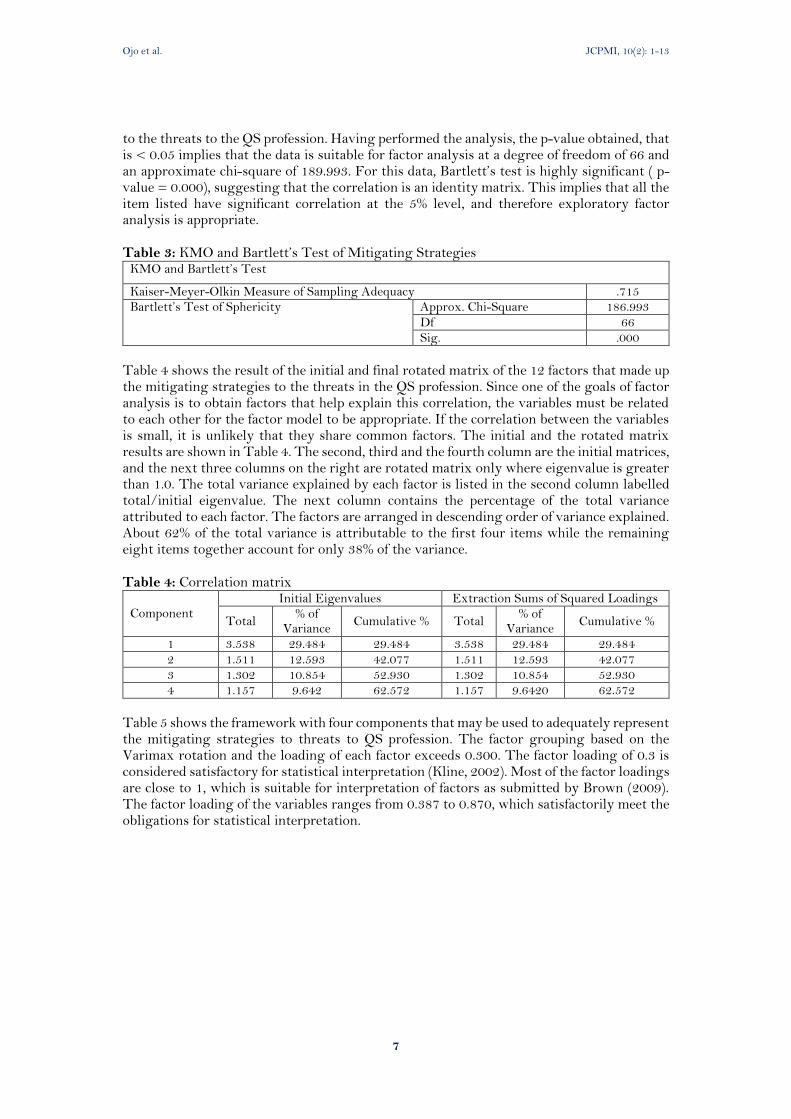
Shen and Liu (2003) showed that conducting an adequacy test of the dataset is the first step in conducting factor analysis. For sampling adequacy, the Kaiser-Mayer-Olkin (KMO) was employed, as shown in Table 3. The KMO of 0.715 at a significant level of 0.000 was obtained, and this shows that Bartlett’s Test of Sphericity for correlation adequacy between the variables was highly significant. The KMO explained that 71.5% of the data gathered were adequate and it explains the suitability of the collected data. It measures the sampling adequacy for each variable considered and the complete model for the mitigating strategies
Ojo et al. JCPMI, 10(2): 1-13
7
to the threats to the QS profession. Having performed the analysis, the p-value obtained, that is < 0.05 implies that the data is suitable for factor analysis at a degree of freedom of 66 and an approximate chi-square of 189.993. For this data, Bartlett’s test is highly significant ( p-value = 0.000), suggesting that the correlation is an identity matrix. This implies that all the item listed have significant correlation at the 5% level, and therefore exploratory factor analysis is appropriate.
Table 3: KMO and Bartlett’s Test of Mitigating Strategies
KMO and Bartlett’s Test
Kaiser-Meyer-Olkin Measure of Sampling Adequacy .715 Bartlett’s Test of Sphericity Approx. Chi-Square 186.993
Df 66 Sig. .000
Table 4 shows the result of the initial and final rotated matrix of the 12 factors that made up the mitigating strategies to the threats in the QS profession. Since one of the goals of factor analysis is to obtain factors that help explain this correlation, the variables must be related to each other for the factor model to be appropriate. If the correlation between the variables is small, it is unlikely that they share common factors. The initial and the rotated matrix results are shown in Table 4. The second, third and the fourth column are the initial matrices, and the next three columns on the right are rotated matrix only where eigenvalue is greater than 1.0. The total variance explained by each factor is listed in the second column labelled total/initial eigenvalue. The next column contains the percentage of the total variance attributed to each factor. The factors are arranged in descending order of variance explained. About 62% of the total variance is attributable to the first four items while the remaining eight items together account for only 38% of the variance. Table 4: Correlation matrix
Component Initial Eigenvalues Extraction Sums of Squared Loadings
Total % of
Variance Cumulative % Total
% of Variance
Cumulative %
1 3.538 29.484 29.484 3.538 29.484 29.484 2 1.511 12.593 42.077 1.511 12.593 42.077 3 1.302 10.854 52.930 1.302 10.854 52.930 4 1.157 9.642 62.572 1.157 9.6420 62.572
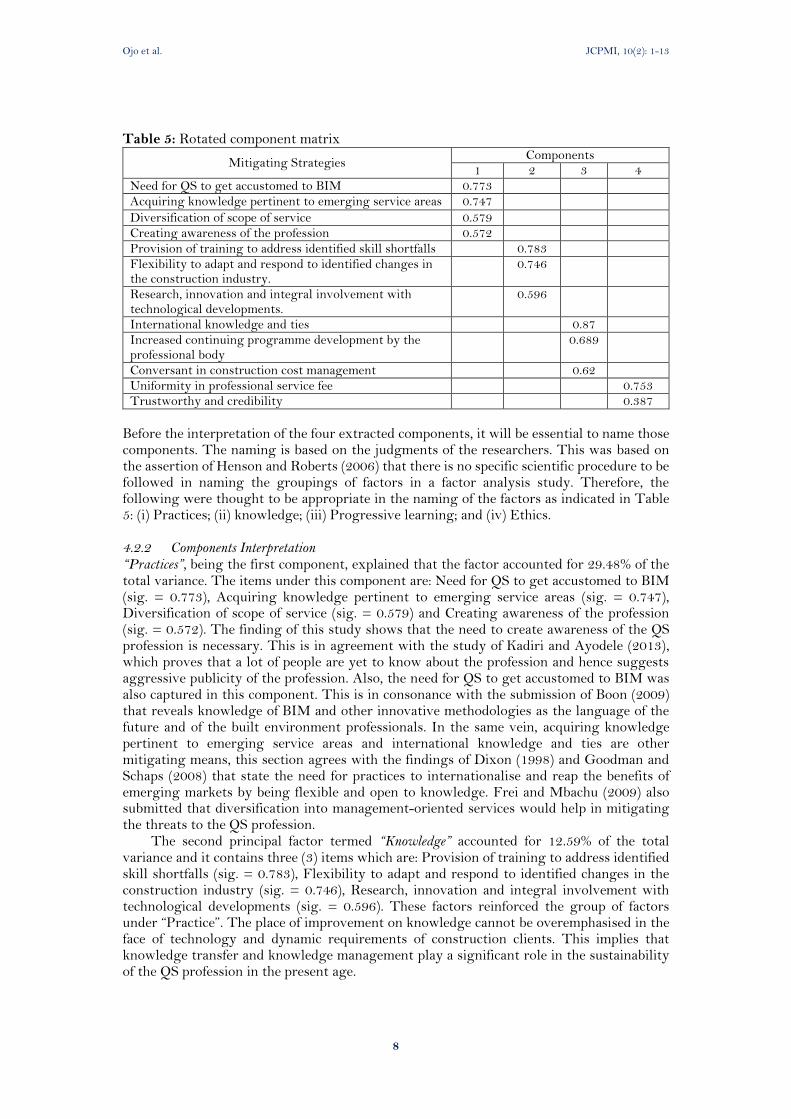
Table 5 shows the framework with four components that may be used to adequately represent the mitigating strategies to threats to QS profession. The factor grouping based on the Varimax rotation and the loading of each factor exceeds 0.300. The factor loading of 0.3 is considered satisfactory for statistical interpretation (Kline, 2002). Most of the factor loadings are close to 1, which is suitable for interpretation of factors as submitted by Brown (2009). The factor loading of the variables ranges from 0.387 to 0.870, which satisfactorily meet the obligations for statistical interpretation.
Ojo et al. JCPMI, 10(2): 1-13
8
Table 5: Rotated component matrix
Mitigating Strategies Components
1 2 3 4 Need for QS to get accustomed to BIM 0.773
Acquiring knowledge pertinent to emerging service areas 0.747
Diversification of scope of service 0.579
Creating awareness of the profession 0.572
Provision of training to address identified skill shortfalls
0.783
Flexibility to adapt and respond to identified changes in the construction industry.
0.746
Research, innovation and integral involvement with technological developments.
0.596
International knowledge and ties
0.87
Increased continuing programme development by the professional body
0.689
Conversant in construction cost management
0.62
Uniformity in professional service fee
0.753 Trustworthy and credibility 0.387
Before the interpretation of the four extracted components, it will be essential to name those components. The naming is based on the judgments of the researchers. This was based on the assertion of Henson and Roberts (2006) that there is no specific scientific procedure to be followed in naming the groupings of factors in a factor analysis study. Therefore, the following were thought to be appropriate in the naming of the factors as indicated in Table 5: (i) Practices; (ii) knowledge; (iii) Progressive learning; and (iv) Ethics. 4.2.2 Components Interpretation “Practices”, being the first component, explained that the factor accounted for 29.48% of the total variance. The items under this component are: Need for QS to get accustomed to BIM (sig. = 0.773), Acquiring knowledge pertinent to emerging service areas (sig. = 0.747), Diversification of scope of service (sig. = 0.579) and Creating awareness of the profession (sig. = 0.572). The finding of this study shows that the need to create awareness of the QS profession is necessary. This is in agreement with the study of Kadiri and Ayodele (2013), which proves that a lot of people are yet to know about the profession and hence suggests aggressive publicity of the profession. Also, the need for QS to get accustomed to BIM was also captured in this component. This is in consonance with the submission of Boon (2009) that reveals knowledge of BIM and other innovative methodologies as the language of the future and of the built environment professionals. In the same vein, acquiring knowledge pertinent to emerging service areas and international knowledge and ties are other mitigating means, this section agrees with the findings of Dixon (1998) and Goodman and Schaps (2008) that state the need for practices to internationalise and reap the benefits of emerging markets by being flexible and open to knowledge. Frei and Mbachu (2009) also submitted that diversification into management-oriented services would help in mitigating the threats to the QS profession.
The second principal factor termed “Knowledge” accounted for 12.59% of the total variance and it contains three (3) items which are: Provision of training to address identified skill shortfalls (sig. = 0.783), Flexibility to adapt and respond to identified changes in the construction industry (sig. = 0.746), Research, innovation and integral involvement with technological developments (sig. = 0.596). These factors reinforced the group of factors under “Practice”. The place of improvement on knowledge cannot be overemphasised in the face of technology and dynamic requirements of construction clients. This implies that knowledge transfer and knowledge management play a significant role in the sustainability of the QS profession in the present age.
Ojo et al. JCPMI, 10(2): 1-13
9
The third principal factor is categorised as “Progressive learning”, and it accounted for 10.85% of the total variance. The items in this grouping includes: i) International knowledge and ties (sig. = 0.870), ii) Increased Continuing Programme Development (CPD) by the professional body (NIQS) (sig. = 0.689), iii) Conversant in construction cost management (sig. = 0.620). Increased continuing programme development (CPD) by the professional body is viewed as another means of mitigating the threats to the QS profession in this study. As noted by Schostak et al. (2010), CPD should be increased by the professional body to address identified knowledge shortfalls. This means that CPD allotted to seminars, workshops and conferences on emerging areas in the built environment should be higher. Enforcement of participation in seminars and workshops of innovative techniques and methodologies in the built environment should be compulsory for graduate trainees in QS professions, especially applicants for corporate membership and professional examination candidates.
“Progressive learning” is a professional competence sustainability concept that can be dated to many decades ago (Nascimento and Valdes-Cotera, 2018). The learning pattern in this concept involves lifelong transformation with consciousness and purpose (Jarvis, 2009). For the context of this study, progressive learning entails undertaking professional competence improvement activities, training as they emerge in the global construction market of QS. Goodman and Schaps (2008) also emphasise the need for international collaboration to reap the benefits of emerging markets and open to knowledge. Collaboration among project participants had been reported as a key element for the successful contractual relationship and knowledge sharing (Rahman et al., 2014). Therefore, international collaborations of QS firms could help reduce the threats to QS services in developing countries and thus improve the relevance of the profession. Sound knowledge in construction cost management such as VM which application is relatively low in the Nigerian construction industry is also a significant step to providing qualitative services to construction clients. Summarily, collaboration and continuous learning would help in skill upgrading and update by quantity surveyors in the Nigerian construction industry.
The fourth principal factor grouping named “Ethics” accounted for 9.64% of the total variance, and it contains only two items which include i) Uniformity in professional service fee (sig. = 0.753) and Trustworthy and credibility (sig. = 0.387). Ethics is significant to the survival of QS profession; this is in line with the submission of Aje and Awodele (2006) that, the image of the construction industry rest on ethical conduct within the professionals. Though, it had been reported that ethics is the least considered in the construction professional practices in spite of its extreme importance (Mlinga, 2006). Ethics define the expected conduct of a professional which encompasses charges of professional fees. In addition, Harun and Abdullah (2006) suggested that the uniformity of professional fee is a significant means of mitigating the threats to the QS profession. Thus, compliance with the code of ethics of the QS profession is one of the panaceas for its relevance and sustainability in the built environment of developing countries. Therefore, compliance with code of conduct is important, as it is possible to have standards written in guiding documents of a professional institution and not being practised by the concerned professionals (Adeniyi et al., 2020). 4.3 The implication of the Study This study investigated the mitigating strategies to the QS profession in a concise form. A critical look at the results of the analyses of the mitigating strategies shows the need to upgrade the educational and training arm or approach of the profession in all spheres. This, therefore, suggests the importance of collaborations between academic institutions and QS practicing organisations. According to Olawumi et al (2018), collaboration among construction stakeholders and firms is pivotal to embrace dynamism, and a viable tool to reduce resistance to change in the industry. Such collaboration could be in form of provision of technological infrastructural facilities to departments of QS in tertiary institutions to improve the teaching and learning of the students at undergraduate and postgraduate levels.
Ojo et al. JCPMI, 10(2): 1-13
10
In this way, the quality of graduates in the QS profession would be fit for the global construction market.
5. CONCLUSIONS AND RECOMMENDATIONS The main aim of this research work was to assess the mitigating strategies to the threats to the QS profession. A total of twelve threats were identified in the extant literature and based on the variables, questionnaires were administered to quantity surveyors working in the construction firms, consulting firms and government establishment in the study area. The mitigating strategies were analysed using both descriptive and inferential statistics. Factor analysis was used to reduce the mitigating strategies into four groups, namely; ‘practices’, ‘knowledge’, ‘progressive learning’ and ‘ethics’ for ease of discussion. The study showed that all the mitigating strategies identified in this study were significant to reducing the threats to QS profession in that they are well above the average of the Likert scale adopted for the study, and the acceptable benchmark. The mitigating strategies centred on the improvement of QS services rendered to clients, acquainting with technological innovation in the built environment, and upholding the banner of the professionalism in adherence to stated ethical conduct.
Based on findings of the study, it is recommended that higher institutions of learning and the professional body (NIQS) should channel training on emerging innovative areas in the construction industry through the organisation of seminars and workshops. For instance, BIM, artificial intelligence, machine learning, cloud computing, gamification, nanotechnology, blockchain, smart contract and mixed reality are thriving areas in the built environment. Sound knowledge of quantity surveyors in these areas will make the profession remains relevant in developing countries, improve the satisfaction of construction clients and provide a platform for international ties. The professional body should also devise means of creating the awareness of the profession to the nation at all levels. The profession should also be made attractive as well to the upcoming generation in other to increase the numerical strength of the profession in developing countries.
6. REFERENCES Adeniyi, O., Adegbembo, T.F., and Ojo, LD. (2018). Assessment of factors influencing ethical
behaviour of quantity surveyors in Nigeria. Proceedings of International Conference on Professionalism and Ethics in Construction held at Keyworth Centre, London South Bank University, UK.
Adeniyi, O., Ojo, L. D., Idowu, O. A., and Kolawole, S. B. (2020). Compliance with stipulated procurement process in local governments: A case from a developing nation. International Journal of Procurement Management. 13(5): 678-700.
Aje, I. O., and Awodele, O. A. (2006). A study of ethical values of quantity surveyors in Nigeria: Ethical issues and the challenges in construction professionals service delivery. Proceedings of a 2-Day National Seminar, 2-3.
Arain, F. M., and Pheng, L. S. (2005) The potential effect of variation orders on institutional building projects. Facilities. 23(11/12), 123-148.
Ashcraft, K. L. (2007). Appreciating the ‘work’ of discourse: Occupational identity and difference as organising mechanisms in the case of commercial airline pilots. Discourse and Communication. 1(1): 9-36.
Ashworth, A., Hogg, K., and Higgs, C. (2013). Willis’s practice and procedure for the quantity surveyor. John Wiley and Sons.
Babatunde, S. O., Awodele, O. A., and Adeniyi, O. (2018). Opportunities and challenges of foreign direct investment utilisation and its impact on construction sector in developing
Ojo et al. JCPMI, 10(2): 1-13
11
countries. Journal of Financial Management of Property and Construction. 23(2), 239-256.
Boon, J. (2001). New Zealand quantity surveying practices–Continuing to adapt in a changing environment. Proceedings of the 2001 RICS COBRA conference. Caledonia.
Brown, J.D. (2009). Choosing the right type of rotation in PCA and EFA. JALT Testing and EvaluationSIG Newslettter. 13(3), 20-25.
Cartlidge, D. (2006). New aspects of quantity surveying practice. Butterworth-Heinemann. London: Spon press.
Chiu, B. W., and Lai, J. H. (2016). Implementing building information modelling in building services engineering: benefits and barriers. Building up business operations and their logic Shaping materials and technologies. 3, 332-343.
Dada, J. O., and Jagboro, G. O. (2012). Core skills requirement and competencies expected of quantity surveyors: perspectives from quantity surveyors, allied professionals and clients in Nigeria. Australasian Journal of Construction Economics and Building. 12(4), 78-90.
Dixon, T. (1998). Building the web: The internet and the property profession. Royal Institute of Chartered Surveyors, United Kingdom.
Doyle, A., and Hughes, W. (2000). The influence of project complexity on estimating accuracy. 16th Annual ARCOM Conference, 623-634.
Fagbenle, O. I., Makinde, F. A., and Oluwunmi, A. O. (2011). Factors influencing construction clients’/contractors’ choice of subcontractors in Nigeria. Journal of Sustainable Development. 4(2), 254-259.
Frei, M. (2010). Implications of the global financial crisis for the quantity surveying profession. International Cost Management Journal. 1-10
Frei, M., and Mbachu, J. (2009). The future of quantity surveying in New Zealand: Likely changes, threats and opportunities. 13th Pacific Association of Quantity Surveyors Congress, 50-63.
Frei, M., Mbachu, J., and Phipps, R. (2013). Critical success factors, opportunities and threats of the cost management profession: the case of Australasian quantity surveying firms. International Journal of Project Organisation and Management, 5(1/2), 4-24.
Ganiyu, B. O., Oyewobi, L. O., and Lynda, N. (2012). Diversification and performance of quantity surveyors in Nigerian construction industry. The Construction, Building and Real Estate Research Conference of the Royal Institution of Chartered Surveyors.
Goodman, E., and Schaps, K. (2008). The evolving QS. Building. available at http://www.building.co.uk/.
Harada, T., Abe, T., Kato, F., Matsumoto, R., Fujita, H., Murai, S., Miyajima, N., Tsuchiya, K., Maruyama, S., Kudo, K., and Shinohara, N. (2015). Five-point Likert scaling on MRI predicts clinically significant prostate carcinoma”, BMC urology. 15(1),1-7.
Harun, H., and Abdullah, J. V. T. (2006). Drivers of change: New challenges for the quantity surveyors. Proceedings of the International Conference of Construction Industry 2006. Malaysia: Universiti Teknologi.
Hasan, A. N., and Rasheed, S. M. (2019). The benefits of and challenges to implement 5D BIM in construction industry. Civil Engineering Journal. 5(2), 412-421.
Henson, R. K., and Roberts, J. K. (2006). Use of exploratory factor analysis in published research: Common errors and some comment on improved practice. Educational and Psychological measurement. 66(3), 393-416.
Hillary, R. (2004). Environmental management systems and the smaller enterprise. Journal of Cleaner Production. 12(6), 19-41.
Jarvis, P. (2009). The Routledge international handbook of lifelong learning. Routledge. Kadiri, D. S., and Ayodele, E. M. (2013). Constraints to quantity surveying awareness in
Nigeria. Constraints. 3(11), 17-21. Kline, P. (2002). An easy guide to factor analysis, Routledge, London.
Ojo et al. JCPMI, 10(2): 1-13
12
Matipa, W. M., Kelliher, D., and Keane, M. (2008). How a quantity surveyor can ease cost management at the design stage using a building product model. Construction Innovation. 8(3), 164-181.
Maver, T., and Petric, J. (2003). Sustainability: real and/or virtual? Automation in Construction. 1(6), 641-648.
Mbachu, J., and Nkado, R. (2006). Conceptual framework for assessment of client needs and satisfaction in the building development process. Construction Management and Economics. 24(1), 31-44.
Mlinga, R. S. (2008). Ethics in public procurement: A missing link in the education and training of construction industry practitioners. Proceedings of Construction Industry Forum, 1-19.
Mogbo, T. C. (1998). Quantity surveying in the Nigerian university system: A pragmatic approach for the new millennium. The Quantity Surveyors, 17-25.
Nascimento, D. V., and Valdes-Cotera, R. (2018). Promoting lifelong learning for all: The experiences of Ethiopia, Kenya, Namibia, Rwanda and the United Republic of Tanzania. UIL Publications Series on Lifelong Learning Policies and Strategies: No. 5. UNESCO Institute for Lifelong Learning.
Nigerian Institute of Quantity Surveyors (NIQS) Lagos State Chapter (2018). Phone call with the Lagos State Chapter Secretary.
Nigerian Institute of Quantity Surveyors. (2004). Who is a quantity surveyor? What can he do for you! Programme of the 21st Biennial conference/general meeting of Nigerian Institute of Quantity Surveyors held at the premier hotel, Ibadan.
Nnadi, E. O. E., Okeke, F. N., and Alintah-Abel, U. (2016). Marketing quantity surveying profession in South-Eastern Nigeria. Journal of Mechanical and Civil Engineering. 13(3), 12-20.
Ogunsemi, D. R. (2015). Value for money in construction projects: The quantity surveyor’s quest. Inaugural Lecture delivered at the Federal University of Technology, Akure, Nigeria.
Ogunsina, O., Ekwus Obiegbu, M., and Adeniyi, O. (2018). Factors confronting quantity surveying practice: The case of Nigeria. Journal of Engineering, Design and Technology. 16(5), 767-782.
Ojo, L. D. (2018). Development of a framework for value management adoption on construction projects in Nigeria. Unpublished Master Thesis of Quantity Surveying Department, Federal University of Technology, Akure.
Ojo, L. D., Akindeinde, A. S., and Oke, A. E. (2019). Pedagogy of quantity surveying software: improvement strategies and impacts. Environmental Design and Management International Conference, 640 – 649.
Ojo, LD, and Ogunsemi, D.R. (2019). Critical Drivers (CDs) of value management adoption in the Nigerian construction industry: A Delphi study. Journal of Engineering, Design and Technology. 17(1), 250-264.
Oke, A. E., and Aigbavboa, C. O. (2017). Sustainable value management for construction projects. Cham: Springer International Publishing.
Oke, A. E., and Aighimien, D. O. (2018). Drivers of value management in the Nigerian construction industry. Journal of Engineering, Design and Technology. 16(2), 270-284.
Oke, A. E., and Ogunsemi, D. R. (2013). Key competencies of value managers in Lagos state, Nigeria. Proceedings of 5th West Africa Built Environment Research (WABER) Conference, 773-778.
Olatunde, N. A., and Okorie, V. N. (2016). Appraisal of awareness level of quantity surveying profession among secondary school students in Benin city, Nigeria. International Journal of Advanced Engineering, Management and Science. 2(8), 1278-1284.
Olatunji, O. A., Sher, W., and Gu, N. (2010). Building information modeling and quantity surveying practice. Emirates Journal for Engineering Research. 15(1): 67-70.
Ojo et al. JCPMI, 10(2): 1-13
13
Olatunji, S. O., Oke, A. E., and Owoeye, L. C. (2014). Factors affecting performance of construction professionals in Nigeria. International Journal of Engineering and Advanced Technology. 3(6), 76-84.
Olawumi, T. O., Akinrata, E. B., and Arijeloye, B. T. (2016) Value management – creating functional value for construction projects: An exploratory study. World Scientific News. 54, 40-59.
Olawumi, T. O., Chan, D. W. M., Wong, J. K. W., and Chan, A. P. C. (2018). Barriers to the integration of BIM and sustainable practices in construction projects: A Delphi survey of international experts. Journal of Building Engineering. 20, 60-71.
Onwunsoye, S.I.J. (2013). Quantity surveying profession and the identity crisis. A paper presented at the 2013 Annual Conference of Registered Quantity Surveyors at the Reiz Continental Hotel, Abuja.
Owolana, V. O., and Booth, C. A. (2016). Stakeholders perception pf the benefits and barriers of implementing environmental management systems in the Nigerian construction industry. Journal of Environmental Engineering and Landscape Management. 24(2), 79-89.
Oyediran, O. S., and Odusami, K. T. (2005). A study of computer usage by Nigerian quantity surveyors. ITcon. 10, 291-303.
Palmer, W. (2012). Incentive and disincentive: Will they affect performance. Journal of Business and Management. 14(3), 32-52.
Porth, S. (2003). Strategic management: A cross functional approach, Prentice Hall, and New Jersey.
Rahman, S. H. A., Endut, I. R., Faisol, N., and Paydar, S. (2014). The importance of collaboration in construction industry from contractors’ perspectives. Procedia-Social and Behavioral Sciences. 129, 414-421.
Sarmah, H. K., & Hazarika, B. B. (2012). Importance of the size of Sample and its determination in the context of data related to the schools of greater Guwahati. Bulletin of the Gauhati University of Mathematics Association, 12, 55-76.
Schostak, J., Davis, M., Hanson, J., Schostak, J., Brown, T., Driscoll, P., and Jenkins, N. (2010). Effectiveness of continuing professional development’ project: A summary of findings. Medical teacher. 32(7), 586-592.
Shen, Q., and Liu, G. (2003). Critical success factor for value management studies in construction. Journal of Construction Engineering and Management. 129(5), 485-498.
Smith, P. (2011). Information technology and the quantity surveying practice. Construction Economics and Building. 1(1), 1-21.
Smith, P. V. (2004). Trends in the Australian quantity surveying profession 1995-2003. World Congress on Cost Engineering, Project Management and Quantity Surveying, AACE American Association of Cost Engineers. International Cost Engineering Council.
Smyth, H. (2000). Marketing and selling construction services. Oxford: Blackwell. Usman, O.S., Oaikhena, E.O., and Ojo, L. D. (2019). Benefits of integrating 5D BIM in cost
management practice in quantity surveying firms. The 4th Research Conference of the Nigerian Institute of Quantity Surveyors, 67-73.
Wao, J. O. (2015). Predicting the future of quantity surveying profession in the construction industry. Journal of Construction Project Management and Innovation. 5(2), 1211-1223.
Wao, J. O., and Flood, I. (2016). The role of quantity surveyors in the international construction arena. International Journal of Construction Management. 16(2), 126-137.
Journal of Construction Project Management and Innovation, 10 (2): 14-29, 2020
ISSN 2223-7852 © Sustainable Human Settlement and Construction Research Centre DOI: https://doi.org/10.36615/jcpmi.v10i2.404
14
PREDICTING RURAL STEM TEACHERS’ ACCEPTANCE OF MOBILE LEARNING IN THE
FOURTH INDUSTRIAL REVOLUTION
David MUTAMBARA1 and Anass BAYAGA1*
1Department of Mathematics, Science and Technology Education, University of Zululand, KwaDlangezwa, Empangeni, South Africa
Email: [email protected]; [email protected]
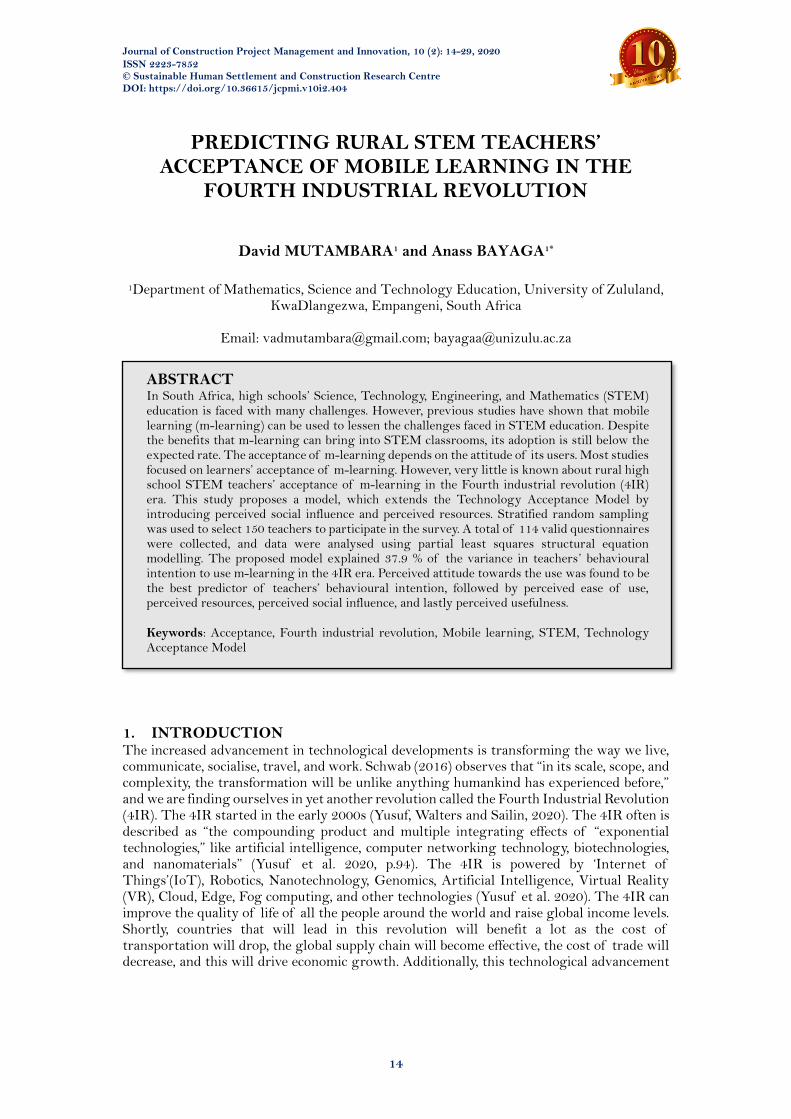
ABSTRACT In South Africa, high schools’ Science, Technology, Engineering, and Mathematics (STEM) education is faced with many challenges. However, previous studies have shown that mobile learning (m-learning) can be used to lessen the challenges faced in STEM education. Despite the benefits that m-learning can bring into STEM classrooms, its adoption is still below the expected rate. The acceptance of m-learning depends on the attitude of its users. Most studies focused on learners’ acceptance of m-learning. However, very little is known about rural high school STEM teachers’ acceptance of m-learning in the Fourth industrial revolution (4IR) era. This study proposes a model, which extends the Technology Acceptance Model by introducing perceived social influence and perceived resources. Stratified random sampling was used to select 150 teachers to participate in the survey. A total of 114 valid questionnaires were collected, and data were analysed using partial least squares structural equation modelling. The proposed model explained 37.9 % of the variance in teachers’ behavioural intention to use m-learning in the 4IR era. Perceived attitude towards the use was found to be the best predictor of teachers’ behavioural intention, followed by perceived ease of use, perceived resources, perceived social influence, and lastly perceived usefulness. Keywords: Acceptance, Fourth industrial revolution, Mobile learning, STEM, Technology Acceptance Model
1. INTRODUCTION The increased advancement in technological developments is transforming the way we live, communicate, socialise, travel, and work. Schwab (2016) observes that “in its scale, scope, and complexity, the transformation will be unlike anything humankind has experienced before,” and we are finding ourselves in yet another revolution called the Fourth Industrial Revolution (4IR). The 4IR started in the early 2000s (Yusuf, Walters and Sailin, 2020). The 4IR often is described as “the compounding product and multiple integrating effects of “exponential technologies,” like artificial intelligence, computer networking technology, biotechnologies, and nanomaterials” (Yusuf et al. 2020, p.94). The 4IR is powered by ‘Internet of Things’(IoT), Robotics, Nanotechnology, Genomics, Artificial Intelligence, Virtual Reality (VR), Cloud, Edge, Fog computing, and other technologies (Yusuf et al. 2020). The 4IR can improve the quality of life of all the people around the world and raise global income levels. Shortly, countries that will lead in this revolution will benefit a lot as the cost of transportation will drop, the global supply chain will become effective, the cost of trade will decrease, and this will drive economic growth. Additionally, this technological advancement
Mutambara and Bayaga, JCPMI, 10(2): 14-29
15
will allow these countries to produce services and products more cheaply than low wage workers (Sekiyama 2020).
Makgato (2019) reported that 4IR is creating new forms of jobs. It is estimated that 65% of children entering primary school will work in jobs that are currently not existing (Yusuf et al. 2020). To prepare these children for 4IR jobs, schools should equip them with cognitive abilities, basic skills, and cross-functional skills. Cognitive abilities require a child to have a flexible mindset, be creative, think logically, and to reason mathematically (Yusuf et al. 2020). Yusuf et al. (2020) differentiated basic skills into content and process skills. M-learning can help learners to acquire these skills through the use of educational games. Content skills require active learning, information and communication technology literacy, written and oral expression. Through the use of m-learning learners will be able to use digital technology, communications tools, and/or networks to access, manage, integrate, evaluate, and create information in order to function in a knowledge society (Tomei, 2008). Critical thinking, active listening, and collaboration form process skills. Yusuf et al. (2020) stated that cross-functional skillset cuts across other skillsets dimensions, like complex problem-solving skills, social skills, and technical skills. Most of these skills that the 4IR require are part of Science, Technology, Engineering, and Mathematics (STEM) education. Makgato (2019) reported that 75% of the fastest-growing occupations require STEM skills and knowledge. However, there is no interest and poor performance in STEM-related subjects in South Africa (Makgato, 2019).
In South Africa, high schools’ STEM education is faced with many challenges, especially in rural areas (Bosman and Schulze 2018; Makgato 2007; Mashaba and Maile 2018; Mboweni 2014). Coupled with local assessments, international assessments in Mathematics and Science, like the Trends in International Mathematics and Science Studies, show that, compared to other developing countries, the performance of South African learners in Mathematics and Science is very poor, especially for African learners in rural areas (Mupira and Ramnarain 2018). According to Bosman and Schulze (2018), teachers use traditional face-to-face instruction (FTF) which fail to stimulate deep holistic STEM learning experiences. Bosman and Schulze (2018) added that this poor performance in STEM-related subjects in rural areas is caused by prolonged mismatches between the teaching styles and learners’ learning preferences in the classroom. Lack of learning materials, science laboratories, and equipment to enhance effective STEM teaching and learning in rural high schools contribute to poor learners’ performance (Mboweni 2014). Mashaba and Maile (2018) attribute learners’ poor performance in mathematics and science in rural areas to a high rate of teacher absenteeism. The high rate of teacher absenteeism is caused by teachers getting into the classroom late or leaving the classroom early before time, teachers attending union meetings, workshops, transport problems, and violence in high schools. The conclusion that can be drawn from these studies (Bosman and Schulze 2018; Makgato 2007; Mashaba and Maile 2018; Mboweni 2014) is that in rural high schools there is no effective STEM teaching and learning. This leads to learners not acquiring the skills needed in the 4IR.
A plethora of studies has shown that m-learning can be used to mitigate the challenges in STEM education (Almaiah et al. 2016; Alrajawy et al. 2017; DoE 2017; Koehler and Mishra 2016; Pinker 1997). With the coming in of the 4IR to Africa, m-learning will be improved even in rural areas, as mobile broadband and fast, and reliable internet access will be made available. Data bundles will also be made cheaper, making m-learning affordable in rural areas. According to Koehler and Mishra (2016), m-learning changes a teacher-centred approach to learner-centred, which can stimulate deep holistic learning experiences. M-learning also provides teachers with many different teaching methods such as the use of audio recording features, live polling tools, chat, online discussion forums, and group work (Yeap et al. 2016), which can be used to meet learners’ different learning preferences. M-learning enables learners to visualise science experiments, which can improve learners’ knowledge of science, and enable them to give complete explanations of scientific concepts
Mutambara and Bayaga, JCPMI, 10(2): 14-29
16
(Pinker 1997). Al-Emran and Salloum (2017) stated that m-learning provides learning material
anywhere and anytime. M-learning increases contact time between teachers and learners (Almaiah et al. 2016), thereby minimising time loss. Mobile devices are affordable, can be used as a cognitive tool in learning tasks to solve realistic problems and encourage reflection and collaboration during learning (Grimus and Ebner, 2016). Grimus and Ebner (2016), carried out a study to assess the effects of m-learning on learners’ performance in STEM-related subjects, and the results showed that it improves learners’ performance. What can be learnt from these studies (Almaiah et al. 2016; Alrajawy et al. 2017; DoE 2017; Grimus and Ebner, 2016; Koehler and Mishra 2016; Pinker 1997), is that even though rural high school STEM education is faced with many challenges, m-learning can be used to alleviate these challenges and to help rural high school learners to acquire STEM skills which can prepare them for jobs in the 4IR era.
Mobile Learning denotes learning involving the use of a mobile device such as smartphone, tablets, Ipad, and laptops (Almaiah et al., 2016). M-learning provides unique opportunities for addressing many of the STEM education needs (Krishnamurthi and Richter, 2013). For effective STEM learning, m-learning can make content more engaging, and this motivates learners to spend time on learning. This can be achieved by implanting videos and problem-solving steps in their mobile STEM notes (Krishnamurthi and Richter, 2013). Lessons can also be recorded and delivered asynchronously, which allows STEM learners to watch them repeatedly until they understand the content. Furthermore, m-learning should enable learners to visualise experiments or to be able to interfere with the experimental setup online (Krishnamurthi and Richter, 2013).
Despite the benefits that m-learning can bring in a rural STEM classroom, Odiakaosa et al. (2017) stated that the potentials of m-learning are roundly overlooked, and cannot be tapped in if the attitudes of educators are not put into consideration. There is a big gap between the availability of technology and how it is being used by teachers for instructional purposes. Learners can informally support their learning using mobile devices; however, it will remain informal until teachers support its integration into a more formal way (Callum et al. 2014). Teachers select the instructional method they see fit to teach in their classes; they consider the type of technology to be used by learners, its quality, and the frequency (Sánchez-Prietoa et al. 2019). Learners’ acceptance of m-learning can easily be influenced by their teachers. Consequently, teachers’ intention to adopt m-learning in the 4IR era is vital for the successful implementation of m-learning in rural areas. Davis (1989) also stated that the acceptance of an information system (IS) depends on the user’s attitudes. Because of the assessments of Callum et al. (2014) and Davis (1989), it could be argued that for m-learning to be successfully implemented in the 4IR era in rural in high schools, it depends on teachers’ attitudes. Thus, it is necessary to investigate high school STEM teachers’ attitudes towards m-learning in the 4IR era.
Several studies have been conducted in tertiary institutions on the acceptance of m-learning (Alasmari and Zhang 2019; Aldheleai et al. 2019; Al-Emran et al. 2016; Callum et al. 2014; Waheed and Jam 2010), hence its successful implementation. It is reasonable to state that, for m-learning to be successfully accepted in the 4IR era in rural high schools of developing countries, more teacher-acceptance studies are needed. Few studies have focused on high school teachers’ (Siyam 2019; Alshmrany and Wilkinson 2017; Nikou and Economides 2018), and learners’ (Estrieganaa et al. 2019; Ford and Botha 2010) acceptance of m-learning. Nikou and Economides (2018) investigated the acceptance of mobile assessment in 32 European countries, Siyam (2019) focused on the acceptance of m-learning by special education teachers, and Alshmrany and Wilkinson (2017) focused on the acceptance of m-learning by primary school teachers. Additionally, studies that explain m-learning acceptance in the 4IR era in the context of STEM, particularly in rural areas, continue to remain limited.
Mutambara and Bayaga, JCPMI, 10(2): 14-29
17
According to Ford and Botha (2010), for m-learning to be successfully implemented in South Africa, more studies on the acceptance of m-learning need to be conducted, especially on teachers’ acceptance and not to blindly follow examples in developed countries. Based on the suggestion of Ford and Botha (2010), this study sought to examine the factors that rural high school STEM teachers consider important when accepting m-learning in the 4IR era. This is primarily because, (Siyam 2019; Alshmrany and Wilkinson 2017; Nikou and Economides 2018), did not look at the perceptions of rural high school STEM teachers towards m-learning in the 4IR era.
For m-learning to be successfully implemented in rural areas in the 4IR era, it is important to identify and understand the factors that rural high school STEM teachers consider important when accepting it. Thus, this study explores the variables that predict the rural high school STEM teachers’ behavioural intention to use m-learning in the 4IR era. Specifically, the study aims to give answers to the following research questions:
RQ1. What are the effects of perceived attitude towards the use, perceived resources, perceived social influence, perceived usefulness, and perceived ease of use on rural high school STEM teachers’ behavioural intention to use m-learning in the 4IR era? RQ2. What is the relative importance of each of these factors in explaining rural high school STEM teachers’ behavioural intention to use m-learning in the 4IR era?
By providing answers to these study questions, this study aims to gain insights into the relative importance of the factors that rural high school STEM teachers consider important when adopting m-learning in the 4IR era. The study proposes the development and validation of a model. The proposed model is an extension of the Technology Acceptance Model (TAM).
2. LITERATURE REVIEW To encourage the use of an information system (IS), the IS needs to be made known to the potential users, and they should accept it. Getting more insight into the factors that potential users of IS consider is at the heart of adoption research (Hoi 2019) and helps relevant decision-makers to form informed decisions. Several models have been developed to explain user acceptance. In the context of m-learning, the TAM (Davis 1989) and the Unified Theory of Acceptance and Use of Technology (UTAUT) (Venkatesh et al. 2003) are the commonly used models. UTAUT is criticised for failing to predict behaviours that are not totally within an individual’s control. M-learning can be implemented, and users can be forced to use it. Since UTAUT fails to predict the behaviours that an individual cannot decide on, it cannot be used in the current study.
Prior research has been carried out to understand teachers’ acceptance of m-learning (Callum et al. 2014; Nikou and Economides 2019; Siyam 2019). Siyam (2019) extended the TAM to study the factors that special education high school teachers consider important when adopting the technology, like the study by Davis (1989), Siyam (2019) found that teachers’ behavioural intention (BI) is influenced by both perceived usefulness (PU) and perceived attitudes towards (ATT) the use. These results were in line with the findings of Callum et al. (2014), who reported that the teachers’ intentions to use m-learning were conditioned by their attitudes and the usefulness of m-learning. Congruent to the findings of Nikou and Economides (2019), both PU and perceived ease of use (PEOU) had a significant effect on ATT. Confirming the results of Callum et al. (2014), PEOU was found to influence teachers’ PU (Siyam 2019).
Nikou and Economides (2019) extended the TAM by adding facilitating conditions
Mutambara and Bayaga, JCPMI, 10(2): 14-29
18
(perceived resources (PR)). Nikou and Economides (2019) found that PR influences teachers’ PEOU. Teo (2010) also extended the TAM by adding perceived social influence (PSI). The results showed that PSI influences teachers’ PU, PEOU, and ATT.
3. THEORETICAL BACKGROUND AND HYPOTHESES DEVELOPMENT
Davis, Bagozzi, and Warshaw (1989) developed the TAM to predict the intention to adopt a new IS. Technology acceptance is defined as a person’s thoughts regarding his or her planned use of technology (Siyam, 2019). Cheng (2019) reported that TAM is the most used model in predicting and explaining the intention of users to use a new IS. The TAM is built upon two pillars: perceived ease of use (PEOU) and perceived usefulness (PU). PU is influenced by PEOU. The TAM posits that perceived ease of use and perceived usefulness (PU) predicts perceived attitude towards the use (ATT). PU and ATT determine the user’s behavioural intention to use (BI), which in turn influences the actual usage.
The TAM has received empirical support in academia for being robust in explaining and predicting m-learning acceptance (Park 2009; Sánchez-Prietoa et al. 2019; Teo 2009). However, the TAM has been criticised by other researchers (Carlsson, Carlsson, Hyvonen, Puhakainen, and Walden 2006; Venkatesh et al. 2003). Carlsson et al. (2006) criticised the TAM for being more general and applicable to the acceptance of technology in many different fields. Carlsson et al. (2006) stressed that m-learning is more individual, more personalised and focuses on services offered by the system. Another criticism of the TAM is its low explanatory power of users’ attitudes towards the IS (Venkatesh et al. 2003). Based on the criticism by Carlsson et al. (2006) and Venkatesh et al. (2003), the TAM alone is not enough in predicting and explaining STEM teachers’ acceptance of m-learning in the 4IR era. Consequently, this paper extended the TAM by adding two external variables: perceived resources and perceived social influence. These two factors are the factors that rural high school STEM teachers are more likely to consider important when accepting m-learning in the 4IR era.
3.1 Behavioural intention (BI) Davis (1989) defined BI as the degree of strength of a user’s intention to carry out a specified behaviour. Many studies have confirmed that the user’s BI has a high correlation with the actual usage (Davis 1989; Teo 2010; Venkatesh and Davis 2000; Venkate et al. 2003). BI is considered the single best predictor of actual usage (Davis 1989; Venkatesh 2000). Based on the finding of Davis (1989) and Venkatesh (2000), one can conclude that understanding factors that influence BI is the same as understanding factors that influence the actual usage of m-learning by rural high school STEM teachers in the 4IR era. 3.2 Perceived attitude toward the use (ATT) In the current study, ATT can be defined as a rural high school STEM teachers’ overall affection reaction towards the use of m-learning. Teachers’ attitudes and beliefs toward m-learning are the key factors for its successful adoption (Aldheleai et al. 2019). Siyam (2019) and Aldheleai et al. (2019) found that teachers’ ATT positively influences their BI to use m-learning. If rural high school STEM teachers develop a positive attitude towards m-learning, they will use it in their STEM classrooms. Therefore, the hypothesis: H1: Rural high school STEM teachers’ ATT influences their BI to use m-learning in the 4IR. 3.3 Perceived ease of use (PEOU) Sánchez-Prietoa et al. (2019) investigated the acceptance of m-learning by pre-service teachers. Their results confirmed the findings of Davis (1989) that PEOU had a direct positive effect on PU and ATT and an indirect effect on BI through PU and ATT. If rural
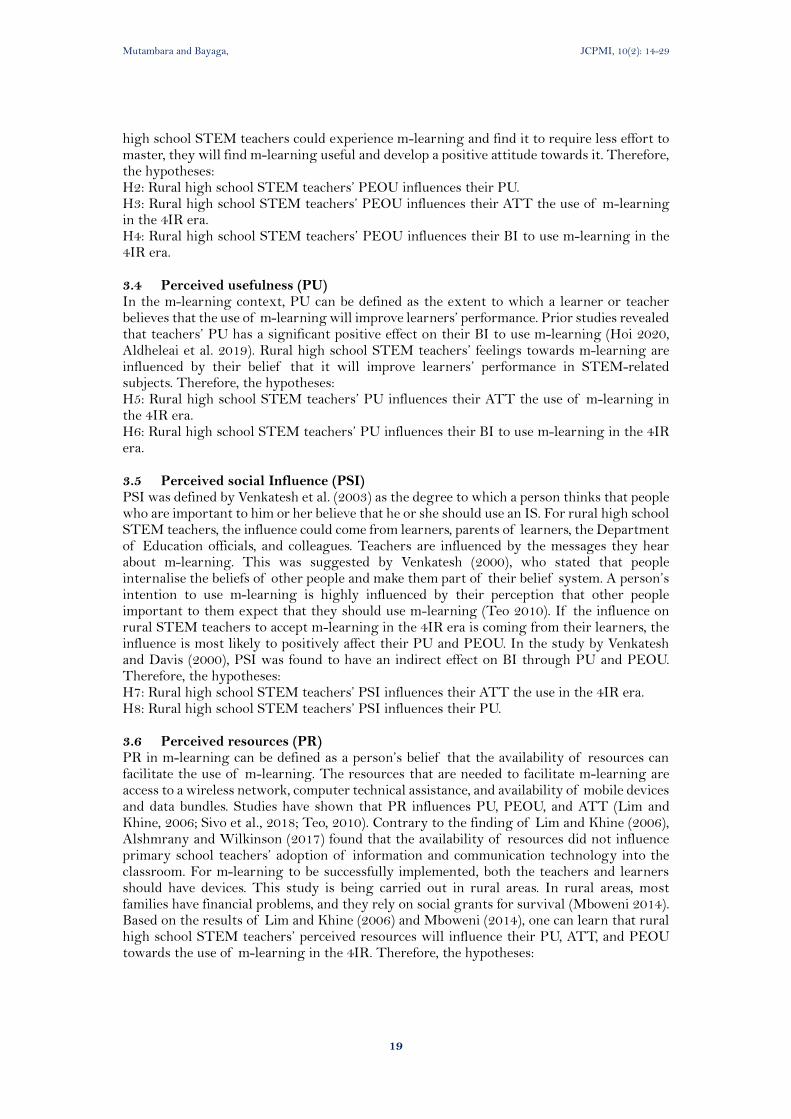
Mutambara and Bayaga, JCPMI, 10(2): 14-29
19
high school STEM teachers could experience m-learning and find it to require less effort to master, they will find m-learning useful and develop a positive attitude towards it. Therefore, the hypotheses: H2: Rural high school STEM teachers’ PEOU influences their PU. H3: Rural high school STEM teachers’ PEOU influences their ATT the use of m-learning in the 4IR era. H4: Rural high school STEM teachers’ PEOU influences their BI to use m-learning in the 4IR era. 3.4 Perceived usefulness (PU) In the m-learning context, PU can be defined as the extent to which a learner or teacher believes that the use of m-learning will improve learners’ performance. Prior studies revealed that teachers’ PU has a significant positive effect on their BI to use m-learning (Hoi 2020, Aldheleai et al. 2019). Rural high school STEM teachers’ feelings towards m-learning are influenced by their belief that it will improve learners’ performance in STEM-related subjects. Therefore, the hypotheses: H5: Rural high school STEM teachers’ PU influences their ATT the use of m-learning in the 4IR era. H6: Rural high school STEM teachers’ PU influences their BI to use m-learning in the 4IR era. 3.5 Perceived social Influence (PSI) PSI was defined by Venkatesh et al. (2003) as the degree to which a person thinks that people who are important to him or her believe that he or she should use an IS. For rural high school STEM teachers, the influence could come from learners, parents of learners, the Department of Education officials, and colleagues. Teachers are influenced by the messages they hear about m-learning. This was suggested by Venkatesh (2000), who stated that people internalise the beliefs of other people and make them part of their belief system. A person’s intention to use m-learning is highly influenced by their perception that other people important to them expect that they should use m-learning (Teo 2010). If the influence on rural STEM teachers to accept m-learning in the 4IR era is coming from their learners, the influence is most likely to positively affect their PU and PEOU. In the study by Venkatesh and Davis (2000), PSI was found to have an indirect effect on BI through PU and PEOU. Therefore, the hypotheses: H7: Rural high school STEM teachers’ PSI influences their ATT the use in the 4IR era. H8: Rural high school STEM teachers’ PSI influences their PU. 3.6 Perceived resources (PR) PR in m-learning can be defined as a person’s belief that the availability of resources can facilitate the use of m-learning. The resources that are needed to facilitate m-learning are access to a wireless network, computer technical assistance, and availability of mobile devices and data bundles. Studies have shown that PR influences PU, PEOU, and ATT (Lim and Khine, 2006; Sivo et al., 2018; Teo, 2010). Contrary to the finding of Lim and Khine (2006), Alshmrany and Wilkinson (2017) found that the availability of resources did not influence primary school teachers’ adoption of information and communication technology into the classroom. For m-learning to be successfully implemented, both the teachers and learners should have devices. This study is being carried out in rural areas. In rural areas, most families have financial problems, and they rely on social grants for survival (Mboweni 2014). Based on the results of Lim and Khine (2006) and Mboweni (2014), one can learn that rural high school STEM teachers’ perceived resources will influence their PU, ATT, and PEOU towards the use of m-learning in the 4IR. Therefore, the hypotheses:
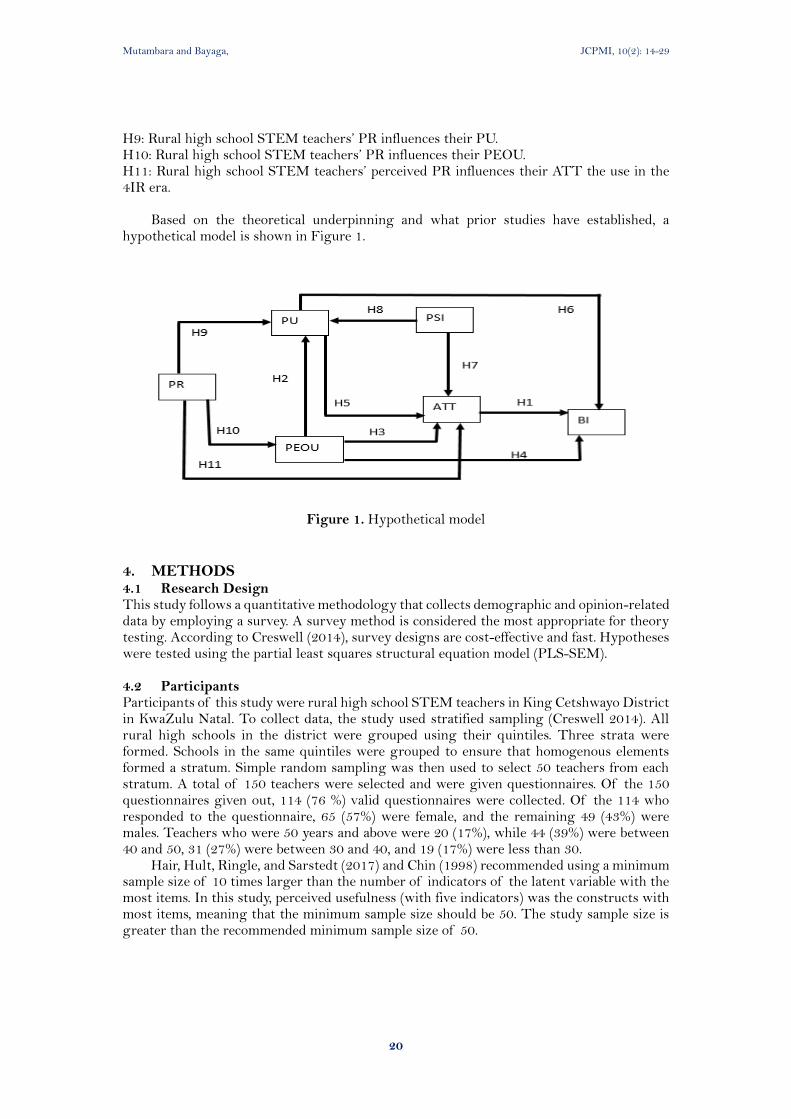
Mutambara and Bayaga, JCPMI, 10(2): 14-29
20
H9: Rural high school STEM teachers’ PR influences their PU. H10: Rural high school STEM teachers’ PR influences their PEOU. H11: Rural high school STEM teachers’ perceived PR influences their ATT the use in the 4IR era.
Based on the theoretical underpinning and what prior studies have established, a hypothetical model is shown in Figure 1.
Figure 1. Hypothetical model
4. METHODS 4.1 Research Design This study follows a quantitative methodology that collects demographic and opinion-related data by employing a survey. A survey method is considered the most appropriate for theory testing. According to Creswell (2014), survey designs are cost-effective and fast. Hypotheses were tested using the partial least squares structural equation model (PLS-SEM). 4.2 Participants Participants of this study were rural high school STEM teachers in King Cetshwayo District in KwaZulu Natal. To collect data, the study used stratified sampling (Creswell 2014). All rural high schools in the district were grouped using their quintiles. Three strata were formed. Schools in the same quintiles were grouped to ensure that homogenous elements formed a stratum. Simple random sampling was then used to select 50 teachers from each stratum. A total of 150 teachers were selected and were given questionnaires. Of the 150 questionnaires given out, 114 (76 %) valid questionnaires were collected. Of the 114 who responded to the questionnaire, 65 (57%) were female, and the remaining 49 (43%) were males. Teachers who were 50 years and above were 20 (17%), while 44 (39%) were between 40 and 50, 31 (27%) were between 30 and 40, and 19 (17%) were less than 30.
Hair, Hult, Ringle, and Sarstedt (2017) and Chin (1998) recommended using a minimum sample size of 10 times larger than the number of indicators of the latent variable with the most items. In this study, perceived usefulness (with five indicators) was the constructs with most items, meaning that the minimum sample size should be 50. The study sample size is greater than the recommended minimum sample size of 50.
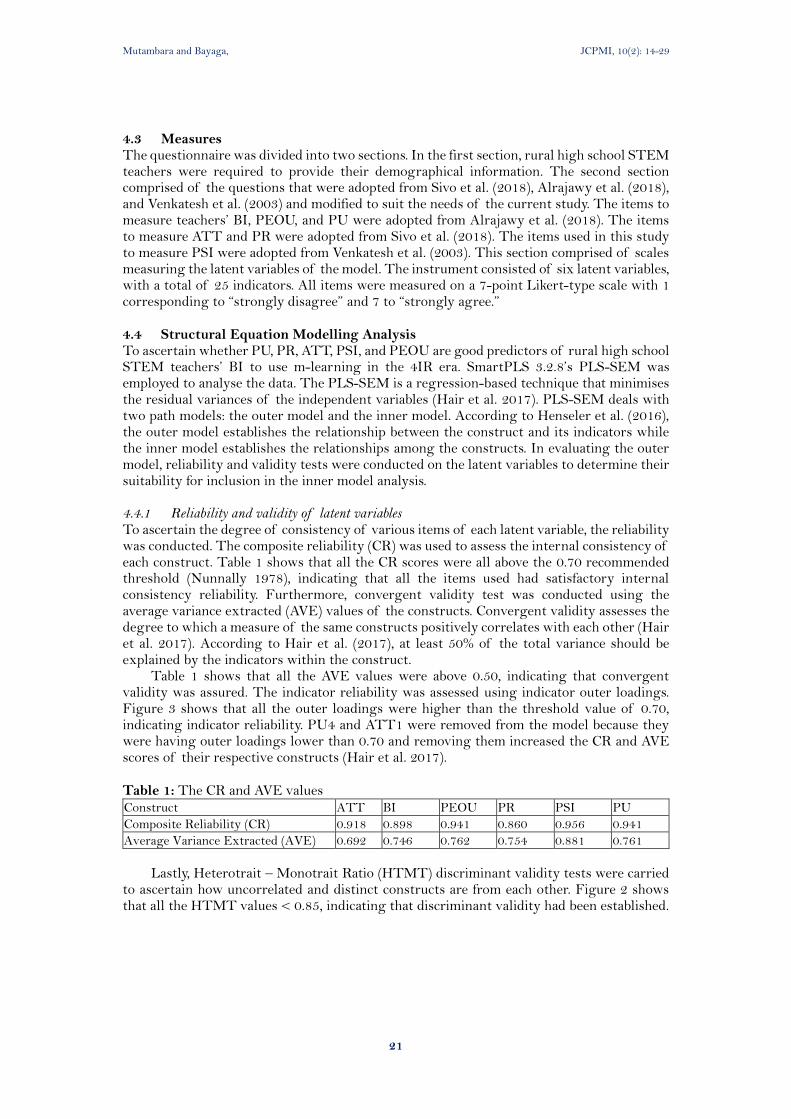
Mutambara and Bayaga, JCPMI, 10(2): 14-29
21
4.3 Measures The questionnaire was divided into two sections. In the first section, rural high school STEM teachers were required to provide their demographical information. The second section comprised of the questions that were adopted from Sivo et al. (2018), Alrajawy et al. (2018), and Venkatesh et al. (2003) and modified to suit the needs of the current study. The items to measure teachers’ BI, PEOU, and PU were adopted from Alrajawy et al. (2018). The items to measure ATT and PR were adopted from Sivo et al. (2018). The items used in this study to measure PSI were adopted from Venkatesh et al. (2003). This section comprised of scales measuring the latent variables of the model. The instrument consisted of six latent variables, with a total of 25 indicators. All items were measured on a 7-point Likert-type scale with 1 corresponding to “strongly disagree” and 7 to “strongly agree.” 4.4 Structural Equation Modelling Analysis To ascertain whether PU, PR, ATT, PSI, and PEOU are good predictors of rural high school STEM teachers’ BI to use m-learning in the 4IR era. SmartPLS 3.2.8’s PLS-SEM was employed to analyse the data. The PLS-SEM is a regression-based technique that minimises the residual variances of the independent variables (Hair et al. 2017). PLS-SEM deals with two path models: the outer model and the inner model. According to Henseler et al. (2016), the outer model establishes the relationship between the construct and its indicators while the inner model establishes the relationships among the constructs. In evaluating the outer model, reliability and validity tests were conducted on the latent variables to determine their suitability for inclusion in the inner model analysis.
4.4.1 Reliability and validity of latent variables To ascertain the degree of consistency of various items of each latent variable, the reliability was conducted. The composite reliability (CR) was used to assess the internal consistency of each construct. Table 1 shows that all the CR scores were all above the 0.70 recommended threshold (Nunnally 1978), indicating that all the items used had satisfactory internal consistency reliability. Furthermore, convergent validity test was conducted using the average variance extracted (AVE) values of the constructs. Convergent validity assesses the degree to which a measure of the same constructs positively correlates with each other (Hair et al. 2017). According to Hair et al. (2017), at least 50% of the total variance should be explained by the indicators within the construct.
Table 1 shows that all the AVE values were above 0.50, indicating that convergent validity was assured. The indicator reliability was assessed using indicator outer loadings. Figure 3 shows that all the outer loadings were higher than the threshold value of 0.70, indicating indicator reliability. PU4 and ATT1 were removed from the model because they were having outer loadings lower than 0.70 and removing them increased the CR and AVE scores of their respective constructs (Hair et al. 2017). Table 1: The CR and AVE values Construct ATT BI PEOU PR PSI PU
Composite Reliability (CR) 0.918 0.898 0.941 0.860 0.956 0.941
Average Variance Extracted (AVE) 0.692 0.746 0.762 0.754 0.881 0.761
Lastly, Heterotrait – Monotrait Ratio (HTMT) discriminant validity tests were carried
to ascertain how uncorrelated and distinct constructs are from each other. Figure 2 shows that all the HTMT values < 0.85, indicating that discriminant validity had been established.
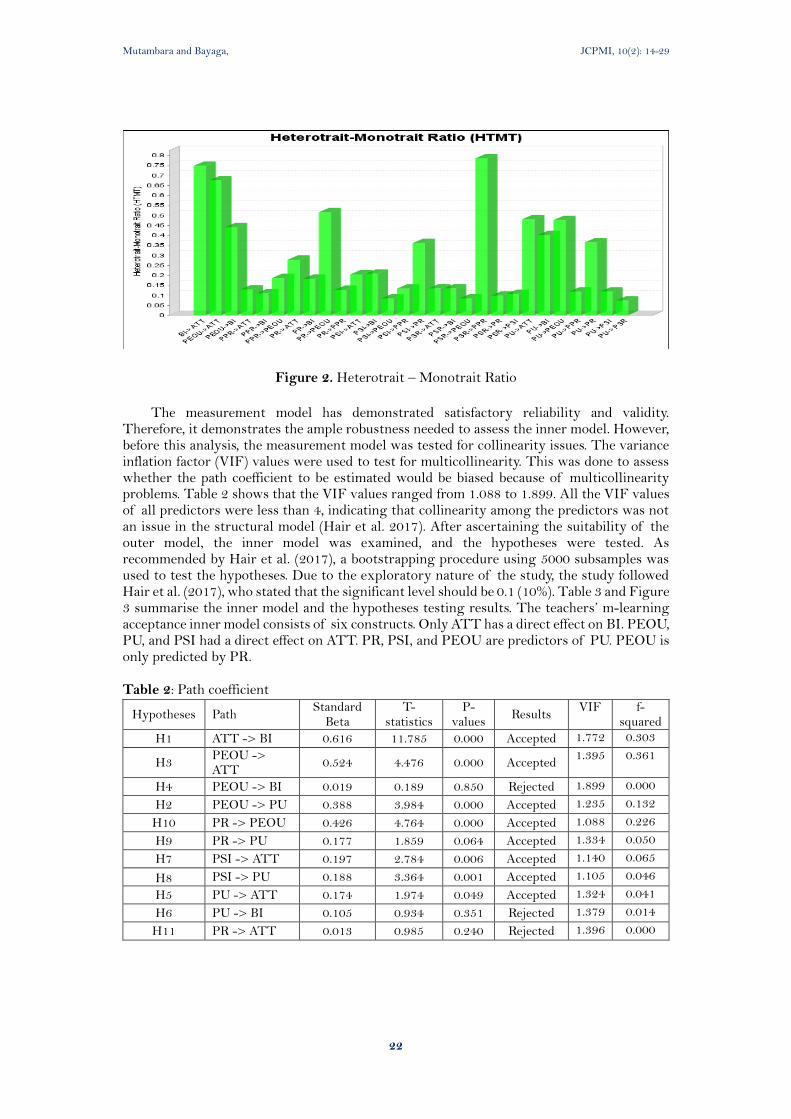
Mutambara and Bayaga, JCPMI, 10(2): 14-29
22
Figure 2. Heterotrait – Monotrait Ratio
The measurement model has demonstrated satisfactory reliability and validity. Therefore, it demonstrates the ample robustness needed to assess the inner model. However, before this analysis, the measurement model was tested for collinearity issues. The variance inflation factor (VIF) values were used to test for multicollinearity. This was done to assess whether the path coefficient to be estimated would be biased because of multicollinearity problems. Table 2 shows that the VIF values ranged from 1.088 to 1.899. All the VIF values of all predictors were less than 4, indicating that collinearity among the predictors was not an issue in the structural model (Hair et al. 2017). After ascertaining the suitability of the outer model, the inner model was examined, and the hypotheses were tested. As recommended by Hair et al. (2017), a bootstrapping procedure using 5000 subsamples was used to test the hypotheses. Due to the exploratory nature of the study, the study followed Hair et al. (2017), who stated that the significant level should be 0.1 (10%). Table 3 and Figure 3 summarise the inner model and the hypotheses testing results. The teachers’ m-learning acceptance inner model consists of six constructs. Only ATT has a direct effect on BI. PEOU, PU, and PSI had a direct effect on ATT. PR, PSI, and PEOU are predictors of PU. PEOU is only predicted by PR. Table 2: Path coefficient
Hypotheses Path Standard
Beta T-
statistics P-
values Results
VIF f-squared
H1 ATT -> BI 0.616 11.785 0.000 Accepted 1.772 0.303
H3 PEOU -> ATT
0.524 4.476 0.000 Accepted 1.395 0.361
H4 PEOU -> BI 0.019 0.189 0.850 Rejected 1.899 0.000
H2 PEOU -> PU 0.388 3.984 0.000 Accepted 1.235 0.132
H10 PR -> PEOU 0.426 4.764 0.000 Accepted 1.088 0.226
H9 PR -> PU 0.177 1.859 0.064 Accepted 1.334 0.050
H7 PSI -> ATT 0.197 2.784 0.006 Accepted 1.140 0.065
H8 PSI -> PU 0.188 3.364 0.001 Accepted 1.105 0.046
H5 PU -> ATT 0.174 1.974 0.049 Accepted 1.324 0.041
H6 PU -> BI 0.105 0.934 0.351 Rejected 1.379 0.014
H11 PR -> ATT 0.013 0.985 0.240 Rejected 1.396 0.000
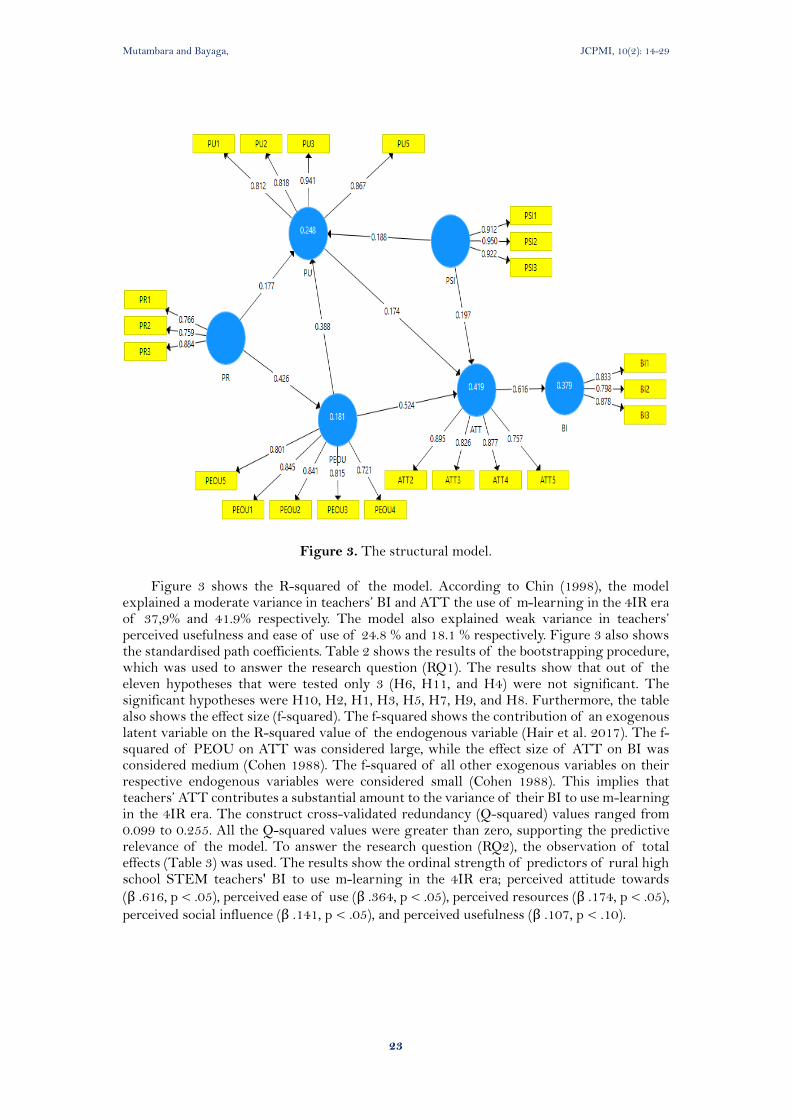
Mutambara and Bayaga, JCPMI, 10(2): 14-29
23
Figure 3. The structural model.
Figure 3 shows the R-squared of the model. According to Chin (1998), the model explained a moderate variance in teachers’ BI and ATT the use of m-learning in the 4IR era of 37,9% and 41.9% respectively. The model also explained weak variance in teachers’ perceived usefulness and ease of use of 24.8 % and 18.1 % respectively. Figure 3 also shows the standardised path coefficients. Table 2 shows the results of the bootstrapping procedure, which was used to answer the research question (RQ1). The results show that out of the eleven hypotheses that were tested only 3 (H6, H11, and H4) were not significant. The significant hypotheses were H10, H2, H1, H3, H5, H7, H9, and H8. Furthermore, the table also shows the effect size (f-squared). The f-squared shows the contribution of an exogenous latent variable on the R-squared value of the endogenous variable (Hair et al. 2017). The f-squared of PEOU on ATT was considered large, while the effect size of ATT on BI was considered medium (Cohen 1988). The f-squared of all other exogenous variables on their respective endogenous variables were considered small (Cohen 1988). This implies that teachers’ ATT contributes a substantial amount to the variance of their BI to use m-learning in the 4IR era. The construct cross-validated redundancy (Q-squared) values ranged from 0.099 to 0.255. All the Q-squared values were greater than zero, supporting the predictive relevance of the model. To answer the research question (RQ2), the observation of total effects (Table 3) was used. The results show the ordinal strength of predictors of rural high school STEM teachers' BI to use m-learning in the 4IR era; perceived attitude towards
(β .616, p < .05), perceived ease of use (β .364, p < .05), perceived resources (β .174, p < .05),
perceived social influence (β .141, p < .05), and perceived usefulness (β .107, p < .10).
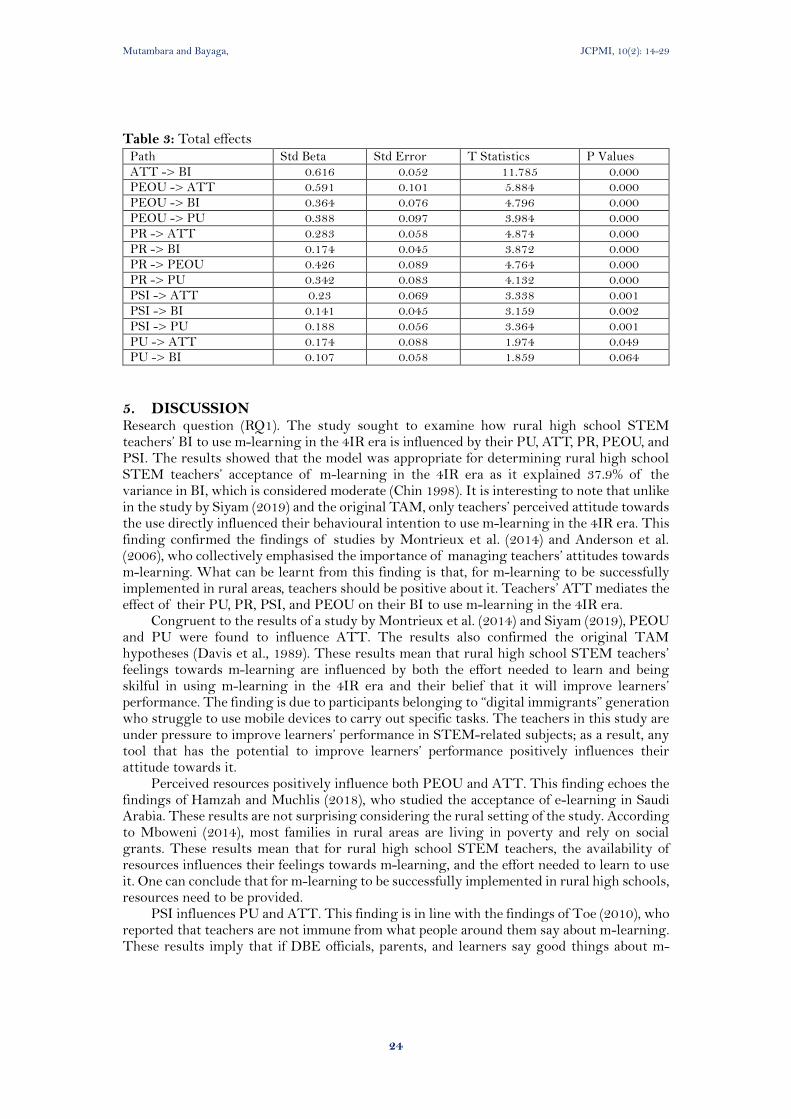
Mutambara and Bayaga, JCPMI, 10(2): 14-29
24
Table 3: Total effects Path Std Beta Std Error T Statistics P Values ATT -> BI 0.616 0.052 11.785 0.000 PEOU -> ATT 0.591 0.101 5.884 0.000 PEOU -> BI 0.364 0.076 4.796 0.000 PEOU -> PU 0.388 0.097 3.984 0.000 PR -> ATT 0.283 0.058 4.874 0.000 PR -> BI 0.174 0.045 3.872 0.000 PR -> PEOU 0.426 0.089 4.764 0.000 PR -> PU 0.342 0.083 4.132 0.000 PSI -> ATT 0.23 0.069 3.338 0.001 PSI -> BI 0.141 0.045 3.159 0.002 PSI -> PU 0.188 0.056 3.364 0.001 PU -> ATT 0.174 0.088 1.974 0.049 PU -> BI 0.107 0.058 1.859 0.064
5. DISCUSSION Research question (RQ1). The study sought to examine how rural high school STEM teachers’ BI to use m-learning in the 4IR era is influenced by their PU, ATT, PR, PEOU, and PSI. The results showed that the model was appropriate for determining rural high school STEM teachers’ acceptance of m-learning in the 4IR era as it explained 37.9% of the variance in BI, which is considered moderate (Chin 1998). It is interesting to note that unlike in the study by Siyam (2019) and the original TAM, only teachers’ perceived attitude towards the use directly influenced their behavioural intention to use m-learning in the 4IR era. This finding confirmed the findings of studies by Montrieux et al. (2014) and Anderson et al. (2006), who collectively emphasised the importance of managing teachers’ attitudes towards m-learning. What can be learnt from this finding is that, for m-learning to be successfully implemented in rural areas, teachers should be positive about it. Teachers’ ATT mediates the effect of their PU, PR, PSI, and PEOU on their BI to use m-learning in the 4IR era.
Congruent to the results of a study by Montrieux et al. (2014) and Siyam (2019), PEOU and PU were found to influence ATT. The results also confirmed the original TAM hypotheses (Davis et al., 1989). These results mean that rural high school STEM teachers’ feelings towards m-learning are influenced by both the effort needed to learn and being skilful in using m-learning in the 4IR era and their belief that it will improve learners’ performance. The finding is due to participants belonging to “digital immigrants” generation who struggle to use mobile devices to carry out specific tasks. The teachers in this study are under pressure to improve learners’ performance in STEM-related subjects; as a result, any tool that has the potential to improve learners’ performance positively influences their attitude towards it.
Perceived resources positively influence both PEOU and ATT. This finding echoes the findings of Hamzah and Muchlis (2018), who studied the acceptance of e-learning in Saudi Arabia. These results are not surprising considering the rural setting of the study. According to Mboweni (2014), most families in rural areas are living in poverty and rely on social grants. These results mean that for rural high school STEM teachers, the availability of resources influences their feelings towards m-learning, and the effort needed to learn to use it. One can conclude that for m-learning to be successfully implemented in rural high schools, resources need to be provided.
PSI influences PU and ATT. This finding is in line with the findings of Toe (2010), who reported that teachers are not immune from what people around them say about m-learning. These results imply that if DBE officials, parents, and learners say good things about m-
Mutambara and Bayaga, JCPMI, 10(2): 14-29
25
learning to teachers, teachers will realise its usefulness and they will have positive feelings about the use of m-learning in the 4IR era.
Research question RQ2. ATT was found to be the best predictor of teachers’ BI to use m-learning in the 4IR, followed by PR, PEOU, PSI, and then PU. These results mean that rural high school STEM teachers’ behavioural intention to use m-learning in the 4IR era is mainly influenced by their attitudes and the availability of resources. This finding is contradictory to the findings of Siyam (2019), who found that perceived usefulness is the best predictor of behavioural intention to use the system. It is interesting but not surprising to find that perceived resources predicts behavioural intention better than perceived usefulness. This result implies that in rural areas where resources are a constraint like in rural areas, the availability of resources influences users’ intention to m-learning. It can be argued that for m-learning to be successfully implemented for STEM learning in rural areas in the 4IR era, teachers need to be supplied with the m-learning resources.
5.1 Theoretical implications The current study contributes to the current body of knowledge in two ways. Firstly, the study provides empirical evidence that even though the TAM is robust and well-established theory, it still needs to be extended to develop a fully-fledged model that can explain and predict acceptance of technology in different contexts. The study showed that unlike in the original TAM, teachers’ perceived usefulness does not influence their behavioural intention to use m-learning. Perceived attitude towards mediate the relationship between behavioural intention and the exogenous variables (perceived usefulness, perceived ease of use, perceived social influence, and perceived resources). Secondly, the study supported the suggestion by Lim (2018), who recommended that the TAM should be extended by providing context-related antecedents of perceived ease of use and perceived usefulness to explain the acceptance of technology in a different context. In this study, perceived social influence and perceived resources were added. The results showed that perceived resources influenced perceived usefulness and perceived ease of use, while perceived social influence affected perceived attitude towards and perceived usefulness. 5.2 Managerial implications Based on these findings, the following suggestions can be made to the DBE. M-learning resources need to be supplied in rural areas for m-learning to be successfully implemented. The DBE should form a partnership with cellular network service providers to provide boosters to improve network connectivity and to allow some educational platforms and websites to be accessed free of charge. Additionally, teachers need thorough training on how to use m-learning for STEM teaching in the 4IR era. The DBE should provide m-learning platforms that are user-friendly and should contain as many learning materials as possible.
One limitation of this study is that it has focused on rural high school STEM teachers only; consequently, the generalisation of the findings of this study to all high school teachers both in rural areas and urban should be done with caution. It will be interesting to replicate the same study using other teachers from other departments, namely, Languages, Commerce, and Humanities and compare the results. Based on the results, the perceived attitude was the only factor that has a direct effect on behavioural intention to use m-learning in the 4IR era, and as a result, future studies should focus on how to improve teachers’ attitudes towards m-learning.
6. CONCLUSION The research was conducted to identify the determinants of rural high school STEM teachers’ behavioural intention to use m-learning in the 4IR era. The study also sought to find the ordinal strength of the predictors of rural high school STEM teachers’ behavioural
Mutambara and Bayaga, JCPMI, 10(2): 14-29
26
intention to use m-learning in the 4IR era. The structural model explained 37.9% of rural high school STEM teachers’ behavioural intention to accept m-learning in the 4IR era. Teachers’ attitudes towards the use of m-learning in the 4IR era influence their intentions to use it. Additionally, their attitude mediates the effects of perceived resources, perceived usefulness, perceived ease of use, and perceived social influence on their behavioural intention to use m-learning in the 4IR era. The ordinal strength of rural high school STEM predictors of acceptance of m-learning in the 4IR era is as follows; perceived attitude towards the use, perceived ease of use, perceived resources, perceived social influence, and perceived usefulness. The effect of perceived resources cannot go unnoticed, even though it was not having a direct effect on behavioural intention, but it has a strong indirect effect on BI. The predictive relevant (Q-squared) of PSI and PR were all greater than zero, meaning that the added constructs are important in predicting rural high school STEM teachers’ adoption of m-learning in the 4IR era in rural areas. The lessons that can be learnt from this study are:
• For m-learning to be successfully implemented in rural areas, resources need to be provided.
• Teachers’ attitudes towards m-learning in the 4IR era play a very important role in its acceptance.
• The effort needed to learn to use m-learning platforms play a more important role in its adoption than its usefulness.
• M-learning awareness programmes are needed to improve teachers’ attitudes towards which in turn influence their behavioural intention to use them in the 4IR era.
7. REFERENCES Alasmari, T. and Zhang, K., (2019). Mobile learning technology acceptance in Saudi Arabian
higher education: an extended framework and A mixed-method study’, Education and Information Technologies, 24(3), 2127-2144.
Al-dheleai, Y.M., Baki, R., Tasir, Z. and Al-rahmi, W.M., (2019). What hinders the use of ICT among academic staff at Yemen’s public universities? International Journal of Humanities and Innovation (IJHI), 2(1), 7-12.
Al-Emran, M. and Salloum, S.A., (2017). Students’ attitudes towards the use of mobile technologies in e-evaluation, International Journal of Interactive Mobile Technologies (IJIM), 11(5), 195-202.
Al-Emran, M., Elsherif, H.M. and Shaalan, K., (2016). Investigating attitudes towards the use of mobile learning in higher education, Computers in Human behavior, 56, pp.93-102.
Almaiah, M.A. and Man, M., (2016). Empirical investigation to explore factors that achieve high quality of mobile learning system based on students’ perspectives, Engineering science and technology, an international journal, 19(3), 1314-1320.
Alrajawy, I., Daud, N.M., Isaac, O. and Mutahar, A.M., (2017). Examine factors influencing the intention to use mobile learning in Yemen Public Universities, Asian Journal of Information Technology, 16(2), 287-297.
Alshmrany, S. and Wilkinson, B., (2017). Factors influencing the adoption of ICT by teachers in primary schools in Saudi Arabia, Education (Mohe), 27, 143-156.
Anderson, J.E., Schwager, P.H. and Kerns, R.L., (2006). The drivers for acceptance of tablet PCs by faculty in a college of business, Journal of Information Systems Education, 17(4), 429.
Bosman, A. and Schulze, S., (2018). Learning style preferences and Mathematics achievement of secondary school learners, South African Journal of Education, 38(1).
Mutambara and Bayaga, JCPMI, 10(2): 14-29
27
Burke, L., Francis, K. and Shanahan, M., (2014). A horizon of possibilities: a definition of STEM education, In STEM 2014 Conference, Vancouver, July (pp.12-15).
Chin, W.W., (1998). The partial least squares approach to structural equation modeling, Modern methods for business research, 295(2), 295-336.
Cohen, J., (2015). Statistical power analysis for the behavioral sciences, Hillsdale, NJ: Lawrence Earlbaum Associates; 1988. Google Scholar, pp.20-26.
Creswell, J. W. (2014). Research design: qualitative, quantitative, and mixed methods approaches, Thousand Oaks, California, USA, SAGE Publications, Inc.
Davis, F. D., Bagozzi, R. P., and Warshaw, P. R., (1989). User acceptance of computer technology: a comparison of two theoretical models, Management science, 35(8), 982-1003.
Department of Basic Education, (DoE) (2017). National Senior Certificate Diagnostic Report on Learner-Performance’ Part 1. Pretoria.
El-Deghaidy, H. and Mansour, N., (2015). Science teachers’ perceptions of STEM education: Possibilities and challenges, International Journal of Learning and Teaching, 1(1), 51-54.
Ford, M. and Botha, A. (2010). A Pragmatic Framework for Integrating ICT into Education in South Africa. In: Cunningham, P. C. A. M., ed. IST-Africa 2010 Conference Proceedings, 2010.
Grimus, M. and Ebner, M., (2016). Mobile Learning and STEM-First Experiences in a Senior High School in Ghana, In Mobile Learning and STEM: Case Studies in Practice (pp. 1-16). Routledge.
Hair, J. F., Hult, G. T. M., Ringle, C. M. and Sarstedt, M., (2017). A primer on partial least squares structural equation modeling (PLS-SEM), Sage Publications.
Hamzah, A. and Muchlis, N.F., (2018). The exploration through the factors affecting students’ adoption on m-learning technologies, In AIP Conference Proceedings (Vol. 1977, No. 1, p. 020023). AIP Publishing LLC.
Henseler, J., Hubona, G. and Ray, P. A., (2016). Using PLS path modeling in new technology research: updated guidelines, Industrial management and data systems, 116, 2-20.
Hoi, V.N., (2020). Understanding higher education learners’ acceptance and use of mobile devices for language learning: A Rasch-based path modeling approach, Computers and Education, 146, 103761.
Kayembe, C. and Nel, D., (2019). Challenges and opportunities for education in the Fourth Industrial Revolution, African Journal of Public Affairs, 11(3), 79-94.
Kim, C., Kim, M.K., Lee, C., Spector, J.M. and DeMeester, K., (2013). Teacher beliefs and technology integration’, Teaching and teacher education, 29, 76-85.
Koehler, M. J. and Mishra, P. (2016). Introducing to TPACK: Handbook of Technological Pedagogical Content Knowledge (TPACK) for Educators, New York, Routledge.
Krishnamurthi, M. and Richter, S., (2013). Promoting STEM Education through Mobile Teaching and Learning, International Association for Development of the Information Society.
Lim, C.P. and Khine, M., (2006). Managing teachers’ barriers to ICT integration in Singapore schools, Journal of technology and Teacher Education, 14(1), 97-125.
Lim, W. M., (2018). Dialectic Antidotes to Critics of the Technology Acceptance Model: Conceptual, Methodological, and Replication Treatments for Behavioural Modelling in Technology-Mediated Environments, Australasian Journal of Information Systems, 22, pp.1-10.
Mac Callum, K. and Jeffrey, L., (2014). Factors impacting teachers’ adoption of mobile learning, Journal of Information Technology Education, 13.
Makgato, M., (2007). Factors associated with poor performance of learners in mathematics and physical science in secondary schools in Soshanguve, South Africa, Africa education review, 4(1), 89-103.
Mutambara and Bayaga, JCPMI, 10(2): 14-29
28
Makgato, M., (2019). STEM for Sustainable Skills for the Fourth Industrial Revolution: Snapshot at Some TVET Colleges in South Africa, In Theorizing STEM Education in the 21st Century. IntechOpen.
Mboweni, L. (2014). Challenges and factors contributing to learner absenteeism in selected primary schools in Acornhoek. Master of Education, University of South Africa.
Montrieux, H., Courtois, C., De Grove, F., Raes, A., Schellens, T. and De Marez, L., (2014). Mobile learning in secondary education: Teachers’ and students’ perceptions and acceptance of tablet computers, International Journal of Mobile and Blended Learning (IJMBL), 6(2), 26-40.
Mupira, P. and Ramnarain, U., (2018). The effect of inquiry‐based learning on the
achievement goal‐orientation of grade 10 physical sciences learners at township schools in South Africa, Journal of Research in Science Teaching, 55(6), 810-825.
Nikou, S.A. and Economides, A.A., (2018). Mobile‐Based micro‐Learning and Assessment: Impact on learning performance and motivation of high school students, Journal of Computer Assisted Learning, 34(3), 269-278.
Nikou, S.A., and Economides, A.A., (2019). Factors that influence behavioral intention to use
mobile‐based assessment: A STEM teachers’ perspective, British Journal of Educational Technology, 50(2), 587-600.
Nunnally, J. (1978). Psychometric theory, New York, McGraw-Hill. Osakwe, J.O., Nomusa, D. and Jere, N., (2017). Teacher and Learner Perceptions on Mobile
Learning Technology: A Case of Namibian High Schools from the Hardap Region, Online Submission, 1(1), 13-41.
Pinker, S., (1997). How the Mind Works, New York, W. W. Nortan. Ritz, J.M. and Fan, S.C., (2015). STEM and technology education: International state-of-the-
art, International Journal of Technology and Design Education, 25(4), 429-451. Sánchez-Prieto, J.C., Hernández-García, Á., García-Peñalvo, F.J., Chaparro-Peláez, J. and
Olmos-Migueláñez, S., (2019). Break the walls! Second-Order barriers and the acceptance of mLearning by first-year pre-service teachers, Computers in Human Behavior, 95, 158-167.
Schwab, K., (2016). The Fourth Industrial Revolution: what it means, how to respond. In World economic forum, Crown Business.
Sekiyama, T., (2020). The Impact of the Fourth Industrial Revolution on Student Mobility from the Perspective of Education Economics. Creative Education, 11(04), 435.
Siegel, D. M. (2008). Accepting Technology and Overcoming Resistance to Change Using the Motivation and Acceptance Model, Doctor of Philosophy, University of Central Florida.
Sivo, S.A., Ku, C.H. and Acharya, P., (2018). Understanding how university student perceptions of resources affect technology acceptance in online learning courses, Australasian Journal of Educational Technology, 34(4).
Siyam, N., (2019). Factors impacting special education teachers’ acceptance and actual use of technology, Education and Information Technologies, 24(3), 2035-2057.
Teo, T. S. H., Srivastava, S. C. and Jiang, L. (2008). Trust and electronic government success: an empirical stud’, Journal of Management Information Systems, 25, 99–132.
Teo, T., (2010). Examining the influence of subjective norm and facilitating conditions on the intention to use technology among pre-service teachers: a structural equation modeling of an extended technology acceptance model, Asia Pacific Education Review, 11(2), 253-262.
Tomei, L.A. ed., (2008). Encyclopedia of information technology curriculum integration, IGI Global.
Venkatesh, V. and Davis, F.D., (2000). A theoretical extension of the technology acceptance model: Four longitudinal field studies, Management science, 46(2), 186-204.

Mutambara and Bayaga, JCPMI, 10(2): 14-29
29
Venkatesh, V., Morris, M. G., Davis, G., B and Davis, F. D., (2003). User Acceptance of Information Technology: Towards a Unified View. MIS Quarterly 27, 425 -478.
Visser, M., Juan, A. and Feza, N., (2015). Home and school resources as predictors of mathematics performance in South Africa, South African Journal of Education, 35(1).
Waheed, M. and Jam, F.A., (2010). Teacher’s intention to accept online education: Extended TAM model, Interdisciplinary Journal of Contemporary Research in Business, 2(5), 330-344.
Yeap, J.A., Ramayah, T. and Soto-Acosta, P., (2016). Factors propelling the adoption of m-learning among students in higher education, Electronic Markets, 26(4), 323-338.
Yusuf, B., Walters, L.M. and Sailin, S.N., (2020). Restructuring Educational Institutions for Growth in the Fourth Industrial Revolution (4IR): A Systematic Review, International Journal of Emerging Technologies in Learning (iJET), 15(03), 93-109.
Journal of Construction Project Management and Innovation, 10 (2): 30-50, 2020
ISSN 2223-7852 © Sustainable Human Settlement and Construction Research Centre DOI: https://doi.org/10.36615/jcpmi.v10i2.405
30
TRANSFORMING SOUTH AFRICA’S UNIVERSITIES OF TECHNOLOGY: A ROADMAP THROUGH 4IR
LENSES
Muthoni MASINDE1* and Peter A. ROUX2
1*Department of Information Technology, Central University of Technology, Free State, South Africa
2UFS Business School, University of the Free State, South Africa
Email: [email protected]*; [email protected]
ABSTRACT Since their birth in the 6th century, universities have undergone different forms of transformations, especially of structural, ideological, and epistemological nature. Recently, the emergence of the fourth industrial revolution (4IR) has triggered a wave of such transformations and just like other industrial revolutions, university management ought to be cautious as such transformations could exacerbate existing inequalities between the rich and the poor students. To this end, a clear roadmap for such a transformation becomes critical. This is the contribution of this paper. We achieve this through a bibliometric analysis of the state of scientific research into the ‘university transformation’ topic, with a special focus on South Africa’s (RSA) context. The content of the identified scientific publications on RSA was further subjected to thematic analysis leading to the revelation that decolonisation, community engagement and structural transformation, are the main research themes. It also emerges that RSA universities have not embraced 4IR as a lens through which to pursue transformation. On the other hand, the RSA government launched the project: “Transformation at Public Universities” during the 2017/18 planning year. Subsequently, all universities in the country adopted and rolled out a customised transformation agenda. Among these universities, are the six universities of technology (UoTs), which, for historical reasons, the transformation project presents unique challenges and opportunities. Created slightly after the millennium, UoTs are still seen as critical role players in the third mission of universities, that of “achieving economic growth and social progress”. These findings, as wells as the existence of systemic exclusion, marginalisation, and discrimination (especially along racial lines) in RSA universities, defines our proposed roadmap. Using one of the UoTs and Massive Open Online Courses (MOOCs) as the reference, the proposed university transformation roadmap is supported by empirical data on the assessment of the readiness of students to adopt 4IR technologies.
Keywords: Fourth industrial revolution (4IR), universities of technology (UoTs), Massive Open Online Courses (MOOCs), university transformation, university transformation
1. INTRODUCTION Institutional transformation can be described as the transition from one state to another through a process of undergoing changes to the structure, nature and appearance (Preez, Simmonds, and Campus, 2016) of the concerned institution. The transformation process is, therefore, highly complex and is influenced by both internal and external factors. Unique history such as apartheid, coupled with peculiar realities such as institutionalised inequality (SACHR, 2018; Soudien-Report, 2008), makes transformation of South Africa’s higher
Masinde and Roux JCPMI, 10(2): 30-50
31
education (HE) sector an extremely attractive research topic as well as fodder for many policy debates. This could explain the existence of a generous number of scientific publications and government reports on this topic. Some of these reports are described in (Luvalo, 2019; Preez et al., 2016). Several research publications under this topic are also analysed in the current paper. The key elements of transforming HE institutions converge to structural discourses, ideological shifts, curriculum change and overhauling of both the institutional management and organisational culture. Apart from the two (that is, motivation to expand higher education and to increase participation) globally accepted drivers for HE transformation, other unique phrases associated with South Africa’s HE transformation are (1) affirmative action to ensure wider access to black African students; and (2) Africanisation and decolonisation of the curriculum (Luvalo, 2019).
The uniqueness of the HE transformation agenda in South Africa is to be found in the alarming levels of inequality, especially along racial lines. On this, South Africa has consistently held the first position (Barr, 2017) as the most unequal country in the world – sometimes interchanging the position with war-torn countries such as the Central Africa Republic. In the most recent (2019) World Bank and United Nations Development index for inequality, South Africa scored the highest Gini index value of 63.38% and a starkest Palma ratio value of 71.4% respectively (United Nations Development Programme, 2019). It should therefore not be surprising that the phrase; “a country of three-nations” has been used to describe South Africa (Bond, 2007). South Africa’s Higher Education sector has not been spared by these alarming levels of inequality. This is a matter of grave concern as captured in the phrase below(SACHR, 2018): “More than 20 years into the country’s democracy, South Africa continues to face deeply entrenched inequalities in all spheres of our society, including our public universities. Despite notable progress made in addressing historical inequalities in public universities, patterns of systemic exclusion, marginalisation and discrimination persist.”
In the same report, fifteen reasons for lack of (or slow) transformation are addressed. Top of the list of the reasons is: “the lack of a uniform understanding of what transformation means”. For this, the following contextualised (to the public universities) definition is provided in (SACHR, 2018). “...a transformed system of higher education is one that is free from all forms of unfair discrimination (whether direct or indirect) and artificial barriers to access and success, as well as one that is built on the principles of social inclusivity, mutual respect and acceptance.”. Three pillars of HE transformation have been identified as (1) policy and compliance, (2) epistemological, and (3) institutional culture. Of focus to this paper is the epistemological pillar which entails interrogation of both the sources of knowledge as well as how it is passed to the student (Luvalo, 2019). For these, it is the thesis of this paper that the technologies associated with 4IR can be used to remove artificial barriers to access and success of university students in South Africa.
The fourth industrial revolution (also known as Industry 4.0 or 4IR) has become a reality to reckon with (Sackey, and Bester, 2016) – it had matured faster than it was forecasted just over three years ago when it was said: “To be sure, the Fourth Industrial Revolution is still in its nascent state. But with the pace of change and disruption to business and society so swift these days, the time to join in is now.” (World Economic Forum, 2018). There is evidence that 4IR can indeed influence not just the curriculum, but all aspects of HE, including vision, policy, planning and implementation of strategies such as change management and research sharing (ISOCARP, 2018). The world is witnessing re-alignments of all kinds - all aimed at embracing the unstoppable 4IR. Like other socio- economic sectors, South Africa’s higher education sector will not be spared by the aftermath of the 4IR (Sackey and Bester, 2016). So dramatic will be the revolution that it will outwash the 19th-century revolution in which the research university evolved. This revolution will also be much more complex than the scope and diversity-based revolution of the past half-century(Altbach, Reisberg, and Rumbley, 2009).
Masinde and Roux JCPMI, 10(2): 30-50
32
The issue of transforming public universities in South Africa is a national agenda by the government. To this end, all universities in the country have taken up the recommendations in the South African Human Rights Commission report on “Transforming Public Universities” (SACHR, 2018) and instituted university-level transformation agenda. Of importance to the work presented in this paper is the categorisation of South African universities into three: the traditional universities, comprehensive universities and universities of technology(UoTs) (Bunting and Cloete, 2010). The UoTs present unique opportunities and challenges in the face of transformation. For instance, more than 90% of UoTs students are black, two, the UoTs are just over ten years old, and three, they have limited resources (Mtshali and Sooryamoorthy, 2018). In this paper, we use one of the UoTs as a reference in developing a blueprint on how UoTs’ top management can leverage 4IR to ensure implementation and success of the transformation agenda.
The Central University of Technology, Free state (CUT), has not been left behind in the inevitable race for/towards 4IR. CUT adopted the leadership slogan: “Reimagining CUT” at the end of 2016(CUT, 2016). During that year, the implementation punchline for the slogan was coined as “Reimagining CUT: The Year of Innovation and Entrepreneurship”, the 2017 one was, “Reimagining CUT: The Year of the Human Project” while the 2018 one was: “Reimagining CUT: Embracing Servant Leadership”. This is all in line with CUT’s special project dubbed “Reimagining CUT as a transformative University and ‘model’ UoT in Africa, impacting on the socio-economic development of the Central region of South Africa and beyond”. The rationale for the project is anchored within the national initiative under the theme: “Transformation at Public Universities in South Africa” (SACHR, 2018). In the case of CUT, the Transformation Project is a university-wide drive towards new institutionalism (change), consisting of ten focus areas. One of these states: “Reimagining CUT as a transformative University.” A look at similar transformation projects from other UoTs reveal a similar pattern; frameworks aimed transforming at all aspects of universities. These are, teaching and learning, research, engagement, governance and leadership, language, institutional culture, student life and administration support.
This paper provides details on how CUT can leverage 4IR to accelerate the transformation agenda; this is done through the sub-them: “Reimagining CUT through 4IR lens”. It is worth noting that CUT has already made some strides towards embracing 4IR. The first one is CUT’s stakeholders’ sensitisation on 4IR as well as the creation of a research centre focusing on 4IR - the Centre for Sustainable Smart Cities 4.0. This points to awareness and commitment by CUT towards leveraging the 4IR in its current and future agenda. It is on this basis that the research objective of developing a roadmap for the adoption of 4IR in CUT’s transformation agenda is proposed. In this context, CUT is used as the case study that represents other South African universities of technology (UoTs). This objective is pursued through the following research questions:
a) What are the main themes that define the current research into higher education
institutions’ transformation in South Africa, and to what extent are they incorporating the 4IR theme?
b) To what extent are students at the South African universities of technology ready for 4IR-driven curriculum transformation?
Masinde and Roux JCPMI, 10(2): 30-50
33
2. LITERATURE REVIEW 2.1 The 4th industrial revolution (4IR) – the basics The term Industry 4.0 was first published in Germany in 2011 – it was associated with an economic development proposal based on high-tech strategy (Mosconi, 2015). Subsequently,
this launched the fourth industrial revolution (Roblek, Meško, and Krapež, 2016). In Sackey and Bester (2016) various aspects of the definition of 4IR are presented, one of these definitions reads as follows: “a collective term for technologies and concepts of value chain organisation which draws together Cyber-Physical Systems, the Internet of Things, and the Internet of Services.”
The duo (Suckey and Bester, 2016) also diagrammatically presented eight value drivers and 24 dependent industry levers in 4IR. Some of the distinct functional features of 4IR include modularised flexibility, interoperability, and virtualisation. The first industrial revolution was based on steam and water power; it emerged from Newton’s law of motion which enabled comprehension and quantification of motion (Xing and Marwala, 2018). The ‘revolution’ here was in the mechanisation of many manual events that were carried out by humans. The second industrial revolution was ushered by the unification of magnetic and electric forces (hence generation of electricity and the emergence of the electric motor); this was the work of Faraday and Maxwell. This led to revolutionised operations on the assembly lines. Finally, the discovery of a transistor ushered in the third industrial revolution which formed the precursor for the centre stage of the widely known electronic/digital age driven by computers and the internet (Kelly, 1998). The first three industrial revolutions were thus characterised by advances in technology. To a large extent, all the first three industrial revolutions enabled the mechanical work done by human beings to be done by machines, thus freeing humans to do the work that required cognitive capability that machines lacked (Bloem et al., 2014).
On the other hand, the fourth industrial revolution, or industry 4.0 or 4IR, is different from the first three in two major ways: firstly, it represents the combination of cyber-physical systems, the Internet of Things, and the Internet of Systems. This gives rise to the idea of, for instance, smart factories in which machines are augmented with web connectivity and connected to a system that can visualise the entire production chain and make decisions on its own. Secondly, the technologies that underpin 4IR are no longer restricted to mechanical work, as they are capable of cognitive processing just like humans. Xing and Marwala (2018) present three hallmarks of 4IR as (1) Digitisation and integration of vertical and horizontal process across the entire organisation’s operations also referred to as the shift from centralised to the decentralisation of production; (2) Digitisation of products and services that entails the application of artificial intelligence to ensure self-regulated production (e.g. only on demand); and (3) Disruptive business models and customer access – this allows customers to influence the production to suit their needs. Examples here include ‘on-site production’ and ‘customer engineering’.
Klaus Schwab, the CEO of the World Economic Forum, once stated; “… in this fourth revolution, we are facing a range of new technologies that combine the physical, digital and biological worlds. These new technologies will impact all disciplines, economies and industries, and even challenge our ideas about what it means to be human” (World Economic Forum, 2018). The potential for economic benefits from 4IR is becoming clearer as more organisations embrace the technologies underpinning it. The only concern is the resistance or/and unwillingness to adapt to these new technologies by some organisations and/or the risk that governments could fail to employ/regulate these technologies. Further, the shifting power created by 4IR may create important new security concerns, and that inequalities could grow rather than shrink if things are not managed properly (Schwab, 2016). The estimate by McKinsey is that as many as 47 per cents of jobs in the United States of America, are at risk from automation (Bughin, LaBerge, and Melbye, 2017). The 4IR is likely to benefit the rich more than the
Masinde and Roux JCPMI, 10(2): 30-50
34
poor, especially as low-skill, low-wage jobs disappear in favour of automation. This is in line with the other three industrial revolutions – they began with greater inequality, followed by periods of political and institutional change. Given the pronounced inequalities in the South African HE sector, (South African Human Rights Commission, 2016) this could imply that the current political, business, and social structures are not ready or capable of absorbing all the changes the 4IR will bring (Sackey, S. and Bester, 2016) and that major changes to the very structure of our society are inevitable. In connection with such changes, it is said (Schwab, 2016): “The changes are so profound that, from the perspective of human history, there has never been a time of greater promise or potential peril. My concern, however, is that decision-makers are too often caught in traditional, linear (and non-disruptive) thinking or too absorbed by immediate concerns to think strategically about the forces of disruption and innovation shaping our future.”
2.2 Higher Education in the Fourth Industrial Revolution (HE 4.0) 2.2.1 Evolving Role of HE “The central mission of higher education is the creation of prepared minds. The prepared minds contribute to the scientific, technological, economic and social development of a nation and world in general. The prepared minds innovate, create new businesses and more jobs as responsible citizens. As new innovations happen, Universities create new programmes and even new schools to focus on developing new mind-sets” (Srinivasa et al., 2013). The history of higher education (HE) can be traced back in the 6th century’s elite system that started at the monastic schools and then evolved into the medieval European University. A phenomenal change though came with ‘massification’ of higher education in the 20th century. In the post- massification era, internationalisation (of both staff and students) and adaptation to social and technological changes are the key trends in the HE (Goodchild and Wechsler, 1997). In (Adams Becker, Cummins, Davis, and A., 2017), the big picture themes that define current and future HE is presented as (1)Advancing progressive learning approaches requires cultural transformation; (2) Real-world skills are needed to bolster employability and workplace development; (3) Collaboration is key for scaling effective solutions; (4) Despite the proliferation of technology and online learning materials, access is still unequal; (5) Processes for assessing nuanced skills at a personal level are needed; (6) Fluency in the digital realm is more than just understanding how to use technology; (7) Online, mobile, and blended learning are foregone conclusions; (8) Learning ecosystems must be agile enough to support the practices of the future; (9) Higher education is an incubator for developing more intuitive computers and (10) Lifelong learning is the lifeblood of higher education.
It is the thesis of this paper that 4IR can be intertwined in all these ten themes and help in improving, supporting, or extending teaching, learning, and creative inquiry within the HE’s main roles of teaching, research and service to the community/society.
2.2.2 Current and future trends in HE Adam Becker et al. (2017) summarise the most prominent HE current and future trends under six categories: (1) Expanding access and convenience that enables ubiquitous learning and working from anywhere, anytime using anything; (2)Spurring of innovation and remaining ‘North Star’ that leads societies to the future; (3)Fostering authentic learning that entails richer and more hands-on, real-world experiences through project/challenge/competency-based learning pedagogies; (4) Tracking and evaluating evidence by ensuring capturing of a bevy of programmatic data. This enables not only performance monitoring but engagement, and behaviour as well; (5) Improving the teaching profession to cope with changing student type – the latter are more informed and highly (globally) connected. The teaching profession now changes from “sage on the stage” to “guide on the side”; and (6) Spreading digital fluency by ensuring that the proliferated digital devices are integrated into the learning process in meaningful ways. By embracing 4IR, university
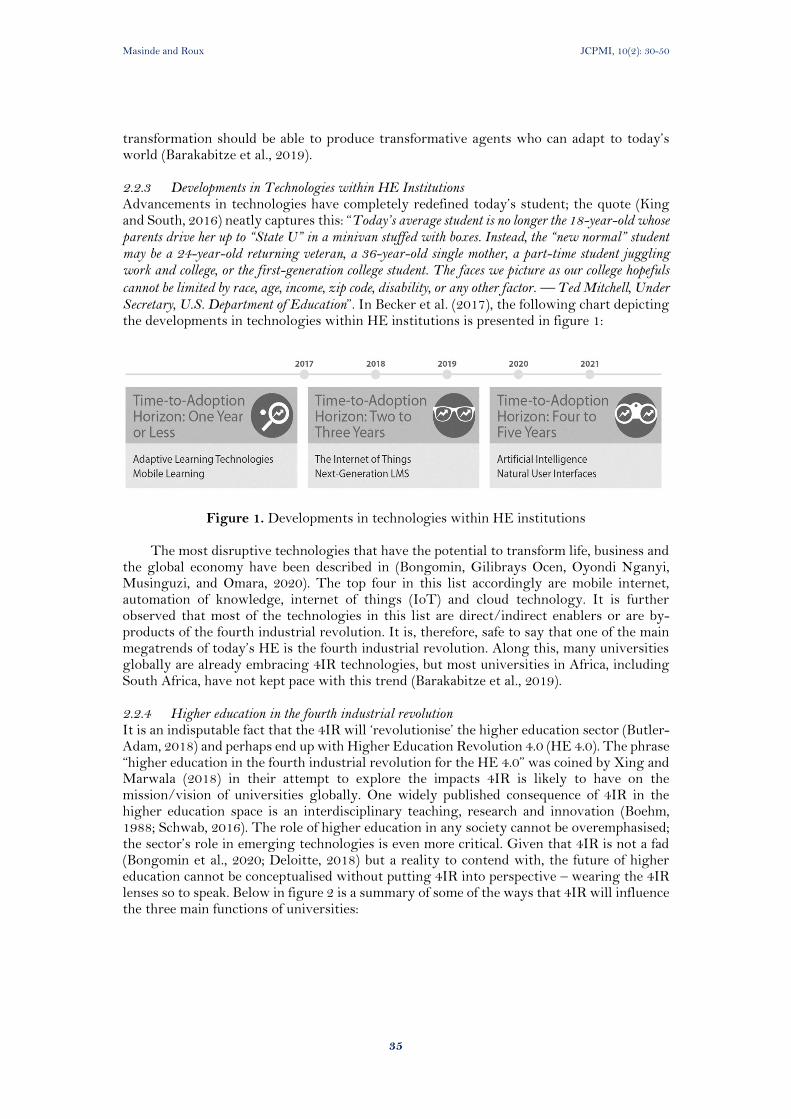
Masinde and Roux JCPMI, 10(2): 30-50
35
transformation should be able to produce transformative agents who can adapt to today’s world (Barakabitze et al., 2019). 2.2.3 Developments in Technologies within HE Institutions Advancements in technologies have completely redefined today’s student; the quote (King and South, 2016) neatly captures this: “Today’s average student is no longer the 18-year-old whose parents drive her up to “State U” in a minivan stuffed with boxes. Instead, the “new normal” student may be a 24-year-old returning veteran, a 36-year-old single mother, a part-time student juggling work and college, or the first-generation college student. The faces we picture as our college hopefuls
cannot be limited by race, age, income, zip code, disability, or any other factor. — Ted Mitchell, Under Secretary, U.S. Department of Education”. In Becker et al. (2017), the following chart depicting the developments in technologies within HE institutions is presented in figure 1:
Figure 1. Developments in technologies within HE institutions
The most disruptive technologies that have the potential to transform life, business and
the global economy have been described in (Bongomin, Gilibrays Ocen, Oyondi Nganyi, Musinguzi, and Omara, 2020). The top four in this list accordingly are mobile internet, automation of knowledge, internet of things (IoT) and cloud technology. It is further observed that most of the technologies in this list are direct/indirect enablers or are by-products of the fourth industrial revolution. It is, therefore, safe to say that one of the main megatrends of today’s HE is the fourth industrial revolution. Along this, many universities globally are already embracing 4IR technologies, but most universities in Africa, including South Africa, have not kept pace with this trend (Barakabitze et al., 2019).
2.2.4 Higher education in the fourth industrial revolution It is an indisputable fact that the 4IR will ‘revolutionise’ the higher education sector (Butler-Adam, 2018) and perhaps end up with Higher Education Revolution 4.0 (HE 4.0). The phrase “higher education in the fourth industrial revolution for the HE 4.0” was coined by Xing and Marwala (2018) in their attempt to explore the impacts 4IR is likely to have on the mission/vision of universities globally. One widely published consequence of 4IR in the higher education space is an interdisciplinary teaching, research and innovation (Boehm, 1988; Schwab, 2016). The role of higher education in any society cannot be overemphasised; the sector’s role in emerging technologies is even more critical. Given that 4IR is not a fad (Bongomin et al., 2020; Deloitte, 2018) but a reality to contend with, the future of higher education cannot be conceptualised without putting 4IR into perspective – wearing the 4IR lenses so to speak. Below in figure 2 is a summary of some of the ways that 4IR will influence the three main functions of universities:
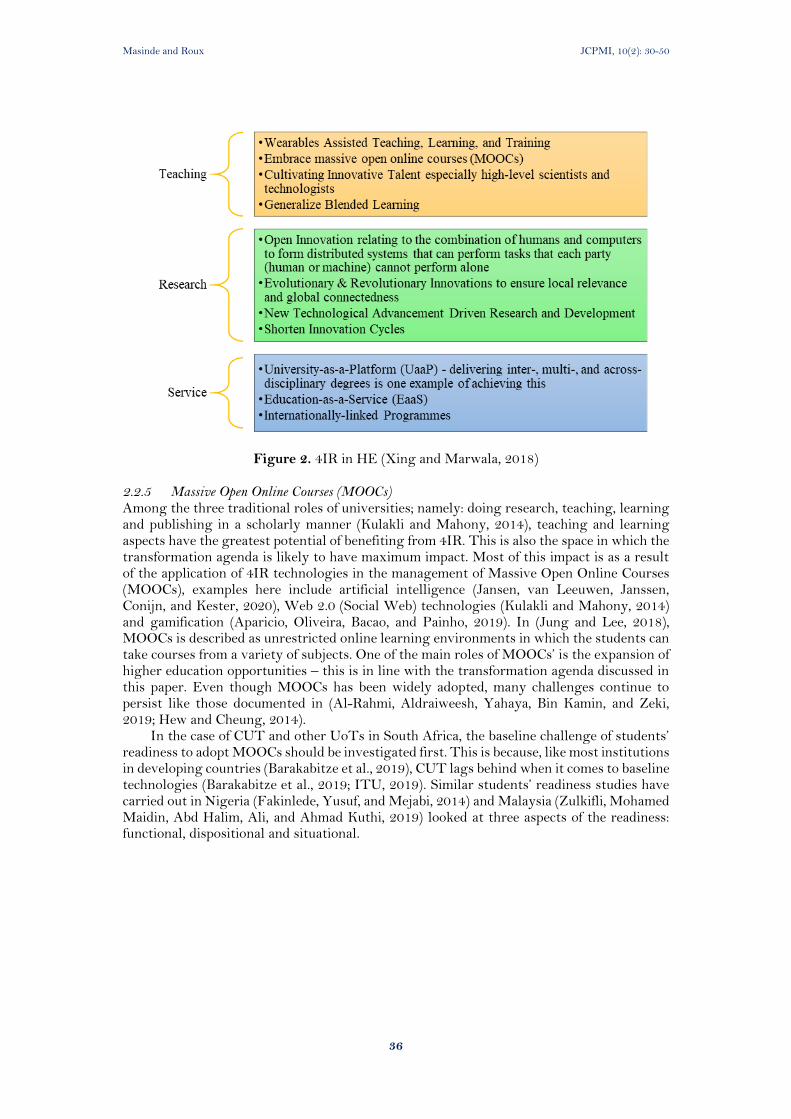
Masinde and Roux JCPMI, 10(2): 30-50
36
Figure 2. 4IR in HE (Xing and Marwala, 2018) 2.2.5 Massive Open Online Courses (MOOCs) Among the three traditional roles of universities; namely: doing research, teaching, learning and publishing in a scholarly manner (Kulakli and Mahony, 2014), teaching and learning aspects have the greatest potential of benefiting from 4IR. This is also the space in which the transformation agenda is likely to have maximum impact. Most of this impact is as a result of the application of 4IR technologies in the management of Massive Open Online Courses (MOOCs), examples here include artificial intelligence (Jansen, van Leeuwen, Janssen, Conijn, and Kester, 2020), Web 2.0 (Social Web) technologies (Kulakli and Mahony, 2014) and gamification (Aparicio, Oliveira, Bacao, and Painho, 2019). In (Jung and Lee, 2018), MOOCs is described as unrestricted online learning environments in which the students can take courses from a variety of subjects. One of the main roles of MOOCs’ is the expansion of higher education opportunities – this is in line with the transformation agenda discussed in this paper. Even though MOOCs has been widely adopted, many challenges continue to persist like those documented in (Al-Rahmi, Aldraiweesh, Yahaya, Bin Kamin, and Zeki, 2019; Hew and Cheung, 2014).
In the case of CUT and other UoTs in South Africa, the baseline challenge of students’ readiness to adopt MOOCs should be investigated first. This is because, like most institutions in developing countries (Barakabitze et al., 2019), CUT lags behind when it comes to baseline technologies (Barakabitze et al., 2019; ITU, 2019). Similar students’ readiness studies have carried out in Nigeria (Fakinlede, Yusuf, and Mejabi, 2014) and Malaysia (Zulkifli, Mohamed Maidin, Abd Halim, Ali, and Ahmad Kuthi, 2019) looked at three aspects of the readiness: functional, dispositional and situational.
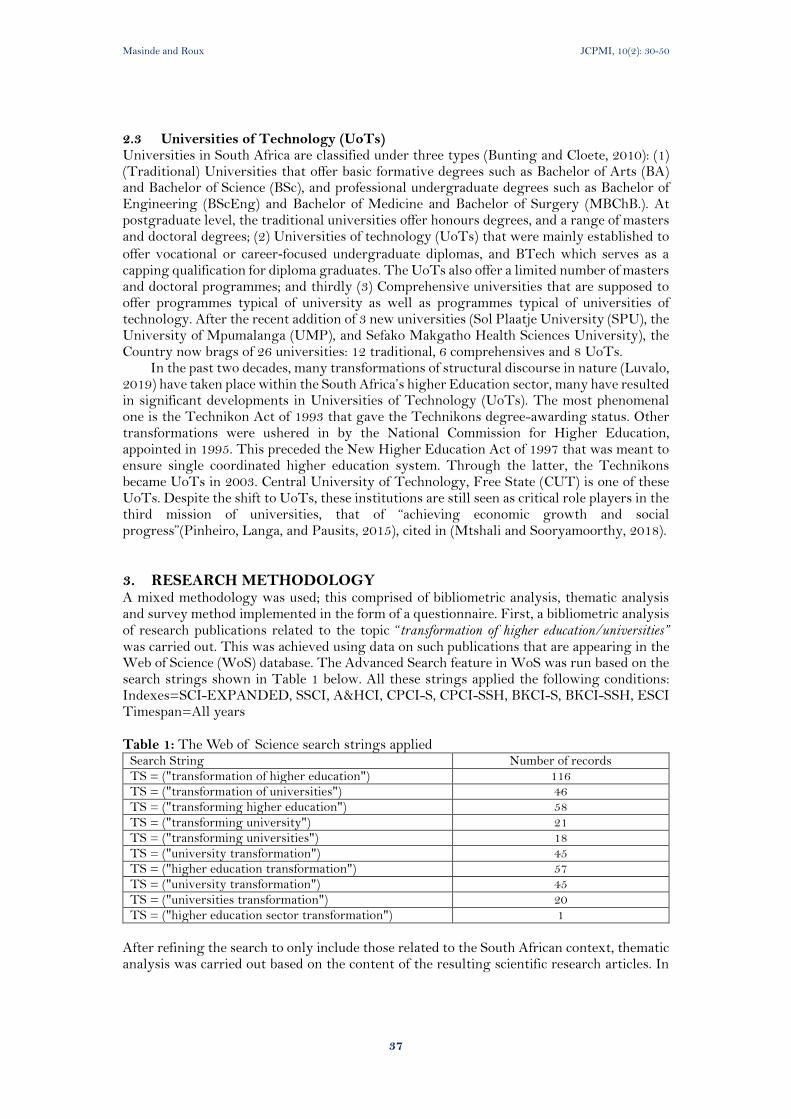
Masinde and Roux JCPMI, 10(2): 30-50
37
2.3 Universities of Technology (UoTs) Universities in South Africa are classified under three types (Bunting and Cloete, 2010): (1) (Traditional) Universities that offer basic formative degrees such as Bachelor of Arts (BA) and Bachelor of Science (BSc), and professional undergraduate degrees such as Bachelor of Engineering (BScEng) and Bachelor of Medicine and Bachelor of Surgery (MBChB.). At postgraduate level, the traditional universities offer honours degrees, and a range of masters and doctoral degrees; (2) Universities of technology (UoTs) that were mainly established to
offer vocational or career‐focused undergraduate diplomas, and BTech which serves as a capping qualification for diploma graduates. The UoTs also offer a limited number of masters and doctoral programmes; and thirdly (3) Comprehensive universities that are supposed to offer programmes typical of university as well as programmes typical of universities of technology. After the recent addition of 3 new universities (Sol Plaatje University (SPU), the University of Mpumalanga (UMP), and Sefako Makgatho Health Sciences University), the Country now brags of 26 universities: 12 traditional, 6 comprehensives and 8 UoTs.
In the past two decades, many transformations of structural discourse in nature (Luvalo, 2019) have taken place within the South Africa’s higher Education sector, many have resulted in significant developments in Universities of Technology (UoTs). The most phenomenal one is the Technikon Act of 1993 that gave the Technikons degree-awarding status. Other transformations were ushered in by the National Commission for Higher Education, appointed in 1995. This preceded the New Higher Education Act of 1997 that was meant to ensure single coordinated higher education system. Through the latter, the Technikons became UoTs in 2003. Central University of Technology, Free State (CUT) is one of these UoTs. Despite the shift to UoTs, these institutions are still seen as critical role players in the third mission of universities, that of “achieving economic growth and social progress”(Pinheiro, Langa, and Pausits, 2015), cited in (Mtshali and Sooryamoorthy, 2018).
3. RESEARCH METHODOLOGY A mixed methodology was used; this comprised of bibliometric analysis, thematic analysis and survey method implemented in the form of a questionnaire. First, a bibliometric analysis of research publications related to the topic “transformation of higher education/universities” was carried out. This was achieved using data on such publications that are appearing in the Web of Science (WoS) database. The Advanced Search feature in WoS was run based on the search strings shown in Table 1 below. All these strings applied the following conditions: Indexes=SCI-EXPANDED, SSCI, A&HCI, CPCI-S, CPCI-SSH, BKCI-S, BKCI-SSH, ESCI Timespan=All years Table 1: The Web of Science search strings applied
Search String Number of records TS = ("transformation of higher education") 116 TS = ("transformation of universities") 46 TS = ("transforming higher education") 58 TS = ("transforming university") 21 TS = ("transforming universities") 18 TS = ("university transformation") 45 TS = ("higher education transformation") 57 TS = ("university transformation") 45 TS = ("universities transformation") 20 TS = ("higher education sector transformation") 1
After refining the search to only include those related to the South African context, thematic analysis was carried out based on the content of the resulting scientific research articles. In
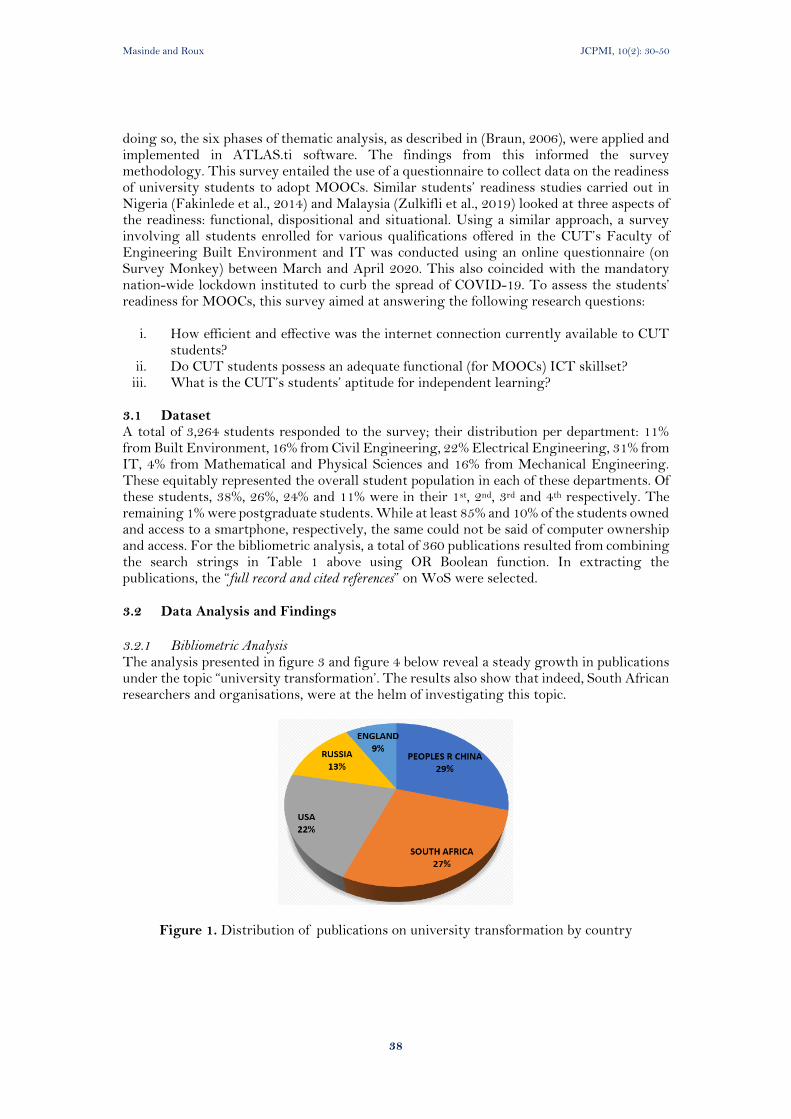
Masinde and Roux JCPMI, 10(2): 30-50
38
doing so, the six phases of thematic analysis, as described in (Braun, 2006), were applied and implemented in ATLAS.ti software. The findings from this informed the survey methodology. This survey entailed the use of a questionnaire to collect data on the readiness of university students to adopt MOOCs. Similar students’ readiness studies carried out in Nigeria (Fakinlede et al., 2014) and Malaysia (Zulkifli et al., 2019) looked at three aspects of the readiness: functional, dispositional and situational. Using a similar approach, a survey involving all students enrolled for various qualifications offered in the CUT’s Faculty of Engineering Built Environment and IT was conducted using an online questionnaire (on Survey Monkey) between March and April 2020. This also coincided with the mandatory nation-wide lockdown instituted to curb the spread of COVID-19. To assess the students’ readiness for MOOCs, this survey aimed at answering the following research questions:
i. How efficient and effective was the internet connection currently available to CUT students?
ii. Do CUT students possess an adequate functional (for MOOCs) ICT skillset? iii. What is the CUT’s students’ aptitude for independent learning?
3.1 Dataset A total of 3,264 students responded to the survey; their distribution per department: 11% from Built Environment, 16% from Civil Engineering, 22% Electrical Engineering, 31% from IT, 4% from Mathematical and Physical Sciences and 16% from Mechanical Engineering. These equitably represented the overall student population in each of these departments. Of these students, 38%, 26%, 24% and 11% were in their 1st, 2nd, 3rd and 4th respectively. The remaining 1% were postgraduate students. While at least 85% and 10% of the students owned and access to a smartphone, respectively, the same could not be said of computer ownership and access. For the bibliometric analysis, a total of 360 publications resulted from combining the search strings in Table 1 above using OR Boolean function. In extracting the publications, the “full record and cited references” on WoS were selected. 3.2 Data Analysis and Findings
3.2.1 Bibliometric Analysis The analysis presented in figure 3 and figure 4 below reveal a steady growth in publications under the topic “university transformation’. The results also show that indeed, South African researchers and organisations, were at the helm of investigating this topic.
Figure 1. Distribution of publications on university transformation by country
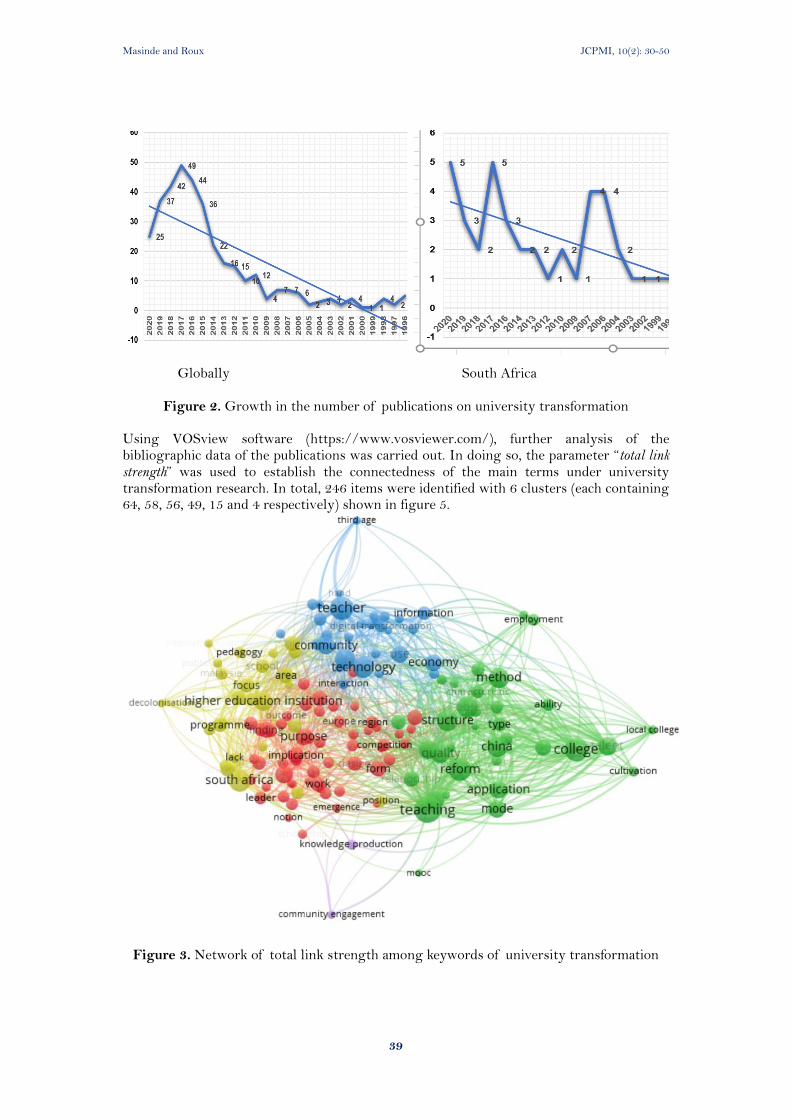
Masinde and Roux JCPMI, 10(2): 30-50
39
Globally South Africa
Figure 2. Growth in the number of publications on university transformation Using VOSview software (https://www.vosviewer.com/), further analysis of the bibliographic data of the publications was carried out. In doing so, the parameter “total link strength” was used to establish the connectedness of the main terms under university transformation research. In total, 246 items were identified with 6 clusters (each containing 64, 58, 56, 49, 15 and 4 respectively) shown in figure 5.
Figure 3. Network of total link strength among keywords of university transformation
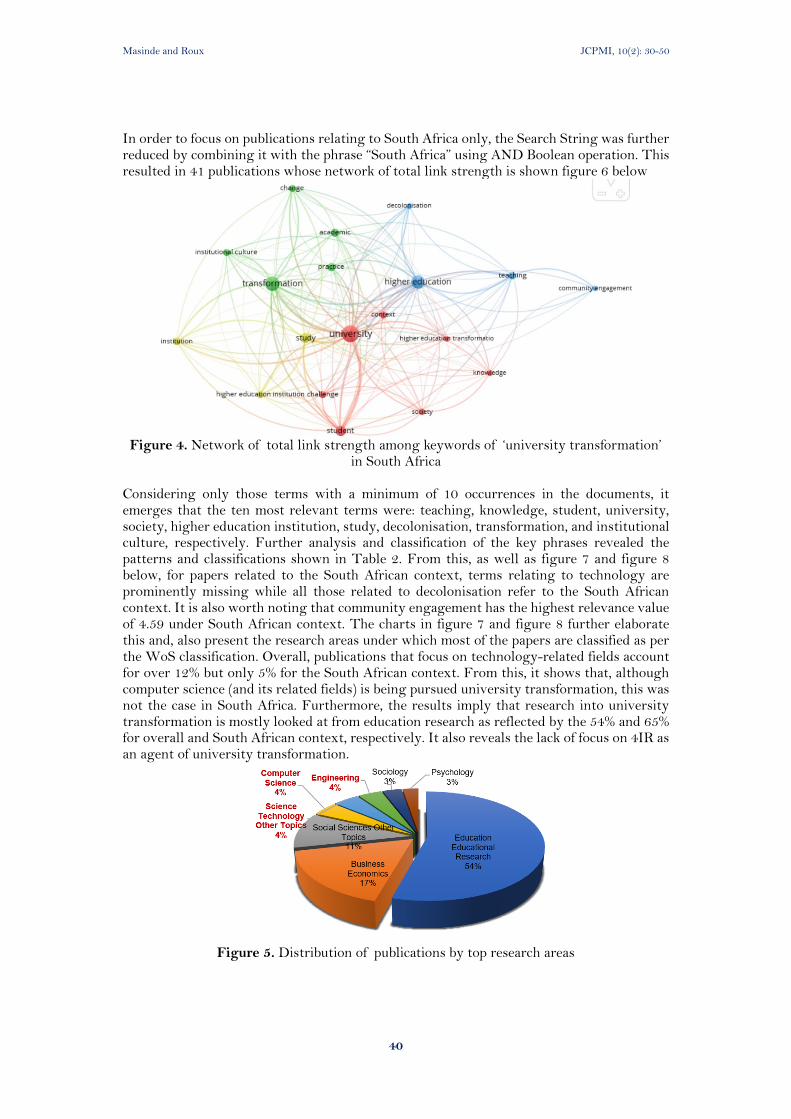
Masinde and Roux JCPMI, 10(2): 30-50
40
In order to focus on publications relating to South Africa only, the Search String was further reduced by combining it with the phrase “South Africa” using AND Boolean operation. This resulted in 41 publications whose network of total link strength is shown figure 6 below
Figure 4. Network of total link strength among keywords of ‘university transformation’
in South Africa Considering only those terms with a minimum of 10 occurrences in the documents, it emerges that the ten most relevant terms were: teaching, knowledge, student, university, society, higher education institution, study, decolonisation, transformation, and institutional culture, respectively. Further analysis and classification of the key phrases revealed the patterns and classifications shown in Table 2. From this, as well as figure 7 and figure 8 below, for papers related to the South African context, terms relating to technology are prominently missing while all those related to decolonisation refer to the South African context. It is also worth noting that community engagement has the highest relevance value of 4.59 under South African context. The charts in figure 7 and figure 8 further elaborate this and, also present the research areas under which most of the papers are classified as per the WoS classification. Overall, publications that focus on technology-related fields account for over 12% but only 5% for the South African context. From this, it shows that, although computer science (and its related fields) is being pursued university transformation, this was not the case in South Africa. Furthermore, the results imply that research into university transformation is mostly looked at from education research as reflected by the 54% and 65% for overall and South African context, respectively. It also reveals the lack of focus on 4IR as an agent of university transformation.
Figure 5. Distribution of publications by top research areas
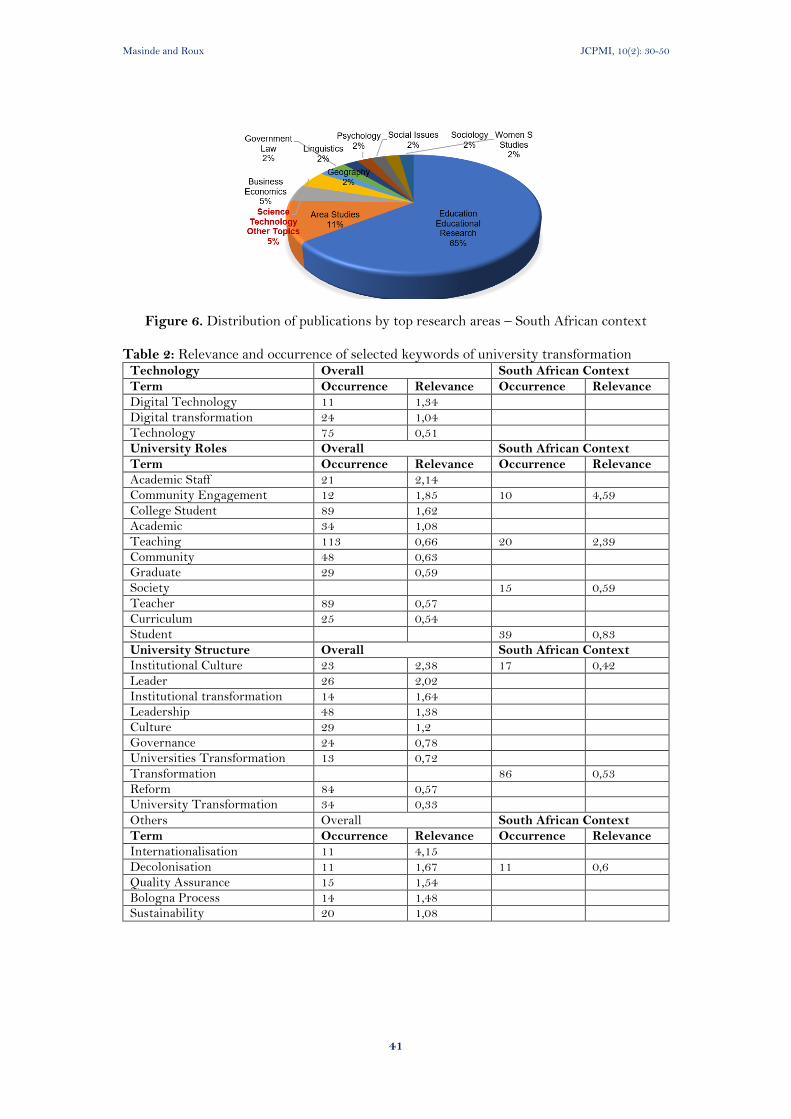
Masinde and Roux JCPMI, 10(2): 30-50
41
Figure 6. Distribution of publications by top research areas – South African context Table 2: Relevance and occurrence of selected keywords of university transformation
Technology Overall South African Context
Term Occurrence Relevance Occurrence Relevance
Digital Technology 11 1,34 Digital transformation 24 1,04 Technology 75 0,51
University Roles Overall South African Context
Term Occurrence Relevance Occurrence Relevance
Academic Staff 21 2,14 Community Engagement 12 1,85 10 4,59 College Student 89 1,62 Academic 34 1,08 Teaching 113 0,66 20 2,39 Community 48 0,63 Graduate 29 0,59
Society 15 0,59 Teacher 89 0,57 Curriculum 25 0,54 Student 39 0,83
University Structure Overall South African Context
Institutional Culture 23 2,38 17 0,42 Leader 26 2,02 Institutional transformation 14 1,64 Leadership 48 1,38 Culture 29 1,2 Governance 24 0,78 Universities Transformation 13 0,72 Transformation 86 0,53 Reform 84 0,57 University Transformation 34 0,33
Others Overall South African Context
Term Occurrence Relevance Occurrence Relevance
Internationalisation 11 4,15 Decolonisation 11 1,67 11 0,6 Quality Assurance 15 1,54 Bologna Process 14 1,48 Sustainability 20 1,08
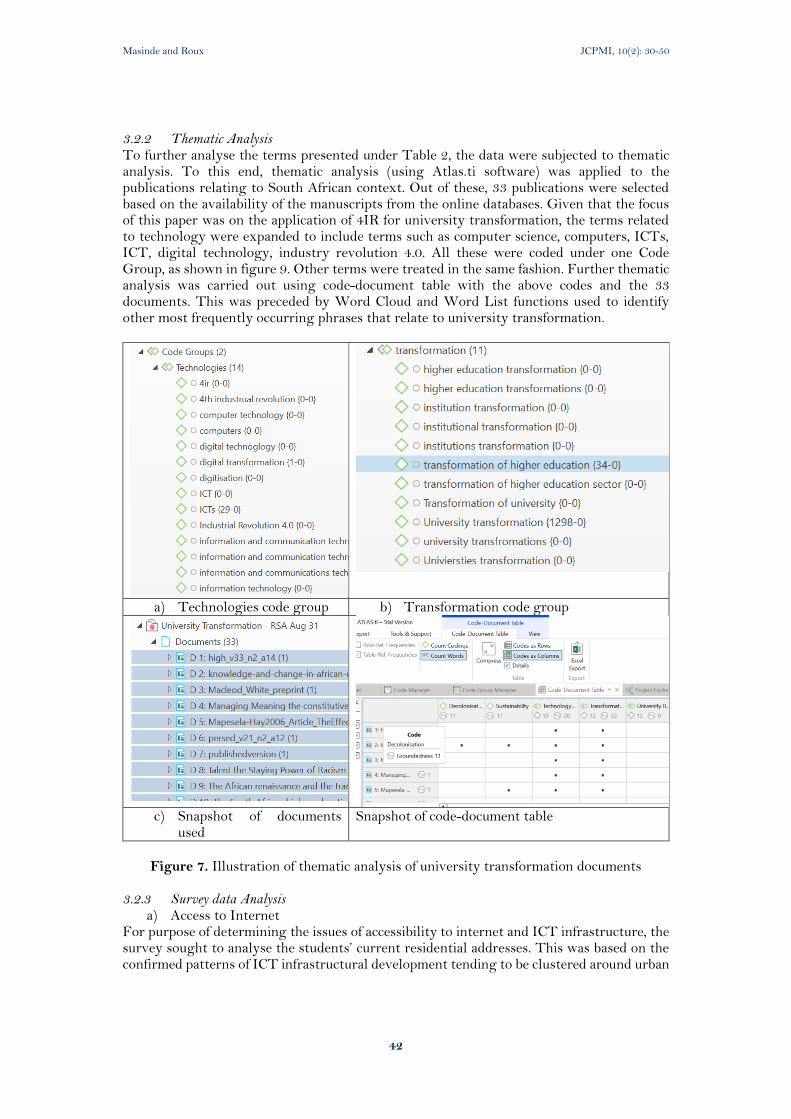
Masinde and Roux JCPMI, 10(2): 30-50
42
3.2.2 Thematic Analysis To further analyse the terms presented under Table 2, the data were subjected to thematic analysis. To this end, thematic analysis (using Atlas.ti software) was applied to the publications relating to South African context. Out of these, 33 publications were selected based on the availability of the manuscripts from the online databases. Given that the focus of this paper was on the application of 4IR for university transformation, the terms related to technology were expanded to include terms such as computer science, computers, ICTs, ICT, digital technology, industry revolution 4.0. All these were coded under one Code Group, as shown in figure 9. Other terms were treated in the same fashion. Further thematic analysis was carried out using code-document table with the above codes and the 33 documents. This was preceded by Word Cloud and Word List functions used to identify other most frequently occurring phrases that relate to university transformation.
a) Technologies code group b) Transformation code group
c) Snapshot of documents
used Snapshot of code-document table
Figure 7. Illustration of thematic analysis of university transformation documents
3.2.3 Survey data Analysis
a) Access to Internet For purpose of determining the issues of accessibility to internet and ICT infrastructure, the survey sought to analyse the students’ current residential addresses. This was based on the confirmed patterns of ICT infrastructural development tending to be clustered around urban
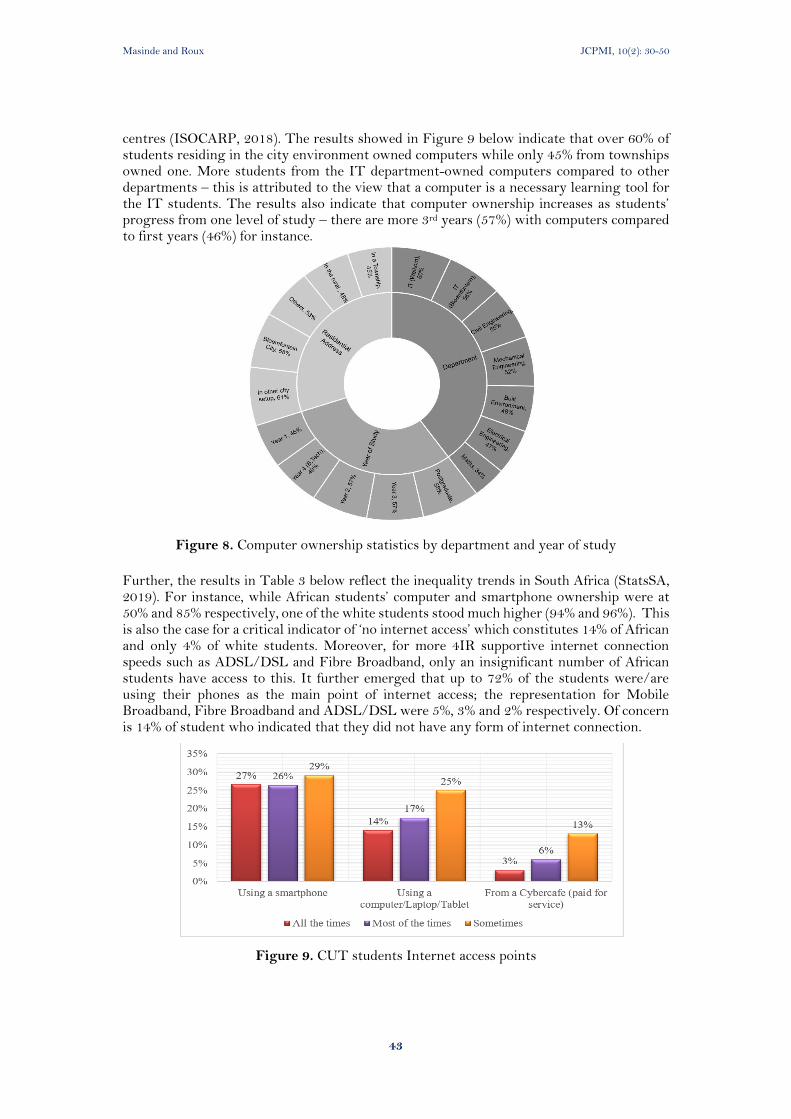
Masinde and Roux JCPMI, 10(2): 30-50
43
centres (ISOCARP, 2018). The results showed in Figure 9 below indicate that over 60% of students residing in the city environment owned computers while only 45% from townships owned one. More students from the IT department-owned computers compared to other departments – this is attributed to the view that a computer is a necessary learning tool for the IT students. The results also indicate that computer ownership increases as students’ progress from one level of study – there are more 3rd years (57%) with computers compared to first years (46%) for instance.
Figure 8. Computer ownership statistics by department and year of study
Further, the results in Table 3 below reflect the inequality trends in South Africa (StatsSA, 2019). For instance, while African students’ computer and smartphone ownership were at 50% and 85% respectively, one of the white students stood much higher (94% and 96%). This is also the case for a critical indicator of ‘no internet access’ which constitutes 14% of African and only 4% of white students. Moreover, for more 4IR supportive internet connection speeds such as ADSL/DSL and Fibre Broadband, only an insignificant number of African students have access to this. It further emerged that up to 72% of the students were/are using their phones as the main point of internet access; the representation for Mobile Broadband, Fibre Broadband and ADSL/DSL were 5%, 3% and 2% respectively. Of concern is 14% of student who indicated that they did not have any form of internet connection.
Figure 9. CUT students Internet access points
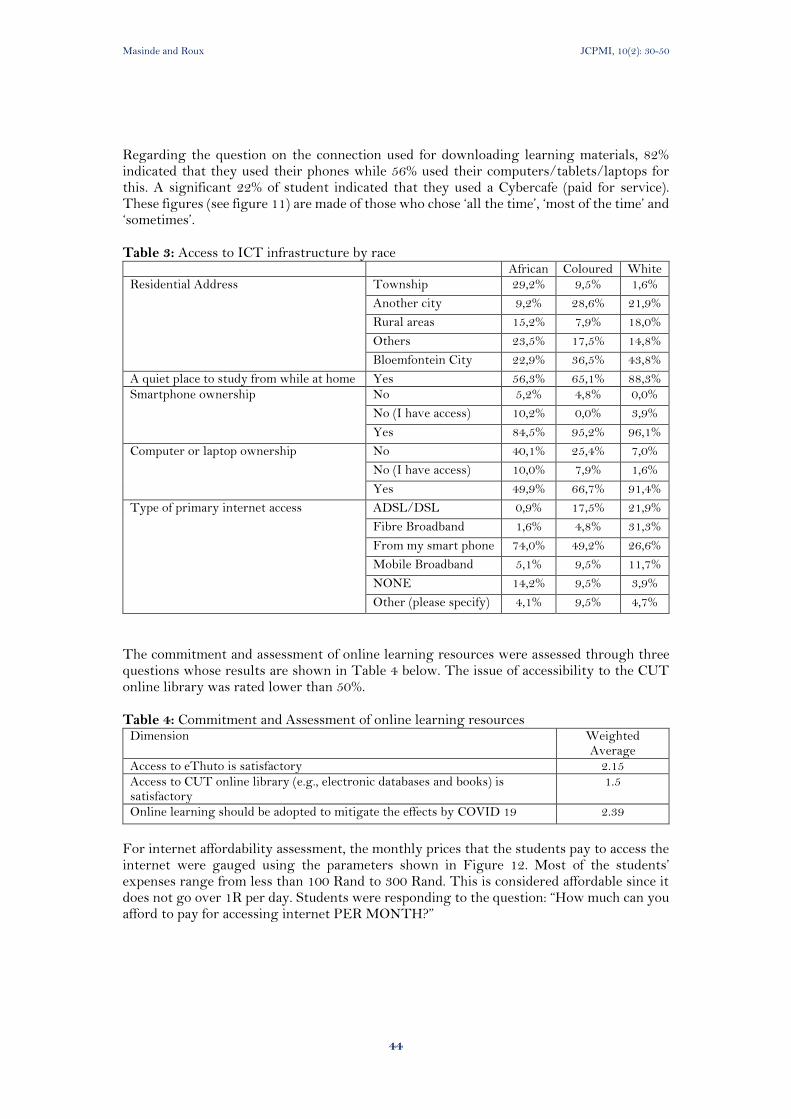
Masinde and Roux JCPMI, 10(2): 30-50
44
Regarding the question on the connection used for downloading learning materials, 82% indicated that they used their phones while 56% used their computers/tablets/laptops for this. A significant 22% of student indicated that they used a Cybercafe (paid for service). These figures (see figure 11) are made of those who chose ‘all the time’, ‘most of the time’ and ‘sometimes’. Table 3: Access to ICT infrastructure by race
African Coloured White Residential Address Township 29,2% 9,5% 1,6%
Another city 9,2% 28,6% 21,9%
Rural areas 15,2% 7,9% 18,0%
Others 23,5% 17,5% 14,8%
Bloemfontein City 22,9% 36,5% 43,8%
A quiet place to study from while at home Yes 56,3% 65,1% 88,3%
Smartphone ownership No 5,2% 4,8% 0,0%
No (I have access) 10,2% 0,0% 3,9%
Yes 84,5% 95,2% 96,1%
Computer or laptop ownership No 40,1% 25,4% 7,0%
No (I have access) 10,0% 7,9% 1,6%
Yes 49,9% 66,7% 91,4%
Type of primary internet access ADSL/DSL 0,9% 17,5% 21,9%
Fibre Broadband 1,6% 4,8% 31,3%
From my smart phone 74,0% 49,2% 26,6%
Mobile Broadband 5,1% 9,5% 11,7%
NONE 14,2% 9,5% 3,9%
Other (please specify) 4,1% 9,5% 4,7%
The commitment and assessment of online learning resources were assessed through three questions whose results are shown in Table 4 below. The issue of accessibility to the CUT online library was rated lower than 50%. Table 4: Commitment and Assessment of online learning resources
Dimension Weighted Average
Access to eThuto is satisfactory 2.15 Access to CUT online library (e.g., electronic databases and books) is satisfactory
1.5
Online learning should be adopted to mitigate the effects by COVID 19 2.39
For internet affordability assessment, the monthly prices that the students pay to access the internet were gauged using the parameters shown in Figure 12. Most of the students’ expenses range from less than 100 Rand to 300 Rand. This is considered affordable since it does not go over 1R per day. Students were responding to the question: “How much can you afford to pay for accessing internet PER MONTH?”
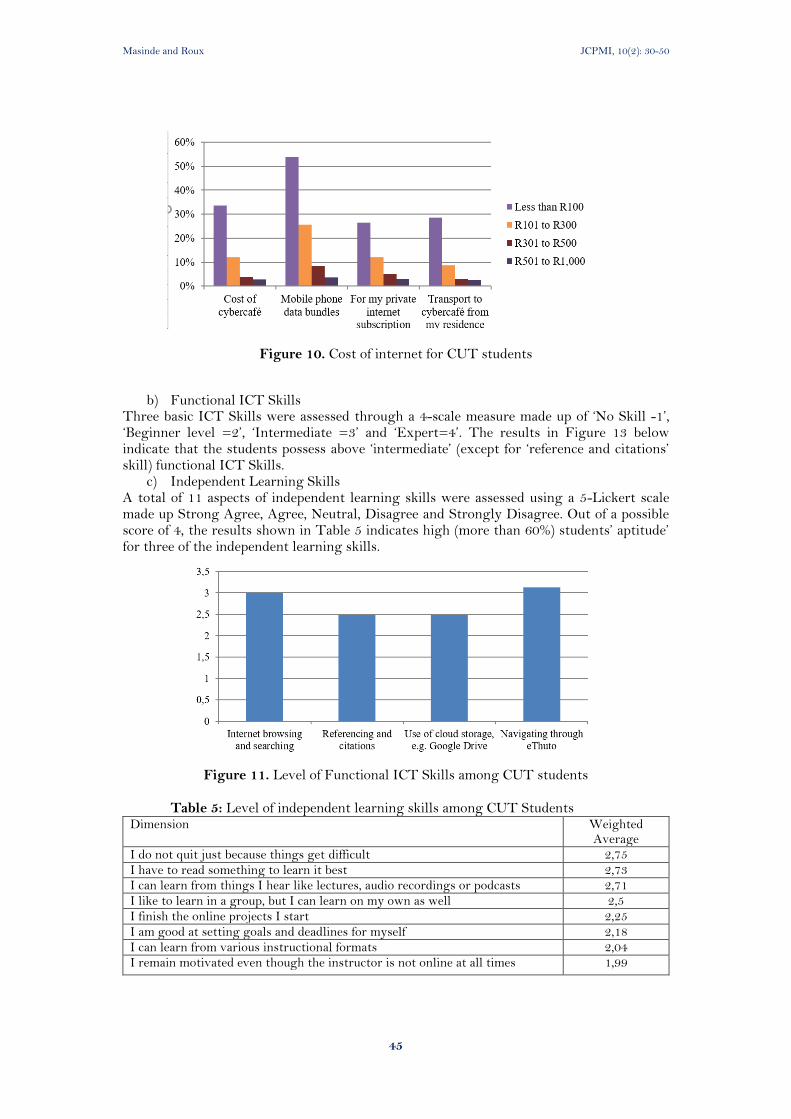
Masinde and Roux JCPMI, 10(2): 30-50
45
Figure 10. Cost of internet for CUT students
b) Functional ICT Skills Three basic ICT Skills were assessed through a 4-scale measure made up of ‘No Skill -1’, ‘Beginner level =2’, ‘Intermediate =3’ and ‘Expert=4’. The results in Figure 13 below indicate that the students possess above ‘intermediate’ (except for ‘reference and citations’ skill) functional ICT Skills.
c) Independent Learning Skills A total of 11 aspects of independent learning skills were assessed using a 5-Lickert scale made up Strong Agree, Agree, Neutral, Disagree and Strongly Disagree. Out of a possible score of 4, the results shown in Table 5 indicates high (more than 60%) students’ aptitude’ for three of the independent learning skills.
Figure 11. Level of Functional ICT Skills among CUT students Table 5: Level of independent learning skills among CUT Students
Dimension Weighted Average
I do not quit just because things get difficult 2,75 I have to read something to learn it best 2,73 I can learn from things I hear like lectures, audio recordings or podcasts 2,71 I like to learn in a group, but I can learn on my own as well 2,5 I finish the online projects I start 2,25 I am good at setting goals and deadlines for myself 2,18 I can learn from various instructional formats 2,04 I remain motivated even though the instructor is not online at all times 1,99
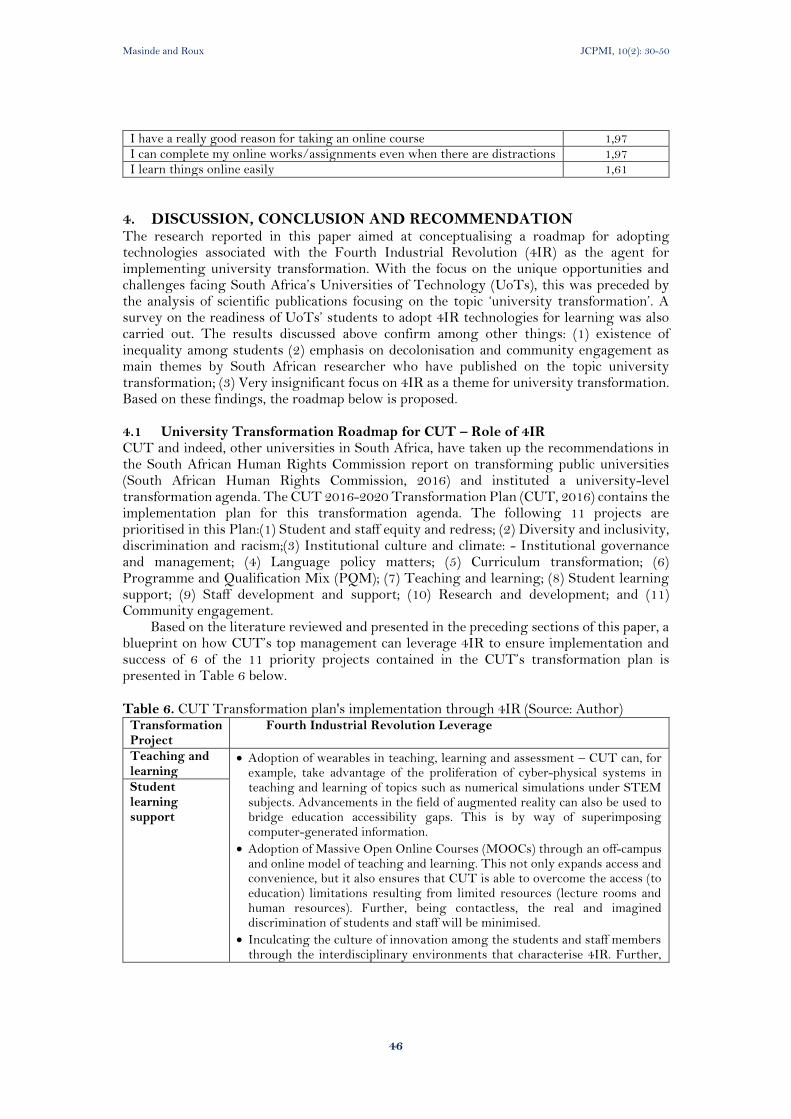
Masinde and Roux JCPMI, 10(2): 30-50
46
I have a really good reason for taking an online course 1,97 I can complete my online works/assignments even when there are distractions 1,97 I learn things online easily 1,61
4. DISCUSSION, CONCLUSION AND RECOMMENDATION The research reported in this paper aimed at conceptualising a roadmap for adopting technologies associated with the Fourth Industrial Revolution (4IR) as the agent for implementing university transformation. With the focus on the unique opportunities and challenges facing South Africa’s Universities of Technology (UoTs), this was preceded by the analysis of scientific publications focusing on the topic ‘university transformation’. A survey on the readiness of UoTs’ students to adopt 4IR technologies for learning was also carried out. The results discussed above confirm among other things: (1) existence of inequality among students (2) emphasis on decolonisation and community engagement as main themes by South African researcher who have published on the topic university transformation; (3) Very insignificant focus on 4IR as a theme for university transformation. Based on these findings, the roadmap below is proposed. 4.1 University Transformation Roadmap for CUT – Role of 4IR CUT and indeed, other universities in South Africa, have taken up the recommendations in the South African Human Rights Commission report on transforming public universities (South African Human Rights Commission, 2016) and instituted a university-level transformation agenda. The CUT 2016-2020 Transformation Plan (CUT, 2016) contains the implementation plan for this transformation agenda. The following 11 projects are prioritised in this Plan:(1) Student and staff equity and redress; (2) Diversity and inclusivity, discrimination and racism;(3) Institutional culture and climate: - Institutional governance and management; (4) Language policy matters; (5) Curriculum transformation; (6) Programme and Qualification Mix (PQM); (7) Teaching and learning; (8) Student learning support; (9) Staff development and support; (10) Research and development; and (11) Community engagement.
Based on the literature reviewed and presented in the preceding sections of this paper, a blueprint on how CUT’s top management can leverage 4IR to ensure implementation and success of 6 of the 11 priority projects contained in the CUT’s transformation plan is presented in Table 6 below.
Table 6. CUT Transformation plan's implementation through 4IR (Source: Author)
Transformation Project
Fourth Industrial Revolution Leverage
Teaching and learning
• Adoption of wearables in teaching, learning and assessment – CUT can, for example, take advantage of the proliferation of cyber-physical systems in teaching and learning of topics such as numerical simulations under STEM subjects. Advancements in the field of augmented reality can also be used to bridge education accessibility gaps. This is by way of superimposing computer-generated information.
• Adoption of Massive Open Online Courses (MOOCs) through an off-campus and online model of teaching and learning. This not only expands access and convenience, but it also ensures that CUT is able to overcome the access (to education) limitations resulting from limited resources (lecture rooms and human resources). Further, being contactless, the real and imagined discrimination of students and staff will be minimised.
• Inculcating the culture of innovation among the students and staff members through the interdisciplinary environments that characterise 4IR. Further,
Student learning support
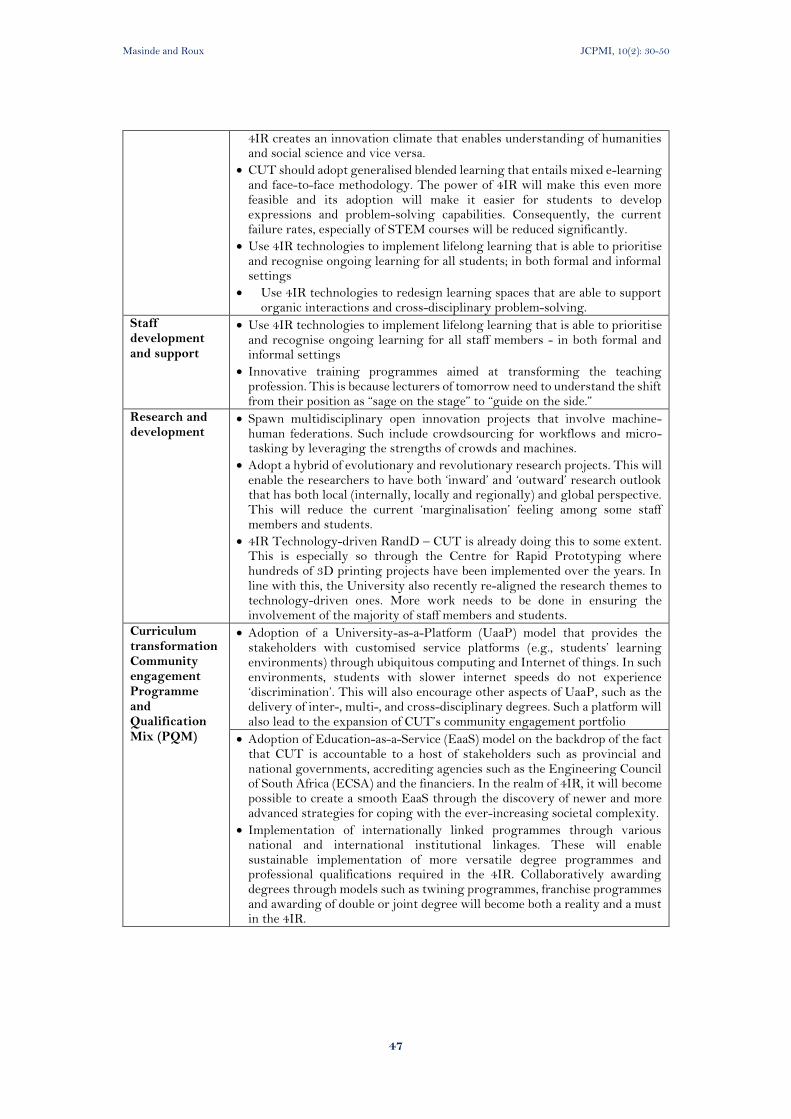
Masinde and Roux JCPMI, 10(2): 30-50
47
4IR creates an innovation climate that enables understanding of humanities and social science and vice versa.
• CUT should adopt generalised blended learning that entails mixed e-learning and face-to-face methodology. The power of 4IR will make this even more feasible and its adoption will make it easier for students to develop expressions and problem-solving capabilities. Consequently, the current failure rates, especially of STEM courses will be reduced significantly.
• Use 4IR technologies to implement lifelong learning that is able to prioritise and recognise ongoing learning for all students; in both formal and informal settings
• Use 4IR technologies to redesign learning spaces that are able to support organic interactions and cross-disciplinary problem-solving.
Staff development and support
• Use 4IR technologies to implement lifelong learning that is able to prioritise and recognise ongoing learning for all staff members - in both formal and informal settings
• Innovative training programmes aimed at transforming the teaching profession. This is because lecturers of tomorrow need to understand the shift from their position as “sage on the stage” to “guide on the side.”
Research and development
• Spawn multidisciplinary open innovation projects that involve machine-human federations. Such include crowdsourcing for workflows and micro-tasking by leveraging the strengths of crowds and machines.
• Adopt a hybrid of evolutionary and revolutionary research projects. This will enable the researchers to have both ‘inward’ and ‘outward’ research outlook that has both local (internally, locally and regionally) and global perspective. This will reduce the current ‘marginalisation’ feeling among some staff members and students.
• 4IR Technology-driven RandD – CUT is already doing this to some extent. This is especially so through the Centre for Rapid Prototyping where hundreds of 3D printing projects have been implemented over the years. In line with this, the University also recently re-aligned the research themes to technology-driven ones. More work needs to be done in ensuring the involvement of the majority of staff members and students.
Curriculum transformation Community engagement Programme and Qualification Mix (PQM)
• Adoption of a University-as-a-Platform (UaaP) model that provides the stakeholders with customised service platforms (e.g., students’ learning environments) through ubiquitous computing and Internet of things. In such environments, students with slower internet speeds do not experience ‘discrimination’. This will also encourage other aspects of UaaP, such as the delivery of inter-, multi-, and cross-disciplinary degrees. Such a platform will also lead to the expansion of CUT’s community engagement portfolio
• Adoption of Education-as-a-Service (EaaS) model on the backdrop of the fact that CUT is accountable to a host of stakeholders such as provincial and national governments, accrediting agencies such as the Engineering Council of South Africa (ECSA) and the financiers. In the realm of 4IR, it will become possible to create a smooth EaaS through the discovery of newer and more advanced strategies for coping with the ever-increasing societal complexity.
• Implementation of internationally linked programmes through various national and international institutional linkages. These will enable sustainable implementation of more versatile degree programmes and professional qualifications required in the 4IR. Collaboratively awarding degrees through models such as twining programmes, franchise programmes and awarding of double or joint degree will become both a reality and a must in the 4IR.
Masinde and Roux JCPMI, 10(2): 30-50
48
4.2 Recommendations At the dawn of the fourth industrial revolution, institutions (public and private) need to identify transformative ways of reimagining their mission and vision. This should be approached in a way that is aligned to this revolution – otherwise not doing so will leave a lost window of opportunity. In the case of higher education institutions such as CUT, such alignments should be anchored on the three functions of the universities: teaching, research and (community) service.
CUT, like other public universities in South Africa, is currently undergoing a mandatory transformation geared towards addressing the inequalities created by the past apartheid government system. Although there are already isolated efforts towards embracing 4IR, this paper has attempted to present a blueprint that CUT could adopt in ensuring that the transformation agenda benefits from the opportunities presented by 4IR.
In this paper, a detailed blueprint of how CUT can anchor its transformation agenda within 4IR is presented. Given that the audience of this paper is the top management of the university, it is recommended that is blueprint be adopted and be used to expand the terms of reference of the recently created 4IR Task Team. Given the similarities of the transformation agenda of other UoTs, it is further recommended that other UoTs adopt and adapt this blueprint to accelerate their transformation processes.
In recognition of the critical role of MOOCs in expanding accessibility to teaching and learning, the paper also provides preliminary results on the students’ readiness to this form of learning. This is underpinned by the assertion that most students at UoTs lag in terms of baseline computing infrastructure. Other aspects of the transformation agenda as explained in Table 6 also need to be pursued in order to cater for all three of the missions of the university – especially the aspects of community engagement, research and innovation.
5. REFERENCES Adams Becker, S., Cummins, M., Davis, A., and A., F. (2017). NMC Horizon Report: 2017
Higher Education Edition (2017th ed.; C. A., Hall Giesinger and V. Ananthanarayanan, Eds.). Retrieved from The New Media Consortium
Al-Rahmi, W., Aldraiweesh, A., Yahaya, N., Bin Kamin, Y., and Zeki, A. M. (2019). Massive Open Online Courses (MOOCs): Data on higher education. Data in Brief, 22, 118–125. https://doi.org/10.1016/j.dib.2018.11.139
Altbach, P. G., Reisberg, L., and Rumbley, L. E. (2009). Trends in Global Higher Education : Tracking an Academic Revolution. UNESCO 2009 World Conference on Higher Education. https://doi.org/10.1016/j.bse.2004.04.006
Aparicio, M., Oliveira, T., Bacao, F., and Painho, M. (2019). Gamification: A key determinant of massive open online course (MOOC) success. Information and Management, 56(1), 39–54. https://doi.org/10.1016/j.im.2018.06.003
Barakabitze, A. A., Lazaro, A. W., Ainea, N., Mkwizu, M. H., Maziku, H., Matofali, A. X., … Sanga, C. (2019). Transforming African Education Systems in Science , Technology ,
Engineering , and Mathematics ( STEM ) Using ICTs : Challenges and Opportunities. Education Research Internationa, 2019, 1–29.
Barr, C. (2017). Inequality index: where are the world’s most unequal countries. The Guardian.
Bloem, J., Van Doorn, M., Duivestein, S., Excoffier, D., Maas, R., and Van Ommeren, E. (2014). The Fourth Industrial Revolution Things to Tighten the Link Between it and ot. In VINT research report.
Boehm, B. W. (1988). A Spiral Model of Software Development and Enhancement. 29(8), 700–703. https://doi.org/10.1177/070674378402900812
Masinde and Roux JCPMI, 10(2): 30-50
49
Bond, P. (2007). Transcending two economies: renewed debates in South African political economy. Africanus. Journal of Development Studies.
Bongomin, O., Gilibrays Ocen, G., Oyondi Nganyi, E., Musinguzi, A., and Omara, T. (2020). Exponential Disruptive Technologies and the Required Skills of Industry 4.0. Journal of Engineering, 2020. https://doi.org/10.1155/2020/4280156
Braun, V. (2006). Using thematic analysis in psychology. Qualitative Research in Psychology, 3(2), 77–101.
Bughin, J., LaBerge, L., and Melbye, A. (2017). The case for digital reinvention (McKinsey Quarterly).
Bunting, I., and Cloete, N. (2010). Institutional types in higher education in South Africa. https://doi.org/10.1080/07366981.2014.869962
CUT. (2016). CUT Transformation Plan 2016-2020. pp. 1–27. Retrieved from www.cut.ac.za Deloitte. (2018). The fourth industrial revolution is here: Are you ready? Deloitte Insight.
https://doi.org/10.1016/j.jbusres.2015.10.029 Fakinlede, C. O., Yusuf, M. O., and Mejabi, O. V. (2014). Readiness for online learning in
higher education: a mixed methods assessment of students at a Nigerian University. Malaysian Journal of Distance Education, 16(1), 37–57.
Hew, K. F., and Cheung, W. S. (2014). Students’ and instructors’ use of massive open online courses (MOOCs): Motivations and challenges. Educational Research Review, 12, 45–58. https://doi.org/10.1016/j.edurev.2014.05.001
ISOCARP. (2018). Cool planning: changing climate and our urban future: Proceedings of 54th ISOCARP Congress (D. Bogunovich, Ed.). Retrieved from https://isocarp.org/
ITU. (2019). International Telecommunication Union, Facts and Figures. Retrieved 1 March 2020, from https://www.itu.int/en/ITU-D/Statistics/Pages/stat/default.aspx
Jansen, R. S., van Leeuwen, A., Janssen, J., Conijn, R., and Kester, L. (2020). Supporting learners’ self-regulated learning in Massive Open Online Courses. Computers and Education, 146(November 2019). https://doi.org/10.1016/j.compedu.2019.103771
Jung, Y., and Lee, J. (2018). Learning Engagement and Persistence in Massive Open Online Courses (MOOCS). Computers and Education, 122(April 2017), 9–22. https://doi.org/10.1016/j.compedu.2018.02.013
Kelly, E. P. (1998). Competing in the Third Wave: The Ten Key Management Issues of the Information Age. Academy of Management Perspectives. https://doi.org/10.5465/ame.1998.254984
Kulakli, A., and Mahony, S. (2014). Knowledge Creation and Sharing with Web 2.0 Tools for Teaching and Learning Roles in So-called University 2.0. Procedia - Social and Behavioral Sciences, 150, 648–657. https://doi.org/10.1016/j.sbspro.2014.09.084
Luvalo, L. M. (2019). Relationship Between Transformation and Institutional Culture. South African Journal of Higher Education, 33(1), 184–199.
Mosconi, F. (2015). The new European industrial policy: Global competitiveness and the manufacturing renaissance. In The New European Industrial Policy: Global Competitiveness and the Manufacturing Renaissance. https://doi.org/10.4324/9781315761756
Mtshali, M. N. G., and Sooryamoorthy, R. (2018). A research-inducing environment at a University of Technology in South Africa: Challenges and future prospects. Futures, (June), 0–1. https://doi.org/10.1016/j.futures.2018.06.017
Pinheiro, R., Langa, P. V., and Pausits, A. (2015). One and two equals three? The third mission of higher education institutions. European Journal of Higher Education. https://doi.org/10.1080/21568235.2015.1044552
Preez, P., Simmonds, S., and Campus, P. (2016). Rethinking and researching transformation
in higher education : A meta-study of South African trends. Transformation in Higher Education, 1(1), 1–7.
Masinde and Roux JCPMI, 10(2): 30-50
50
Roblek, V., Meško, M., and Krapež, A. (2016). A Complex View of Industry 4.0. SAGE Open, 6(2). https://doi.org/10.1177/2158244016653987
SACHR. (2018). Achieving substantive economic equality through rights-based radical socio-economic transformation in South Africa. Pretoria.
Sackey, S., M., and Bester, A. (2016). Industrial Engineering Curriculum in Industry 4.0 in a South African Context. The South African Journal of Industrial Engineering, 27(4), 101–114. Retrieved from http://sajie.journals.ac.za/pub/article/view/1579/746
Sackey, S. M., and Bester, A. (2016). Industrial engineering curriculum in industry 4.0 in a South African context. South African Journal of Industrial Engineering. https://doi.org/10.7166/27-4-1579
Schwab, K. (2016). The Fourth Industrial Revolution: what it means and how to respond. World Economic Forum, 1–7.
Soudien-Report. (2008). 30 November 2008 • Final Report. Pretoria. Srinivasa, P. L., Nagananda, S. N., Kadambi, G. R., Hariharan, R., Shankpal, P., and
Shankapal, S. R. (2013). Development of two degree of freedom (DoF) bionic hand for below elbow amputee. 2013 IEEE International Conference on Electronics, Computing and Communication Technologies, 1–6.
StatsSA. (2019). Inequality Trends in South Africa: A multidimensional diagnostic of inequality. Pretoria.
United Nations Development Programme. (2019). Human Development Report 2019: Beyond income , beyond averages , beyond today. Retrieved from http://hdr.undp.org/sites/default/files/hdr2019.pdf
World Economic Forum. (2018). The Future of Jobs Report. In Centre for the New Economy and Society. https://doi.org/10.1177/0891242417690604
Xing, B., and Marwala, T. (2018). Implications Of The Fourth Industrial Age On Higher
Education. Tạp Chí Nghiên Cứu Dân Tộc. https://doi.org/10.25073/0866-773x/87 Zulkifli, N. Z., Mohamed Maidin, F. B., Abd Halim, A. H., Ali, U. H., and Ahmad Kuthi, H.
A. (2019). Students’ readiness in using MOOC for teaching and learning. Journal of Counseling and Educational Technology, 2(2). https://doi.org/10.32698/0281
Journal of Construction Project Management and Innovation, 10 (2): 51-64, 2020
ISSN 2223-7852 © Sustainable Human Settlement and Construction Research Centre DOI: https://doi.org/10.36615/jcpmi.v10i2.406
51
FACILITATING COMMUNITY PARTICIPATION THROUGH CROWDSOURCING IN URBAN
PLANNING PROCESSES: AN EXPLORATORY STUDY
Lindelwa SINXADI1
1Department of Information Technology, Central University of Technology, Free State, South Africa
Email: [email protected]
ABSTRACT Fostering community participation by planners in South African municipalities poses a challenge during planning processes. Different levels of public apathy have been observed, and they continue to undermine the quest of municipalities to provide sustainable neighbourhoods. Also, value conflicts from different urban stakeholders resulting from this apathy can be ameliorated through improved participation of the communities in the planning processes. In bridging this gap, the paper seeks to explore different Crowdsourcing techniques to be employed in Mangaung to enable urban stakeholders’ participation in planning projects. As such, crowdsourcing, as a new web-based business model, is inclusive in the 4th Industrial Revolution and can be used as the best solution for community participation in planning projects. Based on the foregoing, this paper employs a case study research design and a coterie of techniques: semi-structured interviews and document reviews for data elicitation. Interviewees comprise of purposively recruited town planning and other municipal officials involved in planning projects. The emergent data will be analysed thematically. Expectedly, the findings hold immense implications for planning practitioners as well as other professionals and policymakers working within the urban planning and socio-economic development praxes in South African Municipalities.
Keywords: Community participation, Crowdsourcing, Problem-solving, Value conflicts
1. INTRODUCTION Facilitating community participation in municipalities poses a challenge for planners. As such, due to ineffective communication between the urban stakeholders and non-involvement of community members in planning projects, planners have difficulty achieving the key objectives of planning, namely, creation of sustainable neighbourhoods. Community participation is a significant element in achieving sustainable development and is viewed as a process of a group of procedures aimed at the consultation, involvement and rendering information to the community for them to take part in decision making (Alexander, 2008; Mahjabeen, Shrestha and Dee, 2009; Rowe and Frewer, 2000). Also, it forms part of the democratic process as it involves the community in the planning process in order to achieve the key objectives of planning. Ertiö (2015) acknowledges the democratic respect for citizen’s preferences but also indicates that the public apathy cause challenges in community participation. These challenges include the time and costs of the process of community participation. In addition, Innes and Booher (2004) allude that planners do not conduct the process of community participation in an effective way. Despite the challenges encountered using the traditional approach of community participation, it still continues to underpin the
Sinxadi JCPMI, 10(2): 51-64
52
contemporary approach of community participation. The corrective measure for this shortcoming was the implementation of communicative planning theory which substituted the rational planning theory. This came with new methods in planning which introduced promotion on the interaction of planners and the community (Ertiö, 2015). Experts and non-experts engage in creative problem-solving processes in planning. In this process, collaboration and inclusion of non-experts, namely, community members, get to provide new knowledge and contribute new perspectives to the planning process. They are also bound to rediscover creative solutions. Effective community participation involves ICT driven techniques such as consultation, giving report and visioning. There is an increasing interest in using innovative online problem-solving techniques in engaging different urban stakeholders in planning projects. Brabham (2009) emphasise that planners are faced with challenges on how to implement community participation in planning projects. As such, a crowdsourcing business model, which is a Web-based, distributed problem-solving and productive model for business is also suitable for community participation process in planning projects. Howe (2006) define crowdsourcing as a new web-based business model that harnesses the creative solutions of a distributed network of individuals through what amounts to an open call for proposals. Different crowdsourcing techniques can be employed in fostering community participation in planning projects.
To achieve its objective, the study answers two research questions, namely; What are the probable factors affecting its successful implementation in urban planning projects? And, what are the key planning challenges affecting community participation process in Mangaung? The rest of the paper is structured as follows: a theoretical perspective based on the concept of community participation; crowdsourcing in community participation; justification of research methodology deployed; presentation and discussion of findings section, and the conclusion.
2. THEORETICAL PERSPECTIVE In this section, the extant literature concerning the fostering of community participation process through crowdsourcing by planners in the urban context and contributions thereof to the concept of creating sustainable communities is reviewed. 2.1 Defining community participation in urban planning Community participation has recently become a debated thought in planning and is defined differently by various scholars. It is found at the core of communicative planning theory in decision-making process where different urban stakeholders are involved. Community participation is seen as a process that is central to planning as it promotes democracy, justice and sustainability. It plays a significant role in achieving sustainable development (Alexander, 2008; Mahjabeen et al., 2009). It involves consultation, stakeholder involvement and information sharing conceptualisation, implementation, monitoring and evaluation in planning projects. This direct involvement pertains to planning, governance and development aspects at the grassroots level (Mafukidze and Hoosen, 2009). This implies that the direct engagement of the community by the planners in planning and implementation is vital. Better communication and effective community participation will increase cooperation among the planners and the community. This can be achieved through empowerment and mutual understanding and trust in the participation process. The needs and the values of the community must be taken into account and must form an integral part of decision-making (Ismail and Said, 2015). Filho et al. (2019:679) indicated that planning for sustainable development requires a vision which focuses on changing the development to be better, and a strategy for the vision must be developed. According to the Guide on public participation in the public service (RSA, Department of Public Service and Administration, 2014), community participation is beneficial to all citizens in that:
Sinxadi JCPMI, 10(2): 51-64
53
• It plays a role in the enhancement of the quality and legitimacy of decisions taken by different stakeholders in planning processes.
• It prohibits conflict between stakeholders, which can lead to protests at the municipal level.
• It allows different stakeholders an opportunity to voice their concerns in issues affecting their well-being.
• It assists stakeholders to attain skills that include active listening, problem-solving and creative thinking that they can use in other areas of their lives.
• It permits openness and responsibility and promotes a higher quality of democracy in South Africa.
• It boosts trust and confidence for all the decisions taken by the government, including different programmes.
To achieve this, all the urban stakeholders involved in planning projects must work as a team in order to reach a common goal of understanding the significance of community participation.
Based on the pioneering work of Arnstein (1969), the “Ladder of Participation” consisting of different levels of participation was developed. These levels of participation are a result of social and political turmoil and critiques on how planners and policymakers handled community participation. The “Ladder of Participation” is categorised into non-participation (therapy and manipulation which is associated with blueprint planning), degree of tokenism (placation, consultation and informing which is associated to synoptic planning) and degree of citizen power (citizen control, delegated power and partnership associated with pluralistic planning). The planner and the community members are involved in all the levels of participation. Under the non-participation level, the community is restricted to form part of the decision-making process, but a planner is given an opportunity to educate the community. Mahjabeen et al. (2009) restate that those in power attempt to educate the community but they become inactive in decision making. Furthermore, the level of the degree of tokenism stems from informing, consultation and placation. The community is given information and are granted an opportunity to raise their voice, but they have no power and participation is restricted (Arnstein, 1969). Consultation is dominant in community participation as it is used as a tool to gather information from the community regarding the proposals of the programmes to be considered. Community members can advise during the consultation but denied participation during decision-making (Lane, 2005; Mahjabeen et al., 2009). Arnstein (1969) further alludes that partnership, delegated power and citizen power form part of the level of the degree of citizen power. At this level, the community is fully engaged in participation and decision-making processes. This level is significant in planning processes as community members are made to understand all the planning projects processes. This promotes collaboration amongst the community members, planners and ward councillors. Complete participation of the community helps different stakeholder in planning to analyse and give solutions to challenges faced within urban areas. From the foregoing, a good working relationship among the planners and other urban stakeholders involved in planning projects is established, and this creates a proper way which is more responsive to the needs of the community (Shuib, Hashim and Nasir, 2015; Ismail and Said, 2015; Aitken, 2010). Towards improving the community participation process, Wamsler (2016) adds that implementation of crowdsourcing in planning community participation serves as an innovative planning solution that will enhance communication and collaboration between the urban stakeholders involved in planning projects.
Sinxadi JCPMI, 10(2): 51-64
54
2.2 Connecting the dots between crowdsourcing and community participation in urban planning
2.2.1 Understanding Crowdsourcing in community participation The term “crowdsourcing” was primarily developed in the business field but has emerged to be applied in various fields. It was first coined by Jeff Howe in June 2006, in his article “The Rise of Crowdsourcing” and a blog was also launched, namely; “Crowdsourcing: Tracking the Rise of the Amateur” (Brabham, 2013). Crowdsourcing is described as a new Web-based business model that draws a network of individuals to participate in an open call for proposal for creative solutions. It refers to the utilisation of different technologies with the aim of gathering information from different stakeholders to solve problems. Brabham (2013: xix) defines crowdsourcing as “an online, distributed problem-solving and production model that leverages the collective intelligence of online communities to serve specific organisational goals. Online communities, also called crowds, are given the opportunity to respond to crowdsourcing activities promoted by the organisation, and they are motivated to respond for a variety of reasons”. Brabham (2009) demonstrated that crowdsourcing could be employed in community participation in public policy processes. It has been employed in various disciplines such as medicine, art, journalism, finance. It has also been used in urban planning in the form of engaging community members regarding the township developments in the neighbourhoods (Nguyen et al., 2016). Continuing, Brabham (2013) indicates crowdsourcing is not possible for all the processes but emphasise that the conditions under which it can be used can be technical and conceptual. Technically, the internet and other new technologies can be used as methods to engage in a participatory culture. These give access to new space for creative endeavours, information-sharing, active interaction and business. Conceptually, crowdsourcing relates to the problem-solving and innovative processes where the crowd is involved in interacting. As a problem-solver, crowdsourcing enables the organisation to discuss the problem online in order to get innovative ideas from the crowd. Under crowdsourcing, there is user innovation and open innovation. In urban planning, the crowdsourcing involves the planners and the community members involved in planning projects. Peng et al. (2015) and Nguyen et al (2016) add that crowdsourcing is an effective way of solving challenges by involving stakeholders’ contributions. Participants are able to collaborate online inorder to produce a solution to the challenge encounters. The community is able to engage in any discussions online and can proposed solution, this exercise can be used to engage the community members in discussions regarding the development of the sustainable neighbourhoods.
According to Hossain and Kauranen (2014), community participation forms the integral part of urban planning, whereas crowdsourcing is applicable to urban planning projects. Crowdsourcing allows the community to be engaged in innovative ideas and problem-solving. Connecting the dots, community participation used through crowdsourcing, involves large numbers of people and it permits an open dialogue between the community and the decision-makers. Examples of crowdsourcing via community participation includes the Obama administration where the community get involved in the number of community affairs. Crowdsourcing replaces the old traditional ways such as questionnaires and public hearings because they are time-consuming and costly for the municipality (Liao, 2019; Hossain and Kauranen, 2015). Crowdsourcing via community participation is simple, cost-effective and generalised because it mostly engages the community via information gathering through social media. Crowdsourcing performed through online participation tools allows the community to engage in problem solving and give feedback without any higher costs (Mueller et al, 2018). A widespread of technologies such as the Internet, mobile phones and urban planning apps for planning projects have been used for community participation. In addition, crowdsourcing is appropriate in community participation for urban planning
Sinxadi JCPMI, 10(2): 51-64
55
projects as it brings all the urban stakeholders affected by the development project (Brabham, 2009; Haltofova, 2018).
2.2.2 How do we crowdsource community participation in planning projects? Community engagement and gathering information are two sides of the same coin in urban planning. Non-participation of the community in planning projects lead to ineffectiveness of community participation process and challenges in proper implementation for development plans (Liao et al., 2019). Brabham (2009) alludes that planners face challenges on how to implement community participation in planning projects. A crowdsourcing model, which is a Web-based, distributed problem-solving and productive model for business, is also suitable for community participation in planning projects. Community participation forms part of the democratic process as it involves the community in planning process in ensuring that they form part of the creation of sustainable communities. It involves different urban stakeholders, that is, experts and non-experts to engage in creating problem-solving process of planning. In this process, collaboration and inclusion of non-experts, which in this case is the community, get the opportunity to provide new knowledge and contribute to new perspectives to the planning process. Community members are also bound to rediscover creative solutions to planning projects. In planning projects, different urban stakeholders are involved, and their engagement is important.
Stakeholders are described as individuals who have an interest or are influenced by a certain undertaking. Stakeholders are classified as (i) those who affect the project; (ii) those who are affected by the projects; and (iii) those who are interested in the project (Walker, Borne and Rowlinson, 2008). From the urban planning perspective, Campbell (2016) alludes that urban stakeholders refer to a group of individuals with different backgrounds, roles and expertise. They also represent different aspects of urban complexity. In continuance, Campbell (2016) indicates two groups of urban stakeholders in urban planning processes. One group of stakeholders is involved in the delivery of the project and involve experts such as urban planners, project managers, developers, investors, environmentalists and human settlement practitioners. Another group of stakeholders may be directly or indirectly affected by the planning process. This group of stakeholders include community members who are non-expects. Researchers and the potential users of future projects also form part of the urban stakeholders. All the different urban stakeholders share a common interest in the creation of communities as they are involved in planning projects. Notably, the different urban stakeholders have different values or perceptions of urban land where the development projects are to be implemented. These are influenced by how they engage in the existing spatial patterns within the urban context and this leads to value conflicts regarding the planning projects (Mathur, Price, Austin and Moobela, 2007; Carmona, De Magalhães and Edwars, 2002).
How then do we crowdsource community participation in planning projects? Brabham (2013) states that crowdsourcing takes place when the organisation has a task to perform, when the community voluntarily perform the given task online and when there is a mutual benefit for the organisation and the online community. Each initiative of crowdsourcing in community participation focus on the basic components, namely; the organisation that benefits from the crowd, directly or indirectly; participants involved in crowdsourcing; and the crowdsourcing platform that links the organisation and the crowd. In this case, the organisation is the local government, participants refer to the community members who are affected by the projects, and the platform is the crowdsourcing technology to be employed (Schenk and Guittard, 2011; Zhao and Zhu, 2014; and Aitamurto, Landemore and Saldivar Galli, 2017).
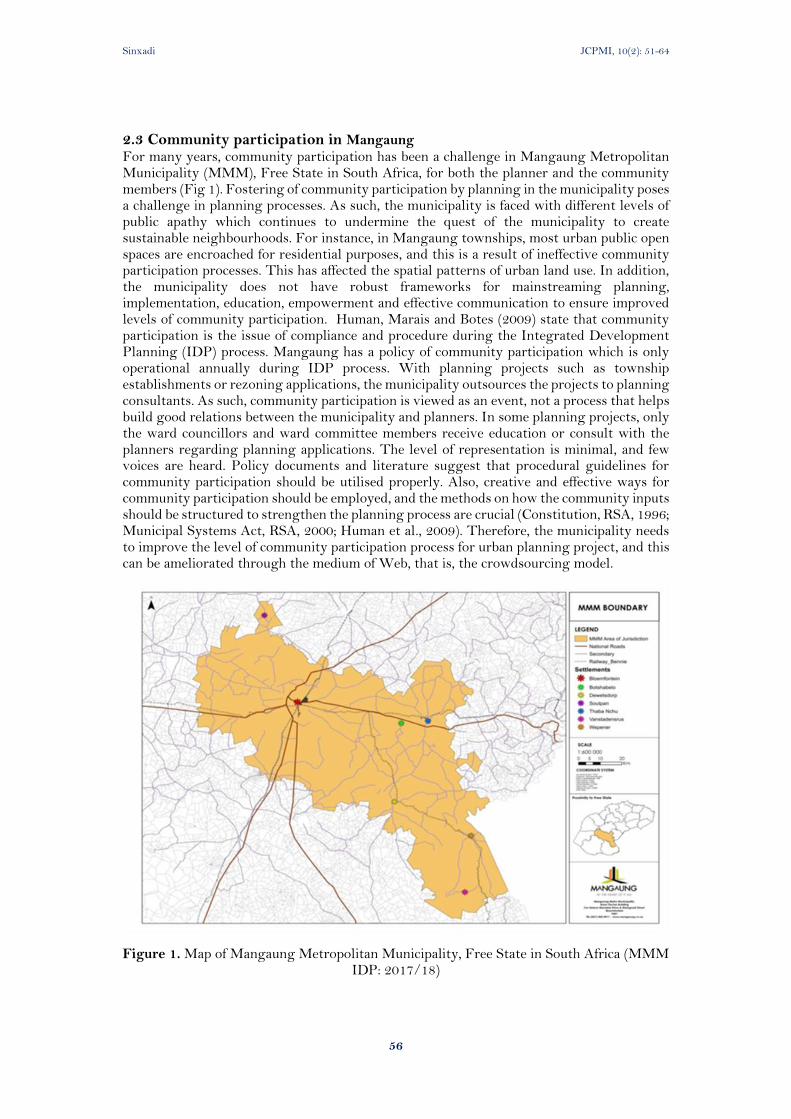
Sinxadi JCPMI, 10(2): 51-64
56
2.3 Community participation in Mangaung For many years, community participation has been a challenge in Mangaung Metropolitan Municipality (MMM), Free State in South Africa, for both the planner and the community members (Fig 1). Fostering of community participation by planning in the municipality poses a challenge in planning processes. As such, the municipality is faced with different levels of public apathy which continues to undermine the quest of the municipality to create sustainable neighbourhoods. For instance, in Mangaung townships, most urban public open spaces are encroached for residential purposes, and this is a result of ineffective community participation processes. This has affected the spatial patterns of urban land use. In addition, the municipality does not have robust frameworks for mainstreaming planning, implementation, education, empowerment and effective communication to ensure improved levels of community participation. Human, Marais and Botes (2009) state that community participation is the issue of compliance and procedure during the Integrated Development Planning (IDP) process. Mangaung has a policy of community participation which is only operational annually during IDP process. With planning projects such as township establishments or rezoning applications, the municipality outsources the projects to planning consultants. As such, community participation is viewed as an event, not a process that helps build good relations between the municipality and planners. In some planning projects, only the ward councillors and ward committee members receive education or consult with the planners regarding planning applications. The level of representation is minimal, and few voices are heard. Policy documents and literature suggest that procedural guidelines for community participation should be utilised properly. Also, creative and effective ways for community participation should be employed, and the methods on how the community inputs should be structured to strengthen the planning process are crucial (Constitution, RSA, 1996; Municipal Systems Act, RSA, 2000; Human et al., 2009). Therefore, the municipality needs to improve the level of community participation process for urban planning project, and this can be ameliorated through the medium of Web, that is, the crowdsourcing model.
Figure 1. Map of Mangaung Metropolitan Municipality, Free State in South Africa (MMM IDP: 2017/18)
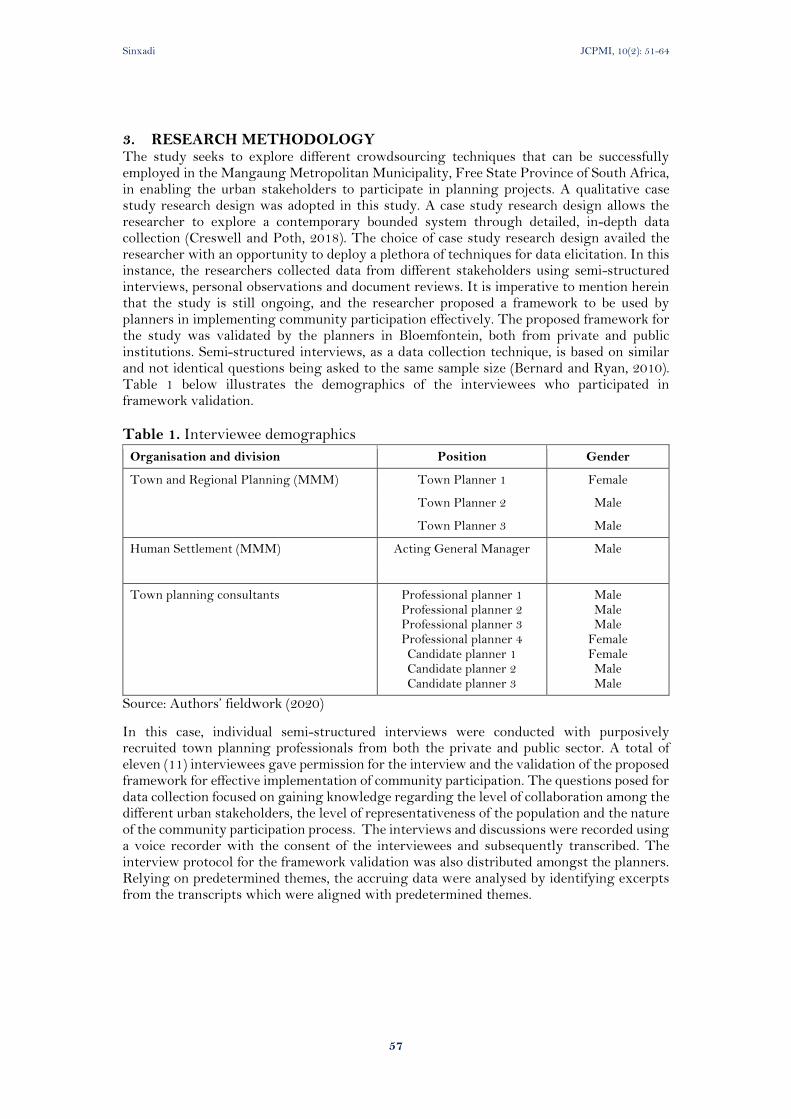
Sinxadi JCPMI, 10(2): 51-64
57
3. RESEARCH METHODOLOGY The study seeks to explore different crowdsourcing techniques that can be successfully employed in the Mangaung Metropolitan Municipality, Free State Province of South Africa, in enabling the urban stakeholders to participate in planning projects. A qualitative case study research design was adopted in this study. A case study research design allows the researcher to explore a contemporary bounded system through detailed, in-depth data collection (Creswell and Poth, 2018). The choice of case study research design availed the researcher with an opportunity to deploy a plethora of techniques for data elicitation. In this instance, the researchers collected data from different stakeholders using semi-structured interviews, personal observations and document reviews. It is imperative to mention herein that the study is still ongoing, and the researcher proposed a framework to be used by planners in implementing community participation effectively. The proposed framework for the study was validated by the planners in Bloemfontein, both from private and public institutions. Semi-structured interviews, as a data collection technique, is based on similar and not identical questions being asked to the same sample size (Bernard and Ryan, 2010). Table 1 below illustrates the demographics of the interviewees who participated in framework validation.
Table 1. Interviewee demographics
Organisation and division Position Gender
Town and Regional Planning (MMM) Town Planner 1 Female
Town Planner 2 Male
Town Planner 3 Male
Human Settlement (MMM) Acting General Manager Male
Town planning consultants Professional planner 1 Professional planner 2 Professional planner 3 Professional planner 4 Candidate planner 1 Candidate planner 2 Candidate planner 3
Male Male Male
Female Female Male Male
Source: Authors’ fieldwork (2020)
In this case, individual semi-structured interviews were conducted with purposively recruited town planning professionals from both the private and public sector. A total of eleven (11) interviewees gave permission for the interview and the validation of the proposed framework for effective implementation of community participation. The questions posed for data collection focused on gaining knowledge regarding the level of collaboration among the different urban stakeholders, the level of representativeness of the population and the nature of the community participation process. The interviews and discussions were recorded using a voice recorder with the consent of the interviewees and subsequently transcribed. The interview protocol for the framework validation was also distributed amongst the planners. Relying on predetermined themes, the accruing data were analysed by identifying excerpts from the transcripts which were aligned with predetermined themes.
Sinxadi JCPMI, 10(2): 51-64
58
4. FINDINGS AND DISCUSSION Findings emanating from the study are discussed according to predetermined themes resulting from the study’s guiding research question: What are the probable factors affecting its successful implementation in urban planning projects? And, what are the key planning challenges affecting community participation process in Mangaung? The two selected themes for the discussions are (1) Probable factors influencing successful implementation of community participation in planning projects; and (2) Absence of robust frameworks for improved levels of community participation. 4.1 Theme 1: Probable factors influencing successful implementation of community
participation in planning projects
4.1.1 Extent of community participation
The Batho Pele Principles (RSA, 1997) indicate that the community should be consulted about the planning aspects affecting their livelihoods. Municipalities must build partnerships with the communities and be transparent. The voice of the community must be heard. The question remains: Who are the participants of community participation and how are they selected? Are their voices heard? The Batho Pele Principles (RSA, 1997) further states that the consultation of the community members in planning projects aspects has an impact on their sustainable livelihoods. The municipalities are therefore expected to be transparent, and it is crucial that the voice of the community is heard. Lalicic and Önder (2018) view community members as urban stakeholders to be involved in all planning projects. This is motivated by their own knowledge and experience from their environment. In addition, the level of representation of the community is crucial, especially during the initial stages of the planning projects. This can curb the incidence of challenges faced by both the planner and the community. Delitheou et al. (2019) emphasise that the engagement of the community is crucial as they show a willingness to participate in planning projects. The community participation, through the crowdsourcing process, assist the community in presenting their ideas regarding the projects at hand. According to the interviewees, for most of the planning projects, especially the upgrading of informal settlement upgrading projects, only the ward councillors and the ward committee members are involved. One of the interviews indicated that most of the planning projects of MMM are outsourced and to town planning consultants who then handle community participation. One of the consultants interviewed mentioned that the incorporation of the community is kept minimal or none at all. Mention was made that the planners sometimes fear the community objections. Therefore, they try to minimise the interaction. From the documentary analysis, community participation is mostly done during the Integrated Development Plan (IDP) review, and this leads to the minimal representation of the urban stakeholders involved in planning projects. The community disengage from the planning process because of lack of interest and knowledge. There is a lack of proper education regarding the processes undertaken in planning projects. Gathering from the foregoing information, no proper consultation is done, and there are no proper guidelines or frameworks used in engaging the community in the development application processes. Konsti-Laakso and Rantala (2018) emphasise the importance of engaging the community and use of transparent processes for engagement of all urban stakeholders. In this way, the planner can achieve the key objectives of planning, namely, creation of sustainable neighbourhoods.
4.1.2 Nature of the community participation process
The nature of community participation relies on the nature of the organisation and mobilisation at the grassroots level. Considering the communicative planning theory, community participation is inclusive of different urban stakeholders who must form part of
Sinxadi JCPMI, 10(2): 51-64
59
decision-making processes. Community members have the right to form part of decision-making in planning projects, and they are bound to bring forth better solutions (Wilson, Hannington and Stephen, 2015; Lalicic and Önder, 2018) Community participation promotes democracy, justice and sustainability, consensus building and information sharing among the stakeholders. Community participation serves as a guide in promoting the engagement of the community in governance (Mafukidze and Hoosen, 2009). The Municipal Systems Act of 2000 (RSA, 2000) enforces the culture of community participation in municipalities. This is regarded as the platform for the community to engage in the affairs of the municipality. The South African government documented policies that guide community participation, and these include the Constitution of 1996, Municipal Systems Act of 2000, Municipal Structures Act of 1998, Municipal Finance Management Act of 2003 and the Intergovernmental Relations Framework Act of 2005. SPLUMA (RSA, 2013), an Act that is related to spatial planning and land use management also emphasise that community participation is crucial. In this instance, community participation relates to good administration as the development principle. Good administration states that all policies, legislation and all-planning processes must inform and empower the community. Also, it promotes the coordination of all spheres of government so that there is an integrated approach to spatial planning and land use management. Good administration promotes transparency in community participation, and it is also inclusive on the preparations and amendment of the spatial plans, land use schemes and the procedures undertaken in development applications (SPLUMA, 2013).
In the MMM planning projects, the interviewees indicated that the municipality has a policy on community participation which provides the procedure for effective participation. The main challenge is that community participation remains the issue of compliance when it comes to other projects undertaken by the municipality. It is further stated that most planning projects are outsourced to the consultants who are sometimes not familiar with the area. Even though these policy documents provide procedural guidelines for community participation, the literature suggested that guidelines should include mechanisms to be used for community participation, creative ways for effective community participation which will suit the nature of the municipalities, and ways on how the community inputs should be structured in order to strengthen the planning process (Human et al., 2009). In addition, to improve the level of community participation, different innovative techniques such as crowdsourcing can be implemented by the municipality.
4.2 Theme 2: Absence of robust frameworks for improved levels of community participation In the planning domain, community members form part of the planning processes and decision-making. SPLUMA (RSA, 2013), which is related to spatial planning and land use management promote community participation as a form of empowerment for the community members. Hassan, Hefnawi and Refaie (2011) proposed the following strategies that can be used in the participation process, both at the international and national level: (i) implementing small projects that will be provided during the preparatory phase of the project; (ii) formulating budgeting workshops which will assist the citizens with better opportunities for accessing the services, this can be done through the strategy formulation phase; (iii) conducting workshops that will enhance the learning capacity of the participants; and (iv) sustaining communication channels by allocating more time and resources for all stakeholders. These strategies will enhance transparency, and partnership between stakeholders and decision-making can be implemented with team effort (Hassan et al., 2011). From the interviews, in most cases, community participation is not done, community members are only informed of the development. One of the interviewees indicated that this impacts negatively because educational awareness is not done for the community. Public notices, in terms of the advertising the land use application, are used, but they do not mean anything to the community. The by-laws of the municipality include different activities for
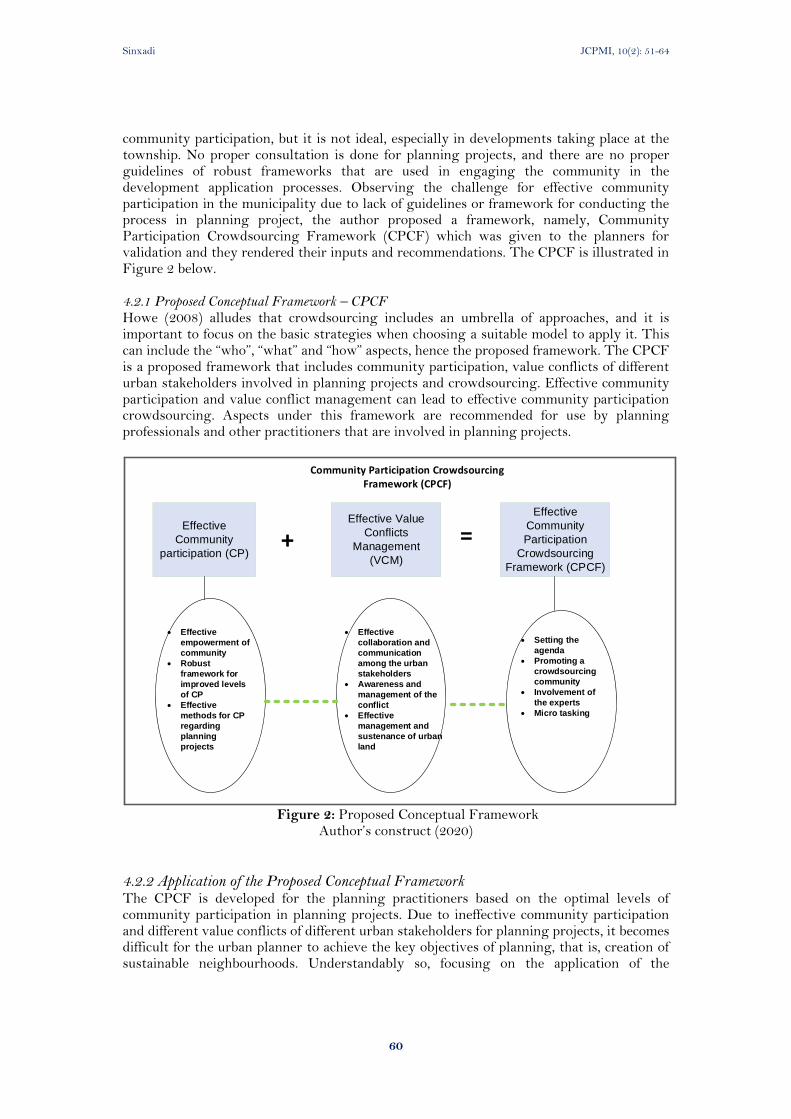
Sinxadi JCPMI, 10(2): 51-64
60
community participation, but it is not ideal, especially in developments taking place at the township. No proper consultation is done for planning projects, and there are no proper guidelines of robust frameworks that are used in engaging the community in the development application processes. Observing the challenge for effective community participation in the municipality due to lack of guidelines or framework for conducting the process in planning project, the author proposed a framework, namely, Community Participation Crowdsourcing Framework (CPCF) which was given to the planners for validation and they rendered their inputs and recommendations. The CPCF is illustrated in Figure 2 below. 4.2.1 Proposed Conceptual Framework – CPCF Howe (2008) alludes that crowdsourcing includes an umbrella of approaches, and it is important to focus on the basic strategies when choosing a suitable model to apply it. This can include the “who”, “what” and “how” aspects, hence the proposed framework. The CPCF is a proposed framework that includes community participation, value conflicts of different urban stakeholders involved in planning projects and crowdsourcing. Effective community participation and value conflict management can lead to effective community participation crowdsourcing. Aspects under this framework are recommended for use by planning professionals and other practitioners that are involved in planning projects.
Effective
Community
participation (CP)
Effective Value
Conflicts
Management
(VCM)
Effective
Community
Participation
Crowdsourcing
Framework (CPCF)
• Effective
empowerment of
community
• Robust
framework for
improved levels
of CP
• Effective
methods for CP
regarding
planning
projects
• Effective
collaboration and
communication
among the urban
stakeholders
• Awareness and
management of the
conflict
• Effective
management and
sustenance of urban
land
• Setting the
agenda
• Promoting a
crowdsourcing
community
• Involvement of
the experts
• Micro tasking
+ =
Community Participation Crowdsourcing Framework (CPCF)
Figure 2: Proposed Conceptual Framework
Author’s construct (2020) 4.2.2 Application of the Proposed Conceptual Framework The CPCF is developed for the planning practitioners based on the optimal levels of community participation in planning projects. Due to ineffective community participation and different value conflicts of different urban stakeholders for planning projects, it becomes difficult for the urban planner to achieve the key objectives of planning, that is, creation of sustainable neighbourhoods. Understandably so, focusing on the application of the
Sinxadi JCPMI, 10(2): 51-64
61
framework, there are implications and limitations as the framework might not be implemented immediately, but rather to integrate the framework with the Capability Maturity Model that has been used in carrying out projects in different disciplines such as engineering and construction, amongst a few. The idea of connecting community participation and crowdsourcing in planning projects is to decentralise decision-making where the community is involved in assisting in solving problems, generate ideas and data and have their voice heard. Crowdsourcing represents a more inclusive form of governance as it incorporated different urban stakeholders. When the community members are involved in planning projects through crowdsourcing, new opportunities for urban planners are created. Furthermore, the credibility of the use of crowdsourcing in urban planning projects is crucial because inaccurate information can impact negatively on the projects. The methods or techniques to be used for effective crowdsourcing process includes agenda setting, encouraging the community to be involved in decision making, the involvement of the experts and micro-tasking. Setting the agenda in crowdsourcing process, the community must prioritise their challenges, and this will help them to be engaged in what they are interested in and will enhance participation. Their ongoing engagement will, therefore encourage the crowdsourcing community as the community will be working on what interests them. At this stage, the urban planner would have gained the trust of the community, and this can extend to the engagement of more people. In addition, an urban planner must be ready to respond quickly to the questions asked and provide feedback. This will therefore encourage the participation on the platform. With micro-tasking, large tasks are divided into small tasks, Wikipedia can be utilised to add information to create a database of information.
4.2.3 Validation of the framework An interview protocol designed by the researcher was sent by email to the eleven (11) research participants. The protocol outlined the relationship between community participation, value conflict management and crowdsourcing. The participants were requested to indicate if these factors are imperative for effective community participation through crowdsourcing in planning projects. Also, the participants were required to make a contribution based on their responses, including the recommendations. Planning practitioners from the public and private sector institutions were the selected urban stakeholders for framework validation. Selection of the participants was based on the experience, expertise, roles and responsibilities in land use management applications. From the responses, all participants agreed that the three concepts of CPCF are imperative for effective community participation through crowdsourcing in planning projects. For effective implementation of the framework, the respondents rendered the following contributions: (i) The introduction of a framework specifically for community participation would be
valuable for the planning field, especially one that deliberates on empowering participants and other stakeholders to decide on issues to be addressed as well as giving them decision making power.
(ii) The community choices, decision-making power and proper implementation of the decisions taken can promote participation in planning projects.
(iii) Sense of ownership within the community is crucial. It establishes the satisfactory level of the participant. Evaluation of the urban stakeholder satisfaction levels in relation to the CP process must be taken into consideration.
(iv) Review of legislation to promote accountability and management. The framework must be applied as a planning tool instead of serving as compliance in planning projects.
(v) The involvement of all urban stakeholders involved in the planning will unlock the citizen’s creativity and use of power to solve problems encountered in land-use projects.
Sinxadi JCPMI, 10(2): 51-64
62
(vi) For successful implementation, communities must be trained on the process of crowdsourcing. Access to resources for implementation or engagement of the community must be taken into account.
(vii) The effective use of the framework will allow flexibility and break up the routine of traditional ways of CP.
(viii) In implementing the framework, a strong working relationship amongst all the urban stakeholders must be promoted, and the evidence of expanded networks plays a crucial role in planning.
5. CONCLUSION AND RECOMMENDATION Community participation and crowdsourcing can be implemented in planning projects. These processes involve the different urban stakeholders who are experts and non-experts in urban planning. The study sets out to explore different Crowdsourcing techniques to be employed in Mangaung to enable urban stakeholders’ participation in planning projects Again, the focus is on the effective implementation of the proposed framework (CPCF) by different urban stakeholders in planning projects. The framework was validated by professional planners from both private and public sector institutions. The findings confirmed that the planners understand the proposed framework and its application during the CP processes. However, they rendered contributions to the framework, which will assist both the planner and the community. From their inputs, it was suggested that a strong working relationship between all the urban stakeholders would ensure effective implementation of the framework. Emphasis was the involvement of the community in decision-making and ensuring that there is an implementation based on the decisions taken with the community. Legislation has to be reviewed to avoid compliance by planners. It is expected that the study’s findings hold immense implications for planning practitioners as well as other professionals and policymakers working within the urban planning and socio-
economic development praxes both within the province and beyond. 6. REFERENCES Aitamurto, T., Landemore, H., and Saldivar Galli, J. (2017). Unmasking the crowd:
participants’ motivation factors, expectations, and profile in a crowdsourced law reform. Information, Communication and Society, 20(8), 1239–1260.
Aitken, M. (2010). A three-dimensional view of public participation in Scottish land use planning: Empowerment or social control? Planning Theory. University of Edinburgh. UK. Sage.
Alexander, E. (2008). Public participation in planning – A multidimensional model: The case of Israel. Planning Theory and Practice, 9(1), 57-80.
Arnstein, S.R. (1969). A ladder of citizen participation. Journal of the American institute of Planners, 35(4), 216-224.
Bernard, H. R., Ryan, G. W. (2010). Analysing qualitative data: Systematic approaches. California. SAGE Publications. Incorporated.
Brabham, D.C. (2009). Crowdsourcing the public participation process for the planning projects. Planning Theory. 8(3), 242-262.
Brabham, D. C. (2013). Using Crowdsourcing in Government. IBM Center for the Business of Government.
Campbell, L. (2016). Stepping back: understanding cites and their systems. In: ALNAP Working Paper. ALNAP/ODI, London.
Carmona, M., De Magalhães, C., Edwards, M. (2002). Stakeholder views on value and urban design. J. Urban Design. 7(2), 145–169.
Sinxadi JCPMI, 10(2): 51-64
63
Creswell, J.W., Poth, C.N. (2018). Qualitative Inquiry and Research Design: Choosing among the Five Approaches (4th ed). Thousand Oaks, CA: Sage.
Delitheou, V. Bakogiannis, E and Kyriakidis, C. (2019). Urban planning: integrating smart applications to promote community engagement. Heliyon. 5, 1-8. e01672.
Ertiö, T. (2015). Participatory Apps for urban planning – Space for improvement. Planning Practice and Research. 30(3).
Filho, W.L., Skanavis, C., Kounani, A., Brandli, L.L., Shiel, C., Do Paco, A., Pace P., Mifsud, M., Beynaghi, A., Price, E., Salvia, A.L., Will, M. and Shula, K. (2019). The role of planning in implementing sustainable development in a higher education context. Journal of Cleaner Production, 235:678-687.
Haltofova, B. (2018). Using Crowdsourcing to support civic engagement in strategic urban development planning: A Case of Ostrava. Czech Republic. Journal of Competitiveness. 10 (1), 85-103.
Hassan, G.F., Hefnawi, A.E. and Refaie, M.E. (2011). Efficiency of participation in planning. World Pumps, 50(2), 203-212.
Hossain, M. and Kauranen, I. (2015). Crowdsourcing: A comprehensive literature review. Strategic Outsourcing: An International Journal. 8(1), 2-22.
Howe, J. (2008). Crowdsourcing: How the power of the crowd is driving the future of the business. New York: Crown.
Human, F., Marais, L. and Botes, L. (2009). Missing the boat? Community participation in the integrated development planning process in the Free State, South Africa. Journal for Development Support, 1,1-32.
Innes, J.E and Booher, D. (2004). Reframing public participation: strategies for the 21st century. Planning Theory and Practice, 5(4), 419-436.
Ismail, W.A.W and Said, I. (2015). Integrating the community in urban design and planning of public spaces: A review in Malaysian cities. Procedia – Social and Behavioural Sciences, 168:357-364.
Konsti-Laakso, S. and Rantaal, T. (2018). Managing community engagement: A process model for urban planning. European Journal of Operational Research, 268: 1040-1049.
Lalicic, L. and Önder, I. (2018). Residents’ involvement in urban tourism planning: Opportunities from the smart city perspective. Sustainability, 10(1852),1-16. doi:10.3390/su10061852.
Lane, M. (2005). Public participation in Planning: an intellectual history. Australian Geographer. 36: 283-299.
Liao, P., Wan, Y., Tang,P., Wu, C., Hu, y. and Zhang, S. (2019). Applying crowdsourcing techniques in urban planning: A bibliometric analysi of research and practice prospects. Cities, 94, 33-43.
Mafukidze, J.K. and Hoosen, F. (2009). Housing shortages in South Africa: A discussion of the after-effects of community participation in housing provision in Diepkloof. Urban Forum. 20:379-396.
Mahjabeen, Z., Shrestha, K.K. and Dee, J.A. (2009). Rethinking community participation in urban planning: The role of disadvantaged groups in Sydney Metropolitan Strategy. Australasian Journal of Regional Studies, 15(1), 45-63.
Mangaung Metropolitan Municipality (2017). Integrated Development Plan 2017/18. Bloemfontein
Mathur, V.N., Price, A.D.F, Austin, S.A., and Moobela, C. (2007). Defining, identifying and mapping stakeholders in the assessment of urban sustainability. In: International Conference on Whole Life Urban Sustainability and Its Assessment, Glasgow.
Mueller, J., Lu, H., Chirkin, A., Klein, B., and Schmitt, G. (2018). Citizen design science: A strategy for crowd-creative urban design. Cities, 72, 181–188.
Nguyen, C., Tahmasbi, N., de Vreede, T., de Vreede, G. J., Oh, O., and Reiter-Palmon, R. (2016). A Definition of Community Crowdsourcing Engagement and Application. In
Sinxadi JCPMI, 10(2): 51-64
64
Blurring the Boundaries Through Digital Innovation. Springer International Publishing. 283-296.
Peng, J., Zhu, Y., Shu, W., Wu, M.Y. (2016). When data contributors meet multiple crowdsourcers: Bilateral competition in mobile crowdsourcing. Computer Networks. 95:1-14.
RSA (Republic of South Africa) (1996). Constitution of the Republic of South Africa. Cape Town: Government Gazette.
RSA (Republic of South Africa) (2000). Municipal Systems Act, Act 32 of 2000. RSA (Republic of South Africa) (2013). Spatial Planning and Land Use Management Act, Act
16 of 2013. Department of Rural Development and Land Reform, Pretoria. RSA (Republic of South Africa) (2014). Guide on public participation in the public service.
Department of Public Service and Administration. Pretoria. Schenk, E., and Guittard, C. (2011). Towards a characterisation of crowdsourcing practices.
Journal of Innovation Economics and Management, 0(1), 93–107. http://dx.doi.org/10.3917/ jie.007.0093.
Shuib, K.B., Hashim, H and Nasir, N.A.M. (2015). Community Participation Strategies in Planning for Urban Parks. Procedia – Social and Behavioural Sciences. 168: 311-320.
UN-Habitat. (2015). Capacity-building-in-new-urban-agenda-HABITAT-III Nairobi. Walker, D.H.T., Bourne, L., and Rowlinson, S.M. (2008).: Stakeholders and the supply chain.
In: Walker, D.H.T., Bourne, L., and Rowlinson, S.M. (eds.) Procurement Systems: A Cross Industry Project Management Perspective. Taylor and Francis, Oxford/New York.
Wamsler, C. (2016). From Risk Governance to City–Citizen Collaboration: Capitalising on individual adaptation to climate change. Environmental Policy and Governance, 26(3), 184– 204.
Wilson, K., Hannington, S. and Stephen, M. (2015). The Role of community participation in planning processes of emerging urban centres. A study of Paidha town in Northern Uganda. International Refereed Journal of Engineering and Science (IRJES), 4(6):61-71.
Zhao, Y., and Zhu, Q. (2014). Evaluation on crowdsourcing research: Current status and future direction. Information Systems Frontiers, 16(3), 417–434.
Journal of Construction Project Management and Innovation, 10 (2): 65-78, 2020
ISSN 2223-7852 © Sustainable Human Settlement and Construction Research Centre DOI: https://doi.org/10.36615/jcpmi.v10i2.319
65
STRATEGIC ALLIANCE IN THE CONSTRUCTION INDUSTRY: BARRIERS FACING ITS
IMPLEMENTATION IN AN EMERGING MARKET
Funmilayo Iyabo BODUNDE1, Ebunoluwa Bimbola AKINRATA2*, Ayodeji
Emmanuel OKE1, Ayotunde BABALOLA1
1Department of Quantity surveying, Federal University of Technology Akure,
Nigeria 2Department of Quantity surveying, Ahmadu Bello University Zaria, Nigeria
Email: [email protected]*
ABSTRACT Construction firms over the world involve in Strategy Alliance (SA) in order to achieve efficient time-cost-quality relationship during construction process through knowledge sharing, team culture and risk management with one another. Despite the numerous benefits gained, there are still various barriers facing it in the developing world. This paper is aimed at analysing the current level of awareness and barrier facing SA procurement method in the building industry in an emerging market (EM) using Nigeria as a case study, to profound future steps in avoiding these barriers and to encourage maximum implementation in the construction industry. A survey design was employed in evaluating the level of awareness of SA and barriers facing its adoption in building industry. Construction professionals in Nigeria were examined through a well-structured questionnaire. Mean Item Score and Factor Analysis were utilized in evaluating data gathered on the current barriers to SA procurement method in the construction industry. It was revealed from the study that the awareness level of SA procurement method within the industry amongst construction professionals is moderately high. This indicates that the barrier facing SA procurement method is not the issue of awareness but of willingness to adopt it. It was also established from the study that fear and trust issue, lack of strategic planning toward alliance, inadequate knowledge about alliance and, different in cultural values were the major component barriers facing strategic alliance procurement method. The study shows the true reflection of the current barriers facing the adoption of SA procurement methods in the developing country and notable points in this study can be largely recommended to promote strategic alliance partnership among construction firms the Nigerian construction industry and other emerging economy countries were building projects are carried out in the same approach, style and method. Keywords: Strategic Alliance, Partnership, Barrier, Professional, Factor analysis, Construction industry.
1. INTRODUCTION There has been a lot of discussions for a long period of time among stakeholders in the construction sector on ways in improving the workforce, increasing performance and productivity (Burke and Morley 2016). This brings about the introduction of various inter-organization partnership within the construction industry, which makes the familiar pattern of one company doing everything in its own right outdated. The requisite technology, financial and competitive skills, sources of sharing in the global construction market (workmanships, machinery, equipment, and more) made many construction firms enter into
Bodunde et al., JCPMI, 10(2): 65-78
66
relationships to compete with other firms. For over five decades now, this interactive contracting approaches like joint venture, partnering, relationship management and Strategic Alliance (SA) have been gaining momentum in the construction industry. According to Howarth, Gillin and Bailey (1995), “strategic alliance is a co-operative arrangement between two or more organizations that forms part of, is consistent with their overall strategy, and contributes to the achievement of their major goals and objectives”. In most of the developing countries, SA method of procurement operates in the construction industry through companies working together to increase their complementary capacity to execute heavy, complex and risky (Ngowi, 2007). As stated by Nielsen and Neergaard (2018), SA occurs mostly in some cases where costs/risks are too high to become feasible for a company to bear. Furthermore, inter-organization partnership, such as SA has become essential tools for business administration in the building sector, particularly in dynamic and rapidly changing environments and, in enhancing competitiveness ability of companies. It has contributed to bridging the gaps between the existing company resources and its future expectations (Burke and Morley, 2016).
Various forms of strategic alliances have been adopted globally as a joint tactic among several organizations (Andersson and Görgulu, 2014). In an Emerging Market (EM), alliance has become vital strategic manoeuvres in the building industry, which is formed with the intent of achieving innovation, knowledge and, utilizing a prequalified pool of other contractors to achieve a certain goal. According to Faems and Van Looy (2003), construction companies tend to involve in SA in order to improve over time in sharing knowledge, team culture and, risk management. As stated by Van den Berg and Kamminga (2006), SA procurement process is an excellent way of achieving efficient time-cost-quality relationship during the construction process. Furthermore, it offers construction firms with several advantages such as; exposure to new events and innovations, complementary tools, markets and emerging developments, which in turn improve the capacity of the company to research, take advantage of economies of scale, share risks and externalize different operations in the value chain (Gulati, 2007). In addition, the construction projects under SA management get a mutual vision, procurement efficiencies and early participation of contractors.
Despite the global advantage of SA adoption in the construction industry, Ofori (2000) stated that the industry is still facing a wide range of problems due to inadequate implementation of projects in developing countries. In a bid to solve these problems, Burke and Morley (2016) suggested that construction companies need good administration, different procurement method, resources, skills and healthy alliance (within and outside the construction industry) for successful delivery. With the adoption of a strategic partnership in the construction sector, these resources and capability needed can be easily acquired. According to Tavallaei, Hosseinalipour and Mohebifar, (2017), the implementation of strategic alliances in the construction industry in the developing world has been facing various difficulties over the last decade. This seeks for an investigation to SA procurement method in the construction industry in an Emerging Market (EM), in order to provide an update on the current level of awareness of SA procurement method and the current barriers facing its implementation. On this basis, the paper aims to evaluate the awareness level and barriers to the adoption of strategic alliance procurement method in the construction industry using Nigeria as a case study, with a view to develop potential steps to overcome these obstacles. Consequently, this study reflects a true representation of barriers facing strategic alliance in a developing world, and recommendations from the study will be useful in fostering strategic partnership in Nigeria and other developing countries where construction activities are being carried out using a similar method, strategy and style.
2. REVIEW OF RELATED LITERATURE According to Tavallaei et al. (2017), strategic alliance is a type of cooperation networks which can be described as a kind of contract arrangement were partners invest their resources for
Bodunde et al., JCPMI, 10(2): 65-78
67
a limited period of time to achieve their mutual objectives and goals. This was buttressed by
(Išoraitė, 2009) that SA is a cooperative arrangement between two or more organizations for one specific business operation so that each company can benefit from the strengths of the other to achieve competitive advantage. Most of the time, strategic alliance works like a joint
venture, but an alliance always involves competitors and has a shorter lifetime (Išoraitė, 2009). In strategic alliances, managing partnership/alliance may be greatly affected by each of the partners’ commitment, and although not only via participation, partners are expected to involved technically and financially (Nguyen, 2019). According to Van den Berg and Kamminga (2006), the establishment of strategic alliances was seen as responding to globalization, growing market instability and complexity. Nurullah et al. (2012) was able to proposed a strategic alliance conceptual model that provides the holistic approach that focuses on the dimensions of the procedures, using various models and approaches to alliances. The model proposed contains the following elements: top management; preparation; intellectual foundations that support the strategic alliance field; Partner selection, team integration and assessment of alliance objectives; Pre-evaluation; Analysis and assessment of the alliance's mutual needs and requirements. Adopting this model in the construction industry, especially in an emerging market will help in minimizing various barriers been faced when entering into strategic alliance.
Akiner and Yitmen (2011) submitted that contractors in the construction industry combine forces together to form SA, so as to build on each other complimentary work and capabilities. This happens when the risk is too high to be viable for one construction firm. Ngowi (2007) opined that the subsequent globalization, together with the exceedingly fragmented and disruptive nature of construction, has forced the industry in seeking for management approaches such as strategic alliances, in order to build on the abilities and strength of different construction participants in achieving its goals. According to Chang and Hsin (2006), many international firms have several alliances with local firms to shape global partnerships. Although implementing strategic alliances in the construction industry have addressed opportunities for knowledge management and learning (Grant and Baden-Fuller, (2004) and Ingirige and Sexton, (2006)), strategic alliances have been widely debated since the interim cooperation has developed into an essential factor for creating competitive advantage globally (Xu, 2005). Studies that focus on the level of adoption and barriers facing its full implementation in the construction sector, especially in an emerging market economy country are still scanty. 2.1 Reasons for Strategic Alliance Several works of literature have highlighted the various reason for adopting a strategic alliance. As for Akiner and Yitmen (2011), the growth opportunity is one of the key reasons why many companies adopted strategic alliance, which allow business activities to develop faster than normal by using its distribution networks in combination with the advantage of a good brand image with other companies in alliance. Stanek (2004) summited that most organizations form collaborations (SA) to develop, open up new markets, resolve local market constraints, and to share mutual benefit & risk. Fitzpatrick and Dilullo, (2005) opined that productive alliances bring forth innovation, open communication, trust, interdependence, engagement, cooperation, alignment of goals and joint solution of the problem for the companies involved. In addition, Mills, Nalewaik, and Davis (2016) argued that sharing skills (distribution, marketing and management), products, customer awareness, technological expertise and assets contributes to a synergistic impact, leading to a pool of resources more precious than separate single resources in the business concerned. According to Raue and Wieland (2015), the key reasons for strategic alliance were creativity, cost and exposure to capital, direct accessibility to target markets, economies of scale and competitive gain.
Bodunde et al., JCPMI, 10(2): 65-78
68
2.2 Some Barriers facing strategic alliance Based on the recent literature on the rudiments that might hinder strategic alliances in building industry among developing countries (Holt, Love and Li, (2000); Yi Wei, (2007); Andersson and Görgulu, (2014); Zamir, Sahar and Zafar, (2014); and Nielsen and Neergaard, (2018)). It is clear that there are some reflections that stand out, which is the challenge in choosing the right partner when entry into strategic alliance (John, 2011). The very first step of choosing a partner starts the challenge to strategic alliance faced by companies involves. Choosing the wrong partner will be detrimental to any alliance. As stated by Grant and Baden-Fuller (2004), an alliance has no basis to build on without a certain degree of confidence and integrity, and once the parties involve is disintegrated, SA will become an history. So, it is crucial for all parties entering an alliance to clearly and concisely identify their expectations. Burke and Morley (2016) indicated that lack of adequate knowledge and proper evaluation are challenges been faced in strategic alliance, it is necessary to know when to re-evaluate the alliance and adjust the structure in order to ensure that a commercial relationship continues to support both sides. Both companies involve in alliance must realize that change is inevitable and over time, they must cooperate in order to reach new agreements. Other barriers are distrust of ownership and control issues (Bamford and Ernst, (2005); loss of Opportunity cost (Burke and Morley (2016); resistance to change (Bamford and Ernst (2002a); uneven alliance; fear of undisclosed agendas (Raue and Wieland (2015); risk of sharing proprietary information; fear of future mergers (Fitzpatrick and Dilullo, 2005); staff turnover; trust issues and ego (Bamford and Ernst, 2002b); managing the alliance (Artto and Kujala, 2008).
3. RESEARCH METHODOLOGY This paper aims to identify obstacles to the strategic alliance procurement method in construction performance in the developing world, in order to profound possible measures to prevent these barriers and increase its adoption. This study was carried out in Nigeria, and the respondents were gathered from the six states of the southwestern zones in the country. Southwestern states were chosen because the zone has the highest level of construction activities in Nigeria. A survey approach was adopted in this study; professionals like Builders, Architects, Quantity Surveyors (QS) and Civil Engineers that are unswervingly involved in the construction activities were sampled. Information about these professionals was collected from their respective organizational bodies. According to the state chapters of construction professionals as at December 2019, five thousand four hundred and five (5405) professionals from organizations in the construction industry both contracting and consulting firms in five states in Southwestern part of Nigeria which are Lagos, Oyo, Ondo, Osun and Ekiti States. The required sample size from this sample frame was derived by means of a demographic formula by Yamane (1967). Total numbers of 401 respondents were sampled after using formula. The sample size for this study was determined using these formulae;
n = 𝑵
𝟏+𝑵(𝒆)𝟐 Eq. 1
Where n = Sample size N= Number of respondents e = 10% level of precision which is + 10%. (Yamane, 1967)
Four hundred (401) copies of the questionnaires were sent to the respondents, and three hundred and sixty-three (363) valid response were retrieved back from them. Based on this result, the response rate for the questionnaire was approximately 91 per cent, which is
Bodunde et al., JCPMI, 10(2): 65-78
69
certainly appropriate for analysis. The questionnaires were self-administered through hand-to-hand and online, while the collection of data covered four months and three weeks. For the purpose of this study convenience sampling was used as a procedure for selecting a sample from the entire population in such a way that every member of the population has a chance in selecting the sample.
For this study, a structured questionnaire was used as a research instrument. The questionnaire was built based on information gathered from the literature review. This questionnaire was prepared in sections, with the first part designed to gather information about the respondent's background. While the second section dealt with barriers facing strategic alliance procurement method in the construction industry. A pilot analysis performed to pre-test the information gathered from the literature review. It was accomplished by randomly dispatching twelve questionnaires to some selected construction professionals (both academia and experienced) for face validity, and the outcome of the pilot test/ Face validity was used in updating the final draft questionnaire. This was carried in line with Sushil and Verma (2010) suggestion that the authenticity of the face validity should be checked by qualified experts who will review the material content to verify if the items are relevant. Ultimately, 20 out of 28 identified barriers facing strategic alliance were considered face accurate for the final questionnaire.
Frequency and percentage were used in analysing the respondents' background information (see table 1). For the second section of the research instrument, Mean Item Scores (MIS) and Factors Analysis (FA) were used in analysing the information gathered.
Furthermore, Cronbach’s α-test for this study was also carried out to assess the research instrument's reliability. This approach is done by measuring the questionnaire's reliability
across each field and the mean of the questionnaire's whole fields. Cronbach's α standard value scale ranges between 0 and 1, and the closer the value to 1, the greater the degree of
internal accuracy. The Cronbach’s α value for this study is 0.897; this indicated that the instrument used was remarkably accurate as the instrument's degree of reliability becomes more optimal, i.e., the value tends toward 1.
4. FINDINGS AND DISCUSSION 4.1 General information of respondents The result in Table 1 displayed the respondents' general information. The information was based on the respondents' background. Information obtained from this table provided a quality check to the data gotten from the respondents. Table 1 established that Quantity Surveyors and Architects that responded to the questionnaire represented 35.2% and 28.1% respectively. 16.5% were Builders, while 20.2% of respondents were Civil Engineers. This showed that the respondents were from all relevant construction professionals who are currently practising in their respective states. The data showed that all respondents were under their professional membership. 35.2% were a member of NIA, while 28.1% of respondents fall under the membership of NIQS. It was established that 20.2% of respondents were under the umbrella of NSE. Moreover, 14.8% were under NIOB, while 1.7% fall under other professionals not stated. The analysis of respondent’s category/grade of membership showed that 38%, 61.4%, 0.3% and 0.3% of respondents were probationers, Corporate/Associate members, fellows and others respectively. This means that the respondents were qualified to provide information on the subject of strategic alliance procurement method in the construction industry. Corporate/Associate members had the largest percentage because they are mostly active on site.
Table 1 showed that 3% and 12.7% of the respondents were polytechnic graduates who are OND and HND, respectively. The highest number of respondents were those with Bachelor Degree (B.tech & B.sc), which represented 65.6%. Moreover, 15.7% and 3% were M.sc/M.tech and PhD respectively. From the information on the academic qualifications of
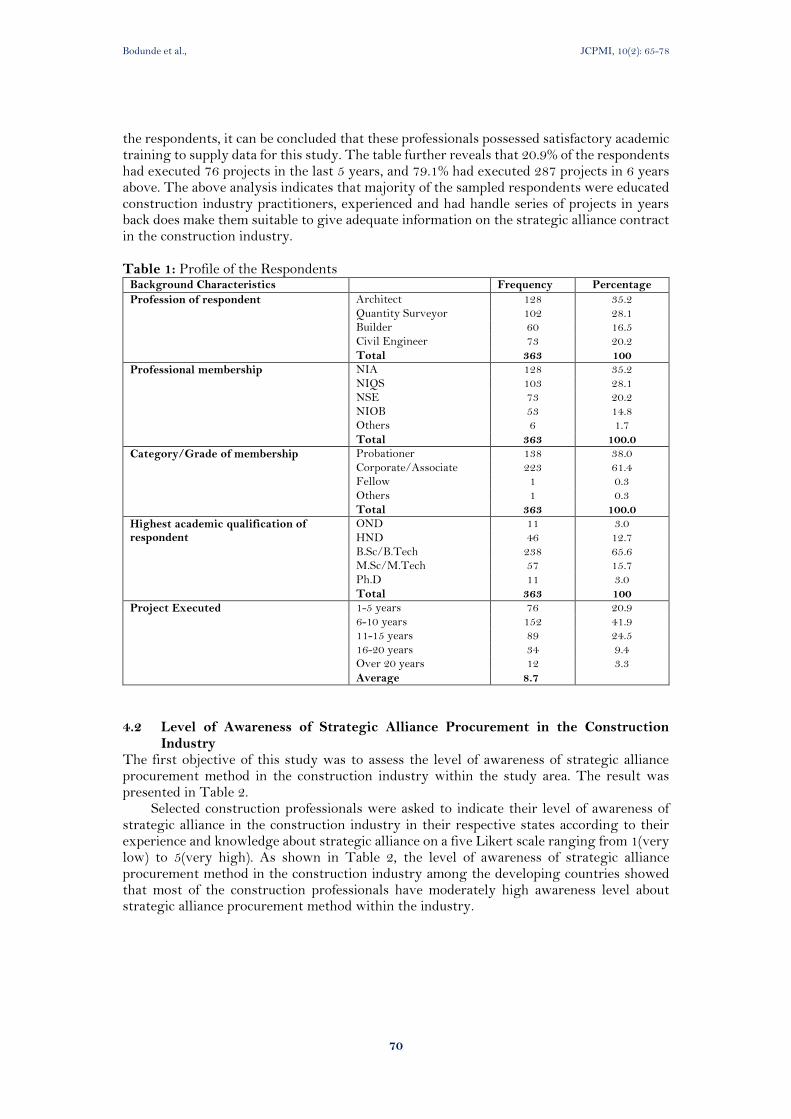
Bodunde et al., JCPMI, 10(2): 65-78
70
the respondents, it can be concluded that these professionals possessed satisfactory academic training to supply data for this study. The table further reveals that 20.9% of the respondents had executed 76 projects in the last 5 years, and 79.1% had executed 287 projects in 6 years above. The above analysis indicates that majority of the sampled respondents were educated construction industry practitioners, experienced and had handle series of projects in years back does make them suitable to give adequate information on the strategic alliance contract in the construction industry. Table 1: Profile of the Respondents
Background Characteristics Frequency Percentage
Profession of respondent
Architect 128 35.2
Quantity Surveyor 102 28.1 Builder 60 16.5
Civil Engineer 73 20.2
Total 363 100
Professional membership NIA 128 35.2
NIQS 103 28.1 NSE 73 20.2
NIOB 53 14.8 Others 6 1.7
Total 363 100.0
Category/Grade of membership Probationer 138 38.0
Corporate/Associate 223 61.4 Fellow 1 0.3
Others 1 0.3
Total 363 100.0
Highest academic qualification of respondent
OND 11 3.0
HND 46 12.7
B.Sc/B.Tech 238 65.6 M.Sc/M.Tech 57 15.7
Ph.D 11 3.0
Total 363 100
Project Executed 1-5 years 76 20.9 6-10 years 152 41.9 11-15 years 89 24.5
16-20 years 34 9.4 Over 20 years 12 3.3
Average 8.7
4.2 Level of Awareness of Strategic Alliance Procurement in the Construction
Industry The first objective of this study was to assess the level of awareness of strategic alliance procurement method in the construction industry within the study area. The result was presented in Table 2.
Selected construction professionals were asked to indicate their level of awareness of strategic alliance in the construction industry in their respective states according to their experience and knowledge about strategic alliance on a five Likert scale ranging from 1(very low) to 5(very high). As shown in Table 2, the level of awareness of strategic alliance procurement method in the construction industry among the developing countries showed that most of the construction professionals have moderately high awareness level about strategic alliance procurement method within the industry.
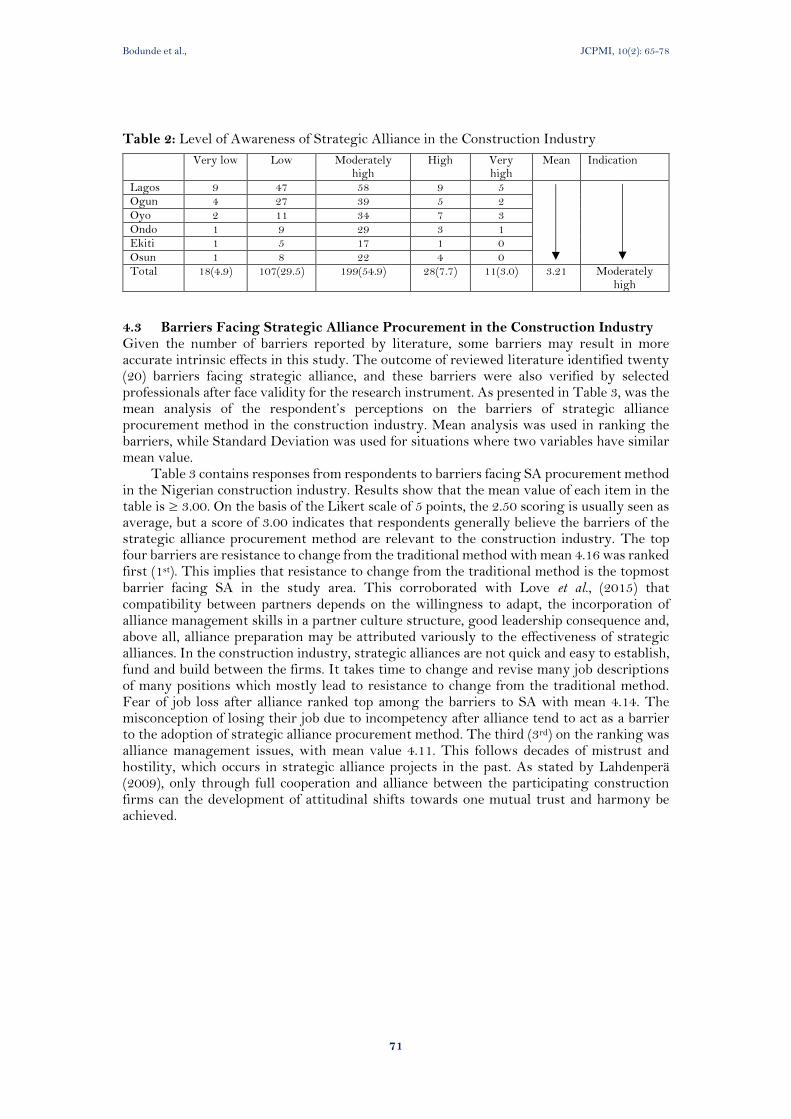
Bodunde et al., JCPMI, 10(2): 65-78
71
Table 2: Level of Awareness of Strategic Alliance in the Construction Industry
4.3 Barriers Facing Strategic Alliance Procurement in the Construction Industry Given the number of barriers reported by literature, some barriers may result in more accurate intrinsic effects in this study. The outcome of reviewed literature identified twenty (20) barriers facing strategic alliance, and these barriers were also verified by selected professionals after face validity for the research instrument. As presented in Table 3, was the mean analysis of the respondent’s perceptions on the barriers of strategic alliance procurement method in the construction industry. Mean analysis was used in ranking the barriers, while Standard Deviation was used for situations where two variables have similar mean value.
Table 3 contains responses from respondents to barriers facing SA procurement method in the Nigerian construction industry. Results show that the mean value of each item in the table is ≥ 3.00. On the basis of the Likert scale of 5 points, the 2.50 scoring is usually seen as average, but a score of 3.00 indicates that respondents generally believe the barriers of the strategic alliance procurement method are relevant to the construction industry. The top four barriers are resistance to change from the traditional method with mean 4.16 was ranked first (1st). This implies that resistance to change from the traditional method is the topmost barrier facing SA in the study area. This corroborated with Love et al., (2015) that compatibility between partners depends on the willingness to adapt, the incorporation of alliance management skills in a partner culture structure, good leadership consequence and, above all, alliance preparation may be attributed variously to the effectiveness of strategic alliances. In the construction industry, strategic alliances are not quick and easy to establish, fund and build between the firms. It takes time to change and revise many job descriptions of many positions which mostly lead to resistance to change from the traditional method. Fear of job loss after alliance ranked top among the barriers to SA with mean 4.14. The misconception of losing their job due to incompetency after alliance tend to act as a barrier to the adoption of strategic alliance procurement method. The third (3rd) on the ranking was alliance management issues, with mean value 4.11. This follows decades of mistrust and hostility, which occurs in strategic alliance projects in the past. As stated by Lahdenperä (2009), only through full cooperation and alliance between the participating construction firms can the development of attitudinal shifts towards one mutual trust and harmony be achieved.
Very low Low Moderately high
High Very high
Mean Indication
Lagos 9 47 58 9 5 Ogun 4 27 39 5 2
Oyo 2 11 34 7 3
Ondo 1 9 29 3 1 Ekiti 1 5 17 1 0
Osun 1 8 22 4 0 Total 18(4.9) 107(29.5) 199(54.9) 28(7.7) 11(3.0) 3.21 Moderately
high
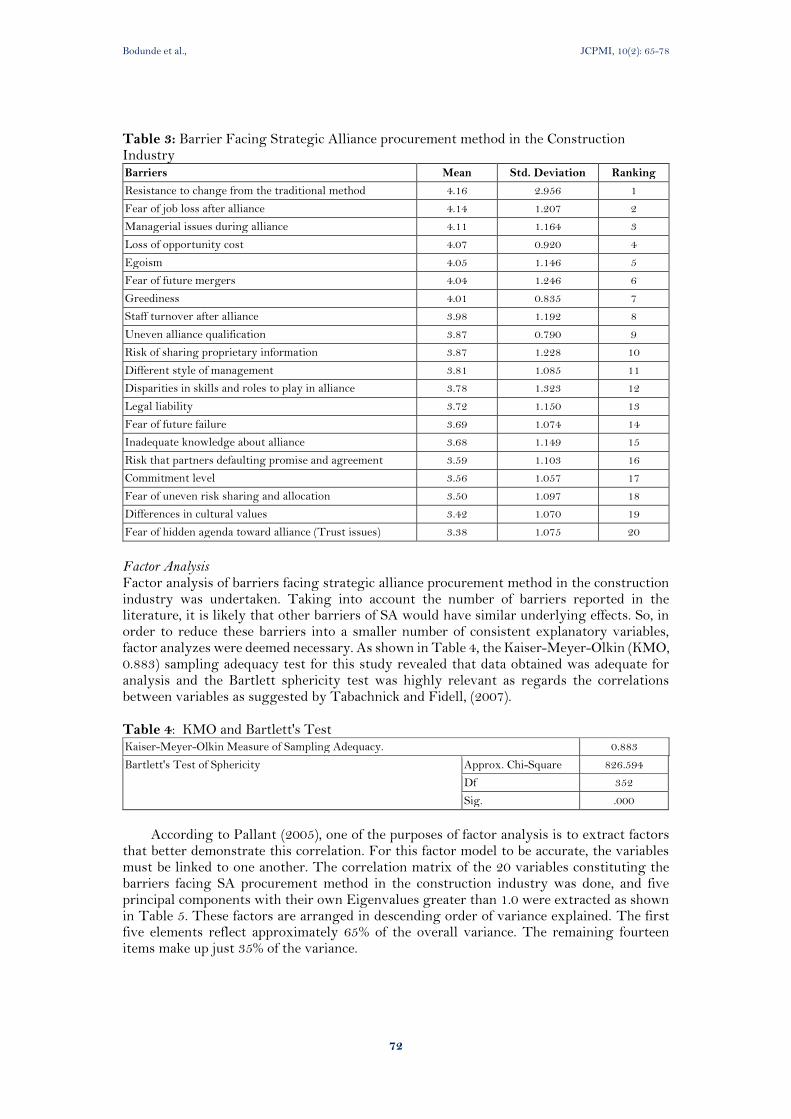
Bodunde et al., JCPMI, 10(2): 65-78
72
Table 3: Barrier Facing Strategic Alliance procurement method in the Construction Industry Barriers Mean Std. Deviation Ranking
Resistance to change from the traditional method 4.16 2.956 1
Fear of job loss after alliance 4.14 1.207 2
Managerial issues during alliance 4.11 1.164 3
Loss of opportunity cost 4.07 0.920 4
Egoism 4.05 1.146 5
Fear of future mergers 4.04 1.246 6
Greediness 4.01 0.835 7
Staff turnover after alliance 3.98 1.192 8
Uneven alliance qualification 3.87 0.790 9
Risk of sharing proprietary information 3.87 1.228 10
Different style of management 3.81 1.085 11
Disparities in skills and roles to play in alliance 3.78 1.323 12
Legal liability 3.72 1.150 13
Fear of future failure 3.69 1.074 14
Inadequate knowledge about alliance 3.68 1.149 15
Risk that partners defaulting promise and agreement 3.59 1.103 16
Commitment level 3.56 1.057 17
Fear of uneven risk sharing and allocation 3.50 1.097 18
Differences in cultural values 3.42 1.070 19
Fear of hidden agenda toward alliance (Trust issues) 3.38 1.075 20
Factor Analysis Factor analysis of barriers facing strategic alliance procurement method in the construction industry was undertaken. Taking into account the number of barriers reported in the literature, it is likely that other barriers of SA would have similar underlying effects. So, in order to reduce these barriers into a smaller number of consistent explanatory variables, factor analyzes were deemed necessary. As shown in Table 4, the Kaiser-Meyer-Olkin (KMO, 0.883) sampling adequacy test for this study revealed that data obtained was adequate for analysis and the Bartlett sphericity test was highly relevant as regards the correlations between variables as suggested by Tabachnick and Fidell, (2007). Table 4: KMO and Bartlett's Test Kaiser-Meyer-Olkin Measure of Sampling Adequacy. 0.883
Bartlett's Test of Sphericity Approx. Chi-Square 826.594
Df 352
Sig. .000
According to Pallant (2005), one of the purposes of factor analysis is to extract factors
that better demonstrate this correlation. For this factor model to be accurate, the variables must be linked to one another. The correlation matrix of the 20 variables constituting the barriers facing SA procurement method in the construction industry was done, and five principal components with their own Eigenvalues greater than 1.0 were extracted as shown in Table 5. These factors are arranged in descending order of variance explained. The first five elements reflect approximately 65% of the overall variance. The remaining fourteen items make up just 35% of the variance.
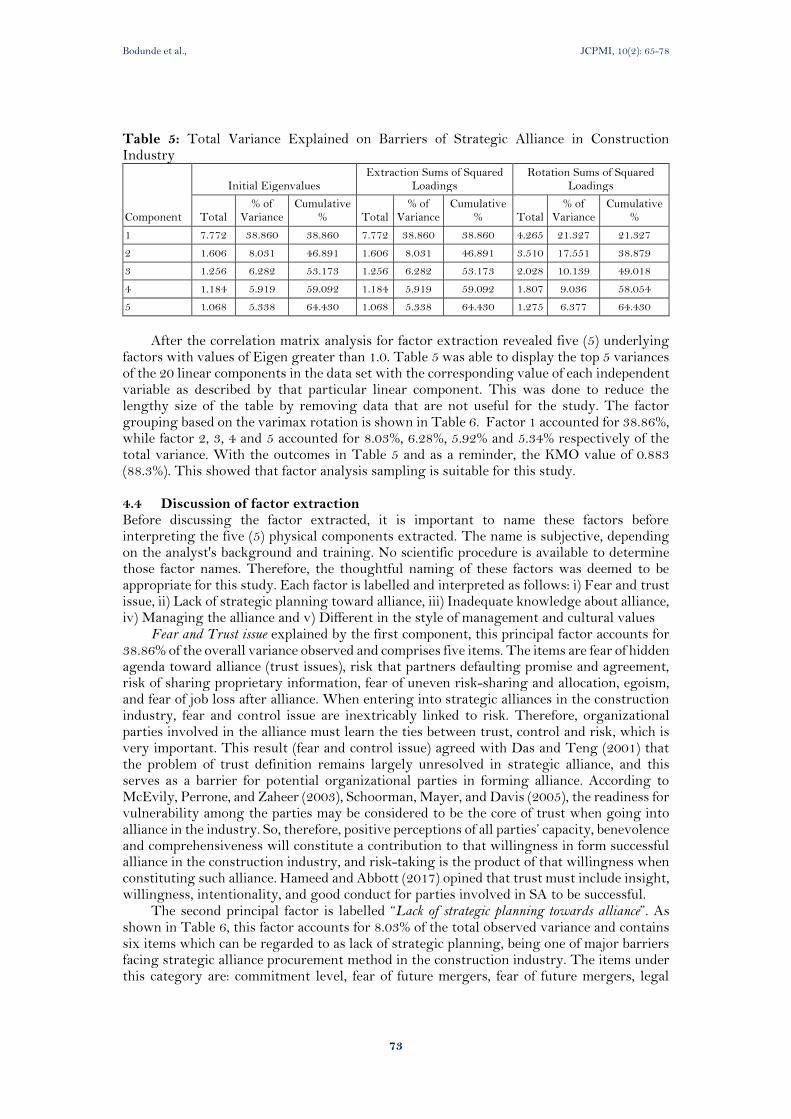
Bodunde et al., JCPMI, 10(2): 65-78
73
Table 5: Total Variance Explained on Barriers of Strategic Alliance in Construction Industry
Component
Initial Eigenvalues Extraction Sums of Squared
Loadings Rotation Sums of Squared
Loadings
Total % of
Variance Cumulative
% Total % of
Variance Cumulative
% Total % of
Variance Cumulative
%
1 7.772 38.860 38.860 7.772 38.860 38.860 4.265 21.327 21.327
2 1.606 8.031 46.891 1.606 8.031 46.891 3.510 17.551 38.879
3 1.256 6.282 53.173 1.256 6.282 53.173 2.028 10.139 49.018
4 1.184 5.919 59.092 1.184 5.919 59.092 1.807 9.036 58.054
5 1.068 5.338 64.430 1.068 5.338 64.430 1.275 6.377 64.430
After the correlation matrix analysis for factor extraction revealed five (5) underlying
factors with values of Eigen greater than 1.0. Table 5 was able to display the top 5 variances of the 20 linear components in the data set with the corresponding value of each independent variable as described by that particular linear component. This was done to reduce the lengthy size of the table by removing data that are not useful for the study. The factor grouping based on the varimax rotation is shown in Table 6. Factor 1 accounted for 38.86%, while factor 2, 3, 4 and 5 accounted for 8.03%, 6.28%, 5.92% and 5.34% respectively of the total variance. With the outcomes in Table 5 and as a reminder, the KMO value of 0.883 (88.3%). This showed that factor analysis sampling is suitable for this study.
4.4 Discussion of factor extraction Before discussing the factor extracted, it is important to name these factors before interpreting the five (5) physical components extracted. The name is subjective, depending on the analyst's background and training. No scientific procedure is available to determine those factor names. Therefore, the thoughtful naming of these factors was deemed to be appropriate for this study. Each factor is labelled and interpreted as follows: i) Fear and trust issue, ii) Lack of strategic planning toward alliance, iii) Inadequate knowledge about alliance, iv) Managing the alliance and v) Different in the style of management and cultural values
Fear and Trust issue explained by the first component, this principal factor accounts for 38.86% of the overall variance observed and comprises five items. The items are fear of hidden agenda toward alliance (trust issues), risk that partners defaulting promise and agreement, risk of sharing proprietary information, fear of uneven risk-sharing and allocation, egoism, and fear of job loss after alliance. When entering into strategic alliances in the construction industry, fear and control issue are inextricably linked to risk. Therefore, organizational parties involved in the alliance must learn the ties between trust, control and risk, which is very important. This result (fear and control issue) agreed with Das and Teng (2001) that the problem of trust definition remains largely unresolved in strategic alliance, and this serves as a barrier for potential organizational parties in forming alliance. According to McEvily, Perrone, and Zaheer (2003), Schoorman, Mayer, and Davis (2005), the readiness for vulnerability among the parties may be considered to be the core of trust when going into alliance in the industry. So, therefore, positive perceptions of all parties’ capacity, benevolence and comprehensiveness will constitute a contribution to that willingness in form successful alliance in the construction industry, and risk-taking is the product of that willingness when constituting such alliance. Hameed and Abbott (2017) opined that trust must include insight, willingness, intentionality, and good conduct for parties involved in SA to be successful.
The second principal factor is labelled “Lack of strategic planning towards alliance”. As shown in Table 6, this factor accounts for 8.03% of the total observed variance and contains six items which can be regarded to as lack of strategic planning, being one of major barriers facing strategic alliance procurement method in the construction industry. The items under this category are: commitment level, fear of future mergers, fear of future mergers, legal
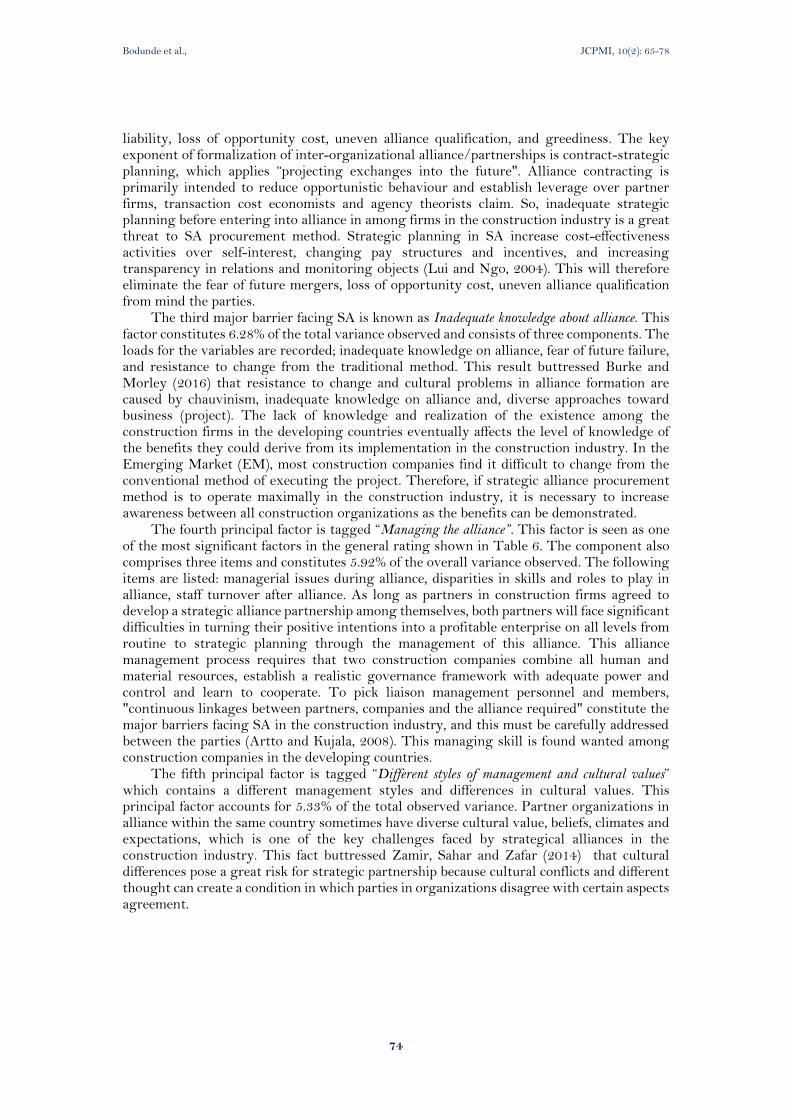
Bodunde et al., JCPMI, 10(2): 65-78
74
liability, loss of opportunity cost, uneven alliance qualification, and greediness. The key exponent of formalization of inter-organizational alliance/partnerships is contract-strategic planning, which applies “projecting exchanges into the future". Alliance contracting is primarily intended to reduce opportunistic behaviour and establish leverage over partner firms, transaction cost economists and agency theorists claim. So, inadequate strategic planning before entering into alliance in among firms in the construction industry is a great threat to SA procurement method. Strategic planning in SA increase cost-effectiveness activities over self-interest, changing pay structures and incentives, and increasing transparency in relations and monitoring objects (Lui and Ngo, 2004). This will therefore eliminate the fear of future mergers, loss of opportunity cost, uneven alliance qualification from mind the parties.
The third major barrier facing SA is known as Inadequate knowledge about alliance. This factor constitutes 6.28% of the total variance observed and consists of three components. The loads for the variables are recorded; inadequate knowledge on alliance, fear of future failure, and resistance to change from the traditional method. This result buttressed Burke and Morley (2016) that resistance to change and cultural problems in alliance formation are caused by chauvinism, inadequate knowledge on alliance and, diverse approaches toward business (project). The lack of knowledge and realization of the existence among the construction firms in the developing countries eventually affects the level of knowledge of the benefits they could derive from its implementation in the construction industry. In the Emerging Market (EM), most construction companies find it difficult to change from the conventional method of executing the project. Therefore, if strategic alliance procurement method is to operate maximally in the construction industry, it is necessary to increase awareness between all construction organizations as the benefits can be demonstrated.
The fourth principal factor is tagged “Managing the alliance”. This factor is seen as one of the most significant factors in the general rating shown in Table 6. The component also comprises three items and constitutes 5.92% of the overall variance observed. The following items are listed: managerial issues during alliance, disparities in skills and roles to play in alliance, staff turnover after alliance. As long as partners in construction firms agreed to develop a strategic alliance partnership among themselves, both partners will face significant difficulties in turning their positive intentions into a profitable enterprise on all levels from routine to strategic planning through the management of this alliance. This alliance management process requires that two construction companies combine all human and material resources, establish a realistic governance framework with adequate power and control and learn to cooperate. To pick liaison management personnel and members, "continuous linkages between partners, companies and the alliance required" constitute the major barriers facing SA in the construction industry, and this must be carefully addressed between the parties (Artto and Kujala, 2008). This managing skill is found wanted among construction companies in the developing countries.
The fifth principal factor is tagged “Different styles of management and cultural values” which contains a different management styles and differences in cultural values. This principal factor accounts for 5.33% of the total observed variance. Partner organizations in alliance within the same country sometimes have diverse cultural value, beliefs, climates and expectations, which is one of the key challenges faced by strategical alliances in the construction industry. This fact buttressed Zamir, Sahar and Zafar (2014) that cultural differences pose a great risk for strategic partnership because cultural conflicts and different thought can create a condition in which parties in organizations disagree with certain aspects agreement.
Bodunde et al., JCPMI, 10(2): 65-78
75
Table 6: Rotated Component Matrix on Barriers of Strategic Alliance in the Construction Industry Component Factors
Barriers 1 2 3 4 5
1) Fear and trust issue
Fear of hidden agenda toward alliance (Trust issues)
0.868
Risk that partners defaulting promise and agreement
0.795
Risk of sharing proprietary information 0.772
Fear of uneven risk sharing and allocation 0.714
Egoism 0.619
Fear of job loss after alliance 0.544
2) Lack of strategic planning toward alliance
Commitment level 0.796
Fear of future mergers 0.689
Legal liability 0.672
Loss of opportunity cost
0.593
Uneven alliance qualification
0.536
Greediness 0.514
3) Inadequate knowledge about alliance
Inadequate knowledge about alliance 0.780
Fear of future failure 0.705
Resistance to change from the traditional method 0.422
4) Managing the alliance
Managerial issues during alliance 0.818
Disparities in skills and roles to play in alliance 0.705
Staff turnover after alliance 0.469
5) Different styles of management and cultural values
Different style of management 0.916
Different in cultural values 0.535
5. CONCLUSION AND RECOMMENDATIONS In the construction industry, entering into a Strategic alliance involves more than just the accomplishment of mutual goals or associates that benefit directly. Strategic alliance adds value to constructing firm's corporate social capital by ensuring exposure to a broad variety of available assets and services managed by representatives of the strategic alliance network. Despite the potential benefits to be gained when construction firms involved in strategic alliance, there are still various barriers facing it in the developing world. This paper was able to assess the awareness level and barriers to the adoption of strategic alliance in the construction industry using Nigeria as a case study. Survey method was fully embraced in the study, using a questionnaire in gathering information from the construction professionals. From the findings, it was discovered that the level of awareness of strategic alliance procurement method among construction professionals is moderately high, which indicated that most construction stakeholders in Nigeria know more about strategic alliance. Therefore, the challenges facing strategic alliance in the construction industry in the developing world is not the awareness/knowledge level, but the commitment of construction firms to enforce it among themselves. Positive perceptions towards SA and willingness to
Bodunde et al., JCPMI, 10(2): 65-78
76
embrace it within the construction sector will be a great mechanism to SA implementation in the developing world.
Findings revealed that resistance to change from the traditional method, fear of job loss after alliance and managerial issues during alliance were the most notable barriers facing strategic alliance procurement method in the construction industry. Almost all identified barriers in the literature were agreed by the professionals to be barriers facing strategic alliance in the construction industry in an emerging market. From factor analysis outcome, the barriers were clustered under the following five labels, namely fear and trust issue, lack of strategic planning toward alliance, inadequate knowledge about alliance, managing the alliance, and different in style of management and cultural values as the major component barriers facing SA in the construction industry. A key barrier in all the factors that were analyzed is inadequate knowledge about alliance. Realization of SA existence among the construction organizations affects the level of knowledge and benefits they could derive from its implementation in the construction industry. Therefore, stakeholders in the construction industry need to be well enlightened through conferences, seminars and workshops on how to embrace various forms of alliance within and outside the industry. This research was mainly limited to Nigeria, as the data provided for this study were predominantly from the country. Similar studies can also be fully extended to other developing countries. More so, different measures may be studied in promoting and adoption SA in the building industry, especially by making reference to countries where the exercise has been fully adopted. Further studies can also examine the structural and organizational influence in adopting strategic alliance.
Furthermore, this study recommended that strategy orientation of both construction partners coming to any alliance must be aligned towards a common objective and vision. Also, individual must be ready to strictly adhere with the regulations and rules guiding the alliance. Furthermore, when its required to ensure openness and a better understanding of rift, the structure and form of sharing for profit and financial report should be developed to prevent the fissure and lack of confidence among both the parties. Construction companies in an emerging market have many opportunities to leverage on the knowledge, resources, and skills of other organizations they alliance with through inter-organization agreements even outside the construction industry. So, full implementation of strategic alliance among construction companies and even outside the sector will be a great advantage in exposure to new events and innovations, complementary tools. This will improve the capacity of the company to research, share risks and externalization of different operations. These recommendations will be useful in encouraging SA implementation in Nigeria, and other countries in the developing world with similar approach in project execution.
6. REFERENCE Akiner, I. and Yitmen, I., (2011). International Strategic Alliances in Construction:
Performances of Turkish Contracting Firms. in Proc. Management and Innovation for a Sustainable Built Environment Conference, Amsterdam, The Netherlands, June 2011, pp. 20-23
Andersson, M., and Görgulu, I. (2014). Strategic Partnering Relationships in the Swedish Construction Industry - Overview And Case Studies On Structures For Learning. Master’s Thesis E2014:069 submitted to Department of Technology Management and Economics Division of Service Management, Chalmers University Of Technology Göteborg, Sweden 2014.
Artto, K. and Kujala, J. (2008). Project Business as a Research Field. International Journal of Managing Projects in Business. 1(4), 469–497
Bamford, James and Ernst, David (2002). Managing an Alliance Portfolio. McKinsey Quarterly, 3, 28-39.
Bodunde et al., JCPMI, 10(2): 65-78
77
Bamford, James and Ernst, David (2002). Measuring Alliance Performance. McKinsey Quarterly, 5, 5-17.
Bamford, James and Ernst, David (2005). Governing Joint Ventures: Better over- sight isn’t just for Wholly Owned Businesses. Mckinsey Quarterly, Special Edition, pp. 62-69.
Burke, C.M and Morley, M.J (2016). On Temporary Organizations: A Review, Synthesis a Research Agenda. Human Relations 69(6), 1235–1258
Chang, W and Hsin, J (2006). The Study of the Motivation and Performance of the Incubators’ Strategic Alliances: Strategic Groups Perspective. Journal of American Academy of Business, Cambridge, 8(2), 126-133
Faems, D. and Van Looy, B. (2003). The role of Inter-Organizational Collaboration within Innovation Strategies: Towards a portfolio approach’, Working Paper Steunpunt OOI. pp. 1-12
Fitzpatrick, W and Dilullo, S (2005). Strategic Alliances and the Management of Intellectual Properties: The Art of the Contract. SAM Advanced Management Journal, 70 (3), 38-45.
Grant, R and Baden-Fuller, C (2004). A Knowledge Accessing Theory of Strategic Alliances. Journal of Management Studies, 41(1), 61-84
Gulati, R. (2007). Managing Network Resources: Alliances, Affiliations, and Other Relational Assets, Oxford University Press, Oxford.
Hameed, W., and Abbott, C. (2017). Critical review of the success factors of strategic alliances in the UK construction industry. Conference or Workshop Item.
Hitt, M; Ahlstrom, D; Dacin, M; Levitas, E and Svobodina, L (2004). The Institutional Effects on Strategic Alliance Partner Selection in Transition Economies: China Vs. Russia, Organization Science, 15(2), 173-185
Holt, G., Love, P. and Li, H. (2000). The Learning Organisation: Toward a Paradigm for Mutually Beneficial Strategic Construction Alliances. International Journal of Project Management, 18, 415-421.
Howarth, C.S, Gillin, M. and Bailey, J. (1995). Strategic Alliances: Resource-sharing Strategies for Smart Companies’, Australia: Pearson Professional (Australia) Pty. Ltd.
Ingirige, B., and Sexton, M. (2006). Alliances in Construction: Investigating Initiatives and Barriers for long-term Collaboration. Engineering, Construction and Architectural Management, 13(5), 521–535
Išoraitė, M. (2009). Importance of Strategic Alliances in Company’s Activity. Intellectual Economics, 1(5), 39–46.
Lahdenperä, P. (2009). Project alliance the competitive single target-cost approach. In VTT Tiedotteita - Valtion Teknillinen Tutkimuskeskus.
Love P., Huang J., and Edwards D., (2004). Nurturing a Learning Organization in Construction: A focus on Strategic Shift, Organizational Transformation, Customer Orientation and Quality Centered Learning. Construction Innovation. 4, 113–126
Lui and Ngo (2004). The Role of Trust and Contractual Safeguards on Cooperation and Non-Equity Alliances. Journal of Management. 30, 471– 485.
Mills, A., Nalewaik, A., and Davis, P. (2016). Identifying Cultures in Construction Project Alliances. PAQS 2016, Christchurch, New Zealand.
Ngowi, A. (2007). The role of trustworthiness in the formation and governance of construction alliances. Building and Environment, 42(4), 1828–1835.
Nguyen, N. (2019). Performance Evaluation in Strategic Alliances : A Case of Vietnamese Construction Industry. Global Journal of Flexible Systems Management, 1-16
Nielsen, L. and Neergaard, P. (2018). Value Creation from Strategic Partnerships Between Companies and NGOs. Developments in Corporate Governance and Responsibility, 24, 3–12.
Bodunde et al., JCPMI, 10(2): 65-78
78
Nurullah G., Alayoglu, N., and Oyku, N. (2012). A Conceptual Model Proposal for Determinants, Form, Functions and Structure Choice in Strategic Alliances. Procedia - Social and Behavioral Sciences. 58, 1594-1600.
Ofori, G. (2000). Globalization and Construction Industry Development: research opportunities. Construction Management and Economics.18, 257-262
Pallant, J. (2005), SPSS Survival Manual: A Step-by-Step Guide to Data Analysis Using SPSS for Windows (Version 12), 2nd ed., Allen & Unwin, Crows Nest NSW.
Pekkinen L (2010). Risk Management in Project Network. In: Aramo-Immonen H, Naaranoja M and Toikka T (eds) Project knowledge sharing arena. Project Management Association Finland (PMAF) in collaboration with University Consortium of Pori (UCP) and University of Applied Sciences in Vaasa (VAMK), Espoo, Finland: 84–100
Pekuri A, Haapasalo H and Herrala M (2011). Productivity and Performance Management— Managerial Practices in the Construction Industry. International Journal of Performance Measurement. 1(1), 39–58
Schoorman, F. D., Mayer, R. C., and Davis, J. H. (2005). An Integrative Model of Organizational Trust: Past, Present and Future. Academy of Management Review. 32, 344-354.
Stanek M.B. (2004), Measuring Alliance Value and Risk: A Model Approach to Prioritising Alliance Projects, Management Decision. 42 (2), 182–204
Sushil, S. and Verma, N. (2010). Questionnaire validation made easy. European Journal of Scientific Research. 46(2), 172-178
Tavallaei, R., Hosseinalipour, M., and Mohebifar, A. (2017). 08-Key Factors Affecting Learning through Construction Industry’s International Strategic Alliances. Journal of Applied Environmental and Biological Sciences. 7 (7), 80–90.
Van den Berg, M. and Kamminga, P. (2006). Optimising Contracting for Alliances in Infrastructure Projects. International Construction Law Review. 23, 59–77.
Xu, T., Bower, D. A., and Smith, N. J. (2005). Types of collaboration between foreign contractors and their Chinese partners. International Journal. Project Management. 23(1), 45–55
Yi Wei (2007). Factors influencing the success of virtual cooperation within Dutch – Chinese strategic alliances. Doctoral dissertation, University of twente,
Zamir, Z., Sahar, A., and Zafar, F. (2014). Strategic alliances; a comparative analysis of successful alliances in large and medium scale enterprises around the world. Educational Research International, 3(1), 25–39. Retrieved from http://www.erint.savap.org.pk/PDF/Vol.3(1)/ERInt.2014(3.1-03).pdf