Embed Size (px)
Citation preview

Volume 8, Issue 12, December 2020
International Journal of Innovative Research in Computer and Communication Engineering
| e-ISSN: 2320-9801, p-ISSN: 2320-9798| www.ijircce.com | |Impact Factor: 7.488 |
|| Volume 8, Issue 12, December 2020 ||
| DOI: 10.15680/IJIRCCE.2020.0812006 |
IJIRCCE©2020 | An ISO 9001:2008 Certified Journal | 4576
An Online Internet Traffic Monitoring System
Using Spark Stream Allam Sireesha, V.S.V. Harika
PG Student, Dept. of C.S.E., Brahmaiah college of Engineering, North Rajupalem , Nellore, Andhra Pradesh, India
Associate Professor, Dept. of C.S.E., Brahmaiah college of Engineering, North Rajupalem , Nellore, Andhra Pradesh,
India
ABSTRACT: The development of applications for advanced Intelligent Transportation Systems (ITS), is a growing
research area, pushed especially by the need to mitigate problems related to transportation inefficiency, overuse and
pollution, mainly caused by the increasing of traffic congestions in big cities. Nowadays, traffic related data coming
from the road infrastructure, user’s cars or mobile phones, is generated in unprecedent volume and speed. Therefore,
ITS face new challenges, with respect to growing demand to process large volumes of traffic data in real-time, and
extract value that can be immediately used for decision making. The work presented here, proposes a scalable
architecture supported by Big Data technologies, capable of processing real-time traffic data captured from 349
inductive loop counters, placed in Slovenian road network. The main goal is to propose an approach which can be
adopted by national road operators, capable of monitoring, in real-time, the current status of the road network. Traffic
events need to be detected in real-time and require the collection of data from several fixed sensors. To deal with data
volume and velocity challenges, a data stream management system was used, able to collect traffic data that arrives and
process it on a continuous (24x7) basis. Results achieved, suggest that there’s a great advantage in the adoption of a
data stream management system, with respect to traditional database management systems, illustrated by practical
examples, providing quantitative metrics about data processing performance.
KEYWORDS: Intelligent Transportation Systems, Stream Analytics, Stream Processing, Traffic Management.
I.INTRODUCTION
Cities have to deal with several challenges regarding their transportation infrastructures due to the number of
people living and commuting in these areas on a daily basis. The United Nations project that, in 2030, the 63 most
populated cities will house at least 400 million people, which is an unprecedent number. Urban infrastructures and
services, were not designed to be used by such number of commuting people, whether we address public transports or
roads infrastructures. The correlation of more population and more private vehicle usage, is a known catalytic agent to
contribute to traffic congestions, and consequently, increase traffic accidents and more CO2 emissions into the
environment. Hence, also capable of affecting the overall public health, by diminishing air quality, which is easily
perceived in heavy traffic areas. Besides contributing to economic losses associated with infrastructures´ costs and
hours spent in traffic jams that could be productive otherwise. These issues, are rapidly growing and need a paradigm
shift in the way cities are organized, as well as in people´s behaviour, in order to keep cities sustainable. Moreover,
since building more roads is no longer viable and sustainable as long run policy in many cities, there is a clear need to
find new ways to make a better use of existing infrastructures. Thus, it is necessary to support newtechnological
solutions and new transportation models that can help achieve more efficiency, and equally offer good convenience of
use to users, fitting their needs.
The transportation sector, aligned with the need to mitigate the problems stated above, is under a profound
transformation, pushed by the advances of several technological areas, either in hardware (e.g. sensing and wireless
communication capabilities) or software (Artificial Intelligence based on Machine Learning already used by
autonomous vehicles). These technologies have the possibility to change the way we see mobility nowadays and
between 2020 and 2030, as autonomous vehicles (AVs) become regulated by countries, is expected a consequential
disruption in transportation methods. This idea is supported by roadmaps that indicate future strength of a new market
that will explore electric, autonomous vehicles and shared rides, using business models based on “transport-as-a-
service” (TaaS). Such transformations in the transportation domain, should be capable of dropping transportation costs
International Journal of Innovative Research in Computer and Communication Engineering
| e-ISSN: 2320-9801, p-ISSN: 2320-9798| www.ijircce.com | |Impact Factor: 7.488 |
|| Volume 8, Issue 12, December 2020 ||
| DOI: 10.15680/IJIRCCE.2020.0812006 |
IJIRCCE©2020 | An ISO 9001:2008 Certified Journal | 4577
through cheaper maintenance and cheaper running costs, having a positive impact for families. Promoting in that way, a
paradigm shift in the way we look into transportation nowadays.
One major thing in common within technologies that soon can be in full use, such as autonomous cars or Vehicle to
Vehicle/Infrastructure (V2V,V2I) communication, and technologies already widely implemented in roads today (in-
roadway sensors like pneumatic road tubes, inductive loop detectors, piezoelectric sensors, along with over-roadway
sensors like infrared sensors and video cameras) is the generation of massive amounts of heterogeneous traffic related
data. Volume of data that can be even bigger if we consider all useful traffic related information created by cars, mobile
phones, users in social media or in traffic mobile applications. All this data represents an opportunity for data driven
application for Intelligent Transportation Systems (ITS), applications that can also be data providers toothers. One of
the upfront challenges is how to properly deal with this kind of data, commonly called Big Data. Characterized by its
overwhelming continuously rising Volume, Variety of data sources with structured or unstructured datasets that may
vary in Veracity (different data quality/ accuracy), Velocity of data collection and transmission, and finally Value,
referring to the extraction of information from datasets, which can be done by applying data analytics and data mining
tools. This kind of traffic related information can be extremely useful, namely to identify mobility pattern and
understand transportation network weaknesses, in order to road authorities take actions to improve efficiency. Other
advantageous applications, only possible through the availability of such data, are the ones for forecasting purposes,
where historical data can be used to train models that will predict how traffic will behave in the future, as in.
Information that can be applied, for instance, in transport infrastructure design, by predicting how drivers will behave if
any changes are introduced.
But before any data analysis is possible, all data generated from sensors must be cleaned, transformed and stored
efficiently. This process, named Extract, Transform, Load (ETL)] stage, is particularly challenging in terms of
computational resources, requiring the adoption of reliable Big Data technologies that can combine distributed and
parallel processing, together with Map Reduce algorithms. Big Data processing is classified in: Batch Processing: processes that normallyrun at certain place in time, normally scheduled or triggered by
something, dealing with big files/datasets in large volumes; Stream Processing: continuous processesthat deal with datasets produced at high velocity rates, requiring on the
fly transformations. Ideally processed near real-time.
II.RELATED WORK
aITS and Big Data are two recent, deeply intertwined research areas. In, authors present a review of ITS history and
ITS architecture, defining the utilization of multiple sources of traffic related data in ITS applications one of the main
challenges today. While Data Fusion and Data Mining are presented as both key technologies and bottlenecks.
There are several studies about the implementation of parallel and distributed in-memory technologies for stream
and batch processing in the ITS domain, as the way to deal with the great amount of heterogeneous data generated
nowadays, addressing issues such as scalability, data fusion, and good processing capabilities, as well as for data
analytics. More specifically, in, a platform to process structured and unstructured data to feed Smart Cities applications
is presented, using Hadoop, Apache Spark and Apache Storm for data processing. Kafka is the choice for data
ingestion. The work also shows benchmarks to assess technologies’ performance. The authors of, propose an approach
for automotive applications that includes machine learning libraries and reviews mainly the same technologies as the
previous authors, besides some others such as Spark
III.PROPOSED ALGORITHM
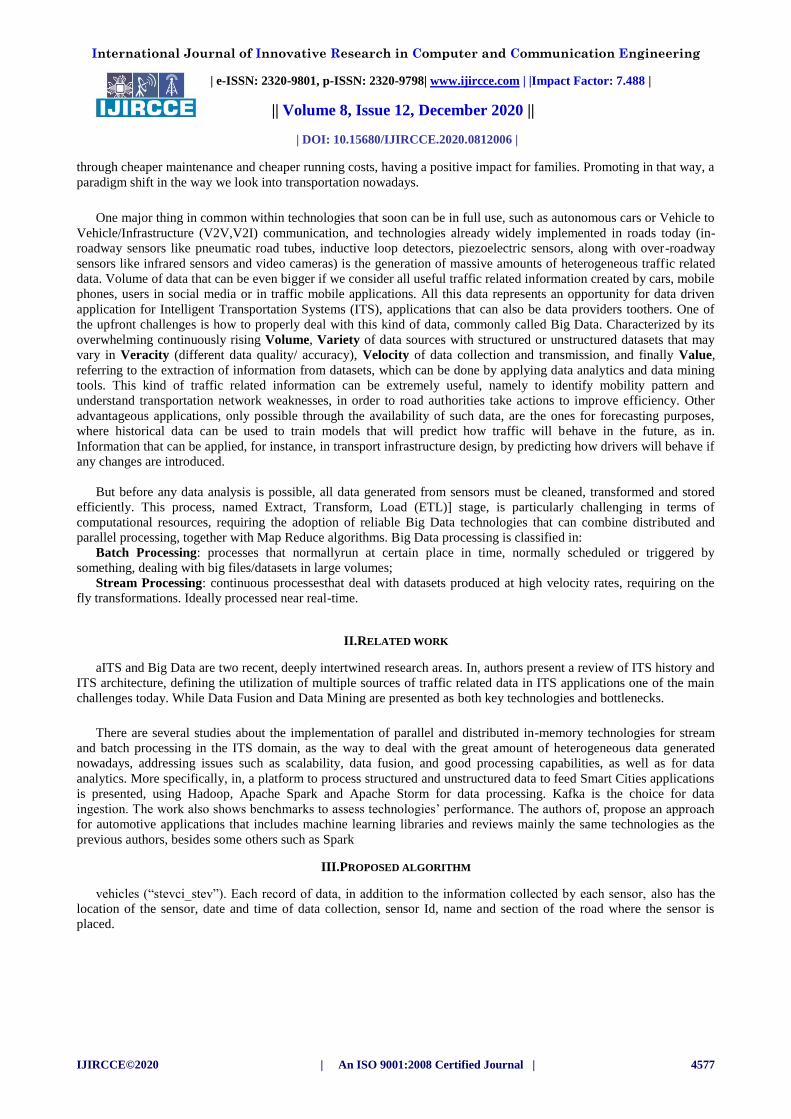
vehicles (“stevci_stev”). Each record of data, in addition to the information collected by each sensor, also has the location of the sensor, date and time of data collection, sensor Id, name and section of the road where the sensor is
placed.
International Journal of Innovative Research in Computer and Communication Engineering
| e-ISSN: 2320-9801, p-ISSN: 2320-9798| www.ijircce.com | |Impact Factor: 7.488 |
|| Volume 8, Issue 12, December 2020 ||
| DOI: 10.15680/IJIRCCE.2020.0812006 |
IJIRCCE©2020 | An ISO 9001:2008 Certified Journal | 4578
Fig. 2.Sample of one sensor´s data, for two lanes in the same direction.
The data collected and used for this study, corresponds to 17 months of loop data, from January 2016 to May 2017, making a total of 33 Gigabytes of data stored.
IV. METHODOLY
The methodology adopted to conduct the work was CRISP-DM (Cross Industry Standard Process for Data
Mining), which establish the principles for data-mining related projects, beingwell accepted by the scientific community. It can be synthesized in 6 steps: business understanding(i), data understanding(ii), data
preparation(iii),modeling(iv), evaluation(v), and finally deployment(vi). The sequence of steps is not strictly sequential,
it is rather recursive, where many times is necessary to revisit previous steps, altering and adapting the development if necessary.
In this case, business understanding and data understanding were especially important, since one of the objectives is
to deliver information that have somehow value for road operators, in order to use the information to improve
efficiency in the road network. Considering this, several studies on raw data were performed, such as: assess data
availability per sensor, assess data availability per month, study the behavior of average speed and occupancy during
weekdays or weekends, study the flow in different temporal aggregations, compare traffic flows in different
geographical areas, between others.
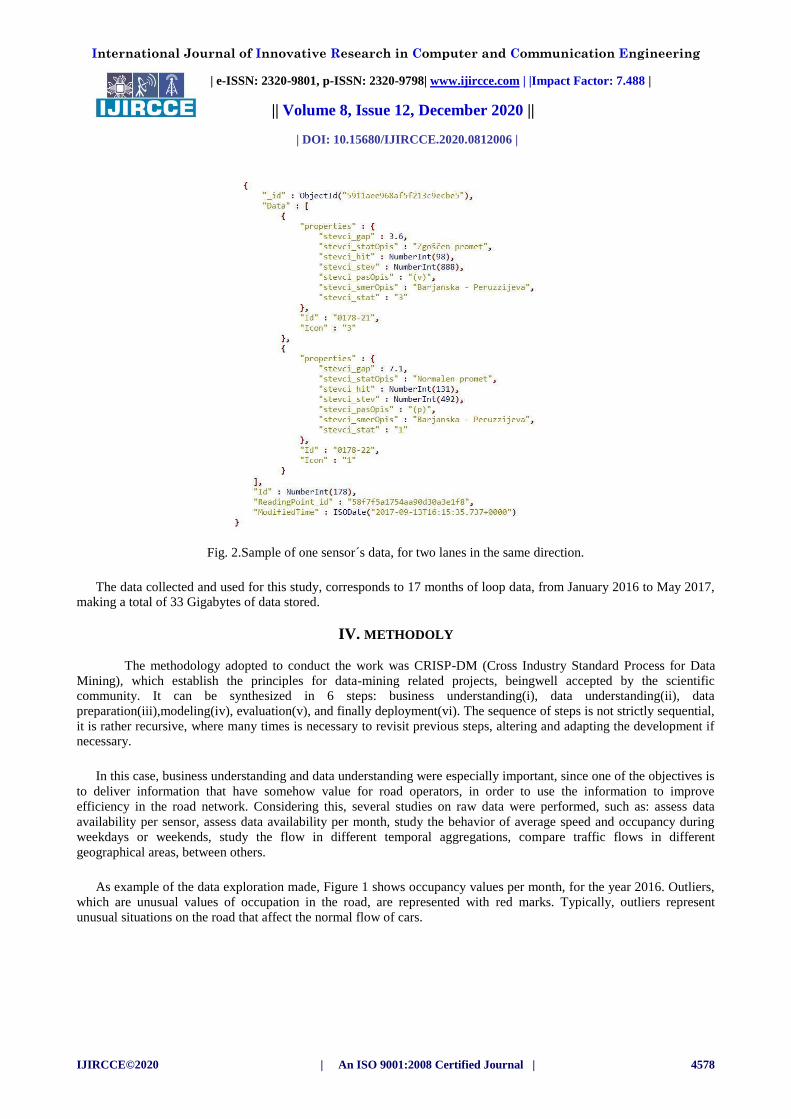
As example of the data exploration made, Figure 1 shows occupancy values per month, for the year 2016. Outliers,
which are unusual values of occupation in the road, are represented with red marks. Typically, outliers represent
unusual situations on the road that affect the normal flow of cars.
International Journal of Innovative Research in Computer and Communication Engineering
| e-ISSN: 2320-9801, p-ISSN: 2320-9798| www.ijircce.com | |Impact Factor: 7.488 |
|| Volume 8, Issue 12, December 2020 ||
| DOI: 10.15680/IJIRCCE.2020.0812006 |
IJIRCCE©2020 | An ISO 9001:2008 Certified Journal | 4579
Fig. 1.Box plot showing occupancy values, per month (January to December, left to right), for year 2016.
From the studies was possible to assess the importance of some variables regarding the application context.
Therefore, speed and occupancy values were the variables selected to serve as key performance indicators for traffic
monitoring in this first iteration of the system. Thereunder, a large part of the processing work is done on this data,
being also the two main outputs in the visualization component, either in simple or temporally aggregated metrics.
V.ARCHITECTURE
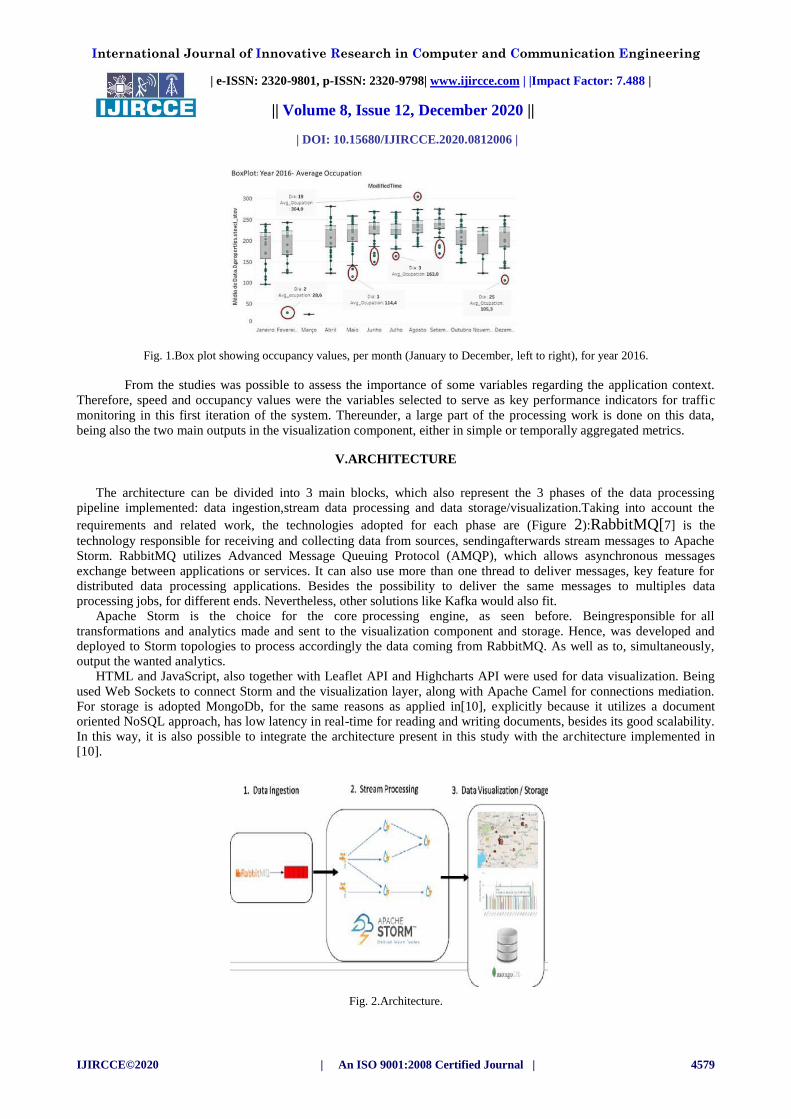
The architecture can be divided into 3 main blocks, which also represent the 3 phases of the data processing pipeline implemented: data ingestion,stream data processing and data storage/visualization.Taking into account the
requirements and related work, the technologies adopted for each phase are (Figure 2):RabbitMQ[7] is the
technology responsible for receiving and collecting data from sources, sendingafterwards stream messages to Apache Storm. RabbitMQ utilizes Advanced Message Queuing Protocol (AMQP), which allows asynchronous messages
exchange between applications or services. It can also use more than one thread to deliver messages, key feature for distributed data processing applications. Besides the possibility to deliver the same messages to multiples data processing jobs, for different ends. Nevertheless, other solutions like Kafka would also fit.
Apache Storm is the choice for the core processing engine, as seen before. Beingresponsible for all
transformations and analytics made and sent to the visualization component and storage. Hence, was developed and deployed to Storm topologies to process accordingly the data coming from RabbitMQ. As well as to, simultaneously, output the wanted analytics.
HTML and JavaScript, also together with Leaflet API and Highcharts API were used for data visualization. Being
used Web Sockets to connect Storm and the visualization layer, along with Apache Camel for connections mediation. For storage is adopted MongoDb, for the same reasons as applied in[10], explicitly because it utilizes a document oriented NoSQL approach, has low latency in real-time for reading and writing documents, besides its good scalability. In this way, it is also possible to integrate the architecture present in this study with the architecture implemented in [10].
Fig. 2.Architecture.
International Journal of Innovative Research in Computer and Communication Engineering
| e-ISSN: 2320-9801, p-ISSN: 2320-9798| www.ijircce.com | |Impact Factor: 7.488 |
|| Volume 8, Issue 12, December 2020 ||
| DOI: 10.15680/IJIRCCE.2020.0812006 |
IJIRCCE©2020 | An ISO 9001:2008 Certified Journal | 4580
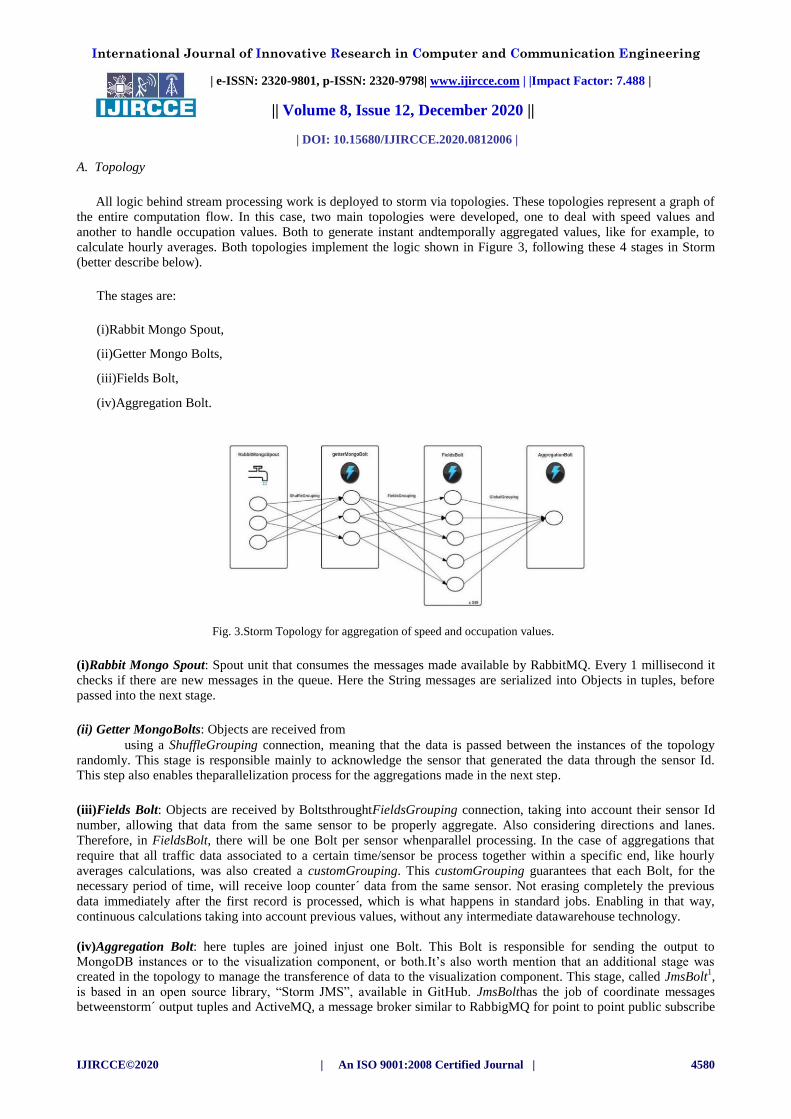
A. Topology
All logic behind stream processing work is deployed to storm via topologies. These topologies represent a graph of
the entire computation flow. In this case, two main topologies were developed, one to deal with speed values and
another to handle occupation values. Both to generate instant andtemporally aggregated values, like for example, to
calculate hourly averages. Both topologies implement the logic shown in Figure 3, following these 4 stages in Storm
(better describe below).
The stages are:
(i)Rabbit Mongo Spout,
(ii)Getter Mongo Bolts,
(iii)Fields Bolt,
(iv)Aggregation Bolt.
Fig. 3.Storm Topology for aggregation of speed and occupation values.
(i)Rabbit Mongo Spout: Spout unit that consumes the messages made available by RabbitMQ. Every 1 millisecond it
checks if there are new messages in the queue. Here the String messages are serialized into Objects in tuples, before
passed into the next stage.
(ii) Getter MongoBolts: Objects are received from using a ShuffleGrouping connection, meaning that the data is passed between the instances of the topology
randomly. This stage is responsible mainly to acknowledge the sensor that generated the data through the sensor Id. This step also enables theparallelization process for the aggregations made in the next step.
(iii)Fields Bolt: Objects are received by BoltsthroughtFieldsGrouping connection, taking into account their sensor Id
number, allowing that data from the same sensor to be properly aggregate. Also considering directions and lanes.
Therefore, in FieldsBolt, there will be one Bolt per sensor whenparallel processing. In the case of aggregations that
require that all traffic data associated to a certain time/sensor be process together within a specific end, like hourly
averages calculations, was also created a customGrouping. This customGrouping guarantees that each Bolt, for the
necessary period of time, will receive loop counter´ data from the same sensor. Not erasing completely the previous
data immediately after the first record is processed, which is what happens in standard jobs. Enabling in that way,
continuous calculations taking into account previous values, without any intermediate datawarehouse technology.
(iv)Aggregation Bolt: here tuples are joined injust one Bolt. This Bolt is responsible for sending the output to MongoDB instances or to the visualization component, or both.It’s also worth mention that an additional stage was created in the topology to manage the transference of data to the visualization component. This stage, called JmsBolt
1,
is based in an open source library, “Storm JMS”, available in GitHub. JmsBolthas the job of coordinate messages betweenstorm´ output tuples and ActiveMQ, a message broker similar to RabbigMQ for point to point public subscribe
International Journal of Innovative Research in Computer and Communication Engineering
| e-ISSN: 2320-9801, p-ISSN: 2320-9798| www.ijircce.com | |Impact Factor: 7.488 |
|| Volume 8, Issue 12, December 2020 ||
| DOI: 10.15680/IJIRCCE.2020.0812006 |
IJIRCCE©2020 | An ISO 9001:2008 Certified Journal | 4581
service. Being Apache Camel responsible to manage the exchange of information in the Web Sockets, passing
messages to front-end technologies.
VII. CONCLUSION Results showed that the approach presented here, materialized in an application for traffic monitoring, is capable of
cope the main objectives, namely, perform real-time stream computing of traffic related data and generate on the fly
traffic indicators with it, through stream mining. Being shown, through a user interface, average speeds and occupation
metrics, aggregated in different granularities (e.g. current time, last 30 minutes, hourly). Moreover, for the specific
scenario of Slovenian loop counters´ data, the performance achieved by the system in tests, outperform the needs.
Having a throughput and output rate much faster than the input rate, if working in real-time, showing that the
implementation is valid to perform stream processing work, such as ETL jobs and real - time streaming analytics. The
use of Big Data technologies also cover requirements like parallel processing capabilities and scalability.
ITS applications capable of stream mining, such as the one developed in this study, have increasing value for traffic
operators, making available information not generally accessible in real-time, considering the classical methods to
monitor the road network. Especially, if we compare these new Data Stream Management Systems (DSMS) approaches
with the classical ones, using Database Management Systems (DBMS), which are more static, less flexible, and
perform normally later analytics. In the other hand, DBMS still fit best when is required to perform analysis on
persistent data.
Future work involves the study and development of a Complex Event Processing (CEP) software layer that could
take advantage of the traffic monitoring information, to automatically detect unusual events on the road. In another
perspective, we also wish to use the base of the stream processing pipeline, shown here, to process other data sources that can affect traffic, such as weather data, traffic events data, social events data, or others. The objective of using different data sources is todevelop also new topologies, applying the knowledge acquired here, to generate different analytics and, if possible, in a next stage, correlate more than one source and type of data. The combination of CEP and
more data sources, would allow the development of a more complete real-time traffic management application, that could sense traffic related events faster, alerting quickly road operators about any problem.
REFERENCES
[1] United Nations, World Urbanization Prospects, vol. 12. 2014.
[2] R. Louf and M. Barthelemy, “How congestion shapes cities: From mobility patterns to scaling,” Sci. Rep., vol. 4,
2014.
[3] J. Arbib and T. Seba, “RethinkingTransportation 2020-2030,” 2017.
[4] G. S. Tewolde, “Sensor and network technology for intelligent transportation systems,” in 2012 IEEE
InternationalConference on Electro/Information Technology, 2012, pp. 1–7.
[5] I. A. T. Hashem, I. Yaqoob, N. B. Anuar, S.Mokhtar, A. Gani, and S. Ullah Khan, “The rise of ‘big data’ on cloud
computing: Review and open research issues,” Inf. Syst., vol. 47, pp. 98–115, 2015.
[6] J. Anuradha, “A Brief Introduction on BigData 5Vs Characteristics and Hadoop Technology,” Procedia –
Procedia Comput. Sci., vol. 48, pp. 319–324, 2015.
[7] Y. G. Petalas, A. Ammari, P. Georgakis, andC. Nwagboso, “A Big Data Architecture for Traffic Forecasting
Using Multi-Source Information,” in Algorithmic Aspects Of Cloud Computing, Algocloud 2016, 2017, vol.
10230, pp. 65–83.
[8] M. Bala, O. Boussaid, and Z. Alimazighi, “Big-ETL: Extracting-Transforming-Loading Approach for Big Data,
Conference: Proceedings of the International Conference on Parallel and Distributed Processing Techniques and
Applications (PDPTA), January 2015
.
BIOGRAPHY
Allam Sireesha is pursuing her M.Tech in Department of CSE, BrahmaiahCollege of Engineering, North
Rajupalem, Nellore. This is an academic project for M.Tech CSE.Under the Supervision of V.S.V. Harika , Assosciate
Professor in Dept. of CSE ,BrahmaiahCollege of Engineering , North Rajupalem, Nellore.