Embed Size (px)
Citation preview
Volume 8
RAJANPUR
Multiple Indicator Cluster Survey (MICS)Punjab 2007-08
VOLUME -8RAJANPUR
GOVERNMENT OF THE PUNJABPLANNING & DEVELOPMENT DEPARTMENT
BUREAU OF STATISTICSMARCH 2009

Contributors to the Report: Bureau of Statistics, Government of Punjab, Planning and Development Department, Lahore UNICEF Pakistan Consultant: Manar E. Abdel-Rahman, PhD M/s Eycon Pvt. Limited: data management consultants
The Multiple Indicator Cluster Survey was carried out by the Bureau of Statistics, Government of Punjab, Planning and Development Department. Financial support was provided by the Government of Punjab through the Annual Development Programme and technical support by the United Nations Children's Fund (UNICEF). The final report consists of 36 volumes of which this document is the first. Readers may refer to the enclosed table of contents for reference. This is a household survey planned by the Planning and Development Department, Government of the Punjab, Pakistan (http://www.pndpunjab.gov.pk/page.asp?id=712). Survey tools were based on models and standards developed by the global MICS project, designed to collect information on the situation of children and women in countries around the world. Additional information on the global MICS project may be obtained from www.childinfo.org.
Suggested Citation: Bureau of Statistics, Planning and Development Department, Government of the Punjab - Multiple Indicator Cluster Survey, Punjab 2007–08, Lahore, Pakistan.
MICS PUN JAB 2 0 0 7 - 0 8ii
Contributors to the Report:
The final report consists of 36 volumes. Readers may refer to the enclosed table of contents forreference.
FOREWORD
Government of the Punjab is committed to reduce poverty through sustaining high growth in all aspects of provincial economy. An abiding challenge in maintaining such growth pattern is concurrent development of capacities in planning, implementation and monitoring which requires reliable and real time data on development needs, quality and efficacy of interventions and impacts. Being cognizant of this need, Planning and Development Department is consistently working on improved systems for generation of accurate information on development needs and impacts of the investments made through development budgets.
Social sectors remain a priority area for the government and development outlays for these sectors have grown multifold over the last five years. Government of the Punjab is committed to attain the Millennium Development Goals (MDGs) for education, health, water supply & sanitation and poverty. That would require not only provision of adequate resources but also a very robust system for ascertaining the area specific needs, efficient use of resources and regular monitoring of the results and impacts. Towards this end, government, with assistance of UNICEF, has embarked upon periodic conduct of Multiple Indicator Cluster Surveys (MICS). The first such survey was carried out in 2003-04 and proved to be the most important tool in determining government budgetary outlays for the next four years, particularly for the social sectors.
MICS 2003-04 was based on 40 indicators and the usage of information generated by the survey pointed to the need of further improvements in the scope and coverage of selected indicators. Therefore, scope of MICS 2007-08 was further expanded to more than 70 indicators and the coverage
level. This posed much greater challenges in terms of logistics and man-management but it is matter of great satisfaction that final product has proven to be worth that effort.
The results of 2007-08 survey not only provide information on progress made in key social indicators since 2003-04 but also provide an excellent baseline for the key social indicators to the provincial planners. The Punjab Bureau of Statistics, Planning & Development Department, partner organizations at the provincial and district level richly deserve all the credit for coming up with an excellent report. Special credit also goes to UNICEF for their unstinted support for the MICS over the years and bringing international expertise to support this effort.
I am confident that this report will prove to be a valuable source not only for the planning efforts of government of punjab but also a valuable reference for the academia and research organizations.
Muhammad Sami Saeed Chairman,
Planning and Development Board, Punjab Dated: 20th February, 2009
TEHSIL-WISE RESULTS OF DISTRICT RAJANPUR iii
FOREWORD
ACKNOWLEDGEMENTS
The Multiple Indicator Cluster Survey (MICS) Punjab 2007 08 is the result of ceaseless efforts of different departments and organisations. Funded through the Annual Development Programme, the survey was conducted by the Bureau of Statistics, Punjab with technical support of UNICEF. The Federal Bureau of Statistics provided the sample design which was also reviewed by an international consultant. The validation of survey was undertaken by the Social Work Department, University of the Punjab, Lahore. The survey covered 6,368 clusters and 91,280 households in urban and rural areas throughout the province. The fieldwork was started on 12 December 2007 and completed on 10 April 2008.
Punjab MICS 2007 08 allows the provincial government and districts to gauge and monitor their respective status of human and social development with precise data on a variety of key indicators. It will assist the decision-makers to move towards new avenues of human and social development.
MICS 2007 08 is result of collective efforts of many individuals and each one of them merits recognition. The Chairman, P&D Board (who also heads the Provincial Steering Committee of MICS) and Secretary P&D Department extended their fullest support and guided throughout the process. Mr. Shamim Rafique, Director General, Bureau of Statistics and his team deserves special mention. Their hard work and dedication has made it possible that the final product is completed in time. The keen interest and contribution made by the members of the Steering Committee, Technical and Planning & Coordination Group, Chief (MEPA) and his team are also acknowledged.
MICS 2007-08 would not have been possible without technical support of UNICEF. Dr. Deepak Bajracharya, Provincial Chief, UNICEF, and his team played an active role throughout the process. Special thanks are due to Dr Manar Abdel Rahman, who led the process; Mr. Armando Levinson and Ivena Bajelic, International consultants for MICS 2007-08; The Federal Bureau of Statistics for providing sample design and listing; ECI (Pvt) Limited for facilitating trainings; Social Work Department, University of the Punjab, Lahore for monitoring; M/s Eycon (Pvt) Ltd for data management support; and many more partners.
The fieldwork of this survey was a mammoth exercise but tireless efforts made by the regional supervisors, team supervisors and field enumerators (both male/ female in house listing and interviews) made possible to complete this difficult task in record time and without any major operational issue. The entire field teams deserve appreciation.
All district governments and Administrative Departments provided valuable support by contributing services of their staff in the process. Communities, local leadership and members of the sampled households devoted their time and resources to facilitate the work of survey teams. They need to be applauded for their confidence in sharing their personal information and enriching this survey. The information provided by them remains in trust and will not be used for any purposes other than their benefit.
Hamed Yaqoob Sheikh
Member/ Chief Economist Dated: 20th February, 2009 Planning and Development Board, Punjab
MICS PUN JAB 2 0 0 7 - 0 8iv
ACKNOWLEDGEMENTS
MDG Global MICS
Punjab MICS District Punjab District Punjab
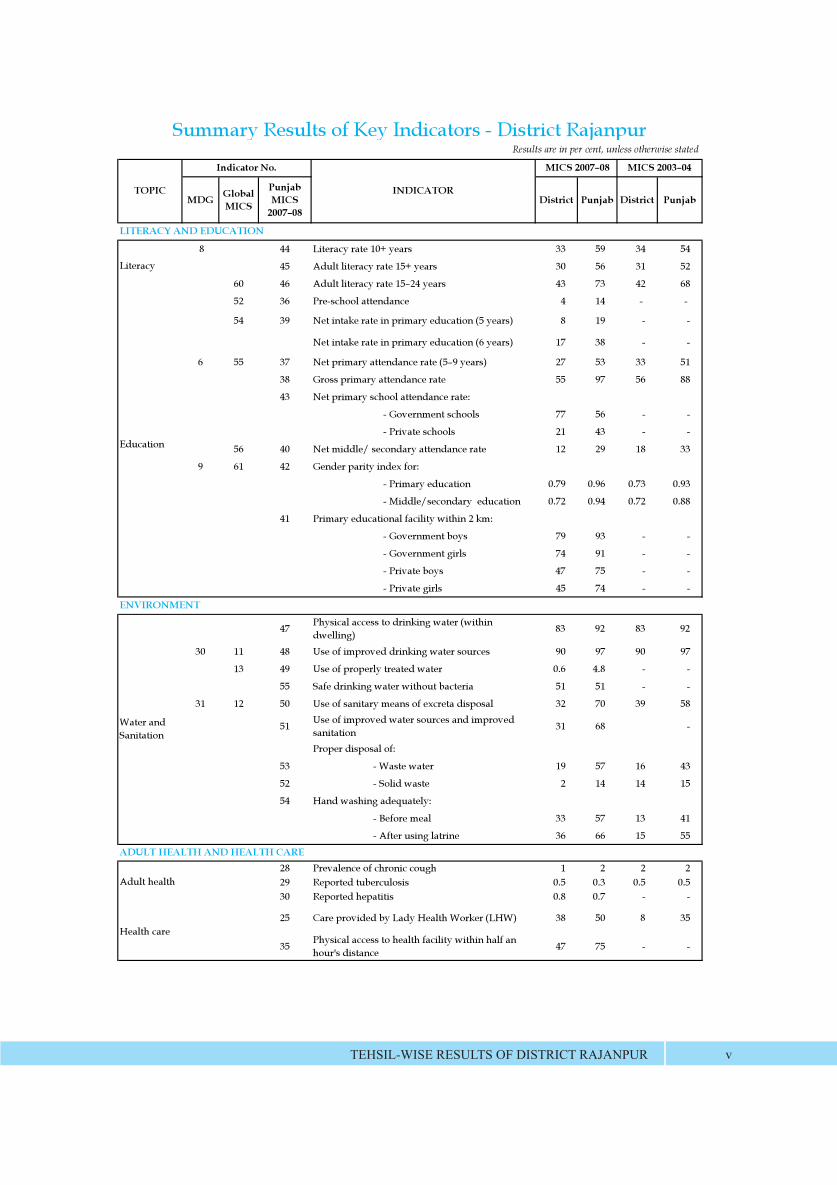
8 44 Literacy rate 10+ years 33 59 34 54
45 Adult literacy rate 15+ years 30 56 31 52
60 46 43 73 42 68
52 36 Pre-school attendance 4 14 - -
54 39 Net intake rate in primary education (5 years) 8 19 - -
Net intake rate in primary education (6 years) 17 38 - -
6 55 37 27 53 33 51
38 Gross primary attendance rate 55 97 56 88
43 Net primary school attendance rate:
- Government schools 77 56 - -
- Private schools 21 43 - -
56 40 Net middle/ secondary attendance rate 12 29 18 33
9 61 42 Gender parity index for:
- Primary education 0.79 0.96 0.73 0.93
- Middle/secondary education 0.72 0.94 0.72 0.88
41 Primary educational facility within 2 km:
- Government boys 79 93 - -
- Government girls 74 91 - -
- Private boys 47 75 - -
- Private girls 45 74 - -
47 Physical access to drinking water (within dwelling)
83 92 83 92
30 11 48 Use of improved drinking water sources 90 97 90 97
13 49 Use of properly treated water 0.6 4.8 - -
55 Safe drinking water without bacteria 51 51 - -
31 12 50 Use of sanitary means of excreta disposal 32 70 39 58
51 Use of improved water sources and improved sanitation 31 68 -
Proper disposal of:
53 - Waste water 19 57 16 43
52 - Solid waste 2 14 14 15
54 Hand washing adequately:
- Before meal 33 57 13 41
- After using latrine 36 66 15 55
28 Prevalence of chronic cough 1 2 2 229 Reported tuberculosis 0.5 0.3 0.5 0.530 Reported hepatitis 0.8 0.7 - -
25 Care provided by Lady Health Worker (LHW) 38 50 8 35
35 Physical access to health facility within half an hour's distance 47 75 - -
Adult health
Health care
LITERACY AND EDUCATION
Literacy
Education
ENVIRONMENT
Water and Sanitation
ADULT HEALTH AND HEALTH CARE
Summary Results of Key Indicators - District RajanpurResults are in per cent, unless otherwise stated
TOPIC
Indicator No.
INDICATOR
TEHSIL-WISE RESULTS OF DISTRICT RAJANPUR v
MDG Global MICS
Punjab MICS District Punjab District Punjab
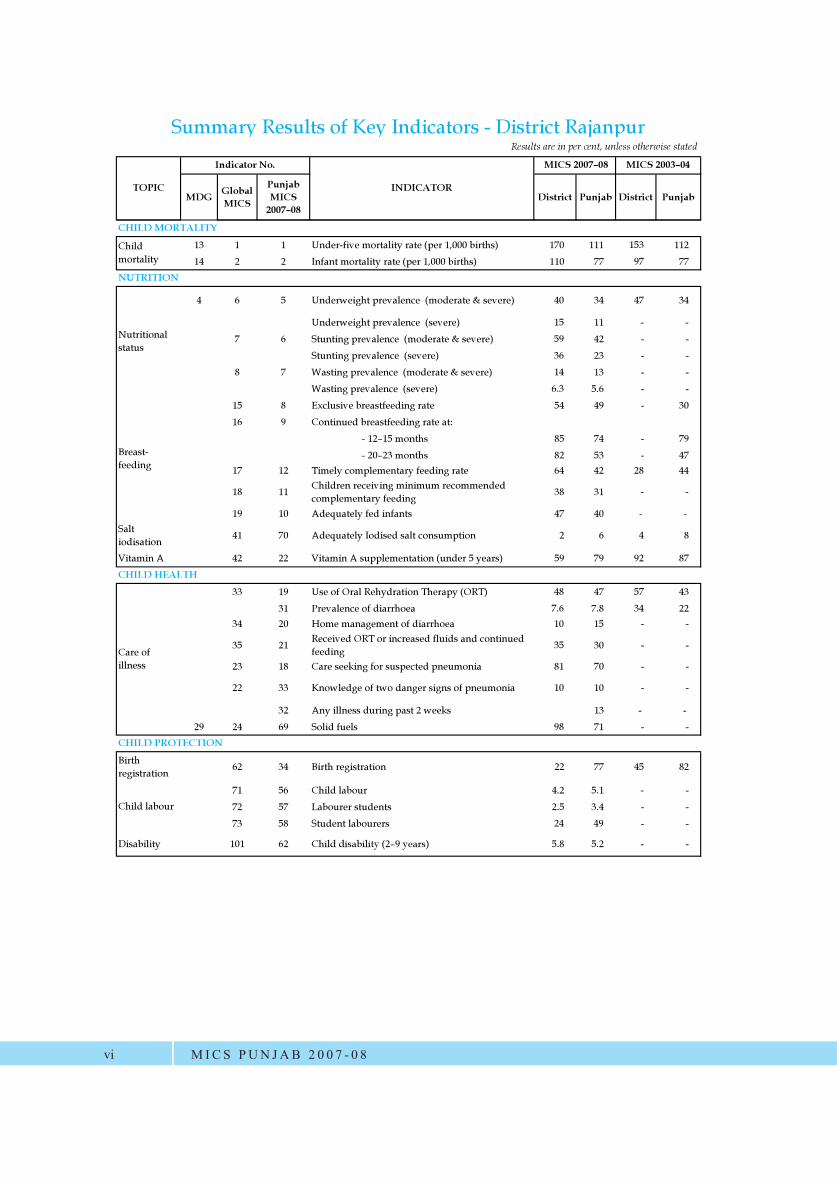
Summary Results of Key Indicators - District RajanpurResults are in per cent, unless otherwise stated
TOPIC
Indicator No.
INDICATOR
13 1 1 Under-five mortality rate (per 1,000 births) 170 111 153 11214 2 2 Infant mortality rate (per 1,000 births) 110 77 97 77
4 6 5 Underweight prevalence (moderate & severe) 40 34 47 34
Underweight prevalence (severe) 15 11 - -
7 6 Stunting prevalence (moderate & severe) 59 42 - -Stunting prevalence (severe) 36 23 - -
8 7 Wasting prevalence (moderate & severe) 14 13 - -Wasting prevalence (severe) 6.3 5.6 - -
15 8 Exclusive breastfeeding rate 54 49 - 3016 9 Continued breastfeeding rate at:
85 74 - 7982 53 - 47
17 12 Timely complementary feeding rate 64 42 28 44
18 11 Children receiving minimum recommended complementary feeding 38 31 - -
19 10 Adequately fed infants 47 40 - -Salt iodisation 41 70 Adequately Iodised salt consumption 2 6 4 8
Vitamin A 42 22 Vitamin A supplementation (under 5 years) 59 79 92 87
33 19 Use of Oral Rehydration Therapy (ORT) 48 47 57 4331 Prevalence of diarrhoea 7.6 7.8 34 22
34 20 Home management of diarrhoea 10 15 - -
35 21 Received ORT or increased fluids and continued feeding
35 30 - -
23 18 Care seeking for suspected pneumonia 81 70 - -
22 33 Knowledge of two danger signs of pneumonia 10 10 - -
32 Any illness during past 2 weeks 13 - - 29 24 69 Solid fuels 98 71 - -
Birth registration 62 34 Birth registration 22 77 45 82
71 56 Child labour 4.2 5.1 - -72 57 Labourer students 2.5 3.4 - -73 58 Student labourers 24 49 - -
Disability 101 62 5.8 5.2 - -
Breast-feeding
CHILD HEALTH
Care of illness
CHILD PROTECTION
Child labour
CHILD MORTALITY
Child mortality
NUTRITION
Nutritional status
MICS PUN JAB 2 0 0 7 - 0 8vi
MDG Global MICS
Punjab MICS District Punjab District Punjab
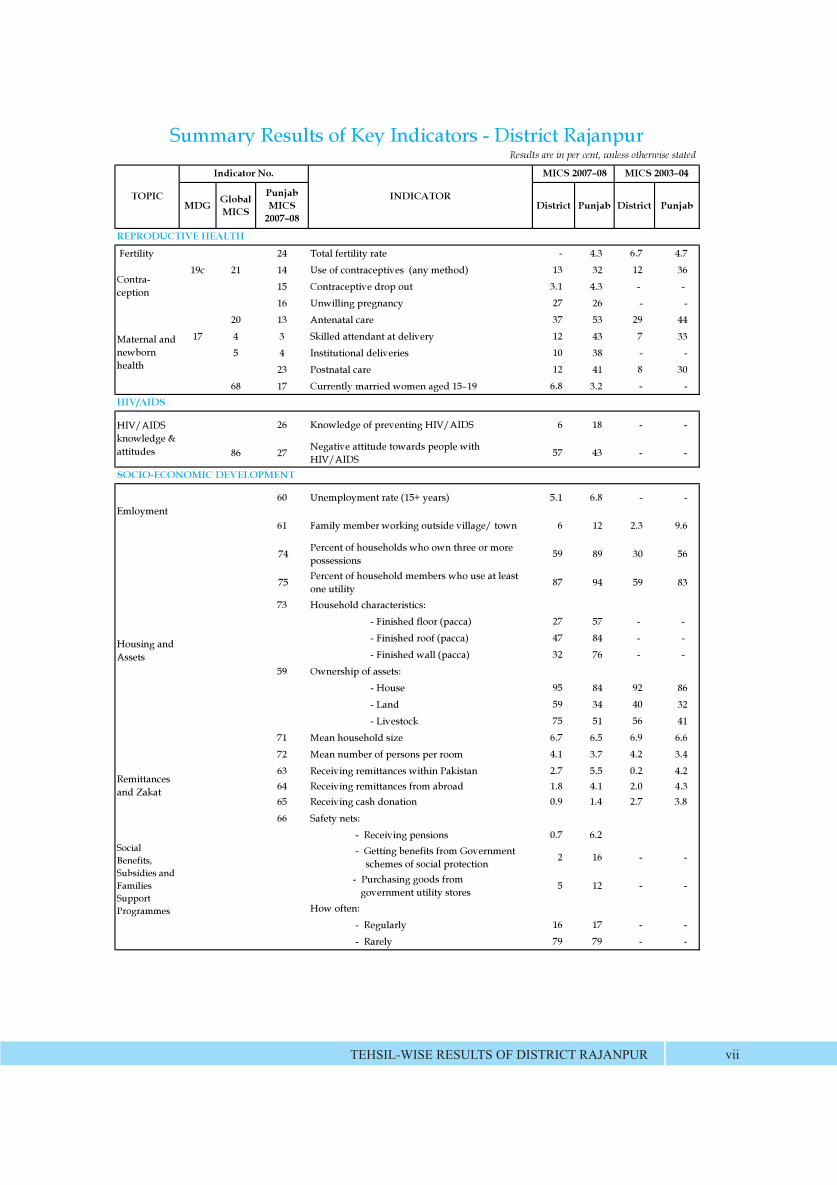
Summary Results of Key Indicators - District RajanpurResults are in per cent, unless otherwise stated
TOPIC
Indicator No.
INDICATOR
Fertility 24 Total fertility rate - 4.3 6.7 4.719c 21 14 Use of contraceptives (any method) 13 32 12 36
15 Contraceptive drop out 3.1 4.3 - - 16 Unwilling pregnancy 27 26 - -
20 13 Antenatal care 37 53 29 4417 4 3 Skilled attendant at delivery 12 43 7 33
5 4 Institutional deliveries 10 38 - -23 Postnatal care 12 41 8 30
68 17 6.8 3.2 - -
26 Knowledge of preventing HIV/AIDS 6 18 - -
86 27 Negative attitude towards people with HIV/AIDS
57 43 - -
60 Unemployment rate (15+ years) 5.1 6.8 - -
61 Family member working outside village/ town 6 12 2.3 9.6
74 Percent of households who own three or more possessions
59 89 30 56
75 Percent of household members who use at least one utility
87 94 59 83
73 Household characteristics:- Finished floor (pacca) 27 57 - - - Finished roof (pacca) 47 84 - - - Finished wall (pacca) 32 76 - -
59 Ownership of assets:- House 95 84 92 86- Land 59 34 40 32- Livestock 75 51 56 41
71 Mean household size 6.7 6.5 6.9 6.672 Mean number of persons per room 4.1 3.7 4.2 3.463 Receiving remittances within Pakistan 2.7 5.5 0.2 4.264 Receiving remittances from abroad 1.8 4.1 2.0 4.365 Receiving cash donation 0.9 1.4 2.7 3.8
66 Safety nets: - Receiving pensions 0.7 6.2 - Getting benefits from Government schemes of social protection
2 16 - -
- Purchasing goods from government utility stores
5 12 - -
How often: - Regularly 16 17 - -
- Rarely 79 79 - -
Contra-ception
Maternal and newborn health
Housing and Assets
Remittances and Zakat
Social Benefits, Subsidies and Families Support Programmes
HIV/AIDS
HIV/AIDS knowledge & attitudes
SOCIO-ECONOMIC DEVELOPMENT
Emloyment
REPRODUCTIVE HEALTH
TEHSIL-WISE RESULTS OF DISTRICT RAJANPUR vii
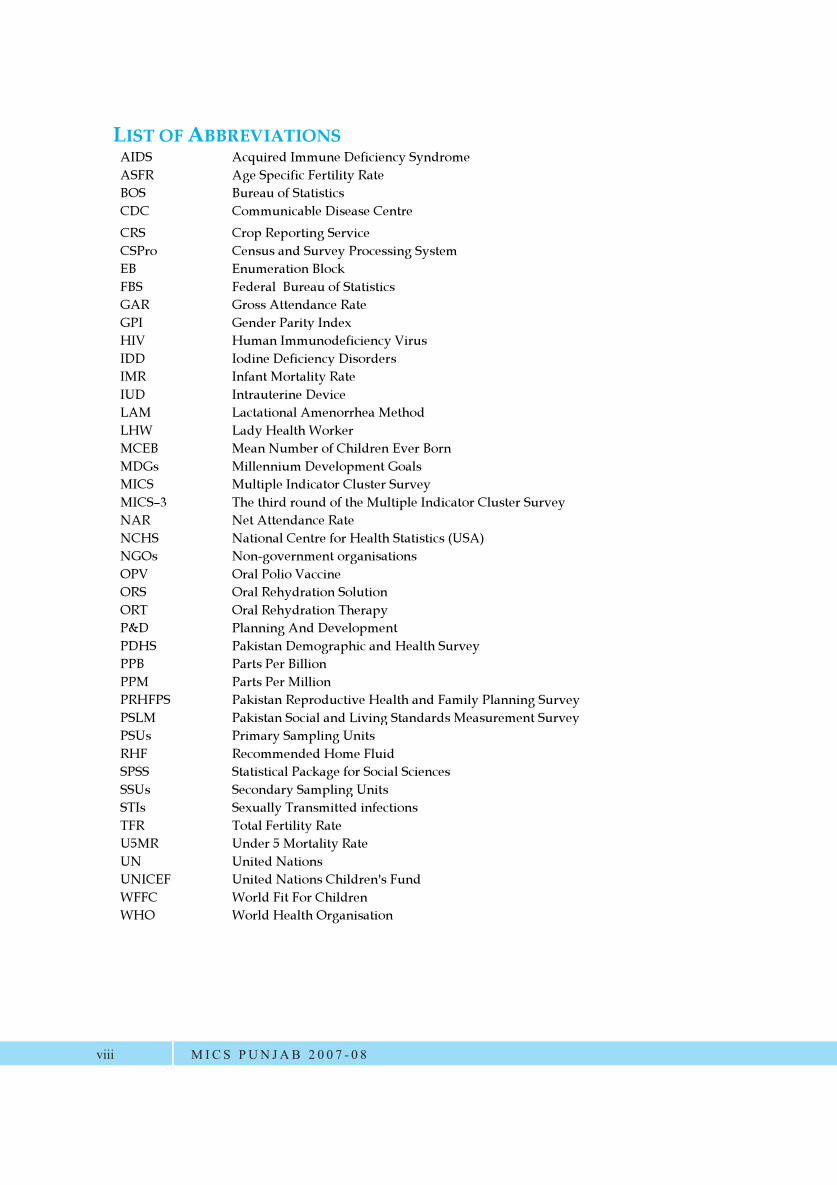
LIST OF ABBREVIATIONS AIDS Acquired Immune Deficiency Syndrome ASFR Age Specific Fertility Rate BOS Bureau of Statistics CDC Communicable Disease Centre CRS Crop Reporting Service CSPro Census and Survey Processing System EB Enumeration Block FBS Federal Bureau of Statistics GAR Gross Attendance Rate GPI Gender Parity Index HIV Human Immunodeficiency Virus IDD Iodine Deficiency Disorders IMR Infant Mortality Rate IUD Intrauterine Device LAM Lactational Amenorrhea Method LHW Lady Health Worker MCEB Mean Number of Children Ever Born MDGs Millennium Development Goals MICS Multiple Indicator Cluster Survey MICS 3 The third round of the Multiple Indicator Cluster Survey NAR Net Attendance Rate NCHS National Centre for Health Statistics (USA) NGOs Non-government organisations OPV Oral Polio Vaccine ORS Oral Rehydration Solution ORT Oral Rehydration Therapy P&D Planning And Development PDHS Pakistan Demographic and Health Survey PPB Parts Per Billion PPM Parts Per Million PRHFPS Pakistan Reproductive Health and Family Planning Survey PSLM Pakistan Social and Living Standards Measurement Survey PSUs Primary Sampling Units RHF Recommended Home Fluid SPSS Statistical Package for Social Sciences SSUs Secondary Sampling Units STIs Sexually Transmitted infections TFR Total Fertility Rate U5MR Under 5 Mortality Rate UN United Nations UNICEF United Nations Children's Fund WFFC World Fit For Children WHO World Health Organisation
MICS PUN JAB 2 0 0 7 - 0 8viii
INTRODUCTION
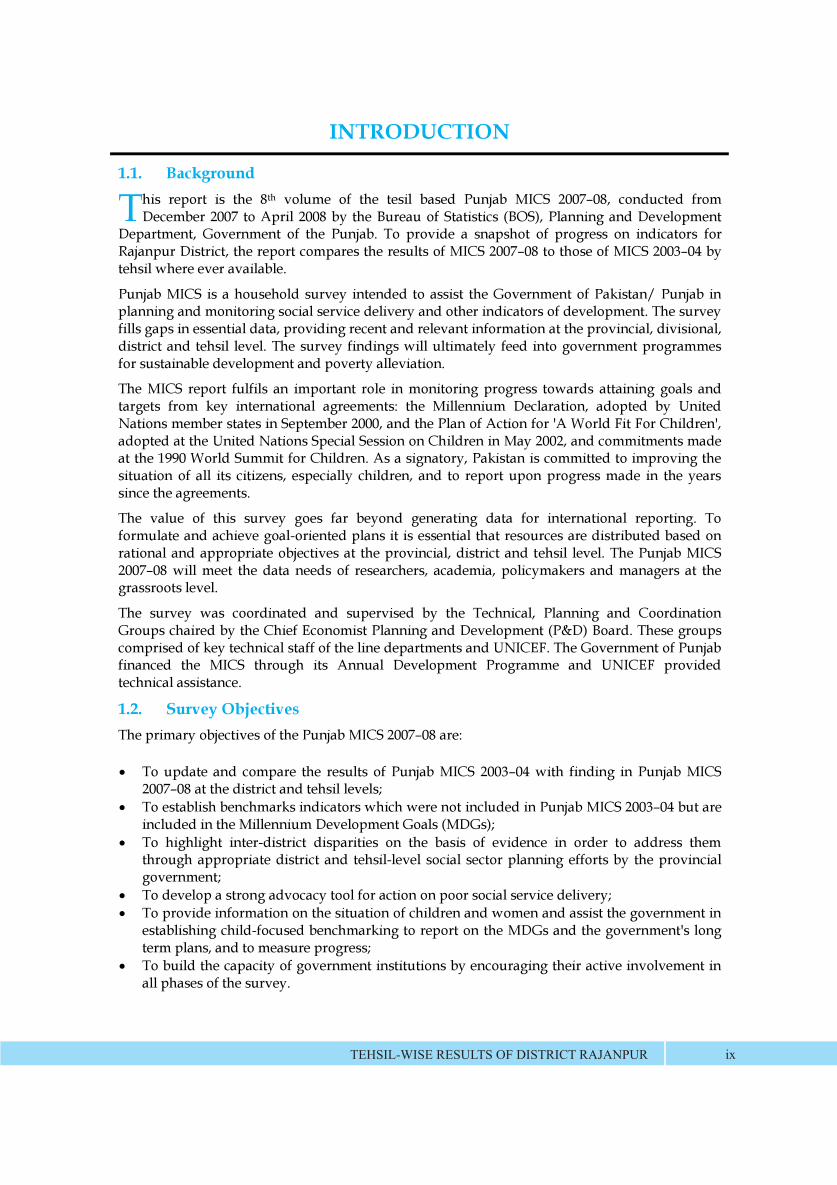
1.1. Background his report is the 8th volume of the tesil based Punjab MICS 2007 08, conducted from December 2007 to April 2008 by the Bureau of Statistics (BOS), Planning and Development
Department, Government of the Punjab. To provide a snapshot of progress on indicators for Rajanpur District, the report compares the results of MICS 2007 08 to those of MICS 2003 04 by tehsil where ever available.
Punjab MICS is a household survey intended to assist the Government of Pakistan/ Punjab in planning and monitoring social service delivery and other indicators of development. The survey fills gaps in essential data, providing recent and relevant information at the provincial, divisional, district and tehsil level. The survey findings will ultimately feed into government programmes for sustainable development and poverty alleviation.
The MICS report fulfils an important role in monitoring progress towards attaining goals and targets from key international agreements: the Millennium Declaration, adopted by United Nations member states in September 2000, and the Plan of Action for 'A World Fit For Children', adopted at the United Nations Special Session on Children in May 2002, and commitments made at the 1990 World Summit for Children. As a signatory, Pakistan is committed to improving the situation of all its citizens, especially children, and to report upon progress made in the years since the agreements.
The value of this survey goes far beyond generating data for international reporting. To formulate and achieve goal-oriented plans it is essential that resources are distributed based on rational and appropriate objectives at the provincial, district and tehsil level. The Punjab MICS 2007 08 will meet the data needs of researchers, academia, policymakers and managers at the grassroots level.
The survey was coordinated and supervised by the Technical, Planning and Coordination Groups chaired by the Chief Economist Planning and Development (P&D) Board. These groups comprised of key technical staff of the line departments and UNICEF. The Government of Punjab financed the MICS through its Annual Development Programme and UNICEF provided technical assistance.
1.2. Survey Objectives The primary objectives of the Punjab MICS 2007 08 are:
To update and compare the results of Punjab MICS 2003 04 with finding in Punjab MICS 2007 08 at the district and tehsil levels;
To establish benchmarks indicators which were not included in Punjab MICS 2003 04 but are included in the Millennium Development Goals (MDGs);
To highlight inter-district disparities on the basis of evidence in order to address them through appropriate district and tehsil-level social sector planning efforts by the provincial government;
To develop a strong advocacy tool for action on poor social service delivery; To provide information on the situation of children and women and assist the government in
establishing child-focused benchmarking to report on the MDGs and the government's long term plans, and to measure progress;
To build the capacity of government institutions by encouraging their active involvement in all phases of the survey.
T
TEHSIL-WISE RESULTS OF DISTRICT RAJANPUR ix
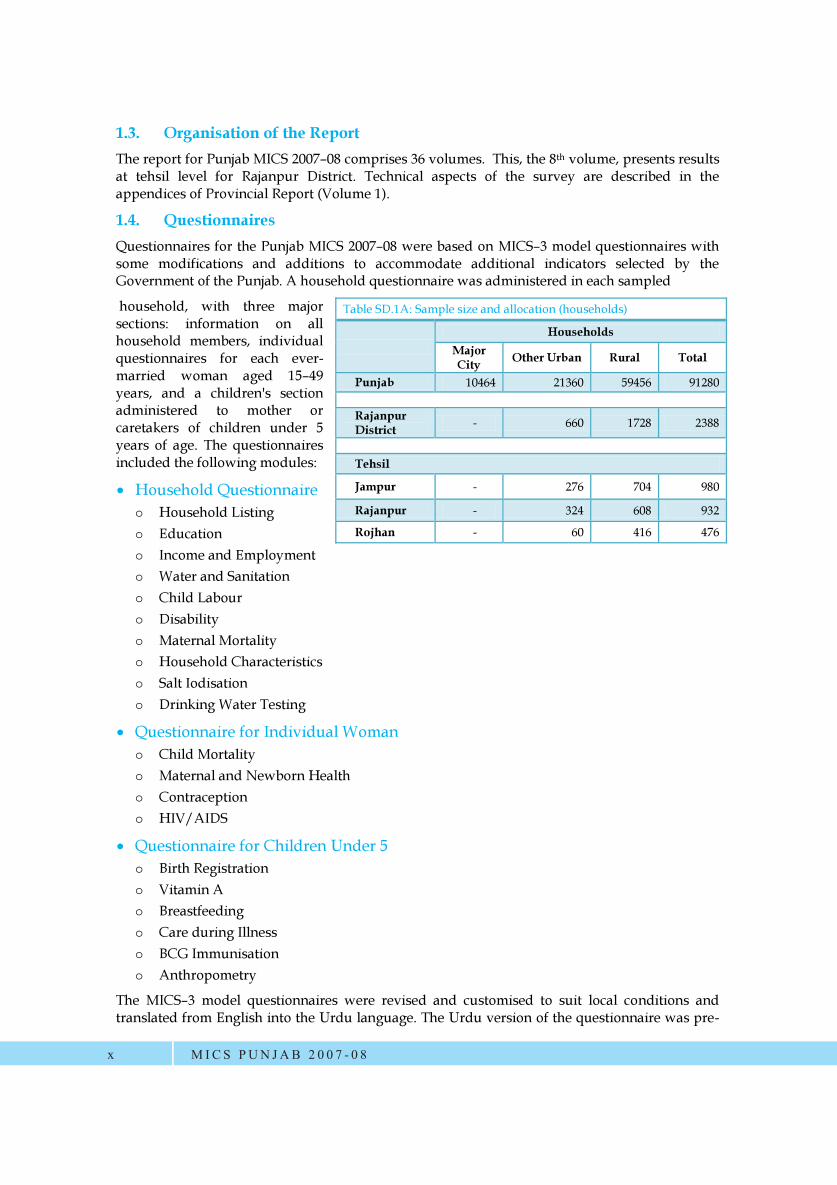
1.3. Organisation of the Report The report for Punjab MICS 2007 08 comprises 36 volumes. This, the 8th volume, presents results at tehsil level for Rajanpur District. Technical aspects of the survey are described in the appendices of Provincial Report (Volume 1).
1.4. Questionnaires Questionnaires for the Punjab MICS 2007 08 were based on MICS 3 model questionnaires with some modifications and additions to accommodate additional indicators selected by the Government of the Punjab. A household questionnaire was administered in each sampled
household, with three major sections: information on all household members, individual questionnaires for each ever-married woman aged 15 49 years, and a children's section administered to mother or caretakers of children under 5 years of age. The questionnaires included the following modules:
Household Questionnaire o Household Listing o Education o Income and Employment o Water and Sanitation o Child Labour o Disability o Maternal Mortality o Household Characteristics o Salt Iodisation o Drinking Water Testing
Questionnaire for Individual Woman o Child Mortality o Maternal and Newborn Health o Contraception o HIV/AIDS
Questionnaire for Children Under 5 o Birth Registration o Vitamin A o Breastfeeding o Care during Illness o BCG Immunisation o Anthropometry
The MICS 3 model questionnaires were revised and customised to suit local conditions and translated from English into the Urdu language. The Urdu version of the questionnaire was pre-
Table SD.1A: Sample size and allocation (households)
Households
Major City Other Urban Rural Total
Punjab 10464 21360 59456 91280
Rajanpur District - 660 1728 2388
Tehsil
Jampur - 276 704 980
Rajanpur - 324 608 932
Rojhan - 60 416 476
MICS PUN JAB 2 0 0 7 - 0 8x
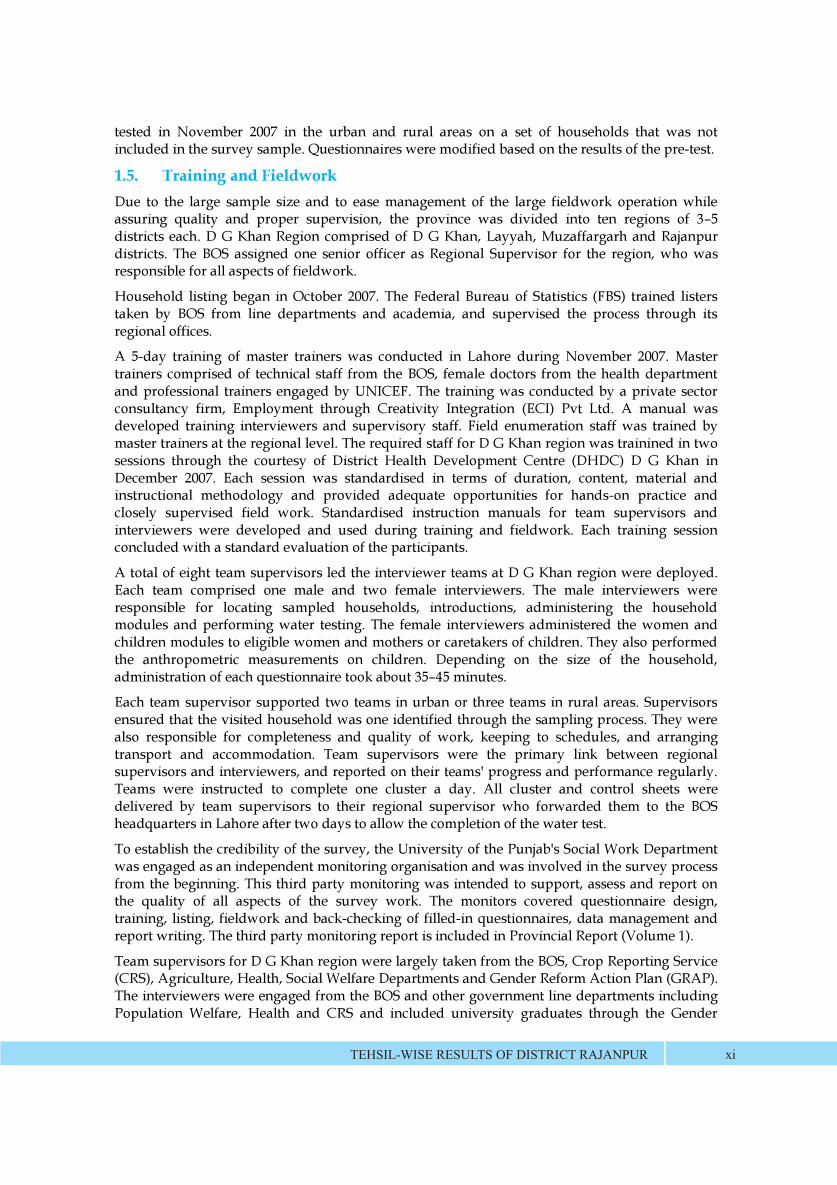
tested in November 2007 in the urban and rural areas on a set of households that was not included in the survey sample. Questionnaires were modified based on the results of the pre-test.
1.5. Training and Fieldwork Due to the large sample size and to ease management of the large fieldwork operation while assuring quality and proper supervision, the province was divided into ten regions of 3 5 districts each. D G Khan Region comprised of D G Khan, Layyah, Muzaffargarh and Rajanpur districts. The BOS assigned one senior officer as Regional Supervisor for the region, who was responsible for all aspects of fieldwork.
Household listing began in October 2007. The Federal Bureau of Statistics (FBS) trained listers taken by BOS from line departments and academia, and supervised the process through its regional offices.
A 5-day training of master trainers was conducted in Lahore during November 2007. Master trainers comprised of technical staff from the BOS, female doctors from the health department and professional trainers engaged by UNICEF. The training was conducted by a private sector consultancy firm, Employment through Creativity Integration (ECI) Pvt Ltd. A manual was developed training interviewers and supervisory staff. Field enumeration staff was trained by master trainers at the regional level. The required staff for D G Khan region was trainined in two sessions through the courtesy of District Health Development Centre (DHDC) D G Khan in December 2007. Each session was standardised in terms of duration, content, material and instructional methodology and provided adequate opportunities for hands-on practice and closely supervised field work. Standardised instruction manuals for team supervisors and interviewers were developed and used during training and fieldwork. Each training session concluded with a standard evaluation of the participants.
A total of eight team supervisors led the interviewer teams at D G Khan region were deployed. Each team comprised one male and two female interviewers. The male interviewers were responsible for locating sampled households, introductions, administering the household modules and performing water testing. The female interviewers administered the women and children modules to eligible women and mothers or caretakers of children. They also performed the anthropometric measurements on children. Depending on the size of the household, administration of each questionnaire took about 35 45 minutes.
Each team supervisor supported two teams in urban or three teams in rural areas. Supervisors ensured that the visited household was one identified through the sampling process. They were also responsible for completeness and quality of work, keeping to schedules, and arranging transport and accommodation. Team supervisors were the primary link between regional supervisors and interviewers, and reported on their teams' progress and performance regularly. Teams were instructed to complete one cluster a day. All cluster and control sheets were delivered by team supervisors to their regional supervisor who forwarded them to the BOS headquarters in Lahore after two days to allow the completion of the water test.
To establish the credibility of the survey, the University of the Punjab's Social Work Department was engaged as an independent monitoring organisation and was involved in the survey process from the beginning. This third party monitoring was intended to support, assess and report on the quality of all aspects of the survey work. The monitors covered questionnaire design, training, listing, fieldwork and back-checking of filled-in questionnaires, data management and report writing. The third party monitoring report is included in Provincial Report (Volume 1).
Team supervisors for D G Khan region were largely taken from the BOS, Crop Reporting Service (CRS), Agriculture, Health, Social Welfare Departments and Gender Reform Action Plan (GRAP). The interviewers were engaged from the BOS and other government line departments including Population Welfare, Health and CRS and included university graduates through the Gender
TEHSIL-WISE RESULTS OF DISTRICT RAJANPUR xi
Reform Action Plan (GRAP) and NGOs. In total, 72 interviewers, 8 team supervisors and a regional supervisor were involved in data collection. Thus more than 80 field enumeration staff participated in fieldwork for the survey from 12 December 2007 to 10 April 2008.
1.6. Data Processing and Analysis Questionnaire responses received a preliminary edit on the spot by team supervisors. At the end of the day, the team supervisor and interviewers reviewed each questionnaire and filled in the cluster control sheet. The regional supervisor checked randomly selected questionnaires. Data editors deployed by the data management organisation conducted a final edit and check before data entry.
Data handling and processing was managed by an experienced private sector agency which was responsible for survey data management and processing, including pre-entry editing, data entry, verification and consistency checks, preliminary tabulations and frequencies, support of the data analysis process and preparation of final data for dissemination in electronic form.
In total, 48 data editors, 78 data entry operators and eight data supervisors and quality control staff took part in the data processing operation at provincial level. They were trained in four batches during May 2008. The two trainings for editors were conducted by Punjab MICS master trainers following the curriculum used in training interviewers.
For better quality control, all questionnaires were double entered and internal consistency checks were performed. The data management operation site was housed within the BOS premises to ensure close monitoring. A short-term international consultant was engaged by UNICEF to review the technical aspects of data entry operation during June 2008 who recommend improvements in the data management process.
Data processing began on 10 May and concluded on 15 September 2008. Procedures and standard programs developed under the global MICS 3 project and adapted to the Punjab questionnaires were used. Data were entered and processed using the CSPro software after customising standard data entry programs, and were analysed using the Statistical Package for Social Sciences (SPSS) software program after customising the model syntax and tabulation plans. Syntax and tabulation plans were prepared for the additional indicators included in the survey.
Table numbers used in this report refer to the same numbers used in the global MICS 3 tabulation plan. Each table number is prefixed by two letters denoting the section to which the table belongs. Generally numbering of figures reflects the table numbers from which the data used in the figures are obtained.
1.7. Dimensions of Data Analysis Data are presented for the entire province in Provincial Report (Volume 1). District Rajanpur data are disaggregated by tehsil, area of residence, sex, age, level of education and wealth index quintile and presented in this report.
MICS PUN JAB 2 0 0 7 - 0 8xii
LIST OF TABLES DISTRICT RAJANPUR
Volume 8
Households (HH) Table HH.2: Household age distribution by sex ................................................................................ 3 Table HH.3: Household composition .................................................................................................. 4 Table HH.4: Women's background characteristics ............................................................................ 5 Table HH.5: Children's background characteristics .......................................................................... 6
Nutrition (NU) Table NU.1: Child malnourishment ..................................................................................................... 7 Table NU.4: Adequately fed infants ..................................................................................................... 8 Table NU.5: Adequately iodised salt consumption ........................................................................... 9 Table NU.6: Children's vitamin A supplementation ......................................................................... 10
Child Health (CH) Table CH.4: Oral rehydration treatment ............................................................................................. 11 Table CH.5: Home management of diarrhoea ................................................................................... 12 Table CH.6: Care seeking for suspected pneumonia ......................................................................... 13 Table CH.7A: Knowledge of the two danger signs of pneumonia .................................................. 14 Table CH.8: Solid fuel use...................................................................................................................... 15
Environment (EN) Table EN.1: Use of improved water sources ...................................................................................... 17 Table EN.2: Household water treatment ............................................................................................ 18 Table EN.3: Physical access to source of water ................................................................................... 19 Table EN.3A: Bacteria water testing..................................................................................................... 20 Table EN.5: Use of sanitary means of excreta disposal ..................................................................... 21 Table EN.7: Use of improved water sources and improved sanitation .......................................... 22 Table EN.11A: Disposal of waste water............................................................................................... 23 Table EN.11B: Disposal of solid waste ................................................................................................. 24 Table EN.12A: Hands washing before meal ....................................................................................... 25 Table EN.12B: Hands washing after using latrine ............................................................................. 26
Reproductive Health (RH) Table RH.1: Use of contraception ......................................................................................................... 27 Table RH.1A: Contraceptive dropout ................................................................................................. 28 Table RH.2: Unwilling pregnancy ........................................................................................................ 29 Table RH.3: Antenatal care provider ................................................................................................... 30 Table RH.5: Assistance during delivery .............................................................................................. 31 Table RH.5A: Postnatal care provider ................................................................................................. 32 Table RH.7: Currently married women by age .................................................................................. 33
Education (ED) Table ED.8A: Literacy rate (10+ years) ................................................................................................ 35
TEHSIL-WISE RESULTS OF DISTRICT RAJANPUR 1
Table ED.8B: Literacy rate (15+ years) ................................................................................................. 36 Table ED.8C: Youth Literacy rate (15 24 years) ................................................................................. 37 Table ED.1: Pre-school attendance ....................................................................................................... 38 Table ED.2: Primary school entry ......................................................................................................... 39 Table ED.3A: Primary school net attendance ratio (5 9 years) ........................................................ 40 Table ED.3B: Primary school gross attendance ratio (5 9 years) ..................................................... 41 Table ED.3C: Public and private primary school attendance rate .................................................. 42 Table ED.4: Middle/Secondary school net attendance ratio ............................................................ 43 Table ED.4w: Secondary school age children attending primary school ........................................ 44 Table ED.7: Education gender parity ................................................................................................... 45 Table ED.9A: Physical access to primary schools............................................................................... 46 Table ED.9B: Physical access to middle schools ................................................................................. 47 Table ED.9C: Physical access to secondary schools ........................................................................... 48
Child Protection (CP) Table CP.1: Birth registration ................................................................................................................ 49 Table CP.2: Child labour................................................. ....................................................................... 50 Table CP.3: Labourer students and student labourers ...................................................................... 51 Table CP.10: Child disability ................................................................................................................. 52
HIV/ AIDS (HA) Table HA.1: Knowledge of preventing HIV transmission ................................................................ 53 Table HA.5: Attitudes toward people living with HIV/AIDS ......................................................... 54
Household Characteristics (HC) Table HC.1: Prevalence of Cough, TB and Hepatitis .........................................................................55 Table HC.2: Care provided by Lady Health Worker (LHW) ...........................................................56 Table HC.3: Physical access to health facility .....................................................................................57 Table HC.5: Unemployment rate .......................................................................................................... 58 Table HC.6: Family member working outside village ....................................................................... 59 Table HC.7A: Main material of the floor ............................................................................................. 60 Table HC.7B: Main material of the roof ............................................................................................... 61 Table HC.7C: Main material of the walls ............................................................................................ 62 Table HC.8A: Household utilities ........................................................................................................ 63 Table HC.8B: Household possessions .................................................................................................. 64 Table HC.9: House, agricultural land and livestock ownership ...................................................... 65 Table HC.10: Household size and mean number of persons per room .......................................... 66 Table HC.11A: Receiving remittance within Pakistan ....................................................................... 67 Table HC.11B: Receiving remittance from abroad ............................................................................. 68 Table HC.12: Cash donations ................................................................................................................ 69 Table HC.13: Pension Benefits .............................................................................................................. 70 Table HC.14A: Benefit from government social protection schemes .............................................. 71 Table HC.14B: Purchasing goods from government utility stores .................................................. 72
MICS PUN JAB 2 0 0 7 - 0 82
Number Percent Number Percent Number Percent
Punjab 303,804 100.0 289,039 100.0 592,843 100.0
DistrictRajanpur 4,153 100.0 3,782 100.0 7,935 100.0
Age
0-4 605 14.6 587 15.5 1,191 15.0
5-9 692 16.7 648 17.1 1,340 16.9
10-14 609 14.7 486 12.9 1,095 13.8
15-19 442 10.6 427 11.3 868 10.9
20-24 296 7.1 262 6.9 558 7.0
25-29 244 5.9 307 8.1 551 6.9
30-34 229 5.5 212 5.6 441 5.6
35-39 217 5.2 183 4.8 400 5.0
40-44 166 4.0 114 3.0 280 3.5
45-49 120 2.9 117 3.1 237 3.0
50-54 112 2.7 152 4.0 265 3.3
55-59 91 2.2 120 3.2 210 2.7
60-64 154 3.7 76 2.0 230 2.9
65-69 44 1.1 32 0.9 76 1.0
70+ 132 3.2 60 1.6 192 2.4
Dependency age groups
<15 1,905 45.9 1,721 45.5 3,626 45.7
15-64 2,072 49.9 1,969 52.1 4,041 50.9
65+ 176 4.2 92 2.4 268 3.4
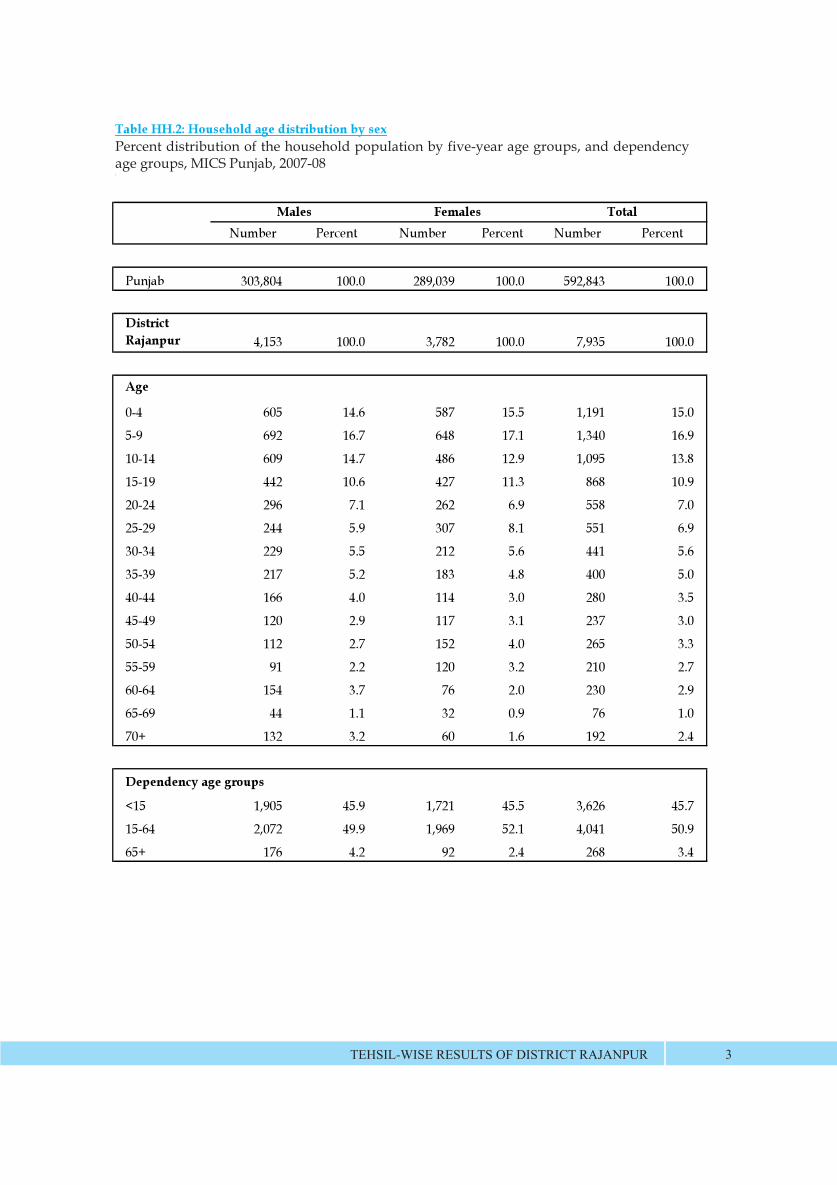
Table HH.2: Household age distribution by sex
Total
Percent distribution of the household population by five-year age groups and dependency age groups, and number of children aged 0-17 years, by sex, MICS Punjab, 2007-08
Males Females
TEHSIL-WISE RESULTS OF DISTRICT RAJANPUR 3
Percent distribution of the household population by five-year age groups, and dependencyage groups, MICS Punjab, 2007-08
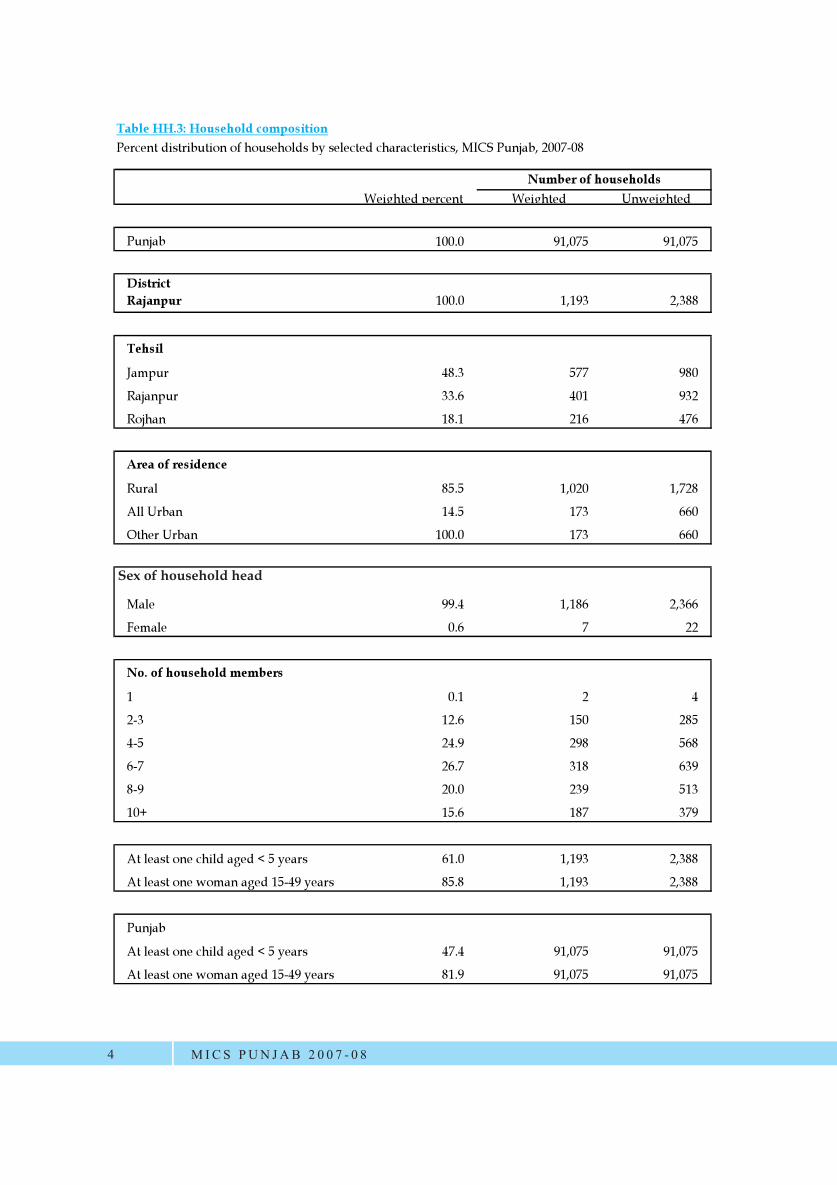
Weighted percent Weighted Unweighted
Punjab 100.0 91,075 91,075
District Rajanpur 100.0 1,193 2,388
Tehsil
Jampur 48.3 577 980
Rajanpur 33.6 401 932
Rojhan 18.1 216 476
Area of residence
Rural 85.5 1,020 1,728
All Urban 14.5 173 660
Other Urban 100.0 173 660
Gender
Male 99.4 1,186 2,366
Female 0.6 7 22
No. of household members
1 0.1 2 4
2-3 12.6 150 285
4-5 24.9 298 568
6-7 26.7 318 639
8-9 20.0 239 513
10+ 15.6 187 379
At least one child aged < 5 years 61.0 1,193 2,388
At least one woman aged 15-49 years 85.8 1,193 2,388
Punjab
At least one child aged < 5 years 47.4 91,075 91,075
At least one woman aged 15-49 years 81.9 91,075 91,075
Table HH.3: Household compositionPercent distribution of households by selected characteristics, MICS Punjab, 2007-08
Number of households
MICS PUN JAB 2 0 0 7 - 0 84
Sex of household head
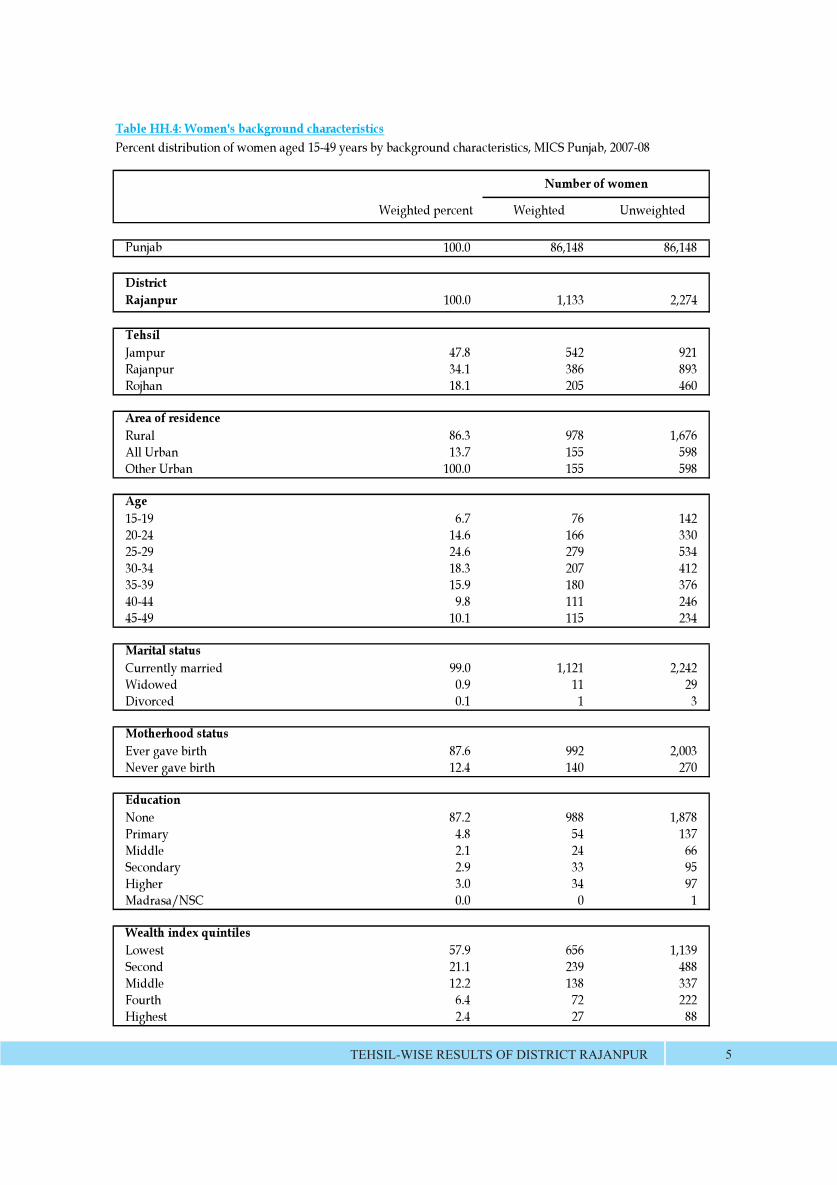
Percent distribution of women aged 15-49 years by background characteristics, MICS Punjab, 2007-08
Weighted percent Weighted Unweighted
Punjab 100.0 86,148 86,148
District Rajanpur 100.0 1,133 2,274
TehsilJampur 47.8 542 921Rajanpur 34.1 386 893Rojhan 18.1 205 460
Area of residenceRural 86.3 978 1,676All Urban 13.7 155 598Other Urban 100.0 155 598
Age15-19 6.7 76 14220-24 14.6 166 33025-29 24.6 279 53430-34 18.3 207 41235-39 15.9 180 37640-44 9.8 111 24645-49 10.1 115 234
Marital statusCurrently married 99.0 1,121 2,242Widowed 0.9 11 29Divorced 0.1 1 3
Motherhood statusEver gave birth 87.6 992 2,003Never gave birth 12.4 140 270
EducationNone 87.2 988 1,878Primary 4.8 54 137Middle 2.1 24 66Secondary 2.9 33 95Higher 3.0 34 97Madrasa/NSC 0.0 0 1
Wealth index quintilesLowest 57.9 656 1,139Second 21.1 239 488Middle 12.2 138 337Fourth 6.4 72 222Highest 2.4 27 88
Number of women
Table HH.4: Women's background characteristics
TEHSIL-WISE RESULTS OF DISTRICT RAJANPUR 5
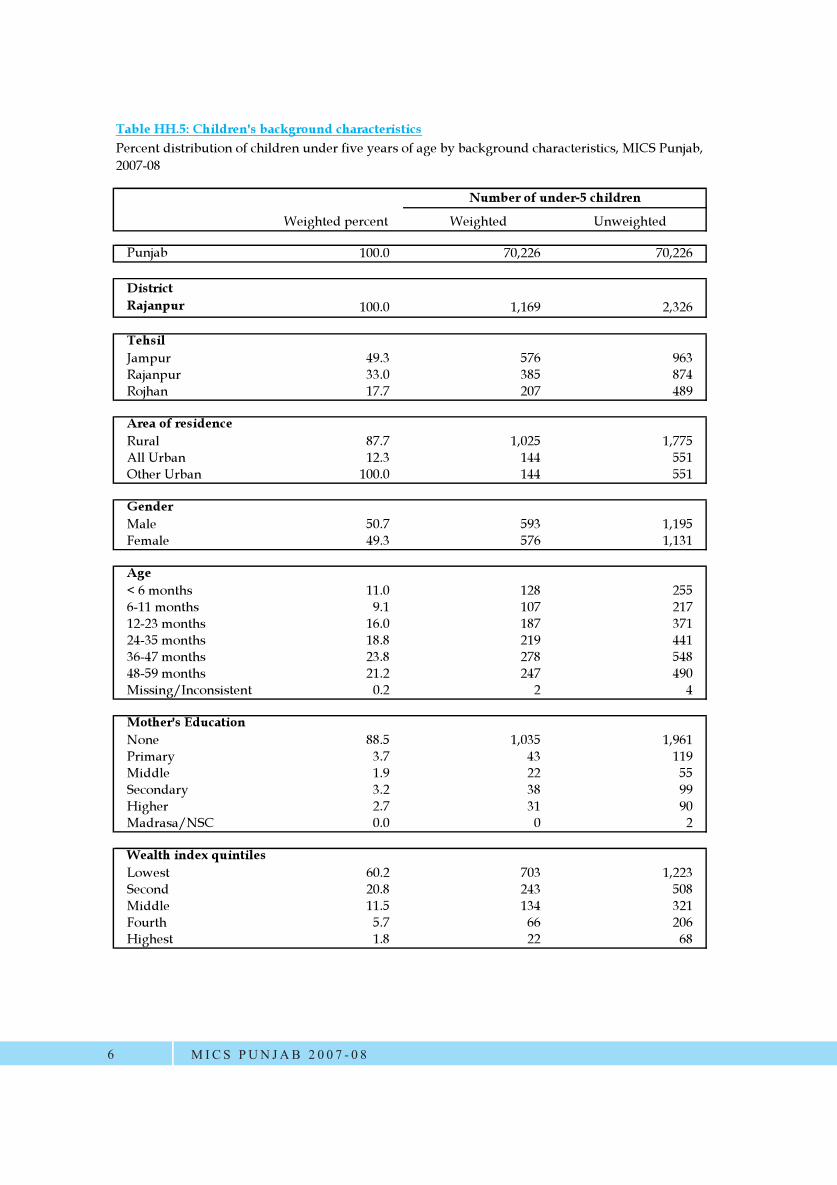
Weighted percent Weighted Unweighted
Punjab 100.0 70,226 70,226
District Rajanpur 100.0 1,169 2,326
TehsilJampur 49.3 576 963Rajanpur 33.0 385 874Rojhan 17.7 207 489
Area of residenceRural 87.7 1,025 1,775All Urban 12.3 144 551Other Urban 100.0 144 551
GenderMale 50.7 593 1,195Female 49.3 576 1,131
Age< 6 months 11.0 128 2556-11 months 9.1 107 21712-23 months 16.0 187 37124-35 months 18.8 219 44136-47 months 23.8 278 54848-59 months 21.2 247 490Missing/Inconsistent 0.2 2 4
Mother's EducationNone 88.5 1,035 1,961Primary 3.7 43 119Middle 1.9 22 55Secondary 3.2 38 99Higher 2.7 31 90Madrasa/NSC 0.0 0 2
Wealth index quintilesLowest 60.2 703 1,223Second 20.8 243 508Middle 11.5 134 321Fourth 5.7 66 206Highest 1.8 22 68
Percent distribution of children under five years of age by background characteristics, MICS Punjab, 2007-08
Number of under-5 children
Table HH.5: Children's background characteristics
MICS PUN JAB 2 0 0 7 - 0 86

Table NU.1: Child malnourishment
% below % below % below % below % below % below % above
- 2 SD* - 3 SD* - 2 SD** - 3 SD** - 2 SD*** - 3 SD*** + 2 SD
Punjab 33.6 11.3 42.4 23.3 13.4 5.6 6.9 57,368
District Rajanpur 40.2 15.1 58.7 36.4 13.7 6.3 9.2 481
TehsilJampur 36.6 12.3 62.6 37.8 11.7 3.8 7.2 225Rajanpur 40.4 18.2 50.3 31.5 15.6 8.4 10.4 144Rojhan 47.0 16.5 61.6 40.0 15.2 8.6 11.9 112
Area of residenceRural 41.6 15.1 61.8 38.3 12.5 5.1 8.1 384All Urban 34.5 15.0 46.6 29.1 18.5 10.7 13.5 98Other Urban 34.5 15.0 46.6 29.1 18.5 10.7 13.5 98
GenderMale 42.6 16.7 60.8 37.7 14.7 7.4 8.5 253Female 37.4 13.2 56.4 34.9 12.6 5.0 10.0 228
Child's age< 6 months 34.4 7.2 44.3 20.3 14.7 5.3 13.6 686-11 months 37.8 12.7 56.4 28.9 13.3 4.5 16.9 7812-23 months 46.5 19.2 56.3 38.7 16.8 5.3 5.9 8824-35 months 47.2 24.6 64.1 45.9 15.2 8.3 5.5 8136-47 months 36.2 12.2 64.9 45.5 9.3 5.6 5.8 8748-59 months 37.0 13.2 64.1 35.6 13.2 8.6 9.2 78Missing/Inconsistent 100.0 0.0 0.0 0.0 0.0 0.0 0.0 1
Mother's EducationNone 41.6 15.8 61.2 38.1 12.8 5.7 8.5 399Primary 32.6 9.9 51.3 26.0 11.7 8.3 13.3 27Middle 45.6 2.1 46.7 36.2 18.4 0.0 8.4 12Secondary 35.4 13.2 44.7 31.2 20.0 8.8 8.5 21Higher 25.5 15.7 41.2 23.8 23.2 14.6 17.1 22Madrasa/NSC 50.0 50.0 50.0 50.0 50.0 50.0 50.0 0
Wealth Index Lowest 44.7 16.7 65.2 41.0 12.6 6.6 9.5 275Second 35.9 15.7 55.1 33.9 12.2 3.1 6.0 91Middle 38.8 10.2 53.9 33.4 18.6 6.0 7.1 65Fourth 26.6 11.0 40.2 21.5 14.6 9.9 13.7 38Highest 20.9 11.7 23.2 15.3 20.1 11.7 23.9 13
Percentage of children aged 0-59 months who are severely or moderately malnourished, MICS Punjab, 2007-08
Number of children
aged 0-59 months
Weight for age Height for age Weight for height
TEHSIL-WISE RESULTS OF DISTRICT RAJANPUR 7
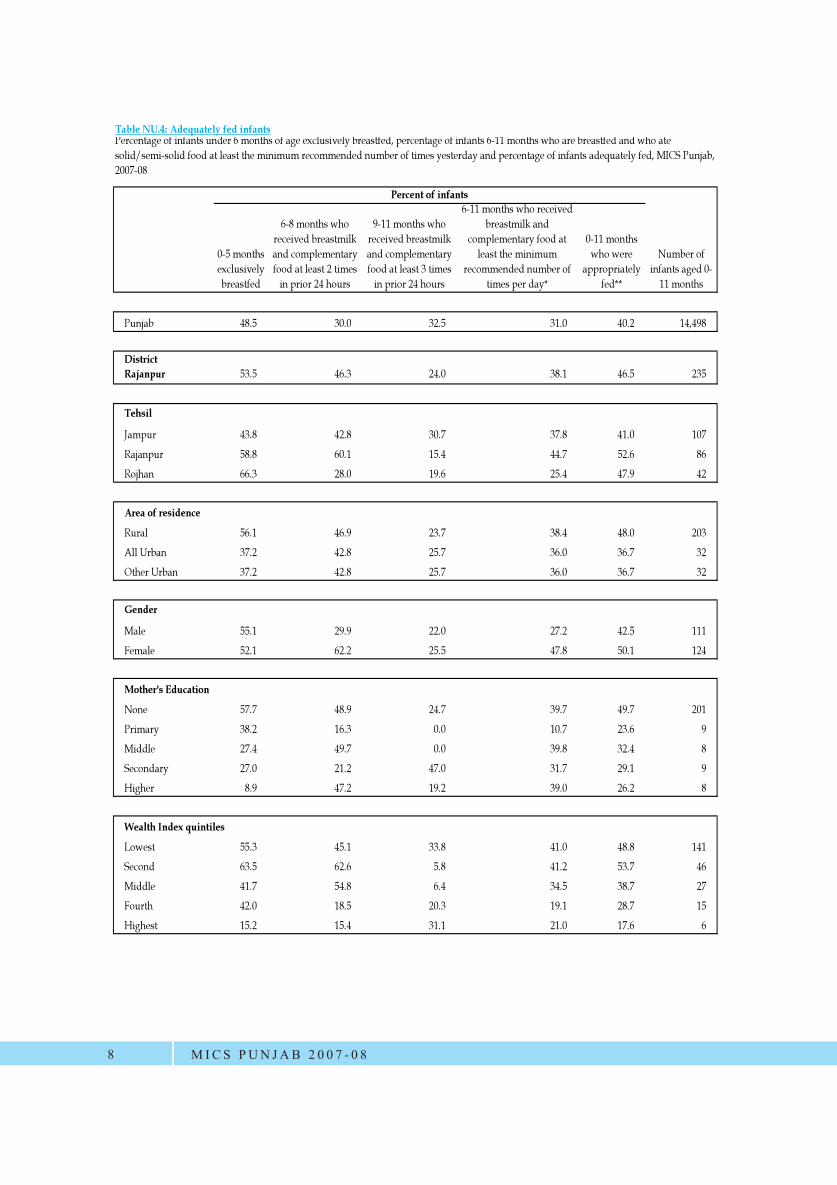
Table NU.4: Adequately fed infants
0-5 months exclusively breastfed
6-8 months who received breastmilk and complementary food at least 2 times
in prior 24 hours
9-11 months who received breastmilk and complementary food at least 3 times
in prior 24 hours
6-11 months who received breastmilk and
complementary food at least the minimum
recommended number of times per day*
0-11 months who were
appropriately fed**
Number of infants aged 0-
11 months
Punjab 48.5 30.0 32.5 31.0 40.2 14,498
District Rajanpur 53.5 46.3 24.0 38.1 46.5 235
Tehsil
Jampur 43.8 42.8 30.7 37.8 41.0 107
Rajanpur 58.8 60.1 15.4 44.7 52.6 86
Rojhan 66.3 28.0 19.6 25.4 47.9 42
Area of residence
Rural 56.1 46.9 23.7 38.4 48.0 203
All Urban 37.2 42.8 25.7 36.0 36.7 32
Other Urban 37.2 42.8 25.7 36.0 36.7 32
Gender
Male 55.1 29.9 22.0 27.2 42.5 111
Female 52.1 62.2 25.5 47.8 50.1 124
Mother's Education
None 57.7 48.9 24.7 39.7 49.7 201
Primary 38.2 16.3 0.0 10.7 23.6 9
Middle 27.4 49.7 0.0 39.8 32.4 8
Secondary 27.0 21.2 47.0 31.7 29.1 9
Higher 8.9 47.2 19.2 39.0 26.2 8
Wealth Index quintiles
Lowest 55.3 45.1 33.8 41.0 48.8 141
Second 63.5 62.6 5.8 41.2 53.7 46
Middle 41.7 54.8 6.4 34.5 38.7 27
Fourth 42.0 18.5 20.3 19.1 28.7 15
Highest 15.2 15.4 31.1 21.0 17.6 6
Percent of infants
Percentage of infants under 6 months of age exclusively breastfed, percentage of infants 6-11 months who are breastfed and who ate solid/semi-solid food at least the minimum recommended number of times yesterday and percentage of infants adequately fed, MICS Punjab, 2007-08
MICS PUN JAB 2 0 0 7 - 0 88
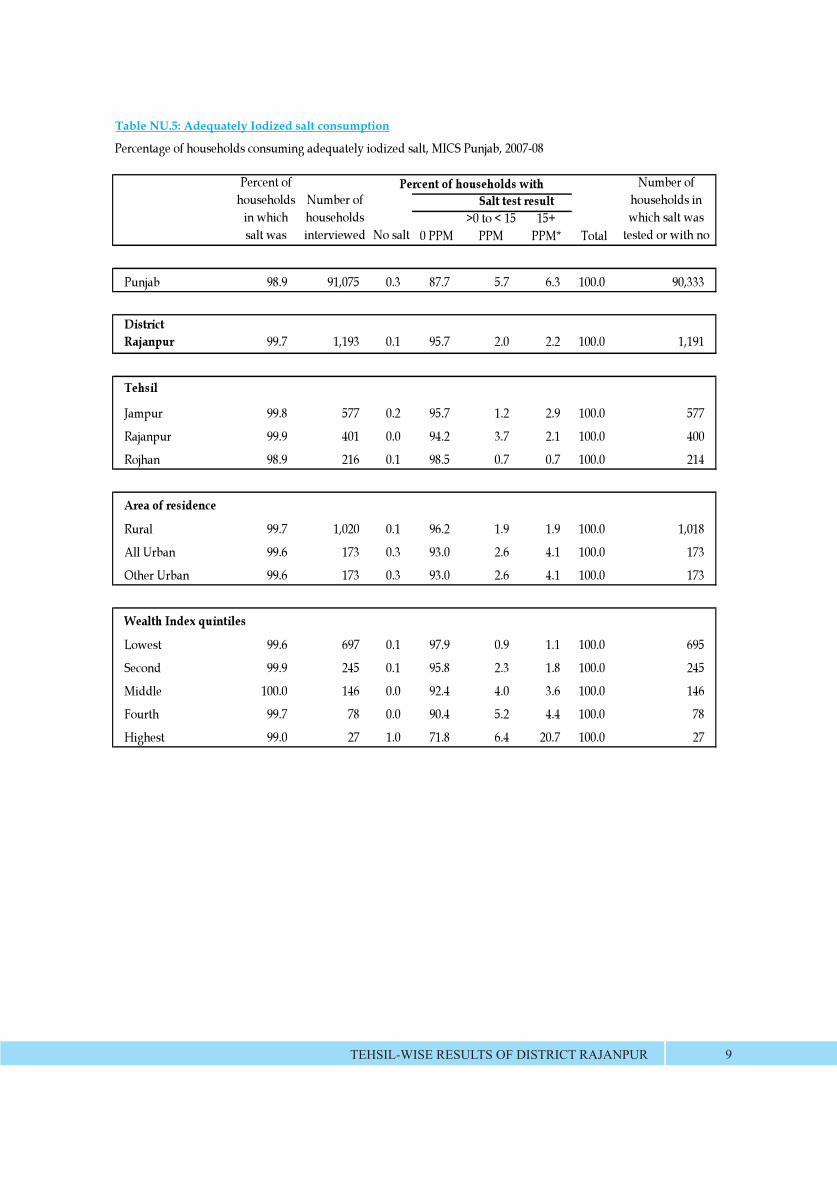
Table NU.5: Iodized salt consumptionPercentage of households consuming adequately iodized salt, MICS Punjab, 2007-08
0 PPM>0 to < 15
PPM15+
PPM* Total
Punjab 98.9 91,075 0.3 87.7 5.7 6.3 100.0 90,333
District Rajanpur 99.7 1,193 0.1 95.7 2.0 2.2 100.0 1,191
Tehsil
Jampur 99.8 577 0.2 95.7 1.2 2.9 100.0 577
Rajanpur 99.9 401 0.0 94.2 3.7 2.1 100.0 400
Rojhan 98.9 216 0.1 98.5 0.7 0.7 100.0 214
Area of residence
Rural 99.7 1,020 0.1 96.2 1.9 1.9 100.0 1,018
All Urban 99.6 173 0.3 93.0 2.6 4.1 100.0 173
Other Urban 99.6 173 0.3 93.0 2.6 4.1 100.0 173
Wealth Index quintiles
Lowest 99.6 697 0.1 97.9 0.9 1.1 100.0 695
Second 99.9 245 0.1 95.8 2.3 1.8 100.0 245
Middle 100.0 146 0.0 92.4 4.0 3.6 100.0 146
Fourth 99.7 78 0.0 90.4 5.2 4.4 100.0 78
Highest 99.0 27 1.0 71.8 6.4 20.7 100.0 27
Salt test resultNumber of
households in which salt was
tested or with no
Percent of households
in which salt was
Number of households interviewed
Percent of households with
No salt
TEHSIL-WISE RESULTS OF DISTRICT RAJANPUR 9
Table NU.5: Adequately Iodized salt consumption
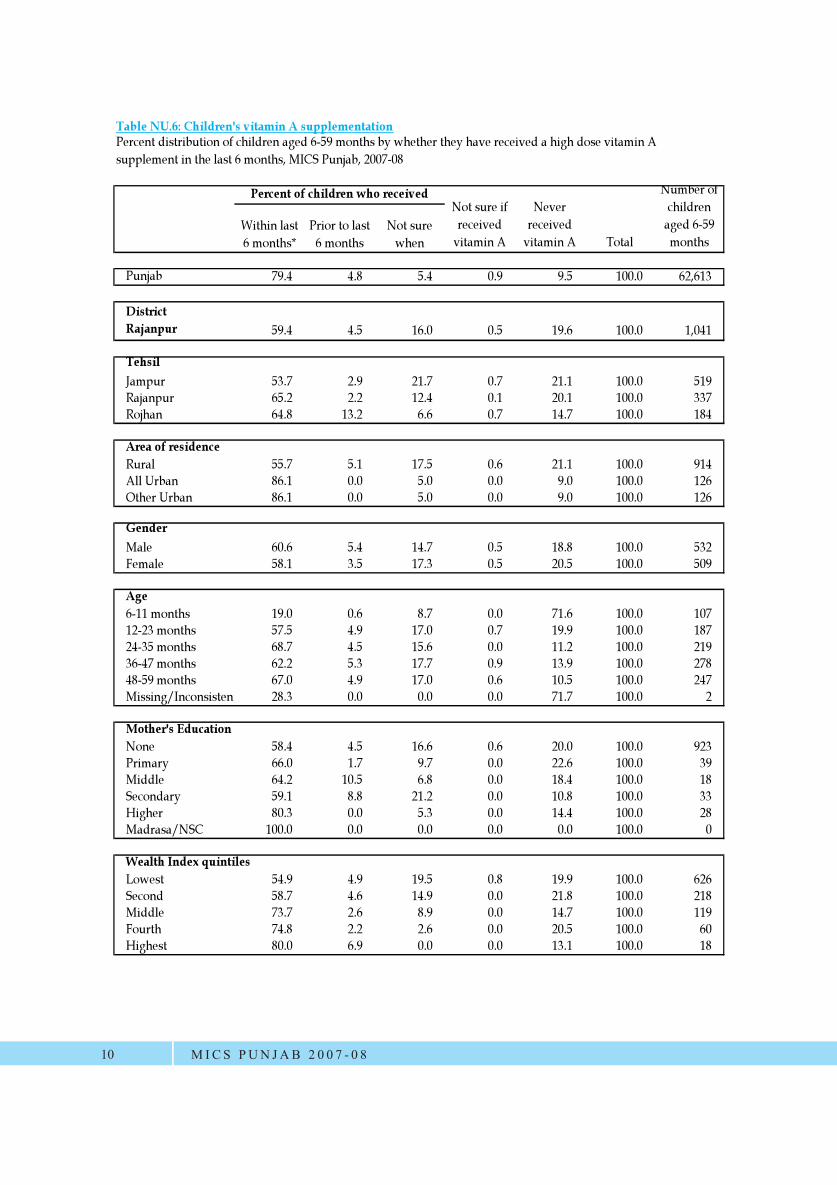
Table NU.6: Children's vitamin A supplementation
Within last 6 months*
Prior to last 6 months
Not sure when
Punjab 79.4 4.8 5.4 0.9 9.5 100.0 62,613
District Rajanpur 59.4 4.5 16.0 0.5 19.6 100.0 1,041
TehsilJampur 53.7 2.9 21.7 0.7 21.1 100.0 519Rajanpur 65.2 2.2 12.4 0.1 20.1 100.0 337Rojhan 64.8 13.2 6.6 0.7 14.7 100.0 184
Area of residenceRural 55.7 5.1 17.5 0.6 21.1 100.0 914All Urban 86.1 0.0 5.0 0.0 9.0 100.0 126Other Urban 86.1 0.0 5.0 0.0 9.0 100.0 126
GenderMale 60.6 5.4 14.7 0.5 18.8 100.0 532Female 58.1 3.5 17.3 0.5 20.5 100.0 509
Age6-11 months 19.0 0.6 8.7 0.0 71.6 100.0 10712-23 months 57.5 4.9 17.0 0.7 19.9 100.0 18724-35 months 68.7 4.5 15.6 0.0 11.2 100.0 21936-47 months 62.2 5.3 17.7 0.9 13.9 100.0 27848-59 months 67.0 4.9 17.0 0.6 10.5 100.0 247Missing/Inconsistent 28.3 0.0 0.0 0.0 71.7 100.0 2
Mother's EducationNone 58.4 4.5 16.6 0.6 20.0 100.0 923Primary 66.0 1.7 9.7 0.0 22.6 100.0 39Middle 64.2 10.5 6.8 0.0 18.4 100.0 18Secondary 59.1 8.8 21.2 0.0 10.8 100.0 33Higher 80.3 0.0 5.3 0.0 14.4 100.0 28Madrasa/NSC 100.0 0.0 0.0 0.0 0.0 100.0 0
Wealth Index quintilesLowest 54.9 4.9 19.5 0.8 19.9 100.0 626Second 58.7 4.6 14.9 0.0 21.8 100.0 218Middle 73.7 2.6 8.9 0.0 14.7 100.0 119Fourth 74.8 2.2 2.6 0.0 20.5 100.0 60Highest 80.0 6.9 0.0 0.0 13.1 100.0 18
Percent distribution of children aged 6-59 months by whether they have received a high dose vitamin A supplement in the last 6 months, MICS Punjab, 2007-08
Total
Number of children
aged 6-59 months
Percent of children who received Not sure if received
vitamin A
Never received
vitamin A
MICS PUN JAB 2 0 0 7 - 0 810
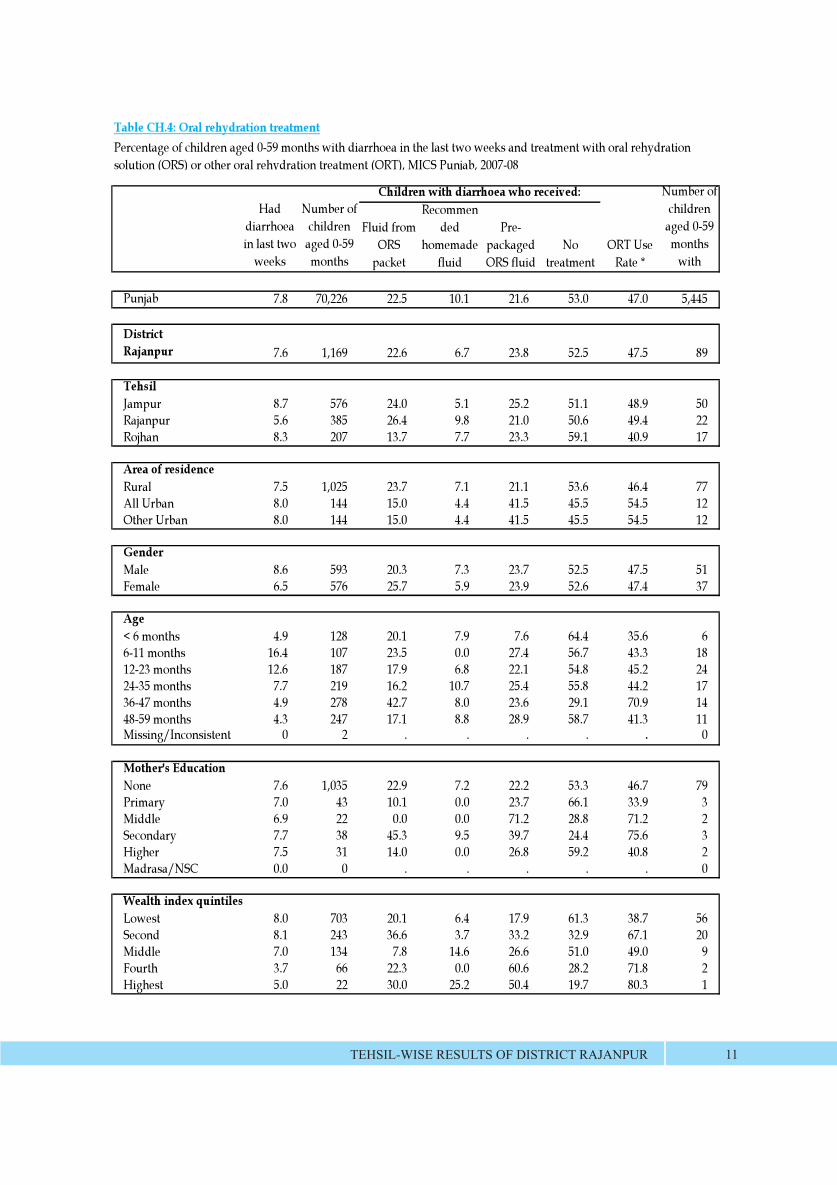
Fluid from ORS
packet
Recommended
homemade fluid
Pre-packaged ORS fluid
No treatment
ORT Use Rate *
Punjab 7.8 70,226 22.5 10.1 21.6 53.0 47.0 5,445
District Rajanpur 7.6 1,169 22.6 6.7 23.8 52.5 47.5 89
TehsilJampur 8.7 576 24.0 5.1 25.2 51.1 48.9 50Rajanpur 5.6 385 26.4 9.8 21.0 50.6 49.4 22Rojhan 8.3 207 13.7 7.7 23.3 59.1 40.9 17
Area of residenceRural 7.5 1,025 23.7 7.1 21.1 53.6 46.4 77All Urban 8.0 144 15.0 4.4 41.5 45.5 54.5 12Other Urban 8.0 144 15.0 4.4 41.5 45.5 54.5 12
GenderMale 8.6 593 20.3 7.3 23.7 52.5 47.5 51Female 6.5 576 25.7 5.9 23.9 52.6 47.4 37
Age< 6 months 4.9 128 20.1 7.9 7.6 64.4 35.6 66-11 months 16.4 107 23.5 0.0 27.4 56.7 43.3 1812-23 months 12.6 187 17.9 6.8 22.1 54.8 45.2 2424-35 months 7.7 219 16.2 10.7 25.4 55.8 44.2 1736-47 months 4.9 278 42.7 8.0 23.6 29.1 70.9 1448-59 months 4.3 247 17.1 8.8 28.9 58.7 41.3 11Missing/Inconsistent 0 2 . . . . . 0
Mother's EducationNone 7.6 1,035 22.9 7.2 22.2 53.3 46.7 79Primary 7.0 43 10.1 0.0 23.7 66.1 33.9 3Middle 6.9 22 0.0 0.0 71.2 28.8 71.2 2Secondary 7.7 38 45.3 9.5 39.7 24.4 75.6 3Higher 7.5 31 14.0 0.0 26.8 59.2 40.8 2Madrasa/NSC 0.0 0 . . . . . 0
Wealth index quintilesLowest 8.0 703 20.1 6.4 17.9 61.3 38.7 56Second 8.1 243 36.6 3.7 33.2 32.9 67.1 20Middle 7.0 134 7.8 14.6 26.6 51.0 49.0 9Fourth 3.7 66 22.3 0.0 60.6 28.2 71.8 2Highest 5.0 22 30.0 25.2 50.4 19.7 80.3 1
Table CH.4: Oral rehydration treatmentPercentage of children aged 0-59 months with diarrhoea in the last two weeks and treatment with oral rehydration solution (ORS) or other oral rehydration treatment (ORT), MICS Punjab, 2007-08
Had diarrhoea in last two
weeks
Number of children
aged 0-59 months
with
Number of children
aged 0-59 months
Children with diarrhoea who received:
TEHSIL-WISE RESULTS OF DISTRICT RAJANPUR 11
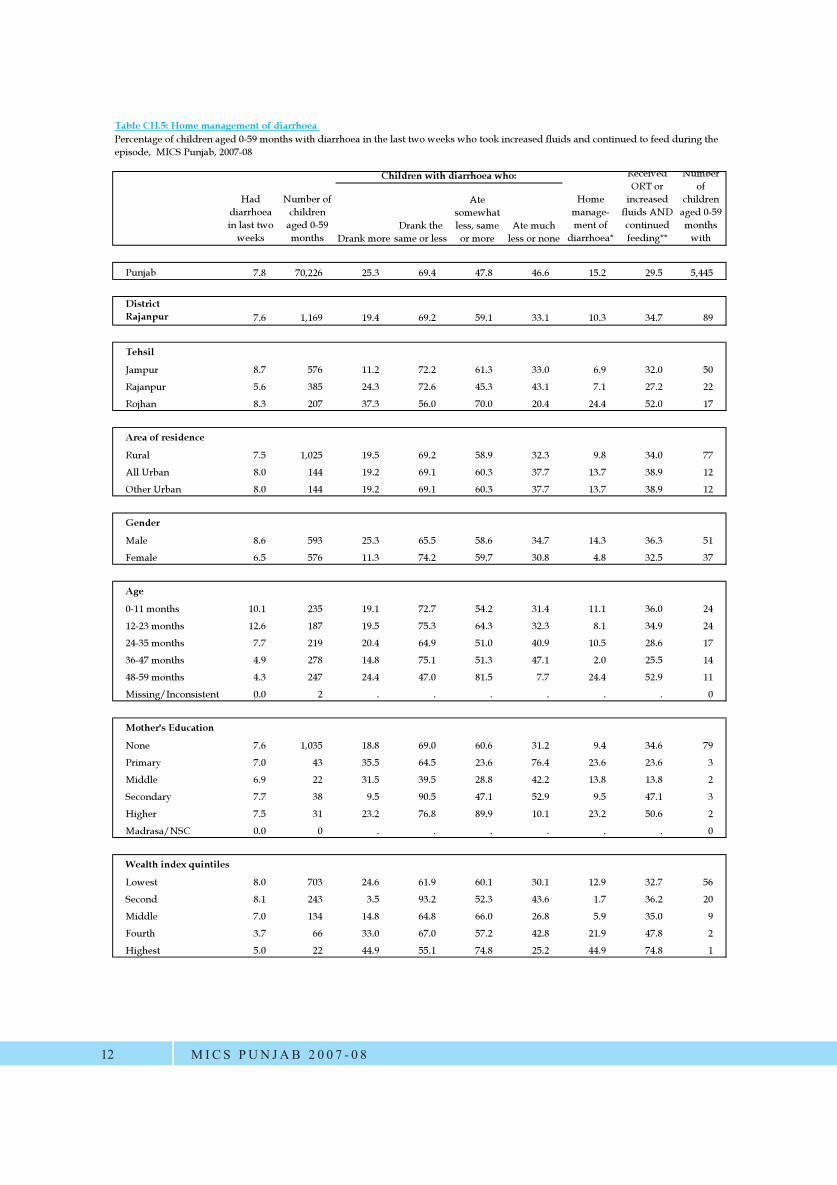
Table CH.5: Home management of diarrhoea
Drank moreDrank the
same or less
Ate somewhat less, same or more
Ate much less or none
Punjab 7.8 70,226 25.3 69.4 47.8 46.6 15.2 29.5 5,445
District Rajanpur 7.6 1,169 19.4 69.2 59.1 33.1 10.3 34.7 89
Tehsil
Jampur 8.7 576 11.2 72.2 61.3 33.0 6.9 32.0 50
Rajanpur 5.6 385 24.3 72.6 45.3 43.1 7.1 27.2 22
Rojhan 8.3 207 37.3 56.0 70.0 20.4 24.4 52.0 17
Area of residence
Rural 7.5 1,025 19.5 69.2 58.9 32.3 9.8 34.0 77
All Urban 8.0 144 19.2 69.1 60.3 37.7 13.7 38.9 12
Other Urban 8.0 144 19.2 69.1 60.3 37.7 13.7 38.9 12
Gender
Male 8.6 593 25.3 65.5 58.6 34.7 14.3 36.3 51
Female 6.5 576 11.3 74.2 59.7 30.8 4.8 32.5 37
Age
0-11 months 10.1 235 19.1 72.7 54.2 31.4 11.1 36.0 24
12-23 months 12.6 187 19.5 75.3 64.3 32.3 8.1 34.9 24
24-35 months 7.7 219 20.4 64.9 51.0 40.9 10.5 28.6 17
36-47 months 4.9 278 14.8 75.1 51.3 47.1 2.0 25.5 14
48-59 months 4.3 247 24.4 47.0 81.5 7.7 24.4 52.9 11
Missing/Inconsistent 0.0 2 . . . . . . 0
Mother's Education
None 7.6 1,035 18.8 69.0 60.6 31.2 9.4 34.6 79
Primary 7.0 43 35.5 64.5 23.6 76.4 23.6 23.6 3
Middle 6.9 22 31.5 39.5 28.8 42.2 13.8 13.8 2
Secondary 7.7 38 9.5 90.5 47.1 52.9 9.5 47.1 3
Higher 7.5 31 23.2 76.8 89.9 10.1 23.2 50.6 2
Madrasa/NSC 0.0 0 . . . . . . 0
Wealth index quintiles
Lowest 8.0 703 24.6 61.9 60.1 30.1 12.9 32.7 56
Second 8.1 243 3.5 93.2 52.3 43.6 1.7 36.2 20
Middle 7.0 134 14.8 64.8 66.0 26.8 5.9 35.0 9
Fourth 3.7 66 33.0 67.0 57.2 42.8 21.9 47.8 2
Highest 5.0 22 44.9 55.1 74.8 25.2 44.9 74.8 1
Children with diarrhoea who:
Home manage-ment of
diarrhoea*
Percentage of children aged 0-59 months with diarrhoea in the last two weeks who took increased fluids and continued to feed during the episode, MICS Punjab, 2007-08
Received ORT or
increased fluids AND continued feeding**
Number of
children aged 0-59 months
with
Number of children
aged 0-59 months
Had diarrhoea in last two
weeks
MICS PUN JAB 2 0 0 7 - 0 812
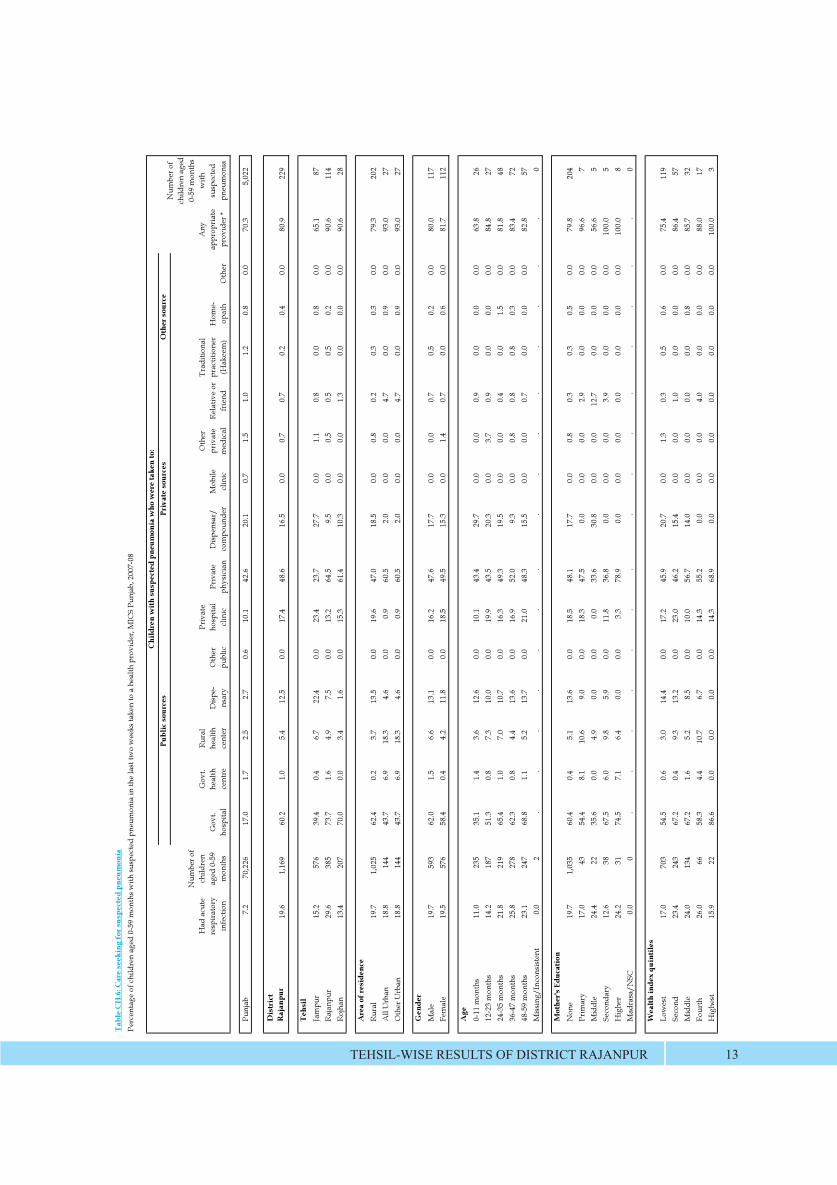
Tabl
e C
H.6
: Car
e se
ekin
g fo
r sus
pect
ed p
neum
onia
Perc
enta
ge o
f chi
ldre
n ag
ed 0
-59
mon
ths w
ith su
spec
ted
pneu
mon
ia in
the
last
two
wee
ks ta
ken
to a
hea
lth p
rovi
der,
MIC
S Pu
njab
, 200
7-08
Gov
t. ho
spita
l
Gov
t. he
alth
ce
ntre
Rura
l he
alth
ce
nter
Dis
pe-
nsar
yO
ther
pu
blic
Priv
ate
hosp
ital
clin
icPr
ivat
e ph
ysic
ian
Dis
pens
ar/
com
poun
der
Mob
ile
clin
ic
Oth
er
priv
ate
med
ical
Rela
tive
or
frie
nd
Trad
ition
al
prac
titio
ner
(Hak
eem
)H
ome-
opat
hO
ther
Punj
ab7.
270
,226
17.0
1.7
2.5
2.7
0.6
10.1
42.6
20.1
0.7
1.5
1.0
1.2
0.8
0.0
70.3
5,02
2
Dis
tric
t R
ajan
pur
19.6
1,16
960
.21.
05.
412
.50.
017
.448
.616
.50.
00.
70.
70.
20.
40.
080
.922
9
Tehs
ilJa
mpu
r15
.257
639
.40.
46.
722
.40.
023
.423
.727
.70.
01.
10.
80.
00.
80.
065
.187
Raja
npur
29.6
385
73.7
1.6
4.9
7.5
0.0
13.2
64.5
9.5
0.0
0.5
0.5
0.5
0.2
0.0
90.6
114
Rojh
an13
.420
770
.00.
03.
41.
60.
015
.361
.410
.30.
00.
01.
30.
00.
00.
090
.628
Are
a of
resi
denc
eRu
ral
19.7
1,02
562
.40.
23.
713
.50.
019
.647
.018
.50.
00.
80.
20.
30.
30.
079
.320
2A
ll U
rban
18.8
144
43.7
6.9
18.3
4.6
0.0
0.9
60.5
2.0
0.0
0.0
4.7
0.0
0.9
0.0
93.0
27O
ther
Urb
an18
.814
443
.76.
918
.34.
60.
00.
960
.52.
00.
00.
04.
70.
00.
90.
093
.027
Gen
der
Mal
e19
.759
362
.01.
56.
613
.10.
016
.247
.617
.70.
00.
00.
70.
50.
20.
080
.011
7Fe
mal
e19
.557
658
.40.
44.
211
.80.
018
.549
.515
.30.
01.
40.
70.
00.
60.
081
.711
2
Age
0-11
mon
ths
11.0
235
35.1
1.4
3.6
12.6
0.0
10.1
43.4
29.7
0.0
0.0
0.9
0.0
0.0
0.0
63.8
2612
-23
mon
ths
14.2
187
51.3
0.8
7.3
10.0
0.0
19.9
43.5
20.3
0.0
3.7
0.9
0.0
0.0
0.0
84.8
2724
-35
mon
ths
21.8
219
65.4
1.0
7.0
10.7
0.0
16.3
49.3
19.5
0.0
0.0
0.4
0.0
1.5
0.0
81.8
4836
-47
mon
ths
25.8
278
62.3
0.8
4.4
13.6
0.0
16.9
52.0
9.3
0.0
0.8
0.8
0.8
0.3
0.0
83.4
7248
-59
mon
ths
23.1
247
68.8
1.1
5.2
13.7
0.0
21.0
48.3
15.5
0.0
0.0
0.7
0.0
0.0
0.0
82.8
57M
issi
ng/I
ncon
sist
ent
0.0
2.
..
..
..
..
..
..
..
0
Mot
her's
Edu
cati
onN
one
19.7
1,03
560
.40.
45.
113
.60.
018
.548
.117
.70.
00.
80.
30.
30.
50.
079
.820
4Pr
imar
y17
.043
54.4
8.1
10.6
9.0
0.0
18.3
47.5
0.0
0.0
0.0
2.9
0.0
0.0
0.0
96.6
7M
iddl
e24
.422
35.6
0.0
4.9
0.0
0.0
0.0
33.6
30.8
0.0
0.0
12.7
0.0
0.0
0.0
56.6
5Se
cond
ary
12.6
3867
.56.
09.
85.
90.
011
.836
.80.
00.
00.
03.
90.
00.
00.
010
0.0
5H
ighe
r24
.231
74.5
7.1
6.4
0.0
0.0
3.3
78.9
0.0
0.0
0.0
0.0
0.0
0.0
0.0
100.
08
Mad
rasa
/NSC
0.0
0.
..
..
..
..
..
..
..
0
Wea
lth
inde
x qu
inti
les
Low
est
17.0
703
54.5
0.6
3.0
14.4
0.0
17.2
45.9
20.7
0.0
1.3
0.3
0.5
0.6
0.0
75.4
119
Seco
nd23
.424
367
.20.
49.
313
.20.
023
.046
.215
.40.
00.
01.
00.
00.
00.
086
.457
Mid
dle
24.0
134
67.2
1.6
5.2
8.5
0.0
10.0
56.7
14.0
0.0
0.0
0.0
0.0
0.8
0.0
85.7
32Fo
urth
26.0
6658
.34.
410
.76.
70.
014
.355
.20.
00.
00.
04.
00.
00.
00.
088
.017
Hig
hest
15.9
2286
.60.
00.
00.
00.
014
.368
.90.
00.
00.
00.
00.
00.
00.
010
0.0
3
Num
ber o
f ch
ildre
n ag
ed
0-59
mon
ths
with
su
spec
ted
pneu
mon
ia
Publ
ic s
ourc
esPr
ivat
e so
urce
s
Any
ap
prop
riat
e pr
ovid
er *
Oth
er s
ourc
e
Had
acu
te
resp
irat
ory
infe
ctio
n
Chi
ldre
n w
ith s
uspe
cted
pne
umon
ia w
ho w
ere
take
n to
:
Num
ber o
f ch
ildre
n ag
ed 0
-59
mon
ths
TEHSIL-WISE RESULTS OF DISTRICT RAJANPUR 13
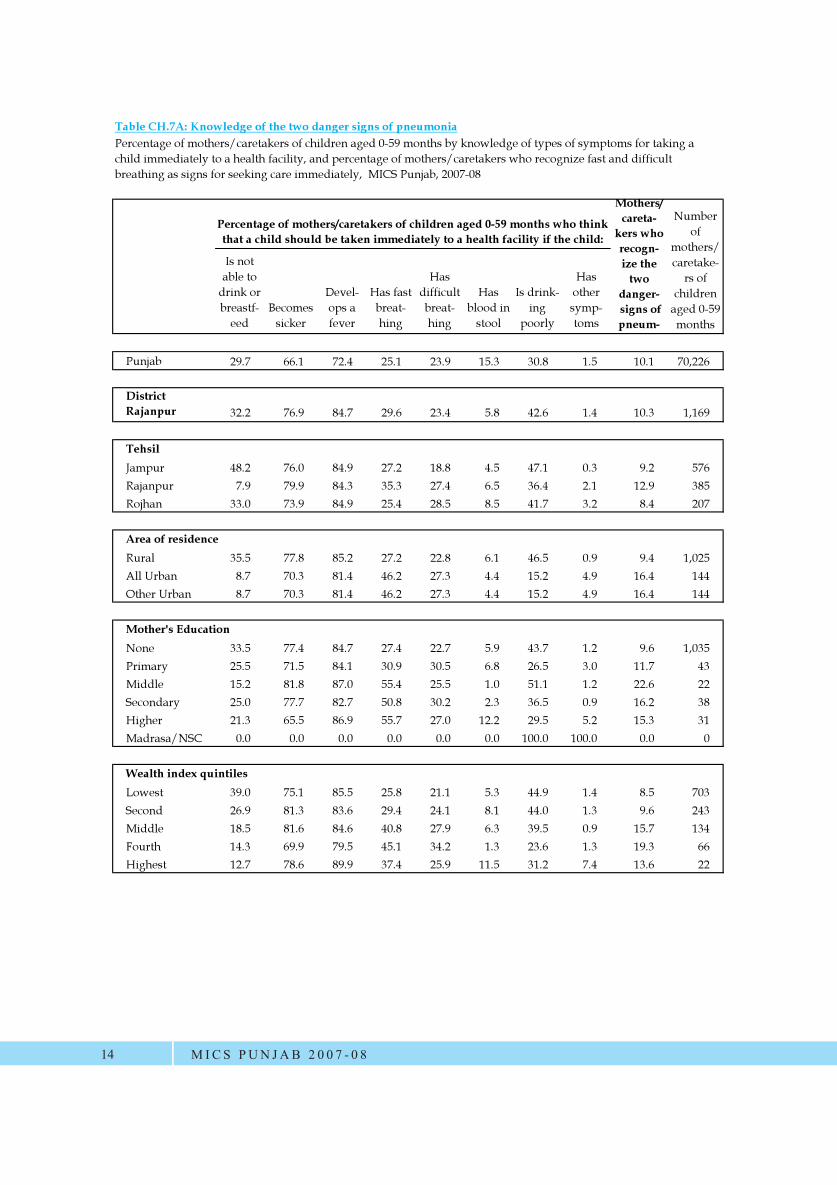
Table CH.7A: Knowledge of the two danger signs of pneumonia
Is not able to
drink or breastf-
eedBecomes
sicker
Devel-ops a fever
Has fast breat-hing
Has difficult breat-hing
Has blood in
stool
Is drink-ing
poorly
Has other symp-toms
Punjab 29.7 66.1 72.4 25.1 23.9 15.3 30.8 1.5 10.1 70,226
District Rajanpur 32.2 76.9 84.7 29.6 23.4 5.8 42.6 1.4 10.3 1,169
TehsilJampur 48.2 76.0 84.9 27.2 18.8 4.5 47.1 0.3 9.2 576Rajanpur 7.9 79.9 84.3 35.3 27.4 6.5 36.4 2.1 12.9 385Rojhan 33.0 73.9 84.9 25.4 28.5 8.5 41.7 3.2 8.4 207
Area of residenceRural 35.5 77.8 85.2 27.2 22.8 6.1 46.5 0.9 9.4 1,025All Urban 8.7 70.3 81.4 46.2 27.3 4.4 15.2 4.9 16.4 144Other Urban 8.7 70.3 81.4 46.2 27.3 4.4 15.2 4.9 16.4 144
Mother's EducationNone 33.5 77.4 84.7 27.4 22.7 5.9 43.7 1.2 9.6 1,035Primary 25.5 71.5 84.1 30.9 30.5 6.8 26.5 3.0 11.7 43Middle 15.2 81.8 87.0 55.4 25.5 1.0 51.1 1.2 22.6 22Secondary 25.0 77.7 82.7 50.8 30.2 2.3 36.5 0.9 16.2 38Higher 21.3 65.5 86.9 55.7 27.0 12.2 29.5 5.2 15.3 31Madrasa/NSC 0.0 0.0 0.0 0.0 0.0 0.0 100.0 100.0 0.0 0
Wealth index quintilesLowest 39.0 75.1 85.5 25.8 21.1 5.3 44.9 1.4 8.5 703Second 26.9 81.3 83.6 29.4 24.1 8.1 44.0 1.3 9.6 243Middle 18.5 81.6 84.6 40.8 27.9 6.3 39.5 0.9 15.7 134Fourth 14.3 69.9 79.5 45.1 34.2 1.3 23.6 1.3 19.3 66Highest 12.7 78.6 89.9 37.4 25.9 11.5 31.2 7.4 13.6 22
Percentage of mothers/caretakers of children aged 0-59 months who think that a child should be taken immediately to a health facility if the child:
Percentage of mothers/caretakers of children aged 0-59 months by knowledge of types of symptoms for taking a child immediately to a health facility, and percentage of mothers/caretakers who recognize fast and difficult breathing as signs for seeking care immediately, MICS Punjab, 2007-08
Mothers/ careta-
kers who recogn-ize the
two danger- signs of pneum-
Number of
mothers/caretake-
rs of children
aged 0-59 months
MICS PUN JAB 2 0 0 7 - 0 814
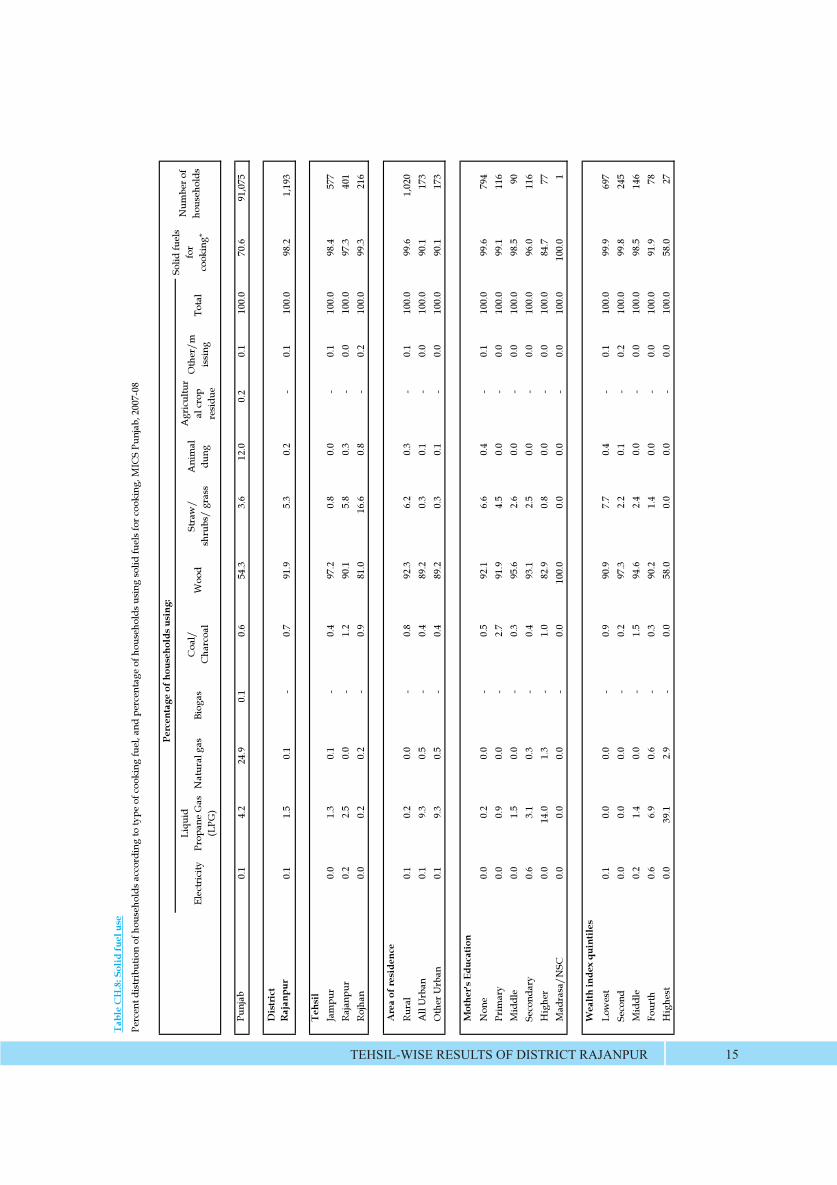
Tabl
e C
H.8
: Sol
id fu
el u
se
Perc
ent d
istr
ibut
ion
of h
ouse
hold
s acc
ordi
ng to
type
of c
ooki
ng fu
el, a
nd p
erce
ntag
e of
hou
seho
lds u
sing
solid
fuel
s for
coo
king
, MIC
S Pu
njab
, 200
7-08
Elec
tric
ityLi
quid
Pr
opan
e G
as
(LPG
)N
atur
al g
asBi
ogas
Coa
l/
Cha
rcoa
lW
ood
Stra
w/
shru
bs/
gras
sA
nim
al
dung
Agr
icul
tur
al c
rop
resi
due
Oth
er/m
issi
ngTo
tal
Punj
ab0.
14.
224
.90.
10.
654
.33.
612
.00.
20.
110
0.0
70.6
91,0
75
Dis
tric
t R
ajan
pur
0.1
1.5
0.1
-0.
791
.95.
30.
2-
0.1
100.
098
.21,
193
Tehs
ilJa
mpu
r0.
01.
30.
1-
0.4
97.2
0.8
0.0
-0.
110
0.0
98.4
577
Raj
anpu
r0.
22.
50.
0-
1.2
90.1
5.8
0.3
-0.
010
0.0
97.3
401
Roj
han
0.0
0.2
0.2
-0.
981
.016
.60.
8-
0.2
100.
099
.321
6
Are
a of
resi
denc
eR
ural
0.1
0.2
0.0
-0.
892
.36.
20.
3-
0.1
100.
099
.61,
020
All
Urb
an0.
19.
30.
5-
0.4
89.2
0.3
0.1
-0.
010
0.0
90.1
173
Oth
er U
rban
0.1
9.3
0.5
-0.
489
.20.
30.
1-
0.0
100.
090
.117
3
Mot
her's
Edu
catio
nN
one
0.0
0.2
0.0
-0.
592
.16.
60.
4-
0.1
100.
099
.679
4Pr
imar
y0.
00.
90.
0-
2.7
91.9
4.5
0.0
-0.
010
0.0
99.1
116
Mid
dle
0.0
1.5
0.0
-0.
395
.62.
60.
0-
0.0
100.
098
.590
Seco
ndar
y0.
63.
10.
3-
0.4
93.1
2.5
0.0
-0.
010
0.0
96.0
116
Hig
her
0.0
14.0
1.3
-1.
082
.90.
80.
0-
0.0
100.
084
.777
Mad
rasa
/NSC
0.0
0.0
0.0
-0.
010
0.0
0.0
0.0
-0.
010
0.0
100.
01
Wea
lth in
dex
quin
tiles
Low
est
0.1
0.0
0.0
-0.
990
.97.
70.
4-
0.1
100.
099
.969
7Se
cond
0.0
0.0
0.0
-0.
297
.32.
20.
1-
0.2
100.
099
.824
5M
iddl
e0.
21.
40.
0-
1.5
94.6
2.4
0.0
-0.
010
0.0
98.5
146
Four
th0.
66.
90.
6-
0.3
90.2
1.4
0.0
-0.
010
0.0
91.9
78H
ighe
st0.
039
.12.
9-
0.0
58.0
0.0
0.0
-0.
010
0.0
58.0
27
Num
ber o
f ho
useh
olds
Perc
enta
ge o
f hou
seho
lds
usin
g:So
lid fu
els
for
cook
ing*
TEHSIL-WISE RESULTS OF DISTRICT RAJANPUR 15
BLANK
MICS PUN JAB 2 0 0 7 - 0 816
Tabl
e EN
.1: U
se o
f im
prov
ed w
ater
sou
rces
Pipe
d in
to
dwel
ling
Pipe
d in
to
yard
or
plot
Publ
ic
tap/
stan
dpi
pe
Han
d Pu
mp
Don
key
Pum
p
Prot
ecte
d w
ell w
ithin
dw
ellin
g
Tube
wel
l/tur
bine
Prot
ecte
d:
wel
l out
side
dw
ellin
g/
sprin
g,
rain
wat
er
Bottl
ed/c
an w
ater
Unp
rote
cted
: w
ell w
ithin
or
outs
ide
dwel
ling/
un
prot
ecte
d
Tank
er/C
art w
ith
smak
k ta
nk
Surfa
ce
wat
er
Bottl
ed/
can
wat
er
Oth
er/M
issi
ngTo
tal
Impr
oved
so
urce
of
drin
king
w
ater
*
Num
ber o
f ho
useh
old
mem
bers
Punj
ab16
.50.
42.
931
.639
.40.
83.
20.
81.
40.
40.
70.
30.
41.
410
0.0
96.8
592,
843
Dis
tric
t R
ajan
pur
5.0
0.7
4.5
62.8
14.8
0.1
2.1
0.0
0.2
2.4
0.2
6.3
0.7
0.2
100.
090
.17,
935
Tehs
ilJa
mpu
r5.
50.
46.
358
.613
.80.
23.
90.
10.
04.
80.
15.
80.
30.
210
0.0
88.8
3,93
2R
ajan
pur
3.7
0.5
1.9
61.3
21.7
0.1
0.0
0.0
0.4
0.0
0.0
9.4
1.0
0.0
100.
089
.62,
691
Roj
han
5.9
2.1
4.1
78.1
3.9
0.0
0.9
0.0
0.4
0.1
1.0
1.4
1.3
0.8
100.
095
.41,
312
Area
of r
esid
ence
Rur
al3.
50.
45.
368
.67.
90.
12.
50.
00.
22.
80.
37.
50.
90.
110
0.0
88.5
6,71
1Al
l Urb
an13
.12.
30.
130
.652
.60.
00.
00.
20.
20.
00.
00.
00.
00.
810
0.0
99.2
1,22
4O
ther
Urb
an13
.12.
30.
130
.652
.60.
00.
00.
20.
20.
00.
00.
00.
00.
810
0.0
99.2
1,22
4R
ural
3.5
0.4
5.3
68.6
7.9
0.1
2.5
0.0
0.2
2.8
0.3
7.5
0.9
0.1
100.
088
.56,
711
Educ
atio
n of
hea
d of
hou
seho
ldN
one
3.0
0.6
5.4
68.6
6.9
0.2
3.0
0.1
0.2
3.1
0.3
7.6
0.8
0.2
100.
088
.15,
215
Prim
ary
6.2
0.4
3.1
65.0
18.2
0.0
0.2
0.0
0.0
1.0
0.0
4.7
0.4
0.7
100.
093
.278
0M
iddl
e9.
81.
04.
457
.123
.20.
01.
10.
00.
02.
20.
01.
00.
00.
210
0.0
96.6
619
Seco
ndar
y8.
71.
11.
446
.034
.70.
00.
00.
00.
31.
10.
05.
81.
00.
010
0.0
92.1
818
Hig
her
11.4
0.8
2.0
33.0
47.9
0.0
0.0
0.0
0.2
0.0
1.0
2.7
1.0
0.0
100.
095
.349
9M
adra
sa/N
SC0.
00.
00.
00.
010
0.0
0.0
0.0
0.0
0.0
0.0
0.0
0.0
0.0
0.0
100.
010
0.0
5
Wea
lth in
dex
quin
tiles
Low
est
1.0
0.1
5.7
75.7
0.7
0.1
2.0
0.0
0.2
3.8
0.3
9.5
0.7
0.2
100.
085
.54,
469
Seco
nd6.
01.
73.
468
.410
.20.
03.
50.
20.
21.
10.
33.
70.
90.
410
0.0
93.6
1,71
7M
iddl
e14
.41.
63.
338
.239
.30.
01.
30.
00.
00.
00.
01.
40.
40.
010
0.0
98.2
1,01
9Fo
urth
13.5
0.5
1.6
5.2
77.3
1.1
0.3
0.0
0.5
0.0
0.0
0.0
0.0
0.0
100.
010
0.0
554
Hig
hest
15.0
0.0
0.0
2.7
79.5
0.0
0.0
0.0
0.0
0.0
0.0
0.0
2.8
0.0
100.
097
.217
6
Mai
n so
urce
of d
rinki
ng w
ater
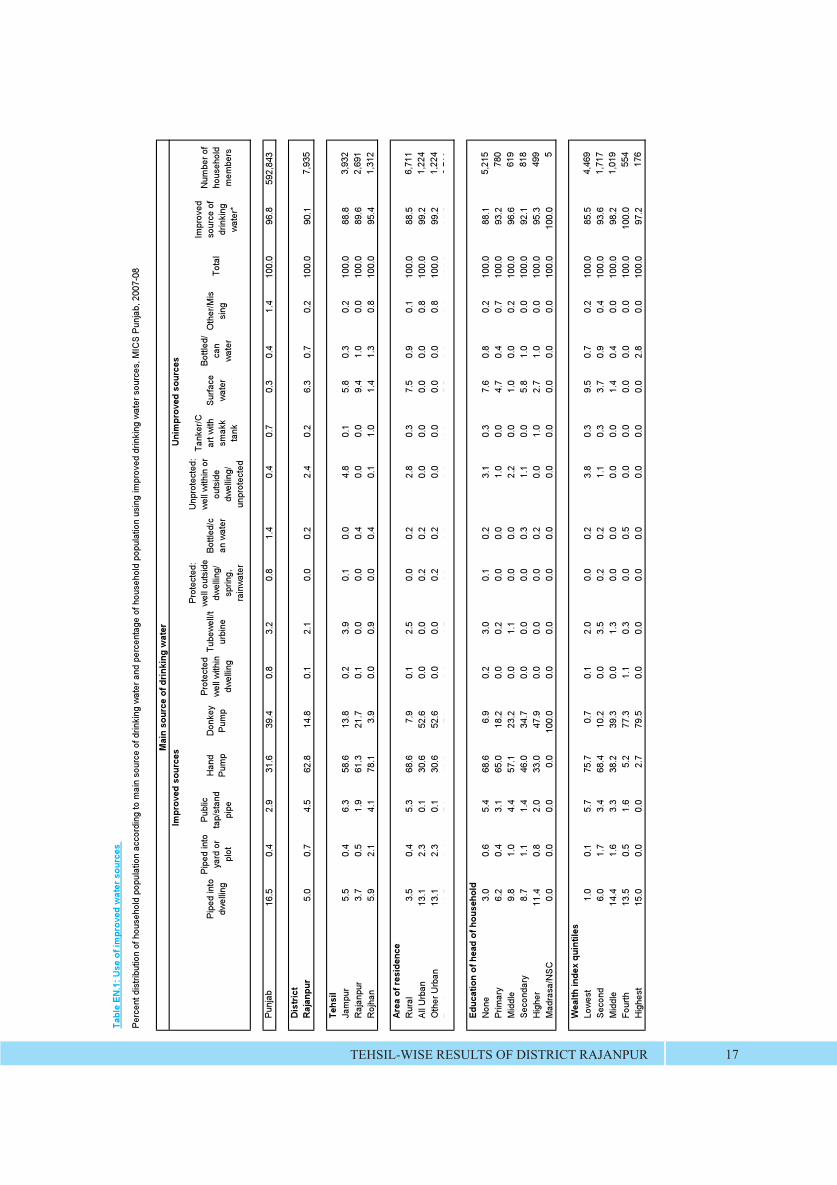
Perc
ent d
istri
butio
n of
hou
seho
ld p
opul
atio
n ac
cord
ing
to m
ain
sour
ce o
f drin
king
wat
er a
nd p
erce
ntag
e of
hou
seho
ld p
opul
atio
n us
ing
impr
oved
drin
king
wat
er s
ourc
es, M
ICS
Punj
ab, 2
007-
08
Impr
oved
sou
rces
Uni
mpr
oved
sou
rces
TEHSIL-WISE RESULTS OF DISTRICT RAJANPUR 17
Tab
le E
N.2
: Hou
seho
ld w
ater
trea
tmen
t
Non
eBo
il
Add
bl
each
/chl
orin
e or
Sol
ar
disi
nfec
tion
Stra
in
thro
ugh
a cl
oth
Use
w
ater
fi
lter
Let i
t st
and
and
sett
leO
ther
/D
K
App
ropr
iate
w
ater
tr
eatm
ent
met
hod*
Num
ber
of
hous
ehol
d m
embe
rs
App
ropr
iate
w
ater
tr
eatm
ent
met
hod
Num
ber
of
hous
ehol
d m
embe
rs
App
ropr
iate
w
ater
tr
eatm
ent
met
hod
Num
ber
of
hous
ehol
d m
embe
rs
Punj
ab93
.82.
80.
00.
22.
01.
00.
14.
859
2,84
34.
957
3,93
02.
618
,913
Dis
tric
t R
ajan
pur
95.8
0.3
0.1
3.0
0.3
0.5
0.0
0.6
7,93
50.
47,
152
2.6
783
Teh
sil
Jam
pur
95.5
0.2
0.0
3.4
0.1
0.9
0.0
0.2
3,93
20.
33,
491
0.0
442
Raj
anpu
r94
.40.
60.
23.
80.
50.
10.
01.
42,
691
0.7
2,41
17.
328
0R
ojha
n99
.40.
00.
00.
30.
30.
00.
00.
31,
312
0.3
1,25
10.
061
Are
a of
res
iden
ceR
ural
95.3
0.3
0.1
3.5
0.1
0.6
0.0
0.5
6,71
10.
25,
938
2.7
773
All
Urb
an98
.30.
40.
00.
11.
10.
00.
01.
51,
224
1.5
1,21
40.
010
Oth
er U
rban
98.3
0.4
0.0
0.1
1.1
0.0
0.0
1.5
1,22
41.
51,
214
0.0
10
Educ
atio
n of
hea
d of
hou
seho
ldN
one
95.9
0.2
0.1
3.3
0.0
0.3
0.0
0.3
5,21
50.
04,
594
2.5
621
Prim
ary
95.8
0.0
0.0
1.9
0.0
2.3
0.0
0.0
780
0.0
727
0.0
53M
iddl
e99
.40.
00.
00.
60.
00.
00.
00.
061
90.
059
80.
021
Seco
ndar
y94
.70.
00.
03.
90.
70.
60.
00.
781
80.
875
30.
065
Hig
her
92.8
1.6
0.0
2.7
2.9
0.0
0.0
4.5
499
3.7
475
21.2
23M
adra
sa/N
SC0.
010
0.0
0.0
0.0
0.0
0.0
0.0
100.
05
100.
05
.0
Wea
lth
inde
x qu
inti
les
Low
est
94.7
0.2
0.1
4.2
0.0
0.6
0.0
0.3
4,46
90.
03,
820
2.4
649
Seco
nd97
.00.
00.
02.
20.
00.
60.
00.
01,
717
0.0
1,60
70.
011
0M
iddl
e98
.90.
00.
01.
10.
00.
00.
00.
01,
019
0.0
1,00
10.
019
Four
th97
.71.
60.
00.
00.
80.
00.
02.
355
42.
355
4.
0H
ighe
st87
.73.
20.
00.
09.
10.
00.
012
.317
69.
717
110
0.0
5
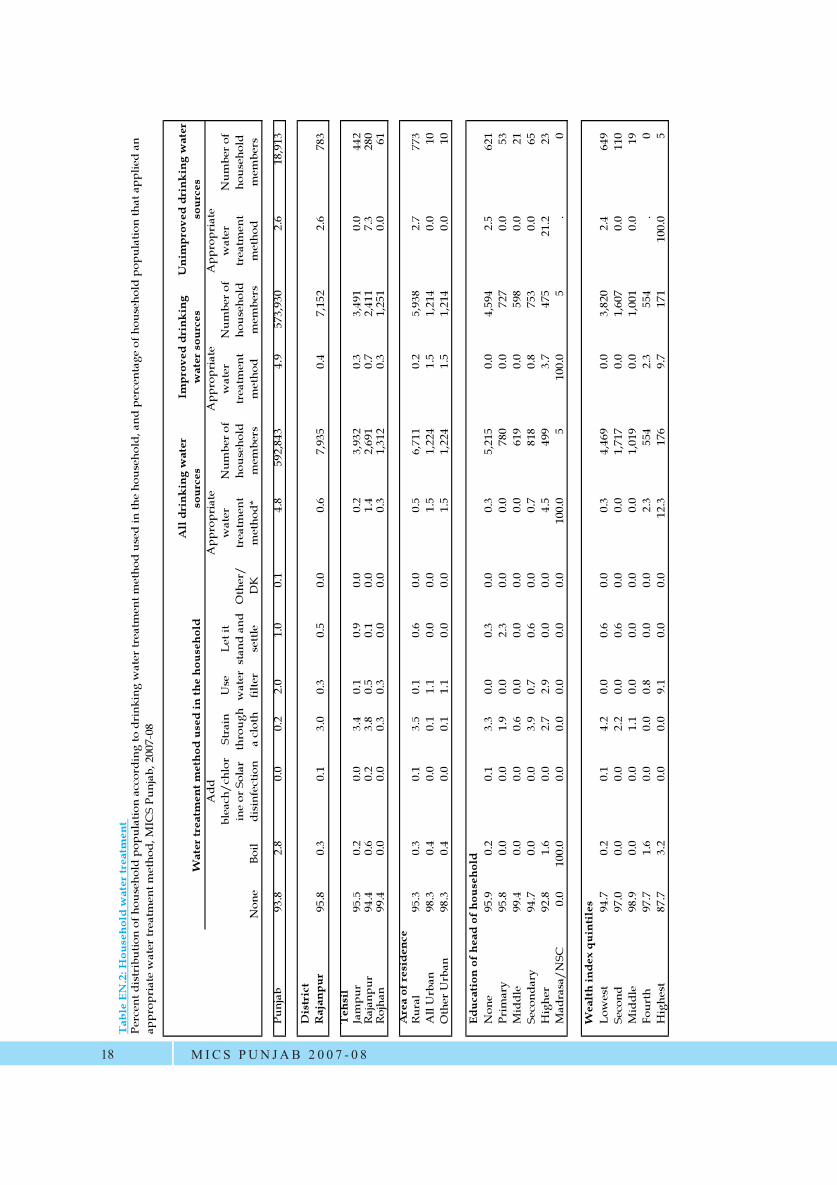
Perc
ent d
istr
ibut
ion
of h
ouse
hold
pop
ulat
ion
acco
rdin
g to
dri
nkin
g w
ater
trea
tmen
t met
hod
used
in th
e ho
useh
old,
and
per
cent
age
of h
ouse
hold
pop
ulat
ion
that
app
lied
an
appr
opri
ate
wat
er tr
eatm
ent m
etho
d, M
ICS
Punj
ab, 2
007-
08
All
dri
nkin
g w
ater
so
urce
sIm
prov
ed d
rink
ing
wat
er s
ourc
esU
nim
prov
ed d
rink
ing
wat
er
sour
ces
Wat
er tr
eatm
ent m
etho
d us
ed in
the
hous
ehol
d
MICS PUN JAB 2 0 0 7 - 0 818
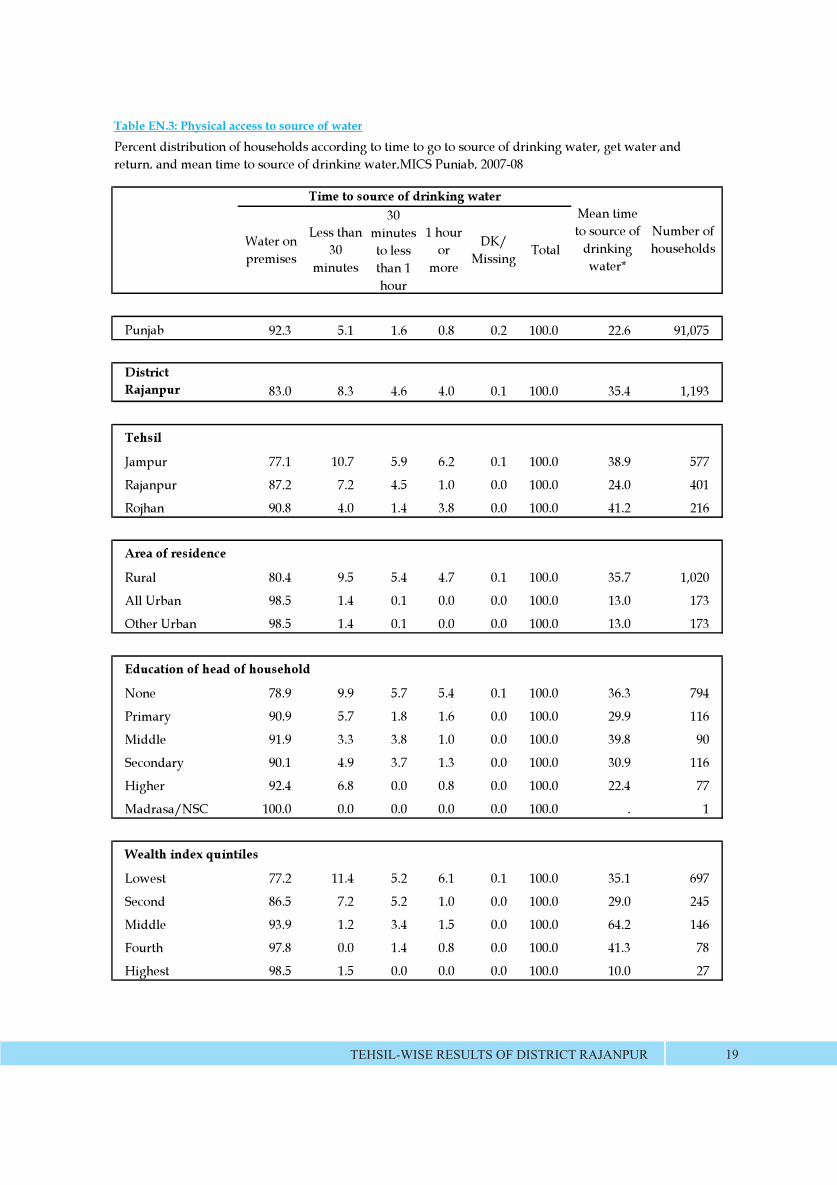
Table EN.3: Physical access to source of water
Water on premises
Less than 30
minutes
30 minutes to less than 1 hour
1 hour or
more
DK/ Missing Total
Punjab 92.3 5.1 1.6 0.8 0.2 100.0 22.6 91,075
District Rajanpur 83.0 8.3 4.6 4.0 0.1 100.0 35.4 1,193
Tehsil
Jampur 77.1 10.7 5.9 6.2 0.1 100.0 38.9 577
Rajanpur 87.2 7.2 4.5 1.0 0.0 100.0 24.0 401
Rojhan 90.8 4.0 1.4 3.8 0.0 100.0 41.2 216
Area of residence
Rural 80.4 9.5 5.4 4.7 0.1 100.0 35.7 1,020
All Urban 98.5 1.4 0.1 0.0 0.0 100.0 13.0 173
Other Urban 98.5 1.4 0.1 0.0 0.0 100.0 13.0 173
Education of head of household
None 78.9 9.9 5.7 5.4 0.1 100.0 36.3 794
Primary 90.9 5.7 1.8 1.6 0.0 100.0 29.9 116
Middle 91.9 3.3 3.8 1.0 0.0 100.0 39.8 90
Secondary 90.1 4.9 3.7 1.3 0.0 100.0 30.9 116
Higher 92.4 6.8 0.0 0.8 0.0 100.0 22.4 77
Madrasa/NSC 100.0 0.0 0.0 0.0 0.0 100.0 . 1
Wealth index quintiles
Lowest 77.2 11.4 5.2 6.1 0.1 100.0 35.1 697
Second 86.5 7.2 5.2 1.0 0.0 100.0 29.0 245
Middle 93.9 1.2 3.4 1.5 0.0 100.0 64.2 146
Fourth 97.8 0.0 1.4 0.8 0.0 100.0 41.3 78
Highest 98.5 1.5 0.0 0.0 0.0 100.0 10.0 27
Percent distribution of households according to time to go to source of drinking water, get water and return, and mean time to source of drinking water,MICS Punjab, 2007-08
Time to source of drinking waterMean time to source of
drinking water*
Number of households
TEHSIL-WISE RESULTS OF DISTRICT RAJANPUR 19
Table EN.3: Physical access to source of water
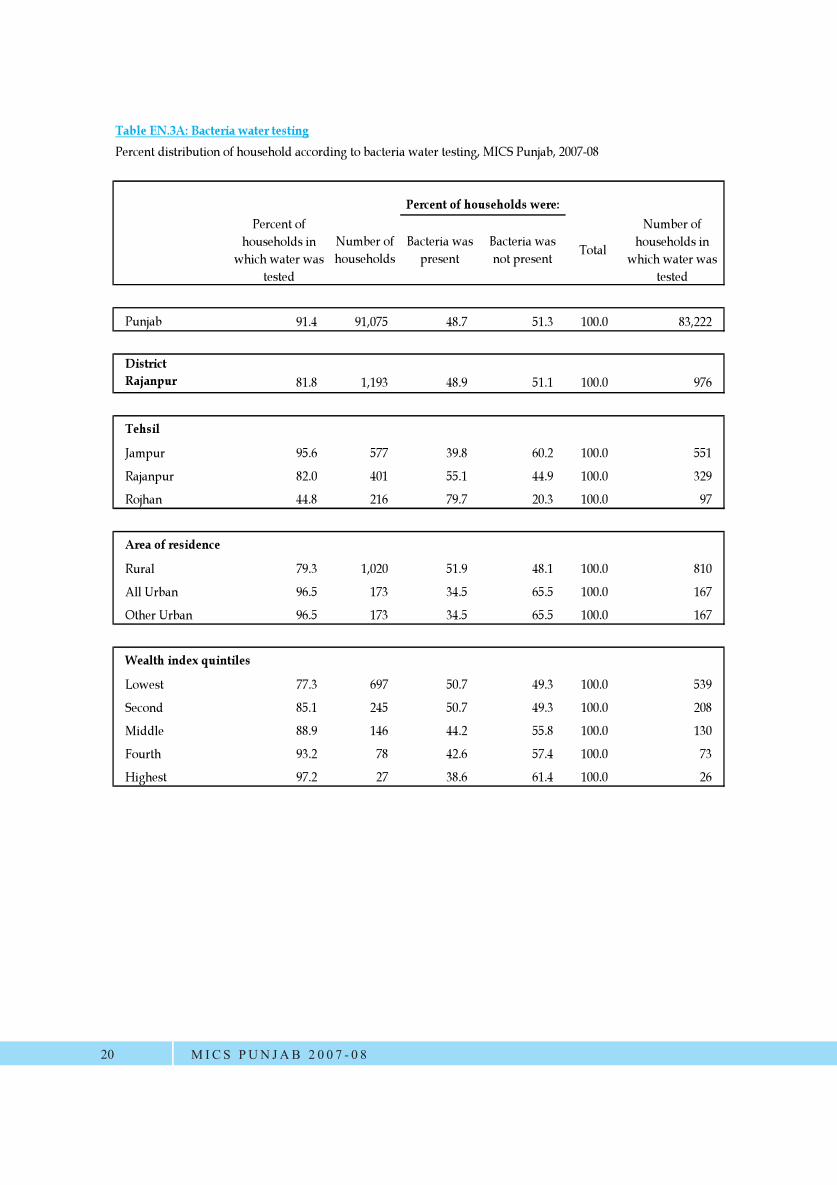
Percent of households in
which water was tested
Number of households
Bacteria was present
Bacteria was not present Total
Number of households in
which water was tested
Punjab 91.4 91,075 48.7 51.3 100.0 83,222
District Rajanpur 81.8 1,193 48.9 51.1 100.0 976
Tehsil
Jampur 95.6 577 39.8 60.2 100.0 551
Rajanpur 82.0 401 55.1 44.9 100.0 329
Rojhan 44.8 216 79.7 20.3 100.0 97
Area of residence
Rural 79.3 1,020 51.9 48.1 100.0 810
All Urban 96.5 173 34.5 65.5 100.0 167
Other Urban 96.5 173 34.5 65.5 100.0 167
Wealth index quintiles
Lowest 77.3 697 50.7 49.3 100.0 539
Second 85.1 245 50.7 49.3 100.0 208
Middle 88.9 146 44.2 55.8 100.0 130
Fourth 93.2 78 42.6 57.4 100.0 73
Highest 97.2 27 38.6 61.4 100.0 26
Percent distribution of household according to bacteria water testing, MICS Punjab, 2007-08Table EN.3A: Bacteria water testing
Percent of households were:
MICS PUN JAB 2 0 0 7 - 0 820

Pipe
d se
wer
sy
stem
Sept
ic
tank
Pit l
atrin
e
Punj
ab20
.936
.59.
60.
71.
60.
10.
329
.40.
50.
310
0.0
69.5
592,
843
Dis
tric
t R
ajan
pur
3.8
14.3
11.6
2.1
0.1
0.1
1.0
63.4
3.3
0.1
100.
032
.17,
935
Tehs
ilJa
mpu
r6.
915
.99.
81.
60.
10.
10.
964
.10.
40.
210
0.0
34.5
3,93
2Ra
janp
ur1.
117
.216
.22.
30.
00.
01.
353
.28.
60.
110
0.0
36.8
2,69
1Ro
jhan
0.2
4.0
7.6
3.1
0.3
0.2
0.9
82.4
1.0
0.0
100.
015
.61,
312
Are
a of
resi
denc
eRu
ral
1.5
9.4
11.1
2.1
0.1
0.1
1.0
74.5
0.2
0.1
100.
024
.36,
711
All
Urb
an16
.741
.714
.71.
90.
20.
01.
43.
020
.40.
210
0.0
75.1
1,22
4O
ther
Urb
an16
.741
.714
.71.
90.
20.
01.
43.
020
.40.
210
0.0
75.1
1,22
4
Educ
atio
n of
hea
d of
hou
seho
ldN
one
1.8
8.5
7.1
1.8
0.2
0.1
1.1
77.7
1.8
0.1
100.
019
.35,
215
Prim
ary
5.8
18.6
17.6
1.9
0.0
0.0
1.4
50.1
4.7
0.0
100.
043
.878
0M
iddl
e8.
124
.117
.91.
70.
00.
90.
341
.75.
40.
010
0.0
52.5
619
Seco
ndar
y6.
624
.227
.03.
10.
00.
01.
031
.17.
10.
010
0.0
60.9
818
Hig
her
12.1
41.1
16.7
4.3
0.3
0.0
1.1
16.0
8.0
0.5
100.
074
.549
9M
adra
sa/N
SC0.
00.
010
0.0
0.0
0.0
0.0
0.0
0.0
0.0
0.0
100.
010
0.0
5
Wea
lth in
dex
quin
tiles
Low
est
0.6
2.1
3.4
1.3
0.0
0.2
1.1
90.7
0.6
0.0
100.
07.
64,
469
Seco
nd3.
118
.819
.13.
80.
50.
01.
449
.53.
50.
410
0.0
45.3
1,71
7M
iddl
e11
.034
.729
.22.
70.
00.
00.
212
.89.
40.
010
0.0
77.7
1,01
9Fo
urth
14.2
48.0
20.1
2.5
0.3
0.0
1.1
0.0
13.4
0.4
100.
085
.055
4H
ighe
st19
.958
.218
.80.
00.
00.
00.
00.
03.
20.
010
0.0
96.8
176
Perc
enta
ge o
f po
pula
tion
usin
g sa
nita
ry m
eans
of
excr
eta
disp
osal
*M
issi
ngTo
tal
Ven
tilat
ed
impr
oved
pit
latr
ine
Pit l
atrin
e w
ith sl
abU
ncov
ered
pi
t
No
faci
litie
s or
bus
h or
fie
ld
Tabl
e EN
.5: U
se o
f san
itary
mea
ns o
f exc
reta
dis
posa
l
Oth
er
Num
ber o
f ho
useh
old
mem
bers
Uni
mpr
oved
sani
tatio
n fa
cilit
y
Perc
ent d
istr
ibut
ion
of h
ouse
hold
pop
ulat
ion
acco
rdin
g to
type
of t
oile
t fac
ility
use
d by
the
hous
ehol
d, a
nd th
e pe
rcen
tage
of h
ouse
hold
pop
ulat
ion
usin
g sa
nita
ry m
eans
of e
xcre
ta d
ispo
sal,
MIC
S Pu
njab
, 200
7-08
Type
of t
oile
t fac
ility
use
d by
hou
seho
ld
Publ
ic/
com
mun
al
latr
ine
Flus
h/po
ur fl
ush
to:
Impr
oved
sani
tatio
n fa
cilit
y
TEHSIL-WISE RESULTS OF DISTRICT RAJANPUR 21
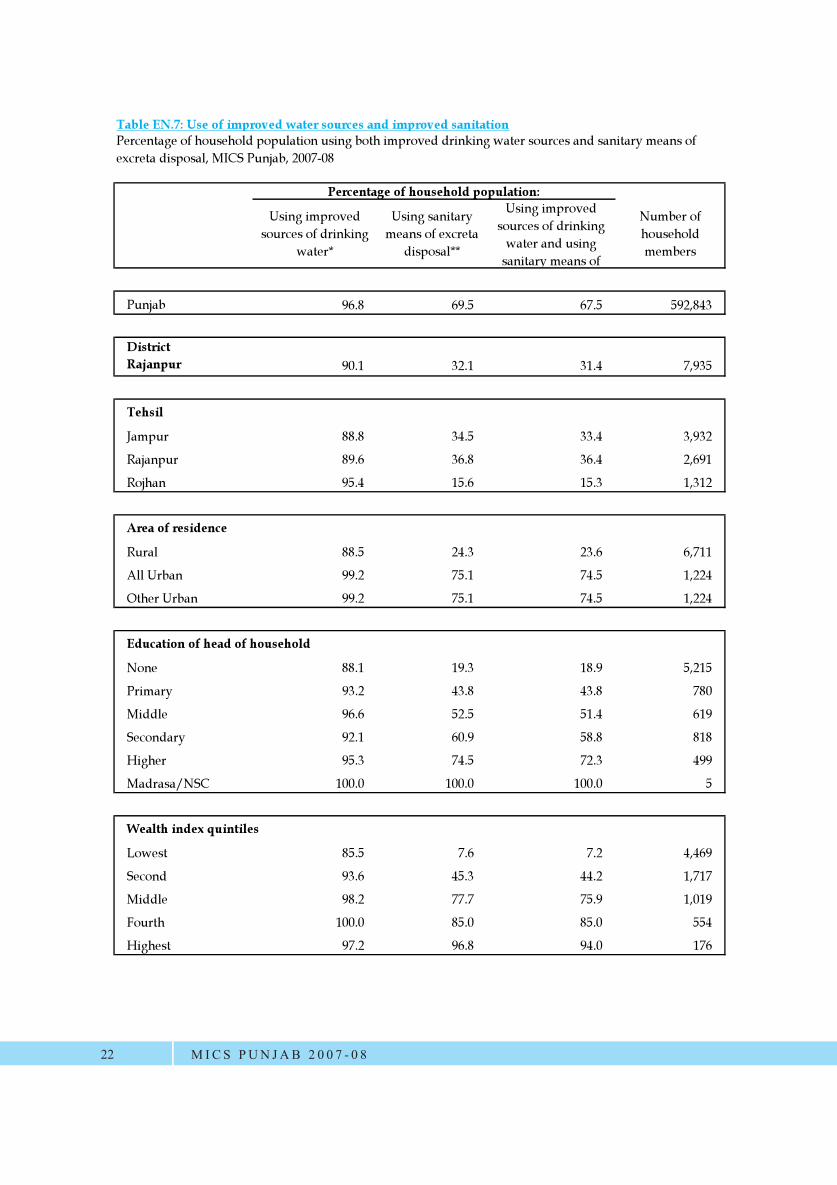
Table EN.7: Use of improved water sources and improved sanitation
Using improved sources of drinking
water*
Using sanitary means of excreta
disposal**
Using improved sources of drinking
water and using sanitary means of
Number of household members
Punjab 96.8 69.5 67.5 592,843
District Rajanpur 90.1 32.1 31.4 7,935
Tehsil
Jampur 88.8 34.5 33.4 3,932
Rajanpur 89.6 36.8 36.4 2,691
Rojhan 95.4 15.6 15.3 1,312
Area of residence
Rural 88.5 24.3 23.6 6,711
All Urban 99.2 75.1 74.5 1,224
Other Urban 99.2 75.1 74.5 1,224
Education of head of household
None 88.1 19.3 18.9 5,215
Primary 93.2 43.8 43.8 780
Middle 96.6 52.5 51.4 619
Secondary 92.1 60.9 58.8 818
Higher 95.3 74.5 72.3 499
Madrasa/NSC 100.0 100.0 100.0 5
Wealth index quintiles
Lowest 85.5 7.6 7.2 4,469
Second 93.6 45.3 44.2 1,717
Middle 98.2 77.7 75.9 1,019
Fourth 100.0 85.0 85.0 554
Highest 97.2 96.8 94.0 176
Percentage of household population using both improved drinking water sources and sanitary means of excreta disposal, MICS Punjab, 2007-08
Percentage of household population:
MICS PUN JAB 2 0 0 7 - 0 822
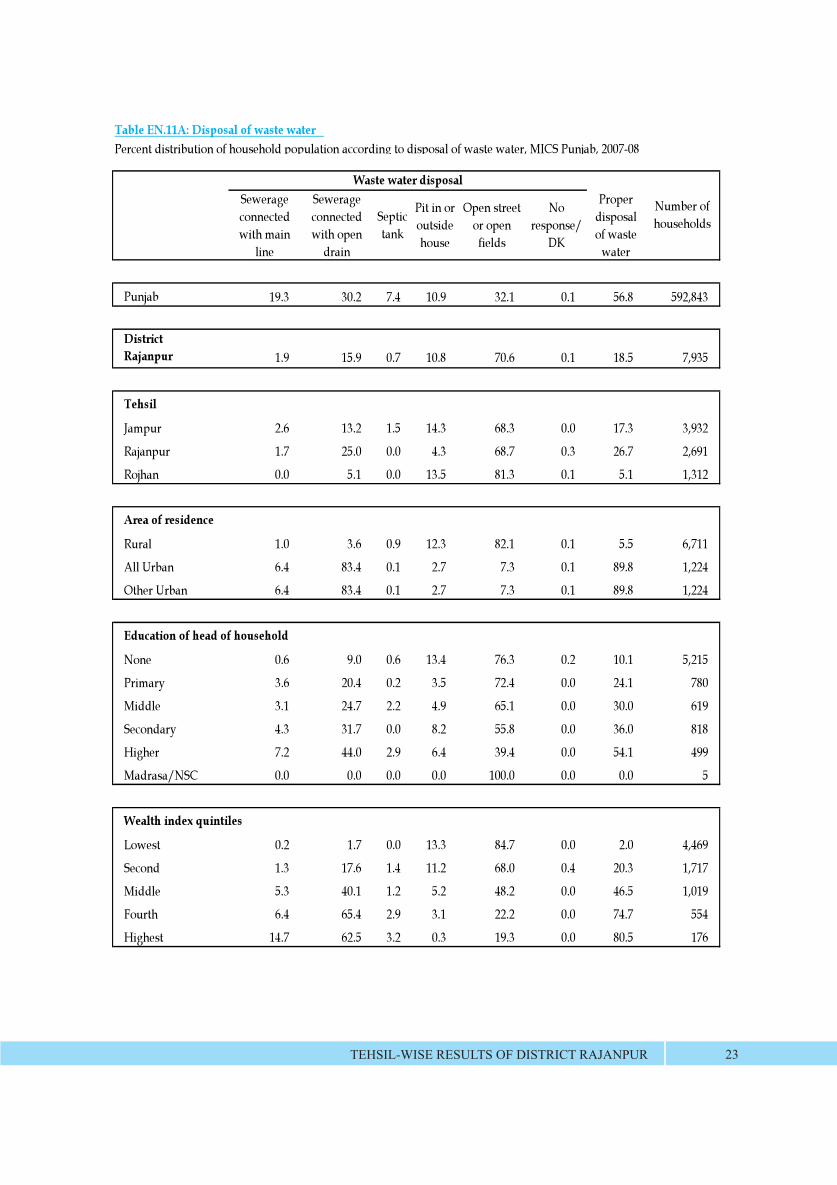
Table EN.11A: Disposal of waste water
Sewerage connected with main
line
Sewerage connected with open
drain
Septic tank
Pit in or outside house
Open street or open fields
No response/
DK
Proper disposal of waste
water
Punjab 19.3 30.2 7.4 10.9 32.1 0.1 56.8 592,843
District Rajanpur 1.9 15.9 0.7 10.8 70.6 0.1 18.5 7,935
Tehsil
Jampur 2.6 13.2 1.5 14.3 68.3 0.0 17.3 3,932
Rajanpur 1.7 25.0 0.0 4.3 68.7 0.3 26.7 2,691
Rojhan 0.0 5.1 0.0 13.5 81.3 0.1 5.1 1,312
Area of residence
Rural 1.0 3.6 0.9 12.3 82.1 0.1 5.5 6,711
All Urban 6.4 83.4 0.1 2.7 7.3 0.1 89.8 1,224
Other Urban 6.4 83.4 0.1 2.7 7.3 0.1 89.8 1,224
Education of head of household
None 0.6 9.0 0.6 13.4 76.3 0.2 10.1 5,215
Primary 3.6 20.4 0.2 3.5 72.4 0.0 24.1 780
Middle 3.1 24.7 2.2 4.9 65.1 0.0 30.0 619
Secondary 4.3 31.7 0.0 8.2 55.8 0.0 36.0 818
Higher 7.2 44.0 2.9 6.4 39.4 0.0 54.1 499
Madrasa/NSC 0.0 0.0 0.0 0.0 100.0 0.0 0.0 5
Wealth index quintiles
Lowest 0.2 1.7 0.0 13.3 84.7 0.0 2.0 4,469
Second 1.3 17.6 1.4 11.2 68.0 0.4 20.3 1,717
Middle 5.3 40.1 1.2 5.2 48.2 0.0 46.5 1,019
Fourth 6.4 65.4 2.9 3.1 22.2 0.0 74.7 554
Highest 14.7 62.5 3.2 0.3 19.3 0.0 80.5 176
Percent distribution of household population according to disposal of waste water, MICS Punjab, 2007-08
Waste water disposal
Number of households
TEHSIL-WISE RESULTS OF DISTRICT RAJANPUR 23
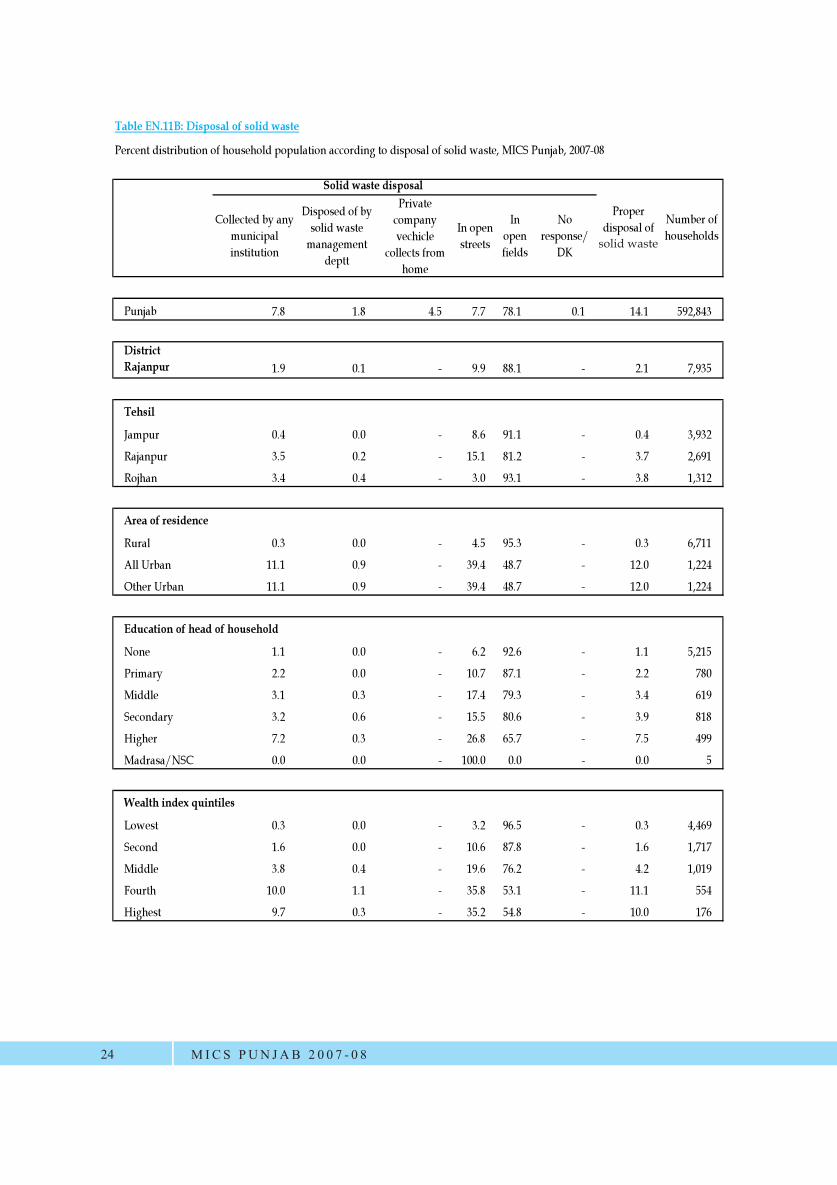
Table EN.11B: Disposal of solid waste
Collected by any municipal institution
Disposed of by solid waste
management deptt
Private company vechicle
collects from home
In open streets
In open fields
No response/
DK
Punjab 7.8 1.8 4.5 7.7 78.1 0.1 14.1 592,843
District Rajanpur 1.9 0.1 - 9.9 88.1 - 2.1 7,935
Tehsil
Jampur 0.4 0.0 - 8.6 91.1 - 0.4 3,932
Rajanpur 3.5 0.2 - 15.1 81.2 - 3.7 2,691
Rojhan 3.4 0.4 - 3.0 93.1 - 3.8 1,312
Area of residence
Rural 0.3 0.0 - 4.5 95.3 - 0.3 6,711
All Urban 11.1 0.9 - 39.4 48.7 - 12.0 1,224
Other Urban 11.1 0.9 - 39.4 48.7 - 12.0 1,224
Education of head of household
None 1.1 0.0 - 6.2 92.6 - 1.1 5,215
Primary 2.2 0.0 - 10.7 87.1 - 2.2 780
Middle 3.1 0.3 - 17.4 79.3 - 3.4 619
Secondary 3.2 0.6 - 15.5 80.6 - 3.9 818
Higher 7.2 0.3 - 26.8 65.7 - 7.5 499
Madrasa/NSC 0.0 0.0 - 100.0 0.0 - 0.0 5
Wealth index quintiles
Lowest 0.3 0.0 - 3.2 96.5 - 0.3 4,469
Second 1.6 0.0 - 10.6 87.8 - 1.6 1,717
Middle 3.8 0.4 - 19.6 76.2 - 4.2 1,019
Fourth 10.0 1.1 - 35.8 53.1 - 11.1 554
Highest 9.7 0.3 - 35.2 54.8 - 10.0 176
Percent distribution of household population according to disposal of solid waste, MICS Punjab, 2007-08
Solid waste disposal
Number of households
Proper disposal of solid water
MICS PUN JAB 2 0 0 7 - 0 824
solid waste
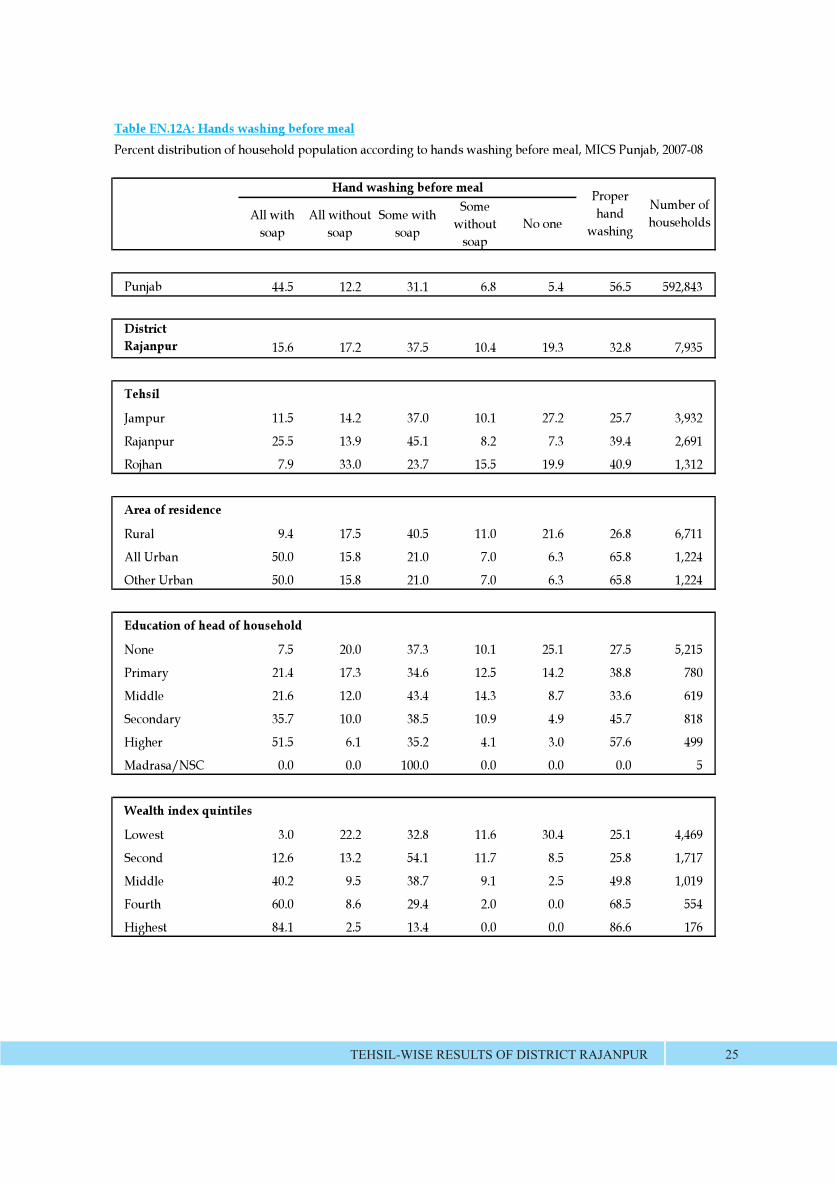
All with soap
All without soap
Some with soap
Some without
soapNo one
Punjab 44.5 12.2 31.1 6.8 5.4 56.5 592,843
District Rajanpur 15.6 17.2 37.5 10.4 19.3 32.8 7,935
Tehsil
Jampur 11.5 14.2 37.0 10.1 27.2 25.7 3,932
Rajanpur 25.5 13.9 45.1 8.2 7.3 39.4 2,691
Rojhan 7.9 33.0 23.7 15.5 19.9 40.9 1,312
Area of residence
Rural 9.4 17.5 40.5 11.0 21.6 26.8 6,711
All Urban 50.0 15.8 21.0 7.0 6.3 65.8 1,224
Other Urban 50.0 15.8 21.0 7.0 6.3 65.8 1,224
Education of head of household
None 7.5 20.0 37.3 10.1 25.1 27.5 5,215
Primary 21.4 17.3 34.6 12.5 14.2 38.8 780
Middle 21.6 12.0 43.4 14.3 8.7 33.6 619
Secondary 35.7 10.0 38.5 10.9 4.9 45.7 818
Higher 51.5 6.1 35.2 4.1 3.0 57.6 499
Madrasa/NSC 0.0 0.0 100.0 0.0 0.0 0.0 5
Wealth index quintiles
Lowest 3.0 22.2 32.8 11.6 30.4 25.1 4,469
Second 12.6 13.2 54.1 11.7 8.5 25.8 1,717
Middle 40.2 9.5 38.7 9.1 2.5 49.8 1,019
Fourth 60.0 8.6 29.4 2.0 0.0 68.5 554
Highest 84.1 2.5 13.4 0.0 0.0 86.6 176
Table EN.12A: Hands washing before mealPercent distribution of household population according to hands washing before meal, MICS Punjab, 2007-08
Number of households
Proper hand
washing
Hand washing before meal
TEHSIL-WISE RESULTS OF DISTRICT RAJANPUR 25
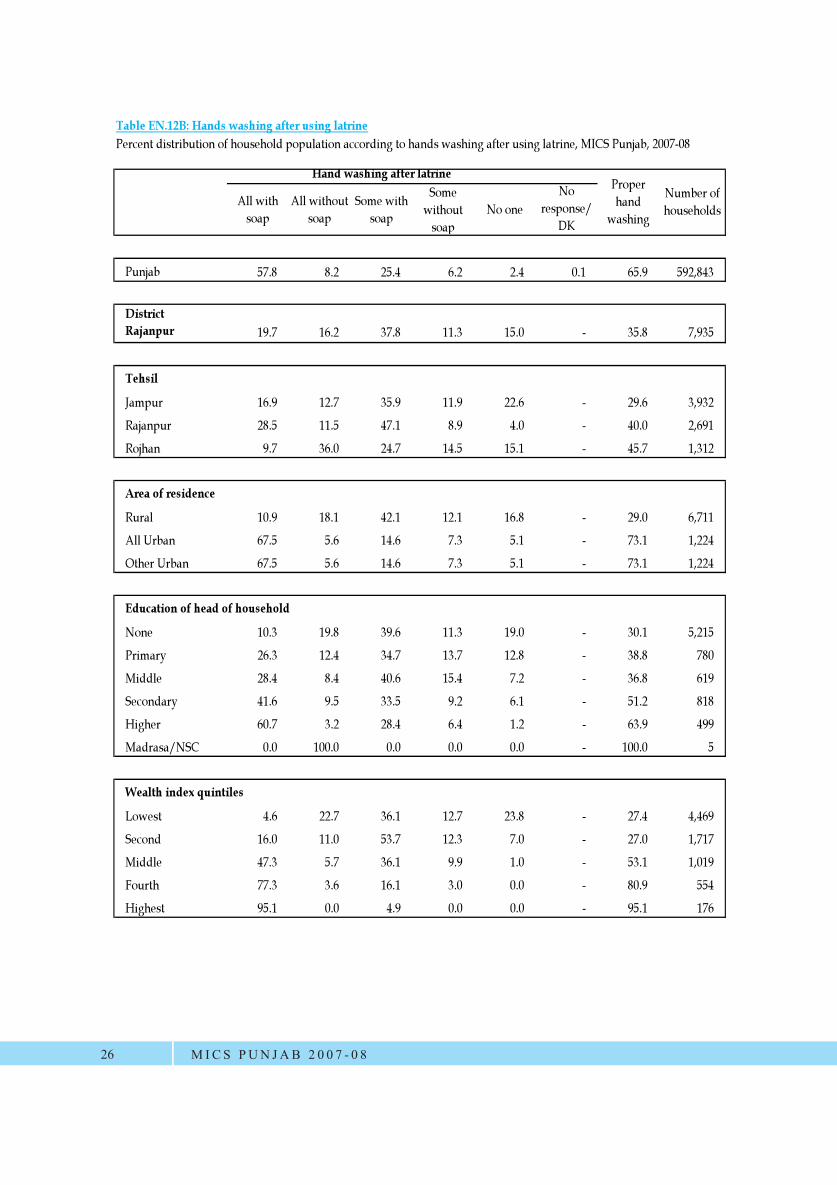
All with soap
All without soap
Some with soap
Some without
soapNo one
No response/
DK
Punjab 57.8 8.2 25.4 6.2 2.4 0.1 65.9 592,843
District Rajanpur 19.7 16.2 37.8 11.3 15.0 - 35.8 7,935
Tehsil
Jampur 16.9 12.7 35.9 11.9 22.6 - 29.6 3,932
Rajanpur 28.5 11.5 47.1 8.9 4.0 - 40.0 2,691
Rojhan 9.7 36.0 24.7 14.5 15.1 - 45.7 1,312
Area of residence
Rural 10.9 18.1 42.1 12.1 16.8 - 29.0 6,711
All Urban 67.5 5.6 14.6 7.3 5.1 - 73.1 1,224
Other Urban 67.5 5.6 14.6 7.3 5.1 - 73.1 1,224
Education of head of household
None 10.3 19.8 39.6 11.3 19.0 - 30.1 5,215
Primary 26.3 12.4 34.7 13.7 12.8 - 38.8 780
Middle 28.4 8.4 40.6 15.4 7.2 - 36.8 619
Secondary 41.6 9.5 33.5 9.2 6.1 - 51.2 818
Higher 60.7 3.2 28.4 6.4 1.2 - 63.9 499
Madrasa/NSC 0.0 100.0 0.0 0.0 0.0 - 100.0 5
Wealth index quintiles
Lowest 4.6 22.7 36.1 12.7 23.8 - 27.4 4,469
Second 16.0 11.0 53.7 12.3 7.0 - 27.0 1,717
Middle 47.3 5.7 36.1 9.9 1.0 - 53.1 1,019
Fourth 77.3 3.6 16.1 3.0 0.0 - 80.9 554
Highest 95.1 0.0 4.9 0.0 0.0 - 95.1 176
Table EN.12B: Hands washing after using latrinePercent distribution of household population according to hands washing after using latrine, MICS Punjab, 2007-08
Number of households
Hand washing after latrineProper hand
washing
MICS PUN JAB 2 0 0 7 - 0 826
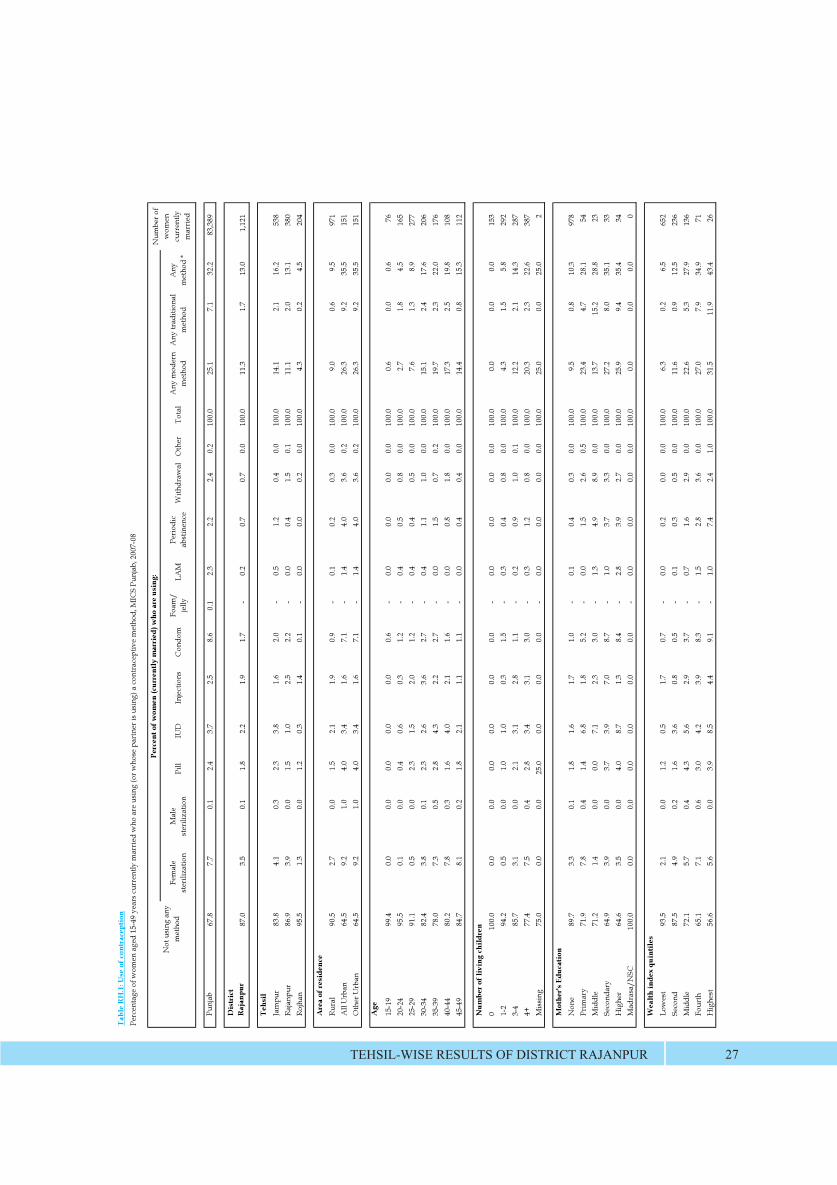
Tabl
e R
H.1
: Use
of c
ontr
acep
tion
Perc
enta
ge o
f wom
en a
ged
15-4
9 ye
ars c
urre
ntly
mar
ried
who
are
usi
ng (o
r who
se p
artn
er is
usi
ng) a
con
trac
eptiv
e m
etho
d, M
ICS
Punj
ab, 2
007-
08
Fem
ale
ster
iliza
tion
Mal
e st
erili
zatio
nPi
llIU
DIn
ject
ions
Con
dom
Foam
/
jelly
LAM
Peri
odic
ab
stin
ence
With
draw
alO
ther
Tota
lA
ny m
oder
n m
etho
dA
ny tr
aditi
onal
m
etho
dA
ny
met
hod
*
Punj
ab67
.87.
70.
12.
43.
72.
58.
60.
12.
32.
22.
40.
210
0.0
25.1
7.1
32.2
83,3
89
Dis
tric
t R
ajan
pur
87.0
3.5
0.1
1.8
2.2
1.9
1.7
-0.
20.
70.
70.
010
0.0
11.3
1.7
13.0
1,12
1
Tehs
ilJa
mpu
r83
.84.
10.
32.
33.
81.
62.
0-
0.5
1.2
0.4
0.0
100.
014
.12.
116
.253
8Ra
janp
ur86
.93.
90.
01.
51.
02.
52.
2-
0.0
0.4
1.5
0.1
100.
011
.12.
013
.138
0Ro
jhan
95.5
1.3
0.0
1.2
0.3
1.4
0.1
-0.
00.
00.
20.
010
0.0
4.3
0.2
4.5
204
Are
a of
resi
denc
eRu
ral
90.5
2.7
0.0
1.5
2.1
1.9
0.9
-0.
10.
20.
30.
010
0.0
9.0
0.6
9.5
971
All
Urb
an64
.59.
21.
04.
03.
41.
67.
1-
1.4
4.0
3.6
0.2
100.
026
.39.
235
.515
1O
ther
Urb
an64
.59.
21.
04.
03.
41.
67.
1-
1.4
4.0
3.6
0.2
100.
026
.39.
235
.515
1
Age
15-1
999
.40.
00.
00.
00.
00.
00.
6-
0.0
0.0
0.0
0.0
100.
00.
60.
00.
676
20-2
495
.50.
10.
00.
40.
60.
31.
2-
0.4
0.5
0.8
0.0
100.
02.
71.
84.
516
525
-29
91.1
0.5
0.0
2.3
1.5
2.0
1.2
-0.
40.
40.
50.
010
0.0
7.6
1.3
8.9
277
30-3
482
.43.
80.
12.
32.
63.
62.
7-
0.4
1.1
1.0
0.0
100.
015
.12.
417
.620
635
-39
78.0
7.3
0.5
2.8
4.3
2.2
2.7
-0.
01.
50.
70.
210
0.0
19.7
2.3
22.0
176
40-4
480
.27.
80.
31.
64.
02.
11.
6-
0.0
0.8
1.8
0.0
100.
017
.32.
519
.810
845
-49
84.7
8.1
0.2
1.8
2.1
1.1
1.1
-0.
00.
40.
40.
010
0.0
14.4
0.8
15.3
112
Num
ber o
f liv
ing
chil
dren
010
0.0
0.0
0.0
0.0
0.0
0.0
0.0
-0.
00.
00.
00.
010
0.0
0.0
0.0
0.0
153
1-2
94.2
0.5
0.0
1.0
1.0
0.3
1.5
-0.
30.
40.
80.
010
0.0
4.3
1.5
5.8
292
3-4
85.7
3.1
0.0
2.1
3.1
2.8
1.1
-0.
20.
91.
00.
110
0.0
12.2
2.1
14.3
287
4+77
.47.
50.
42.
83.
43.
13.
0-
0.3
1.2
0.8
0.0
100.
020
.32.
322
.638
7M
issi
ng75
.00.
00.
025
.00.
00.
00.
0-
0.0
0.0
0.0
0.0
100.
025
.00.
025
.02
Mot
her's
Edu
cati
onN
one
89.7
3.3
0.1
1.8
1.6
1.7
1.0
-0.
10.
40.
30.
010
0.0
9.5
0.8
10.3
978
Prim
ary
71.9
7.8
0.4
1.4
6.8
1.8
5.2
-0.
01.
52.
60.
510
0.0
23.4
4.7
28.1
54M
iddl
e71
.21.
40.
00.
07.
12.
33.
0-
1.3
4.9
8.9
0.0
100.
013
.715
.228
.823
Seco
ndar
y64
.93.
90.
03.
73.
97.
08.
7-
1.0
3.7
3.3
0.0
100.
027
.28.
035
.133
Hig
her
64.6
3.5
0.0
4.0
8.7
1.3
8.4
-2.
83.
92.
70.
010
0.0
25.9
9.4
35.4
34M
adra
sa/N
SC10
0.0
0.0
0.0
0.0
0.0
0.0
0.0
-0.
00.
00.
00.
010
0.0
0.0
0.0
0.0
0
Wea
lth
inde
x qu
inti
les
Low
est
93.5
2.1
0.0
1.2
0.5
1.7
0.7
-0.
00.
20.
00.
010
0.0
6.3
0.2
6.5
652
Seco
nd87
.54.
90.
21.
63.
60.
80.
5-
0.1
0.3
0.5
0.0
100.
011
.60.
912
.523
6M
iddl
e72
.15.
70.
44.
35.
62.
93.
7-
0.7
1.6
2.9
0.0
100.
022
.65.
327
.913
6Fo
urth
65.1
7.1
0.6
3.0
4.2
3.9
8.3
-1.
52.
83.
60.
010
0.0
27.0
7.9
34.9
71H
ighe
st56
.65.
60.
03.
98.
54.
49.
1-
1.0
7.4
2.4
1.0
100.
031
.511
.943
.426
Num
ber o
f w
omen
cu
rren
tly
mar
ried
Not
usi
ng a
ny
met
hod
Perc
ent o
f wom
en (c
urre
ntly
mar
ried
) who
are
usi
ng:
TEHSIL-WISE RESULTS OF DISTRICT RAJANPUR 27
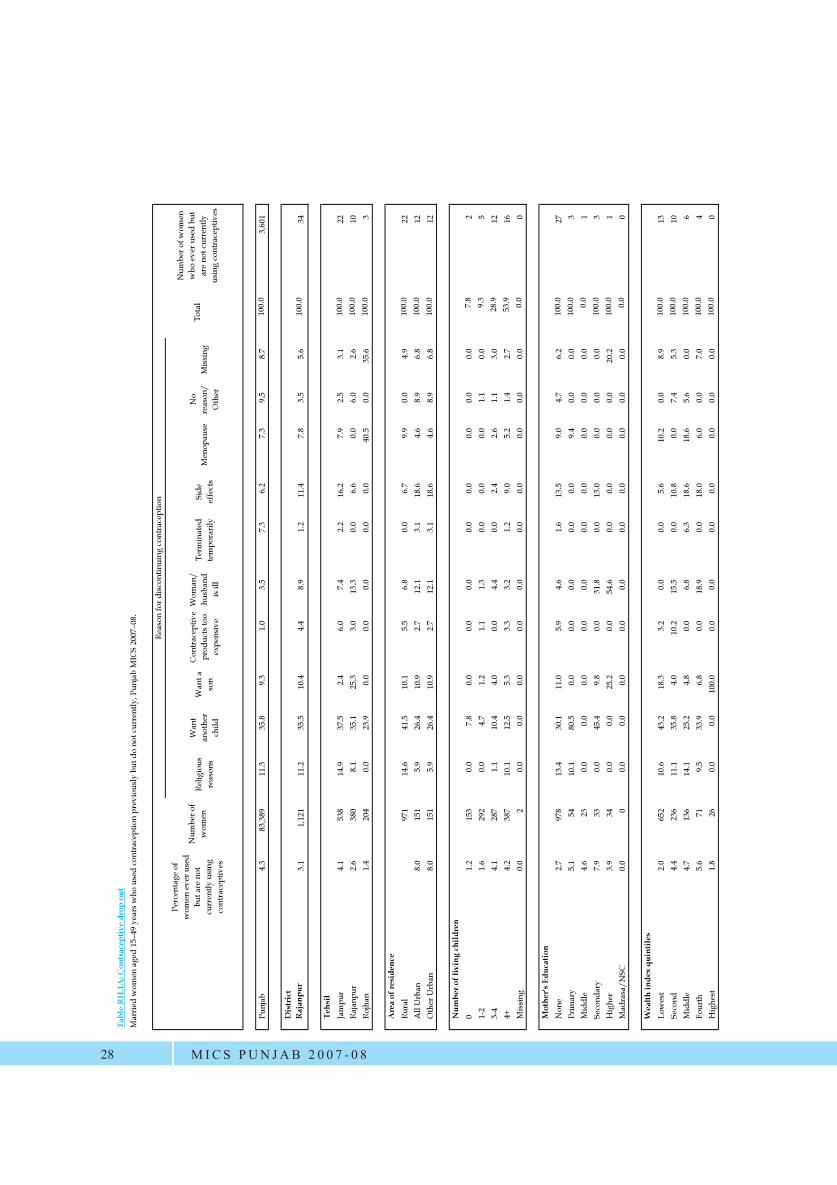
Tabl
e R
H.1
A: C
ontr
acep
tive
dro
p ou
t
Relig
ious
re
ason
s
Wan
t an
othe
r ch
ild
Wan
t a
son
Con
trac
eptiv
e pr
oduc
ts to
o ex
pens
ive
Wom
an/
husb
and
is il
l
Term
inat
ed
tem
pora
rily
Side
ef
fect
sM
enop
ause
No
reas
on/
Oth
erM
issi
ng
Punj
ab4.
383
,389
11.3
35.8
9.3
1.0
3.5
7.3
6.2
7.3
9.5
8.7
100.
03,
601
Dis
tric
t R
ajan
pur
3.1
1,12
111
.235
.510
.44.
48.
91.
211
.47.
83.
55.
610
0.0
34
Tehs
ilJa
mpu
r4.
153
814
.937
.52.
46.
07.
42.
216
.27.
92.
53.
110
0.0
22Ra
janp
ur2.
638
08.
135
.125
.33.
013
.30.
06.
60.
06.
02.
610
0.0
10Ro
jhan
1.4
204
0.0
23.9
0.0
0.0
0.0
0.0
0.0
40.5
0.0
35.6
100.
03
Are
a of
resi
denc
eRu
ral
97
114
.641
.510
.15.
56.
80.
06.
79.
90.
04.
910
0.0
22A
ll U
rban
8.0
151
5.9
26.4
10.9
2.7
12.1
3.1
18.6
4.6
8.9
6.8
100.
012
Oth
er U
rban
8.0
151
5.9
26.4
10.9
2.7
12.1
3.1
18.6
4.6
8.9
6.8
100.
012
Num
ber o
f liv
ing
chil
dren
01.
215
30.
07.
80.
00.
00.
00.
00.
00.
00.
00.
07.
82
1-2
1.6
292
0.0
4.7
1.2
1.1
1.3
0.0
0.0
0.0
1.1
0.0
9.3
53-
44.
128
71.
110
.44.
00.
04.
40.
02.
42.
61.
13.
028
.912
4+4.
238
710
.112
.55.
33.
33.
21.
29.
05.
21.
42.
753
.916
Mis
sing
0.0
20.
00.
00.
00.
00.
00.
00.
00.
00.
00.
00.
00
Mot
her's
Edu
catio
nN
one
2.7
978
13.4
30.1
11.0
5.9
4.6
1.6
13.5
9.0
4.7
6.2
100.
027
Prim
ary
5.1
5410
.180
.50.
00.
00.
00.
00.
09.
40.
00.
010
0.0
3M
iddl
e4.
623
0.0
0.0
0.0
0.0
0.0
0.0
0.0
0.0
0.0
0.0
0.0
1Se
cond
ary
7.9
330.
045
.49.
80.
031
.80.
013
.00.
00.
00.
010
0.0
3H
ighe
r3.
934
0.0
0.0
25.2
0.0
54.6
0.0
0.0
0.0
0.0
20.2
100.
01
Mad
rasa
/NSC
0.0
00.
00.
00.
00.
00.
00.
00.
00.
00.
00.
00.
00
Wea
lth in
dex
quin
tiles
Low
est
2.0
652
10.6
43.2
18.3
3.2
0.0
0.0
5.6
10.2
0.0
8.9
100.
013
Seco
nd4.
423
611
.135
.84.
010
.215
.50.
010
.80.
07.
45.
310
0.0
10M
iddl
e4.
713
614
.125
.24.
80.
06.
86.
318
.618
.65.
60.
010
0.0
6Fo
urth
5.6
719.
533
.96.
80.
018
.90.
018
.06.
00.
07.
010
0.0
4H
ighe
st1.
826
0.0
0.0
100.
00.
00.
00.
00.
00.
00.
00.
010
0.0
0
Perc
enta
ge o
f w
omen
eve
r use
d bu
t are
not
cu
rren
tly u
sing
co
ntra
cept
ives
Num
ber o
f w
omen
Reas
on fo
r dis
cont
inui
ng c
ontr
acep
tion
Tota
l
Num
ber o
f wom
en
who
eve
r use
d bu
t ar
e no
t cur
rent
ly
usin
g co
ntra
cept
ives
MICS PUN JAB 2 0 0 7 - 0 828
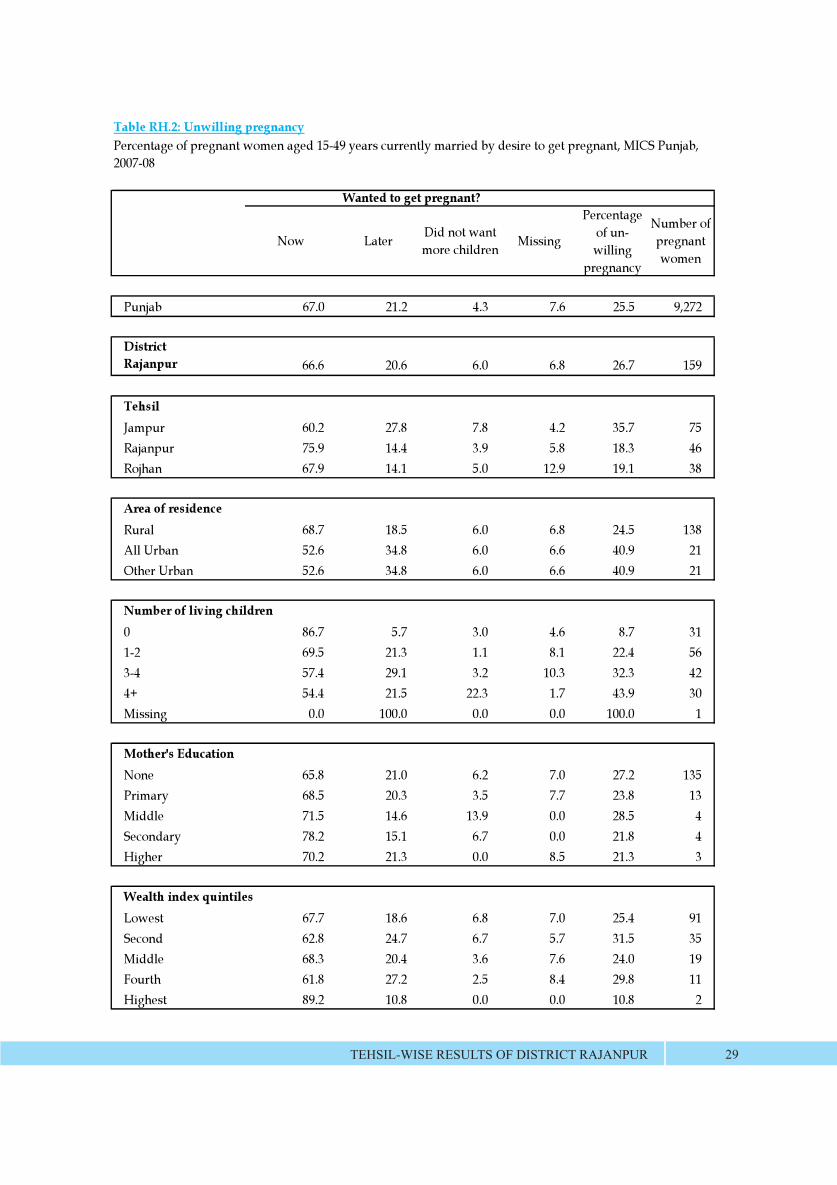
Table RH.2: Unwilling pregnancy
Now Later Did not want more children Missing
Percentage of un-willing
pregnancy
Number of pregnant women
Punjab 67.0 21.2 4.3 7.6 25.5 9,272
District Rajanpur 66.6 20.6 6.0 6.8 26.7 159
TehsilJampur 60.2 27.8 7.8 4.2 35.7 75Rajanpur 75.9 14.4 3.9 5.8 18.3 46Rojhan 67.9 14.1 5.0 12.9 19.1 38
Area of residenceRural 68.7 18.5 6.0 6.8 24.5 138All Urban 52.6 34.8 6.0 6.6 40.9 21Other Urban 52.6 34.8 6.0 6.6 40.9 21
Number of living children0 86.7 5.7 3.0 4.6 8.7 311-2 69.5 21.3 1.1 8.1 22.4 563-4 57.4 29.1 3.2 10.3 32.3 424+ 54.4 21.5 22.3 1.7 43.9 30Missing 0.0 100.0 0.0 0.0 100.0 1
Mother's EducationNone 65.8 21.0 6.2 7.0 27.2 135Primary 68.5 20.3 3.5 7.7 23.8 13Middle 71.5 14.6 13.9 0.0 28.5 4Secondary 78.2 15.1 6.7 0.0 21.8 4Higher 70.2 21.3 0.0 8.5 21.3 3
Wealth index quintilesLowest 67.7 18.6 6.8 7.0 25.4 91Second 62.8 24.7 6.7 5.7 31.5 35Middle 68.3 20.4 3.6 7.6 24.0 19Fourth 61.8 27.2 2.5 8.4 29.8 11Highest 89.2 10.8 0.0 0.0 10.8 2
Wanted to get pregnant?
Percentage of pregnant women aged 15-49 years currently married by desire to get pregnant, MICS Punjab, 2007-08
TEHSIL-WISE RESULTS OF DISTRICT RAJANPUR 29
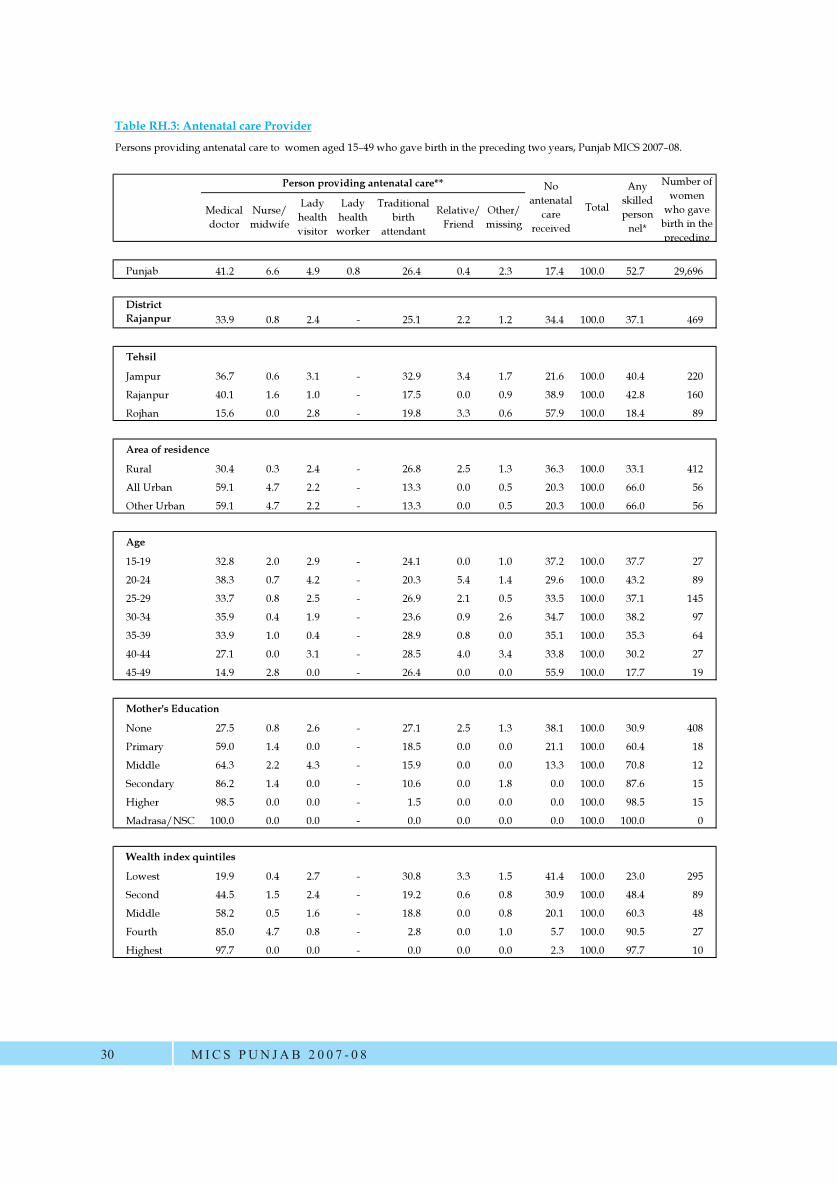
Table RH.3: Antenatal care
Medical doctor
Nurse/midwife
Lady health visitor
Lady health worker
Traditional birth
attendant
Relative/Friend
Other/missing
Punjab 41.2 6.6 4.9 0.8 26.4 0.4 2.3 17.4 100.0 52.7 29,696
District Rajanpur 33.9 0.8 2.4 - 25.1 2.2 1.2 34.4 100.0 37.1 469
Tehsil
Jampur 36.7 0.6 3.1 - 32.9 3.4 1.7 21.6 100.0 40.4 220
Rajanpur 40.1 1.6 1.0 - 17.5 0.0 0.9 38.9 100.0 42.8 160
Rojhan 15.6 0.0 2.8 - 19.8 3.3 0.6 57.9 100.0 18.4 89
Area of residence
Rural 30.4 0.3 2.4 - 26.8 2.5 1.3 36.3 100.0 33.1 412
All Urban 59.1 4.7 2.2 - 13.3 0.0 0.5 20.3 100.0 66.0 56
Other Urban 59.1 4.7 2.2 - 13.3 0.0 0.5 20.3 100.0 66.0 56
Age
15-19 32.8 2.0 2.9 - 24.1 0.0 1.0 37.2 100.0 37.7 27
20-24 38.3 0.7 4.2 - 20.3 5.4 1.4 29.6 100.0 43.2 89
25-29 33.7 0.8 2.5 - 26.9 2.1 0.5 33.5 100.0 37.1 145
30-34 35.9 0.4 1.9 - 23.6 0.9 2.6 34.7 100.0 38.2 97
35-39 33.9 1.0 0.4 - 28.9 0.8 0.0 35.1 100.0 35.3 64
40-44 27.1 0.0 3.1 - 28.5 4.0 3.4 33.8 100.0 30.2 27
45-49 14.9 2.8 0.0 - 26.4 0.0 0.0 55.9 100.0 17.7 19
Mother's Education
None 27.5 0.8 2.6 - 27.1 2.5 1.3 38.1 100.0 30.9 408
Primary 59.0 1.4 0.0 - 18.5 0.0 0.0 21.1 100.0 60.4 18
Middle 64.3 2.2 4.3 - 15.9 0.0 0.0 13.3 100.0 70.8 12
Secondary 86.2 1.4 0.0 - 10.6 0.0 1.8 0.0 100.0 87.6 15
Higher 98.5 0.0 0.0 - 1.5 0.0 0.0 0.0 100.0 98.5 15
Madrasa/NSC 100.0 0.0 0.0 - 0.0 0.0 0.0 0.0 100.0 100.0 0
Wealth index quintiles
Lowest 19.9 0.4 2.7 - 30.8 3.3 1.5 41.4 100.0 23.0 295
Second 44.5 1.5 2.4 - 19.2 0.6 0.8 30.9 100.0 48.4 89
Middle 58.2 0.5 1.6 - 18.8 0.0 0.8 20.1 100.0 60.3 48
Fourth 85.0 4.7 0.8 - 2.8 0.0 1.0 5.7 100.0 90.5 27
Highest 97.7 0.0 0.0 - 0.0 0.0 0.0 2.3 100.0 97.7 10
Number of women
who gave birth in the preceding
No antenatal
care received
Any skilled person
nel*
Total
Person providing antenatal care**
MICS PUN JAB 2 0 0 7 - 0 830
Table RH.3: Antenatal care Provider
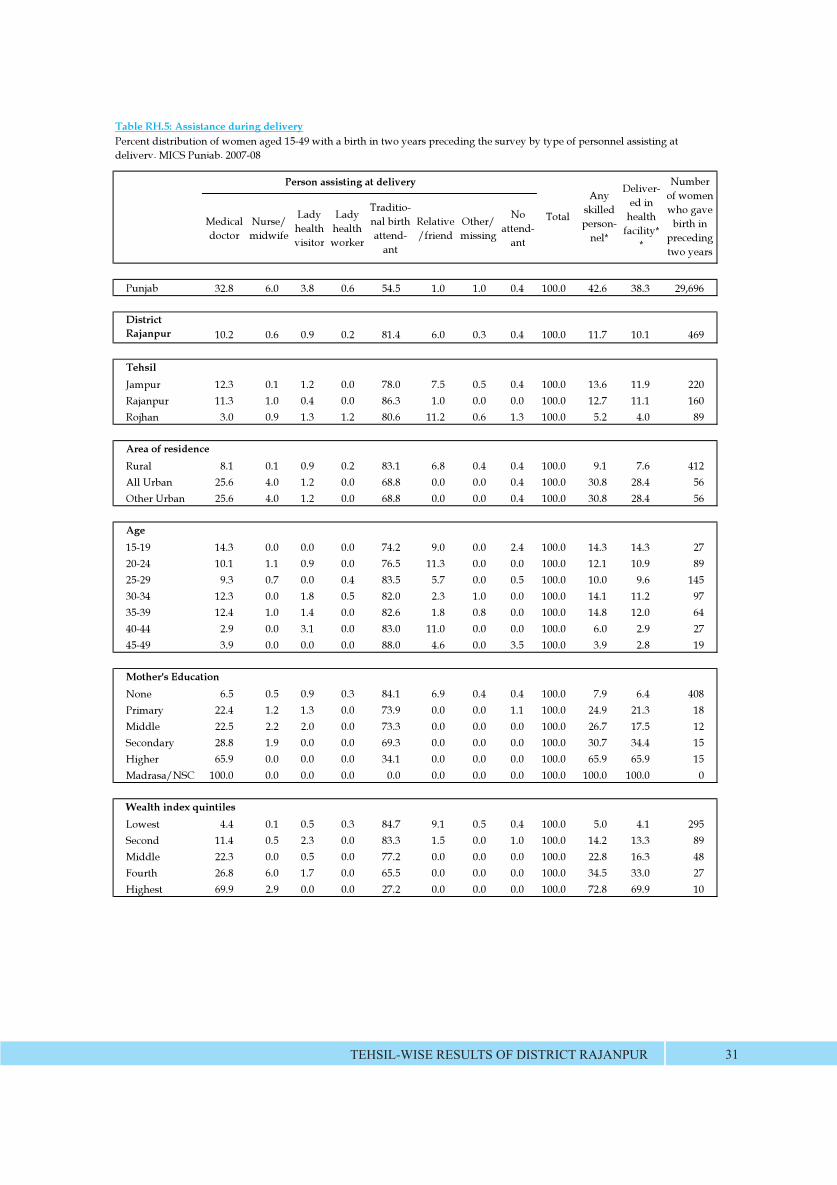
Table RH.5: Assistance during delivery
Medical doctor
Nurse/midwife
Lady health visitor
Lady health worker
Traditio-nal birth attend-
ant
Relative/friend
Other/missing
No attend-
ant
Punjab 32.8 6.0 3.8 0.6 54.5 1.0 1.0 0.4 100.0 42.6 38.3 29,696
District Rajanpur 10.2 0.6 0.9 0.2 81.4 6.0 0.3 0.4 100.0 11.7 10.1 469
TehsilJampur 12.3 0.1 1.2 0.0 78.0 7.5 0.5 0.4 100.0 13.6 11.9 220Rajanpur 11.3 1.0 0.4 0.0 86.3 1.0 0.0 0.0 100.0 12.7 11.1 160Rojhan 3.0 0.9 1.3 1.2 80.6 11.2 0.6 1.3 100.0 5.2 4.0 89
Area of residenceRural 8.1 0.1 0.9 0.2 83.1 6.8 0.4 0.4 100.0 9.1 7.6 412All Urban 25.6 4.0 1.2 0.0 68.8 0.0 0.0 0.4 100.0 30.8 28.4 56Other Urban 25.6 4.0 1.2 0.0 68.8 0.0 0.0 0.4 100.0 30.8 28.4 56
Age15-19 14.3 0.0 0.0 0.0 74.2 9.0 0.0 2.4 100.0 14.3 14.3 2720-24 10.1 1.1 0.9 0.0 76.5 11.3 0.0 0.0 100.0 12.1 10.9 8925-29 9.3 0.7 0.0 0.4 83.5 5.7 0.0 0.5 100.0 10.0 9.6 14530-34 12.3 0.0 1.8 0.5 82.0 2.3 1.0 0.0 100.0 14.1 11.2 9735-39 12.4 1.0 1.4 0.0 82.6 1.8 0.8 0.0 100.0 14.8 12.0 6440-44 2.9 0.0 3.1 0.0 83.0 11.0 0.0 0.0 100.0 6.0 2.9 2745-49 3.9 0.0 0.0 0.0 88.0 4.6 0.0 3.5 100.0 3.9 2.8 19
Mother's EducationNone 6.5 0.5 0.9 0.3 84.1 6.9 0.4 0.4 100.0 7.9 6.4 408Primary 22.4 1.2 1.3 0.0 73.9 0.0 0.0 1.1 100.0 24.9 21.3 18Middle 22.5 2.2 2.0 0.0 73.3 0.0 0.0 0.0 100.0 26.7 17.5 12Secondary 28.8 1.9 0.0 0.0 69.3 0.0 0.0 0.0 100.0 30.7 34.4 15Higher 65.9 0.0 0.0 0.0 34.1 0.0 0.0 0.0 100.0 65.9 65.9 15Madrasa/NSC 100.0 0.0 0.0 0.0 0.0 0.0 0.0 0.0 100.0 100.0 100.0 0
Wealth index quintilesLowest 4.4 0.1 0.5 0.3 84.7 9.1 0.5 0.4 100.0 5.0 4.1 295Second 11.4 0.5 2.3 0.0 83.3 1.5 0.0 1.0 100.0 14.2 13.3 89Middle 22.3 0.0 0.5 0.0 77.2 0.0 0.0 0.0 100.0 22.8 16.3 48Fourth 26.8 6.0 1.7 0.0 65.5 0.0 0.0 0.0 100.0 34.5 33.0 27Highest 69.9 2.9 0.0 0.0 27.2 0.0 0.0 0.0 100.0 72.8 69.9 10
Percent distribution of women aged 15-49 with a birth in two years preceding the survey by type of personnel assisting at delivery, MICS Punjab, 2007-08
Number of women who gave
birth in preceding two years
Person assisting at delivery
Total
Any skilled person-
nel*
Deliver-ed in
health facility*
*
TEHSIL-WISE RESULTS OF DISTRICT RAJANPUR 31
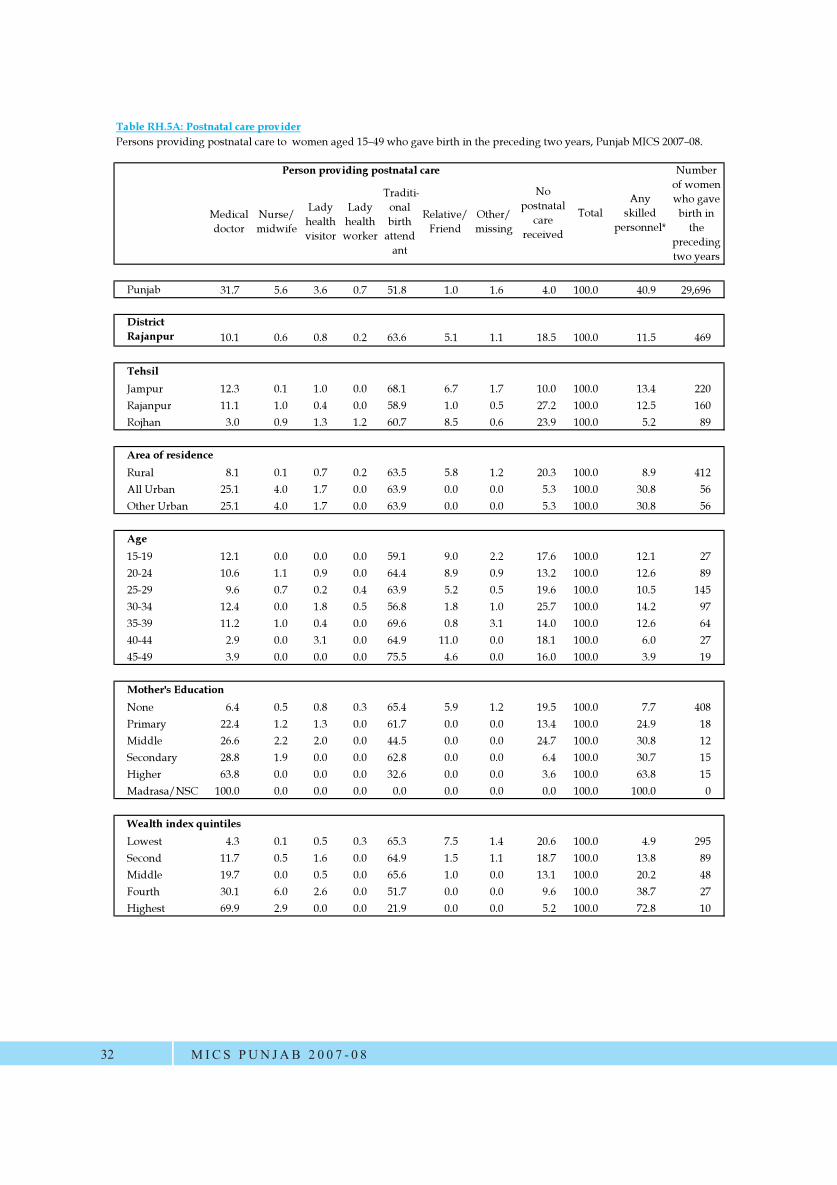
Table RH.5A: Postnatal care provider
Medical doctor
Nurse/midwife
Lady health visitor
Lady health worker
Traditi-onal birth
attendant
Relative/Friend
Other/missing
Punjab 31.7 5.6 3.6 0.7 51.8 1.0 1.6 4.0 100.0 40.9 29,696
DistrictRajanpur 10.1 0.6 0.8 0.2 63.6 5.1 1.1 18.5 100.0 11.5 469
TehsilJampur 12.3 0.1 1.0 0.0 68.1 6.7 1.7 10.0 100.0 13.4 220Rajanpur 11.1 1.0 0.4 0.0 58.9 1.0 0.5 27.2 100.0 12.5 160Rojhan 3.0 0.9 1.3 1.2 60.7 8.5 0.6 23.9 100.0 5.2 89
Area of residenceRural 8.1 0.1 0.7 0.2 63.5 5.8 1.2 20.3 100.0 8.9 412All Urban 25.1 4.0 1.7 0.0 63.9 0.0 0.0 5.3 100.0 30.8 56Other Urban 25.1 4.0 1.7 0.0 63.9 0.0 0.0 5.3 100.0 30.8 56
Age15-19 12.1 0.0 0.0 0.0 59.1 9.0 2.2 17.6 100.0 12.1 2720-24 10.6 1.1 0.9 0.0 64.4 8.9 0.9 13.2 100.0 12.6 8925-29 9.6 0.7 0.2 0.4 63.9 5.2 0.5 19.6 100.0 10.5 14530-34 12.4 0.0 1.8 0.5 56.8 1.8 1.0 25.7 100.0 14.2 9735-39 11.2 1.0 0.4 0.0 69.6 0.8 3.1 14.0 100.0 12.6 6440-44 2.9 0.0 3.1 0.0 64.9 11.0 0.0 18.1 100.0 6.0 2745-49 3.9 0.0 0.0 0.0 75.5 4.6 0.0 16.0 100.0 3.9 19
Mother's EducationNone 6.4 0.5 0.8 0.3 65.4 5.9 1.2 19.5 100.0 7.7 408Primary 22.4 1.2 1.3 0.0 61.7 0.0 0.0 13.4 100.0 24.9 18Middle 26.6 2.2 2.0 0.0 44.5 0.0 0.0 24.7 100.0 30.8 12Secondary 28.8 1.9 0.0 0.0 62.8 0.0 0.0 6.4 100.0 30.7 15Higher 63.8 0.0 0.0 0.0 32.6 0.0 0.0 3.6 100.0 63.8 15Madrasa/NSC 100.0 0.0 0.0 0.0 0.0 0.0 0.0 0.0 100.0 100.0 0
Wealth index quintilesLowest 4.3 0.1 0.5 0.3 65.3 7.5 1.4 20.6 100.0 4.9 295Second 11.7 0.5 1.6 0.0 64.9 1.5 1.1 18.7 100.0 13.8 89Middle 19.7 0.0 0.5 0.0 65.6 1.0 0.0 13.1 100.0 20.2 48Fourth 30.1 6.0 2.6 0.0 51.7 0.0 0.0 9.6 100.0 38.7 27Highest 69.9 2.9 0.0 0.0 21.9 0.0 0.0 5.2 100.0 72.8 10
Person providing postnatal care
No postnatal
care received
TotalAny
skilled personnel*
Number of women who gave
birth in the
preceding two years
MICS PUN JAB 2 0 0 7 - 0 832
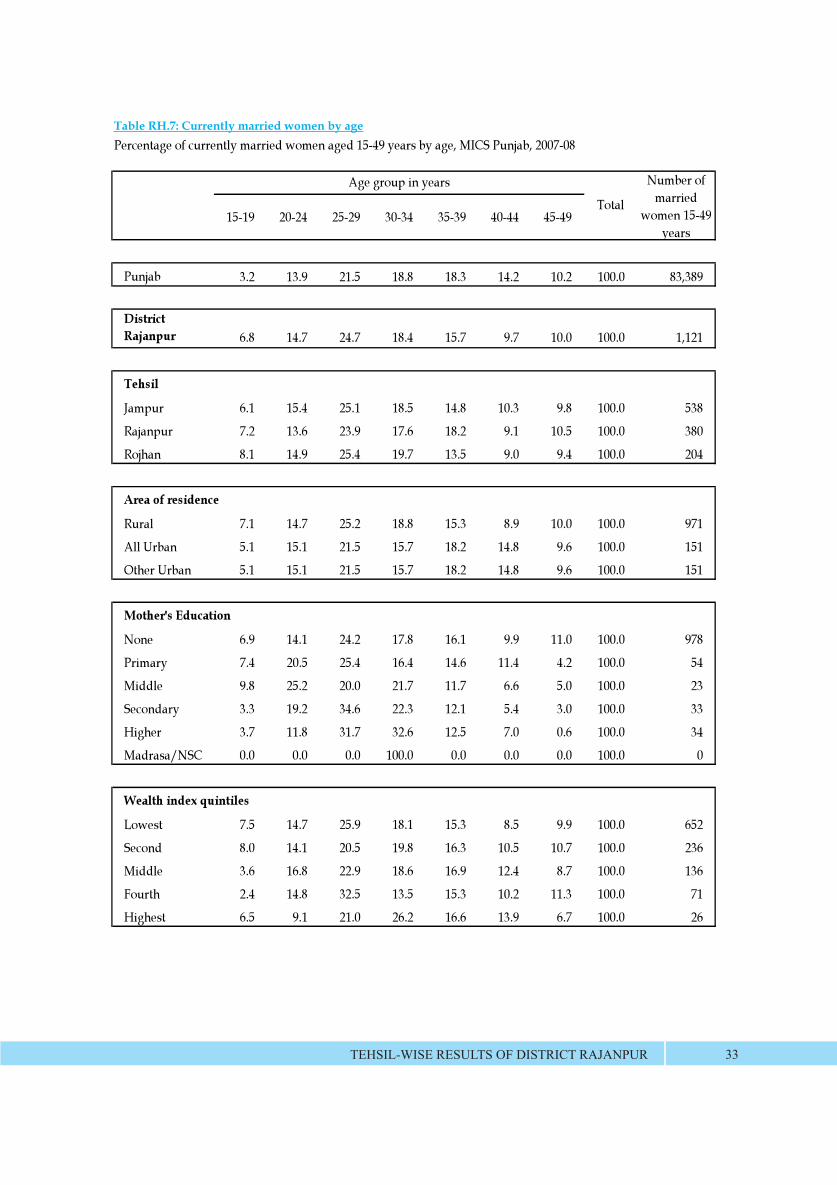
Table RH.7: Crrently married women by agePercentage of currently married women aged 15-49 years by age, MICS Punjab, 2007-08
15-19 20-24 25-29 30-34 35-39 40-44 45-49
Punjab 3.2 13.9 21.5 18.8 18.3 14.2 10.2 100.0 83,389
DistrictRajanpur 6.8 14.7 24.7 18.4 15.7 9.7 10.0 100.0 1,121
Tehsil
Jampur 6.1 15.4 25.1 18.5 14.8 10.3 9.8 100.0 538
Rajanpur 7.2 13.6 23.9 17.6 18.2 9.1 10.5 100.0 380
Rojhan 8.1 14.9 25.4 19.7 13.5 9.0 9.4 100.0 204
Area of residence
Rural 7.1 14.7 25.2 18.8 15.3 8.9 10.0 100.0 971
All Urban 5.1 15.1 21.5 15.7 18.2 14.8 9.6 100.0 151
Other Urban 5.1 15.1 21.5 15.7 18.2 14.8 9.6 100.0 151
Mother's Education
None 6.9 14.1 24.2 17.8 16.1 9.9 11.0 100.0 978
Primary 7.4 20.5 25.4 16.4 14.6 11.4 4.2 100.0 54
Middle 9.8 25.2 20.0 21.7 11.7 6.6 5.0 100.0 23
Secondary 3.3 19.2 34.6 22.3 12.1 5.4 3.0 100.0 33
Higher 3.7 11.8 31.7 32.6 12.5 7.0 0.6 100.0 34
Madrasa/NSC 0.0 0.0 0.0 100.0 0.0 0.0 0.0 100.0 0
Wealth index quintiles
Lowest 7.5 14.7 25.9 18.1 15.3 8.5 9.9 100.0 652
Second 8.0 14.1 20.5 19.8 16.3 10.5 10.7 100.0 236
Middle 3.6 16.8 22.9 18.6 16.9 12.4 8.7 100.0 136
Fourth 2.4 14.8 32.5 13.5 15.3 10.2 11.3 100.0 71
Highest 6.5 9.1 21.0 26.2 16.6 13.9 6.7 100.0 26
Age group in years
Total
Number of married
women 15-49 years
TEHSIL-WISE RESULTS OF DISTRICT RAJANPUR 33
Table RH.7: Currently married women by age
BLANK
MICS PUN JAB 2 0 0 7 - 0 834
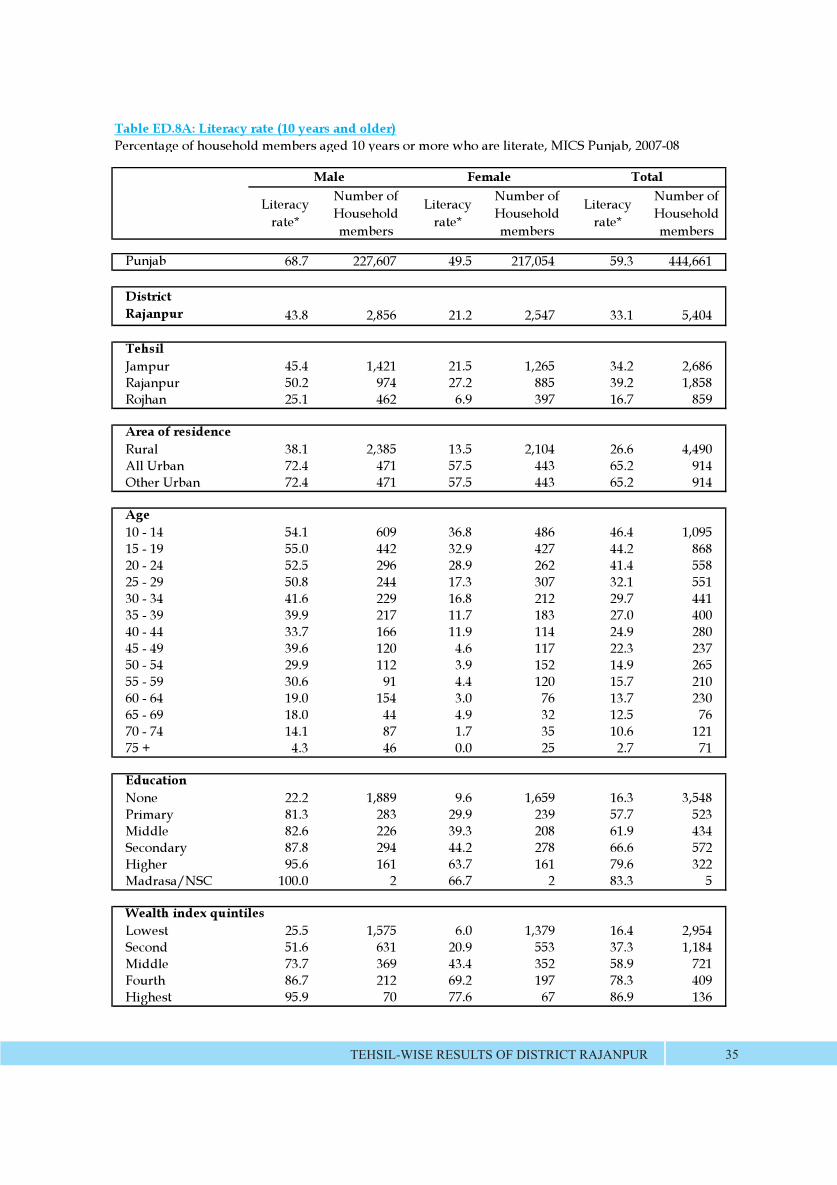
Literacy rate*
Number of Household members
Literacy rate*
Number of Household members
Literacy rate*
Number of Household members
Punjab 68.7 227,607 49.5 217,054 59.3 444,661
District Rajanpur 43.8 2,856 21.2 2,547 33.1 5,404
TehsilJampur 45.4 1,421 21.5 1,265 34.2 2,686Rajanpur 50.2 974 27.2 885 39.2 1,858Rojhan 25.1 462 6.9 397 16.7 859
Area of residenceRural 38.1 2,385 13.5 2,104 26.6 4,490All Urban 72.4 471 57.5 443 65.2 914Other Urban 72.4 471 57.5 443 65.2 914
Age10 - 14 54.1 609 36.8 486 46.4 1,09515 - 19 55.0 442 32.9 427 44.2 86820 - 24 52.5 296 28.9 262 41.4 55825 - 29 50.8 244 17.3 307 32.1 55130 - 34 41.6 229 16.8 212 29.7 44135 - 39 39.9 217 11.7 183 27.0 40040 - 44 33.7 166 11.9 114 24.9 28045 - 49 39.6 120 4.6 117 22.3 23750 - 54 29.9 112 3.9 152 14.9 26555 - 59 30.6 91 4.4 120 15.7 21060 - 64 19.0 154 3.0 76 13.7 23065 - 69 18.0 44 4.9 32 12.5 7670 - 74 14.1 87 1.7 35 10.6 12175 + 4.3 46 0.0 25 2.7 71
EducationNone 22.2 1,889 9.6 1,659 16.3 3,548Primary 81.3 283 29.9 239 57.7 523Middle 82.6 226 39.3 208 61.9 434Secondary 87.8 294 44.2 278 66.6 572Higher 95.6 161 63.7 161 79.6 322Madrasa/NSC 100.0 2 66.7 2 83.3 5
Wealth index quintilesLowest 25.5 1,575 6.0 1,379 16.4 2,954Second 51.6 631 20.9 553 37.3 1,184Middle 73.7 369 43.4 352 58.9 721Fourth 86.7 212 69.2 197 78.3 409Highest 95.9 70 77.6 67 86.9 136
Table ED.8A: Literacy rate (10 years and older)Percentage of household members aged 10 years or more who are literate, MICS Punjab, 2007-08
Male Female Total
TEHSIL-WISE RESULTS OF DISTRICT RAJANPUR 35
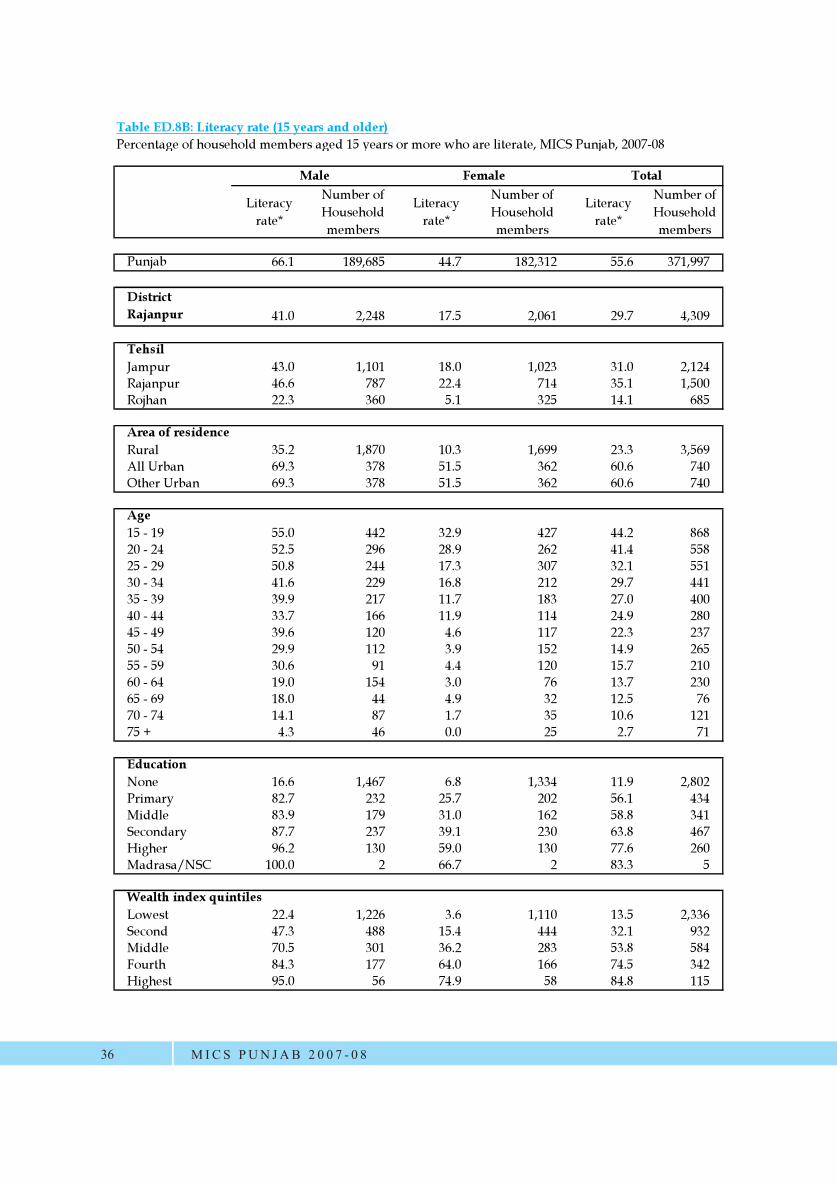
Literacy rate*
Number of Household members
Literacy rate*
Number of Household members
Literacy rate*
Number of Household members
Punjab 66.1 189,685 44.7 182,312 55.6 371,997
District Rajanpur 41.0 2,248 17.5 2,061 29.7 4,309
TehsilJampur 43.0 1,101 18.0 1,023 31.0 2,124Rajanpur 46.6 787 22.4 714 35.1 1,500Rojhan 22.3 360 5.1 325 14.1 685
Area of residenceRural 35.2 1,870 10.3 1,699 23.3 3,569All Urban 69.3 378 51.5 362 60.6 740Other Urban 69.3 378 51.5 362 60.6 740
Age15 - 19 55.0 442 32.9 427 44.2 86820 - 24 52.5 296 28.9 262 41.4 55825 - 29 50.8 244 17.3 307 32.1 55130 - 34 41.6 229 16.8 212 29.7 44135 - 39 39.9 217 11.7 183 27.0 40040 - 44 33.7 166 11.9 114 24.9 28045 - 49 39.6 120 4.6 117 22.3 23750 - 54 29.9 112 3.9 152 14.9 26555 - 59 30.6 91 4.4 120 15.7 21060 - 64 19.0 154 3.0 76 13.7 23065 - 69 18.0 44 4.9 32 12.5 7670 - 74 14.1 87 1.7 35 10.6 12175 + 4.3 46 0.0 25 2.7 71
EducationNone 16.6 1,467 6.8 1,334 11.9 2,802Primary 82.7 232 25.7 202 56.1 434Middle 83.9 179 31.0 162 58.8 341Secondary 87.7 237 39.1 230 63.8 467Higher 96.2 130 59.0 130 77.6 260Madrasa/NSC 100.0 2 66.7 2 83.3 5
Wealth index quintilesLowest 22.4 1,226 3.6 1,110 13.5 2,336Second 47.3 488 15.4 444 32.1 932Middle 70.5 301 36.2 283 53.8 584Fourth 84.3 177 64.0 166 74.5 342Highest 95.0 56 74.9 58 84.8 115
Table ED.8B: Literacy rate (15 years and older)Percentage of household members aged 15 years or more who are literate, MICS Punjab, 2007-08
Male Female Total
MICS PUN JAB 2 0 0 7 - 0 836
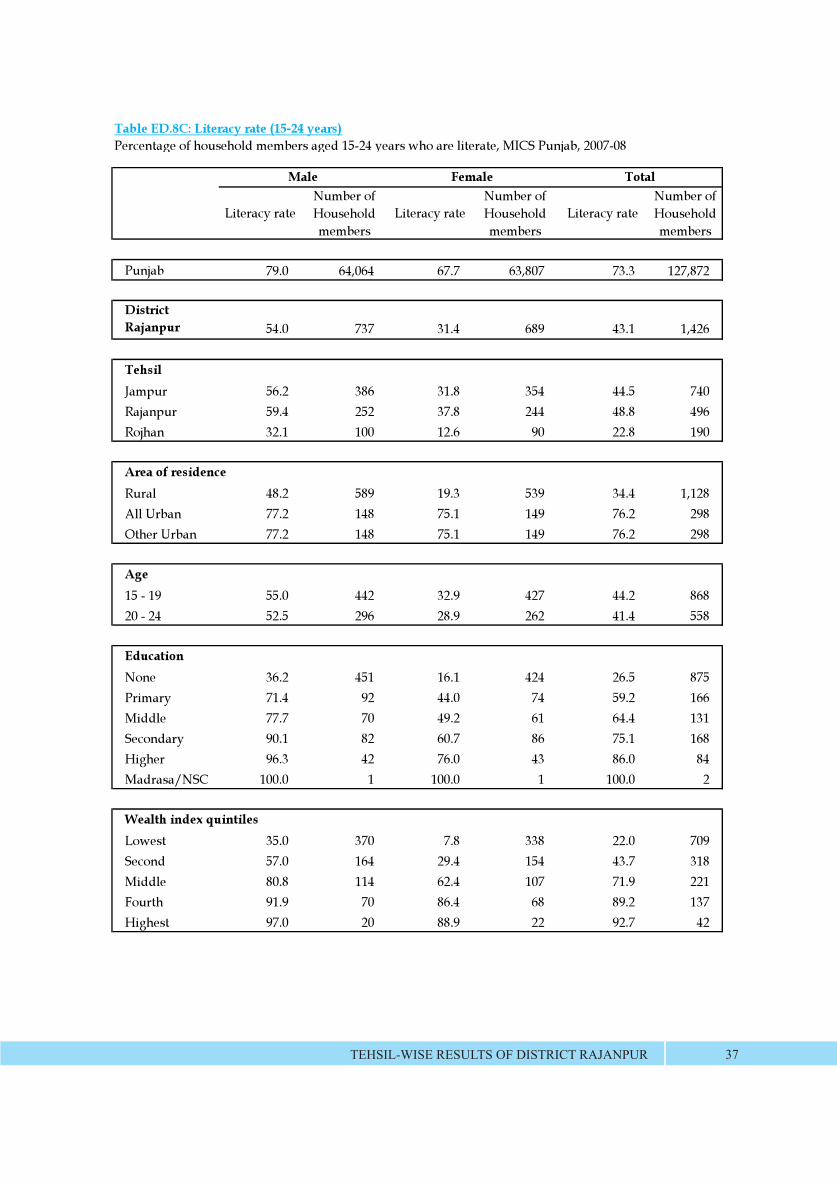
Literacy rateNumber of Household members
Literacy rateNumber of Household members
Literacy rateNumber of Household members
Punjab 79.0 64,064 67.7 63,807 73.3 127,872
District Rajanpur 54.0 737 31.4 689 43.1 1,426
TehsilJampur 56.2 386 31.8 354 44.5 740Rajanpur 59.4 252 37.8 244 48.8 496Rojhan 32.1 100 12.6 90 22.8 190
Area of residenceRural 48.2 589 19.3 539 34.4 1,128All Urban 77.2 148 75.1 149 76.2 298Other Urban 77.2 148 75.1 149 76.2 298
Age15 - 19 55.0 442 32.9 427 44.2 86820 - 24 52.5 296 28.9 262 41.4 558
EducationNone 36.2 451 16.1 424 26.5 875Primary 71.4 92 44.0 74 59.2 166Middle 77.7 70 49.2 61 64.4 131Secondary 90.1 82 60.7 86 75.1 168Higher 96.3 42 76.0 43 86.0 84Madrasa/NSC 100.0 1 100.0 1 100.0 2
Wealth index quintilesLowest 35.0 370 7.8 338 22.0 709Second 57.0 164 29.4 154 43.7 318Middle 80.8 114 62.4 107 71.9 221Fourth 91.9 70 86.4 68 89.2 137Highest 97.0 20 88.9 22 92.7 42
Table ED.8C: Literacy rate (15-24 years)Percentage of household members aged 15-24 years who are literate, MICS Punjab, 2007-08
Male Female Total
TEHSIL-WISE RESULTS OF DISTRICT RAJANPUR 37

Percentage of children aged
3-4 years currently attending preschool
Number of children aged
3-4 years
Percentage of children aged
3-4 years currently attending preschool
Number of children aged
3-4 years
Percentage of children aged
3-4 years currently attending preschool
Number of children aged
3-4 years
Punjab 13.8 14,977 13.2 14,323 13.5 29,300
District Rajanpur 3.6 276 4.6 263 4.1 539
TehsilJampur 3.7 131 4.7 139 4.2 270Rajanpur 4.5 93 3.5 83 4.1 176Rojhan 1.7 53 6.6 41 3.8 94
Area of residenceRural 2.5 244 2.6 231 2.5 474All Urban 11.9 33 18.9 33 15.4 65Other Urban 11.9 33 18.9 33 15.4 65
Age3 1.1 140 1.4 146 1.2 2864 6.2 137 8.7 117 7.3 254
EducationNone 2.9 248 3.5 233 3.2 481Primary 4.3 10 10.9 10 7.6 20Middle 0.0 3 0.0 4 0.0 7Secondary 21.8 9 11.4 10 16.3 20Higher 4.0 7 29.4 5 14.9 12Madrasa/NSC . 0 100.0 0 100.0 0
Wealth index quintilesLowest 1.4 168 1.1 156 1.3 325Second 6.0 59 9.3 56 7.6 115Middle 3.8 28 8.6 35 6.4 63Fourth 16.6 16 8.8 12 13.1 28Highest 5.7 5 30.8 4 17.0 9
Table ED.1: Early childhood education
Male Female Total
Percentage of children aged 3-4 years who are attending pre-school, MICS Punjab, 2007-08
MICS PUN JAB 2 0 0 7 - 0 838
Table ED.1: Pre-school attendance
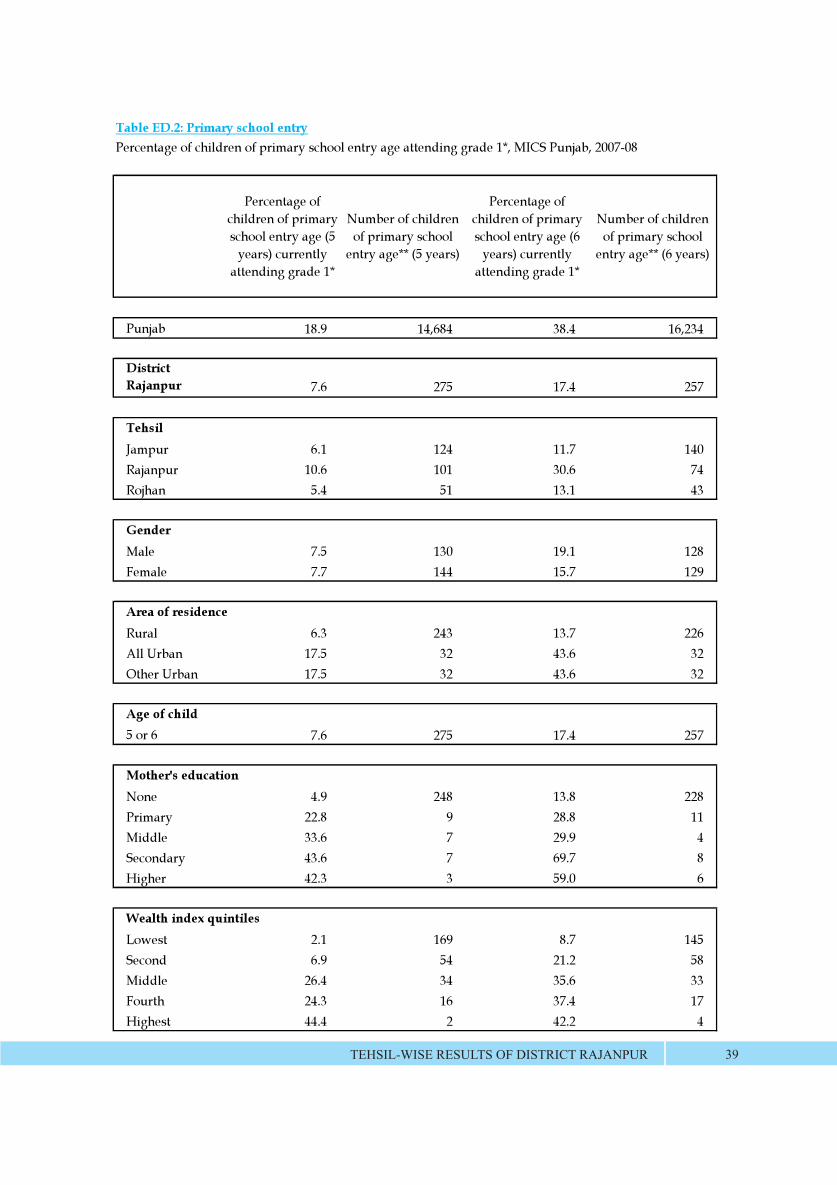
Percentage of children of primary school entry age (5
years) currently attending grade 1*
Number of children of primary school
entry age** (5 years)
Percentage of children of primary school entry age (6
years) currently attending grade 1*
Number of children of primary school
entry age** (6 years)
Punjab 18.9 14,684 38.4 16,234
DistrictRajanpur 7.6 275 17.4 257
TehsilJampur 6.1 124 11.7 140Rajanpur 10.6 101 30.6 74Rojhan 5.4 51 13.1 43
GenderMale 7.5 130 19.1 128Female 7.7 144 15.7 129
Area of residenceRural 6.3 243 13.7 226All Urban 17.5 32 43.6 32Other Urban 17.5 32 43.6 32
Age of child5 or 6 7.6 275 17.4 257
Mother's educationNone 4.9 248 13.8 228Primary 22.8 9 28.8 11Middle 33.6 7 29.9 4Secondary 43.6 7 69.7 8Higher 42.3 3 59.0 6
Wealth index quintilesLowest 2.1 169 8.7 145Second 6.9 54 21.2 58Middle 26.4 34 35.6 33Fourth 24.3 16 37.4 17Highest 44.4 2 42.2 4
Table ED.2: Primary school entryPercentage of children of primary school entry age attending grade 1*, MICS Punjab, 2007-08
TEHSIL-WISE RESULTS OF DISTRICT RAJANPUR 39
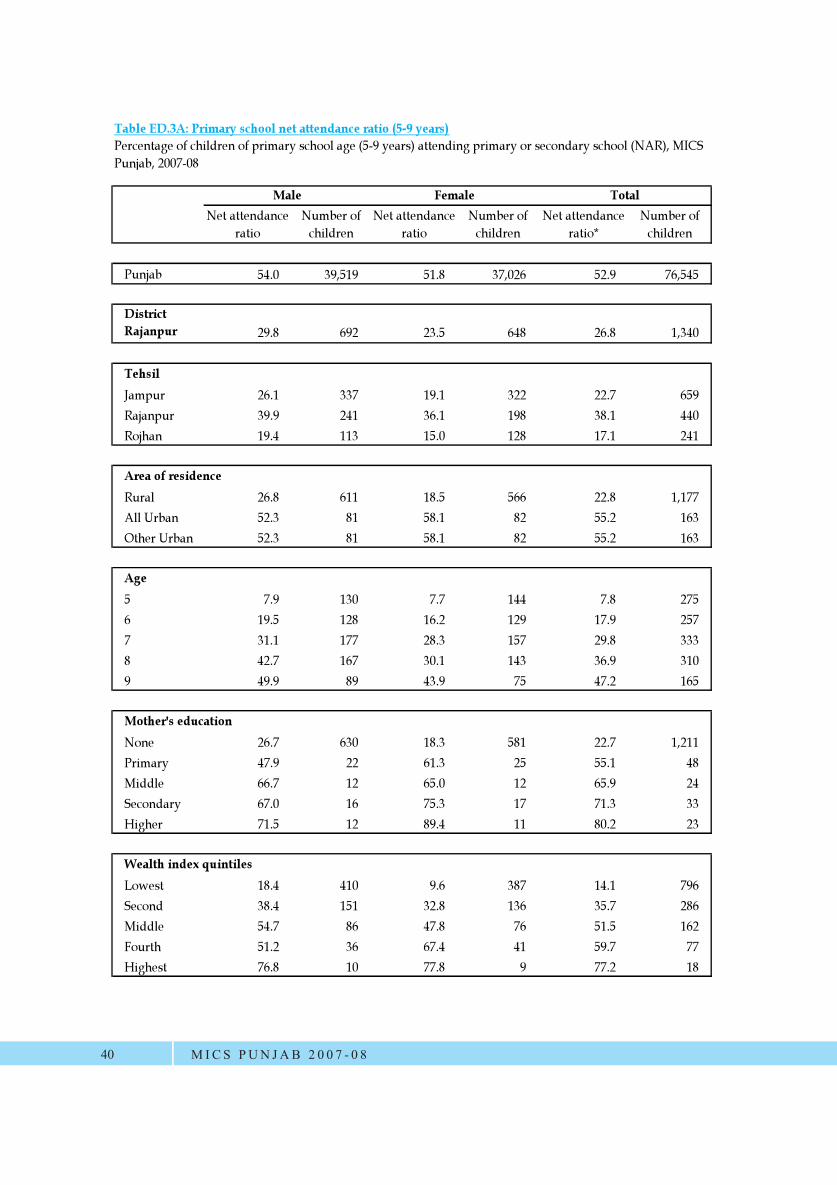
Net attendance ratio
Number of children
Net attendance ratio
Number of children
Net attendance ratio*
Number of children
Punjab 54.0 39,519 51.8 37,026 52.9 76,545
District Rajanpur 29.8 692 23.5 648 26.8 1,340
TehsilJampur 26.1 337 19.1 322 22.7 659Rajanpur 39.9 241 36.1 198 38.1 440Rojhan 19.4 113 15.0 128 17.1 241
Area of residenceRural 26.8 611 18.5 566 22.8 1,177All Urban 52.3 81 58.1 82 55.2 163Other Urban 52.3 81 58.1 82 55.2 163
Age5 7.9 130 7.7 144 7.8 2756 19.5 128 16.2 129 17.9 2577 31.1 177 28.3 157 29.8 3338 42.7 167 30.1 143 36.9 3109 49.9 89 43.9 75 47.2 165
Mother's educationNone 26.7 630 18.3 581 22.7 1,211Primary 47.9 22 61.3 25 55.1 48Middle 66.7 12 65.0 12 65.9 24Secondary 67.0 16 75.3 17 71.3 33Higher 71.5 12 89.4 11 80.2 23
Wealth index quintilesLowest 18.4 410 9.6 387 14.1 796Second 38.4 151 32.8 136 35.7 286Middle 54.7 86 47.8 76 51.5 162Fourth 51.2 36 67.4 41 59.7 77Highest 76.8 10 77.8 9 77.2 18
Table ED.3A: Primary school net attendance ratio (5-9 years)Percentage of children of primary school age (5-9 years) attending primary or secondary school (NAR), MICS Punjab, 2007-08
Male Female Total
MICS PUN JAB 2 0 0 7 - 0 840
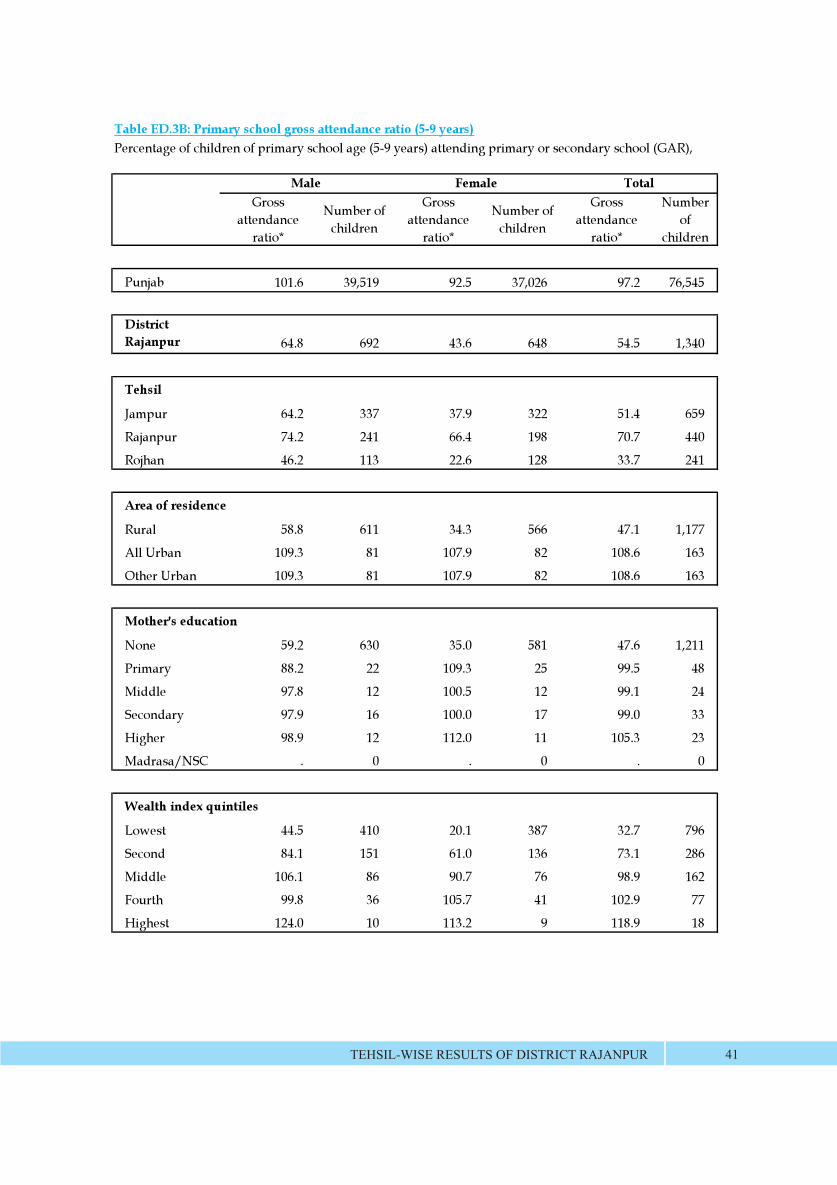
Gross attendance
ratio*
Number of children
Gross attendance
ratio*
Number of children
Gross attendance
ratio*
Number of
children
Punjab 101.6 39,519 92.5 37,026 97.2 76,545
District Rajanpur 64.8 692 43.6 648 54.5 1,340
Tehsil
Jampur 64.2 337 37.9 322 51.4 659
Rajanpur 74.2 241 66.4 198 70.7 440
Rojhan 46.2 113 22.6 128 33.7 241
Area of residence
Rural 58.8 611 34.3 566 47.1 1,177
All Urban 109.3 81 107.9 82 108.6 163
Other Urban 109.3 81 107.9 82 108.6 163
Mother's education
None 59.2 630 35.0 581 47.6 1,211
Primary 88.2 22 109.3 25 99.5 48
Middle 97.8 12 100.5 12 99.1 24
Secondary 97.9 16 100.0 17 99.0 33
Higher 98.9 12 112.0 11 105.3 23
Madrasa/NSC . 0 . 0 . 0
Wealth index quintiles
Lowest 44.5 410 20.1 387 32.7 796
Second 84.1 151 61.0 136 73.1 286
Middle 106.1 86 90.7 76 98.9 162
Fourth 99.8 36 105.7 41 102.9 77
Highest 124.0 10 113.2 9 118.9 18
Male
Table ED.3B: Primary school gross attendance ratio (5-9 years)Percentage of children of primary school age (5-9 years) attending primary or secondary school (GAR),
Female Total
TEHSIL-WISE RESULTS OF DISTRICT RAJANPUR 41
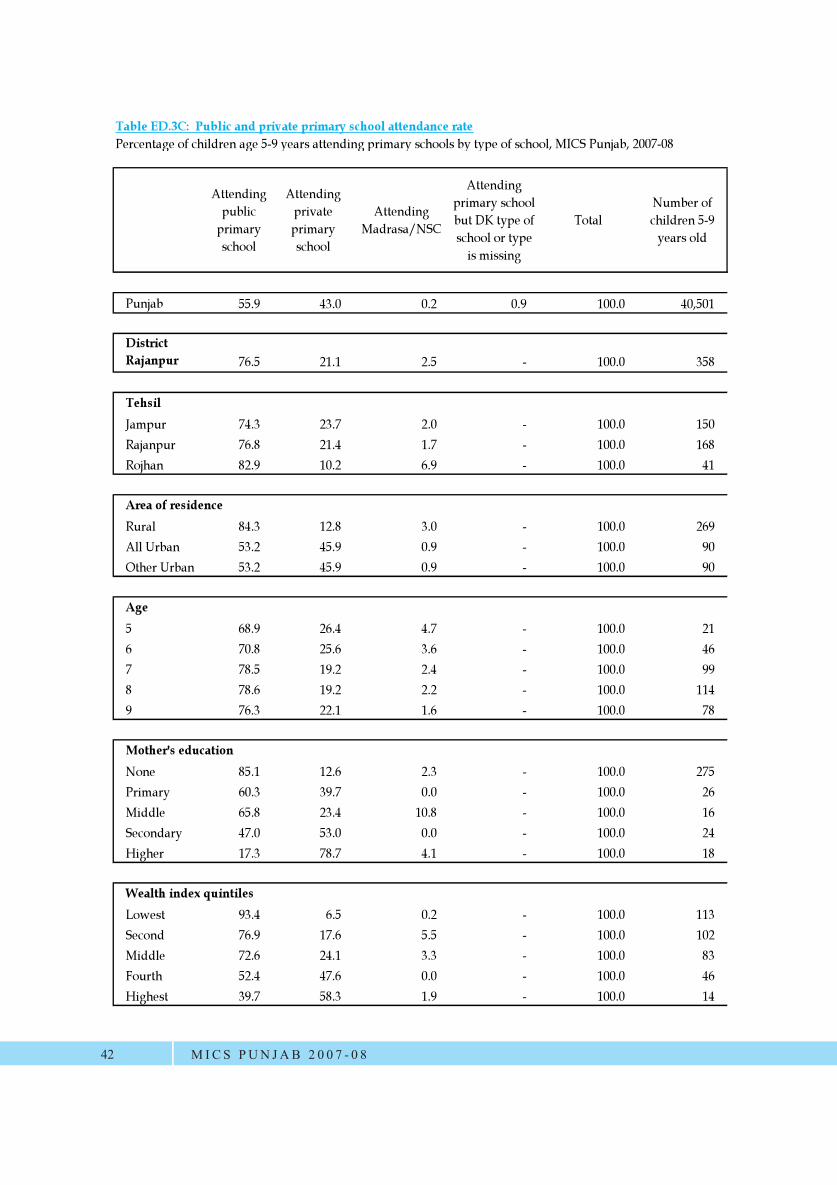
Attending public
primary school
Attending private primary school
Attending Madrasa/NSC
Attending primary school but DK type of school or type
is missing
TotalNumber of children 5-9
years old
Punjab 55.9 43.0 0.2 0.9 100.0 40,501
District Rajanpur 76.5 21.1 2.5 - 100.0 358
TehsilJampur 74.3 23.7 2.0 - 100.0 150Rajanpur 76.8 21.4 1.7 - 100.0 168Rojhan 82.9 10.2 6.9 - 100.0 41
Area of residenceRural 84.3 12.8 3.0 - 100.0 269All Urban 53.2 45.9 0.9 - 100.0 90Other Urban 53.2 45.9 0.9 - 100.0 90
Age5 68.9 26.4 4.7 - 100.0 216 70.8 25.6 3.6 - 100.0 467 78.5 19.2 2.4 - 100.0 998 78.6 19.2 2.2 - 100.0 1149 76.3 22.1 1.6 - 100.0 78
Mother's educationNone 85.1 12.6 2.3 - 100.0 275Primary 60.3 39.7 0.0 - 100.0 26Middle 65.8 23.4 10.8 - 100.0 16Secondary 47.0 53.0 0.0 - 100.0 24Higher 17.3 78.7 4.1 - 100.0 18
Wealth index quintilesLowest 93.4 6.5 0.2 - 100.0 113Second 76.9 17.6 5.5 - 100.0 102Middle 72.6 24.1 3.3 - 100.0 83Fourth 52.4 47.6 0.0 - 100.0 46Highest 39.7 58.3 1.9 - 100.0 14
Table ED.3C: Public and private primary school attendance ratePercentage of children age 5-9 years attending primary schools by type of school, MICS Punjab, 2007-08
MICS PUN JAB 2 0 0 7 - 0 842
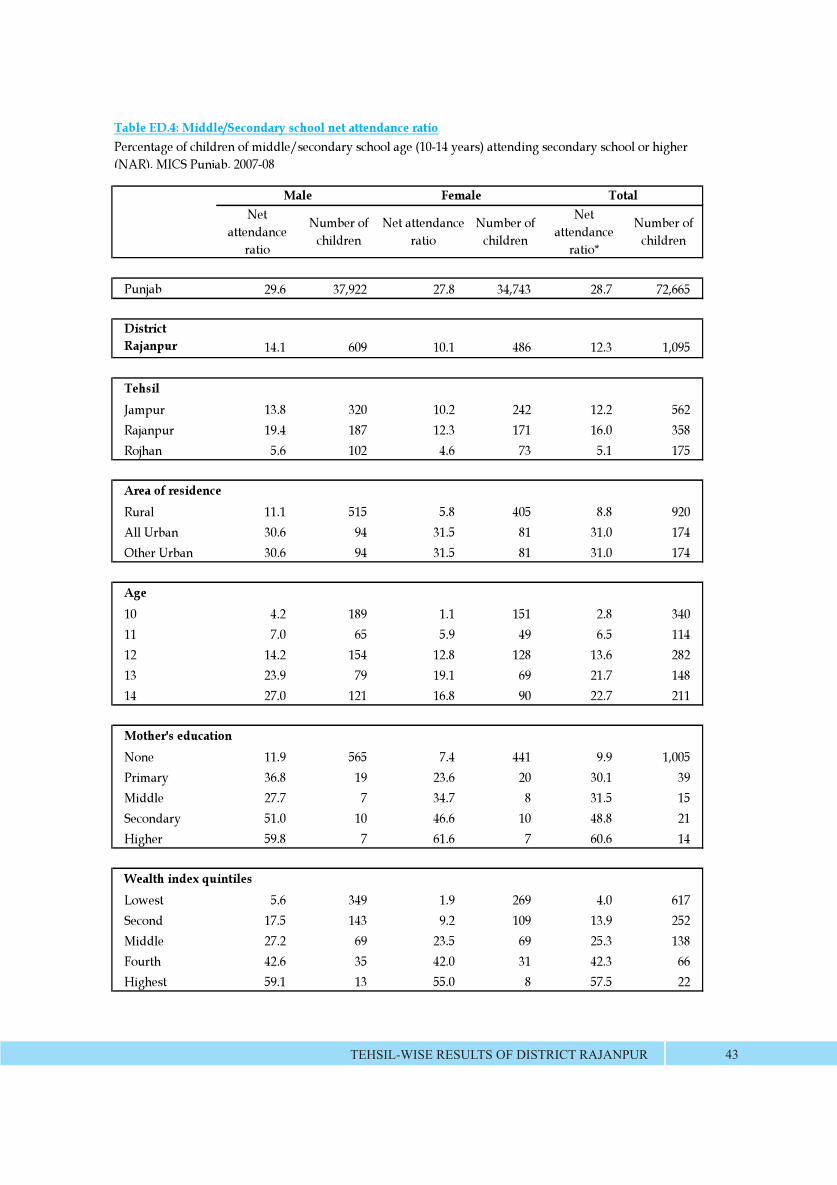
Net attendance
ratio
Number of children
Net attendance ratio
Number of children
Net attendance
ratio*
Number of children
Punjab 29.6 37,922 27.8 34,743 28.7 72,665
District Rajanpur 14.1 609 10.1 486 12.3 1,095
TehsilJampur 13.8 320 10.2 242 12.2 562Rajanpur 19.4 187 12.3 171 16.0 358Rojhan 5.6 102 4.6 73 5.1 175
Area of residenceRural 11.1 515 5.8 405 8.8 920All Urban 30.6 94 31.5 81 31.0 174Other Urban 30.6 94 31.5 81 31.0 174
Age10 4.2 189 1.1 151 2.8 34011 7.0 65 5.9 49 6.5 11412 14.2 154 12.8 128 13.6 28213 23.9 79 19.1 69 21.7 14814 27.0 121 16.8 90 22.7 211
Mother's educationNone 11.9 565 7.4 441 9.9 1,005Primary 36.8 19 23.6 20 30.1 39Middle 27.7 7 34.7 8 31.5 15Secondary 51.0 10 46.6 10 48.8 21Higher 59.8 7 61.6 7 60.6 14
Wealth index quintilesLowest 5.6 349 1.9 269 4.0 617Second 17.5 143 9.2 109 13.9 252Middle 27.2 69 23.5 69 25.3 138Fourth 42.6 35 42.0 31 42.3 66Highest 59.1 13 55.0 8 57.5 22
Female Total
Table ED.4: Middle/Secondary school net attendance ratioPercentage of children of middle/secondary school age (10-14 years) attending secondary school or higher (NAR), MICS Punjab, 2007-08
Male
TEHSIL-WISE RESULTS OF DISTRICT RAJANPUR 43
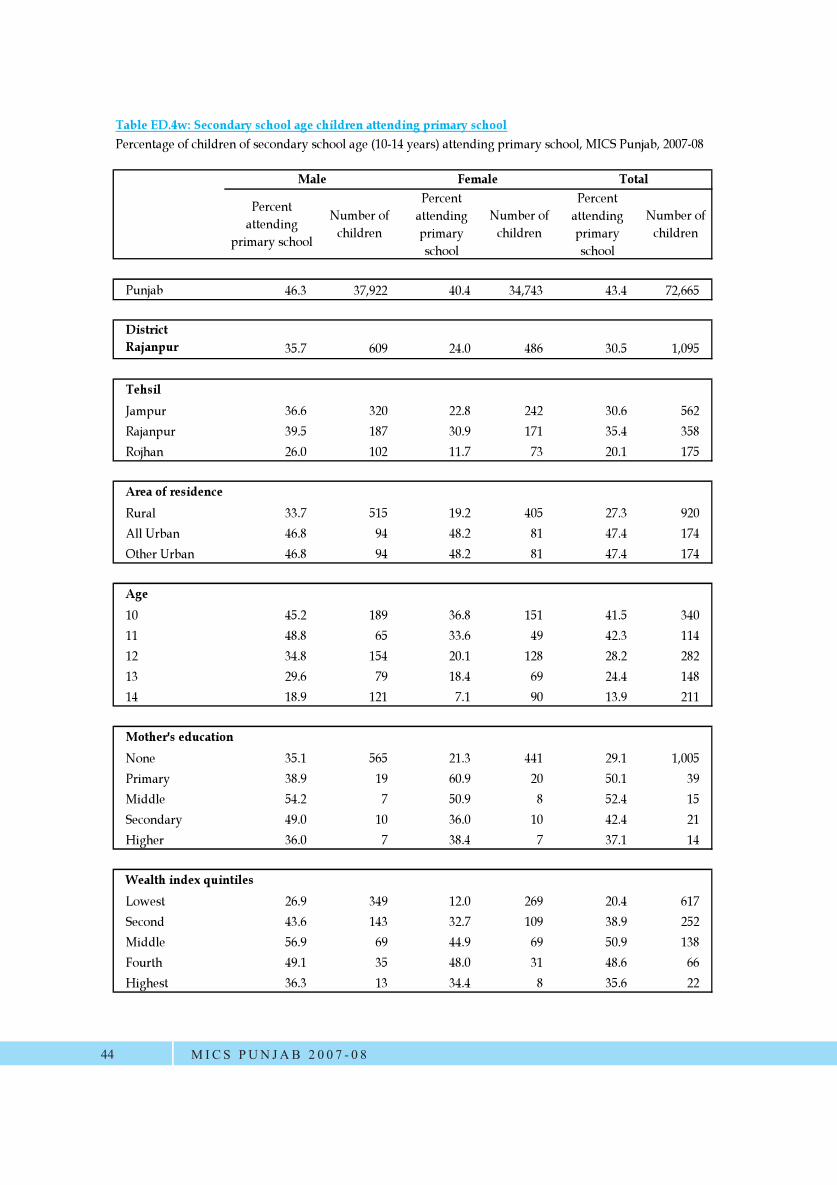
Percent attending
primary school
Number of children
Percent attending primary school
Number of children
Percent attending primary school
Number of children
Punjab 46.3 37,922 40.4 34,743 43.4 72,665
District Rajanpur 35.7 609 24.0 486 30.5 1,095
TehsilJampur 36.6 320 22.8 242 30.6 562Rajanpur 39.5 187 30.9 171 35.4 358Rojhan 26.0 102 11.7 73 20.1 175
Area of residenceRural 33.7 515 19.2 405 27.3 920All Urban 46.8 94 48.2 81 47.4 174Other Urban 46.8 94 48.2 81 47.4 174
Age10 45.2 189 36.8 151 41.5 34011 48.8 65 33.6 49 42.3 11412 34.8 154 20.1 128 28.2 28213 29.6 79 18.4 69 24.4 14814 18.9 121 7.1 90 13.9 211
Mother's educationNone 35.1 565 21.3 441 29.1 1,005Primary 38.9 19 60.9 20 50.1 39Middle 54.2 7 50.9 8 52.4 15Secondary 49.0 10 36.0 10 42.4 21Higher 36.0 7 38.4 7 37.1 14
Wealth index quintilesLowest 26.9 349 12.0 269 20.4 617Second 43.6 143 32.7 109 38.9 252Middle 56.9 69 44.9 69 50.9 138Fourth 49.1 35 48.0 31 48.6 66Highest 36.3 13 34.4 8 35.6 22
Table ED.4w: Secondary school age children attending primary schoolPercentage of children of secondary school age (10-14 years) attending primary school, MICS Punjab, 2007-08
Male Female Total
MICS PUN JAB 2 0 0 7 - 0 844
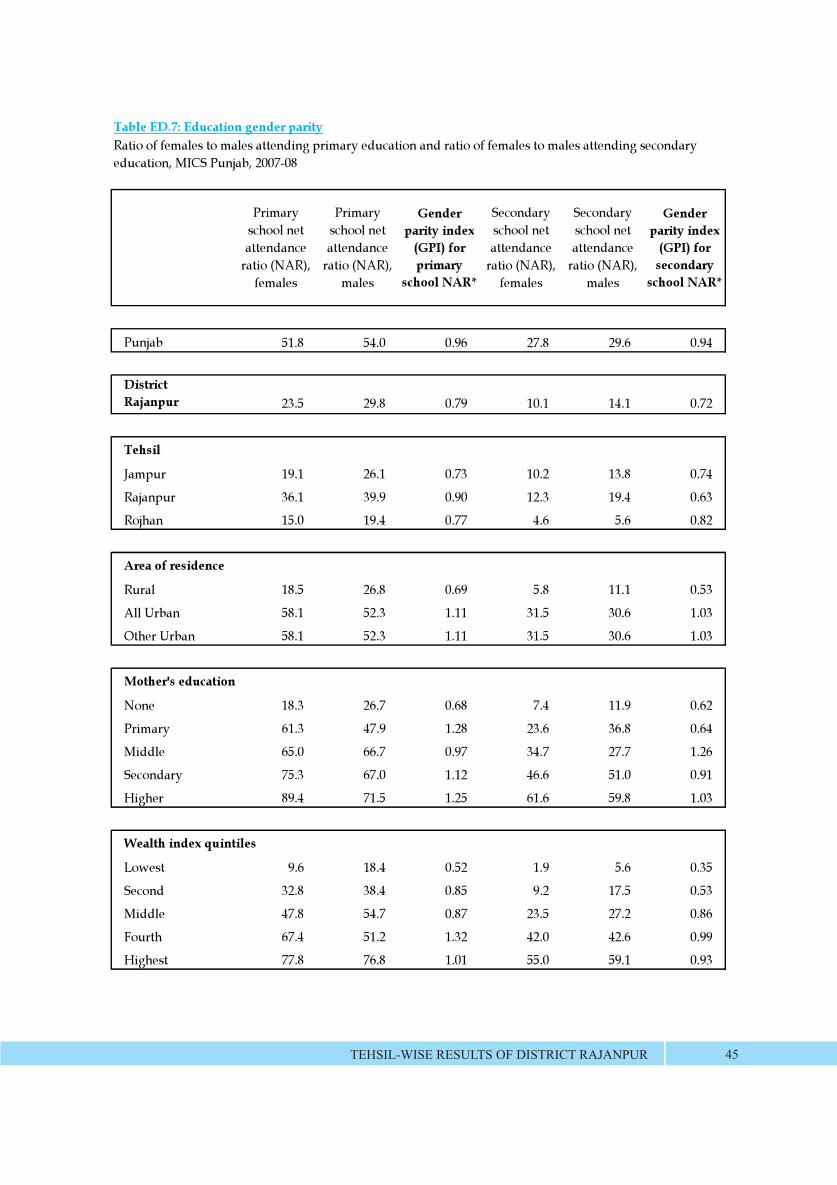
Table ED.7: Education gender parity
Primary school net attendance
ratio (NAR), females
Primary school net attendance
ratio (NAR), males
Gender parity index
(GPI) for primary
school NAR*
Secondary school net attendance
ratio (NAR), females
Secondary school net attendance
ratio (NAR), males
Gender parity index
(GPI) for secondary
school NAR*
Punjab 51.8 54.0 0.96 27.8 29.6 0.94
District Rajanpur 23.5 29.8 0.79 10.1 14.1 0.72
Tehsil
Jampur 19.1 26.1 0.73 10.2 13.8 0.74
Rajanpur 36.1 39.9 0.90 12.3 19.4 0.63
Rojhan 15.0 19.4 0.77 4.6 5.6 0.82
Area of residence
Rural 18.5 26.8 0.69 5.8 11.1 0.53
All Urban 58.1 52.3 1.11 31.5 30.6 1.03
Other Urban 58.1 52.3 1.11 31.5 30.6 1.03
Mother's education
None 18.3 26.7 0.68 7.4 11.9 0.62
Primary 61.3 47.9 1.28 23.6 36.8 0.64
Middle 65.0 66.7 0.97 34.7 27.7 1.26
Secondary 75.3 67.0 1.12 46.6 51.0 0.91
Higher 89.4 71.5 1.25 61.6 59.8 1.03
Wealth index quintiles
Lowest 9.6 18.4 0.52 1.9 5.6 0.35
Second 32.8 38.4 0.85 9.2 17.5 0.53
Middle 47.8 54.7 0.87 23.5 27.2 0.86
Fourth 67.4 51.2 1.32 42.0 42.6 0.99
Highest 77.8 76.8 1.01 55.0 59.1 0.93
Ratio of females to males attending primary education and ratio of females to males attending secondary education, MICS Punjab, 2007-08
TEHSIL-WISE RESULTS OF DISTRICT RAJANPUR 45

Table ED.9A: Physical access to primary schools, MICS Punjab, 2007-08
<2 km 2-5 km
>5 km <2 km 2-5 km >5 km <2 km 2-5 km >5 km <2 km 2-5 km >5 km
Punjab 93.0 5.3 1.7 91.4 5.9 2.7 74.7 9.6 15.7 74.0 9.8 16.2 91,075
District Rajanpur 78.9 7.9 13.2 73.8 9.2 17.0 46.9 15.4 37.6 45.2 15.3 39.5 2,388
Tehsil
Jampur 83.1 7.5 9.4 77.8 9.9 12.3 52.4 13.1 34.6 51.4 13.3 35.3 980
Rajanpur 85.7 5.6 8.7 81.8 8.0 10.2 56.0 21.2 22.8 52.7 20.6 26.7 932
Rojhan 56.6 13.5 29.9 49.9 10.3 39.8 18.4 9.1 72.6 18.4 9.1 72.6 476
Area of residence
Rural 71.4 10.4 18.2 64.3 12.2 23.4 26.8 20.9 52.3 24.4 20.7 54.9 1,728
All Urban 98.5 1.4 0.2 98.5 1.4 0.2 98.3 1.5 0.2 98.3 1.5 0.2 660
Other Urban 98.5 1.4 0.2 98.5 1.4 0.2 98.3 1.5 0.2 98.3 1.5 0.2 660
Education of household head
None 69.9 10.9 19.2 63.7 11.9 24.4 34.4 16.9 48.6 32.4 16.9 50.7 1,477
Primary 89.0 4.9 6.1 82.9 7.7 9.3 56.6 16.8 26.6 55.3 16.8 27.9 246
Middle 95.4 3.1 1.5 91.3 5.6 3.1 62.1 14.9 23.1 61.0 14.4 24.6 195
Secondary 92.9 3.4 3.7 90.6 4.5 4.9 67.3 13.7 19.0 65.8 13.3 20.9 267
Higher 98.0 0.5 1.5 97.0 1.0 2.0 83.1 6.0 10.9 82.1 6.0 11.9 202
Madrasa/NSC 100.0 0.0 0.0 100.0 0.0 0.0 100.0 0.0 0.0 100.0 0.0 0.0 1
Wealth index quintiles
Lowest 63.6 11.8 24.6 55.0 13.6 31.4 22.3 18.1 59.6 20.2 17.9 61.9 1,195
Second 89.9 7.2 3.0 88.0 7.8 4.2 55.2 19.0 25.8 53.2 19.0 27.8 503
Middle 96.2 2.7 1.1 95.3 3.3 1.4 75.1 12.2 12.7 74.0 12.2 13.8 364
Fourth 98.3 0.8 0.8 96.3 2.5 1.3 90.4 4.6 5.0 89.6 4.2 6.3 240
Highest 98.8 0.0 1.2 98.8 0.0 1.2 94.2 3.5 2.3 94.2 3.5 2.3 86
Girls private school Number of
houshold members
Boys government school
Girls government school Boys private school
MICS PUN JAB 2 0 0 7 - 0 846
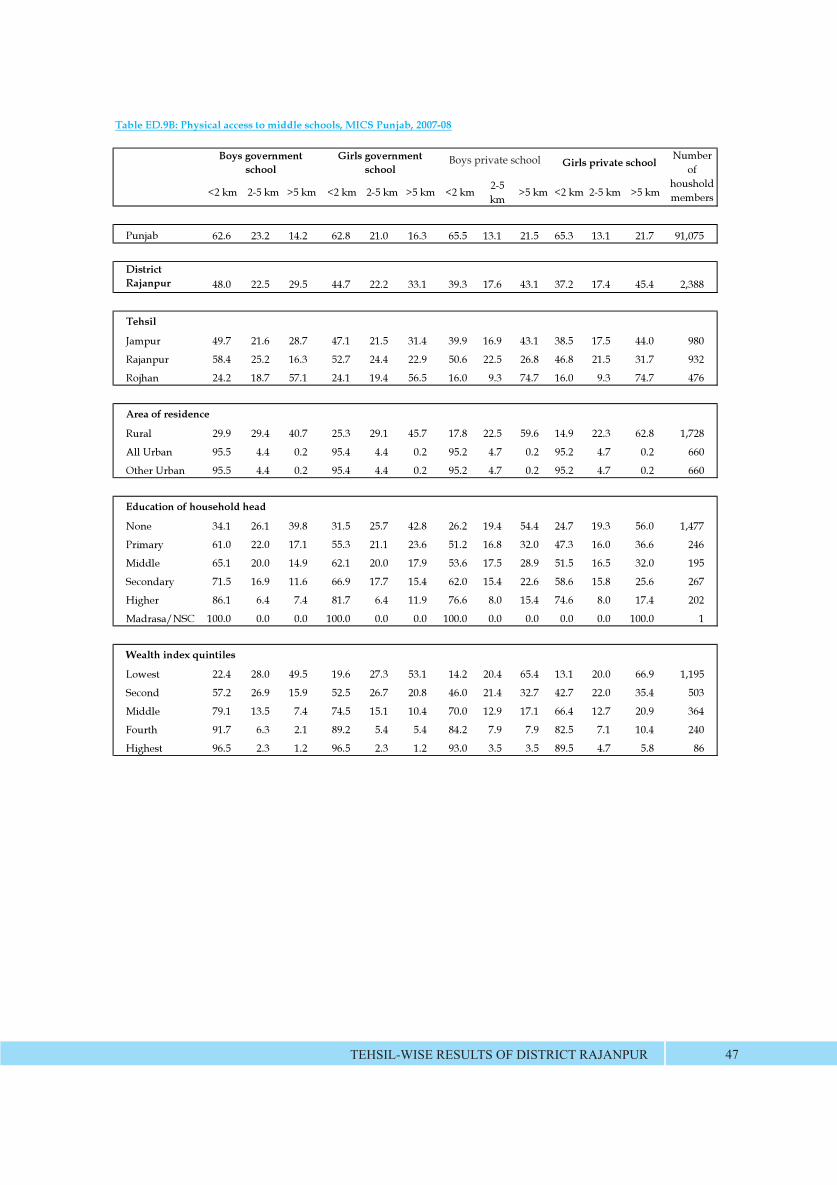
Table ED.9B: Physical access to middle schools, MICS Punjab, 2007-08
<2 km 2-5 km >5 km <2 km 2-5 km >5 km <2 km 2-5 km >5 km <2 km 2-5 km >5 km
Punjab 62.6 23.2 14.2 62.8 21.0 16.3 65.5 13.1 21.5 65.3 13.1 21.7 91,075
District Rajanpur 48.0 22.5 29.5 44.7 22.2 33.1 39.3 17.6 43.1 37.2 17.4 45.4 2,388
Tehsil
Jampur 49.7 21.6 28.7 47.1 21.5 31.4 39.9 16.9 43.1 38.5 17.5 44.0 980
Rajanpur 58.4 25.2 16.3 52.7 24.4 22.9 50.6 22.5 26.8 46.8 21.5 31.7 932
Rojhan 24.2 18.7 57.1 24.1 19.4 56.5 16.0 9.3 74.7 16.0 9.3 74.7 476
Area of residence
Rural 29.9 29.4 40.7 25.3 29.1 45.7 17.8 22.5 59.6 14.9 22.3 62.8 1,728
All Urban 95.5 4.4 0.2 95.4 4.4 0.2 95.2 4.7 0.2 95.2 4.7 0.2 660
Other Urban 95.5 4.4 0.2 95.4 4.4 0.2 95.2 4.7 0.2 95.2 4.7 0.2 660
Education of household head
None 34.1 26.1 39.8 31.5 25.7 42.8 26.2 19.4 54.4 24.7 19.3 56.0 1,477
Primary 61.0 22.0 17.1 55.3 21.1 23.6 51.2 16.8 32.0 47.3 16.0 36.6 246
Middle 65.1 20.0 14.9 62.1 20.0 17.9 53.6 17.5 28.9 51.5 16.5 32.0 195
Secondary 71.5 16.9 11.6 66.9 17.7 15.4 62.0 15.4 22.6 58.6 15.8 25.6 267
Higher 86.1 6.4 7.4 81.7 6.4 11.9 76.6 8.0 15.4 74.6 8.0 17.4 202
Madrasa/NSC 100.0 0.0 0.0 100.0 0.0 0.0 100.0 0.0 0.0 0.0 0.0 100.0 1
Wealth index quintiles
Lowest 22.4 28.0 49.5 19.6 27.3 53.1 14.2 20.4 65.4 13.1 20.0 66.9 1,195
Second 57.2 26.9 15.9 52.5 26.7 20.8 46.0 21.4 32.7 42.7 22.0 35.4 503
Middle 79.1 13.5 7.4 74.5 15.1 10.4 70.0 12.9 17.1 66.4 12.7 20.9 364
Fourth 91.7 6.3 2.1 89.2 5.4 5.4 84.2 7.9 7.9 82.5 7.1 10.4 240
Highest 96.5 2.3 1.2 96.5 2.3 1.2 93.0 3.5 3.5 89.5 4.7 5.8 86
Number of
houshold members
Boys government school
Girls government school Girls private school Girls private school
TEHSIL-WISE RESULTS OF DISTRICT RAJANPUR 47
Boys private school
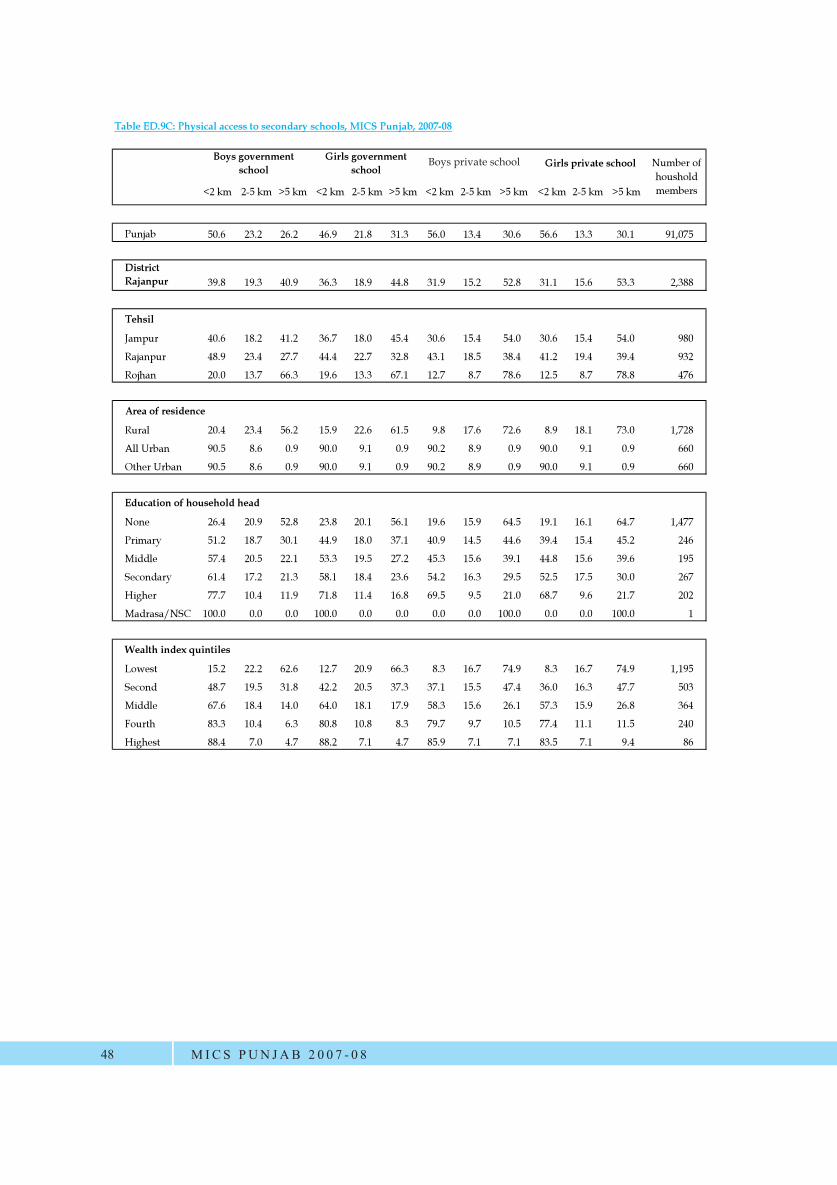
Table ED.9C: Physical access to secondary schools, MICS Punjab, 2007-08
<2 km 2-5 km >5 km <2 km 2-5 km >5 km <2 km 2-5 km >5 km <2 km 2-5 km >5 km
Punjab 50.6 23.2 26.2 46.9 21.8 31.3 56.0 13.4 30.6 56.6 13.3 30.1 91,075
District Rajanpur 39.8 19.3 40.9 36.3 18.9 44.8 31.9 15.2 52.8 31.1 15.6 53.3 2,388
Tehsil
Jampur 40.6 18.2 41.2 36.7 18.0 45.4 30.6 15.4 54.0 30.6 15.4 54.0 980
Rajanpur 48.9 23.4 27.7 44.4 22.7 32.8 43.1 18.5 38.4 41.2 19.4 39.4 932
Rojhan 20.0 13.7 66.3 19.6 13.3 67.1 12.7 8.7 78.6 12.5 8.7 78.8 476
Area of residence
Rural 20.4 23.4 56.2 15.9 22.6 61.5 9.8 17.6 72.6 8.9 18.1 73.0 1,728
All Urban 90.5 8.6 0.9 90.0 9.1 0.9 90.2 8.9 0.9 90.0 9.1 0.9 660
Other Urban 90.5 8.6 0.9 90.0 9.1 0.9 90.2 8.9 0.9 90.0 9.1 0.9 660
Education of household head
None 26.4 20.9 52.8 23.8 20.1 56.1 19.6 15.9 64.5 19.1 16.1 64.7 1,477
Primary 51.2 18.7 30.1 44.9 18.0 37.1 40.9 14.5 44.6 39.4 15.4 45.2 246
Middle 57.4 20.5 22.1 53.3 19.5 27.2 45.3 15.6 39.1 44.8 15.6 39.6 195
Secondary 61.4 17.2 21.3 58.1 18.4 23.6 54.2 16.3 29.5 52.5 17.5 30.0 267
Higher 77.7 10.4 11.9 71.8 11.4 16.8 69.5 9.5 21.0 68.7 9.6 21.7 202
Madrasa/NSC 100.0 0.0 0.0 100.0 0.0 0.0 0.0 0.0 100.0 0.0 0.0 100.0 1
Wealth index quintiles
Lowest 15.2 22.2 62.6 12.7 20.9 66.3 8.3 16.7 74.9 8.3 16.7 74.9 1,195
Second 48.7 19.5 31.8 42.2 20.5 37.3 37.1 15.5 47.4 36.0 16.3 47.7 503
Middle 67.6 18.4 14.0 64.0 18.1 17.9 58.3 15.6 26.1 57.3 15.9 26.8 364
Fourth 83.3 10.4 6.3 80.8 10.8 8.3 79.7 9.7 10.5 77.4 11.1 11.5 240
Highest 88.4 7.0 4.7 88.2 7.1 4.7 85.9 7.1 7.1 83.5 7.1 9.4 86
Number of houshold members
Boys government school
Girls government school Girls private school Girls private school
MICS PUN JAB 2 0 0 7 - 0 848
Boys private school
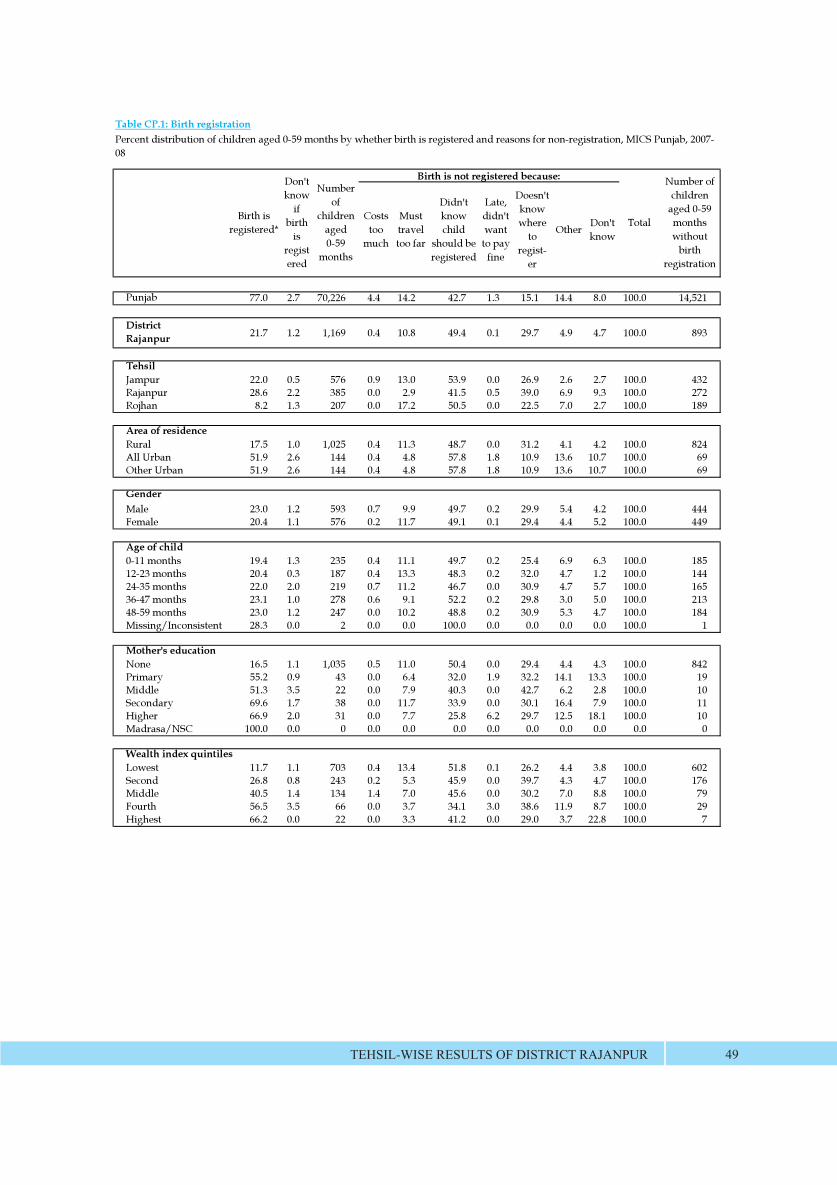
Costs too
much
Must travel too far
Didn't know child
should be registered
Late, didn't want
to pay fine
Doesn't know where
to regist-
er
Other Don't know
Punjab 77.0 2.7 70,226 4.4 14.2 42.7 1.3 15.1 14.4 8.0 100.0 14,521
District Rajanpur 21.7 1.2 1,169 0.4 10.8 49.4 0.1 29.7 4.9 4.7 100.0 893
TehsilJampur 22.0 0.5 576 0.9 13.0 53.9 0.0 26.9 2.6 2.7 100.0 432Rajanpur 28.6 2.2 385 0.0 2.9 41.5 0.5 39.0 6.9 9.3 100.0 272Rojhan 8.2 1.3 207 0.0 17.2 50.5 0.0 22.5 7.0 2.7 100.0 189
Area of residenceRural 17.5 1.0 1,025 0.4 11.3 48.7 0.0 31.2 4.1 4.2 100.0 824All Urban 51.9 2.6 144 0.4 4.8 57.8 1.8 10.9 13.6 10.7 100.0 69Other Urban 51.9 2.6 144 0.4 4.8 57.8 1.8 10.9 13.6 10.7 100.0 69
GenderMale 23.0 1.2 593 0.7 9.9 49.7 0.2 29.9 5.4 4.2 100.0 444Female 20.4 1.1 576 0.2 11.7 49.1 0.1 29.4 4.4 5.2 100.0 449
Age of child0-11 months 19.4 1.3 235 0.4 11.1 49.7 0.2 25.4 6.9 6.3 100.0 18512-23 months 20.4 0.3 187 0.4 13.3 48.3 0.2 32.0 4.7 1.2 100.0 14424-35 months 22.0 2.0 219 0.7 11.2 46.7 0.0 30.9 4.7 5.7 100.0 16536-47 months 23.1 1.0 278 0.6 9.1 52.2 0.2 29.8 3.0 5.0 100.0 21348-59 months 23.0 1.2 247 0.0 10.2 48.8 0.2 30.9 5.3 4.7 100.0 184Missing/Inconsistent 28.3 0.0 2 0.0 0.0 100.0 0.0 0.0 0.0 0.0 100.0 1
Mother's educationNone 16.5 1.1 1,035 0.5 11.0 50.4 0.0 29.4 4.4 4.3 100.0 842Primary 55.2 0.9 43 0.0 6.4 32.0 1.9 32.2 14.1 13.3 100.0 19Middle 51.3 3.5 22 0.0 7.9 40.3 0.0 42.7 6.2 2.8 100.0 10Secondary 69.6 1.7 38 0.0 11.7 33.9 0.0 30.1 16.4 7.9 100.0 11Higher 66.9 2.0 31 0.0 7.7 25.8 6.2 29.7 12.5 18.1 100.0 10Madrasa/NSC 100.0 0.0 0 0.0 0.0 0.0 0.0 0.0 0.0 0.0 0.0 0
Wealth index quintilesLowest 11.7 1.1 703 0.4 13.4 51.8 0.1 26.2 4.4 3.8 100.0 602Second 26.8 0.8 243 0.2 5.3 45.9 0.0 39.7 4.3 4.7 100.0 176Middle 40.5 1.4 134 1.4 7.0 45.6 0.0 30.2 7.0 8.8 100.0 79Fourth 56.5 3.5 66 0.0 3.7 34.1 3.0 38.6 11.9 8.7 100.0 29Highest 66.2 0.0 22 0.0 3.3 41.2 0.0 29.0 3.7 22.8 100.0 7
Table CP.1: Birth registrationPercent distribution of children aged 0-59 months by whether birth is registered and reasons for non-registration, MICS Punjab, 2007-08
Birth is registered*
Don't know
if birth
is registered
Number of
children aged 0-59
months
Birth is not registered because:
Total
Number of children
aged 0-59 months without
birth registration
TEHSIL-WISE RESULTS OF DISTRICT RAJANPUR 49

Paid work Unpaid work
Punjab 0.6 1.0 0.8 2.9 5.1 149,210
District Rajanpur 0.8 0.7 0.4 3.0 4.2 2,435
TehsilJampur 0.8 1.0 0.2 2.4 3.8 1,221Rajanpur 0.2 0.7 0.0 2.4 3.1 798Rojhan 1.8 0.1 1.6 5.9 7.9 416
Area of residenceRural 0.8 0.5 0.4 3.2 4.2 2,097All Urban 1.1 2.0 0.0 1.6 4.6 337Other Urban 1.1 2.0 0.0 1.6 4.6 337
GenderMale 0.8 0.8 0.3 3.3 4.5 1,300Female 0.8 0.6 0.5 2.7 3.9 1,134
Age of child5-11 years 0.5 1.0 0.2 3.1 4.4 1,79412-14 years 1.7 0.0 0.9 2.7 3.7 641
Mother's educationNone 0.9 0.7 0.4 3.1 4.3 2,216Primary 0.3 0.7 0.0 2.5 3.5 87Middle 0.0 0.0 0.0 3.6 3.6 39Secondary 0.0 0.0 0.0 0.3 0.3 54Higher 0.0 3.8 0.0 1.6 5.3 37
Wealth index quintilesLowest 1.1 0.5 0.6 4.4 5.5 1,414Second 0.2 0.6 0.0 0.9 1.7 538Middle 0.6 1.5 0.2 1.8 4.0 299Fourth 0.2 0.8 0.0 0.5 1.5 143Highest 0.0 2.0 0.0 0.7 2.7 40
School participationYes 0.2 0.8 0.1 1.5 2.5 988No 1.2 0.7 0.6 4.0 5.4 1,446
Table CP.2: Child labour
Working for family
business
Total child labour*
Number of children
aged 5-14 years
Working outside householdHousehold chores for
28+ hours/ week
Percentage of children aged 5-14 years who are involved in child labour activities by type of work, MICS Punjab, 2007-08
MICS PUN JAB 2 0 0 7 - 0 850
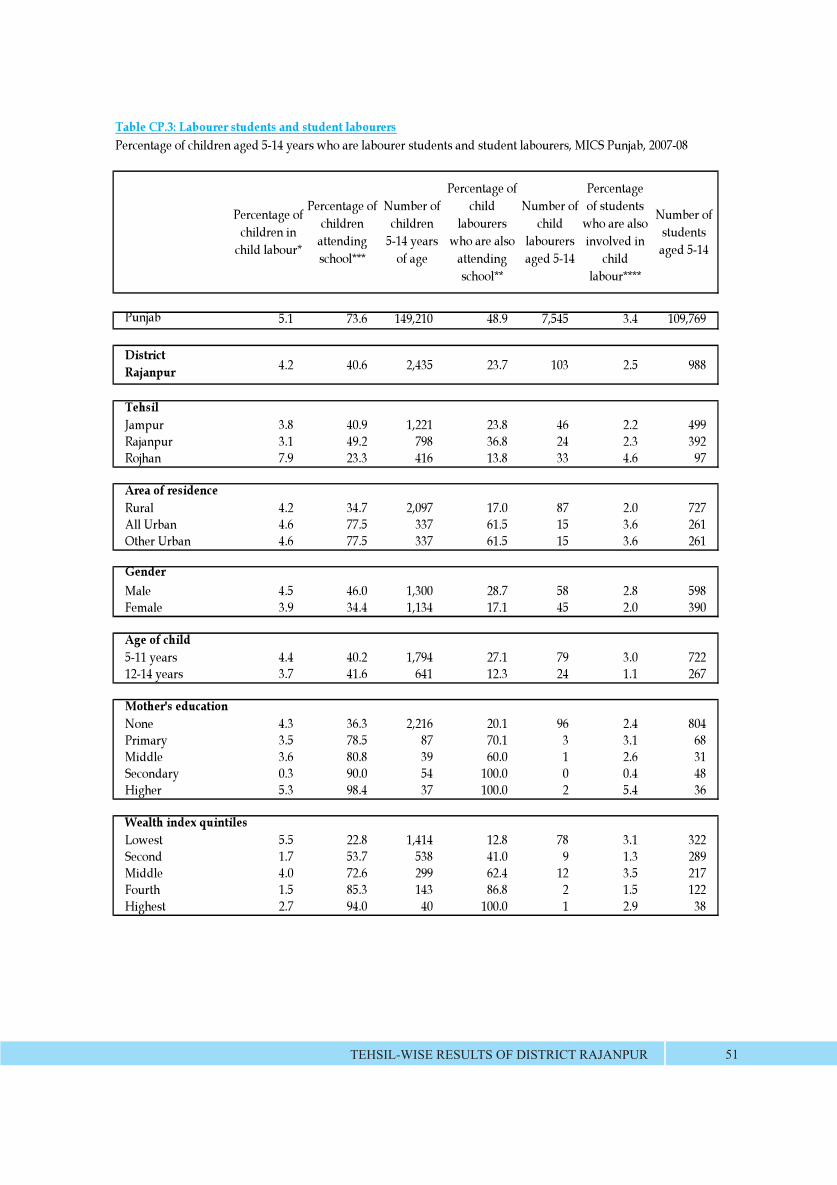
Table CP.3: Labourer students and student labourersPercentage of children aged 5-14 years who are labourer students and student labourers, MICS Punjab, 2007-08
Percentage of children in
child labour*
Percentage of children
attending school***
Number of children
5-14 years of age
Percentage of child
labourers who are also
attending school**
Number of child
labourers aged 5-14
Percentage of students
who are also involved in
child labour****
Number of students aged 5-14
Punjab 5.1 73.6 149,210 48.9 7,545 3.4 109,769
District Rajanpur 4.2 40.6 2,435 23.7 103 2.5 988
TehsilJampur 3.8 40.9 1,221 23.8 46 2.2 499Rajanpur 3.1 49.2 798 36.8 24 2.3 392Rojhan 7.9 23.3 416 13.8 33 4.6 97
Area of residenceRural 4.2 34.7 2,097 17.0 87 2.0 727All Urban 4.6 77.5 337 61.5 15 3.6 261Other Urban 4.6 77.5 337 61.5 15 3.6 261
GenderMale 4.5 46.0 1,300 28.7 58 2.8 598Female 3.9 34.4 1,134 17.1 45 2.0 390
Age of child5-11 years 4.4 40.2 1,794 27.1 79 3.0 72212-14 years 3.7 41.6 641 12.3 24 1.1 267
Mother's educationNone 4.3 36.3 2,216 20.1 96 2.4 804Primary 3.5 78.5 87 70.1 3 3.1 68Middle 3.6 80.8 39 60.0 1 2.6 31Secondary 0.3 90.0 54 100.0 0 0.4 48Higher 5.3 98.4 37 100.0 2 5.4 36
Wealth index quintilesLowest 5.5 22.8 1,414 12.8 78 3.1 322Second 1.7 53.7 538 41.0 9 1.3 289Middle 4.0 72.6 299 62.4 12 3.5 217Fourth 1.5 85.3 143 86.8 2 1.5 122Highest 2.7 94.0 40 100.0 1 2.9 38
TEHSIL-WISE RESULTS OF DISTRICT RAJANPUR 51
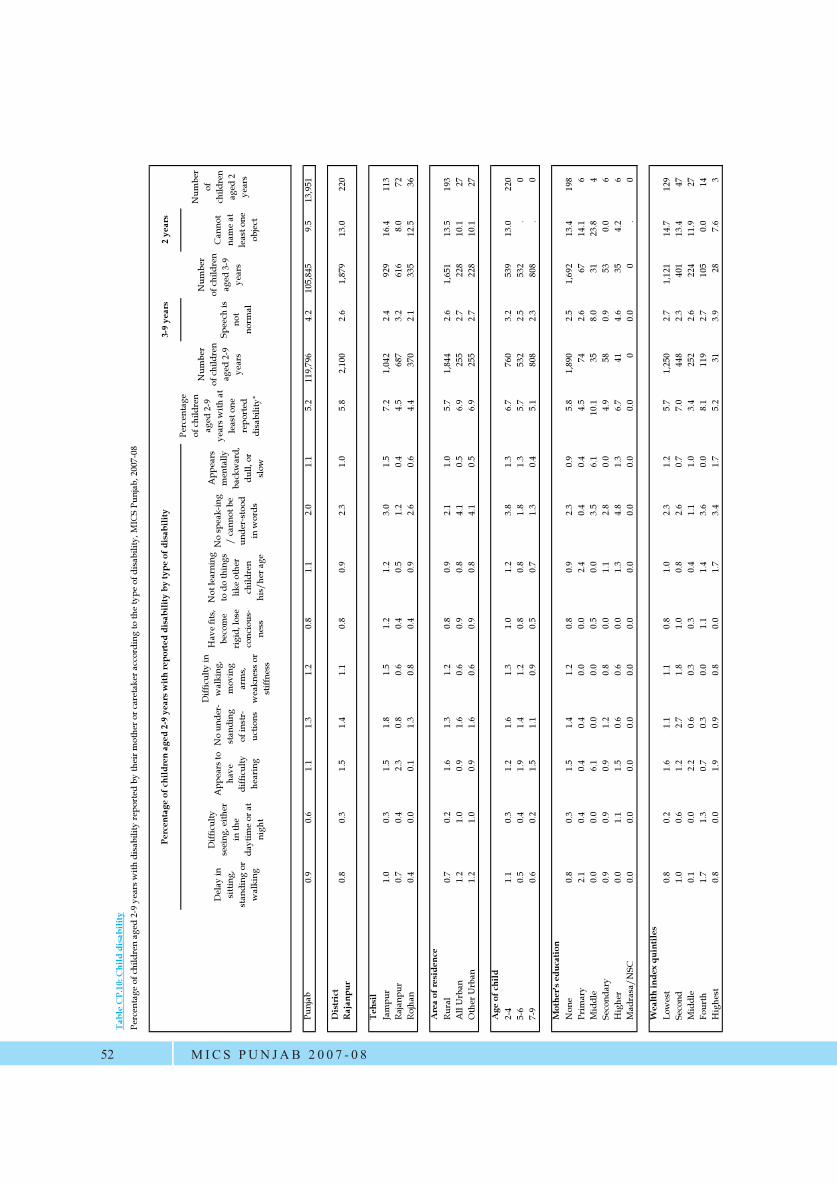
Tabl
e C
P.10
: Chi
ld d
isab
ility
3-9
year
s2
year
s
Del
ay in
si
tting
, st
andi
ng o
r w
alki
ng
Diff
icul
ty
seei
ng, e
ither
in
the
dayt
ime
or a
t ni
ght
App
ears
to
have
di
fficu
lty
hear
ing
No
unde
r-st
andi
ng
of in
str-
uctio
ns
Diff
icul
ty in
w
alki
ng,
mov
ing
arm
s,
wea
knes
s or
stiff
ness
Hav
e fit
s, be
com
e ri
gid,
lose
co
ncio
us-
ness
Not
lear
ning
to
do
thin
gs
like
othe
r ch
ildre
n hi
s/he
r age
No
spea
k-in
g /
cann
ot b
e un
der-
stoo
d in
wor
ds
App
ears
m
enta
lly
back
war
d,
dull,
or
slow
Spee
ch is
no
t no
rmal
Can
not
nam
e at
le
ast o
ne
obje
ct
Punj
ab0.
90.
61.
11.
31.
20.
81.
12.
01.
15.
211
9,79
64.
210
5,84
59.
513
,951
Dis
tric
t R
ajan
pur
0.8
0.3
1.5
1.4
1.1
0.8
0.9
2.3
1.0
5.8
2,10
02.
61,
879
13.0
220
Tehs
ilJa
mpu
r1.
00.
31.
51.
81.
51.
21.
23.
01.
57.
21,
042
2.4
929
16.4
113
Raj
anpu
r0.
70.
42.
30.
80.
60.
40.
51.
20.
44.
568
73.
261
68.
072
Roj
han
0.4
0.0
0.1
1.3
0.8
0.4
0.9
2.6
0.6
4.4
370
2.1
335
12.5
36
Are
a of
resi
denc
eR
ural
0.7
0.2
1.6
1.3
1.2
0.8
0.9
2.1
1.0
5.7
1,84
42.
61,
651
13.5
193
All
Urb
an1.
21.
00.
91.
60.
60.
90.
84.
10.
56.
925
52.
722
810
.127
Oth
er U
rban
1.2
1.0
0.9
1.6
0.6
0.9
0.8
4.1
0.5
6.9
255
2.7
228
10.1
27
Age
of c
hild
2-4
1.1
0.3
1.2
1.6
1.3
1.0
1.2
3.8
1.3
6.7
760
3.2
539
13.0
220
5-6
0.5
0.4
1.9
1.4
1.2
0.8
0.8
1.8
1.3
5.7
532
2.5
532
.0
7-9
0.6
0.2
1.5
1.1
0.9
0.5
0.7
1.3
0.4
5.1
808
2.3
808
.0
Mot
her's
edu
catio
nN
one
0.8
0.3
1.5
1.4
1.2
0.8
0.9
2.3
0.9
5.8
1,89
02.
51,
692
13.4
198
Prim
ary
2.1
0.4
0.4
0.4
0.0
0.0
2.4
0.4
0.4
4.5
742.
667
14.1
6M
iddl
e0.
00.
06.
10.
00.
00.
50.
03.
56.
110
.135
8.0
3123
.84
Seco
ndar
y0.
90.
90.
91.
20.
80.
01.
12.
80.
04.
958
0.9
530.
06
Hig
her
0.0
1.1
1.5
0.6
0.6
0.0
1.3
4.8
1.3
6.7
414.
635
4.2
6M
adra
sa/N
SC0.
00.
00.
00.
00.
00.
00.
00.
00.
00.
00
0.0
0.
0
Wea
lth in
dex
quin
tiles
Low
est
0.8
0.2
1.6
1.1
1.1
0.8
1.0
2.3
1.2
5.7
1,25
02.
71,
121
14.7
129
Seco
nd1.
00.
61.
22.
71.
81.
00.
82.
60.
77.
044
82.
340
113
.447
Mid
dle
0.1
0.0
2.2
0.6
0.3
0.3
0.4
1.1
1.0
3.4
252
2.6
224
11.9
27Fo
urth
1.7
1.3
0.7
0.3
0.0
1.1
1.4
3.6
0.0
8.1
119
2.7
105
0.0
14H
ighe
st0.
80.
01.
90.
90.
80.
01.
73.
41.
75.
231
3.9
287.
63
Num
ber
of
child
ren
aged
2
year
s
Perc
enta
ge o
f chi
ldre
n ag
ed 2
-9 y
ears
with
dis
abili
ty re
port
ed b
y th
eir m
othe
r or c
aret
aker
acc
ordi
ng to
the
type
of d
isab
ility
, MIC
S Pu
njab
, 200
7-08
Num
ber
of c
hild
ren
aged
2-9
ye
ars
Perc
enta
ge
of c
hild
ren
aged
2-9
ye
ars w
ith a
t le
ast o
ne
repo
rted
di
sabi
lity*
Perc
enta
ge o
f chi
ldre
n ag
ed 2
-9 y
ears
with
repo
rted
dis
abili
ty b
y ty
pe o
f dis
abili
ty
Num
ber
of c
hild
ren
aged
3-9
ye
ars
MICS PUN JAB 2 0 0 7 - 0 852
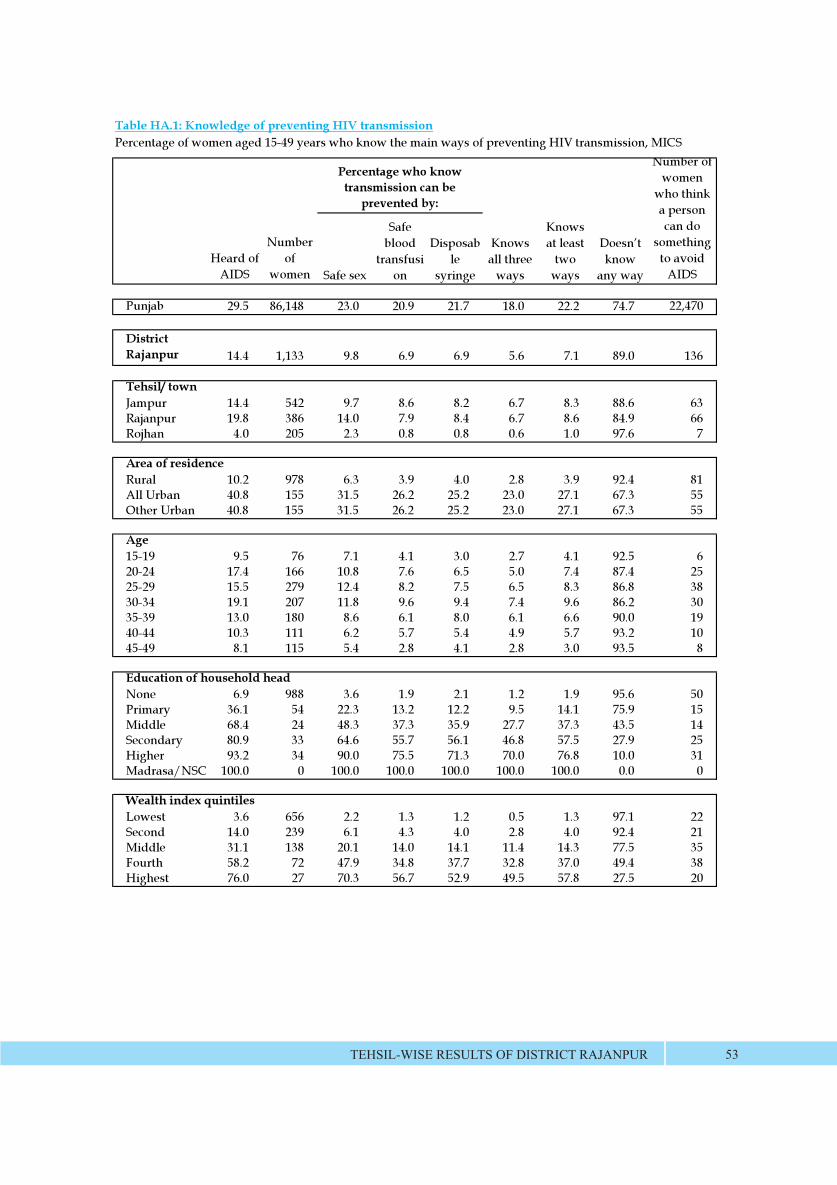
Safe sex
Safe blood
transfusion
Disposable
syringe
Knows all three
ways
Knows at least
two ways
know any way
Punjab 29.5 86,148 23.0 20.9 21.7 18.0 22.2 74.7 22,470
District Rajanpur 14.4 1,133 9.8 6.9 6.9 5.6 7.1 89.0 136
Tehsil/ townJampur 14.4 542 9.7 8.6 8.2 6.7 8.3 88.6 63Rajanpur 19.8 386 14.0 7.9 8.4 6.7 8.6 84.9 66Rojhan 4.0 205 2.3 0.8 0.8 0.6 1.0 97.6 7
Area of residenceRural 10.2 978 6.3 3.9 4.0 2.8 3.9 92.4 81All Urban 40.8 155 31.5 26.2 25.2 23.0 27.1 67.3 55Other Urban 40.8 155 31.5 26.2 25.2 23.0 27.1 67.3 55
Age15-19 9.5 76 7.1 4.1 3.0 2.7 4.1 92.5 620-24 17.4 166 10.8 7.6 6.5 5.0 7.4 87.4 2525-29 15.5 279 12.4 8.2 7.5 6.5 8.3 86.8 3830-34 19.1 207 11.8 9.6 9.4 7.4 9.6 86.2 3035-39 13.0 180 8.6 6.1 8.0 6.1 6.6 90.0 1940-44 10.3 111 6.2 5.7 5.4 4.9 5.7 93.2 1045-49 8.1 115 5.4 2.8 4.1 2.8 3.0 93.5 8
Education of household headNone 6.9 988 3.6 1.9 2.1 1.2 1.9 95.6 50Primary 36.1 54 22.3 13.2 12.2 9.5 14.1 75.9 15Middle 68.4 24 48.3 37.3 35.9 27.7 37.3 43.5 14Secondary 80.9 33 64.6 55.7 56.1 46.8 57.5 27.9 25Higher 93.2 34 90.0 75.5 71.3 70.0 76.8 10.0 31Madrasa/NSC 100.0 0 100.0 100.0 100.0 100.0 100.0 0.0 0
Wealth index quintilesLowest 3.6 656 2.2 1.3 1.2 0.5 1.3 97.1 22Second 14.0 239 6.1 4.3 4.0 2.8 4.0 92.4 21Middle 31.1 138 20.1 14.0 14.1 11.4 14.3 77.5 35Fourth 58.2 72 47.9 34.8 37.7 32.8 37.0 49.4 38Highest 76.0 27 70.3 56.7 52.9 49.5 57.8 27.5 20
Table HA.1: Knowledge of preventing HIV transmissionPercentage of women aged 15-49 years who know the main ways of preventing HIV transmission, MICS
Heard of AIDS
Percentage who know transmission can be
prevented by:
Number of women
who think a person can do
something to avoid
AIDS
Number of
women
TEHSIL-WISE RESULTS OF DISTRICT RAJANPUR 53
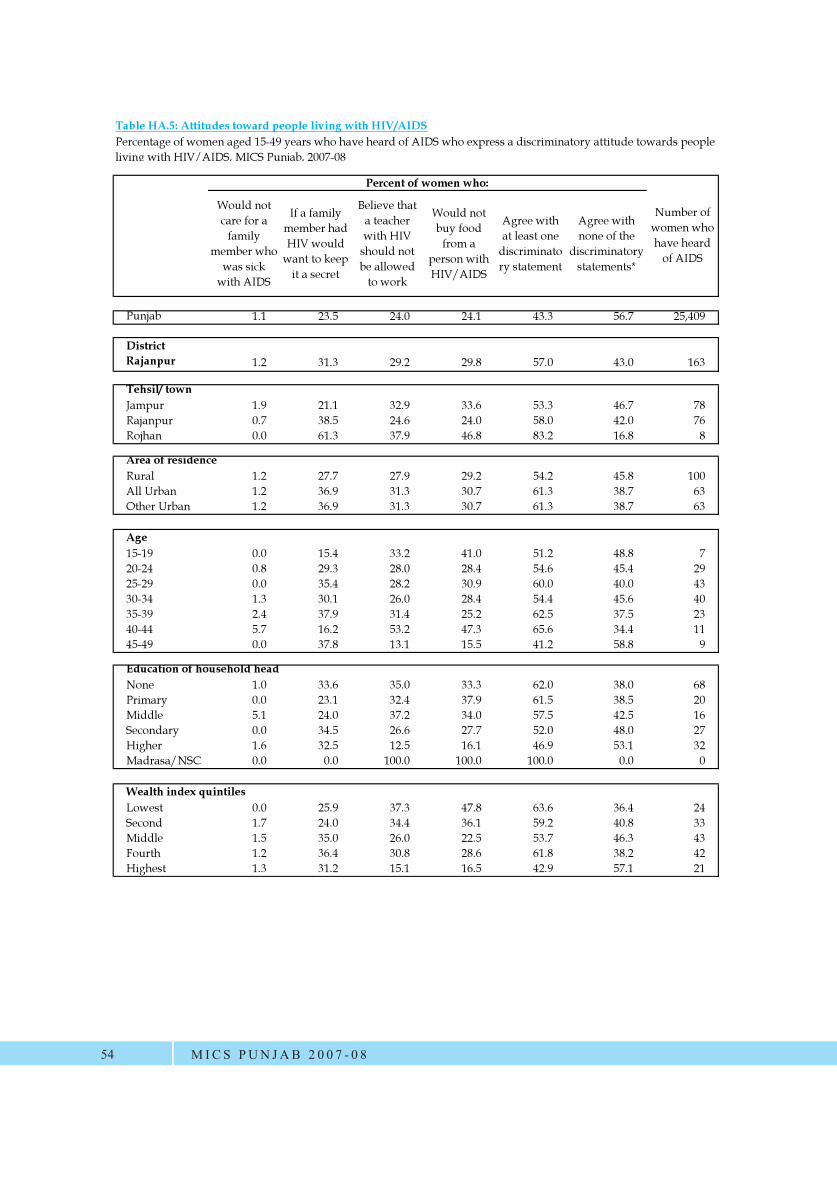
Table HA.5: Attitudes toward people living with HIV/AIDS
Would not care for a
family member who
was sick with AIDS
If a family member had HIV would
want to keep it a secret
Believe that a teacher with HIV
should not be allowed
to work
Would not buy food
from a person with HIV/AIDS
Agree with at least one
discriminatory statement
Agree with none of the
discriminatory statements*
Punjab 1.1 23.5 24.0 24.1 43.3 56.7 25,409
District Rajanpur 1.2 31.3 29.2 29.8 57.0 43.0 163
Tehsil/ townJampur 1.9 21.1 32.9 33.6 53.3 46.7 78Rajanpur 0.7 38.5 24.6 24.0 58.0 42.0 76Rojhan 0.0 61.3 37.9 46.8 83.2 16.8 8
Area of residenceRural 1.2 27.7 27.9 29.2 54.2 45.8 100All Urban 1.2 36.9 31.3 30.7 61.3 38.7 63Other Urban 1.2 36.9 31.3 30.7 61.3 38.7 63
Age15-19 0.0 15.4 33.2 41.0 51.2 48.8 720-24 0.8 29.3 28.0 28.4 54.6 45.4 2925-29 0.0 35.4 28.2 30.9 60.0 40.0 4330-34 1.3 30.1 26.0 28.4 54.4 45.6 4035-39 2.4 37.9 31.4 25.2 62.5 37.5 2340-44 5.7 16.2 53.2 47.3 65.6 34.4 1145-49 0.0 37.8 13.1 15.5 41.2 58.8 9
Education of household headNone 1.0 33.6 35.0 33.3 62.0 38.0 68Primary 0.0 23.1 32.4 37.9 61.5 38.5 20Middle 5.1 24.0 37.2 34.0 57.5 42.5 16Secondary 0.0 34.5 26.6 27.7 52.0 48.0 27Higher 1.6 32.5 12.5 16.1 46.9 53.1 32Madrasa/NSC 0.0 0.0 100.0 100.0 100.0 0.0 0
Wealth index quintilesLowest 0.0 25.9 37.3 47.8 63.6 36.4 24Second 1.7 24.0 34.4 36.1 59.2 40.8 33Middle 1.5 35.0 26.0 22.5 53.7 46.3 43Fourth 1.2 36.4 30.8 28.6 61.8 38.2 42Highest 1.3 31.2 15.1 16.5 42.9 57.1 21
Percentage of women aged 15-49 years who have heard of AIDS who express a discriminatory attitude towards people living with HIV/AIDS, MICS Punjab, 2007-08
Number of women who have heard
of AIDS
Percent of women who:
MICS PUN JAB 2 0 0 7 - 0 854
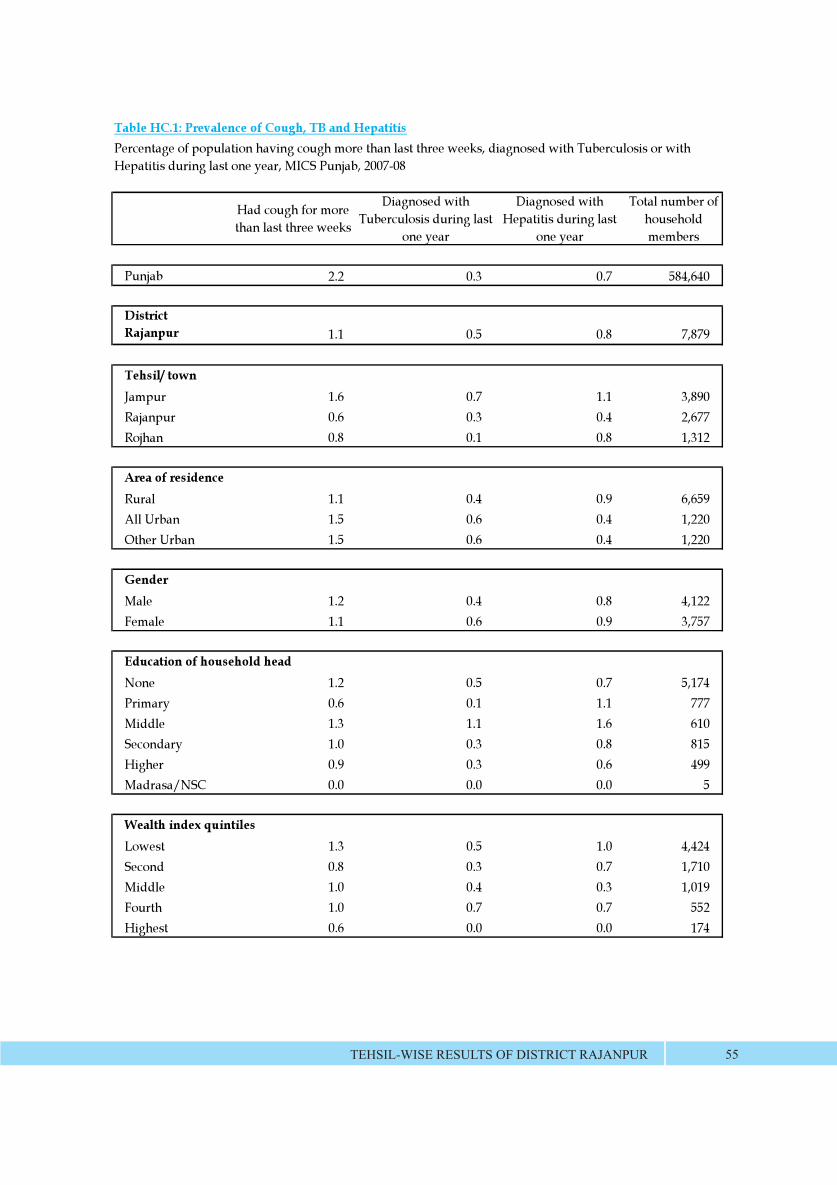
Had cough for more than last three weeks
Diagnosed with Tuberculosis during last
one year
Diagnosed with Hepatitis during last
one year
Total number of household members
Punjab 2.2 0.3 0.7 584,640
District Rajanpur 1.1 0.5 0.8 7,879
Tehsil/ townJampur 1.6 0.7 1.1 3,890Rajanpur 0.6 0.3 0.4 2,677Rojhan 0.8 0.1 0.8 1,312
Area of residenceRural 1.1 0.4 0.9 6,659All Urban 1.5 0.6 0.4 1,220Other Urban 1.5 0.6 0.4 1,220
GenderMale 1.2 0.4 0.8 4,122Female 1.1 0.6 0.9 3,757
Education of household headNone 1.2 0.5 0.7 5,174Primary 0.6 0.1 1.1 777Middle 1.3 1.1 1.6 610Secondary 1.0 0.3 0.8 815Higher 0.9 0.3 0.6 499Madrasa/NSC 0.0 0.0 0.0 5
Wealth index quintilesLowest 1.3 0.5 1.0 4,424Second 0.8 0.3 0.7 1,710Middle 1.0 0.4 0.3 1,019Fourth 1.0 0.7 0.7 552Highest 0.6 0.0 0.0 174
Table HC.1: Prevalence of Cough, TB and HepatitisPercentage of population having cough more than last three weeks, diagnosed with Tuberculosis or with Hepatitis during last one year, MICS Punjab, 2007-08
TEHSIL-WISE RESULTS OF DISTRICT RAJANPUR 55
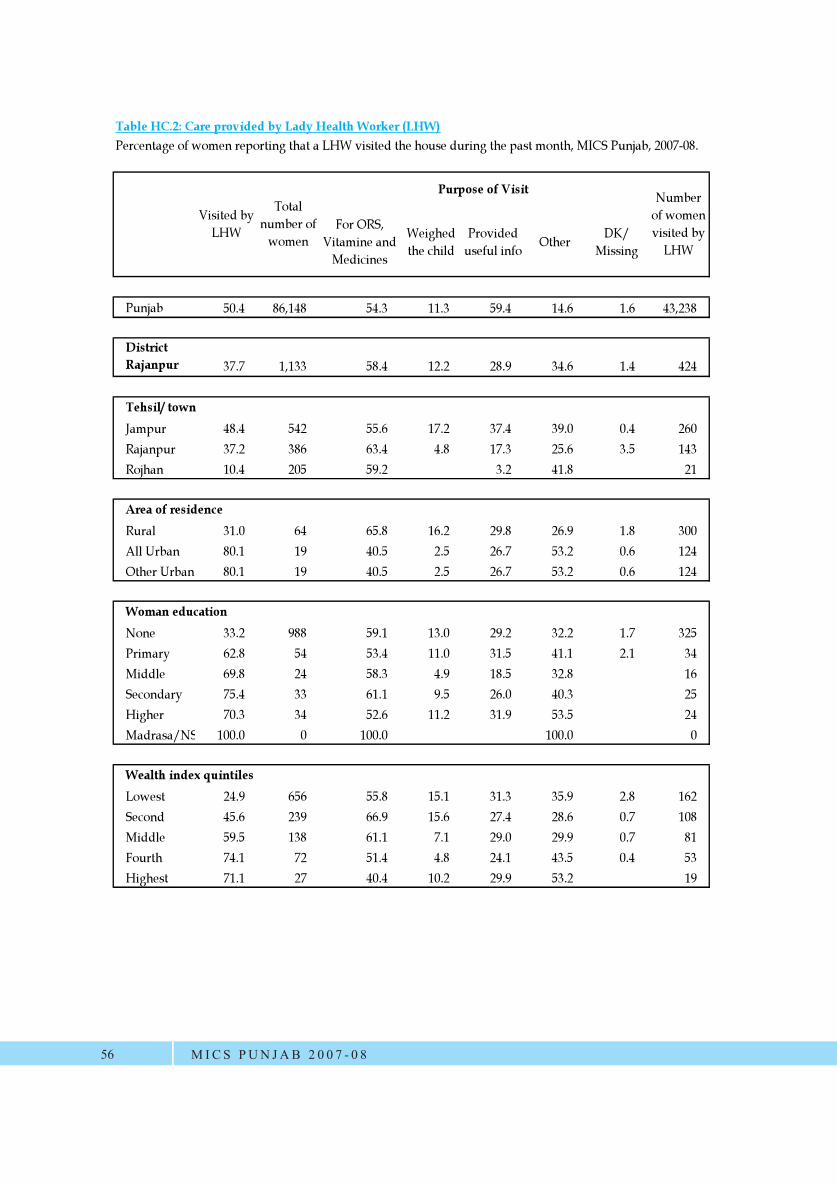
For ORS, Vitamine and
Medicines
Weighed the child
Provided useful info Other DK/
Missing
Punjab 50.4 86,148 54.3 11.3 59.4 14.6 1.6 43,238
District Rajanpur 37.7 1,133 58.4 12.2 28.9 34.6 1.4 424
Tehsil/ townJampur 48.4 542 55.6 17.2 37.4 39.0 0.4 260Rajanpur 37.2 386 63.4 4.8 17.3 25.6 3.5 143Rojhan 10.4 205 59.2 3.2 41.8 21
Area of residenceRural 31.0 64 65.8 16.2 29.8 26.9 1.8 300All Urban 80.1 19 40.5 2.5 26.7 53.2 0.6 124Other Urban 80.1 19 40.5 2.5 26.7 53.2 0.6 124
Woman educationNone 33.2 988 59.1 13.0 29.2 32.2 1.7 325Primary 62.8 54 53.4 11.0 31.5 41.1 2.1 34Middle 69.8 24 58.3 4.9 18.5 32.8 16Secondary 75.4 33 61.1 9.5 26.0 40.3 25Higher 70.3 34 52.6 11.2 31.9 53.5 24Madrasa/NS 100.0 0 100.0 100.0 0
Wealth index quintilesLowest 24.9 656 55.8 15.1 31.3 35.9 2.8 162Second 45.6 239 66.9 15.6 27.4 28.6 0.7 108Middle 59.5 138 61.1 7.1 29.0 29.9 0.7 81Fourth 74.1 72 51.4 4.8 24.1 43.5 0.4 53Highest 71.1 27 40.4 10.2 29.9 53.2 19
Table HC.2: Care provided by Lady Health Worker (LHW)
Total number of
women
Visited by LHW
Number of women visited by
LHW
Percentage of women reporting that a LHW visited the house during the past month, MICS Punjab, 2007-08.
Purpose of Visit
MICS PUN JAB 2 0 0 7 - 0 856
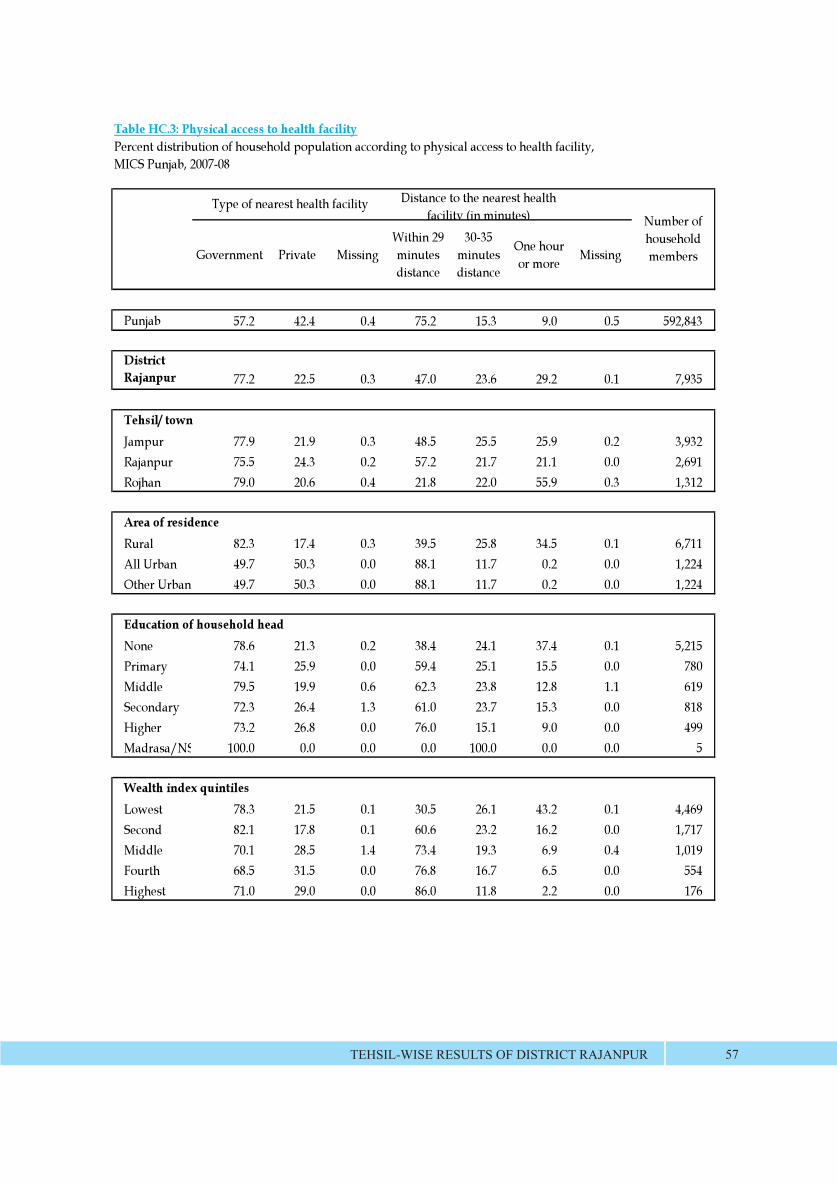
Government Private MissingWithin 29 minutes distance
30-35 minutes distance
One hour or more Missing
Punjab 57.2 42.4 0.4 75.2 15.3 9.0 0.5 592,843
District Rajanpur 77.2 22.5 0.3 47.0 23.6 29.2 0.1 7,935
Tehsil/ townJampur 77.9 21.9 0.3 48.5 25.5 25.9 0.2 3,932Rajanpur 75.5 24.3 0.2 57.2 21.7 21.1 0.0 2,691Rojhan 79.0 20.6 0.4 21.8 22.0 55.9 0.3 1,312
Area of residenceRural 82.3 17.4 0.3 39.5 25.8 34.5 0.1 6,711All Urban 49.7 50.3 0.0 88.1 11.7 0.2 0.0 1,224Other Urban 49.7 50.3 0.0 88.1 11.7 0.2 0.0 1,224
Education of household headNone 78.6 21.3 0.2 38.4 24.1 37.4 0.1 5,215Primary 74.1 25.9 0.0 59.4 25.1 15.5 0.0 780Middle 79.5 19.9 0.6 62.3 23.8 12.8 1.1 619Secondary 72.3 26.4 1.3 61.0 23.7 15.3 0.0 818Higher 73.2 26.8 0.0 76.0 15.1 9.0 0.0 499Madrasa/NS 100.0 0.0 0.0 0.0 100.0 0.0 0.0 5
Wealth index quintilesLowest 78.3 21.5 0.1 30.5 26.1 43.2 0.1 4,469Second 82.1 17.8 0.1 60.6 23.2 16.2 0.0 1,717Middle 70.1 28.5 1.4 73.4 19.3 6.9 0.4 1,019Fourth 68.5 31.5 0.0 76.8 16.7 6.5 0.0 554Highest 71.0 29.0 0.0 86.0 11.8 2.2 0.0 176
Table HC.3: Physical access to health facility
Number of household members
Type of nearest health facility Distance to the nearest health facility (in minutes)
Percent distribution of household population according to physical access to health facility, MICS Punjab, 2007-08
TEHSIL-WISE RESULTS OF DISTRICT RAJANPUR 57

Table HC.5: Unemployment rate
Employed Unemployed and seeking job Total
Total number of households 15 years
or more in active labour force
Punjab 93.2 6.8 100.0 163,215
District Rajanpur 94.9 5.1 100.0 1,894
Tehsil/ town
Jampur 94.1 5.9 100.0 899
Rajanpur 95.3 4.7 100.0 670
Rojhan 95.8 4.2 100.0 325
Area of residence
Rural 95.5 4.5 100.0 1,565
All Urban 92.0 8.0 100.0 330
Other Urban 92.0 8.0 100.0 330
Age
15-24 85.5 14.5 100.0 534
23-34 97.6 2.4 100.0 480
35-44 99.1 0.9 100.0 401
45-54 99.0 1.0 100.0 233
55-64 99.1 0.9 100.0 183
65-74 99.3 0.7 100.0 53
75+ 100.0 0.0 100.0 10
Wealth index quintiles
Lowest 95.6 4.4 100.0 1,058
Second 93.9 6.1 100.0 390
Middle 95.4 4.6 100.0 254
Fourth 90.9 9.1 100.0 142
Highest 95.8 4.2 100.0 50
Percent distribution of population 15 years or more who are unemployed, MICS Punjab, 2007-08
MICS PUN JAB 2 0 0 7 - 0 858
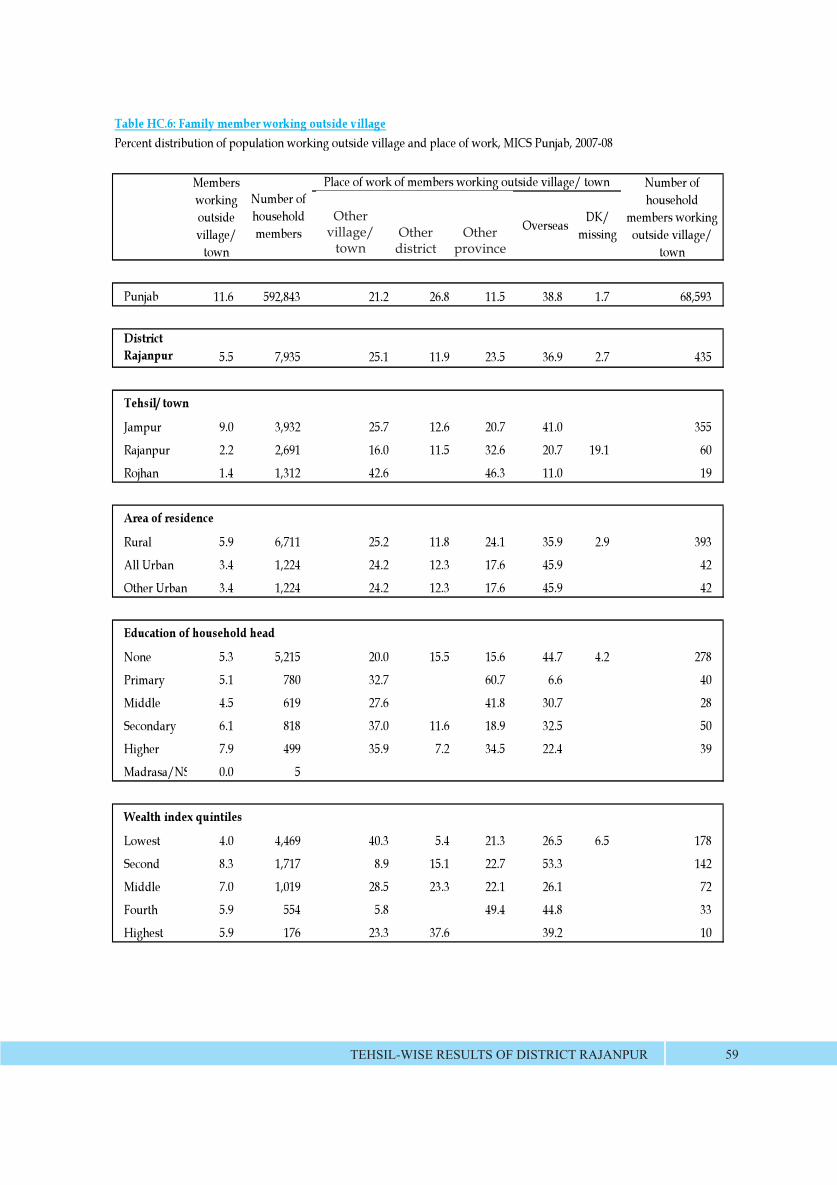
Other village/ town or district or province or
overseas
District or province
or overseas
Province or
overseasOverseas DK/
missing
Punjab 11.6 592,843 21.2 26.8 11.5 38.8 1.7 68,593
District Rajanpur 5.5 7,935 25.1 11.9 23.5 36.9 2.7 435
Tehsil/ town
Jampur 9.0 3,932 25.7 12.6 20.7 41.0 355
Rajanpur 2.2 2,691 16.0 11.5 32.6 20.7 19.1 60
Rojhan 1.4 1,312 42.6 46.3 11.0 19
Area of residence
Rural 5.9 6,711 25.2 11.8 24.1 35.9 2.9 393
All Urban 3.4 1,224 24.2 12.3 17.6 45.9 42
Other Urban 3.4 1,224 24.2 12.3 17.6 45.9 42
Education of household head
None 5.3 5,215 20.0 15.5 15.6 44.7 4.2 278
Primary 5.1 780 32.7 60.7 6.6 40
Middle 4.5 619 27.6 41.8 30.7 28
Secondary 6.1 818 37.0 11.6 18.9 32.5 50
Higher 7.9 499 35.9 7.2 34.5 22.4 39
Madrasa/NS 0.0 5
Wealth index quintiles
Lowest 4.0 4,469 40.3 5.4 21.3 26.5 6.5 178
Second 8.3 1,717 8.9 15.1 22.7 53.3 142
Middle 7.0 1,019 28.5 23.3 22.1 26.1 72
Fourth 5.9 554 5.8 49.4 44.8 33
Highest 5.9 176 23.3 37.6 39.2 10
Table HC.6: Family member working outside village
Place of work of members working outside village/ town Number of household
members working outside village/
town
Members working outside village/
town
Number of household members
Percent distribution of population working outside village and place of work, MICS Punjab, 2007-08
TEHSIL-WISE RESULTS OF DISTRICT RAJANPUR 59
Othervillage/
townOther
districtOther
province
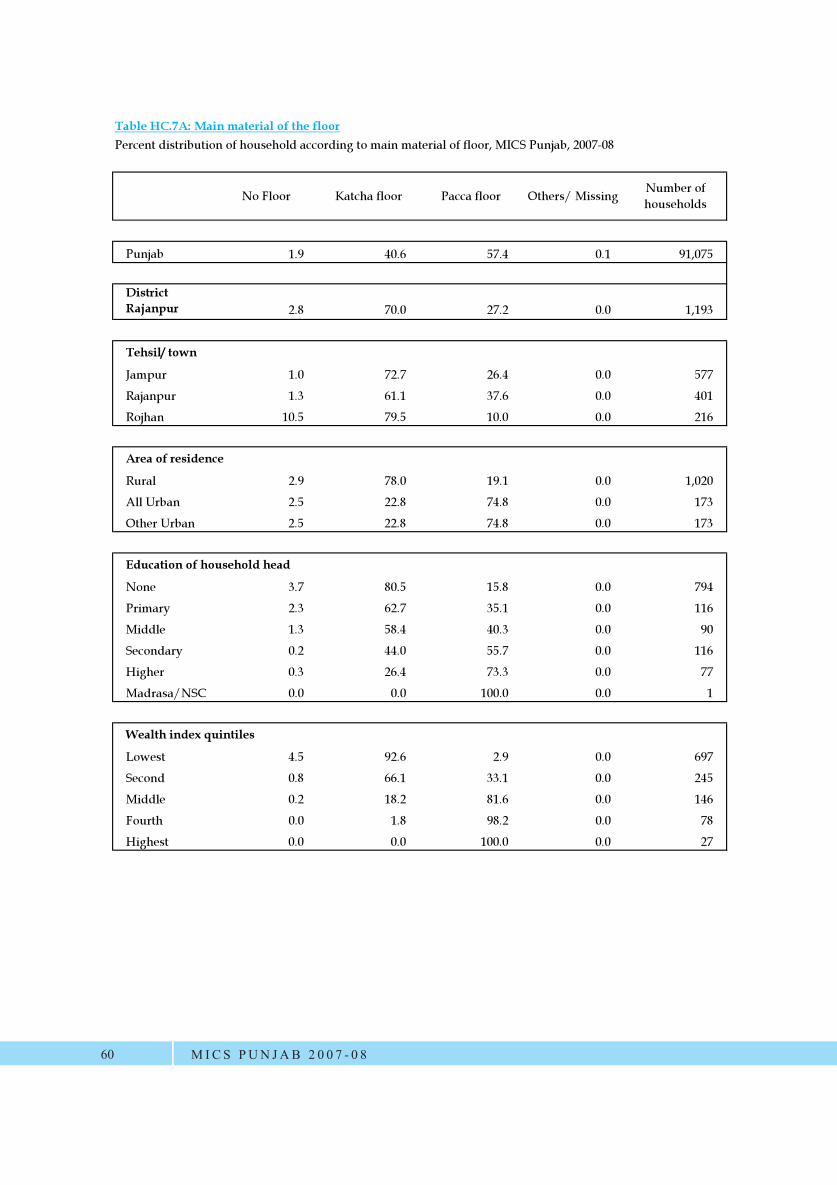
Table HC.7A: Main material of the floor
No Floor Katcha floor Pacca floor Others/ Missing Number of households
Punjab 1.9 40.6 57.4 0.1 91,075
District Rajanpur 2.8 70.0 27.2 0.0 1,193
Tehsil/ town
Jampur 1.0 72.7 26.4 0.0 577
Rajanpur 1.3 61.1 37.6 0.0 401
Rojhan 10.5 79.5 10.0 0.0 216
Area of residence
Rural 2.9 78.0 19.1 0.0 1,020
All Urban 2.5 22.8 74.8 0.0 173
Other Urban 2.5 22.8 74.8 0.0 173
Education of household head
None 3.7 80.5 15.8 0.0 794
Primary 2.3 62.7 35.1 0.0 116
Middle 1.3 58.4 40.3 0.0 90
Secondary 0.2 44.0 55.7 0.0 116
Higher 0.3 26.4 73.3 0.0 77
Madrasa/NSC 0.0 0.0 100.0 0.0 1
Wealth index quintiles
Lowest 4.5 92.6 2.9 0.0 697
Second 0.8 66.1 33.1 0.0 245
Middle 0.2 18.2 81.6 0.0 146
Fourth 0.0 1.8 98.2 0.0 78
Highest 0.0 0.0 100.0 0.0 27
Percent distribution of household according to main material of floor, MICS Punjab, 2007-08
MICS PUN JAB 2 0 0 7 - 0 860
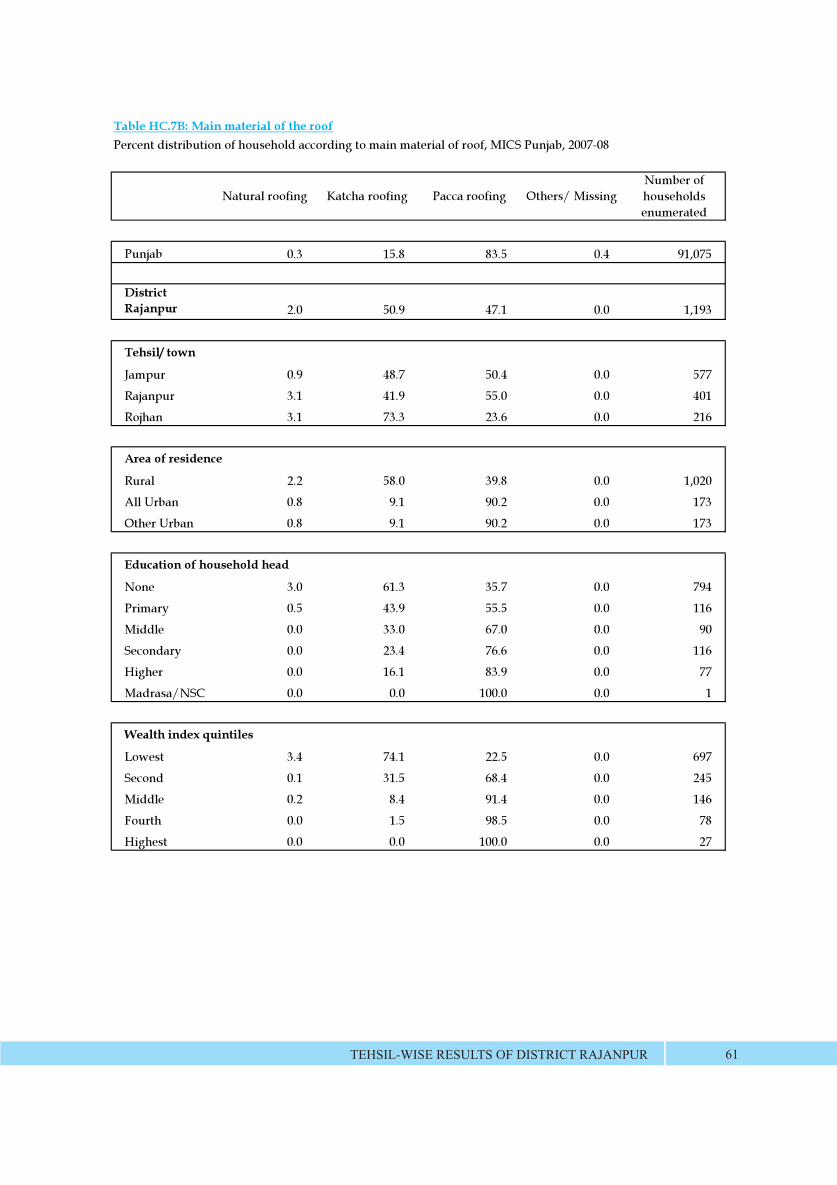
Table HC.7B: Main material of the roof
Natural roofing Katcha roofing Pacca roofing Others/ MissingNumber of households enumerated
Punjab 0.3 15.8 83.5 0.4 91,075
District Rajanpur 2.0 50.9 47.1 0.0 1,193
Tehsil/ town
Jampur 0.9 48.7 50.4 0.0 577
Rajanpur 3.1 41.9 55.0 0.0 401
Rojhan 3.1 73.3 23.6 0.0 216
Area of residence
Rural 2.2 58.0 39.8 0.0 1,020
All Urban 0.8 9.1 90.2 0.0 173
Other Urban 0.8 9.1 90.2 0.0 173
Education of household head
None 3.0 61.3 35.7 0.0 794
Primary 0.5 43.9 55.5 0.0 116
Middle 0.0 33.0 67.0 0.0 90
Secondary 0.0 23.4 76.6 0.0 116
Higher 0.0 16.1 83.9 0.0 77
Madrasa/NSC 0.0 0.0 100.0 0.0 1
Wealth index quintiles
Lowest 3.4 74.1 22.5 0.0 697
Second 0.1 31.5 68.4 0.0 245
Middle 0.2 8.4 91.4 0.0 146
Fourth 0.0 1.5 98.5 0.0 78
Highest 0.0 0.0 100.0 0.0 27
Percent distribution of household according to main material of roof, MICS Punjab, 2007-08
TEHSIL-WISE RESULTS OF DISTRICT RAJANPUR 61
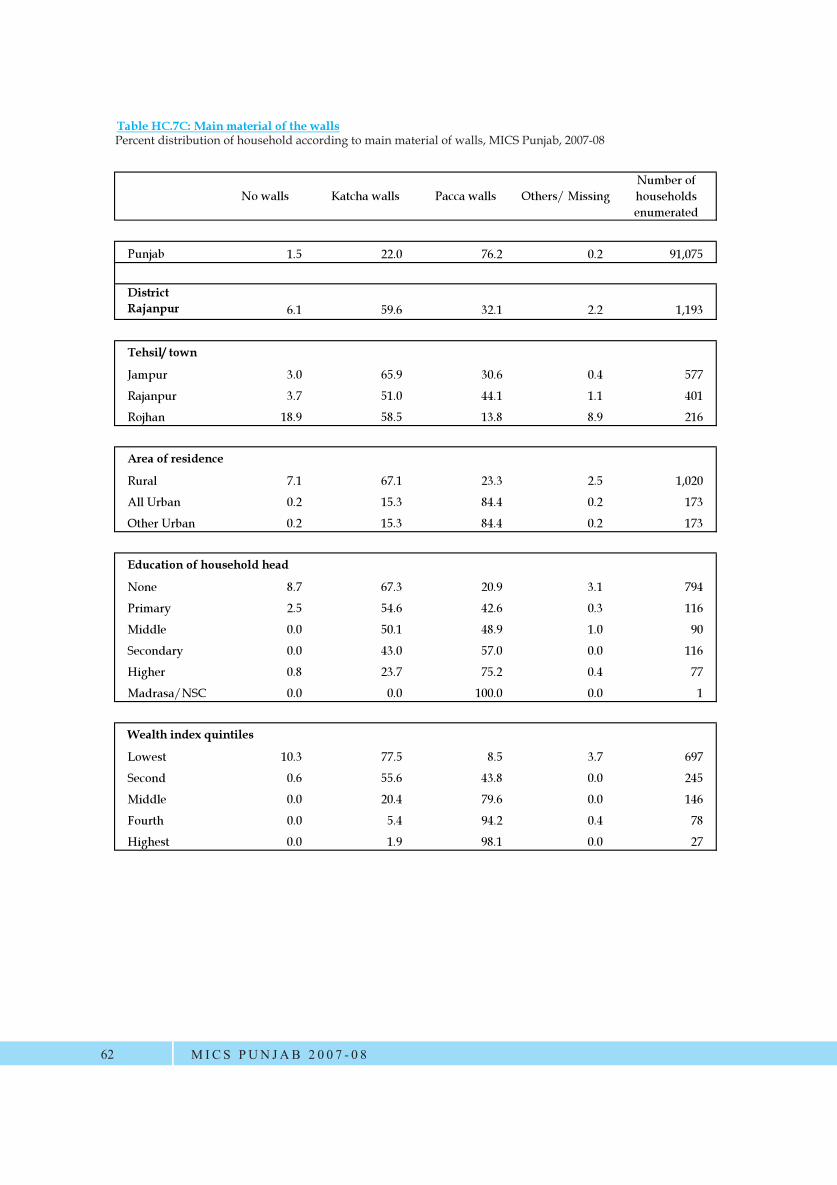
Table HC.7C: Main material of the walls
No walls Katcha walls Pacca walls Others/ MissingNumber of households enumerated
Punjab 1.5 22.0 76.2 0.2 91,075
District Rajanpur 6.1 59.6 32.1 2.2 1,193
Tehsil/ town
Jampur 3.0 65.9 30.6 0.4 577
Rajanpur 3.7 51.0 44.1 1.1 401
Rojhan 18.9 58.5 13.8 8.9 216
Area of residence
Rural 7.1 67.1 23.3 2.5 1,020
All Urban 0.2 15.3 84.4 0.2 173
Other Urban 0.2 15.3 84.4 0.2 173
Education of household head
None 8.7 67.3 20.9 3.1 794
Primary 2.5 54.6 42.6 0.3 116
Middle 0.0 50.1 48.9 1.0 90
Secondary 0.0 43.0 57.0 0.0 116
Higher 0.8 23.7 75.2 0.4 77
Madrasa/NSC 0.0 0.0 100.0 0.0 1
Wealth index quintiles
Lowest 10.3 77.5 8.5 3.7 697
Second 0.6 55.6 43.8 0.0 245
Middle 0.0 20.4 79.6 0.0 146
Fourth 0.0 5.4 94.2 0.4 78
Highest 0.0 1.9 98.1 0.0 27
Percent distribution of household according to main material of floor, MICS Punjab, 2007-08
MICS PUN JAB 2 0 0 7 - 0 862
Percent distribution of household according to main material of walls, MICS Punjab, 2007-08
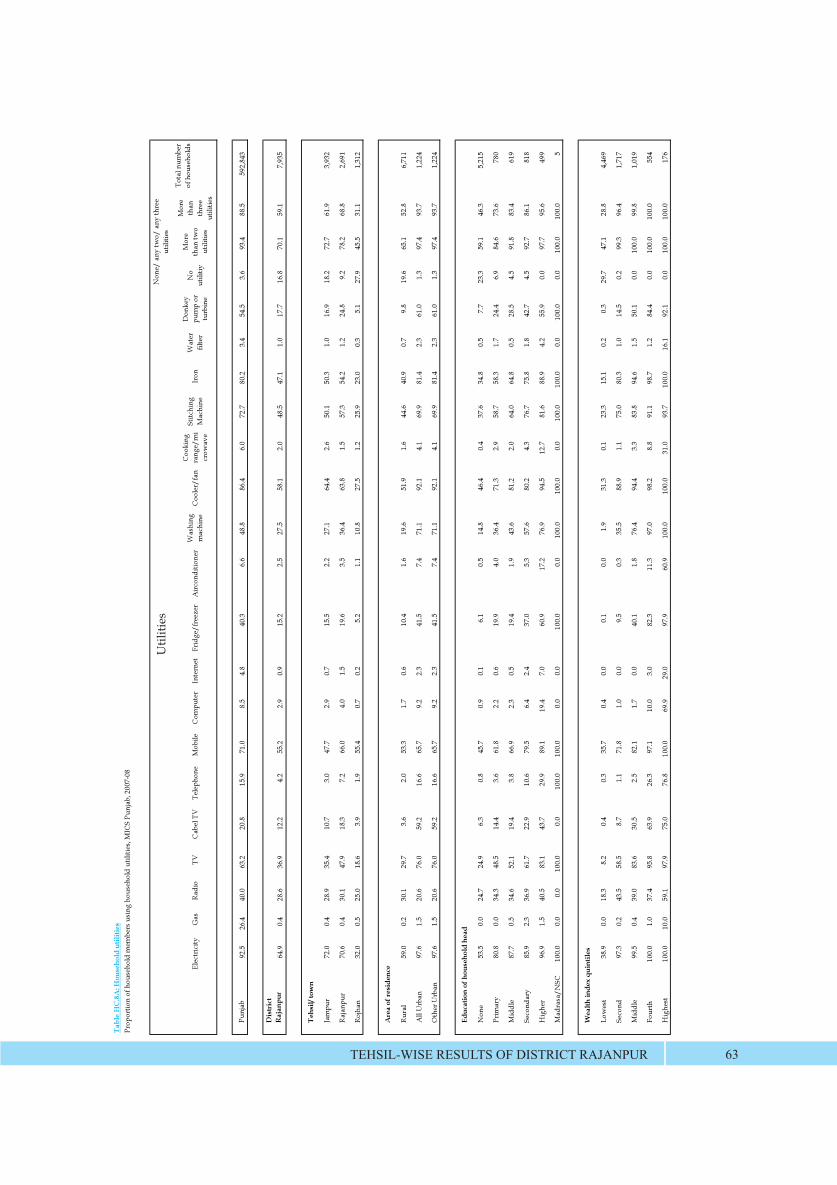
Tab
le H
C.8
A: H
ouse
hold
util
ities
Elec
tric
ityG
asR
adio
TVC
abel
TV
Tele
phon
eM
obile
Com
pute
rIn
tern
etFr
idge
/fre
ezer
Air
cond
ition
erW
ashi
ng
mac
hine
Coo
ler/
fan
Coo
king
ra
nge/
mi
crow
ave
Stitc
hing
M
achi
neIr
onW
ater
fil
ter
Don
key
pum
p or
tu
rbin
e
No
utili
tiy
Mor
e th
an tw
o ut
ilitie
s
Mor
e th
an
thre
e ut
ilitie
s
Punj
ab92
.526
.440
.063
.220
.815
.971
.08.
54.
840
.36.
648
.886
.46.
072
.780
.23.
454
.53.
693
.488
.559
2,84
3
Dis
tric
t R
ajan
pur
64.9
0.4
28.6
36.9
12.2
4.2
55.2
2.9
0.9
15.2
2.5
27.5
58.1
2.0
48.5
47.1
1.0
17.7
16.8
70.1
59.1
7,93
5
Teh
sil/
tow
n
Jam
pur
72.0
0.4
28.9
35.4
10.7
3.0
47.7
2.9
0.7
15.5
2.2
27.1
64.4
2.6
50.1
50.3
1.0
16.9
18.2
72.7
61.9
3,93
2
Raj
anpu
r70
.60.
430
.147
.918
.37.
266
.04.
01.
519
.63.
536
.463
.81.
557
.354
.21.
224
.89.
278
.268
.82,
691
Roj
han
32.0
0.5
25.0
18.6
3.9
1.9
55.4
0.7
0.2
5.2
1.1
10.8
27.5
1.2
25.9
23.0
0.3
5.1
27.9
45.5
31.1
1,31
2
Are
a of
resi
denc
e
Rur
al59
.00.
230
.129
.73.
62.
053
.31.
70.
610
.41.
619
.651
.91.
644
.640
.90.
79.
819
.665
.152
.86,
711
All
Urb
an97
.61.
520
.676
.059
.216
.665
.79.
22.
341
.57.
471
.192
.14.
169
.981
.42.
361
.01.
397
.493
.71,
224
Oth
er U
rban
97.6
1.5
20.6
76.0
59.2
16.6
65.7
9.2
2.3
41.5
7.4
71.1
92.1
4.1
69.9
81.4
2.3
61.0
1.3
97.4
93.7
1,22
4
Educ
atio
n of
hou
seho
ld h
ead
Non
e53
.50.
024
.724
.96.
30.
845
.70.
90.
16.
10.
514
.846
.40.
437
.634
.80.
57.
723
.359
.146
.35,
215
Prim
ary
80.8
0.0
34.3
48.5
14.4
3.6
61.8
2.2
0.6
19.9
4.0
36.4
71.3
2.9
58.7
58.3
1.7
24.4
6.9
84.6
73.6
780
Mid
dle
87.7
0.5
34.6
52.1
19.4
3.8
66.9
2.3
0.5
19.4
1.9
43.6
81.2
2.0
64.0
64.8
0.5
28.5
4.5
91.8
83.4
619
Seco
ndar
y85
.92.
336
.961
.722
.910
.679
.56.
42.
437
.05.
357
.680
.24.
376
.775
.81.
842
.74.
592
.786
.181
8
Hig
her
96.9
1.5
40.5
83.1
43.7
29.9
89.1
19.4
7.0
60.9
17.2
76.9
94.5
12.7
81.6
88.9
4.2
55.9
0.0
97.7
95.6
499
Mad
rasa
/NSC
100.
00.
00.
010
0.0
0.0
100.
010
0.0
0.0
0.0
100.
00.
010
0.0
100.
00.
010
0.0
100.
00.
010
0.0
0.0
100.
010
0.0
5
Wea
lth in
dex
quin
tiles
Low
est
38.9
0.0
18.3
8.2
0.4
0.3
35.7
0.4
0.0
0.1
0.0
1.9
31.3
0.1
23.3
15.1
0.2
0.3
29.7
47.1
28.8
4,46
9
Seco
nd97
.30.
243
.558
.58.
71.
171
.81.
00.
09.
50.
335
.588
.91.
175
.080
.31.
014
.50.
299
.396
.41,
717
Mid
dle
99.5
0.4
39.0
83.6
30.5
2.5
82.1
1.7
0.0
40.1
1.8
76.4
94.4
3.3
83.8
94.6
1.5
50.1
0.0
100.
099
.81,
019
Four
th10
0.0
1.0
37.4
95.8
63.9
26.3
97.1
10.0
3.0
82.3
11.3
97.0
98.2
8.8
91.1
98.7
1.2
84.4
0.0
100.
010
0.0
554
Hig
hest
100.
010
.059
.197
.975
.076
.810
0.0
69.9
29.0
97.9
60.9
100.
010
0.0
31.0
93.7
100.
016
.192
.10.
010
0.0
100.
017
6
Prop
ortio
n of
hou
seho
ld m
embe
rs u
sing
hou
seho
ld u
tiliti
es, M
ICS
Punj
ab, 2
007-
08
Poss
essi
ons
Non
e/ a
ny tw
o/ a
ny th
ree
utili
ties
Tota
l num
ber
of h
ouse
hold
s
TEHSIL-WISE RESULTS OF DISTRICT RAJANPUR 63
Util
ities
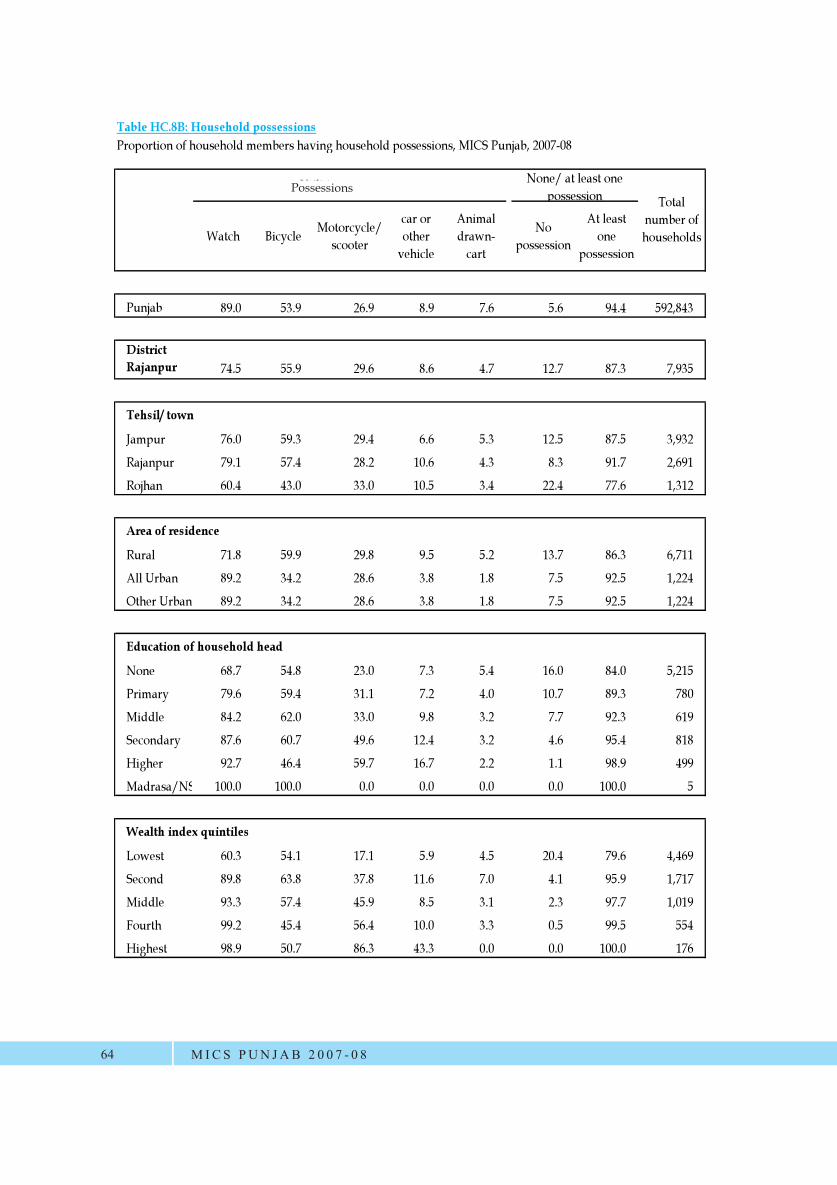
Table HC.8B: Household possessions
Watch Bicycle Motorcycle/scooter
car or other
vehicle
Animal drawn-
cart
No possession
At least one
possession
Punjab 89.0 53.9 26.9 8.9 7.6 5.6 94.4 592,843
District Rajanpur 74.5 55.9 29.6 8.6 4.7 12.7 87.3 7,935
Tehsil/ town
Jampur 76.0 59.3 29.4 6.6 5.3 12.5 87.5 3,932
Rajanpur 79.1 57.4 28.2 10.6 4.3 8.3 91.7 2,691
Rojhan 60.4 43.0 33.0 10.5 3.4 22.4 77.6 1,312
Area of residence
Rural 71.8 59.9 29.8 9.5 5.2 13.7 86.3 6,711
All Urban 89.2 34.2 28.6 3.8 1.8 7.5 92.5 1,224
Other Urban 89.2 34.2 28.6 3.8 1.8 7.5 92.5 1,224
Education of household head
None 68.7 54.8 23.0 7.3 5.4 16.0 84.0 5,215
Primary 79.6 59.4 31.1 7.2 4.0 10.7 89.3 780
Middle 84.2 62.0 33.0 9.8 3.2 7.7 92.3 619
Secondary 87.6 60.7 49.6 12.4 3.2 4.6 95.4 818
Higher 92.7 46.4 59.7 16.7 2.2 1.1 98.9 499
Madrasa/NS 100.0 100.0 0.0 0.0 0.0 0.0 100.0 5
Wealth index quintiles
Lowest 60.3 54.1 17.1 5.9 4.5 20.4 79.6 4,469
Second 89.8 63.8 37.8 11.6 7.0 4.1 95.9 1,717
Middle 93.3 57.4 45.9 8.5 3.1 2.3 97.7 1,019
Fourth 99.2 45.4 56.4 10.0 3.3 0.5 99.5 554
Highest 98.9 50.7 86.3 43.3 0.0 0.0 100.0 176
UtilitiesTotal
number of households
None/ at least one possession
Proportion of household members having household possessions, MICS Punjab, 2007-08
MICS PUN JAB 2 0 0 7 - 0 864
Possessions
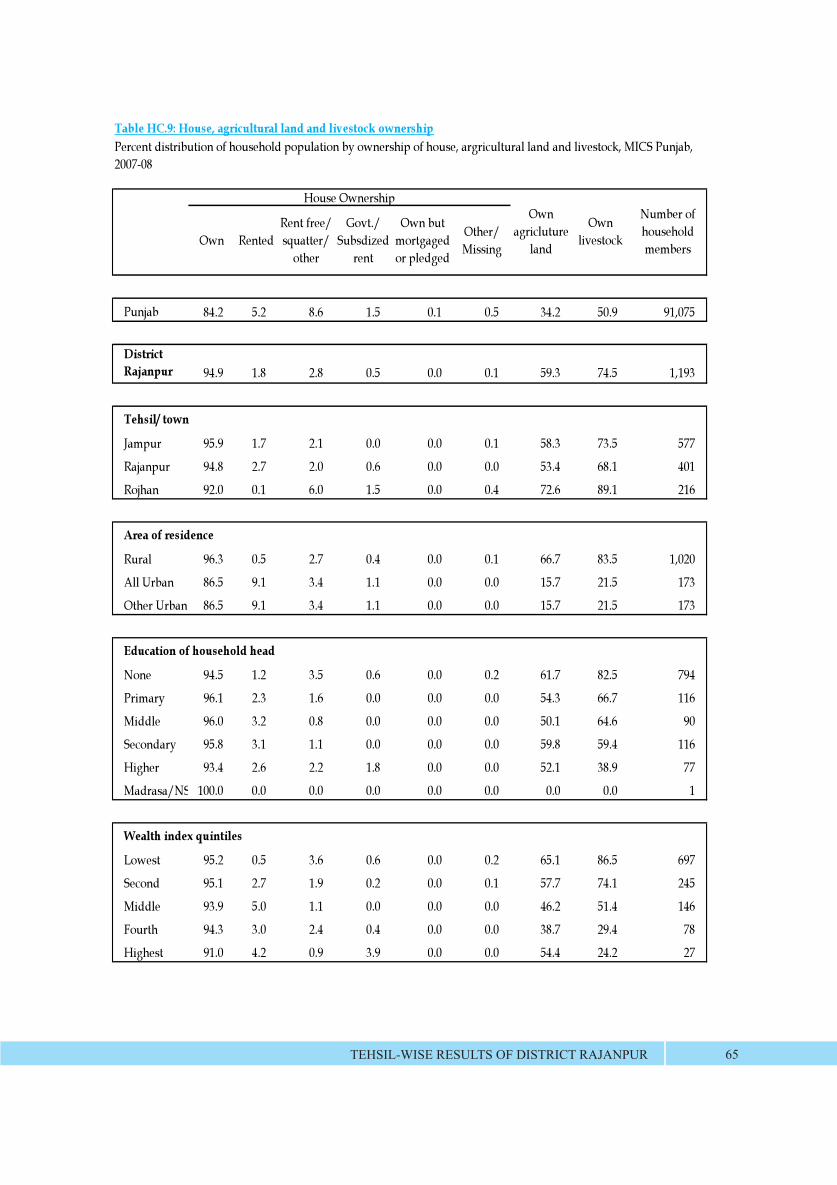
Table HC.9: House, agricultural land and livestock ownership
Own RentedRent free/ squatter/
other
Govt./ Subsdized
rent
Own but mortgaged or pledged
Other/ Missing
Punjab 84.2 5.2 8.6 1.5 0.1 0.5 34.2 50.9 91,075
District Rajanpur 94.9 1.8 2.8 0.5 0.0 0.1 59.3 74.5 1,193
Tehsil/ town
Jampur 95.9 1.7 2.1 0.0 0.0 0.1 58.3 73.5 577
Rajanpur 94.8 2.7 2.0 0.6 0.0 0.0 53.4 68.1 401
Rojhan 92.0 0.1 6.0 1.5 0.0 0.4 72.6 89.1 216
Area of residence
Rural 96.3 0.5 2.7 0.4 0.0 0.1 66.7 83.5 1,020
All Urban 86.5 9.1 3.4 1.1 0.0 0.0 15.7 21.5 173
Other Urban 86.5 9.1 3.4 1.1 0.0 0.0 15.7 21.5 173
Education of household head
None 94.5 1.2 3.5 0.6 0.0 0.2 61.7 82.5 794
Primary 96.1 2.3 1.6 0.0 0.0 0.0 54.3 66.7 116
Middle 96.0 3.2 0.8 0.0 0.0 0.0 50.1 64.6 90
Secondary 95.8 3.1 1.1 0.0 0.0 0.0 59.8 59.4 116
Higher 93.4 2.6 2.2 1.8 0.0 0.0 52.1 38.9 77
Madrasa/NS 100.0 0.0 0.0 0.0 0.0 0.0 0.0 0.0 1
Wealth index quintiles
Lowest 95.2 0.5 3.6 0.6 0.0 0.2 65.1 86.5 697
Second 95.1 2.7 1.9 0.2 0.0 0.1 57.7 74.1 245
Middle 93.9 5.0 1.1 0.0 0.0 0.0 46.2 51.4 146
Fourth 94.3 3.0 2.4 0.4 0.0 0.0 38.7 29.4 78
Highest 91.0 4.2 0.9 3.9 0.0 0.0 54.4 24.2 27
Percent distribution of household population by ownership of house, argricultural land and livestock, MICS Punjab, 2007-08
House OwnershipOwn
agricluture land
Own livestock
Number of household members
TEHSIL-WISE RESULTS OF DISTRICT RAJANPUR 65
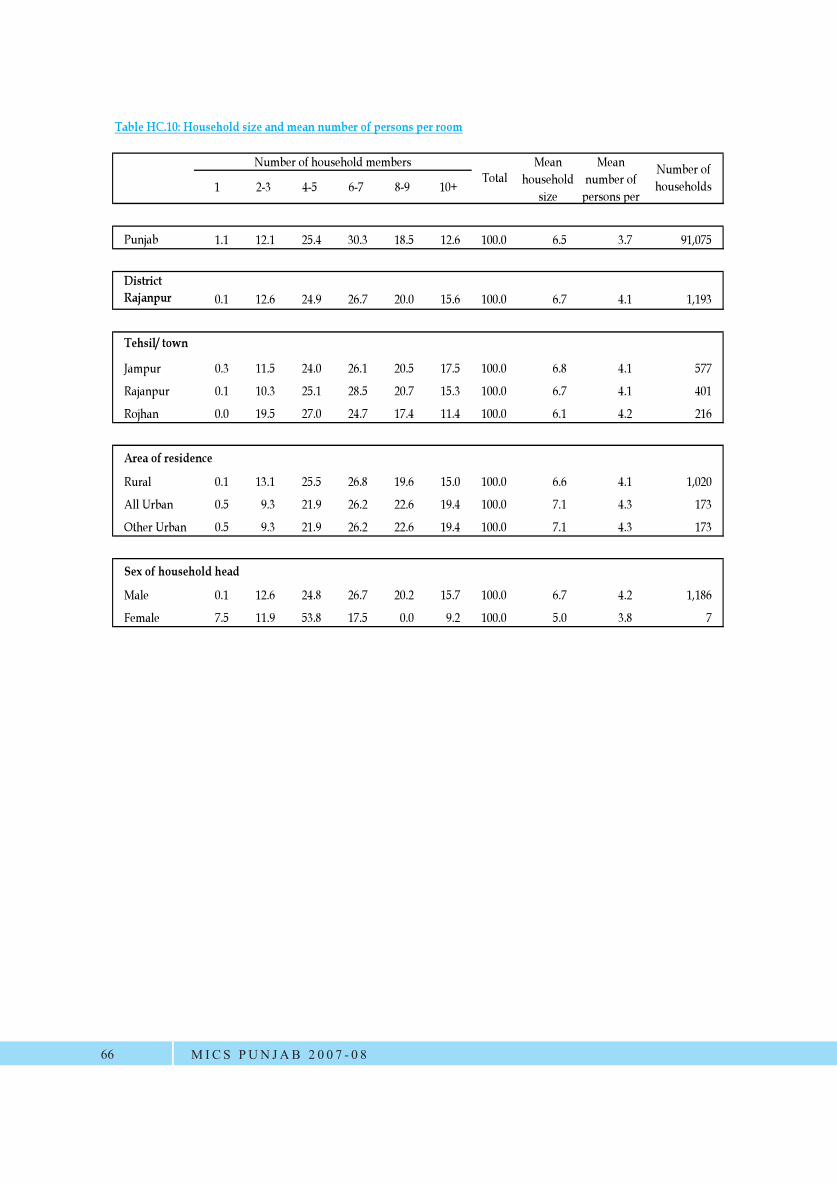
Table HC.10: Household size and mean number of persons per room
1 2-3 4-5 6-7 8-9 10+
Punjab 1.1 12.1 25.4 30.3 18.5 12.6 100.0 6.5 3.7 91,075
District Rajanpur 0.1 12.6 24.9 26.7 20.0 15.6 100.0 6.7 4.1 1,193
Tehsil/ town
Jampur 0.3 11.5 24.0 26.1 20.5 17.5 100.0 6.8 4.1 577
Rajanpur 0.1 10.3 25.1 28.5 20.7 15.3 100.0 6.7 4.1 401
Rojhan 0.0 19.5 27.0 24.7 17.4 11.4 100.0 6.1 4.2 216
Area of residence
Rural 0.1 13.1 25.5 26.8 19.6 15.0 100.0 6.6 4.1 1,020
All Urban 0.5 9.3 21.9 26.2 22.6 19.4 100.0 7.1 4.3 173
Other Urban 0.5 9.3 21.9 26.2 22.6 19.4 100.0 7.1 4.3 173
Sex of household head
Male 0.1 12.6 24.8 26.7 20.2 15.7 100.0 6.7 4.2 1,186
Female 7.5 11.9 53.8 17.5 0.0 9.2 100.0 5.0 3.8 7
Number of household membersTotal
Mean household
size
Number of households
Mean number of
persons per
MICS PUN JAB 2 0 0 7 - 0 866
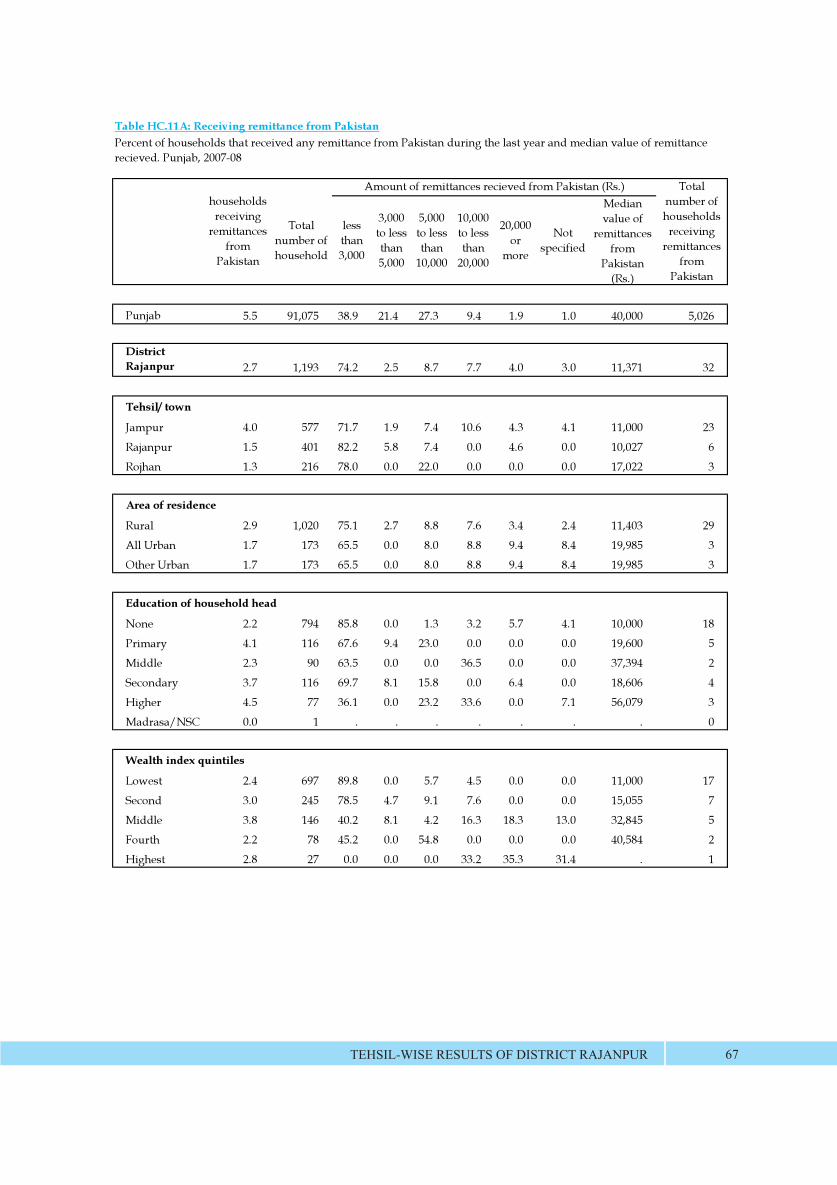
Total number of household
less than 3,000
3,000 to less than 5,000
5,000 to less than
10,000
10,000 to less than
20,000
20,000 or
more
Not specified
Median value of
remittances from
Pakistan (Rs.)
Punjab 5.5 91,075 38.9 21.4 27.3 9.4 1.9 1.0 40,000 5,026
District Rajanpur 2.7 1,193 74.2 2.5 8.7 7.7 4.0 3.0 11,371 32
Tehsil/ town
Jampur 4.0 577 71.7 1.9 7.4 10.6 4.3 4.1 11,000 23
Rajanpur 1.5 401 82.2 5.8 7.4 0.0 4.6 0.0 10,027 6
Rojhan 1.3 216 78.0 0.0 22.0 0.0 0.0 0.0 17,022 3
Area of residence
Rural 2.9 1,020 75.1 2.7 8.8 7.6 3.4 2.4 11,403 29
All Urban 1.7 173 65.5 0.0 8.0 8.8 9.4 8.4 19,985 3
Other Urban 1.7 173 65.5 0.0 8.0 8.8 9.4 8.4 19,985 3
Education of household head
None 2.2 794 85.8 0.0 1.3 3.2 5.7 4.1 10,000 18
Primary 4.1 116 67.6 9.4 23.0 0.0 0.0 0.0 19,600 5
Middle 2.3 90 63.5 0.0 0.0 36.5 0.0 0.0 37,394 2
Secondary 3.7 116 69.7 8.1 15.8 0.0 6.4 0.0 18,606 4
Higher 4.5 77 36.1 0.0 23.2 33.6 0.0 7.1 56,079 3
Madrasa/NSC 0.0 1 . . . . . . . 0
Wealth index quintiles
Lowest 2.4 697 89.8 0.0 5.7 4.5 0.0 0.0 11,000 17
Second 3.0 245 78.5 4.7 9.1 7.6 0.0 0.0 15,055 7
Middle 3.8 146 40.2 8.1 4.2 16.3 18.3 13.0 32,845 5
Fourth 2.2 78 45.2 0.0 54.8 0.0 0.0 0.0 40,584 2
Highest 2.8 27 0.0 0.0 0.0 33.2 35.3 31.4 . 1
Table HC.11A: Receiving remittance from Pakistan
households receiving
remittances from
Pakistan
Total number of households
receiving remittances
from Pakistan
Amount of remittances recieved from Pakistan (Rs.)
Percent of households that received any remittance from Pakistan during the last year and median value of remittance recieved. Punjab, 2007-08
TEHSIL-WISE RESULTS OF DISTRICT RAJANPUR 67
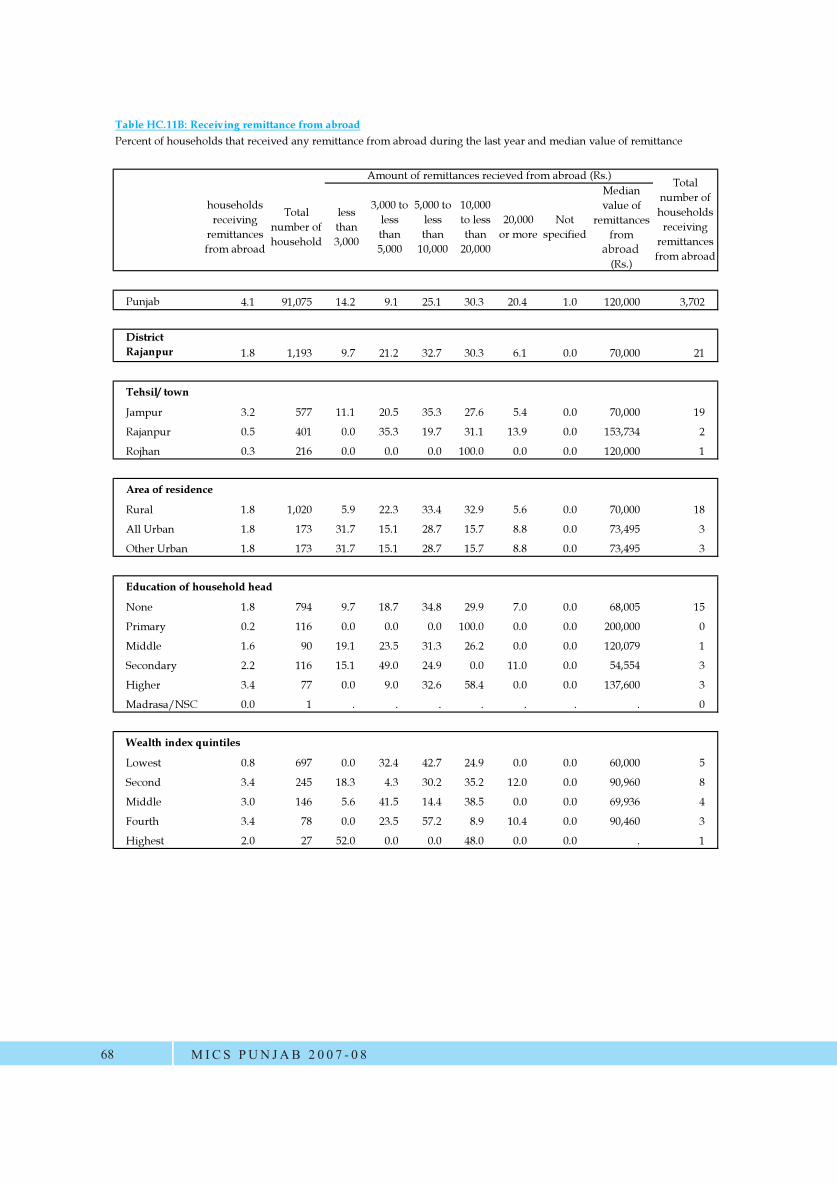
households receiving
remittances from abroad
Total number of household
less than 3,000
3,000 to less than 5,000
5,000 to less than
10,000
10,000 to less than
20,000
20,000 or more
Not specified
Median value of
remittances from
Pakistan (Rs.)
Punjab 4.1 91,075 14.2 9.1 25.1 30.3 20.4 1.0 120,000 3,702
District Rajanpur 1.8 1,193 9.7 21.2 32.7 30.3 6.1 0.0 70,000 21
Tehsil/ town
Jampur 3.2 577 11.1 20.5 35.3 27.6 5.4 0.0 70,000 19
Rajanpur 0.5 401 0.0 35.3 19.7 31.1 13.9 0.0 153,734 2
Rojhan 0.3 216 0.0 0.0 0.0 100.0 0.0 0.0 120,000 1
Area of residence
Rural 1.8 1,020 5.9 22.3 33.4 32.9 5.6 0.0 70,000 18
All Urban 1.8 173 31.7 15.1 28.7 15.7 8.8 0.0 73,495 3
Other Urban 1.8 173 31.7 15.1 28.7 15.7 8.8 0.0 73,495 3
Education of household head
None 1.8 794 9.7 18.7 34.8 29.9 7.0 0.0 68,005 15
Primary 0.2 116 0.0 0.0 0.0 100.0 0.0 0.0 200,000 0
Middle 1.6 90 19.1 23.5 31.3 26.2 0.0 0.0 120,079 1
Secondary 2.2 116 15.1 49.0 24.9 0.0 11.0 0.0 54,554 3
Higher 3.4 77 0.0 9.0 32.6 58.4 0.0 0.0 137,600 3
Madrasa/NSC 0.0 1 . . . . . . . 0
Wealth index quintiles
Lowest 0.8 697 0.0 32.4 42.7 24.9 0.0 0.0 60,000 5
Second 3.4 245 18.3 4.3 30.2 35.2 12.0 0.0 90,960 8
Middle 3.0 146 5.6 41.5 14.4 38.5 0.0 0.0 69,936 4
Fourth 3.4 78 0.0 23.5 57.2 8.9 10.4 0.0 90,460 3
Highest 2.0 27 52.0 0.0 0.0 48.0 0.0 0.0 . 1
Table HC.11B: Receiving remittance from abroadPercent of households that received any remittance from abroad during the last year and median value of remittance
Amount of remittances recieved from abroad (Rs.) Total number of households receiving
remittances from abroad
MICS PUN JAB 2 0 0 7 - 0 868
abroad
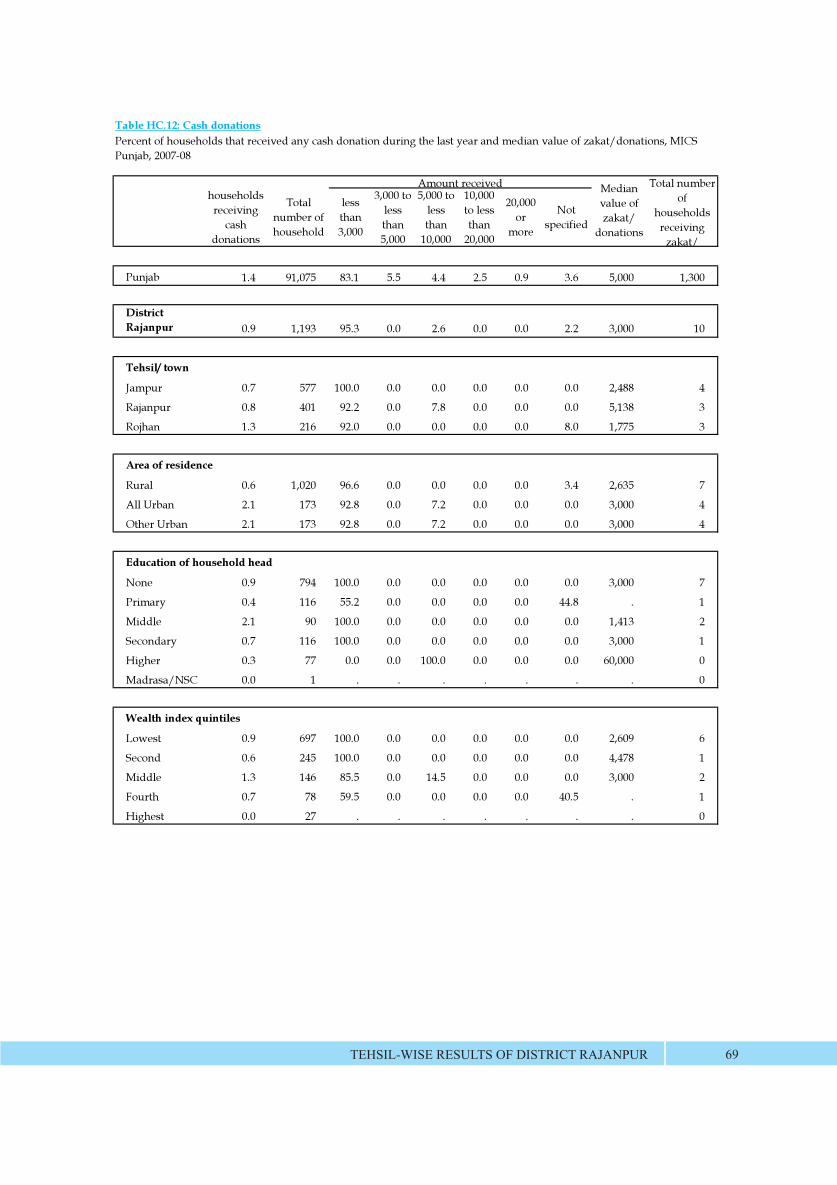
Table HC.12: Cash donations
households receiving
cash donations
Total number of household
less than 3,000
3,000 to less than 5,000
5,000 to less than
10,000
10,000 to less than
20,000
20,000 or
more
Not specified
Punjab 1.4 91,075 83.1 5.5 4.4 2.5 0.9 3.6 5,000 1,300
District Rajanpur 0.9 1,193 95.3 0.0 2.6 0.0 0.0 2.2 3,000 10
Tehsil/ town
Jampur 0.7 577 100.0 0.0 0.0 0.0 0.0 0.0 2,488 4
Rajanpur 0.8 401 92.2 0.0 7.8 0.0 0.0 0.0 5,138 3
Rojhan 1.3 216 92.0 0.0 0.0 0.0 0.0 8.0 1,775 3
Area of residence
Rural 0.6 1,020 96.6 0.0 0.0 0.0 0.0 3.4 2,635 7
All Urban 2.1 173 92.8 0.0 7.2 0.0 0.0 0.0 3,000 4
Other Urban 2.1 173 92.8 0.0 7.2 0.0 0.0 0.0 3,000 4
Education of household head
None 0.9 794 100.0 0.0 0.0 0.0 0.0 0.0 3,000 7
Primary 0.4 116 55.2 0.0 0.0 0.0 0.0 44.8 . 1
Middle 2.1 90 100.0 0.0 0.0 0.0 0.0 0.0 1,413 2
Secondary 0.7 116 100.0 0.0 0.0 0.0 0.0 0.0 3,000 1
Higher 0.3 77 0.0 0.0 100.0 0.0 0.0 0.0 60,000 0
Madrasa/NSC 0.0 1 . . . . . . . 0
Wealth index quintiles
Lowest 0.9 697 100.0 0.0 0.0 0.0 0.0 0.0 2,609 6
Second 0.6 245 100.0 0.0 0.0 0.0 0.0 0.0 4,478 1
Middle 1.3 146 85.5 0.0 14.5 0.0 0.0 0.0 3,000 2
Fourth 0.7 78 59.5 0.0 0.0 0.0 0.0 40.5 . 1
Highest 0.0 27 . . . . . . . 0
Amount received
Percent of households that received any cash donation during the last year and median value of zakat/donations, MICS Punjab, 2007-08
Median value of zakat/
donations
Total number of
households receiving
zakat/
TEHSIL-WISE RESULTS OF DISTRICT RAJANPUR 69

Govt EOBI Other Missing
Punjab 6.2 91,075 91.8 1.8 0.6 5.9 5,678
District Rajanpur 0.7 1,193 92.2 - - 7.8 8
Tehsil/ town
Jampur 0.6 577 81.2 - - 18.8 3
Rajanpur 1.1 401 100.0 - - 0.0 4
Rojhan 0.1 216 100.0 - - 0.0 0
Area of residence
Rural 0.3 1,020 79.1 - - 20.9 3
All Urban 2.9 173 100.0 - - 0.0 5
Other Urban 2.9 173 100.0 - - 0.0 5
Education of household head
None 0.2 794 100.0 - - 0.0 2
Primary 0.0 116 0.0 - - 0.0 0
Middle 0.3 90 100.0 - - 0.0 0
Secondary 3.0 116 81.9 - - 18.1 3
Higher 3.2 77 100.0 - - 0.0 2
Madrasa/NSC 0.0 1 0.0 - - 0.0 0
Wealth index quintiles
Lowest 0.2 697 100.0 - - 0.0 1
Second 0.3 245 100.0 - - 0.0 1
Middle 1.2 146 62.8 - - 37.2 2
Fourth 3.5 78 100.0 - - 0.0 3
Highest 5.2 27 100.0 - - 0.0 1
Table HC.13: Pension BenefitsPercentage of households recieving pension by source, MICS Punjab, 2007-08
Receiving pension
Total number of households
Source of pension Number of households
recieving pension
MICS PUN JAB 2 0 0 7 - 0 870
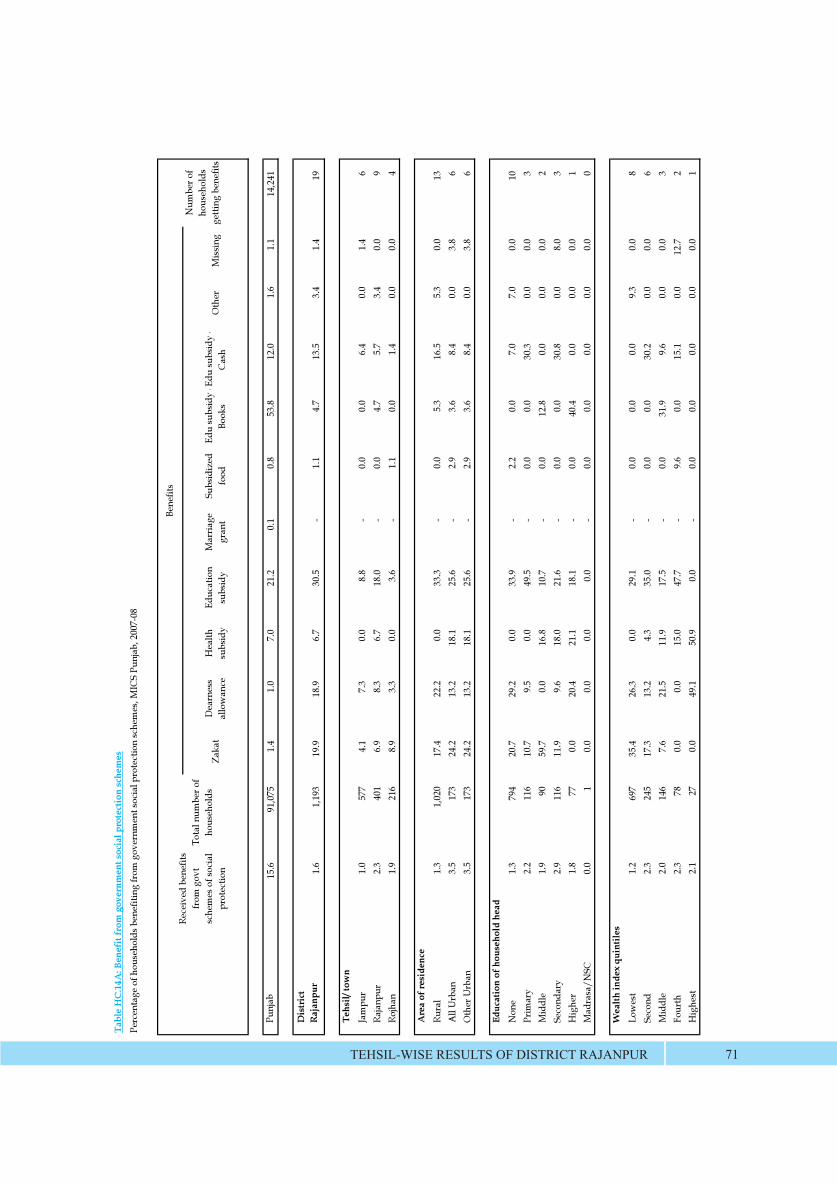
Zaka
tD
earn
ess
allo
wan
ceH
ealth
su
bsid
yEd
ucat
ion
subs
idy
Mar
riage
gr
ant
Subs
idiz
ed
food
Edu
subs
idy
-Bo
oks
Edu
subs
idy
-C
ash
Oth
erM
issi
ng
Punj
ab15
.691
,075
1.4
1.0
7.0
21.2
0.1
0.8
53.8
12.0
1.6
1.1
14,2
41
Dis
tric
t R
ajan
pur
1.6
1,19
319
.918
.96.
730
.5-
1.1
4.7
13.5
3.4
1.4
19
Tehs
il/ to
wn
Jam
pur
1.0
577
4.1
7.3
0.0
8.8
-0.
00.
06.
40.
01.
46
Raja
npur
2.3
401
6.9
8.3
6.7
18.0
-0.
04.
75.
73.
40.
09
Rojh
an1.
921
68.
93.
30.
03.
6-
1.1
0.0
1.4
0.0
0.0
4
Are
a of
resi
denc
e
Rura
l1.
31,
020
17.4
22.2
0.0
33.3
-0.
05.
316
.55.
30.
013
All
Urb
an3.
517
324
.213
.218
.125
.6-
2.9
3.6
8.4
0.0
3.8
6O
ther
Urb
an3.
517
324
.213
.218
.125
.6-
2.9
3.6
8.4
0.0
3.8
6
Educ
atio
n of
hou
seho
ld h
ead
Non
e1.
379
420
.729
.20.
033
.9-
2.2
0.0
7.0
7.0
0.0
10Pr
imar
y2.
211
610
.79.
50.
049
.5-
0.0
0.0
30.3
0.0
0.0
3M
iddl
e1.
990
59.7
0.0
16.8
10.7
-0.
012
.80.
00.
00.
02
Seco
ndar
y2.
911
611
.99.
618
.021
.6-
0.0
0.0
30.8
0.0
8.0
3H
ighe
r1.
877
0.0
20.4
21.1
18.1
-0.
040
.40.
00.
00.
01
Mad
rasa
/NSC
0.0
10.
00.
00.
00.
0-
0.0
0.0
0.0
0.0
0.0
0
Wea
lth in
dex
quin
tiles
Low
est
1.2
697
35.4
26.3
0.0
29.1
-0.
00.
00.
09.
30.
08
Seco
nd2.
324
517
.313
.24.
335
.0-
0.0
0.0
30.2
0.0
0.0
6M
iddl
e2.
014
67.
621
.511
.917
.5-
0.0
31.9
9.6
0.0
0.0
3Fo
urth
2.3
780.
00.
015
.047
.7-
9.6
0.0
15.1
0.0
12.7
2H
ighe
st2.
127
0.0
49.1
50.9
0.0
-0.
00.
00.
00.
00.
01
Tabl
e H
C.1
4A: B
enef
it fr
om g
over
nmen
t soc
ial p
rote
ctio
n sc
hem
esPe
rcen
tage
of h
ouse
hold
s ben
efiti
ng fr
om g
over
nmen
t soc
ial p
rote
ctio
n sc
hem
es, M
ICS
Punj
ab, 2
007-
08
Num
ber o
f ho
useh
olds
ge
tting
ben
efits
Rece
ived
ben
efits
fr
om g
ovt
sche
mes
of s
ocia
l pr
otec
tion
Tota
l num
ber o
f ho
useh
olds
Bene
fits
TEHSIL-WISE RESULTS OF DISTRICT RAJANPUR 71
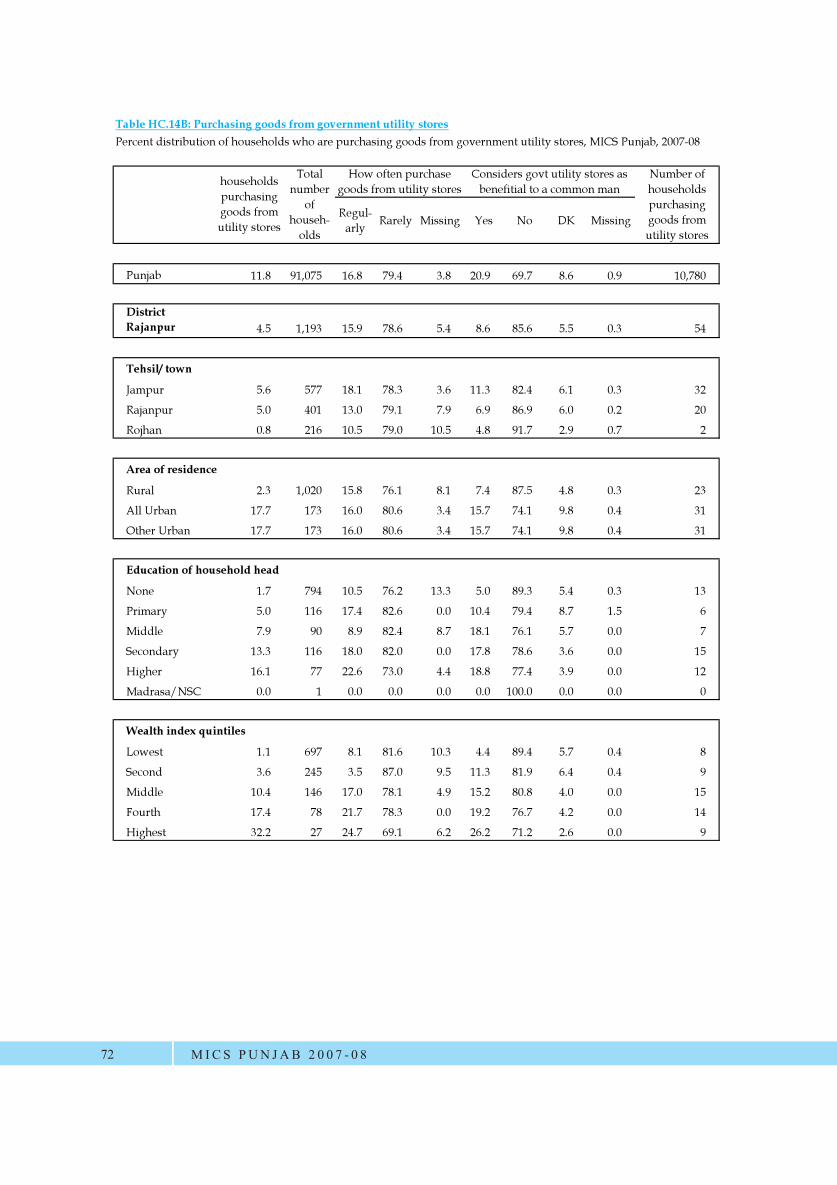
Regul-arly Rarely Missing Yes No DK Missing
Punjab 11.8 91,075 16.8 79.4 3.8 20.9 69.7 8.6 0.9 10,780
District Rajanpur 4.5 1,193 15.9 78.6 5.4 8.6 85.6 5.5 0.3 54
Tehsil/ town
Jampur 5.6 577 18.1 78.3 3.6 11.3 82.4 6.1 0.3 32
Rajanpur 5.0 401 13.0 79.1 7.9 6.9 86.9 6.0 0.2 20
Rojhan 0.8 216 10.5 79.0 10.5 4.8 91.7 2.9 0.7 2
Area of residence
Rural 2.3 1,020 15.8 76.1 8.1 7.4 87.5 4.8 0.3 23
All Urban 17.7 173 16.0 80.6 3.4 15.7 74.1 9.8 0.4 31
Other Urban 17.7 173 16.0 80.6 3.4 15.7 74.1 9.8 0.4 31
Education of household head
None 1.7 794 10.5 76.2 13.3 5.0 89.3 5.4 0.3 13
Primary 5.0 116 17.4 82.6 0.0 10.4 79.4 8.7 1.5 6
Middle 7.9 90 8.9 82.4 8.7 18.1 76.1 5.7 0.0 7
Secondary 13.3 116 18.0 82.0 0.0 17.8 78.6 3.6 0.0 15
Higher 16.1 77 22.6 73.0 4.4 18.8 77.4 3.9 0.0 12
Madrasa/NSC 0.0 1 0.0 0.0 0.0 0.0 100.0 0.0 0.0 0
Wealth index quintiles
Lowest 1.1 697 8.1 81.6 10.3 4.4 89.4 5.7 0.4 8
Second 3.6 245 3.5 87.0 9.5 11.3 81.9 6.4 0.4 9
Middle 10.4 146 17.0 78.1 4.9 15.2 80.8 4.0 0.0 15
Fourth 17.4 78 21.7 78.3 0.0 19.2 76.7 4.2 0.0 14
Highest 32.2 27 24.7 69.1 6.2 26.2 71.2 2.6 0.0 9
Number of households purchasing goods from utility stores
Table HC.14B: Purchasing goods from government utility storesPercent distribution of households who are purchasing goods from government utility stores, MICS Punjab, 2007-08
households purchasing goods from utility stores
How often purchase goods from utility stores
Total number
of househ-
olds
Considers govt utility stores as benefitial to a common man
MICS PUN JAB 2 0 0 7 - 0 872