Embed Size (px)
Citation preview

In this Issue
Official journal of The American Institute of Chemists, Inc.
http://www.theaic.org/pub_thechemist_journals/
Structural and Optical Properties of Zinc Oxide Nanorods Prepared by Aqueous Solution Route
Vibrational Spectroscopic and Molecular Docking Studies of 2,6-Dichlorobenzyl Alcohol
Electro Analytical Studies on the Interaction and Corrosion Inhibition of a Triazine Dimer (AMTDT) on Metallic Copper in Hydrochloric Acid
Thermal and Electrical Properties of Polyindole/Magnetite Nanocomposites
Note: Research Lab.This work has been released into the public domain by author Abdulmirza. The file was taken from Wikimedia Commons from the following location:https://commons.wikimedia.org/wiki/File:AFC_Lab.jpg
The ChemistJournal of the American Institute of Chemists
Volume 89 Number 1 April 2016Established in 1923 ISSN 1945-0702

The Chemist Established in 1923, The Chemist is the official publication of The American Institute of Chemists, Inc. (AIC). The Chemist was published quarterly in magazine format until 2006. The Chemist is currently being set up and formatted as an online journal.
Editor-in-Chief David Devraj Kumar Florida Atlantic University, USA
Editorial AssistantsChelsea Dittrich Florida Atlantic University, USA
Deborah Cate The American Institute of Chemists, USA
Art & Web Direction Alberto Fernández Florida Atlantic University, USA
Editorial Review Board John E. E. Baglin, ........................................................................................................................................................................... IBM Almaden Research Center, USA Rodney Bennett, .............................................................................................................................................................................................................................. JRF America, USA Donna Chamley-Wiik, .............................................................................................................................................................................. Florida Atlantic University, USA Bethany Davis, ............................................................................................................................................................ The Commonwealth Medical College, USA Jerry Ray Dias, ............................................................................................................................................................................. University of Missouri-Kansas City, USA J. Stephen Duerr, ............................................................................................................................................................................................ Chemlabconsulting, LLC, USA Lawrence Duffy, ................................................................................................................................................................................. University of Alaska Fairbanks, USA Nwadiuto Esiobu, .......................................................................................................................................................................................... Florida Atlantic University, USA Penelope Fritzer, ............................................................................................................................................................................................. Florida Atlantic University, USA Peter D. Frade, ...................................................................................................................................................................................................... Wayne State University, USA Abraham George, ................................................................................................................................................................................................. Mar Ivanios College, India David Gossman,........................................................................................................................................................................................... Gossman Consulting, Inc., USA Margaret Hall, ................................................................................................................................................................................ University of Southern Mississippi, USA Karickal. R. Haridas, ........................................................................................................................................................................................................ Kannur University, India John Hill, ...................................................................................................................................................................................................................... La Trobe University, Australia Jerry P. Jasinski, .......................................................................................................................................................................................................... Keene State College, USA Edward J. Kikta, Jr., .......................................................................................................................................................................................................... FMC Corporation, USA David Devraj Kumar, ................................................................................................................................................................................. Florida Atlantic University, USA Gopendra Kumar, .............................................................................................................................................................................. University of Botswana, Botswana James Kumi-Diaka, ...................................................................................................................................................................................... Florida Atlantic University, USA Gary R. List, .............................................................................................................................................................................................. US Department of Agriculture, USA Bushan Mandava, ...................................................................................................................................................................................... Mandava Associate, LLC, USA David M. Manuta, ............................................................................................................................................................. Manuta Chemical Consulting, Inc., USA Dayal T. Meshri, .................................................................................................................................................................. Advance Research Chemicals, Inc., USA E. Gerald Meyer, .................................................................................................................................................................................................... University of Wyoming, USA Robert F. Moran, ................................................................................................................................................................... Wentworth Institute of Technology, USA Wayne A. Morris, .................................................................................................................................................................................... Morris-Kopec Forensics, Inc., USA Ronald Persin, ................................................................................................................................................................................................................................................... Lnk2Lrn, USA Gary F. Porter, .......................................................................................................................................................................................... Bergan Community College, USA Manit Rappon, ................................................................................................................................................................................................. Lakehead University, Canada James A. Roe, ........................................................................................................................................................................................ Loyola Marymount University, USA Sarah Reisert, ........................................................................................................................................................................ The Chemical Heritage Foundation, USA James S. Smith, ..................................................................................................................................................................................................................................... Trillium, Inc., USA Joy E. Stewart,........................................................................................................................................................................................................................ Broward College, USA Saligrama Subbarao, ...................................................................................................................................................................................................... Lincoln University, USA P. V. Thomas, ................................................................................................................................................................................................................ Mar Ivanios College, India Ranjit K. Verma, ............................................................................................................................................................................................................ Magadh University, India Rock J. Vitale, ..................................................................................................................................................................................... Environmental Standards, Inc., USA Kurt Winkelman, ................................................................................................................................................................................................................................. Florida Tech, USA
The American Institute of Chemists, Inc. does not necessarily endorse any of the facts or opinions expressed in the articles, book reviews, or advertisements appearing in The Chemist. Subscription: $35 per year to members, $100 per year to non-members. Single copy: $50. The Chemist (ISSN-0009-3025) is published online by The American Institute of Chemists, Inc.

© The AIC 2016. All rights reserved. Volume 89 Number 1 | The Chemist | Page ii
Editorial: Research in Chemistry David Devraj Kumar ............................................................................................................................ iii
ARTICLES
Structural and Optical Properties of Zinc Oxide Nanorods Prepared by Aqueous Solution Route David Devraj Kumar, Prabitha B. Nair, Justinvictor V. B., P. V. Thomas ....................................... 1
Vibrational Spectroscopic and Molecular Docking Studies of 2,6-Dichlorobenzyl Alcohol Merrin Mary Abraham, Resmi K. S., Sheena Mary, C. YohannanPanicker, B. Harikumar ............. 6
Electro Analytical Studies on the Interaction and Corrosion Inhibition of a Triazine Dimer (AMTDT) on Metallic Copper in Hydrochloric Acid Shainy K. M. and Abraham Joseph ................................................................................................... 16
Thermal and Electrical Properties of Polyindole/Magnetite Nanocomposites Jayakrishnan P., P. P. Pradyumnan and M. T. Ramesan ................................................................. 27
PUBLIC UNDERSTANDING OF CHEMISTRY
Chemical Risk and the Public Perception Arnold J. Frankel .............................................................................................................................. 33
The AIC Code of Ethics............................................................................................................. 36
Manuscript Style Guide ............................................................................................................ 38
ANNOUNCEMENTS
Invitation to Authors ................................................................................................................ 43
The Chemist (Established in 1923) Copyright 2015. The American Institute of Chemists, Inc.
The Chemist Journal of the American Institute of Chemists
Volume 89 | Issue 1 | 2016

Volume 89 Number 1 | The Chemist | Page iii © The AIC 2016. All rights reserved.
Research contributions in chemistry are countless, ranging from theoretical studies to advanced applications integrated into other branches of the sciences. While there is a tendency to look for grants from government agencies, such as the National Science Foundation, to carry out large-scale studies, there are plenty of published studies which resulted from locally funded and/or non-funded research efforts of dedicated researchers. This issue of The Chemist presents four research articles and one non-research article. Two of the four research articles deal with nanomaterials. The study by Kumar, Nair, Justinvictor, and Thomas presents the structural and optical properties of ZnO nanorods prepared by an aqueous solution route. Abraham, Resmi, Mary, Panicker, and Harikumar describe vibrational spectroscopic and molecular docking studies of 2,6-dichlorobenzyl alcohol using Gaussian09. Shiney and Joseph report electroanalytical studies on the interaction and corrosion inhibition of a triazine dimer on metallic copper in hydrochloric acid. Jayakrishnan, Pradyumman, and Ramesan report on the research on the thermal and electrical properties of polyindole/magnetite nanocomposites at various concentrations of Fe3O4 nanoparticles. In the public understanding section, the reprinted article by Frankel deals with chemical risks and public perception of chemists. I would like to acknowledge the timely help of members of the Review Board who provide valuable feedback on manuscripts. All editorial costs, except the web design, are pro-bono. I would encourage authors who are not members of the American Institute of Chemists to consider joining the Institute as a gesture of support for The Chemist. Thank you.
Editorial Research in Chemistry David Devraj Kumar
Florida Atlantic University

© The AIC 2016. All rights reserved. Volume 89 Number 1 | The Chemist | Page 1
Structural and Optical Properties of Zinc Oxide Nanorods Prepared by Aqueous Solution Route David Devraj Kumara, Prabitha B. Nairb, Justinvictor V. B.b, P. V. Thomasb, * a STEM Education Lab, College of Education, Florida Atlantic University, 3200 College Ave, Davie, FL
33314, USA. b Thin Film Lab, Research Center, Department of Physics, Mar Ivanios College, Thiruvananthapuram-695015, India. (*Email: [email protected])
Abstract: Preparation of ZnO nanorods was successfully carried out by a simple cost-effective precipitation from an aqueous solution route at a low temperature (353K). Detailed structural and optical characterizations were performed using x-ray diffraction (XRD), scanning electron microscope (SEM), ultraviolet-visible (UV-Visible) spectrophotometry, and Photo Luminescence (PL) spectroscopy. Results revealed the formation of high quality ZnO nanorods in a wurtzite hexagonal crystal phase. The electronic energy state transition spectrum revealed an optical band gap of 3.37 eV. Measured PL intensities due to exciton emission and deep level emissions indicated the quality of the nanorods prepared by this method. PL spectra showed an intense blue emission by the ZnO rods, which increased with a rise in calcination temperature. Key Words: Zinc oxide, nanorods, band gap, photoluminescence.
INTRODUCTION
Zinc oxide is a II-VI semiconducting material having a wurtzite hexagonal structure with lattice parameters a=3.2501Å and c=5.2066 Å [1]. It is a unique material that possesses attractive electronic properties, such as wide band gap (3.37eV) and large exciton energy (60 meV) [2], in addition to semiconducting, piezoelectric and pyroelectric properties. The strong exciton binding energy indicates efficient exciton emission in the UV region. This property makes it a promising photonic material in the blue-UV region [3]. ZnO nanomaterials in the form of nanowires and nanorods are important due to their applications in tunable electronic and optoelectronic devices [4].
Several methods have been proposed for the preparation of ZnO nanorods, such as hydrothermal and thermal decomposition methods, sol gel synthesis, chemical vapor deposition, spray pyrolysis, and precipitation method [5-10]. Control of the particle shape is a major concern for nanostructured material synthesis because electrical and optical properties of nanomaterials depend sensitively on both size and shape of the particle.
Therefore, it is desirable to prepare nanomaterials of controllable shape and size by a simple approach. For zinc oxide particles, various shapes, including nanorods [7,11-14], whiskers [15,16], and nanowires [17], have been successfully prepared. A simple chemical route to the preparation of ZnO nanorods has been reported where thermal decomposition of ZnC2O4.2H2O resulted from the reaction of Zn(CH3COO)2.2H2O and H2C2O4.2H2O with surfactant phenyl ether and NaCl flux [14]. Hydrothermal preparations of ZnO nanorods from aqueous Zn(NO3)2 and KOH at 673 K with a simple apparatus and without organic feed reagents have yielded ZnO nanorods in average 230nm in length and 38nm in width [13]. But many of the synthesis methods reported require complex experimental conditions, substrates, and sophisticated instruments [7,18]. Also, most of the methods produce nanorods or tubes in small quantities at high cost. Therefore, a simple preparation route to ZnO nanorods is of great importance. See, for example, a template-free aqueous route to the preparation of ZnO nanorods that was reported showing useful optical properties by PL spectroscopy [19]. In the present work, a similarly simple
The Chemist Journal of the American Institute of Chemists

Volume 89 Number 1 | The Chemist | Page 2 © The Author 2016. All rights reserved.
aqueous solution route for the preparation of ZnO nanorods at low temperatures and at normal conditions of pressure, without using any templates or surfactants, is presented. The quality of the nanorods is high in terms of their crystallinity and optical properties.
EXPERIMENT
ZnO nanorods were prepared by precipitation from
an aqueous solution. Analytical-grade zinc nitrate hexahydrate [Zn(NO3)2.6H2O] and sodium hydroxide (NaOH) were used without further purification. In a typical synthesis for the growth of ZnO nanorods, 3g of Zn(NO3)2.6H2O was dissolved in 200 ml of distilled water and stirred for 30 minutes. Then, 40 ml, 0.1M NaOH was added slowly, drop wise, under vigorous stirring using a magnetic stirrer until the slow precipitation of ZnO was completed. During this process, the temperature of the Zn(NO3)2.6H2O solution was kept constant at 353 K. It was then kept at 353 K in an electric furnace for 3 hours in ambient atmospheric conditions. The precipitate was filtered and washed several times with distilled water and ethanol. The final product was air-dried at room temperature and characterized as follows.
The structural properties of the prepared ZnO nanoparticles were studied using a PAN ANALYTICALTM X-ray diffractometer. A Cu target (Cu Kα radiation, λ=0.15418 nm) was used as the X-ray source. Data was collected in the range 2θ = 20-70o, at a scanning speed of 4o per minute. UV-VIS spectrophotometry was used to record the reflectance spectra of the sample. The spectra were recorded in reflectance mode using a JASCO spectrophotometer, model V-550TM, equipped with an integrating sphere attachment. BaSO4 was used as the reference sample. Photoluminescence (PL) spectra were recorded at room temperature using a Perkin Elmer LS55TM spectrophotometer. The surface morphology and size of the nanorods were determined using a Scanning Electron Microscopy (CARL ZEISS EVO50) TM. The samples were calcined at 523K and 673K in air and the effect of calcination on the PL spectra of the samples was investigated.
RESULTS & DISCUSSION
Surface morphology - SEM
Figure 1 shows the surface morphology of the prepared nanoparticles in the form of nanorods. The
grown nanorods are solid and straight with non-uniform widths and lengths. The average length and diameter of a typical rod is 300 nm and 200 nm, respectively.
Fig 1. SEM micrographs of (a) prepared ZnO
nanoparticles (b) magnified image of (a). Structural characterization - XRD
Figure 2 shows the XRD patterns of the prepared
sample, which indicate that the ZnO phase is of wurtzite structure. The different peaks can be indexed to a hexagonal structure (space group P63mc, JCPDS card no: 36-1451). Compared with the standard diffraction patterns (Table 1), no characteristic peaks from impurities were detected, indicating high purity of the product. Also, the highly intense, sharp peaks indicate that the product is well crystallized.
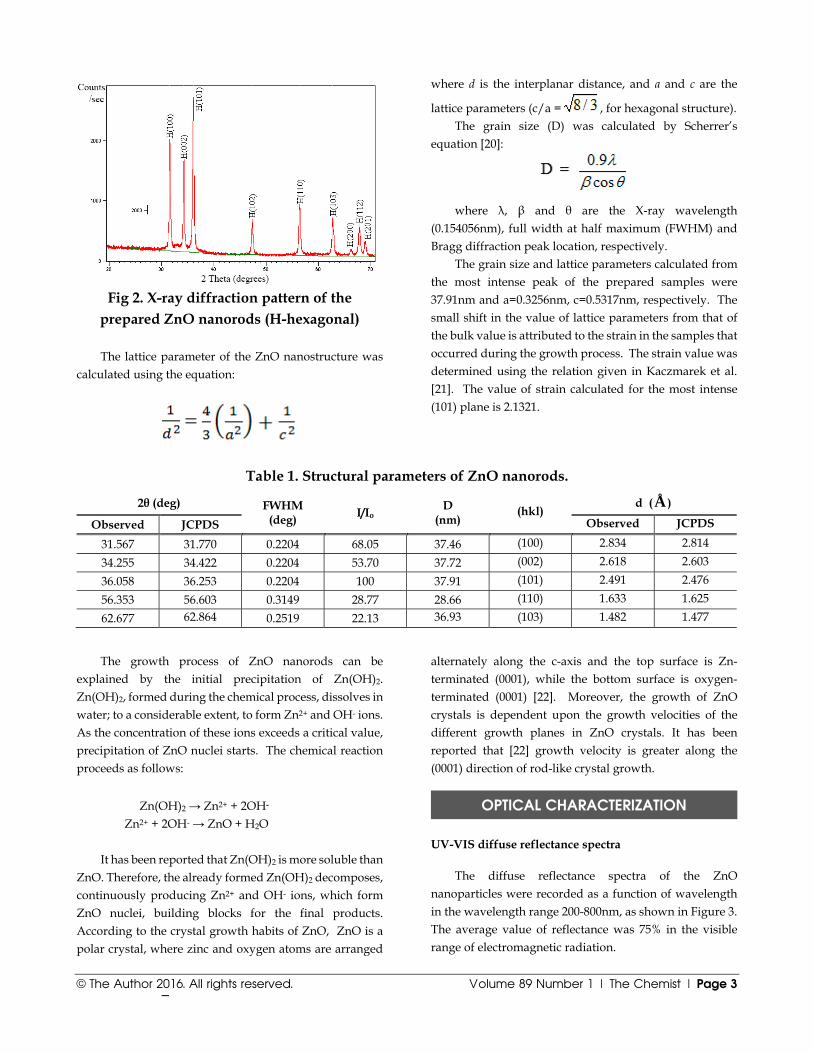
© The Author 2016. All rights reserved. Volume 89 Number 1 | The Chemist | Page 3
Fig 2. X-ray diffraction pattern of the
prepared ZnO nanorods (H-hexagonal) The lattice parameter of the ZnO nanostructure was
calculated using the equation:
where d is the interplanar distance, and a and c are the
lattice parameters (c/a = , for hexagonal structure). The grain size (D) was calculated by Scherrer’s
equation [20]:
where λ, β and θ are the X-ray wavelength (0.154056nm), full width at half maximum (FWHM) and Bragg diffraction peak location, respectively.
The grain size and lattice parameters calculated from the most intense peak of the prepared samples were 37.91nm and a=0.3256nm, c=0.5317nm, respectively. The small shift in the value of lattice parameters from that of the bulk value is attributed to the strain in the samples that occurred during the growth process. The strain value was determined using the relation given in Kaczmarek et al. [21]. The value of strain calculated for the most intense (101) plane is 2.1321.
Table 1. Structural parameters of ZnO nanorods.
2θ (deg) FWHM (deg)
I/Io D (nm)
(hkl) d (Å ) Observed JCPDS Observed JCPDS
31.567 31.770 0.2204 68.05 37.46 (100) 2.834 2.814
34.255 34.422 0.2204 53.70 37.72 (002) 2.618 2.603
36.058 36.253 0.2204 100 37.91 (101) 2.491 2.476
56.353 56.603 0.3149 28.77 28.66 (110) 1.633 1.625
62.677 62.864 0.2519 22.13 36.93 (103) 1.482 1.477
The growth process of ZnO nanorods can be explained by the initial precipitation of Zn(OH)2. Zn(OH)2, formed during the chemical process, dissolves in water; to a considerable extent, to form Zn2+ and OH- ions. As the concentration of these ions exceeds a critical value, precipitation of ZnO nuclei starts. The chemical reaction proceeds as follows:
Zn(OH)2 → Zn2+ + 2OH- Zn2+ + 2OH- → ZnO + H2O It has been reported that Zn(OH)2 is more soluble than
ZnO. Therefore, the already formed Zn(OH)2 decomposes, continuously producing Zn2+ and OH- ions, which form ZnO nuclei, building blocks for the final products. According to the crystal growth habits of ZnO, ZnO is a polar crystal, where zinc and oxygen atoms are arranged
alternately along the c-axis and the top surface is Zn-terminated (0001), while the bottom surface is oxygen-terminated (0001) [22]. Moreover, the growth of ZnO crystals is dependent upon the growth velocities of the different growth planes in ZnO crystals. It has been reported that [22] growth velocity is greater along the (0001) direction of rod-like crystal growth.
OPTICAL CHARACTERIZATION UV-VIS diffuse reflectance spectra
The diffuse reflectance spectra of the ZnO nanoparticles were recorded as a function of wavelength in the wavelength range 200-800nm, as shown in Figure 3. The average value of reflectance was 75% in the visible range of electromagnetic radiation.

Volume 89 Number 1 | The Chemist | Page 4 © The AIC 2016. All rights reserved.
Fig 3. Diffuse reflectance spectra of the
prepared ZnO nanoparticles The band gap of semiconductors is influenced by
various factors: temperature, pressure, electric and magnetic fields, impurities, etc. Therefore, band gap is responsive to the structural perfection of the material. The diffuse reflectance, R, is related to the Kubelka – Munk function F(R) by the relation [23]:
F(R) = (1-R)2 / 2R
Band gap of ZnO nanoparticles was calculated by plotting F(R)2 vs. hν, as shown in Figure 4. The linear part of the curve was extrapolated to F(R)2 = 0 to get the direct band gap energy. The value of band gap energy thus obtained was 3.42 eV. The increase of band gap from the bulk value (3.37 eV) can be explained on the basis of change in lattice parameter due to the kinetics of the growth process.
Fig 4. Determination of optical band
gap – plot of F(R)2 vs. hν
Photoluminescence spectra Photoluminescence (PL) properties of ZnO nanorods
are some of the most interesting and important properties that have been recently investigated. PL spectra of the prepared sample and samples annealed at 523 K and 673 K are shown in Figure 5.
Fig 5. PL spectra of (a) prepared sample and samples calcined at (b) 523 K and (c) 673 K.
Different from the intense UV emission peaks (near-
band edge emission) of ZnO nanorods at 385 and 386 nm observed by Guo et al. and Cheng et al. [24,25], a weak broad band from 380 – 410 nm (centered at 395 nm), is observed in our study. In bulk materials, the intensity ratio of near-band edge emission to deep level emission is very low [26]. The broad, near-band edge UV emission may be attributed to the direct recombination of excitons through an exciton-exciton collision process, where one of the excitons radiatively recombines to generate a photon [27]. The strong blue emission observed at 447 and 459 nm (deep level emission) may be related to the intrinsic defects due to O and Zn vacancies or interstitials and their complexes in ZnO materials [27]. The weak broadband located at 512 nm in the visible region is the green band emission, which is attributed to the presence of singly ionized oxygen vacancies [28]. An additional peak at 483
© The AIC 2016. All rights reserved. Volume 89 Number 1 | The Chemist | Page 5
nm, which was not previously reported, was also observed in our studies. An increase in emission intensity is observed as calcination temperature is increased to 623 K.
CONCLUSION
ZnO nanorods were prepared by a simple precipitation from an aqueous solution route using zinc nitrate hexahydrate [Zn(NO3)2.6H2O] and sodium hydroxide (NaOH). XRD analysis of the nanorods showed that the samples were highly crystalline with a hexagonal wurtzite structure. The optical band gap calculated from the reflectance spectra was 3.37eV. In the PL spectra, weak near-band emissions centered around 395 nm and very intense deep level emissions at 447 and 459 were observed. The intensity of emissions increased with the increase of calcination temperature. One of the implications of this method of preparing nanorods is that this would make a simple, cost-efficient laboratory project in nanomaterials preparation and analysis.
REFERENCES 1. S h a l i m o v A , P a s z k o w i c z W , Gr a s z a K ,
S k u p i n s k i P , M y c i e l s k A , B a k - M i s i u k J . P h y s . S t a t u s S o l i d i , 2 0 0 7 , ( b ) 2 4 4 , 1 5 7 3 -1 5 7 7 .
2. T h o m a s D G . J . P h y s . C h e m . S o l i d s , 1 9 6 0 , 1 5 , 8 6 - 9 6 .
3. C h e n Y , B a g n a l l D , Y a o T . M a t e r . S c i . E n g . , 2 0 0 0 , B 7 5 , 1 9 0 - 1 9 8 .
4. W a n g J L . J . P h y s . C o n d en s . M a t t e r , 2 0 0 4 , 1 6 , R 8 2 9 .
5. S h i n d e S D , P a t i l G E , K a j a l e D D , A h i r e D V , G a i k w a d V B , J a i n G H . I n t l . J . S m a r t S e n s i n g a n d I n t e l l i g e n t S y s t e m s , 2 0 1 2 , 5 .
6. W e i H , W u Y , L u n N , H u C . M a t e r . S c i . E n g . , 2 0 0 5 , A 3 9 3 , 8 0 - 8 2 .
7. B a l a g u e r a - G e l v e s M R , P e r a l e s - P e r e z O J , S i n g h S P , J i m e n e z J A , A p a r i c o - B o l o n o s J A , H e r n a n d e z - R i v e r a S P . M a t e r . S c i . A p p l n . , 2 0 1 3 , 4 , 2 9 - 3 8 .
8. S a a r a v a n a n P , A l a m S , M a t h u r G N . M a t e r . L e t t . , 2 0 0 4 , 5 8 , 3 5 2 8 - 3 5 3 1 .
9. K a m a l a s a n a n M N , C h a n d r a S . T h i n S o l i d F i l m s , 1 9 9 6 , 2 8 8 , 1 1 2 - 1 1 5 .
10. M u e l l e r R , M a d l e r L , P r a t s i n s S E . C h e m . E n g g . S c i . , 2 0 0 3 , 5 8 , 1 9 6 9 - 1 9 7 6 .
11. Z h a n g Y , D a i Y , H u a n g Y , Z h o u C . J . U n i v . S c i . T e c h . , 2 0 0 4 , B e i j i n g 1 1 , 2 3 - 2 9 .
12. L i J Y , C h e n X L , L i H , H e M , Q i a o Z Y . J . C r y s . G r o w t h , 2 0 0 1 , 2 3 3 , 5 - 7 .
13. S u e K , K i m u r a K , Y a m a m t o M , A r a i K . M a t e r L e t t , 2 0 0 4 , 5 8 , 3 3 5 0 - 3 3 5 2 .
14. X u C , X u G , L i u Y , W a n g G A . S o l i d S t a t e C o m m u n . , 2 0 0 2 , 1 2 2 , 1 7 5 - 1 7 9 .
15. H u J Q , M a X L , X i e Z Y , W o n g N B , L e e C S , L e e S T . C h e m . P h y s . L e t t . , 2 0 0 1 , 3 4 4 , 9 7 - 1 0 0 .
16. L i u Y , L i u Z , W a n g G . J . C r y s . G r o w t h , 2 0 0 3 , 2 5 2 , 2 1 3 - 2 1 8 .
17. L y u S C , Z h a n g Z , R u h H , L e e H J , S h i m H W , S u h E K , L e e C J . C h e m . P h y s . L e t t . , 2 0 0 2 , 3 6 3 , 1 3 4 - 1 3 8 .
18. M a l i S S , K i m H , P a t i l P S , H o n g C K . D a l t o n T r a n s . , 2 0 1 3 , 4 2 , 1 6 9 6 1 - 1 6 9 6 7 .
19. T a n g Q , Z ho u W , S h e n J , Z h a n g W , K o n g L , Q i a n Y , C h e m . C o m m u n . , 2 0 0 4 , 7 1 2 - 7 1 3 .
20. A z a r o f f L V i n E l e m e n t s o f C r y s t a l l o g r a p h y , M c G r a w H i l l , N e w Y o r k , 1 9 6 8 .
21. K a c z m a r e k D , D o m a r a d z k i J , W o j c i e s z a k D , W a s i e l e w s k i R , B o rk o w s k a A , P r o c i o w E L , C i s z e w s k i A . A p p l i e d S u r f a c e S c i e n c e , 2 0 0 8 , 2 5 4 , 4 3 0 3 - 4 3 0 7 .
22. A l - H a j r y A , U m a r A , H a h n Y B , K i m D H . S u p e r l a t t i c e s a n d M i c r o s t r u c t u r e s , 2 0 0 9 , 4 5 , 5 2 9 - 5 3 4 .
23. K o r t u m G i n R e f l e c t a n c e S p e c t r o s c o p y , S p r i n g e r V e r l a g , N e w Y o r k .
24. G u o L , J i Y L , X u H B , S i m o n P , W u Z Y . J . A m . C h e m . S o c . , 2 0 0 2 , 1 2 4 , 1 4 8 6 4 - 1 4 8 6 5 .
25. C h e n g C W , X u G Y , Z ha n g H Q , L u o Y , L i Y Y . M a t e r . L e t t . , 2 0 0 8 , 5 2 , 3 7 3 3 - 3 7 3 5 .
26. C h e n Y , B a g n a l l D , Y a o T . M a t e r . S c i . E n g . , 2 0 0 0 , B 7 5 , 1 9 0 – 1 9 8 .
27. D a i L , C h e n X L , W a n g W J , Z h o u T , H u B Q . J . P h y s . C o nd e n s . M a t t e r , 2 0 0 3 , 1 5 , 2 2 2 1 .
28. H u a n g M H , W u Y , F e i c k H , T r a n N , W e b e r E , Y a n g P . A d v . M a t e r . , 2 0 0 1 , 1 3 , 1 1 3 - 1 1 6 .
Volume 89 Number 1 | The Chemist | Page 6 © The AIC 2016. All rights reserved.
Vibrational Spectroscopic & Molecular Docking Studies of 2,6-Dichlorobenzyl Alcohol Merrin Mary Abrahama, Resmi K. S.a, Sheena Mary Y.b, C. YohannanPanickerb*, B. Harikumarc aDepartment of Physics, TKM College of Arts and Science, Kollam, Kerala, India bDepartment of Physics, Fatima Mata National College, Kollam, Kerala, India cDepartment of Chemistry, TKM College of Arts and Science, Kollam, Kerala, India (*E-mail: [email protected])
Abstract: The optimized molecular structure, vibrational frequencies, and corresponding vibrational assignments of 2,6-dichlorobenzyl alcohol have been investigated experimentally and theoretically using Gaussian09 software package. Potential energy distribution of the normal modes of vibrations was done using GAR2PED program. The HOMO and LUMO analysis was used to determine the charge transfer with the molecule. The stability of the molecule arising from hyper-conjugative interaction and charge delocalization has been analyzed using NBO analysis. Molecular electrostatic potential was performed by the DFT method and from the MEP, it is evident that the negative region covers the CH2 group, oxygen atom, and phenyl ring and that positive region is over the hydrogen atoms. The calculated first hyperpolarizability of the title compound is 4.523 times that of standard NLO material urea and the title compound is an attractive object for future studies of nonlinear optical properties. The docked title compound forms a stable complex with aryl hydrocarbon receptor and gives a binding affinity value of -4.4 kcal/mol. The results suggest that the compound might exhibit inhibitory activity against aryl hydrocarbon receptor. Key Words: DFT, chlorobenzyl, docking, NLO, MEP.
INTRODUCTION
Benzyl alcohol derivatives are found in natural products and play a central role in numerous mechanistic investigations [1]. Aminobenzyl alcohols are useful as antimicrobial agents [2] and herbicides [3]. 3-Aminobenzyl alcohol is used to synthesize gamma-L-glutamyl-4-nitroanilide derivative to determine γ-GTP (gamma-glutamyltranspeptides) in serum [4]. A hit-to-lead optimization program on dichlorobenzyl derivative discovers pyrimidine-5-carbonitrile-6-cyclopropyl as a functional antagonist of the human CXCR2 receptor and shows good oral bioavailability in the rat [5]. Alcohols are used in topical ophthalmic pharmaceuticals and are useful against cataracts [6]. In spite of these numerous applications and consequent interest in their qualitative and quantitative characterization, the vibrational spectra of benzyl alcohol derivative provide a deeper insight into
their biological actions when they are administered as drugs and in the environment as herbicides. Several author groups have studied the vibrational spectra of benzyl alcohol derivatives [7, 8].
EXPERIMENTAL &
COMPUTATIONAL DETAILS
The FT-IR spectrum (Fig. 1) was recorded using KBr pellets on a DR/Jasco FT-IR 6300 spectrometer and the FT-Raman spectrum (Fig. 2) was obtained on Bruker RFS 100/s, Germany.
Calculations of the title compound were carried out with Gaussian09 [9] program using the B3LYP/ 6-31G (6D, 7F) basis sets to predict the molecular structure and vibrational wave numbers. Molecular geometry was fully optimized by Berny’s optimization algorithm using redundant internal coordinates. Harmonic vibrational
The Chemist Journal of the American Institute of Chemists

© The AIC 2016. All rights reserved. Volume 89 Number 1 | The Chemist | Page 7
wave numbers were calculated using the analytic second derivatives to confirm the convergence to minima on the potential surface. The theoretical calculations were performed with the hybrid B3LYP functional that is, a combination of the Becke’s three-parameter exchange functional and Lee-Yang-Parr correlation functional [10, 11]. The DFT calculations reported excellent vibrational wavenumber of organic compounds if the calculated wavenumbers were scaled to compensate for the approximate treatment of electron correlation, for basis set deficiencies and for the anharmonicity [12]. The DFT hybrid B3LYP functional tended to overestimate the fundamental modes [13]; therefore, scaling factor of 0.9613 has to be used for obtaining a considerably better agreement with experimental data [14]. Then, frequency calculations were employed to confirm the structure as minimum points in energy. The absence of imaginary wavenumbers on the calculated vibrational spectrum confirmed that the structure (Fig. 3) deduced corresponded to minimum energy. The assignments of the calculated wave numbers were aided by the animation option of GAUSSVIEW program, which gave a visual presentation of the vibrational modes [15]. The potential energy distribution (PED) was calculated with the help of GAR2PED software package [16].
Fig 1. FT-IR spectrum of
2,6-dichlorobenzyl alcohol
Fig 2. FT-Raman spectrum of
2,6-dichlorobenzyl alcohol
Fig 3. Optimized geometry of
2,6-dichlorobenzyl alcohol
RESULTS & DISCUSSION IR and Raman Spectrum
The calculated (scaled) wavenumbers, observed IR,
Raman bands, and assignments are given in Table 1. Aromatic compounds commonly exhibit multiple weak bands in the region 3100-3000 cm-1, due to aromatic CH stretching vibrations [17]. For the title compound, the band observed at 3094 cm-1 in the Raman spectrum and at 3127, 3121, 3095 cm-1 (DFT) were assigned the CH stretching modes of the phenyl ring. For tri-substituted benzenes δCH modes were expected in the range 1050–1280 cm-1 [17] and the bands observed at 1214 cm-1in the IR spectrum, 1071 cm-1in the Raman spectrum and at 1230, 1184, 1066 cm-1 (DFT) are assigned as these in-plane CH deformation modes. The CH out-of-plane deformations were expected below 1000 cm-1 [18]. The bands at 971, 900 cm-1in the IR spectrum, 900 cm-1in the Raman spectrum and 980, 947, 909 cm-1 (DFT) were assigned as the CH out-of-plane deformations.
The benzene ring possesses six ring stretching modes of which the four with the highest wavenumbers occurring near 1600, 1580, 1490, and 1440 cm-1 were good group vibrations [17]. These modes were expected in the region 1250-1620 cm-1 [17]. For the title compound, the bands observed at 1571, 1557, 1429 cm-1 (IR), 1578, 1437, 1294 cm-
1 (Raman) and 1585, 1552, 1438, 1437, 1310 cm-1 (DFT) were assigned as the phenyl ring stretching modes.

Volume 89 Number 1 | The Chemist | Page 8 © The AIC 2016. All rights reserved.
Table 1: Vibrational assignments of 2,6-dichlorobenzyl alcohol
B3LYP/6-31G* IR υ(cm-1)
Raman υ(cm-1)
Assignmentsa υ(cm-1) IRA RA
3490 4.97 263.88 3300 υOH(100)
3127 3.95 175.44 υCH(98)
3121 0.70 64.76 υCH(95)
3095 5.56 84.57 3094 υCH(97)
2987 17.88 40.62 3000 υCH2(100)
2946 34.69 79.83 2943 υCH2(93)
1585 29.67 23.88 1571 1578 υPh(65), δCH2(12)
1552 45.74 13.81 1557 υPh(70), δCH2(10)
1507 5.64 12.68 δCH2(49), υPh(12)
1438 1.30 0.83 υPh(54), δCH2(20)
1437 64.38 0.08 1429 1437 υPh(60), δOH(22)
1413 15.12 8.69 δOH(45), υPh(18)
1310 0.61 11.89 1294 υPh(59), δCH2(23)
1233 1.23 1.21 δCH2(55)
1230 20.45 13.24 1214 δCH(71), δCH2(11)
1184 11.01 7.23 δCH(63), υCC(21)
1163 50.42 13.48 1167 υCO(41), δCH(13)
1156 14.89 0.90 1157 δCH2(58), υCC(15)
1066 4.02 18.81 1071 δCH(45), δCH2(18)
1049 30.61 7.17 1057 1040 υCC(39), δCH(23)
984 22.45 3.12 δCH2(61), υCC(12)
980 0.99 0.30 971 γCH(95)
947 60.08 14.78 υCO(44), γCH(34)
909 0.00 0.77 900 900 γCH(68)
808 8.06 2.83 829 794 υCCl(35), γCH(23)
788 32.93 3.15 786 778 υCCl(41), γCH(17)
745 39.08 1.86 754 τPh(55), υCCl(24)
720 90.03 0.13 729 υPh(48), υCCl(20)
599 4.54 5.71 γOH(37), τCH2(18)
533 0.70 8.52 540 τPh(40), γOH(22)
531 0.04 1.45 514 τPh(37), γOH(16)
473 4.24 0.25 484 τCH2(48), τPh(30)
384 9.18 6.53 δPh(32), γCCl(20)
381 10.21 7.69 τPh(40), γCCl(28)
325 0.99 5.75 δPh(38), γCCl(32)
307 2.59 0.06 τCH2(29), γCCl(22)
211 3.15 4.07 219 δCCl(24), δPh(19)
210 137.83 8.10 200 δCCl(28), δPh(25)
196 1.46 1.79 τPh(38)
162 3.44 2.11 141 τPh(31)
77 2.87 1.37 τCCl(24), τPh(19)
37 1.17 2.63 τOH(27), τPh(20)
υ- stretching; δ- in-plane deformation; γ- out-of-plane deformation; a% of PED contribution of each mode is given in parenthesis.

© The Author 2016. All rights reserved. Volume 89 Number 1 | The Chemist | Page 9
In asymmetric tri-substituted benzenes, when all the three substituents were light, the wavenumber interval of the breathing mode was between 500 and 600 cm−1. In the case of mixed substituent, the wavenumber was expected to appear between 600 and 750 cm-1. When all the three substituents were heavy, the ring breathing mode was expected around 1100 cm-1 [19, 20]. The band observed at 729 cm-1in the IR spectrum was assigned as the ring breathing mode of the phenyl ring which found support from the computational value at 720 cm-1.
The asymmetric and symmetric CH2 stretching appeared in the region 3000±50 and 2965±30 cm-1, respectively [17, 18]. The CH2 stretching modes were observed at 2943 cm-1 in the IR spectrum and at 3000 cm-1
in the Raman spectrum. The DFT calculations gave these modes at 2987 and 2946 cm-1. The scissoring vibration δCH2 and wagging vibration ωCH2 appeared in the regions 1455 ± 55 and 1350 ± 85 cm-1, respectively [17,18]. The CH2 deformation band, which came near 1463 cm-1 in alkenes, [21] was lowered to about 1440 cm-1 when the CH2 group was next to a double or triple bond. The rocking mode [17] ρCH2 was expected in the range 895±85 cm-1. The deformation modes of the methylene group were assigned at 1507 cm-1 (scissoring), 1233 cm-1 (wagging), 1156 cm-1 (twisting), and 984 cm-1 (rocking) theoretically.
For the hydroxyl group, the OH group provided three normal vibrations; the stretching vibration OH, in-plane and out-of-plane deformations δOH and γOH. The in-plane OH deformation [17] was expected in the region 1440 ± 40 cm-1. The out-of-plane deformation was expected generally in the region 650 ± 80 cm-1 [17]. The C-O stretching mode was expected in the region 1220 ± 40 cm-1
[18-20]. The OH modes were assigned at 3490 cm-1
(stretching), 1413 cm-1 (in-plane bend), and 599 cm-1 (out-of-plane bend) theoretically, for the title compound.
Varghese et al. reported υOH at 3633 cm-1 and δOH at 1345 cm-1 theoretically and C-O stretching at 1255 cm-1 in both IR and Raman spectra and 1262 cm-1 theoretically [22]. For paracetamol, the C-O stretching mode and out-of-plane OH were reported at 1240 and 620 cm-1, respectively [23]. In the present case the C-O stretching mode was assigned at 1167 cm-1 in the Raman spectrum and at 1163 cm-1 theoretically. For simple organic chlorine compounds C-Cl absorptions were in the region 800-700 cm-1 [24, 25]. The bands observed at 829, 786 cm-1 in the IR spectrum, 794, 778 cm-1 in the Raman spectrum and at 808, 788 cm-1
(DFT) were assigned as the C-Cl stretching modes for the title compound. Most of the modes were not pure but contained significant contributions from other modes also.
Nonlinear optical properties The first hyperpolarizability (β0) of this novel
molecular system is calculated using the B3LYP/ 6-31G (6D, 7F) method, based on the finite-field approach. In the presence of an applied electric field, the energy of a system is a function of the electric field. The first hyperpolarizability is a third-rank tensor that can be described by a 3 × 3 × 3 matrix. The 27 components of the 3D matrix can be reduced to 10 components due to the Kleinman symmetry [26]. The components of β are defined as the coefficients in the Taylor series expansion of the energy in the external electric field. When the electric field is weak and homogeneous, this expansion becomes:
where E0 is the energy of the unperturbed molecule, Fi is the field at the origin, µi, αij, βijk and γijkl are the components of dipole moment, polarizability, the first hyperpolarizabilities, and second hyperpolarizabilities, respectively.
β0= (βx2+ βy2+ βz2)1/2 where βx= βxxx+ βxyy+ βxzz
βy= βyyy+ βxxy+ βyzz
βz= βzzz+ βxxz+ βyyz
The calculated first hyperpolarizability of the title
compound is 0.588×10⁻³⁰ esu which is 4.523 times that of standard NLO material urea (0.13 ×10⁻³⁰ esu) [27]. We conclude that the title compound is an attractive object for future studies of nonlinear optical properties. Molecular Electrostatic Potential (MEP)
MEP is related to the Electron Density (ED) and is a
very useful descriptor in understanding sites for electrophilic and nucleophilic reactions, as well as hydrogen bonding interactions [28]. The electrostatic potential V(r) is also well suited for analyzing processes based on the "recognition" of one molecule by another, as in drug-receptor and enzyme-substrate interactions, because it is through their potentials that the two species first "see" each other [29,30]. To predict reactive sites of electrophilic and nucleophilic attacks for the investigated molecule, MEP at the B3LYP/ 6-31G (6D, 7F) optimized

Volume 89 Number 1 | The Chemist | Page 10 © The Author 2016. All rights reserved.
geometry is calculated. The different values of the electrostatic potential at the surface are represented by different colors: red represents regions of most electronegative, electrostatic potential; blue represents regions of the most positive electrostatic potential; and green represents region of zero potential. Potential decreases in the order red < orange < yellow < green < blue. The MEP surface (Fig.4) provides necessary information about the reactive sites. From the MEP, it is evident that the negative region covers the CH2 group, oxygen atom, phenyl ring, and the positive region is over the hydrogen atoms.
Fig 4. MEP plot of 2,6-dichlorobenzyl alcohol Frontier Molecular Orbital Analysis
The most widely used theory by chemists is the
molecular orbital (MO) theory. It is important that ionization potential (I), electron affinity (A),
electrophilicity index (), chemical potential (), electro-
negativity (), and hardness () be put into a MO framework. Based on density functional descriptors, global chemical reactivity descriptors of compounds, such as hardness, chemical potential, softness, electro negativity, and electrophilicity index, as well as local reactivity, have been defined [31-33]. Pauling introduced the concept of electro-negativity as the power of an atom in a compound to attract electrons to it. Using Koopman’s
theorem for closed shell components , and can be
defined as = (I -A)/2; = -(I + A)/2; = (I + A)/2; where I and A are the ionization potential and electron affinity of the compounds, respectively. The ionization energy (I) and electron affinity (A) can be expressed through HOMO and LUMO orbital energies as I = -EHOMO = 8.086 and A =
-ELUMO = 4.413eV. Electron affinity refers to the capability of ligand to accept precisely one electron from a donor. However, in many kinds of bonding viz. covalent hydrogen bonding, partial charge transfer takes place.
Considering the chemical hardness (), a large HOMO-LUMO energy gap means a hard molecule and a small HOMO-LUMO gap means a soft molecule.
Fig 5. HOMO-LUMO plots of
2,6-dichlorobenzyl alcohol
One can also relate the stability of the molecule to hardness, which means that the molecule with a smaller HOMO-LUMO gap (3.673eV) is more reactive. Parr et al. [31] have defined a new descriptor to quantify the global electrophilic power of the compound as electrophilicity
index () which defines a quantitative classification of global electrophilic nature of a compound. Parr et al. have
proposed electrophilicity index () as a measure of energy lowering due to maximal electron flow between donor and
acceptor. They defined electrophilicity index as follows:
© The Author 2016. All rights reserved. Volume 89 Number 1 | The Chemist | Page 11
= 2/2. The usefulness of this new reactivity measure has been recently demonstrated in understanding the toxicity of various pollutants in terms of their reactivity and site
selectivity [34]. The calculated values of , , , and are 10.6324eV, -6.250eV, 6.250eV, and 1.837eV, respectively. The calculated value of electrophilicity index describes the biological activity of the title compound. The atomic orbital components of the frontier molecular orbital are shown in Fig. 5. Natural Bond Orbital Analysis
The natural bond orbital (NBO) calculations were
performed using NBO 3.1 program [35] as implemented in the Gaussian09 package at the DFT/B3LYP/ 6-31G (6D, 7F) level in order to understand various second-order interactions between the filled orbital of one subsystem and the vacant orbital of another subsystem, which is a measure of the intermolecular delocalization or hyper-conjugation. NBO analysis provides the most accurate possible ‘natural Lewis structure’ picture of ‘j’ because all orbital details are mathematically chosen to include the highest possible percentage of the electron density. A useful aspect of the NBO method is that it gives information about interactions of both filled and virtual orbital spaces that could enhance the analysis of intra- and inter-molecular interactions. The second-order Fock-matrix was carried out to evaluate the donor–acceptor interactions in the NBO basis. The interactions resulted in a loss of occupancy from the localized NBO of the idealized Lewis structure into an empty non-Lewis orbital. For each donor (i) and acceptor (j) the stabilization energy
(E2) associated with the delocalization ij is determined as:
E (2) = ijE = )(
)( 2,
ij
jii EE
Fq
qi is donor orbital occupancy, Ei, Ej is the diagonal elements, and F(i,j) is the off diagonal NBO Fock- matrix element. In NBO analysis large E(2) value shows the intensive interaction between electron-donors and electron- acceptors, and a higher extension of conjugation of the whole system. The possible intensive interaction is given in Table 2. The second-order perturbation theory analysis of Fock-matrix in NBO basis shows that strong
intra-molecular, hyper-conjugative interactions are
formed by orbital overlap between n(Cl) and *(C-C) bond orbital which result in ICT causing stabilization of the system. These interactions are observed as an increase in electron density(ED) in C-C anti-bonding orbital that weakens the respective bonds. The strong intra-molecular, hyper-conjugative interaction of C3-C4 from Cl10 of
n3(Cl10)*(C3-C4) which increases ED(0.39326e) that weakens the respective bonds C3-C4 leading to stabilization of 9.63kJ/mol and also the hyper-conjugative
interaction of C1-C2 from Cl11 of n3(Cl11)π*(C1-C2) which increases ED (0.37193e) that weakens the respective bonds C1-C2 leading to stabilization of 9.29kJ/mol.
The NBO analysis describes the bonding in terms of the natural hybrid orbital n3(Cl10), which occupies a higher energy orbital (-0.31889a.u) with considerable p-character (100%) and low occupation number (1.94196) and the other n1(Cl10) occupies a lower energy orbital (-0.92091a.u) with p-character (15.25%) and high occupation number (1.99411). The NBO analysis also describes the bonding in terms of the natural hybrid orbital n3(Cl11), which occupies a higher energy orbital (-0.31888a.u) with considerable p-character (100%) and low occupation number (1.94195) and the other n1(Cl11) occupies a lower energy orbital (-0.92090a.u) with p-character (15.25%) and high occupation number (1.99412). Again, the NBO analysis describes the bonding in terms of the natural hybrid orbital n2(O15), which occupies a higher energy orbital (-0.28535a.u) with considerable p-character (100%) and low occupation number (1.96816) and the other n1(O15) occupies a lower energy orbital (-0.60657a.u) with p-character (46.89%) and high occupation number (1.98601). Thus, a very close to pure p-type lone pair orbital participates in the electron donation to the π*(C3-C4) orbital for n3(Cl10)→π*(C3-C4) and π*(C1-C2) orbital for n3(Cl11)→ π*(C1-C2) interaction in the compound. The results are tabulated in Table 3.
Molecular docking
Aryl hydrocarbon receptor (AHR), a cytosolic ligand-activated transcription factor, belongs to the family of hetero-dimeric transcriptional regulators and is widely expressed in a variety of animal and human species, and experimental animal data provided substantial support for an association between abnormal AHR function and cancer, implicating AHR may be a novel drug-interfering target for cancers [36]. Certain benzyl alcohol derivatives show anticancer activity [37]. High-resolution crystal

Volume 89 Number 1 | The Chemist | Page 12 © The Author 2016. All rights reserved.
Table 2. TG-DTA results evidenced the presence of lattice water in Co(II) and Ni(II) complexes
Donor(i) Type ED/e Acceptor(j) Type ED/e E(2)a E(j)-E(i)b F(i,j)c
C1-C2 σ 1.98163 C1-C6 σ* 0.01622 2.34 1.29 0.049
C2-C3 σ* 0.03356 3.98 1.28 0.064
C3-C12 σ* 0.02501 2.94 1.14 0.052
C1-C2 π 1.67720 C3-C4 π* 0.39326 20.04 0.29 0.069
C5-C6 π* 0.32742 19.19 0.29 0.067
C3-C4 σ 1.97002 C2-C3 σ* 0.03356 3.49 1.27 0.060
C2-Cl11 σ* 0.03486 4.69 0.82 0.056
C3-C12 σ* 0.02501 2.37 1.14 0.046
C4-C5 σ* 0.02172 3.51 1.29 0.060
C3-C4 π 1.66492 C1-C2 π* 0.37193 19.41 0.28 0.067
C5-C6 π* 0.32742 19.58 0.29 0.068
C12-O15 σ* 0.02140 5.26 0.53 0.051
C2-C3 σ 1.97002 C1-C2 σ* 0.02172 3.51 1.29 0.060
C3-C4 σ* 0.03357 3.49 1.27 0.060
C4-Cl10 σ* 0.03486 4.69 0.82 0.055
C4-C5 σ 1.98163 C3-C4 σ* 0.03357 3.98 1.28 0.064
C3-C12 σ* 0.02501 2.94 1.14 0.052
C5-C6 σ* 0.01622 2.34 1.29 0.049
LPCl10 σ 1.99411 C3-C4 σ* 0.03357 1.02 1.46 0.059
LPCl10 π 1.97381 C3-C4 σ* 0.03357 3.46 0.86 0.049
C4-C5 σ* 0.02172 2.56 0.87 0.042
LPCl10 n 1.94196 C3-C4 π* 0.39326 9.63 0.33 0.055
LPCl11 σ 1.99412 C2-C3 σ* 0.03356 1.02 1.46 0.035
LPCl11 π 1.97382 C1-C2 σ* 0.02172 2.56 0.87 0.042
C2-C3 σ* 0.03356 3.46 0.86 0.049
LPCl11 n 1.94195 C1-C2 π* 0.37193 9.29 0.32 0.053
a E(2) means energy of hyper-conjugative interactions (stabilization energy in kJ/mol) b Energy difference (a.u) between donor and acceptor i and j NBO orbitals c F(i,j) is the Fock matrix elements (a.u) between i and j NBO orbitals

© The Author 2016. All rights reserved. Volume 89 Number 1 | The Chemist | Page 13
Table 3. NBO results showing the formation of Lewis and non-Lewis orbitals.
Bond(A-B) ED/ea EDA% EDB% NBO s% p%
σC1-C2 1.98163 -0.73810
49.23 50.77 0.7016(sp1.90)C
+0.7126(sp1.51)C 34.35 39.75
65.65 60.65
πC1-C2 1.67720 -0.27880
48.14 51.86 0.6938(sp1.00)C
+0.6938(sp1.00)C 0.00 0.00
100.0 100.0
σC3-C4 1.97002 -0.73425
50.52 49.48 0.7108(sp1.95)C
+0.7034(sp1.95)C 33.86 39.55
66.14 60.45
πC3-C4 1.66492 -0.27670
48.44 51.56 0.6960(sp1.00)C
+0.7180(sp1.00)C 0.01 0.00
99.99 100.0
σC4-C5 1.98163 -0.73811
50.77 49.23 0.7126(sp1.51)C
+0.7016(sp1.91)C 9.75
34.35 60.25 65.65
n1Cl10 1.99411 -0.92091
sp0.18 84.75 15.25
n2 Cl10 1.97381 -0.32023
sp99.99 0.05 99.95
n3 Cl10 1.94196 -0.31889
sp1.00 0.00 100.0
n1 Cl11 1.99412 -0.92090
sp0.18 84.75 15.25
n2 Cl11 1.97382 -0.32022
sp99.99 0.05 99.95
n3 Cl11 1.94195 -0.31888
sp1.00 0.00 100.0
n1 O15 1.98601 -0.60657
sp0.88 53.11 46.89
n2 O15 1.96816 -0.28535
sp1.00 0.00 100.0
a ED/e is expressed in a.u.
structure of aryl hydrocarbon receptor was downloaded from the protein data bank website (PDB ID: 2B02). All molecular docking calculations were performed on AutoDock-Vinasoftware [38]. The 3D crystal structure of aryl hydrocarbon receptor was obtained from Protein Data Bank. The protein was prepared for docking by removing the co-crystallized ligands, waters, and co-factors. The AutoDockTools (ADT) graphical user interface was used to calculate Kollman charges and polar hydrogen. The ligand was prepared for docking by minimizing its energy at B3LYP/6-31G (6D, 7F) level of theory. Partial charges were calculated by Geistenger method. The active site of the enzyme was defined to include residues of the active site within the grid size of 40Å×40Å×40Å. The most popular algorithm available in Auto Dock, the Lamarckian Genetic Algorithm (LGA), was employed for docking. The docking protocol was tested by extracting co-crystallized
inhibitor from the protein and then docking the same. The docking protocol predicted the same conformation as was present in the crystal structure with RMSD value well within the reliable range of 2Å [39]. Amongst the docked conformations, one which binds well at the active site was analyzed for detailed interactions in Discover Studio Visualizer 4.0 software. The ligand binds at the active site of the substrate (Figs. 6 and 7) by weak non-covalent interactions. Amino acid Asn395 forms H-bond with OH group and Arg409 forms hydrophobic interaction with phenyl ring. The docked ligand title compound forms a stable complex with aryl hydrocarbon receptor and gives a binding affinity (ΔG in kcal/mol) value of -4.4 (Table 4). These preliminary results suggest that the compound might exhibit inhibitory activity against aryl hydrocarbon receptor.

Volume 89 Number 1 | The Chemist | Page 14 © The AIC 2016. All rights reserved.
Fig 6. Schematic for the docked conformation
of active site of title compound at AHR
Fig 7. The docked protocol reproduced the co-
crystallized conformation with H-bond (green), alkyl-π (pink), and sigma-π (violet)
Table 4. The binding affinity values of different poses of the title compound
predicted by AutoDockVina.
Mode Affinity (kcal/mol)
Distance from best mode (Å)
RMSD l.b. RMSD u.b.
1 -4.4 0.000 0.000
2 -4.3 13.604 14.299
3 -4.3 13.610 14.145
4 -4.3 0.643 2.985
5 -4.2 21.000 22.118
6 -4.2 1.948 4.008
7 -4.1 2.155 2.445
8 -4.1 12.995 13.858
9 -4.1 2.144 2.938
CONCLUSIONS
The vibrational spectroscopic studies of 2,6-dichlorobenzyl alcohol were reported experimentally and theoretically. Potential energy distribution of normal modes of vibrations was done using GAR2PED program. Using HOMO and LUMO energy values, the quantum chemical descriptors are reported. MEP predicts the most reactive part in the molecule and it is evident that the negative region covers the CH2 group, oxygen atom, and phenyl ring, and the positive region is over the hydrogen atoms. The hyperpolarizability of the title compound 4.523 times that of standard NLO material urea and is an attractive object for future studies in nonlinear optics. From the molecular docking study title compound forms a stable complex with aryl hydrocarbon receptor and gives a binding affinity value of -4.4kcal/mol, and this suggests that the compound might exhibit inhibitory activity against aryl hydrocarbon receptor.
ACKNOWLEDGEMENTS
Authors, BH would like to thank UGC, India for a minor research project and RKS would like thank University of Kerala for a research fellowship.
REFERENCES 1. Schaefer T, Danchura W, Niemezura W, Parr WJE. Can.
J. Chem., 1978, 56, 1721. 2. Yu S, Andreichikov LA, Voronova ZD, Belykh AN,
Perm Pharmaceutical Institute, USSR 666, 799, C1. C07D 267/14, 1979, p. 222.
3. Kenneth P, Albright JA, SCM Corp., 1973, p. 280. 4. Ogata H, Nawa H, Tokuda K, Ishihara M, Wako Pure
Chemicals Industries, Ltd., 1987, p. 17. 5. Porter DW, Bradley M, Brown Z, Charlton SJ, Cox B,
Hunt P, Janus D, Lewis S, Oakley P, Connor DO, Reilly J, Smith N, Press NJ. Bioorg. Med. Chem. Lett., 2014, 24, 3285.
6. Serafini, MF. Testa MF, Villano D, Pecorari M, Wieren KV, Azzini E, Brambilla A, Maiani G. Free Radic Biol. Med., 2009, 15, 769.
7. Sundaraganesan N, Anand B, Meganathan C, Joshua BD, Saleem H. Spectrochim. Acta, 2008, 69, 198.
8. Sundaraganesan N, Anand B, Jian FF, Zhao P, Spectrochim. Acta, 2006, 65, 826.

© The AIC 2016. All rights reserved. Volume 89 Number 1 | The Chemist | Page 15
9. Gaussian 09, Revision C.01, Frisch MJ, Trucks GW, Schlegel HB, Scuseria GE, Robb MA, Cheeseman JR, Scalmani G, Barone V, Mennucci B, Petersson GA, Nakatsuji H, Caricato M, Li X, Hratchian HP, Izmaylov AF, Bloino J, Zheng G, Sonnenberg JL, Hada M, Ehara M, Toyota K, Fukuda R, Hasegawa J, Ishida M, Nakajima T, Honda Y, Kitao O, Nakai H, Vreven T, Montgomery, Jr. JA, Peralta JE, OgliaroF, Bearpark M, Heyd JJ, Brothers E, Kudin KN, Staroverov VN, Keith T, Kobayashi R, Normand J, Raghavachari K, Rendell A, Burant JC, Iyengar SS, Tomasi J, Cossi M, Rega N, Millam JM, Klene M, Knox JE, Cross JB, Bakken V, Adamo C, Jaramillo J, Gomperts R, Stratmann RE, Yazyev O, Austin AJ, Cammi R, Pomelli C, Ochterski JW, Martin RL, Morokuma K, Zakrzewski VG, Voth GA, Salvador P, Dannenberg JJ, Dapprich S, Daniels AD, Farkas O, Foresman JB, Ortiz JV, Cioslowski J, Fox DJ, Gaussian, Inc., Wallingford CT, 2010.
10. Becke AD. J. Chem. Phys. 1993, 98, 5648. 11. Lee C, Yang W, Parr RG, Phys. Rev. B. 1988, 37, 785. 12. Handy NC, Masley PE, Amos RD, Andrews JS, Murray
CW, Laming G. Chem. Phys. Lett., 1992, 197, 506. 13. Scott AP, Radom L. J. Phys. Chem., 1996, 100, 16502. 14. Foresman JB in Exploring Chemistry with Electronic
Structure Methods: A Guide to Using Gaussian, Ed. Frisch E, Pittsburg, PA, 1996.
15. Dennington R, Keith T, Millam J, Gaussview, Version 5, Semichem. Inc., Shawnee Missions, KS, 2009.
16. Martin JML, Van Alsenoy C, GAR2PED, A Program to Obtain A Potential Energy Distribution from a Gaussian Archive Record, University of Antwerp, Belgium, 2007.
17. N.P.G. Roeges NPG, A Guide to the Complete Interpretation of Infrared Spectra of Organic Structures, John Wiley and Sons Inc., New York, 1994.
18. Colthup NB, Daly LH, Wiberly SE, Introduction to Infrared and Raman Spectroscopy, third ed., Academic Press, Boston, 1990.
19. Varsanyi G, Assignments of Vibrational Spectra of Seven hundred benzene derivatives, Wiley, New York, 1974.
20. Socrates G, Infrared Characteristic Group Frequencies, John Wiley and Sons, New York, 1981.
21. McMurry HL, Thornton V. Anal. Chem., 1952, 24, 310. 22. Varghese HT, Panicker CY, Philip D, Mannekutla JR,
Inamdar SR. Spectrochim. Acta, 2007, 66, 959. 23. El-Shahway AS, Ahmed SM, Sayed NK. Spectrochim.
Acta, 2007, 66, 143. 24. Mooney EF. Spectrochim. Acta, 1964, 20, 1021. 25. Mooney EF. Spectrochim. Acta, 1963, 19, 877. 26. Kleinman DA. Phys. Rev., 1962, 126, 1977.
27. Adant M, Dupuis M, Bredas JL. Int. J. Quantum. Chem., 1995, 56, 497.
28. Scrocco E, Tomasi J. Adv. Quantum. Chem., 1978, 103, 115.
29. Politzer P, Murray JS in: Theoretical Biochemistry and Molecular Biophysics: A Comprehensive Survey, Vol. 2, Protein, Beveridge DL, Lavery R, Eds., Adenine Press, Schenectady, NY, 1991, Chap. 13.
30. Scrocco E, Tomasi J. Top. Curr. Chem., 1973, 42, 95. 31. Parr RG, Szentpaly LV, Liu SJ. J. Am. Chem. Soc., 1999,
121, 1922. 32. Chaltraj PK, Maiti B, Sarbar UJ. J. Phys. Chem., 2003,
107, 4973. 33. Parr RG, Donnelly RA, Levy M, Palke WE. J. Am. Chem.
Soc., 1978, 68, 3801. 34. Parthasarathi R, Padmanabhan J, Subramanian V,
Maiti B, Chattraj PK. J. Phys. Chem., 2003, 107, 10346. 35. Glendening ED, Reed AE, Carpenter JE, Weinhold F,
NBO 3.1 Program Manual, Theoretical Chemistry Institute, University of Wisconsin, Madison, WI.
36. Feng S, Cao Z, Wang X. BioChim. Biophys- A Rev, Cancer, 2013, 197, 1837.
37. Lawrence NJ, Hepworth LA, Denisson D, McGown AT, Hadfield JA. J. Fluorine Chem., 2003, 123, 101.
38. Trott O, Olson AJ. J. Comput. Chem., 2010, 31, 455. 39. Kramer B, Rarey M, Lengauer T. Proteins: Struct. Funct.
Genet., 1999, 37, 228.

Volume 89 Number 1 | The Chemist | Page 16 © The AIC 2016. All rights reserved.
Electro Analytical Studies on the Interaction and Corrosion Inhibition of a Triazine Dimer (AMTDT) on Metallic Copper in Hydrochloric Acid Shainy K.M. and Abraham Joseph* Department of Chemistry, University of Calicut, Calicut University P O, Kerala, India. (*E-mail [email protected])
Abstract: The effect of corrosion inhibition of a triazine dimer (E)-4-((4-amino-6-methyl-3-thioxo-3,4-dihydro-1,2,4-triazin-5(2H)-ylidene)amino)-6-methyl-3-thioxo-3,4-dihydro-1,2,4-triazin-5(2H)-one.bis[4-amino-3-mercapto-6-methyl-1,2,4-triazin-2(H)-5(one)] (AMTDT) on copper in 0.5M, 1M and 2M HCl at different temperatures has been investigated by polarization, EIS, adsorption, surface studies, and computational calculations. The results of electrochemical impedance and Tafelpolarization measurements show that AMTDT acts as a good corrosion inhibitor. The inhibition efficiency increases with increasing concentration of AMTDT and decreases with acid concentration and temperature. AMTDT was more efficient at 313K compared to 303K and 323K. The mechanism involves adsorption and the process follows Langmuir isotherm and the adsorption process is temperature dependent. The theoretical parameters were also calculated using density functional theory at the level of B3LYP/6-31G* and found to be in support of the experimental result. Key Words: Copper, Schiff base, acid solution, adsorption, polarization, EIS.
INTRODUCTION
Selection of an effective corrosion inhibitor is very important to protect metals and metal based objects, when it is exposed to acidic or alkaline environment. Copper is a noble metal with valuable properties such as high electrical conductivity and thermal conductivity, but it undergoes corrosion in acidic and strong alkaline media. Most of the time tested inhibitors are aromatic compounds containing N, S, O, and P atoms or systems with conjugated pi electron network. The heterocyclic compounds which contain N, S, and O atoms can also form chelates with metal and form a film on the surface, which in turn prevents the attack of H+ ions, and resists corrosion [1-8]. Schiff base is another class of compounds which can act as inhibitors due to the presence of electron rich groups like >C=N- and their inhibiting efficiency is more encouraging than corresponding aldehydes and amines [9-10].
The blocking of metal surface from the corrosive medium is mainly by the adsorption of inhibitor molecules on the metal surface. The adsorption ability of metals depends on the nature and surface charge of the metal, chemical composition of electrolytes, molecular structure, and electronic characteristic of inhibitor. The process of adsorption may be of different types, (1) electrostatic attraction between charged molecules and charged metal, (2) interaction of unshared electron pairs in the molecules
with metal, (3) interaction of electron with metal, and/or (4) combination of all these processes [11-12].
Recently, some triazine molecules and their derivatives were reported to act as good corrosion inhibitors for mild steel and copper. The choice of these compounds was based on the inherent properties they possess like π-electron conjugation, abundance of heteroatom, ability of coordination, and adsorption on to copper metal [13-15].
The Chemist Journal of the American Institute of Chemists

© The Author 2016. All rights reserved. Volume 89 Number 1 | The Chemist | Page 17
The present study aims to investigate the effect of inhibitor, (E)-4-((4-amino-6-methyl-3-thioxo-3,4-dihydro-1,2,4-triazin-5(2H)-ylidene)amino)-6-methyl-3-thioxo-3,4-dihydro-1,2,4-triazin-5(2H)-one, a triazine dimer on copper corrosion in 0.5M, 1M and 2M HCl solutions, using electrochemical techniques such as electrochemical impedance spectroscopy and Tafel polarization. The mechanism of inhibition was ascertained by scanning electron microscopy and adsorption studies. In order to investigate the relationship between the inhibitor efficiency and structure of the molecule, some quantum chemical parameters such as HOMO and LUMO energies, charge density on adsorption center, and dipole momentetc have been calculated.
EXPERIMENTAL METHODS Synthesis of Inhibitor Molecule AMTDT
The inhibitor molecule, AMTDT, was synthesized by
a three stage reaction. In the first stage, carbon disulfide (E. Merck Germany) reacted with hydrazine mono hydrate (E. Merck) to form thiocarbohydrazide. The thiocarbohydrazide reacted with 2-oxopropionicacid (E. Merck) which led to the formation of [4- amino 3-mercapto 6-methyl -1, 2, 4-triazin 2(H)- 5one] in the second stage [16-17]. At the final stage, [ 4- amino 3-mercapto 6-methyl -1,2,4-triazin 2(H)- 5one] dimerized to form (E)-4-((4-amino-6-methyl-3-thioxo-3,4-dihydro-1,2,4-triazin-5(2H)-ylidene)amino)-6-methyl-3-thioxo-3,4-dihydro-1,2,4-triazin-5(2H)-one in the presence of conc. HCl and ethanol under reflex for 4 hours. The product was re-crystallized from alcohol and characterized by spectral and elemental analysis. The compound was soluble in HCl and was used for the investigation. Synthesis of AMTDT is shown in Scheme 1.
Material and Medium
The copper specimens of dimensions 2.8x1.9cm2 were
selected and polished with different grade emery papers followed by washing with water and acetone and were used in electrochemical measurements. The test solution was prepared from reagent grade HCl (E. Merck) and distilled water [18]. All the tests were performed in aerated medium at room temperature (303K) and high temperatures (313K and 323K).
Scheme 1. Synthesis of AMTDT
Electrochemical Measurements
The electrochemical measurements were carried out by a computer controlled electrochemical work station (ACM, UK model no.1745). It consisted of a three electrode corrosion cell with platinum foil (1 cm2 surface area), used as the auxiliary electrode, and saturated calomel electrode (SCE) as the reference electrode. The working electrode was a copper metal piece, which was immersed in the test solution firstly. Prior to the electrochemical measurements, a stabilization period of 60 minutes was allowed to attain a stable value of Ecorr [19].
The electrochemical impedance measurements were carried out in a frequency range of 0.01 to 1000 Hz, with amplitude of 5mV. The impedance diagrams were plotted in the Nyquist representation. The double layer capacitance (Cdl) calculated [20] from the equation:
where fmax is the frequency at which the imaginary component of impedance is maximum.
The percentage inhibition efficiency (IE %) was calculated from charge transfer resistance by the equation:

Volume 89 Number 1 | The Chemist | Page 18 © The Author 2016. All rights reserved.
where R’c t and Rc t are the charge-transfer resistance in the presence and absence of inhibitor AMTDT.
The potentiodynamic polarization was carried out from the cathodic potential -250mV verses Ecorrto anodic potential of +250mV verses Ecorr, with a scan rate 1mV/s. The linear Tafel segments of the cathodic and anodic curves were extrapolated to corrosion potential, to obtain the corrosion current densities, which were used to calculate inhibition efficiency.
The percentage inhibition efficiency was calculated from the equation of polarization measurements:
where Icorr* and Icorr are the corrosion current densities of the inhibited and uninhibited copper metal. Surface Characterization
The scanning electron microscopy measurements of
the metal specimens were done in Hitachi SU 6600, instrument at an accelerating voltage 20.0Kv and at a 500X magnification. The metal specimens were immersed in acid solution containing optimum concentration of inhibitor for 4 hours, and then removed, rinsed with acetone and dried, and used for measurements. Computational Studies
The quantum chemical calculations were performed
with complete geometry optimization of the inhibitor molecule using density functional theory at B3LYP/6-31G* level and the frequency calculation was also done with the same level of DFT to get energy minima using Gaussian 03 software package. The energies of the frontier molecular orbital (HOMO and LUMO) can be used to calculate and interpret the adsorption characteristics of the inhibitor molecule.
According to Koopman’s theorem, the following theoretical relations can be arrived between the chemical potential of molecule, such as ionization potential, electron affinity, electronegativity, hardness, softness, and corresponding Frontier molecular orbitals, and have been well established in conceptual density functional theory [21].
The fraction of electro transferred from the inhibitor
to the metal surface can be predicted as:
where χm and χinh represents the electro negativity of Fe and inhibitor molecule and ηm and ηinh are the hardness of the metal and inhibitor, respectively. Theoretically, we assume that the value of χFe is 7.0eV and ηFe is zero.
RESULTS & DISCUSSION Characterization of (E)-4-((4-amino-6-methyl-3-thioxo-3, 4-dihydro-1, 2, 4-triazin-5(2H)-ylidene) amino)-6-methyl-3-thioxo-3, 4-dihydro-1, 2, 4-triazin-5(2H)-one
The synthesized inhibitor AMTDT was characterized
by elemental analysis, FTIR, 1H NMR, and Mass spectra. CHNS (%) found (calculated) C: 32.34 (32.21), H: 2.63
(3.38), N: 37.62 (37.58), S: 19.11 (21.47). FTIR (KBr); = 1662cm-1 (C=N- stretch), 1235 and 891cm-1 (C=S stretch), 1128 cm-1 (N-N stretch), 2907cm-1 (C-H stretch), 3216 cm-1 (N-H stretch). The 1HNMR spectrum of AMTDT in
dmso-d6, (Fig.1) shows the chemical shifts (/ppm) at = 6.45ppm assignable to secondary N-H proton. A singlet of
three protons at =2.17ppm was assignable to methyl protons.
Mass spectrum of AMTDT was recorded HRMS-FAB method and is represented in Fig.2. It shows the molecular ion peak at m/z 298.68 (41%) with a base beak atm/z 215.21 (100.00 %). This is in addition to the other significant peaks at m/z 197.25 (60 %), 280.23 (67 %), 109 (63%), 179.24 (30 %), 149.23 (39 %).

© The Author 2016. All rights reserved. Volume 89 Number 1 | The Chemist | Page 19
Fig 1. 1HNMR Spectra of AMTDT
Fig 2. MASS Spectra of AMTDT
Electrochemical Impedance Spectroscopy (EIS) The impedance measurements were carried out after
an immersion time of one hour in 0.5M, 1M and 2M HCl solutions at 303K, 313K, and 323K in the presence and absence of different concentrations of AMTDT. The results were recorded as Nyquist plots. It contains semicircles whose size increases with increasing inhibitor concentration and a representation corresponding to 303K is given in Fig.3. The corresponding electrochemical parameters, namely the charge transfer resistance (Rct), double layer capacitance (Cdl), corrosion rate (CR mils/year), and percentage inhibition efficiency were calculated. Among these the Rct, CR (mils/year), and percentage inhibition efficiency were listed in Tables 1, 2, and 3. The values of Rct and Cdl exhibit opposite trends over the entire concentration range. The Rct values increased with increasing inhibitor concentration, which indicates considerable surface coverage by the inhibitor and a bonding between the surface of the metal to the inhibitor [22].The decrease in Cdl value suggests that strong adsorption of the inhibitor on the surface of copper, which revealed that an increase in the thickness of the protective layer. The mechanism of adsorption involves blocking of reaction sites on the surface by adsorbing the inhibitor [23-26], which increases with concentration of inhibitor and decreases with temperature. But at higher temperature 323K, the Cdl values indicate that there is a weak adsorption on the metal.
Table 1. Electrochemical data for copper corrosion in different concentrations of HCl in the presence and absence of inhibitor AMTDT at 303K
Acid conc.(M)
Inhibitor conc.(ppm)
EIS Parameters Polarization Parameters Rct CR (mils/yr) %IE Icorr CR (mils/yr) %IE
0.5
Blank 349.9 68.31 ---- 0.0239 21.89 ---- 50 815.8 29.28 57 0.0039 3.54 83 100 1245 19.19 71 0.0037 3.45 84 150 1758 13.59 80 0.0024 2.24 89 200 2517 9.49 86 0.0018 1.71 92
1
Blank 494.5 48.37 ---- 0.0225 20.61 ---- 50 1050 22.21 52 0.0095 8.78 57 100 1396 17.11 64 0.0071 6.55 68 150 1641 14.56 69 0.0069 5.82 71 200 1790 13.35 72 0.0062 5.74 72
2
Blank 501.1 47.13 ---- 0.0203 18.60 ---- 50 942.4 25.35 46 0.0090 8.25 55 100 1194 20.01 58 0.0079 7.28 61 150 1275 18.74 60 0.0074 6.79 63 200 1362 17.54 63 0.0065 6.01 68

Volume 89 Number 1 | The Chemist | Page 20 © The Author 2016. All rights reserved.
Fig 3. Nyquist plots for copper corrosion in (1) 0.5M, (2) 1M, (3) 2M HCl in the absence and presence of different concentrations of
AMTDT at 303K
Tafel Polarization The potentiodynamic polarization curves for copper
in 0.5M, 1M, and 2M HCl solutions at 303K, 313K and 323K in the presence and absence of inhibitor AMTDT were recorded, and presentation corresponding to 303K shown in Fig.4. The electrochemical parameters, such as corrosion potential (Ecorr), corrosion current density (Icorr) cathodic and anodic Tafel slopes (βa and βc), were obtained from the Tafel polarization plots, in which Icorr, and CR (mils/year) were listed in Tables 1, 2, and 3.
The inhibition efficiency of AMTDT increases with increasing concentration, which is the major result of polarization study and is parallel to the EIS result. In the acidic solution, cathodic reaction is the discharge of H+
ions to hydrogen gas or reduced oxygen and the anodic reaction involves the passage of metal ion from the metal solution. Generally, an inhibitor might affect either anodic or cathodic reactions or both in some cases. But in this case, the inhibitor AMTDT effect anodic and cathodic curves of polarization and shifted both to lower current densities and AMTDT act as a mixed type inhibitor [27].
The investigation of the effect of temperature on the inhibitor has led to an important observation. The solubility of the inhibitor is low at room temperature. Therefore, at higher temperature (313K) a more effective protective layer is formed on the surface of the metal. This explains the increased efficiency of the inhibitor at 313K. But when the temperature was further increased to 323K, the efficiency was found to decrease. The adsorption of inhibitor molecules on the metal surface can be considered as a combination of physisorption and chemisorptions, with physisorption as the major contributor. The effect of physisorption decreases with increasing temperature. Therefore, as the temperature was increased, efficiency of adsorption of inhibitor molecules on to the metal surface would decrease. This explains the low inhibition efficiency of the inhibitor at 323K [28]. Thus, 313K is the optimum temperature for the inhibitor AMTDT.

© The Author 2016. All rights reserved. Volume 89 Number 1 | The Chemist | Page 21
Table 2. Electrochemical data for copper corrosion in different concentrations of HCl in the presence and absence of inhibitor AMTDT at 313K
Acid conc.(M)
Inhibitor conc.(ppm)
EIS Parameters Polarization Parameters
Rct CR (mils/yr) %IE Icorr CR (mils/yr) %IE
0.5
Blank 73.21 157.2 ---- 0.0208 19.07 ----
50 311.1 76.79 40 0.0055 5.06 73
100 459.2 52.2 76 0.0040 3.75 81
150 589.7 40.51 87 0.0026 2.4 87
200 1234 19.36 94 0.0016 1.51 94
1
Blank 109.9 217.4 ---- 0.0901 82.58 ----
50 269.2 88.74 59 0.0035 32.49 60
100 797.5 29.95 86 0.0092 8.47 89
150 1020 23.42 89 0.0070 6.47 92
200 1840 12.98 94 0.0051 4.32 94
2
Blank 102.2 233.7 ---- 0.0228 20.96 ----
50 614.1 38.90 83 0.0041 3.84 81
100 1349 17.20 90 0.0020 1.85 91
150 1517 15.54 92 0.0016 1.52 93
200 2820 8.38 93 0.0012 1.15 94
Table 3. Electrochemical data for copper corrosion in different concentrations of HCl in the presence and absence of inhibitor AMTDT at 323K
Acid conc.(M)
Inhibitor conc.(ppm)
EIS Parameters Polarization Parameters
Rct CR (mils/yr) %IE Icorr CR (mils/yr) %IE
0.5
Blank 301.3 79.29 ---- 0.0399 36.54 ----
50 910.7 26.23 66 0.0994 8.65 76
100 998.5 23.92 69 0.0790 7.24 80
150 1278 18.67 76 0.0670 6.2 83
200 5275 4.52 94 0.0021 2.00 94
1
Blank 213.2 121.1 ---- 0.0185 17.01 ----
50 348.2 96.64 39 0.0096 8.86 47
100 1171 20.40 79 0.0050 4.64 73
150 1721 13.88 86 0.0031 2.88 83
200 1983 11.27 89 0.0018 1.65 90
2
Blank 358.9 66.56 ---- 0.0121 11.09 ----
50 668.8 35.72 46 0.0058 5.38 52
100 754.9 31.16 52 0.0042 3.86 65
150 1154 20.70 68 0.0030 2.81 75
200 1882 10.95 84 0.0021 1.97 82
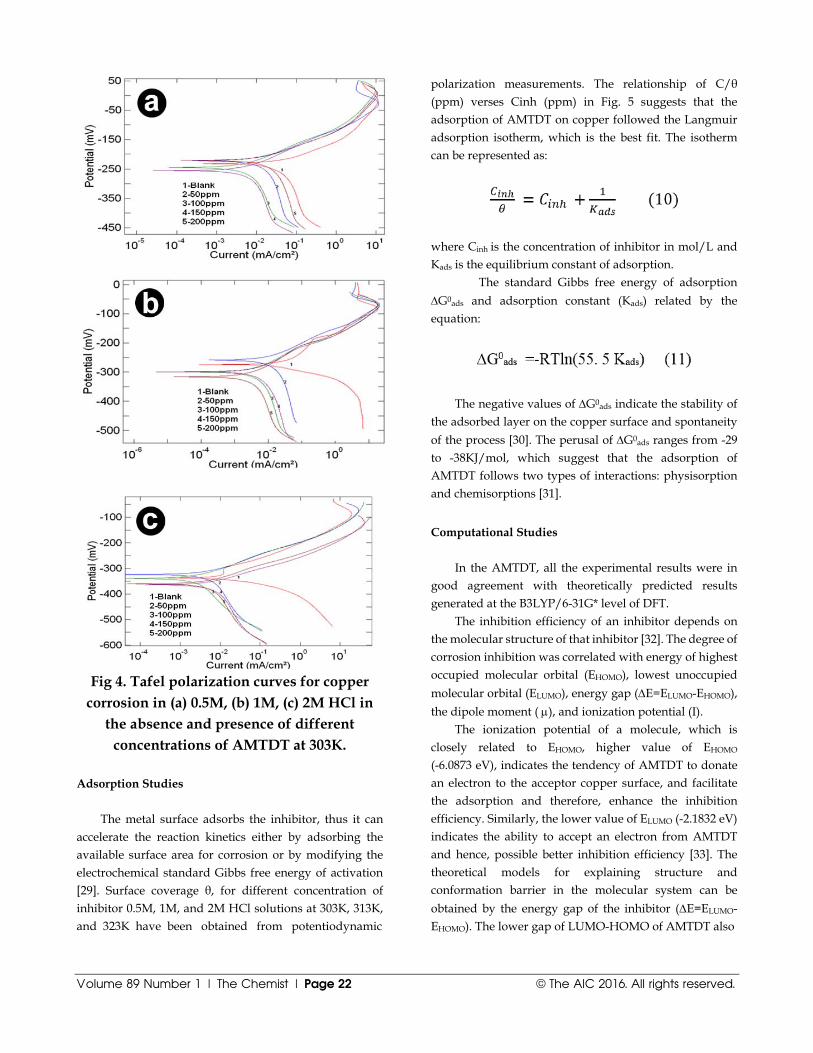
Volume 89 Number 1 | The Chemist | Page 22 © The AIC 2016. All rights reserved.
Fig 4. Tafel polarization curves for copper
corrosion in (a) 0.5M, (b) 1M, (c) 2M HCl in the absence and presence of different
concentrations of AMTDT at 303K. Adsorption Studies
The metal surface adsorbs the inhibitor, thus it can
accelerate the reaction kinetics either by adsorbing the available surface area for corrosion or by modifying the electrochemical standard Gibbs free energy of activation [29]. Surface coverage θ, for different concentration of inhibitor 0.5M, 1M, and 2M HCl solutions at 303K, 313K, and 323K have been obtained from potentiodynamic
polarization measurements. The relationship of C/θ (ppm) verses Cinh (ppm) in Fig. 5 suggests that the adsorption of AMTDT on copper followed the Langmuir adsorption isotherm, which is the best fit. The isotherm can be represented as:
where Cinh is the concentration of inhibitor in mol/L and Kads is the equilibrium constant of adsorption.
The standard Gibbs free energy of adsorption
G0ads and adsorption constant (Kads) related by the equation:
The negative values of G0ads indicate the stability of
the adsorbed layer on the copper surface and spontaneity
of the process [30]. The perusal of G0ads ranges from -29 to -38KJ/mol, which suggest that the adsorption of AMTDT follows two types of interactions: physisorption and chemisorptions [31].
Computational Studies
In the AMTDT, all the experimental results were in
good agreement with theoretically predicted results generated at the B3LYP/6-31G* level of DFT.
The inhibition efficiency of an inhibitor depends on the molecular structure of that inhibitor [32]. The degree of corrosion inhibition was correlated with energy of highest occupied molecular orbital (EHOMO), lowest unoccupied
molecular orbital (ELUMO), energy gap (E=ELUMO-EHOMO),
the dipole moment ( ), and ionization potential (I). The ionization potential of a molecule, which is
closely related to EHOMO, higher value of EHOMO (-6.0873 eV), indicates the tendency of AMTDT to donate an electron to the acceptor copper surface, and facilitate the adsorption and therefore, enhance the inhibition efficiency. Similarly, the lower value of ELUMO (-2.1832 eV) indicates the ability to accept an electron from AMTDT and hence, possible better inhibition efficiency [33]. The theoretical models for explaining structure and conformation barrier in the molecular system can be
obtained by the energy gap of the inhibitor (E=ELUMO-EHOMO). The lower gap of LUMO-HOMO of AMTDT also

© The AIC 2016. All rights reserved. Volume 89 Number 1 | The Chemist | Page 23
Fig 5. Langmuir adsorption plots for copper in (a) 0.5M, (b) 1M (c) 2M HCl in AMTDT inhibitor at 303, 303 and 323K temperature
supports the better inhibition efficiency [34]. The lower value of chemical softness (0.5123) confirms higher reactivity of AMTDT [35-36].
The dipole moment of AMTDT (1.3883 D) indicating polarity reveals the ability to donate electrons to the metal surface. The fraction of electron transferred from the AMTDT to the mild steel surface showing the higher inhibition efficiency of AMTDT. The theoretical parameters and chemical reactivity descriptors such as ionization potential, electronaffinity, hardness, and softness are demonstrated in Table 4. The optimized geometry, HOMO, LUMO of AMTDT are given in Figure 6.
Table 4. Calculated quantum chemical parameters for the Inhibitor AMTDT
Quantum chemical parameters of AMTDT
Etotal (eV) -44092.3
EHOMO (eV) -6.0873
ELUMO (eV) -2.1832
E (eV) 3.9041
I (eV) 6.0873
A (eV) 2.1832
(eV) 4.1352
(eV) 1.9520
(D) 1.3883
0.5123
N 0.7338
Fig 6. (a) Optimized molecular structure of
the inhibitor AMTDT

Volume 89 Number 1 | The Chemist | Page 24 © The AIC 2016. All rights reserved.
Fig 6. (b) Highest occupied molecular orbital
HOMO (c) Lowest unoccupied molecular orbital LUMO
The condensed atom fukui functions for electrophilic and nucleophilic attack were calculated and given in Table 5. It is clear that the most reactive electrophilic sites are S(24), C(17), N(16), and N(23) and most reactive nucleophilic sites are N(6), C(2), and N(23). Thus, it can be concluded that the data obtained from theoretical study were in agreement with that obtained from electro analytical studies.
Table 5. Condensed atom fukui functions for AMTDT
Atom (-) (+)
1C 0.0002 0.0085 2C 0.0061 0.1219 3C 0.0020 0.1064 4H 0.0000 0.0001 5N 0.0054 0.0267 6N 0.0042 0.1636 7N 0.0053 0.0531 8S 0.0016 0.0063 9N 0.0002 0.0023 10H 0.0002 0.0020 11H 0.0001 0.0023 12C 0.0002 0.0015 13H 0.0002 0.0037 14H 0.0001 0.0026 15H 0.0000 0.0001 16N 0.0188 0.0830 17C 0.0444 0.0310 18C 0.0022 0.0597 19C 0.0009 0.0927 20H 0.0053 0.0001 21N 0.0094 0.0306 22N 0.0097 0.0103 23N 0.0117 0.1124 24S 0.8633 0.0314 25C 0.0008 0.0011 26H 0.0001 0.0028 27H 0.0002 0.0031 28H 0.0001 0.0000 29O 0.0071 0.0404
SEM Analysis
The scanning electron microscopic images of the surface of copper samples were recorded in order to observe the changes that occurred during the corrosion in the absence and presence of AMTDT. The Fig.7 (a) shows the bare copper. Fig.7 (b) shows highly damaged copper specimens due to the direct attack of 0.5M HCl solution. It is clear that the surface of copper was highly corroded in the aggressive acid media. The Fig.7 (c) shows a smooth surface with the inhibitor on the surface of the copper after the addition of 200ppm inhibitor in 0.5M HCl solution. The results reveal that the protective layer formed on the surface, by means of adsorption or coordination, acts to offer excellent corrosion protection properties on 0.5M HCl solution.

© The AIC 2016. All rights reserved. Volume 89 Number 1 | The Chemist | Page 25
Fig 7. SEM images (a) Bare Copper, (b) Copper in 0.5 M HCl, (c) Copper in 0.5 M
HCl with AMTDT
CONCLUSIONS
1. The studied Schiff base AMTDT is shown to be a good inhibitor. As the concentration increases, charge transfer resistance and corrosion inhibition efficiency increases whereas the corrosion rate and double layer capacitance decreases. It is a mixed type (Cathodic/anodic) inhibitor for copper corrosion in HCl medium.
2. The inhibition process is temperature dependent, which is maximized at 313K.
3. The adsorption follows Langmuir adsorption isotherm, suggesting a multilayer formation (mixed adsorption, which is temperature dependent) on the copper surface.
4. From the SEM images, it is clear that the inhibitor molecules adsorbed on the copper surface, formed a strong protective layer in low acid concentration and weak layer in high acid concentration.
5. The computational calculations and electro analytical results confirm that the inhibitor AMTDT can act as a better inhibitor at 313K.
REFERENCES 1. Elmorsi MA, Hassanien AM. Corros. Sci., 1999, 41, 2337-
2352. 2. Bastidas JM, Pinilla P, Cano E, Polo JL, Mignel S. Corros.
Sci., 2003, 45, 427-449. 3. Tremont R, Cabrera CR. J.Appl.Electrochem. 2002, 32,
783-793. 4. Bentiss F, Traisnel M, Gengembre L, Lagrence M. Appl.
Surf. Sci., 1999, 152, 237-249. 5. Cicileo GP, Rosales BM, Varela FE, Vilche JR. Corros.
Sci., 1999, 41, 1359-1375. 6. Ye XR, Xin XQ, Zhu JJ, Xue ZL. Appl. Surf. Sci., 1998,
153, 307-317. 7. Bragmann II in Corrosion Inhibitors, Macmillan, New
York, 1963. 8. Behpour M, Ghoreishi SM, Salavati-Niasari M,
Ebrahimi B. Mater. Chem. Phys., 2008, 107, 153-157. 9. Vastag GY, Szocs E, Shaban A, Kalman E. Pure Appl.
Chem., 2001, 73, 1861-1869. 10. Aiad I, Ahmed SM, Dardir MM. J. Dispers. Sci. Tech.,
2012, 33, 317-324. 11. Yurt A, Dursn B, Dal H. Arab. J. Chem., 2010, doi:10.1016 12. Li S, Chen S, Lei S, Ma H, Yu R, Liu D. Corros. Sci., 1999,
41, 1273-1287. 13. Singh K, Kumar Y, Puri P, Sharma C, Aneja KR.
Med.Chem.Res., 2012, 21, 1708-1716. 14. John S, Joseph B, Aravindakshan KK, Joseph A. Mater.
Chem. Phys., 2010, 122, 374-379. 15. Chem J-L, Wu B, WuiGu, Cao X-F, Wen H-R, Hong R,
Liao J, Bo-Taosu. Trans. Met. Chem., 2011, 36, 379-386. 16. John S, Joseph A. RSC Adv., 2012, 2, 9944-9951. 17. Darnow A, Mengel H, Marx P. Chem. Ber., 1964, 97,
2173-2184.

Volume 89 Number 1 | The Chemist | Page 26 © The AIC 2016. All rights reserved.
18. ASTM G-31-72, In Annual Book of ASTM standard, ASTM International, West Conshohocken (PA), 1990, p 401.
19. El-Sayed, Sherif M. Appl. Surf. Sci., 2006, 252, 8615-8623. 20. Sorkhabi HA, Shaabani B, Seitzdeh D. Appl. Surf. Sci.,
2005, 239, 154-164. 21. Sastri VS, Perumareddi JR. Corrosion, 1997, 53, 617-622. 22. Kumar SLA, Gopiraman M, Kumar MS, Sreekanth A.
Ind. Eng. Chem. Res., 2011, 50, 7824-7832. 23. Champion FA in Corrosion Testing Procedure, 2nd ed.,
Champion Hall, London, 1964, p 32. 24. Zhang D-Q, Gao L-X, Zhou G-D. Appl. Surf. Sci., 2004,
225, 287-2903. 25. Ohsawa M, Suetaka W. Corros.Sci., 1979, 19, 709-722. 26. Samide A, Tutunaru B. Part A: Toxic/Hazardous
Substances and Environmental Engineering, 2011, 46, 1713- 1720.
27. Yan Y, Li W, Cai L, Hou B. Electrochem. Acta, 2008, 53, 5953-5960.
28. Li W, Zhao X, Liu F, Deng J, Hou B. Corros., 2009, 60, 287-293.
29. Morad MS. J. Appl. Electrochem., 2007, 37, 1191-1200. 30. Abdullah M. Corros. Sci., 2002, 44, 717-728. 31. John S, Mohammed Ali K, Joseph A. Bull. Mater. Sci.,
2011, 34, 1245-1256. 32. Fouda AS, Elewady GY, Abdel-Fattah AM. Protection of
Metals and Physical Chemistry of Surfaces, 2011, 47, 253-263.
33. Eddy NO. Molecular Simulation, 2010, 36, 354-363. 34. Tang Y-M, Yang W-Z, Yin X-S, Liu Y, Wan R, Wang J-
T. Meter. Chem. Phys., 2009, 116, 479-483. 35. Amin MA, Khaled KF, Fadl SA. Corros. Sci., 2010, 52,
140-151. 36. Venkata R, Gorantla, Matijevic E, Babu SV.
Chem.Mater., 2005, 17, 2076-2080.

© The AIC 2016. All rights reserved. Volume 89 Number 1 | The Chemist | Page 27
Thermal and Electrical Properties of Polyindole/ Magnetite Nanocomposites Jayakrishnan P.1, P.P. Pradyumnan2 and M.T.Ramesan1* 1Department of Chemistry, University of Calicut, Calicut University P.O., Kerala, India 673 635 2Department of Physics, University of Calicut, Calicut University P.O., Kerala, India 673 635 (*E-mail: [email protected])
Abstract: A continuation work on the fabrication of polyindole (PIN)/ magnetite (Fe3O4) nanocomposites with respect to the effect of various concentrations of Fe3O4 nanoparticles on thermal and electrical conductivity behavior is presented. Thermal stability of the nanocomposites was determined by thermal gravimetric analysis (TGA). AC conductivity behavior was investigated in the frequency range of 100- 106 Hz at room temperature and the DC conductivity was studied in the temperature range 30-2000C. TGA results indicated that the thermal stability of the nanocomposite increased with increase in Fe3O4 percentage in the polyindole. AC conductivity was significantly increased with increase in Fe3O4 content (up to 10 weight percentage) and also with the increase in frequency. Dielectric constant and dielectric loss tangent values were increased with increase in content of nanoparticles up to 10 wt. %, and thereafter the value decreased with the further addition of nanoparticles. The observed enhancement in DC conductivity was attributed to the increase in number of conduction paths formed by the interfacial interaction between the polyindole chains and the nanoparticles. The enhancement in thermal and electrical conductivity with the addition of these properties suggests that the fabricated PIN/magnetite nanocomposites can be used as materials in sensors, actuators, etc. Key Words: Polyindole, magnetite, nanocomposites, thermal properties, electrical conductivity
INTRODUCTION
Conducting polymers are important materials with applications in rechargeable batteries, sensors, electrochemical display devices, and microwave absorbing materials [1, 2]. Research in the field of these polymers has been aimed mainly at some suitable modification of existing polymers so that their performance can be improved. Conducting polymer based nanocomposites possess the advantages of both low dimensional systems (nanostructure filler) and organic conductors (conducting polymer). In recent years conducting polymer based composites containing inorganic oxides or salts of different metal nanoparticles have been of special interest due to their unique electromagnetic properties and their potential applications in several important technological fields [3, 4].
Nanometer sized iron oxide, in the crystalline form of magnetite (Fe3O4) and containing supermagnetic and
ferromagnetic properties, has received immense interest because of its numerous applications in various fields, e.g., magnetic recording media, giant magnetoresistive sensors, and photonic crystals [5,6]. Transition metal oxide nanomaterials, such as copper oxide, zinc oxide, and iron oxide, have special physico-chemical properties arising from the quantum size effect and high specific surface area, which can be different from their atomic or bulk counterparts. The large surface to volume ratio of the nanoparticles results in the formation of composites with unusual physical and chemical properties. Compared with organic polymer ferromagnets, conducting polymer–inorganic ferromagnetic composites are considered to be easier to prepare and easier to be put into use.
The majority of authors who have worked on the synthesis of conducting polymer/ Fe3O4 composites have reported that the conductivity increases with increasing the loading of fillers [7, 8]. A conducting polypyrrole–ferromagnet composite film has been prepared by means
The Chemist Journal of the American Institute of Chemists
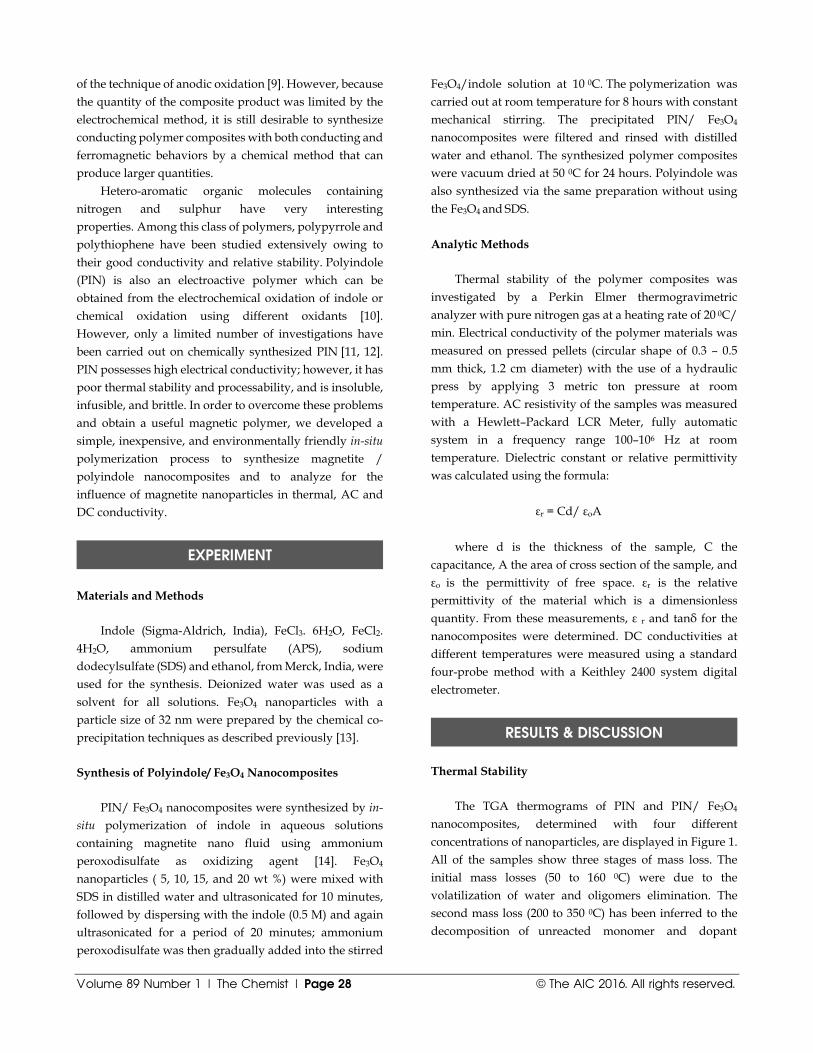
Volume 89 Number 1 | The Chemist | Page 28 © The AIC 2016. All rights reserved.
of the technique of anodic oxidation [9]. However, because the quantity of the composite product was limited by the electrochemical method, it is still desirable to synthesize conducting polymer composites with both conducting and ferromagnetic behaviors by a chemical method that can produce larger quantities.
Hetero-aromatic organic molecules containing nitrogen and sulphur have very interesting properties. Among this class of polymers, polypyrrole and polythiophene have been studied extensively owing to their good conductivity and relative stability. Polyindole (PIN) is also an electroactive polymer which can be obtained from the electrochemical oxidation of indole or chemical oxidation using different oxidants [10]. However, only a limited number of investigations have been carried out on chemically synthesized PIN [11, 12]. PIN possesses high electrical conductivity; however, it has poor thermal stability and processability, and is insoluble, infusible, and brittle. In order to overcome these problems and obtain a useful magnetic polymer, we developed a simple, inexpensive, and environmentally friendly in-situ polymerization process to synthesize magnetite / polyindole nanocomposites and to analyze for the influence of magnetite nanoparticles in thermal, AC and DC conductivity.
EXPERIMENT Materials and Methods
Indole (Sigma-Aldrich, India), FeCl3. 6H2O, FeCl2. 4H2O, ammonium persulfate (APS), sodium dodecylsulfate (SDS) and ethanol, from Merck, India, were used for the synthesis. Deionized water was used as a solvent for all solutions. Fe3O4 nanoparticles with a particle size of 32 nm were prepared by the chemical co-precipitation techniques as described previously [13]. Synthesis of Polyindole/ Fe3O4 Nanocomposites
PIN/ Fe3O4 nanocomposites were synthesized by in-situ polymerization of indole in aqueous solutions containing magnetite nano fluid using ammonium peroxodisulfate as oxidizing agent [14]. Fe3O4 nanoparticles ( 5, 10, 15, and 20 wt %) were mixed with SDS in distilled water and ultrasonicated for 10 minutes, followed by dispersing with the indole (0.5 M) and again ultrasonicated for a period of 20 minutes; ammonium peroxodisulfate was then gradually added into the stirred
Fe3O4/indole solution at 10 0C. The polymerization was carried out at room temperature for 8 hours with constant mechanical stirring. The precipitated PIN/ Fe3O4 nanocomposites were filtered and rinsed with distilled water and ethanol. The synthesized polymer composites were vacuum dried at 50 0C for 24 hours. Polyindole was also synthesized via the same preparation without using the Fe3O4 and SDS.
Analytic Methods
Thermal stability of the polymer composites was investigated by a Perkin Elmer thermogravimetric analyzer with pure nitrogen gas at a heating rate of 20 0C/ min. Electrical conductivity of the polymer materials was measured on pressed pellets (circular shape of 0.3 – 0.5 mm thick, 1.2 cm diameter) with the use of a hydraulic press by applying 3 metric ton pressure at room temperature. AC resistivity of the samples was measured with a Hewlett–Packard LCR Meter, fully automatic system in a frequency range 100–106 Hz at room temperature. Dielectric constant or relative permittivity was calculated using the formula:
εr = Cd/ εoA where d is the thickness of the sample, C the
capacitance, A the area of cross section of the sample, and εo is the permittivity of free space. εr is the relative permittivity of the material which is a dimensionless quantity. From these measurements, ε r and tanδ for the nanocomposites were determined. DC conductivities at different temperatures were measured using a standard four-probe method with a Keithley 2400 system digital electrometer.
RESULTS & DISCUSSION Thermal Stability
The TGA thermograms of PIN and PIN/ Fe3O4 nanocomposites, determined with four different concentrations of nanoparticles, are displayed in Figure 1. All of the samples show three stages of mass loss. The initial mass losses (50 to 160 0C) were due to the volatilization of water and oligomers elimination. The second mass loss (200 to 350 0C) has been inferred to the decomposition of unreacted monomer and dopant
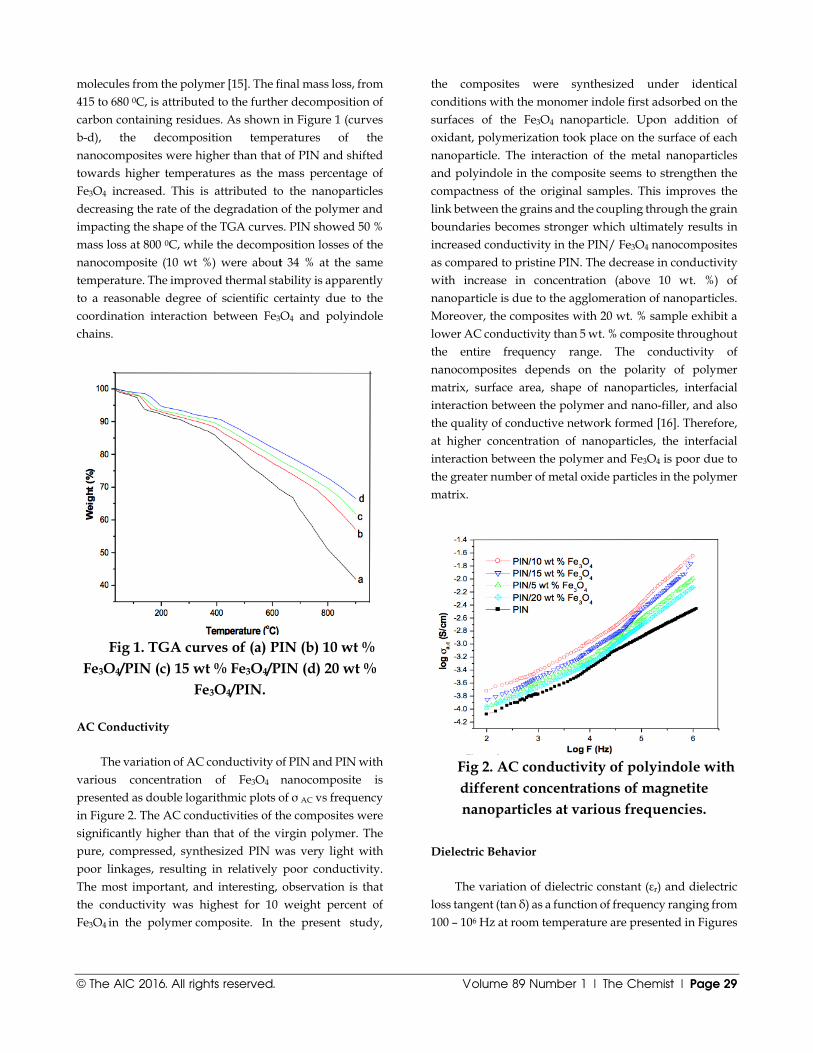
© The AIC 2016. All rights reserved. Volume 89 Number 1 | The Chemist | Page 29
molecules from the polymer [15]. The final mass loss, from 415 to 680 0C, is attributed to the further decomposition of carbon containing residues. As shown in Figure 1 (curves b-d), the decomposition temperatures of the nanocomposites were higher than that of PIN and shifted towards higher temperatures as the mass percentage of Fe3O4 increased. This is attributed to the nanoparticles decreasing the rate of the degradation of the polymer and impacting the shape of the TGA curves. PIN showed 50 % mass loss at 800 0C, while the decomposition losses of the nanocomposite (10 wt %) were about 34 % at the same temperature. The improved thermal stability is apparently to a reasonable degree of scientific certainty due to the coordination interaction between Fe3O4 and polyindole chains.
Fig 1. TGA curves of (a) PIN (b) 10 wt %
Fe3O4/PIN (c) 15 wt % Fe3O4/PIN (d) 20 wt % Fe3O4/PIN.
AC Conductivity
The variation of AC conductivity of PIN and PIN with various concentration of Fe3O4 nanocomposite is presented as double logarithmic plots of σ AC vs frequency in Figure 2. The AC conductivities of the composites were significantly higher than that of the virgin polymer. The pure, compressed, synthesized PIN was very light with poor linkages, resulting in relatively poor conductivity. The most important, and interesting, observation is that the conductivity was highest for 10 weight percent of Fe3O4 in the polymer composite. In the present study,
the composites were synthesized under identical conditions with the monomer indole first adsorbed on the surfaces of the Fe3O4 nanoparticle. Upon addition of oxidant, polymerization took place on the surface of each nanoparticle. The interaction of the metal nanoparticles and polyindole in the composite seems to strengthen the compactness of the original samples. This improves the link between the grains and the coupling through the grain boundaries becomes stronger which ultimately results in increased conductivity in the PIN/ Fe3O4 nanocomposites as compared to pristine PIN. The decrease in conductivity with increase in concentration (above 10 wt. %) of nanoparticle is due to the agglomeration of nanoparticles. Moreover, the composites with 20 wt. % sample exhibit a lower AC conductivity than 5 wt. % composite throughout the entire frequency range. The conductivity of nanocomposites depends on the polarity of polymer matrix, surface area, shape of nanoparticles, interfacial interaction between the polymer and nano-filler, and also the quality of conductive network formed [16]. Therefore, at higher concentration of nanoparticles, the interfacial interaction between the polymer and Fe3O4 is poor due to the greater number of metal oxide particles in the polymer matrix.
Fig 2. AC conductivity of polyindole with different concentrations of magnetite nanoparticles at various frequencies.
Dielectric Behavior
The variation of dielectric constant (εr) and dielectric loss tangent (tan δ) as a function of frequency ranging from 100 – 106 Hz at room temperature are presented in Figures

Volume 89 Number 1 | The Chemist | Page 30 © The AIC 2016. All rights reserved.
3 and 4, respectively. The dielectric constant initially decreased rapidly with increase in frequency and then, at frequencies higher this104 Hz, became nearly constant. The dielectric properties of materials are mainly analyzed in terms of their polarizabilities at a given frequency. The electron exchange between the Fe atoms of Fe3O4 and nitrogen atoms of PIN, results in local displacement of electrons in the direction of the applied field, which induces interfacial polarization. This type of polarization principally influences the low frequency (10 2 – 10 4 Hz) dielectric properties. As the frequency decreased, the time available for the drift of charge carriers increased and the observed value of dielectric constant became significantly higher than that of PIN.
Fig 3. Frequency dependence of dielectric constant of PIN with various weight percentages of Fe3O4 nanoparticles.
The dielectric constant increased with the increase in
concentration of nanoparticles up to a certain concentration (10 wt. %), but the magnitude of conductivity decreased with further addition of magnetite (i.e., 15 to 20 wt. %) (Figure 3). This can be explained on the basis of space charge polarization and reversal of the direction of polarization [17]. At higher loading of fillers, the particle-to-particle distance between the fillers was too short; therefore, the contribution to the dielectric constant by space charge polarization and rotation of the direction of polarization occurring mainly as the interface diminishes. As a result, the magnitude of the dielectric constant was lower at higher content of magnetite nanoparticles.
Figure 4 shows that the tan δ also decreased steeply with increasing frequency. At highest frequency the tan δ
became constant. At lower frequencies the tan δ values were higher for higher content of magnetite nanoparticles. This is due to the increased interaction between the nanoparticles and polymer chains leading to an ordered arrangement of the composites, which causes a space charge build up at the interfaces [18]. This accumulation of space charge leads to an increase in dielectric loss due to the movement of virtual charges that get trapped at the interface of a multi-component material with different conductivities. The dielectric loss tangent value of PIN was lower than the composites and among the composite, 10 wt. % of sample exhibited the higher dielectric values. The higher surface area of nanoparticles provide better particle to particle contact and this leads to a higher packing of chain inside the polymer composite. It was responsible for the higher tangent values. Further, the sudden decrease in dielectric constant above 10 wt. % of composite was due to the agglomeration of nanoparticles in the polymer chain. This reduces the segmental mobility and hence increases the rigidity of the chain. The improvement in electric properties suggests that the fabricated PIN/Fe3O4 nanocomposite has potential application in the fields of nanotechnology, plus multifunctional material in various electronic industries.
Fig 4. Dielectric loss tangent versus frequency plot for PIN and its
nanocomposites.
Temperature Dependent DC Conductivity Studies
The temperature dependence of the electrical
conductivity of PIN and four types PIN/Fe3O4 composites at various temperatures from 30 0C to 200 0C are given in

© The AIC 2016. All rights reserved. Volume 89 Number 1 | The Chemist | Page 31
Figure 5. Two ranges of near linear variations with applied voltage were obtained for the Fe3O4 nanoparticles incorporated PIN. In the case of the nanocomposites, the growing polymer chains were presumed uniformly adsorbed on the surface of the magnetite particles and, thereby, led to an arrangement of nanoparticles in the polymer matrix.
Fig 5. I-V characteristics of PIN and PIN
magnetite nanocomposites at different temperatures.
From the figure, it can be noted that from 30 0C to 100
0C, the conductivity values did not show much variation (>10 wt. % of nanoparticles) and increased suddenly in the temperature range from 100 0C to 200 0C. At low temperature, the polymer can behave like a hard and glassy material. PIN has a glass transition temperature (Tg) of 128 0C and a melting temperature (Tm) of 273 0C. The higher conductivity of PIN/Fe3O4 composite at higher temperatures is due to the phase transition of polymer composite from the glassy state to a rubbery region [11]. Moreover, it is important to mention here that the high value of DC conductivity above Tg is apparently attributed to the increase in the number of conduction paths created by the interaction between magnetite nanoparticles and the polymer chains.
CONCLUSIONS
Polyindole with different mass percentage of Fe3O4 (0, 5, 10, 15, and 20 wt. %) was prepared by an in situ polymerization method. TGA results indicated that the
PIN/Fe3O4 composite had better thermal stability than that of PIN and the thermal stability of the composite increased with an increase in concentration of metal oxide nanoparticles. This might be due to the interaction between the electronegative nitrogen of PIN and the magnetite nanoparticles. AC electrical conductivity, dielectric constant, and dielectric loss factor of PIN/Fe3O4 were studied as a function of frequency at different volume fractions of nanoparticles. The electrical properties of the composite increased with an increase in concentration of magnetite up to 10 wt.% and with further addition of nano-fillers, the conductivity was found to decrease. The higher value of conductivity of the composite was apparently due to the increased polymer filler interaction. The dielectric constant and loss factor increased with an increase in Fe3O4 weight percentage in the composite up to a certain concentration (10 wt. %) of filler. These properties (dielectric constant and loss factor) decreased with further addition of nanoparticles. The high values of the dielectric constant of the nanocomposite suggest a possible application of these materials in the field of actuators and sensors. DC conductivity of the polymer composites was higher than that of the PIN and the conductivity increased with an increase in mass percentage of magnetite nanoparticles.
ACKNOWLEDGEMENT
The authors wish to thanks Prof. K. R. Haridas, School of Chemical Science, Kannur University for providing TGA facilities in the department.
REFERENCES 1. Kawaguchi H. Prog. Polym. Sci., 2000, 25, 1171-1210. 2. Burda C, El-Sayed MA. Pure Appl. Chem., 2000, 72, 165-
177. 3. Wan F, Li L, Wan X., Xue G. J. Appl. Polym. Sci., 2002,
85, 814-820. 4. Corbacioglu B, Ismail O, Altyn Z, Keyf S, Erturan
S. Int. J. Polym. Mat., 2005, 54, 607-617. 5. Folarin OM, Sadiku ER, Maity A. Int. J. Phys. Sci., 2011,
6, 4869-4882. 6. Elsayed AH, Eldin MSM, Elsyed AM, Elazm AHA,
Younes EM, Motaweh HA. Int. J. Electrochem. Sci., 2011, 6, 206-221.
7. Jacobo SE, Aphesteguy JC, Anton RL, Schegoleva NN, Kurlyandskaya GV. Eur. Polym. J., 2007, 43, 1333-1346.

Volume 89 Number 1 | The Chemist | Page 32 © The AIC 2016. All rights reserved.
8. Ramesan MT. Int. J. Polym. Mater. Polym. Biomater. 2013, 62,277-283.
9. Yan F, Xue G, Chen J, Lu Y. Synth. Met., 2001, 123, 17-20.
10. Billaud D, Maarouf EB, Hannecart E. Mater. Res. Bull., 1994, 29, 1239-1246.
11. Ramesan M T. Polym. Compos., 2012, 33, 2169-2176. 12. Eraldemir O, Sari B, Gok A, Unal HI. J. Macromol. Sci.
Part A, Pure Appl. Chem., 2008, 45, 205-211. 13. Jayakrishnann P, Ramesan MT. AIP Conf. Proc., 2014,
1620, 165-172. 14. Ramesan MT. Adv. Polym. Tech., 2014, 32, 928-934. 15. Gangopadhyay R, De A. Chem. Mater., 2000, 12, 608-
622. 16. Nihmath A, Ramesan MT. AIP Conf. Proc., 2014, 1620,
353-359. 17. Ramesan MT. J. Thermoplast. Compos. Mater., 2015, 28,
1286-1300. 18. Kumar KR, Ravinder D. Mater. Lett., 2002, 53, 437-440.

© The AIC 2016. All rights reserved. Volume 89 Number 1 | The Chemist | Page 33
Public Understanding of Chemistry
CHEMICAL RISK AND THE PUBLIC PERCEPTION Arnold J. Frankel Aceto Corporation Presented May 25, 1989 on receipt of the New York Institute's Honor Scroll, September 1989 (Originally appeared in Frankel, A.J. (1989). Chemical risk and the public perception. The Chemist 66(9), 15. Copyright - The American Institute of Chemists)
Introduction
There was a time not too many years ago when the public held science and scientists in undisputed esteem.
Chemists, physicists, and medical researchers were respected by the public for their objectivity in the pursuit of their research by scientific methods. This objectivity was taught to students as early as junior high school. Students took pride in their pursuit of scientific studies. Chemical companies took pride in their activities--DuPont's motto was "Better things for better living-through chemistry". Chemical companies called themselves chemical companies, but today, many of the major chemical companies no longer have the word "chemical" in their name. These include such giants as the Monsanto Corp. and Union Carbide Corp. DuPont never had "chemical" as part of its name but dropped the chemistry motto some years ago. Chemistry had become a dirty word. What happened?
Part of the chemical industry's history is that it had operated in an unregulated era, when chemical companies, like everyone else, took advantage of the most economical and legal means of disposing of waste. It was burned, buried or sewered just like any other waste product; it was treated as garbage. Chemical waste was hauled away for $4 per drum. The hauler often brought the chemical waste to an industrial dumpsite where drugs and barrels of waste chemicals were unloaded and heaped onto a continuous fire. The empty, used containers were then sold and everyone was happy. It was not unusual for companies discarding chemical waste to insist that the carter assume all responsibility for the waste once his truck left the company's premises.
Changing Times About 25 years ago, though, things began to change. As a result of a growing concern about our environment,
the Federal Government established the Environmental Protection Agency. Many states established their own EPA or departments of environmental protection. Commercial practices of the past that admittedly were not in the best interest of a clean environment were now the subject of legislation. This legislation was much needed, and as responsible citizens we support it.
Public Understanding of Chemistry: Chemistry and its social-political-economic contexts continue to change. Chemistry and chemistry-based technology that impact our lives make for the complexity and controversy of life and set the stage for thinking about public understanding of chemistry. The Public Understanding of Chemistry section will try to address chemistry in real life context with original contributions (articles/position papers/policy briefs) and/or published articles and columns in reputable sources (used with permission). Founding Section Editor: David Devraj Kumar, Section Co-Editor: David M. Manuta

Volume 89 Number 1 | The Chemist | Page 34 © The AIC 2016. All rights reserved.
As a result, the word "hazardous" crept into our vocabulary as "hazardous waste" or "hazardous chemicals". We learned of PCBs, dioxins, and other carcinogens. The media--the press and television--in their zeal as investigative reporters, while exposing all the bad guys, at the same time, were exploiting the ignorance of the general population thereby creating a mood of hysteria. They publicized reports of impurities present at levels of several parts per billion; levels which are insignificant and harmless, as though they were present in hazardous amounts. Our ability to measure impurities at these low levels created the situation.
Recent hysteria was fanned by some of the publicity given to the Natural Resources Defense Council, whose name has appeared in the press recently in connection with Alar, a trade name for diarninozide, the growth regulator applied to apples (erroneously called a pesticide in most news articles). It was also deemed to be somehow, somewhat carcinogenic. The New York Times, on April 29, 1989 reported on page 1 that "Fears of Pesticides Threaten The American Way of Farming." The Times reported further that "Apple sales have dropped since the New York-based Natural Resources Defense Council (NRDC) published a report that said Alar, a chemical used to make apples crisp by controlling their ripening was carcinogenic and especially hazardous to children."
Now, what are the facts? According to Prof. Thomas Jukes at Berkeley, an award-winning cancer researcher and a consultant to the
California state advisory committee on cancer, the carcinogenicity index of the average daily intake of Alar, as measured on rodents, is 30 times smaller than 1 oz. of peanut butter, 30 times smaller than one slice of bread, and 2,800 times less than 12 oz. of beer; it is equal to that of 1 liter of chlorinated tap water.
The heads of three federal agencies also disagreed with the NRDC report and said apples are safe to eat, but their comments came too late to halt the decline in sales.
The Times article continued with this comment: "Fearful of the potential health perils and skeptical of chemical industry assurances of safety, consumers, says the Times are demanding a new quality control standard for fresh and processed products by insisting on food without any detectable pesticide residues." The article concluded with a statement by Daniel A. Botts, an official with the Florida Fruit and Vegetable Association, an Industry Trade Group in Orlando. He said, "We're being asked to reach a nonattainable and unnecessary standard of zero pesticide residues in food."
It was noted according to a recent study by the National Center for Policy Analysis of Dallas, and others, that when regulatory agencies ban products, the public often turns to other products that are even less safe.
Carcinogens Everywhere "About one-half of all the natural and man-made chemicals that have been tested will produce cancer in rats
and mice if administered in sufficiently large doses," says Richard Stroup, a Montana State University economist who coauthored the study. As a result, "When the government bans a carcinogenic chemical", he continued "there is a 50-50 chance that the substitute chemical people use will also be carcinogenic." For example, the study points out, a government ban on ethylene dibromide has removed the safest and most effective way of combating the far more dangerous carcinogen, aflatoxin, which is now infecting much of the nation's grain crop.
The International Agency for Research on Cancer, part of the World Health Organization, evaluated the
carcinogenic risk of chemicals to humans, and reported them in a series of monographs. Of two groups, the so-called 2B group exhibited a lower degree of evidence of carcinogenicity in humans than the 2A group, the group

© The AIC 2016. All rights reserved. Volume 89 Number 1 | The Chemist | Page 35
where there was a higher degree of evidence. Aflatoxin is listed in the 2A group. Ethylene dibromide, and incidentally both polychlorinated biphenyls and tetra-chloro dibenzopara-dioxin (commonly mis-named dioxin), are all in the 2B group, the one with the lower degree of evidence.
I should note that there was a refreshing exception to the media's general inability to assess risk in the editorial position taken recently by The New York Times, advocating operation of the Shoreham Nuclear plant on Long Island. The Times noted that the flip side of dismantling Shoreham was: (1) a CO2 buildup in the atmosphere caused by buring oil in a new plant that would have to be built, (2) acceleration of the depletion rate of oil reserves, and (3) exacerbation of the "acid rain" problem. And, in addition, asks the Times, who is going to pay for the trashing of the five billion dollar plant? And where will the energy of the future come from? I might add that the same people, who distrust technology, look to future scientists to perform magic with the winds and the tides as economical sources of energy. However, we can be optimistic that solar energy could begin to be economically viable for some small part of energy requirements by the mid-1990s.
Another example of the public's inability to assess risk sensibly is the massive waste disposal problem-not industrial waste, but household waste. The choices at present are burial at sea or burial in landfills. As these reach their capacity, incinerators become the major remaining option, but N.Y.C. will bank the 2M odd remaining building incinerators in the next four years. Recycling a portion of the waste is possible, but its potential is overestimated by those opposed to incinerators.
In all these examples, the assumption is that zero risk is a serious option in the real world. Yet everyone knows that we take risks in everyday life by climbing a ladder at home, by stepping into a bathtub, by crossing the street, by driving a car or riding in an airplane. Yet our legislators, who view re-election as a major goal, will advocate risk-free environment, as if it were a serious option. Suffolk County on Long Island was so emotionally charged by the prospect of an operating nuclear energy plant at Shoreham, that no legislator, Republican or Democrat, Liberal or Conservative would dare be Shoreham's proponent. The voices of technology and science that seriously assess relative risks, were drowned out.
Now, why am I reciting all this to you, most of which you probably already know? As award-winning students, as leaders of the future, you have a responsibility to be sure you are heard, loud and clear. Scientists can, and often do disagree, but we cannot allow the media, or an anti-science segment in our population to substitute emotion, fear, or hysteria for fact. You have to be the voice that will explain things to the non-science public. There will be opportunities in social situations, in your community, and even politically to add your voices. As chemists and scientists you can help bring reason and balance to public opinion and restore the respect and esteem that science deserves. You have an important task ahead. Let me wish you success.
Note: Originally appeared in Frankel, A.J. (1989). Chemical risk and the public perception. The Chemist 66(9), 15. Copyright - The American Institute of Chemists

Volume 89 Number 1 | The Chemist | Page 36 © The AIC 2016. All rights reserved.
The AIC Code of Ethics Approved by the AIC Board of Directors, April 29, 1983
The profession of chemistry is increasingly important to the progress and the welfare of the community. The Chemist is frequently responsible for decisions affecting the lives and fortunes of others. To protect the public and maintain the honor of the profession, the American Institute of Chemists has established the following rules of conduct. It is the Duty of The Chemist:
1. To uphold the law; not to engage in illegal work nor cooperate with anyone so engaged;
2. To avoid associating or being identified with any enterprise of questionable character;
3. To be diligent in exposing and opposing such errors and frauds as The Chemist’s special knowledge brings to light;
4. To sustain the institute and burdens of the community as a responsible citizen;
5. To work and act in a strict spirit of fairness to employers, clients, contractors, employees, and in a spirit of personal helpfulness and fraternity toward other members of the chemical profession;
6. To use only honorable means of competition for professional employment; to advertise only in a dignified and factual manner; to refrain from unfairly injuring, directly or indirectly, the professional reputation, prospects, or business of a fellow Chemist, or attempting to supplant a fellow chemist already selected for employment; to perform services for a client only at rates that fairly reflect costs of equipment, supplies, and overhead expenses as well as fair personal compensation;
7. To accept employment from more than one employer or client only when there is no conflict of interest; to accept commission or compensation in any form from more than one interested party only with the full knowledge and consent of all parties concerned;
8. To perform all professional work in a manner that merits full confidence and trust; to be conservative in estimates, reports, and testimony, especially if these are related to the promotion of a business enterprise or the protection of the public interest, and to state explicitly any known bias embodied therein; to advise client or employer of the probability of success before undertaking a project;
9. To review the professional work of other chemists, when requested, fairly and in confidence, whether they are:
a. subordinates or employees b. authors of proposals for grants or contracts c. authors of technical papers, patents, or other publications d. involved in litigation;
10. To advance the profession by exchanging general information and experience with fellow Chemists and by contributing to the work of technical societies and to the technical press when such contribution does

© The AIC 2016. All rights reserved. Volume 89 Number 1 | The Chemist | Page 37
not conflict with the interests of a client or employer; to announce inventions and scientific advances first in this way rather than through the public press; to ensure that credit for technical work is given to its actual authors;
11. To work for any client or employer under a clear agreement, preferable in writing, as to the ownership of data, plans, improvements, inventions, designs, or other intellectual property developed or discovered while so employed, understanding that in the absence of a written agreement:
a. results based on information from the client or employer, not obtainable elsewhere, are the property of the client or employer
b. results based on knowledge or information belonging to The Chemist, or publicly available, are the property of The Chemist, the client or employer being entitled to their use only in the case or project for which The Chemist was retained
c. all work and results outside of the field for which The Chemist was retained or employed, and not using time or facilities belonging to a client or employer, are the property of The Chemist;
12. Special data or information provided by a client or employer, or created by The Chemist and belonging to the client or employer, must be treated as confidential, used only in general as a part of The Chemist’s professional experience, and published only after release by the client or employer;
13. To report any infractions of these principles of professional conduct to the authorities responsible for enforcement of applicable laws or regulations, or to the Ethics Committee of The American Institute of Chemists, as appropriate.

Volume 89 Number 1 | The Chemist | Page 38 © The AIC 2016. All rights reserved.
Manuscript Style Guide
The Chemist is the official online refereed journal of The American Institute of Chemists (AIC). We accept submissions from all fields of chemistry defined broadly (e.g., scientific, educational, socio-political). The Chemist will not consider any paper or part of a paper that has been published or is under consideration for publication anywhere else. The editorial office of The Chemist is located at: The American Institute of Chemists, Inc. 315 Chestnut Street Philadelphia, PA 19106-2702, Email: [email protected].
Categories of Submissions
RESEARCH PAPERS
Research Papers (up to ~5000 words) that are original will only be accepted. Research Papers are peer-reviewed and include an abstract, an introduction, up to 5 figures or tables, sections with brief subheadings and a maximum of approximately 30 references.
REPORTS
Reports (up to ~3000 words) present new research results of broad interest to the chemistry community. Reports are peer- reviewed and include an abstract, an introductory paragraph, up to 3 figures or tables, and a maximum of approximately 15 references.
BRIEF REPORTS
Brief Reports (up to ~1500 words) are short papers that are peer-reviewed and present novel techniques or results of interest to the chemistry community.
REVIEW ARTICLES
Review Articles (up to ~6000 words) describe new or existing areas of interest to the chemistry community. Review Articles are peer-reviewed and include an abstract, an introduction that outlines the main point, brief subheadings for each section and up to 80 references.
LETTERS
Letters (up to ~500 words) discuss material published in The Chemist in the last 8 months or issues of general interest to the chemistry community.
BOOK REVIEWS
Book Reviews (up to ~ 500 words) will be accepted.
The Chemist Journal of the American Institute of Chemists

© The AIC 2016. All rights reserved. Volume 89 Number 1 | The Chemist | Page 39
Manuscript Preparation RESEARCH PAPERS, REPORTS, BRIEF REPORTS & REVIEW ARTICLES
The first page should contain the title, authors and their respective institutions/affiliations and the corresponding author. The general area of chemistry the article represents should also be indicated, i.e. General Chemistry, Organic Chemistry, Physical Chemistry, Chemical Education, etc.
Titles should be 55 characters or less for Research Papers, Reports, and Brief Reports. Review articles should have a title of up to 80 characters.
Abstracts explain to the reader why the research was conducted and why it is important to the field. The abstract should be 100-150 words and convey the main point of the paper along with an outline of the results and conclusions.
Text should start with a brief introduction highlighting the paper’s significance and should be understood to readers of all chemistry disciplines. All symbols, abbreviations, and acronyms should be defined the first time they are used. All tables and figures should be cited in numerical order.
Units must be used appropriately. Internationally accepted units of measurement should be used in conjunction with their numerical values. Abbreviate the units as shown: cal, kcal, µg, mg, g (or gm), %, ºC, nm, µm (not m), mm, cm, cm3, m, in. (or write out inch), h (or hr), min, s (or sec), ml [write out liter(s)], kg. Wherever commonly used units are used their conversion factors must be shown at their first occurrence. Greek symbols are permitted as long as they show clearly in the soft copy.
References and notes should be numbered in the order in which they are cited, starting with the text and then through the table and figure legends. Each reference should have a unique number and any references to unpublished data should be given a number in the text and referred to in the references. References should follow the standards presented in the AIC Reference Style Guidelines below.
REFERENCE STYLE GUIDELINES
References should be cited as numbers within square brackets [] at the appropriate place in the text. The reference numbers should be cited in the correct order throughout the text (including those in tables and figure captions, numbered according to where the table or figure is designated to appear). The references themselves are listed in numerical order at the end of the final printed text along with any Notes. Journal abbreviations should be consistent with those presented in Chemical Abstracts Service Source Index (CASSI) (http://www.cas.org) guide available at most academic libraries.

Volume 89 Number 1 | The Chemist | Page 40 © The AIC 2016. All rights reserved.
Names and initials of all authors should always be given in the reference and must not be replaced by the phrase et al. This does not preclude one from referring to them by the first author, et al in the text.
Tables should be in numerical order as they appear in the text and they should not duplicate the text. Tables should be completely understandable without reading the text. Every table should have a title. Table titles should be placed above the respective tables.
Table 1. Bond Lengths (Å) of 2-aminophenol
Figure legends should be in numerical order as they appear in the text. Legends should be limited to 250 words.
Figure 1. PVC Melt Flow Characterized by Analytical Structural Method
Letters and Book Reviews should be clearly indicated as such when being submitted. They are not peer-reviewed and are published as submitted. Legends should be placed after/under the respective figures.
Journals - The general format for citations should be in the order: author(s), journal, year, volume, page. Page number ranges are preferred over single values, but either format is acceptable. Where page numbers are not yet known, articles may be cited by DOI (Digital Object Identifier). For example:
Booth DE, Isenhour TL. The Chemist, 2000, 77(6), 7-14.
Books - For example:
Turner GK in Chemiluminescence: Applications, ed. Knox Van Dyke, CRC Press, Boca Raton, 1985, vol 1, ch. 3, pp 43-78.
Patents should be indicated in the following form:
McCapra F, Tutt D, Topping RM, UK Patent Number 1 461 877, 1973.
Reports and bulletins, etc. - For example:
Smith AB, Jones CD, Environmental Impact Report for the US, final report to the National Science Foundation on Grant AAA-999999, Any University, Philadelphia, PA, 2006.
Material presented at meetings - For example:
Smith AB. Presented at the Pittsburgh Conference, Atlantic City, NJ, March 1983, paper 101.
Theses - For example:
Jones AB, Ph.D. Thesis, Columbia University, 2004.
© The AIC 2016. All rights reserved. Volume 89 Number 1 | The Chemist | Page 41
REFERENCE TO UNPUBLISHED MATERIAL
For material presented at a meeting, congress or before a Society, etc., but not published, the following form should be used:
Jones AB, presented in part at the 20th American Institute of Chemists National Meeting, Philadelphia, PA, June, 2004.
For material accepted for publication, but not yet published, the following form should be used:
Smith AB. Anal. Chem., in press
For material submitted for publication but not yet accepted the following form should be used:
Jones AB, Anal. Chem. submitted for publication.
For personal communications the following should be used:
Smith AB, personal communication.
If material is to be published but has not yet been submitted the following form should be used:
Smith AB, unpublished work.
Reference to unpublished work should not be made without the permission of those by whom the work was performed.
Manuscript Selection The submission and review process is completely electronic. Submitted papers are assigned by the Editors, when appropriate, to at least two external reviewers anonymously. Reviewers will have approximately 10 days to submit their comments. In selected situations the review process can be expedited. Selected papers will be edited for clarity, accuracy, or to shorten, if necessary. The Editor-in-Chief will have final say over the acceptance of submissions. Most papers are published in the next issue after acceptance. Proofs will be sent to the corresponding author for review and approval. Authors will be charged for excessive alterations at the discretion of the Editor-in-Chief.
Conditions of Acceptance When a paper is accepted by The Chemist for publication, it is understood that:
• Any reasonable request for materials to verify the conclusions or experiments will be honored.
• Authors retain copyright but agree to allow The Chemist to exclusive license to publish the submission in print or online.

Volume 89 Number 1 | The Chemist | Page 42 © The AIC 2016. All rights reserved.
• Authors agree to disclose all affiliations, funding sources, and financial or management relationships that could be perceived as potential conflicts of interest or biases.
• The submission will remain a privileged document and will not be released to the public or press before publication.
• The authors certify that all information described in their submission is original research reported for the first time within the submission and that the data and conclusions reported are correct and ethically obtained.
• The Chemist, the referees, and the AIC bear no responsibility for accuracy or validity of the submission.
Authorship By submitting a manuscript, the corresponding author accepts the responsibility that all authors have agreed to be listed and have seen and approved of all aspects of the manuscript including its submission to The Chemist.
Submissions Authors are required to submit their manuscripts, book reviews, and letters electronically. They can be submitted via email at [email protected] with “Submission for consideration in The Chemist” in the subject line. All submissions should be in Microsoft® Word format.
Copyright Assignment & Warranty Form for The Chemist It is the policy of The Chemist to require all contributors to transfer the copyright for their contributions (hereafter referred to as the manuscript) to The American Institute of Chemists, Inc. (hereafter referred to as The AIC) the official publisher of The Chemist. By signing this agreement, you assign to The AIC to consider publishing your manuscript the exclusive, royalty-free, irrevocable copyright in any medium internationally for the full term of the copyright. This agreement shall permit The AIC to publish, distribute, create derivative works, and otherwise use any materials accepted for publication in The Chemist internationally. A copy of the Copyright and Warranty Form for The Chemist will be sent to the author(s) whose manuscript is accepted for publication. The AIC will not publish any accepted manuscript in The Chemist without its author(s) fully complying with this requirement.
For further information or if you can any questions please contact the Publisher of The Chemist at (215) 873-8224 or via email at [email protected].
Website: http://www.theaic.org/ Email: [email protected] Phone: 215-873-8224

© The AIC 2016. All rights reserved. Volume 89 Number 1 | The Chemist | Page 43
Announcements INVITATION TO AUTHORS
Authors are invited to submit manuscripts for The Chemist, the official online refereed journal of The American Institute of Chemists (AIC). We accept submissions from all fields of chemistry defined broadly (e.g., scientific, educational, socio-political). The Chemist will not consider any paper or part of a paper that has been published or is under consideration for publication anywhere else.
Research Papers (up to ~5000 words) that are original will only be accepted. Research Papers are peer-reviewed and include an abstract, an introduction, up to 5 figures or tables, sections with brief subheadings and a maximum of approximately 30 references.
Reports (up to ~3000 words) present new research results of broad interest to the chemistry community. Reports are peer- reviewed and include an abstract, an introductory paragraph, up to 3 figures or tables, and a maximum of approximately 15 references.
Brief Reports (up to ~1500 words) are short papers that are peer-reviewed and present novel techniques or results of interest to the chemistry community.
Review Articles (up to ~6000 words) describe new or existing areas of interest to the chemistry community. Review Articles are peer-reviewed and include an abstract, an introduction that outlines the main point, brief subheadings for each section and up to 80 references.
Letters (up to ~500 words) discuss material published in The Chemist in the last 8 months or issues of general interest to the chemistry community.
Book Reviews (up to ~ 500 words) will be accepted.
Where to Send Manuscripts? Please submit your manuscripts by email ([email protected]) to the attention of:
The Editor-in-Chief, The Chemist The American Institute of Chemists, Inc. 315 Chestnut Street Philadelphia, PA 19106-2702 Email: [email protected]

Volume 89 Number 1 | The Chemist | Page 44 © The AIC 2016. All rights reserved.
From its earliest days in 1923 to the present, the American Institute of Chemists has fostered the advancement of the chemical profession in the United States. The Institute has a corresponding dedication "to promote and protect the public welfare; to establish and maintain standards of practice for these professions; and to promote the professional experience through certification as to encourage competent and efficient service." The AIC engages in a broad range of programs for professional enhancement through the prestigious Fellow membership category, awards program, certification programs, meetings, publications and public relations activities.
Advertising: Send insertion orders and advertising materials to AIC. Visit The AIC
Web site for additional information at www.TheAIC.org.
The American Institute of Chemists, Inc. 315 Chestnut Street, Philadelphia, PA 19106-2702. Phone: (215) 873-8224 | Fax: (215) 629-5224 | E-mail: [email protected]
American Institute of Chemists www.TheAIC.org


