Embed Size (px)
Citation preview
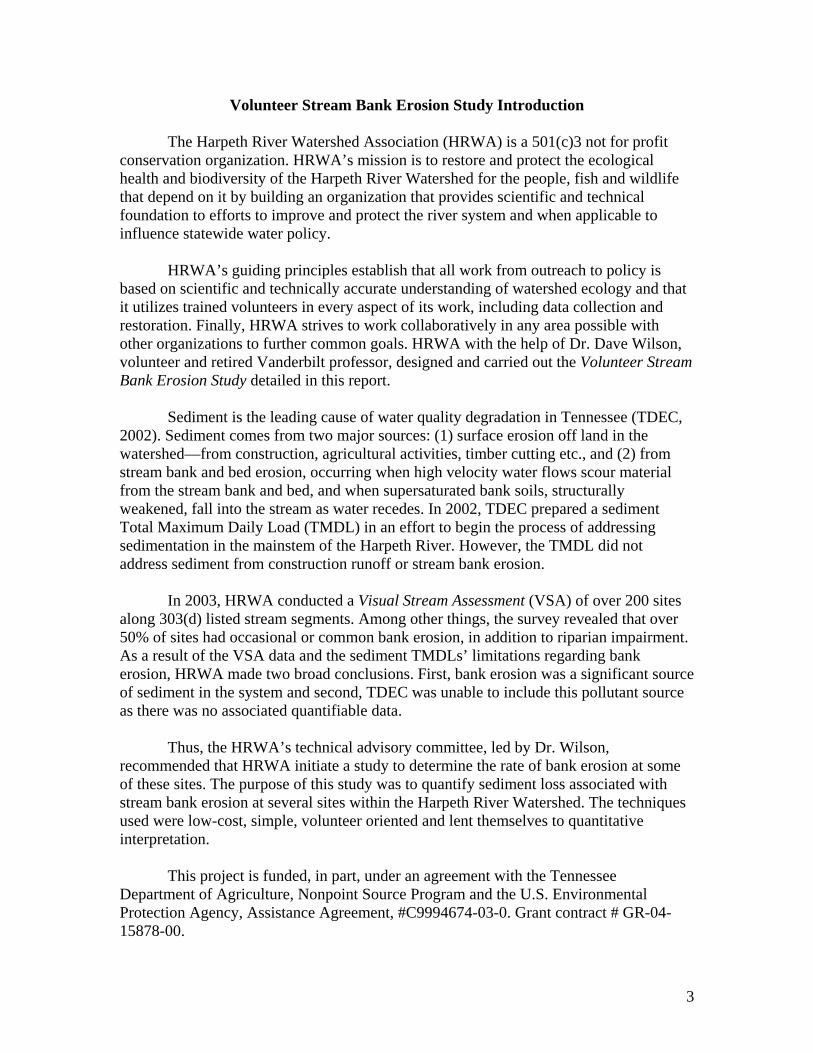
Volunteer Stream Bank Erosion Study
“So How Much Sediment Does Bank Erosion Generate?"
Harpeth River Watershed Association PO Box 1127
Franklin, Tennessee 37065 www.harpethriver.org
John McFadden
March 2007
Bank Erosion at Morton Mill Site, Bellevue, TN
2
Table of Contents
Introduction p.3
Methods and Materials p.4
Results p.5
Conclusion and Recommendations p.6-9
References p.10
Appendix I – Tables Table 1: Site Number, Location and Total Soil Loss p. 11 Table 2: Summary Data- Least to Greatest Total Soil Loss p. 11
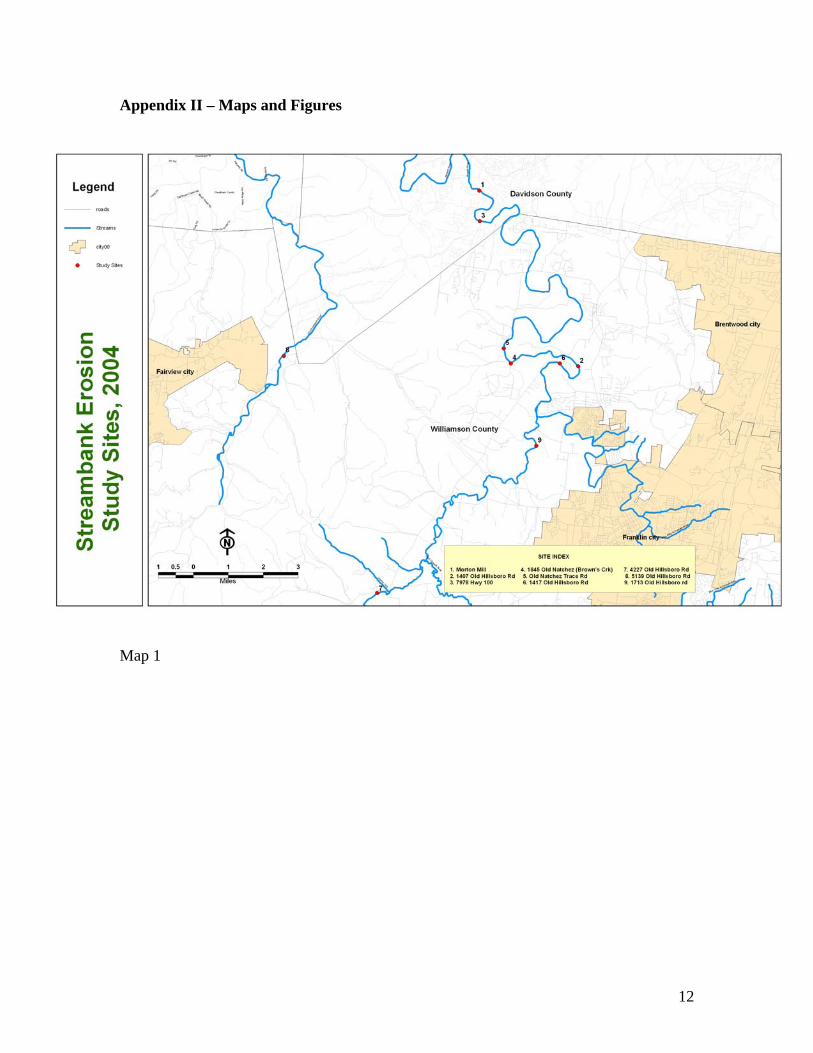
Appendix II – Maps and Figures Map 1: Streambank Erosion Study Sites p.12
Figure 1: HRWA Bank Erosion Sites Lowest to Highest Soil Loss p.13
Figure 2: Harpeth River near Bellevue, TN Site 9 Soil Loss 2002-2006 p.13
Figure 3: Harpeth River near Bellevue, TN Site 9 p.13 Figure 4: Harpeth River near Bellevue, TN Site 9 Erosion Stake on New Bank Location p.14 Figure 5: Harpeth River near Bellevue, TN Site 9 Erosion During Flood Stage p.14 Figure 6: Harpeth River at Brown’s Creek Site 1, Lowest Total Soil Loss p.15 Figure 7: Site 2, Second Lowest Total Soil Loss p.15 Figure 8: Site 5, South Harpeth River at Old Harding Road p.16
Appendix III – Protocols for Stream Bank Erosion Study p.17-20
3
Volunteer Stream Bank Erosion Study Introduction
The Harpeth River Watershed Association (HRWA) is a 501(c)3 not for profit conservation organization. HRWA’s mission is to restore and protect the ecological health and biodiversity of the Harpeth River Watershed for the people, fish and wildlife that depend on it by building an organization that provides scientific and technical foundation to efforts to improve and protect the river system and when applicable to influence statewide water policy.
HRWA’s guiding principles establish that all work from outreach to policy is
based on scientific and technically accurate understanding of watershed ecology and that it utilizes trained volunteers in every aspect of its work, including data collection and restoration. Finally, HRWA strives to work collaboratively in any area possible with other organizations to further common goals. HRWA with the help of Dr. Dave Wilson, volunteer and retired Vanderbilt professor, designed and carried out the Volunteer Stream Bank Erosion Study detailed in this report.
Sediment is the leading cause of water quality degradation in Tennessee (TDEC,
2002). Sediment comes from two major sources: (1) surface erosion off land in the watershed—from construction, agricultural activities, timber cutting etc., and (2) from stream bank and bed erosion, occurring when high velocity water flows scour material from the stream bank and bed, and when supersaturated bank soils, structurally weakened, fall into the stream as water recedes. In 2002, TDEC prepared a sediment Total Maximum Daily Load (TMDL) in an effort to begin the process of addressing sedimentation in the mainstem of the Harpeth River. However, the TMDL did not address sediment from construction runoff or stream bank erosion.
In 2003, HRWA conducted a Visual Stream Assessment (VSA) of over 200 sites
along 303(d) listed stream segments. Among other things, the survey revealed that over 50% of sites had occasional or common bank erosion, in addition to riparian impairment. As a result of the VSA data and the sediment TMDLs’ limitations regarding bank erosion, HRWA made two broad conclusions. First, bank erosion was a significant source of sediment in the system and second, TDEC was unable to include this pollutant source as there was no associated quantifiable data.
Thus, the HRWA’s technical advisory committee, led by Dr. Wilson,
recommended that HRWA initiate a study to determine the rate of bank erosion at some of these sites. The purpose of this study was to quantify sediment loss associated with stream bank erosion at several sites within the Harpeth River Watershed. The techniques used were low-cost, simple, volunteer oriented and lent themselves to quantitative interpretation.
This project is funded, in part, under an agreement with the Tennessee
Department of Agriculture, Nonpoint Source Program and the U.S. Environmental Protection Agency, Assistance Agreement, #C9994674-03-0. Grant contract # GR-04-15878-00.
4
Methods and Materials Bank erosion can be measured with a number of methods. HRWA utilized trained volunteers to collect the bank erosion data via two simple methods, the knitting needle and stake and tape method. These methods are described in detail in Appendix III. Training
Volunteer training was conducted in Franklin, Tennessee and included lecture, demonstration, and practice until participant competence was achieved. Once trained, volunteers were instructed to set up their study sites within a two-week period if possible. If the site was not set up within the two week window, HRWA staff or Dr. Wilson assisted the volunteer with site set up provided a review of methodologies. Knitting Needle Method
The knitting needle method was designed to determine stream bank erosion rates when the rates were thought to be minor. The method involved measuring the length, width and height of the bank and then “nailing” the knitting needles into the face (vertical) of the bank in a grid pattern. Volunteers were instructed to nail the needles in until only the head of the needle was visible. The grid pattern was recorded on the field data sheet. Once a flood event occurred, volunteers went back to the sites and measured the distance from the head of the needle to the new face of the bank (post erosion event). Unfortunately, this method posed two problems: 1) initial bank erosion rates were greater than the length of the needle (1 foot/needle) and 2) needles proved hard to find in the bank following flooding, as leaves and detrital material obscured them. Due to these problems, this method was abandoned.
Stake and Tape Method
The stake and tape method was generally designed for larger sites in the range of 1000 to 2000 feet in length and greater than 20 feet in height. Due to their size, these sites were not accessible from the face of the bank, but only from the top of the bank. The stake and tape method involved first collecting the length and height of the area to be studied and then setting up a grid on the top of the bank utilizing wooden stakes. Two stakes were employed, one was the reference stake utilized to measure the distance from the top of bank back and the other stake was deemed auxiliary and placed in between the reference stake and top edge of bank to assure measurements were made at the same location/direction on subsequent data collections. In addition to the auxiliary stake, a compass reading taken along the same line allowed for reestablishing the position in the event the auxiliary stake was lost. This proved helpful as several auxiliary stakes were lost even though they had been placed five to seven feet back from the top edge of the bank. Soil loss rates were calculated by finding the difference between the initial stake to bank distance and final stake to bank distance, multiplying this difference by bank length and bank height to determine soil loss in cubic feet. Soil loss, in cubic feet was divided by 27 (cubic feet per cubic yard) to determine soil loss in cubic yards.
5
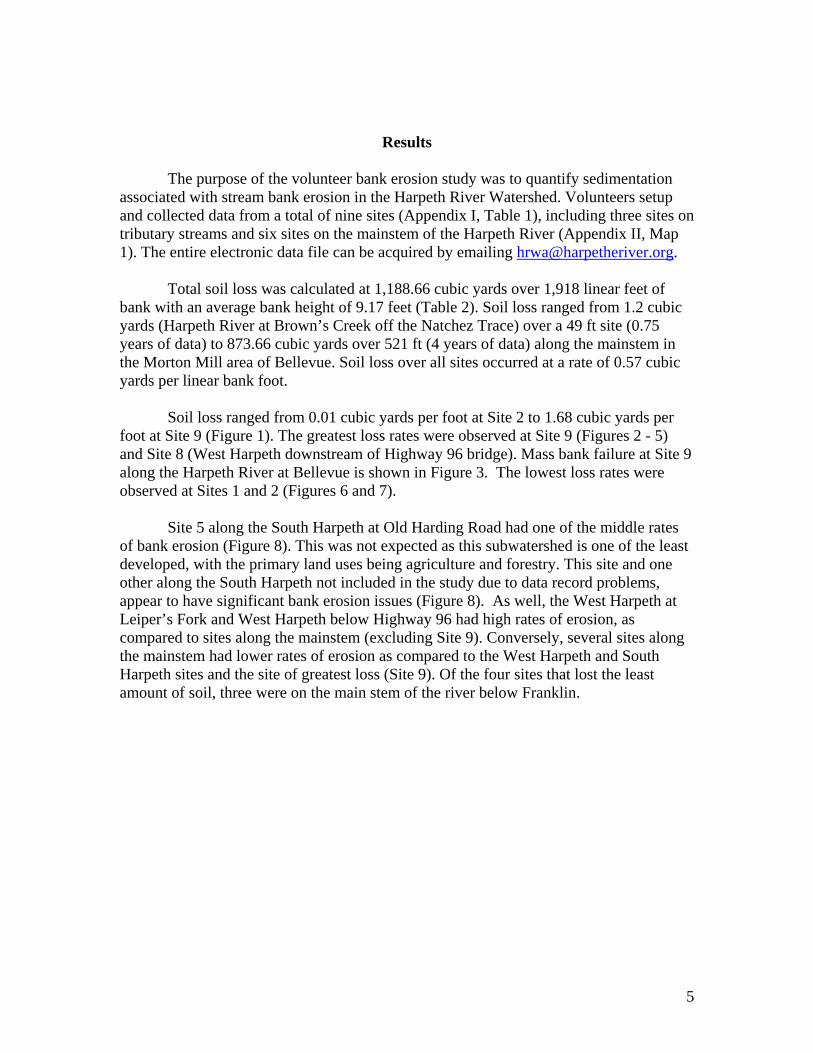
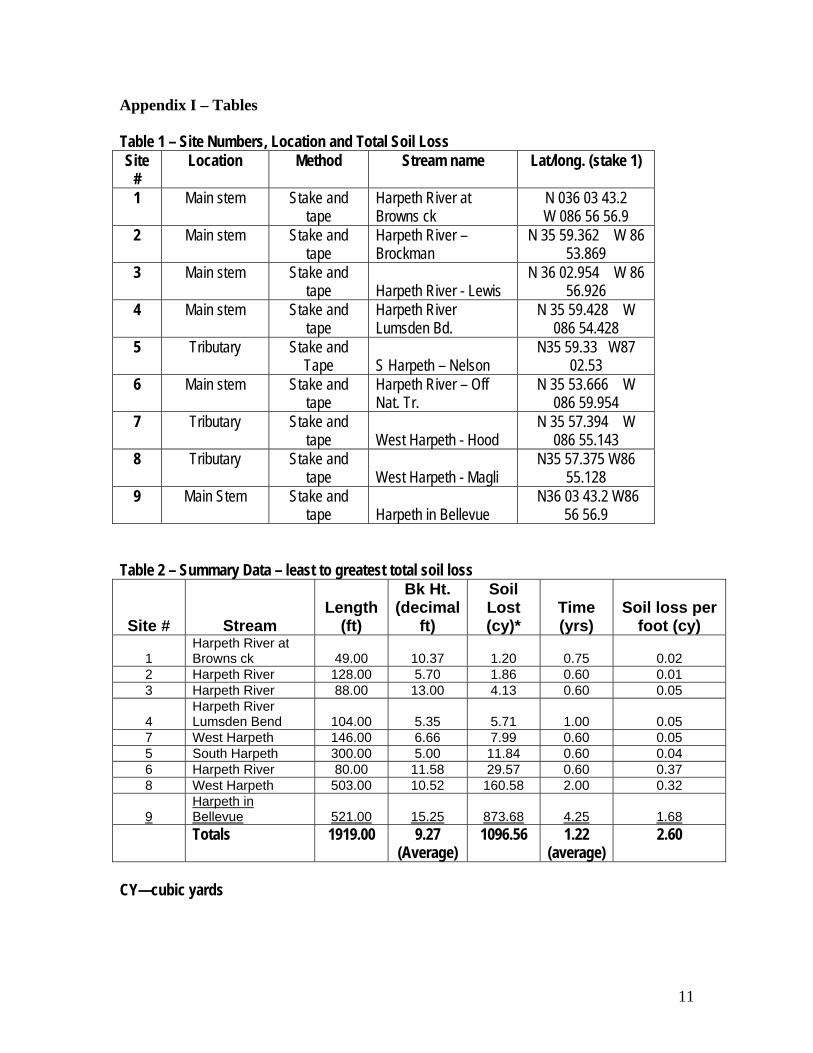
Results The purpose of the volunteer bank erosion study was to quantify sedimentation associated with stream bank erosion in the Harpeth River Watershed. Volunteers setup and collected data from a total of nine sites (Appendix I, Table 1), including three sites on tributary streams and six sites on the mainstem of the Harpeth River (Appendix II, Map 1). The entire electronic data file can be acquired by emailing [email protected]. Total soil loss was calculated at 1,188.66 cubic yards over 1,918 linear feet of bank with an average bank height of 9.17 feet (Table 2). Soil loss ranged from 1.2 cubic yards (Harpeth River at Brown’s Creek off the Natchez Trace) over a 49 ft site (0.75 years of data) to 873.66 cubic yards over 521 ft (4 years of data) along the mainstem in the Morton Mill area of Bellevue. Soil loss over all sites occurred at a rate of 0.57 cubic yards per linear bank foot.
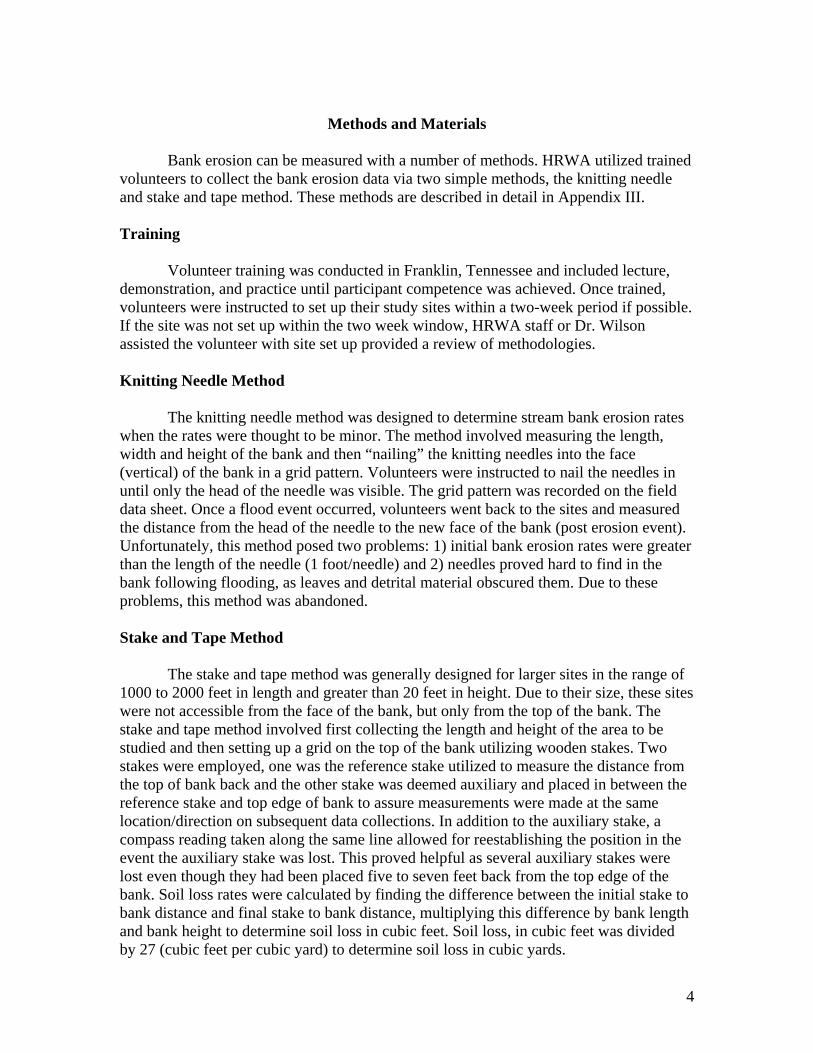
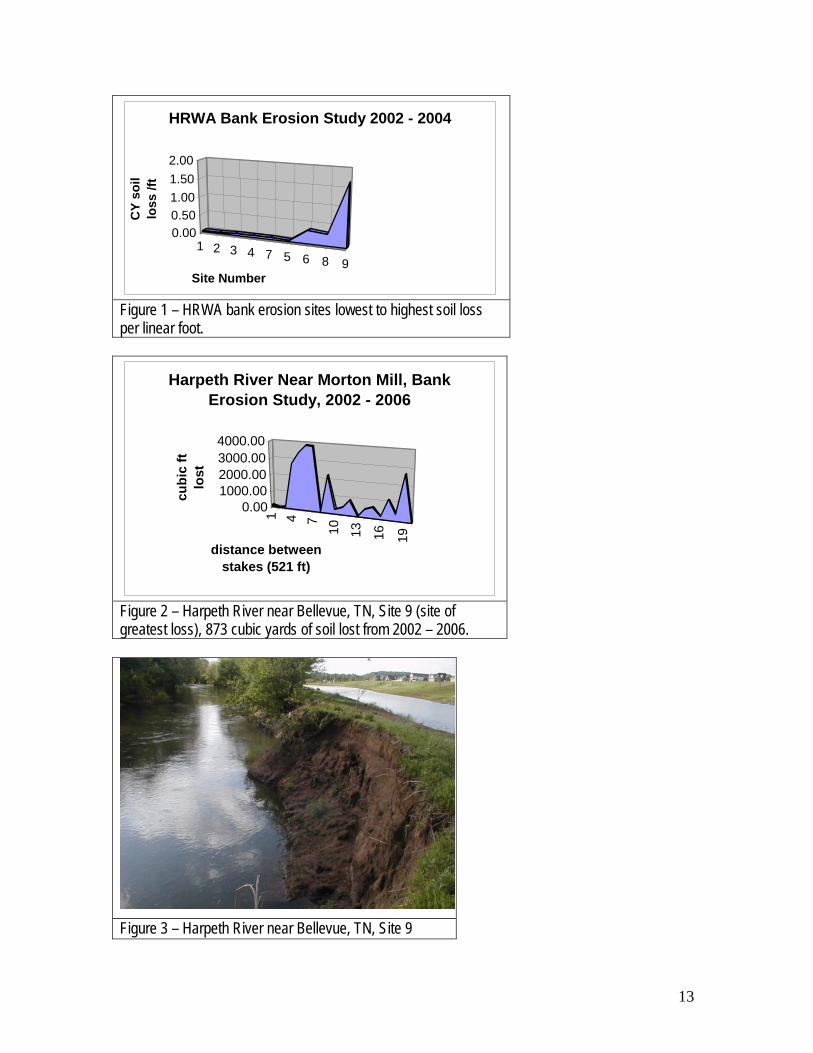
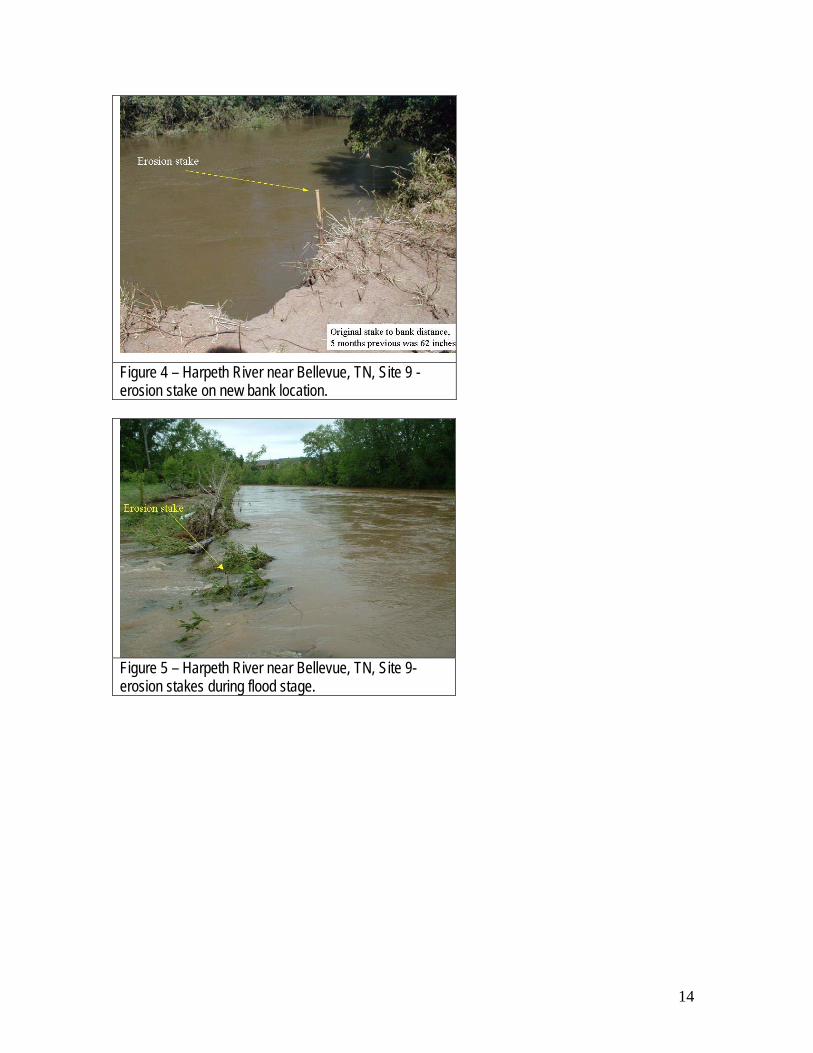
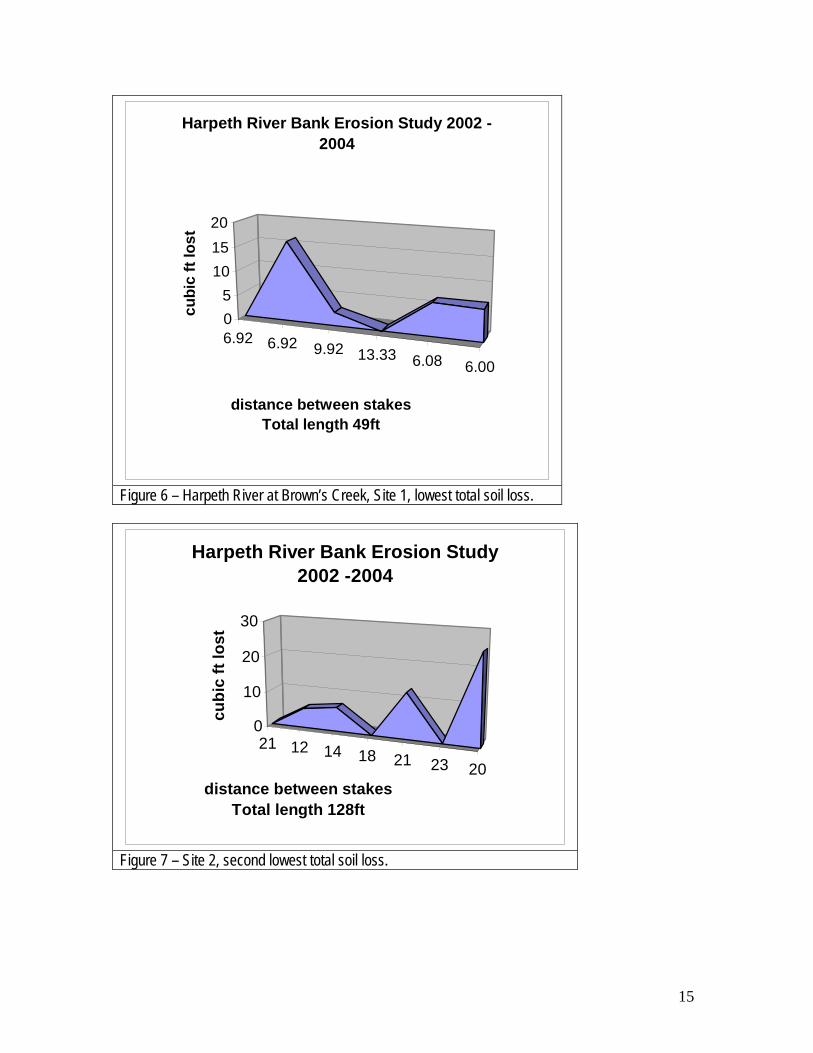
Soil loss ranged from 0.01 cubic yards per foot at Site 2 to 1.68 cubic yards per foot at Site 9 (Figure 1). The greatest loss rates were observed at Site 9 (Figures 2 - 5) and Site 8 (West Harpeth downstream of Highway 96 bridge). Mass bank failure at Site 9 along the Harpeth River at Bellevue is shown in Figure 3. The lowest loss rates were observed at Sites 1 and 2 (Figures 6 and 7).
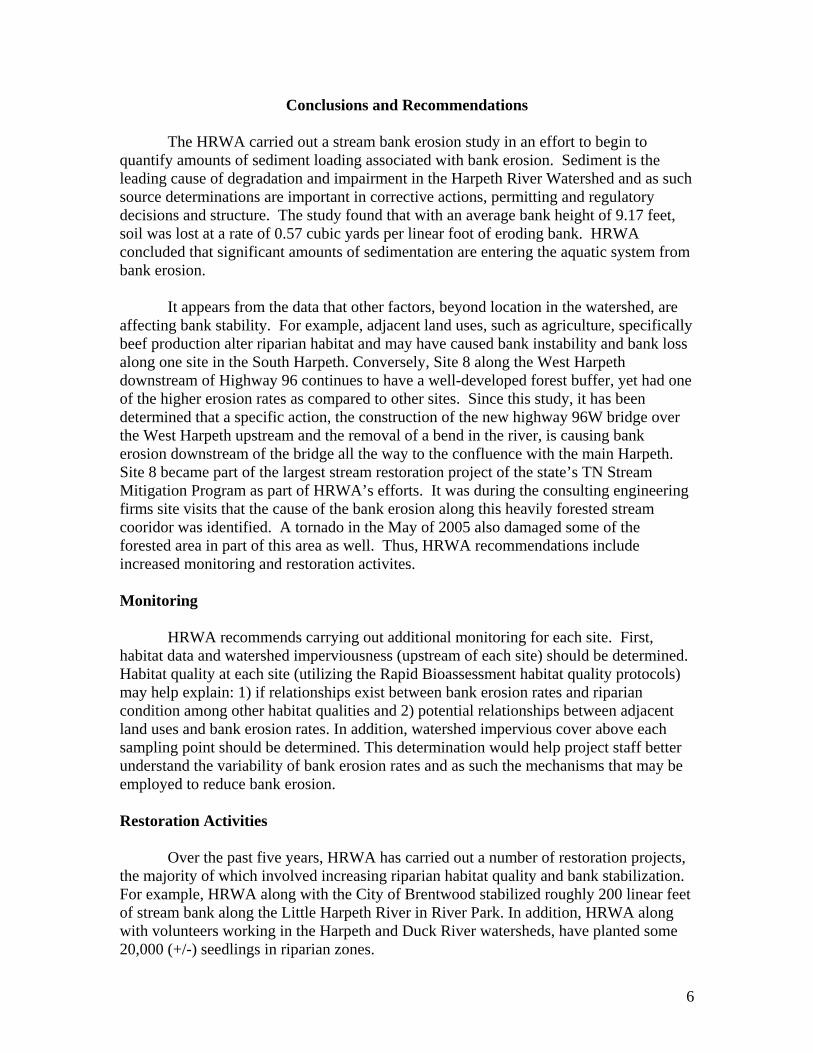
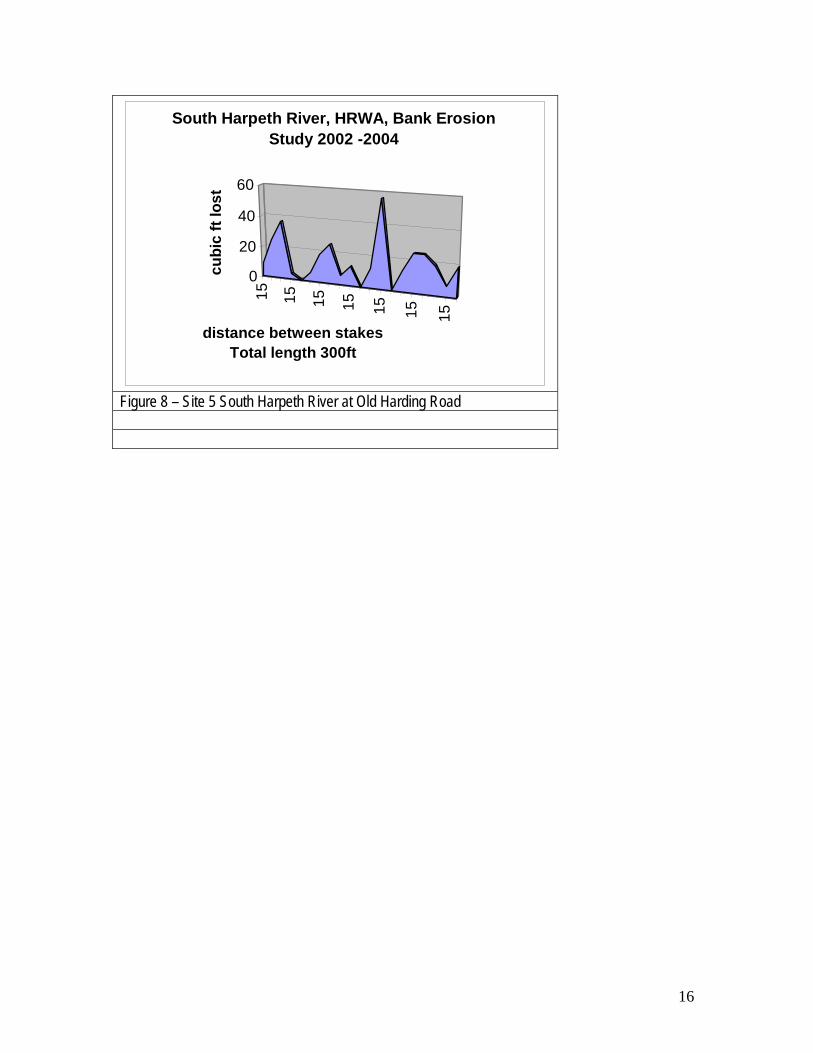
Site 5 along the South Harpeth at Old Harding Road had one of the middle rates
of bank erosion (Figure 8). This was not expected as this subwatershed is one of the least developed, with the primary land uses being agriculture and forestry. This site and one other along the South Harpeth not included in the study due to data record problems, appear to have significant bank erosion issues (Figure 8). As well, the West Harpeth at Leiper’s Fork and West Harpeth below Highway 96 had high rates of erosion, as compared to sites along the mainstem (excluding Site 9). Conversely, several sites along the mainstem had lower rates of erosion as compared to the West Harpeth and South Harpeth sites and the site of greatest loss (Site 9). Of the four sites that lost the least amount of soil, three were on the main stem of the river below Franklin.
6
Conclusions and Recommendations
The HRWA carried out a stream bank erosion study in an effort to begin to quantify amounts of sediment loading associated with bank erosion. Sediment is the leading cause of degradation and impairment in the Harpeth River Watershed and as such source determinations are important in corrective actions, permitting and regulatory decisions and structure. The study found that with an average bank height of 9.17 feet, soil was lost at a rate of 0.57 cubic yards per linear foot of eroding bank. HRWA concluded that significant amounts of sedimentation are entering the aquatic system from bank erosion.
It appears from the data that other factors, beyond location in the watershed, are affecting bank stability. For example, adjacent land uses, such as agriculture, specifically beef production alter riparian habitat and may have caused bank instability and bank loss along one site in the South Harpeth. Conversely, Site 8 along the West Harpeth downstream of Highway 96 continues to have a well-developed forest buffer, yet had one of the higher erosion rates as compared to other sites. Since this study, it has been determined that a specific action, the construction of the new highway 96W bridge over the West Harpeth upstream and the removal of a bend in the river, is causing bank erosion downstream of the bridge all the way to the confluence with the main Harpeth. Site 8 became part of the largest stream restoration project of the state’s TN Stream Mitigation Program as part of HRWA’s efforts. It was during the consulting engineering firms site visits that the cause of the bank erosion along this heavily forested stream cooridor was identified. A tornado in the May of 2005 also damaged some of the forested area in part of this area as well. Thus, HRWA recommendations include increased monitoring and restoration activites. Monitoring
HRWA recommends carrying out additional monitoring for each site. First, habitat data and watershed imperviousness (upstream of each site) should be determined. Habitat quality at each site (utilizing the Rapid Bioassessment habitat quality protocols) may help explain: 1) if relationships exist between bank erosion rates and riparian condition among other habitat qualities and 2) potential relationships between adjacent land uses and bank erosion rates. In addition, watershed impervious cover above each sampling point should be determined. This determination would help project staff better understand the variability of bank erosion rates and as such the mechanisms that may be employed to reduce bank erosion.
Restoration Activities Over the past five years, HRWA has carried out a number of restoration projects, the majority of which involved increasing riparian habitat quality and bank stabilization. For example, HRWA along with the City of Brentwood stabilized roughly 200 linear feet of stream bank along the Little Harpeth River in River Park. In addition, HRWA along with volunteers working in the Harpeth and Duck River watersheds, have planted some 20,000 (+/-) seedlings in riparian zones.
7
Riparian restoration consists of two basic activities including: 1) removal of any cause of degradation and 2) restoration of the vegetative community. In addition, some hydrologic conditions may need to be restored. Removal of the cause of degradation may include livestock or other human use exclusions and provisions for livestock alternative water supply. Once removal of degradation causes occurs, riparian (buffer) re-vegetation can occur.
The Natural Resources Conservation Service (NRCS) guidelines call for a
minimum buffer width of 35 feet along rivers and streams, however other sources call for up to 100 feet of buffer (see Wenger, 1999). HRWA should promote as wide a buffer as possible, based on land condition, landowner concerns and other factors that may apply. In an effort to leverage additional (NRCS) funds, buffers would need to be a minimum of 35 feet wide. However, because TDEC biologist (as per communication with James R. Smith) and others have observed improvements in water quality associated with one row of trees along creek banks, and because land owner objections often have to do with loss of land to graze, crop etc. HRWA should advocate for as much width as possible, but in some cases work to reestablish at least minimal riparian zones (e.g. one row of trees) for bank stabilization and shading of the stream.
Finally, it may be necessary to restore natural hydrology to the riparian zone. In
cases where aquatic systems are severely down cut, channels have formed through the riparian zone, thus bypassing the beneficial effects of sheet flow. This reduces the pollutant loads associated with riparian zones. In addition, it may be desirable to add in-stream structures to increase a systems ability to carry its bed load. For example a series of check dams, j-vanes or other appropriate structures may be used to increase velocity and/or sinuosity within an existing channel. However, in utilizing these options, one should pay particular attention to opposing banks to ensure structures do not create additional erosion. Proper installation of structures is the key to proper functioning.
Stream bank erosion is a significant problem in the Harpeth River and thus
treating all eroding stream banks may not be cost-effective or practical. HRWA recommends the following prioritization scheme: areas where specific ecologic assets, such as mature trees are located should be treated first, and then areas thought to be contributing significant soil to the system, second. For example, streams with one row of scattered trees on a highly erosive stream bank would be treated in an effort to conserve those trees providing shade and detrital material (habitat and food) to the system (ecological asset). In systems affected by sediment, long, highly erosive segments may be treated. This should provide for the greatest load reductions at the least cost. Utilizing the current study’s data the following formula can be utilized to calculate an estimated sediment load (ESL) associated with stream bank erosion:
ESL = ((bh/9.17) x 0.143) x L
Where: ESL = Sediment loss in cubic yards per foot
bh = bank height to be treated 9.17 feet = average bank height from HRWA Bank Erosion study 0.143 cubic yards = soil loss/foot per year in HRWA Bank Erosion Study L = Length of bank to be treated

8
The formula should continue to be refined and validated. For example, estimates of soil erosion should be made on stream banks and then measurements should be collected to determine the accuracy of estimates. Hopefully over time, the formula can be validated as a mechanism utilized to drive sediment load reductions via bank restoration efforts.
The primary method utilized by HRWA to treat eroding stream banks has been placement of cedar revetments, and in many cases reshaping of banks, back fill and re-vegetation. HRWA continues to utilize cedar revetments to treat banks as high as 12 feet and generally found them effective in reducing stream bank erosion (McFadden, 2005). HRWA utilizes a technique developed by Jen-Hill Construction for cedar revetments similar to that recommended by the Natural Resources Conservation Service, except cedar trees are bundled in coir matting or jute, prior to being attached to the stream bank. The matting helps capture sediment through compaction of the branches. In addition, the revetment can be backfilled and replanted immediately following installation.
HRWA believes the habitat restoration activities listed above will do much to help bring the watershed back to an unimpaired state, however if development trends and methods are not modified, the long term implications for the watershed are increased levels of impairment. Thus, HRWA strongly encourages establishment and/or maintenance of riparian buffers in developed and developing areas, maintaining natural hydrology (generally infiltration versus runoff and conveyance) and construction and post construction stormwater treatments. HRWA believes theses techniques, when strictly adhered to, have a tendency to increase water quality specifically in smaller tributaries. Field data collected following development will reflect the nature of the development techniques. For example, one study conducted by HRWA along unnamed tributaries of the Harpeth River documents degraded water quality following development infrastructure implementation (McFadden, 2004). The following development site design changes are made generally and may need to be modified based on site-specific conditions.
The goal of alternative site design is to maintain natural watershed hydrology, allowing rainwater to infiltrate into the ground versus increasing runoff. Stream bank erosion is exacerbated by increased runoff associated with roads, parking lot and rooftops (impervious cover). Reconnecting stormwater flow to ground water is the key to preventing additional bank erosion and associated water quality and habitat degradation, and more importantly, increasing the possibility for water quality enhancement in impaired systems. Thus, inclusion of pervious pavement for driveways, modified road drainage structures, biofiltration islands, and lot level stormwater retention devices can enable developed areas to come closer matching the hydrology similar to natural areas. For example, stormwater from roads can be discharged laterally (as sheet flow) into grassed swales or other permeable materials. An area could still have the curb and gutter appearance without the curb, but with a concrete (pervious or not) ribbon along the edge of roadways. In addition, rooftop drainage should be directed to rain barrels, rain gardens and/or discharged into drain fields as opposed to being directed onto impervious drive and roadways. Parking lots and/or paved areas can be constructed of pervious material for overflow and low use areas. Much information can be found on alternative development
9
site design at www.cwp.org. Finally, and perhaps most importantly, streamside (riparian) buffers are necessary for protecting and enhancing water quality, especially in maintaining bank stabilization and shading to minimize water temperature fluctuations and the effects on water chemistry that affects aquatic life..
Reestablishing and/or maintaining adequate riparian buffers along streams, and
wet weather conveyances is imperative to water and habitat quality as they provide water quality treatment, infiltration, increased channel stability and opportunities for wildlife. Natural (no human activity) buffers along perennial streams should be a minimum of 100 feet wide and along all other watercourses a minimum of 75 feet wide. Wenger (1999) suggests a width of 100 feet with an increase of two feet per degree of slope. It may be advantageous for other ecological functions (wildlife, in particular amphibians), along the mainstem of the Harpeth and major tributaries to increase the buffer to 300 feet. HRWA recommends planting buffers with native vegetation including canopy trees, understory trees, shrubs and herbaceous vegetation.
In summary, HRWA carried out the Volunteer Stream Bank Erosion Study in an
effort to quantify sedimentation associated with stream bank erosion in the Harpeth River Watershed. To that end, the data indicate that 0.39 cubic yards per foot of soil were lost along 1,918 linear feet of stream bank studied. The study was carried out by volunteers over a two year period, however due to mass bank failure and other human activities (i.e. bushogging) most sites were reestablished during the second year by project staff. The data indicate bank erosion is a significant source of sedimentation to the river system. Thus, HRWA recommends conducting additional studies to document and validate methodologies and to carry out bank restoration effectiveness.
Although the activity referenced in this publication has been financed, in part,
with the Sate and/or federal fund, the mention of trade names or commercial products does not constitute endorsement or reformation by the State or the Environmental Protection Agency.
Acknowledgments
This study would not have been possible without the efforts of Dr. Wilson to
design the project and the effort of volunteers to identify study sites and contact landowners who were willing to allow volunteers or staff to establish the study sites and
do periodic measurements. We would like to thank Conner Haugh and Ed Snyder particularly of the volunteers. Also, thanks to Eddie Bateman and Gwen Blanton who as
HRWA staff during the course of the project managed the data gathering and coordination with the volunteers.
10
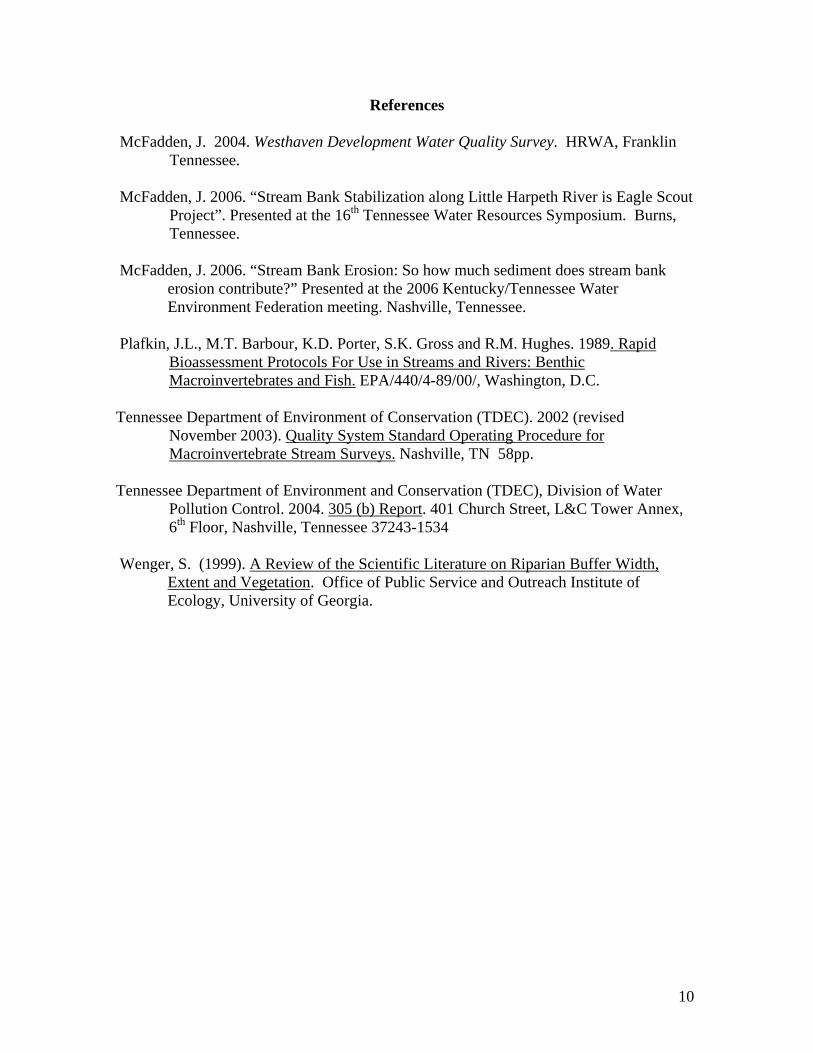
References
McFadden, J. 2004. Westhaven Development Water Quality Survey. HRWA, Franklin Tennessee.
McFadden, J. 2006. “Stream Bank Stabilization along Little Harpeth River is Eagle Scout
Project”. Presented at the 16th Tennessee Water Resources Symposium. Burns, Tennessee.
McFadden, J. 2006. “Stream Bank Erosion: So how much sediment does stream bank
erosion contribute?” Presented at the 2006 Kentucky/Tennessee Water Environment Federation meeting. Nashville, Tennessee.
Plafkin, J.L., M.T. Barbour, K.D. Porter, S.K. Gross and R.M. Hughes. 1989. Rapid
Bioassessment Protocols For Use in Streams and Rivers: Benthic Macroinvertebrates and Fish. EPA/440/4-89/00/, Washington, D.C.
Tennessee Department of Environment of Conservation (TDEC). 2002 (revised
November 2003). Quality System Standard Operating Procedure for Macroinvertebrate Stream Surveys. Nashville, TN 58pp.
Tennessee Department of Environment and Conservation (TDEC), Division of Water
Pollution Control. 2004. 305 (b) Report. 401 Church Street, L&C Tower Annex, 6th Floor, Nashville, Tennessee 37243-1534
Wenger, S. (1999). A Review of the Scientific Literature on Riparian Buffer Width,
Extent and Vegetation. Office of Public Service and Outreach Institute of Ecology, University of Georgia.
11
Appendix I – Tables
Table 1 – Site Numbers, Location and Total Soil Loss Site
# Location Method Stream name Lat/long. (stake 1)
1 Main stem Stake and tape
Harpeth River at Browns ck
N 036 03 43.2 W 086 56 56.9
2 Main stem Stake and tape
Harpeth River – Brockman
N 35 59.362 W 86 53.869
3 Main stem Stake and tape Harpeth River - Lewis
N 36 02.954 W 86 56.926
4 Main stem Stake and tape
Harpeth River Lumsden Bd.
N 35 59.428 W 086 54.428
5 Tributary Stake and Tape S Harpeth – Nelson
N35 59.33 W87 02.53
6 Main stem Stake and tape
Harpeth River – Off Nat. Tr.
N 35 53.666 W 086 59.954
7 Tributary Stake and tape West Harpeth - Hood
N 35 57.394 W 086 55.143
8 Tributary Stake and tape West Harpeth - Magli
N35 57.375 W86 55.128
9 Main Stem Stake and tape Harpeth in Bellevue
N36 03 43.2 W86 56 56.9
Table 2 – Summary Data – least to greatest total soil loss
Site # Stream Length
(ft)
Bk Ht. (decimal
ft)
Soil Lost (cy)*
Time (yrs)
Soil loss per foot (cy)
1 Harpeth River at Browns ck 49.00 10.37 1.20 0.75 0.02
2 Harpeth River 128.00 5.70 1.86 0.60 0.01 3 Harpeth River 88.00 13.00 4.13 0.60 0.05
4 Harpeth River Lumsden Bend 104.00 5.35 5.71 1.00 0.05
7 West Harpeth 146.00 6.66 7.99 0.60 0.05 5 South Harpeth 300.00 5.00 11.84 0.60 0.04 6 Harpeth River 80.00 11.58 29.57 0.60 0.37 8 West Harpeth 503.00 10.52 160.58 2.00 0.32
9 Harpeth in Bellevue 521.00 15.25 873.68
4.25 1.68
Totals 1919.00 9.27 (Average)
1096.56 1.22 (average)
2.60
CY—cubic yards
12
Appendix II – Maps and Figures Map 1
13
1 2 3 4 7 5 6 8 9
0.000.501.001.502.00
CY
soil
loss
/ft
Site Number
HRWA Bank Erosion Study 2002 - 2004
Figure 1 – HRWA bank erosion sites lowest to highest soil loss per linear foot.
1 4 710 13 16 19
0.001000.002000.003000.004000.00
cubi
c ft
lost
distance between stakes (521 ft)
Harpeth River Near Morton Mill, Bank Erosion Study, 2002 - 2006
Figure 2 – Harpeth River near Bellevue, TN, Site 9 (site of greatest loss), 873 cubic yards of soil lost from 2002 – 2006.
Figure 3 – Harpeth River near Bellevue, TN, Site 9
14
Figure 4 – Harpeth River near Bellevue, TN, Site 9 -erosion stake on new bank location.
Figure 5 – Harpeth River near Bellevue, TN, Site 9- erosion stakes during flood stage.
15
6.92 6.92 9.92 13.33 6.08 6.00
05
101520
cubi
c ft
lost
distance between stakes Total length 49ft
Harpeth River Bank Erosion Study 2002 -2004
Figure 6 – Harpeth River at Brown’s Creek, Site 1, lowest total soil loss.
21 12 14 18 21 23 20
0
10
20
30
cubi
c ft
lost
distance between stakes Total length 128ft
Harpeth River Bank Erosion Study 2002 -2004
Figure 7 – Site 2, second lowest total soil loss.
16
15 15 15 15 15 15 15
0
20
40
60
cubi
c ft
lost
distance between stakes Total length 300ft
South Harpeth River, HRWA, Bank Erosion Study 2002 -2004
Figure 8 – Site 5 South Harpeth River at Old Harding Road
17
Appendix IV - Protocols for Stream Bank Erosion Study Harpeth River Watershed Association, 05/09/02
“Knitting needle” Method
For small streams and for large streams having banks that are accessible and are not eroding very rapidly, one can use knitting needles for measuring erosion rates. Materials Needed
1. field book for recording measurements and observations 2. #2 pencils 3. a measuring tape 16 ft or more in length 4. a map (topo sheet) on which you can mark the location of the site (may
use maps available from Topozone web site.) 5. 24 knitting needles (number needed may vary with the site), at least 8” in
length, with one capped end. Must be stiff enough to permit insertion into a clay bank. 6-8” pins or nails will also work.
6. a light hammer (tack hammer) or mallet to install needles 7. a 1-ft ruler calibrated in inches and centimeters 8. printed data table form
. Site Set-up Step 1. Determine the latitude and longitude of your site (degrees, minutes, seconds) using either Topozone on the internet or a GPS; record these in your field book. For help, contact [email protected] or 615-790-9767. Step 2. During a period of low water, knitting needles should be driven into the eroding bank on a grid having a spacing of approximately 2 ft. in the vertical/near-vertical direction and approximately 6 ft. in the horizontal direction. Needles should be pushed in at right angles to the bank surface and should be inserted completely, so that only the heads are visible. (This is to reduce the likelihood of their being dislodged by floating logs and other debris during floods.) Step 3. Measure the distance between the needles with your tape (ft, in). Make an accurate sketch map showing the locations of the needles and record the measured distances between them; this is necessary in order to calculate the area of the bank being studied. Number the needle locations on your sketch map so that each needle can be identified. Step 3. Record in your field book the date on which the needles were installed. Also record any descriptive information—condition of streamside vegetation, livestock access, obvious signs of erosion, manmade structures causing erosion, etc. Step 5. Make a table in your field book showing the needle identification numbers in the left column and approximately 20 columns to the right in which to record measurements as they are made. Leave space for the dates of the measurements in the top row of the
18
table. You may use the prepared tables. Data should be turned in on these prepared tables at the end of the project. Step 6. After each major storm, allow the stream to subside to a level at which it is safe to work. Use the ruler to measure the lengths of knitting needles which are exposed (in millimeters), and record these lengths and the identification numbers of the needles in your field book. You may also record the data and the exposed lengths directly on the printed data table you’ve been given. After you have recorded the exposed length and identification number of each needle, push or drive it into the bank so that the head is flush with the clay surface. If none of the needle has been exposed, record 0 mm for its exposed length. Repeat 20 times at regular intervals. Step 7. At the end of the study, add up the exposed lengths for each needle recorded in the table; the sum equals the thickness of the layer of soil that was eroded at that location. Add these sums together for all the needles, then divide by the number of needles to obtain the average thickness in mm. Multiply the average thickness by 0.00328 ft/mm to obtain the average thickness in ft. Determine the area of your study site by calculating the product of its height (ft, closest tenth) by its length (ft, closest tenth). (If the area of your bank site is not rectangular, you may want to subdivide it into rectangular units and calculate the area of each, or you can contact a project coordinator to help you determine the area of your site.) The volume of soil lost during the period of the study is given in cubic feet by the product of the total site area and the average thickness of the eroded layer. To obtain cubic yards, multiply this result by 1 cu yd / 27 cu ft.
Stake and Tape Method If you anticipate substantial erosion, it may not be practical to use the knitting needle technique. Also, if the near-vertical face of the bank is not safely accessible, you may not want to use this technique. In that case, the stake and tape method will allow you to get a fairly good estimate of the rate of erosion, although this technique is not as accurate as the knitting needle method. If possible, your site should consist of the full length of bank at which you see signs of active erosion—raw soil, perhaps some exposed tree roots, signs of bank slumping, information from the property owner, etc. If possible, please use both the knitting needle method and the stake and tape method, as it is helpful to obtain data using both techniques at several sites to compare the two methods. Materials Needed
1. field book 2. topographic map segment (from Topozone) for showing site location 3. wooden, metal, or plastic stakes, two for every six feet of bank to be
studied. Thus, if your site is 100 ft long, you will need 2 X 16.667 = 34 stakes. Number these with waterproof magic marker or by some other method.
4. waterproof magic marker 5. #2 pencil 6. hammer or mallet for driving the stakes
19
7. compass 8. measuring tape at least 16 ft in length
9. printed data table form Site Set-up Step 1. Determine the latitude and longitude (degrees, minutes, seconds) of each end of your site either by using the Topozone site on the internet or by means of a GPS unit. Record this information in your field book, along with any relevant descriptive information about the site—state of riparian vegetation, livestock access to bank, visible signs of erosion, manmade structures causing erosion, best management practices (BMPs), etc. Set up your site when the water is fairly low. Step 2. Drive stakes into the ground at approximately 6-ft intervals along a line 8-12 ft back from the edge of the stream bank and parallel to it. Number each of these stakes consecutively with waterproof magic marker. Do this along the full length of your study site. These are your reference stakes. Leave the tops of the stakes high enough so that they can readily be seen, or put in auxiliary markers (surveyor’s tape or something similar) to show you later where the stakes are. Do not put stakes in cultivated land where they may be torn out and/or damage equipment—check with the property owner. Step 3. Record the number of each stake in Column 1 of the data table provided. For each stake, determine the compass bearing (degrees) of the shortest line to the bank and record this in Column 2 of the printed data table provided. Place an auxiliary stake between the reference stake (the numbered stake) and the bank (about 2 ft from the reference stake) to indicate the compass bearing of this line. Do not number the auxiliary stake, so that you can later distinguish it from the numbered reference stake. Step 4. Make a sketch map in your field book showing the locations and numbers of the stakes. Measure the distance (feet, inches) between successive stakes (1-2, 2-3, 3-4, etc.) with your tape and record these distances on your sketch map and in Column 3 of your table. Step 5. For each numbered stake, use your measuring tape to measure the distance (ft, in) from the top of the bank to the bottom of the bank (where it starts to level out and become stream bed). Record this in Column 4 of the table. Step 6. Measure the distance from the front (streamside) edge of the reference stake over the auxiliary stake to the edge of the bank. Later, in similar fashion, you will use the auxiliary stake to make sure that you always measure in exactly the same direction from the reference stake toward the stream’s edge. In Column 5, enter the date in the top row, then enter the distance measured from each reference stake to the bank in the appropriate place. Step 7. After each major storm, for each reference stake measure the distance (ft, in) between the front edge of the stake over the auxiliary stake to the edge of the streambank. Put the date at the top of the first available blank column, then record the stake-bank distances in that column. Repeat as directed for completion of data gathering.
20
Step 8. At the end of the study, calculate the volume of soil lost by bank erosion as follows. For each stake, subtract the last stake-to-bank distance from the first (in the fifth column of your data table), and convert this figure from feet and inches to feet (to tenths of a ft, shown as XX.X). This gives the thickness (T) of the volume of soil lost at that stake. For each stake convert the bank height measurement (in Column 4) to ft (XX.X). This gives the height (H) of the volume lost at that stake. For each stake calculate half the distance between the stakes on either side of it (to tenths of a ft) to get the length (L) of the volume lost at that stake. This cannot be done for the two end stakes; for them, use the distance (to tenths of a ft) between the end stake and the adjacent stake for the length (L) of the volume lost by that stake. The volume of soil lost by each stake is then given by V = T*H*L. Add the volumes lost by each of the stakes to get the total volume of soil (in cubic ft) lost by the site during the course of the study. If you wish to convert this to cubic yards, multiply by 1 cu yd / 27 cu ft. Safety Considerations
1. Take care when parking and getting into and out of your car. Traffic accidents are probably the greatest hazard.
2. Sampling in bad weather or in the dark should be avoided.
3. You may be working along near-vertical, muddy, slippery stream banks
with deep, fast-moving water below. Be prudent and cautious, particularly when using the knitting needle method. A safety rope and a helper may be in order. Do not attempt to check your knitting needles when the stream is in flood stage; this may be extremely dangerous.
4. Take precautions regarding hornets and wasps, snakes, ticks and chiggers,
poison ivy, farm animals (particularly bulls) and dogs.
5. Let someone know where you’re going and when you expect to be back.
6. If you should use a canoe or other boat in a knitting needle study, don’t go in flooded, raging streams, wear a life jacket, and use caution.