Embed Size (px)
Citation preview

VOT 75149
A NOVEL CAPILLARY ELECTROPHORETIC METHOD FOR THE ANALYSIS OF DIOXINS AND FURANS
(KAEDAH NOVEL ELEKTROFORESIS RERAMBUT UNTUK ANALISIS DIOKSIN DAN FURAN)
WAN AINI BINTI WAN IBRAHIM
PUSAT PENGURUSAN PENYELIDIKAN UNIVERSITI TEKNOLOGI MALAYSIA
2008

VOT 75149

VOT 75149
A NOVEL CAPILLARY ELECTROPHORETIC METHOD FOR THE ANALYSIS OF DIOXINS AND FURANS
(KAEDAH NOVEL ELEKTROFORESIS RERAMBUT UNTUK ANALISIS DIOKSIN DAN FURAN)
WAN AINI BINTI WAN IBRAHIM
RESEARCH VOTE NO: 75149
Jabatan Kimia Fakulti Sains
Universiti Teknologi Malaysia
2008

ii
ACKNOWLEDGEMENT
Financial assistance from Ministry of Higher Education (MOHE) for the
project number 75149 is greatfully acknowledged.

iii
ABSTRACT
A NOVEL CAPILLARY ELECTROPHORETIC METHOD FOR
THE ANALYSIS OF DIOXINS AND FURANS
(Keywords: Micellar electrokinetic chromatography, capillary elctrophoresis, dioxin, furan)
Micellar electrokinetic chromatography (MEKC) is increasingly popular in the analysis of organic pollutants in the environment due to its high separation efficiency, less solvent usage and shorter analysis time. In this study, MEKC was used for the separation of 2,3,7,8-tetrachlorodibenzo-p-dioxin (TCDD) and 2,3,7,8-tetrachlorodibenzo-p-furan (TCDF) with a separation buffer consisting of 20 mM sodium cholate, 20 mM sodium tetraborate decahydrate and 5% v/v organic modifier acetonitrile-methanol (3:1 v/v) at a final buffering pH of 9.16-9.22. Separation voltage was at 25 kV with anodic injection and optimum wavelength set at 225 nm. To improve the limit of detection (LOD), five on-line preconcentration techniques were evaluated. The techniques were normal stacking mode (NSM-MEKC), reversed electrode polarity stacking mode (REPSM-MEKC), high conductivity sample stacking mode (HCSSM-MEKC), sweeping and field enhanced sample injection (FESI-MEKC). High conductivity sample stacking method-MEKC (HCSSM-MEKC) that gave an LOD of 46 ppb for TCDF and 18.5 ppb for TCDD was chosen. Solid phase disc extraction (SPDE) was used to further improve the LOD during the extraction of TCDF and TCDD from water thus reducing the LODs by 1000 fold. LODs in the ppt range were achieved for both analytes.
Key researchers:
Assoc. Prof. Dr. Wan Aini Wan Ibrahim (Head) Prof. Dr. Mohd Marsin Sanagi
Ms Sharain Liew Yen Ling
E-mail : [email protected] Tel. No. : 07-5534311 Vote No. : 75149

iv
ABSTRAK
KAEDAH NOVEL ELEKTROFORESIS RERAMBUT UNTUK
ANALISIS DIOKSIN DAN FURAN
(Kata kekunci: Kromatografi rerambut elektrokinetik misel, elektroforesis rerambut, dioksin, furan)
Kromatografi rerambut elektrokinetik misel (MEKC) semakin kerap digunakan dalam analisis bahan pencemar alam sekitar kerana kecekapan pemisahan yang tinggi, penggunaan isipadu pelarut yang kecil dan masa analisis yang singkat. Dalam kajian ini, MEKC telah digunakan untuk memisahkan 2,3,7,8-tetraklorodibenzo-p-dioksin (TCDD) dan 2,3,7,8-tetraklorodibenzo-p-furan (TCDF) dengan menggunakan larutan penimbal 20 mM natrium kolat, 20 mM natrium tetraborat dekahidrat dan campuran pengubahsuai organik 5% asetonitrile-methanol (3:1 v/v) dengan pH 9.16-9.22. Voltan pemisahan adalah 25 kV dan panjang gelombang optimum pada 225 nm. Lima teknik pra-pemekatan talian terus iaitu mod penyusunan normal (NSM-MEKC), penyusunan kekutuban elektrod berbalik (REPSM-MEKC), mod penyusunan sampel kekonduksian tinggi (HCSSM-MEKC), sapuan (S-MEKC) dan suntikan sampel peningkatan medan (FESI-MEKC) telah diuji untuk membaiki had pengesanan analit. Mod penyusunan sampel kekonduksian tinggi (HCSSM-MEKC) telah dipilih dengan had pengesanan 46 ppb untuk TCDF dan 18.5 ppb untuk TCDD. Kaedah pengekstrakan cakera fasa pepejal (SPDE) telah digunakan untuk memperbaiki had pengesanan TCDF dan TCDD dalam sampel air dan berjaya menurunkan had pengesanan sebanyak 1000 kali ganda. Had pengesanan adalah dalam julat ganda bahagian per trillion (ppt).
Penyelidik Utama:
Assoc. Prof. Dr. Wan Aini Wan Ibrahim (Head) Prof. Dr. Mohd Marsin Sanagi
Cik Sharain Liew Yen Ling
E-mail : [email protected] Tel. No. : 07-5534311 Vote No. : 75149

v
TABLE OF CONTENTS
CHAPTER TITLE PAGE
TITLE PAGE i
ACKNOWLEDGEMENT ii
ABSTRACT iii
ABSTRAK iv
TABLE OF CONTENTS v
LIST OF TABLES xi
LIST OF FIGURES xv
LIST OF SYMBOLS xxvii
LIST OF ABBREVIATIONS
LIST OF APPENDICES
xxviii
xxxi
1 INTRODUCTION
1.1 Background 1
1.2 Summary 2
2 LITERATURE STUDY 5
2.1 Organic Pollutants 5
2.2 Chlorinated Dioxins and Dibenzofurans 6
2.2.1 Physical and Chemical Properties Of 2,3,7,8-TCDF
and 2,3,7,8-TCDD
7

vi
2.2.2 Toxicity of PCDDs and PCDFs 8
2.2.3 Potential Routes of PCDDs and PCDFs Exposure In
Wildlife and Humans
9
2.2.3.1 Commercial and Technical Products 9
2.2.3.2 Municipal Incinerators and Hazardous Waste Incinerators 10
2.2.3.3 Food Products 10
2.3 Organophosphorous Pesticides 11
2.3.1 Physical and Chemical Properties 12
2.3.2 Toxicity of OPPs 14
2.4 Sample Extraction and Clean-up Strategies of Organic
Pollutants
14
2.4.1 Methods For The Extraction Organic Pollutants 15
2.4.2 Clean-up Procedures for Organic Pollutants 17
2.5 Identification and Quantification of Organic Pollutants 19
2.5.1 Gas Chromatography 19
2.5.2 Micellar Electrokinetic Chromatography (MEKC) 20
2.5.3 Types of Surfactants 21
2.5.4 Organic Modifier Effect 25
2.5.5 Matrix Effect 26
2.6 On-line Preconcentration Techniques 27
2.6.1 Stacking 28
2.6.2 Sweeping 34
2.7 Problem Statement 35
2.8 Research Objectives 37
2.9 Scope of Work 38
3 EXPERIMENTAL 41
3.1 Introduction 41
3.2 Reagents 41
3.3 Instrumentations 42
3.4 Conditioning of the Capillary 43
3.5 Procedures for MEKC Separation of TCDF and TCDD 44

vii
3.5.1 Preliminary Investigation For The Separation of TCDF and
TCDD
44
3.5.2 Evaluation Of Organic Modifier Effect On The Separation
of TCDF and TCDD
45
3.5.3 Separation Efficiency of TCDF and TCDD Under Different
Sample Matrix
45
3.5.4 Normal Stacking Mode (NSM-MEKC) In The Separation
Of TCDF and TCDD
46
3.5.5 Reversed Electrode Polarity Stacking Mode 47
3.5.6 High Conductivity Sample Stacking Mode (HCSSM) 47
3.5.7 Sweeping 47
3.5.8 Field-Enhanced Sample Injection (FESI-MEKC) 48
3.6 Off-line Preconcentration Using Solid Phase Disc
Extraction (SPDE)
48
3.6.1 Sample Preparation 48
3.6.2 Solid Phase Disc Extraction 49
3.7 Summary of Methodology of Optimization of eparation of
TCDD and TCDF
51
3.8 Procedures for MEKC Separation Of Hydrophilic
Organophosphorous Pesticides (OPPs)
52
3.8.1 Wavelength Optimization In The Separation Of OPPs
Under Acidic Conditions
52
3.8.2 Stacking With Reverse Migrating Micelles (SRMM) In The
Analysis Of OPPs
53
3.9 Off-line Concentration Using Solid Phase Disc
Extraction (SPDE) Of OPPs
53
3.9.1 Sample Preparation 53
3.9.2 Extraction 53
3.9.3 Method Validation Of Extraction Process 54
4 OPTIMIZATION OF SEPARATION PARAMETERS 55
4.1 Introduction 55

viii
4.2 Preliminary Investigation On The Separation of TCDF and
TCDD Using MEKC
55
4.2.1 Confirmation of Individual Peaks 56
4.2.2 Optimization of Analyte Separation By Varying The
Percentage Of Acetontrile In The Running Buffer Solution
57
4.3 Evaluation of Organic Modifier Effect On The Separation
Efficiency of TCDF and TCDD Using MEKC
62
4.3.1 Comparison of Separation Performance Between
Acetonitrile and Methanol
63
4.3.2 Comparison Of Mixed Modifier With Single Organic
Modifier On Separation Performance
68
4.4 Investigation of Sample Matrix Effect On The Separation
Efficiency of TCDF and TCDD
74
4.4.1 Baseline Stability and Unknown Peak Elimination 74
4.4.2 Comparison Of Peak Area, Peak Height
And Separation Efficiency In Different Matrix
77
5 OFF-LINE AND ON-LINE PRECONCENTRATION
TECHNIQUES
80
5.1 Introduction 80
5.2 Normal Mode (NM-MEKC) In Analysis of TCDF and
TCDD
80
5.2.1 Normal Mode MEKC (NM-MEKC) 80
5.2.2 Calibration Lines, Linearity (r2), LODs 81
5.2.3 Repeatability and Efficiency (N) 82
5.3 Normal Stacking Mode (NSM-MEKC) 84
5.3.1 Optimization of Injection Time 85
5.3.2 Calibration Lines, Linearity (r2), LODs 88
5.3.3 Repeatability, Reproducibility and Efficiency (N) 89
5.3.4 Stacking Efficiency 92
5.4 Reversed Electrode Polarity Stacking Mode (REPSM) 93
ix
5.4.1 Influence Of Various Stacking Periods 93
5.4.2 Calibration lines, linearity (r2) and LODs 97
5.4.3 Repeatability and Efficiency 98
5.4.4 Stacking Efficiency 99
5.5 High Conductivity Sample Stacking Mode
(HCSSM-MEKC)
99
5.5.1 Optimization of Sodium Chloride Concentration 100
5.5.2 Calibration lines, linearity (r2) and LODs 103
5.5.3 Repeatability, Reproducibility and Efficiency 104
5.5.4 Stacking Efficiency 105
5.6 Sweeping 106
5.7 Field-Enhanced Sample Injection (FESI) 107
5.8 Off-line Preconcentration Technique With Solid Phase Disc
Extraction (SPDE)
109
5.9 Conclusions
113
6 SEPARATION OF HYDROPHILIC
ORGANOPHOSPHOROUS PESTICIDES USING
MICELLAR ELECTROKINETIC CHROMATOGRAPHY
(MEKC) WITH ACIDIC BUFFER
114
6.1 Introduction 114
6.2 Reverse Mode Micellar Electrokinetic Chromatography 115
6.2.1 Wavelength Optimization 115
6.2.2 Calibration Lines, Linearity (r2), LODs 118
6.2.3 Repeatabilities and Efficiency (N) 119
6.3 Stacking With Reverse Migrating Micelles 121
6.3.1 Calibration Lines, Linearity (r2), LODs 122
6.3.2 Repeatability and Efficiency (N) 124
6.3.3 Stacking Efficiencies (SEF) 125

x
6.4 Off-line Preconcentration Technique With Solid Phase
Disc Extraction (SPDE)
127
7 CONCLUSIONS AND FUTURE DIRECTION 130
7.1 Conclusions 130
7.2 Future Direction
134
REFERENCES 135
APPENDICES
List of Publications
List of Presentations
152
152
153

xi
LIST OF TABLES
TABLE NO. TITLE PAGE
2.1 Physical and chemical properties of 2,3,7,8-TCDF and 2,3,7,8-
TCDD.
7
2.2 Toxicity Equivalent Factors (TEF) for chlorinated
dibenzodioxins and chlorinated dibenzofurans
8
2.3 Functions and physical properties of the three hydrophilic OPPs 12
2.4 Example of various sorbents used in SPE for the analysis of
polychlorinated dibenzodioxins, polychlorinated dibenzofurans,
polychlorinated biphenyls (PCBs) and organophosphorous
pesticides (OPPs) from various matrices.
18
2.5 Some examples of GC analysis used for PCDD/Fs 22
2.6 Some examples of GC analysis used for OPPs 23
2.7 Some examples of determination of organic pollutants using
MEKC.
24
4.1 Repeatability of migration time, peak areas and peak height for
TCDF and TCDD under different fractions of acetonitrile in
running buffer. Separation conditions remain the same as in
Figure 4.1.
61
4.2 A comparison on the effect of different fractions of MeCN on
the peak resolution, Rs for TCDF measured relative to peak X.
62
4.3 A comparison on the effect of different fractions of MeOH on
the peak resolution, Rs for TCDF measured relative to peak X.
63
4.4 A comparison of the effect of 15 % v/v MeCN and 15 % v/v
MeOH on the migration time (tm), resolution (Rs), efficiency
(N) and selectivity (α) of TCDF and TCDD MEKC separation.
65

xii
4.5 Repeatability of migration time, peak area and peak height for
TCDF and TCDD under different fractions of methanol, MeOH
in running buffer. Separation conditions the same as in Figure
4.1.
66
4.6 The effect of different organic modifiers on the relative
standard deviation (% RSD) of migration time, peak area and
peak height for TCDF and TCDD.
73
5.1 Equation of calibration curves, correlation coefficients, r2,
LODs (at S/N = 3) on the basis of calibration curves in Figure
5.1.
82
5.2 Repeatability of migration time, peak area and peak height
(mAU) in the separation of TCDF and TCDD using NM-
MEKC.
82
5.3 Injection volume and plug length as a function of pressure, time
and capillary id. % of sample plug and corresponding % of
remaining length available for separation is also indicated.
86
5.4 Equation of calibration curves, r2, LODs (for S/N = 3)
on the basis of calibration curves in Figure 5.6.
89
5.5 Repeatability of migration time, peak height and peak area for
TCDF and TCDD using NSM.
90
5.6 Reproducibility of migration time (min), peak area (mAUs) and
peak height (mAU) for TCDF and TCDD.
91
5.7 Sensitivity Enhancements Factor (SEF) in NSM-MEKC over
NM-MEKC in the separation of TCDF and TCDD.
92
5.8 Corresponding percentage of original current, % with polarity
switching time,s used in REPSM.
95
5.9 Equation of calibration curves, r2, LODs (for S/N = 3) on the
basis of calibration curves in Figure 5.11 using REPSM.
97
5.10 Repeatability of migration time, peak area and peak height in
the separation of TCDF and TCDD using REPSM.
98
5.11 Sensitivity Enhancement Factors (SEF) in REPSM over NM-
MEKC in the separation of TCDF and TCDD.
99

xiii
5.12 Equation of calibration curves, r2, LODs (at S/N = 3) for TCDF
and TCDD based on calibration curves in Figure 5.15.
103
5.13 Repeatability of migration time (min), peak area (mAUs) and
peak height (mAU) in the separation of TCDF and TCDD.
104
5.14 Reproducibility over four consecutive days with n=5 per day of
migration time (min), peak area (mAUs) and peak height
(mAU) in the separation of TCDF and TCDD using HCSSM.
TCDF is at 2 ppm while TCDD is at 0.3 ppm.
104
5.15 Sensitivity Enhancements Factor (SEF) in HCSSM-MEKC
over NM-MEKC in the separation of TCDF and TCDD.
106
5.16 Recovery and repeatability of extraction of TCDF and TCDD
from spiked water using SPDE.
110
5.17 Concentration of TCDF and TCDD discovered in pulp-mill
treated and untreated effluent. ND: Not detected.
111
6.1 Summary of wavelength optimization for dicrotophos,
monocrotophos and phosphamidon. Separation conditions:
separation buffer contained 20 mM phosphate (pH 2.3), 10 mM
SDS and 10% v/v methanol; samples at 100 ppm each prepared
in methanol; applied potential -25kV; hydrodynamic sample
injection for 10 s at 50 mbar. Total capillary length: 48.5 cm.
Effective length: 40 cm.
116
6.2 Regression equation, r2, LODs (S/N = 3) on the basis of
calibration curves in Figure 6.4.
119
6.3 Intraday % RSD of migration time (min), peak area (mAUs)
and peak height (mAU) in the separation of dicrotophos,
monocrotophos and phosphamidon at three replicates each at
100 ppm.
120
6.4 Regression equation, r2, LODs (for S/N = 3) using SRMM-
MEKC based on calibration curves in Figure 6.8.
123

xiv
6.5 Repeatability of migration time (min), peak area (mAUs) and
peak height (mAU) in the separation of dicrotophos,
monocrotophos and phosphamidon at three replicates each at
10 ppm.
125
6.6 Sensitivity Enhancement Factors in SRMM-MEKC over RM-
MEKC in the separation of dicrotophos, monocrotophos and
phosphamidon. Conditions as in Figure 6.10.
126
6.7 Recovery and repeatability of extraction. 128
7.1 LODs (for S/N = 3) obtained using the three online
preconcentration techniques as compared to normal mode (NM)
for TCDF and TCDD.
131
7.2 Repeatabilities for migration time, peak area and peak height
for both analytes using the three online preconcentration
techniques as compared to normal mode (NM) for TCDF and
TCDD. Sweeping and FESI were not successful in enhancing
the detection of both analytes.
132

xv
LIST OF FIGURES
FIGURE NO. TITLE PAGE
2.1 General structures of A) polychlorinated dibenzo-p-dioxins,
PCDDs and B) polychlorinated dibenzofurans, PCDFs.
6
2.2 General structure of organophosphorous pesticides. 12
2.3 The chemical structures of (A) phosphamidon, (B)
dicrotophos and (C) monocrotophos.
13
2.4 Schematic diagram of the principle of sample stacking in
MEKC. SB is the stacking boundary. EOF is the
electrooosmotic flow. (Quirino and Terabe, 1997a).
29
2.5 Schematic diagram of stacking of analytes during REPSM.
(A) Before stacking; (B) micelles enter the capillary and
carry with it neutral analytes a, k(ax)>k(ay)>k(az); (C)
micelles and neutral analytes stack at the concentration
boundary (B2) and (B1) and polarity is switched later to
positive; (D) separation and later detection of zones.
Retention factor is referred with the symbol k. ax, ay and az
refer to the stacking boundary for analyte x, analyte y and
analyte z.(Quirino and Terabe, 1997b).
31

xvi
2.6 Schematic diagram of stacking of neutral analytes in
FESI-MEKC. (A) initial situation (water plug, unshaded;
BGS shaded); (B) micelles enter the capillary and carry
with them neutral analytes emanating from the cathodic
vial, k(x)>k(y)>k(z); (C) micelles and neutral analytes
stacked at the concentration boundary, voltage is cut and
sample vial replaced with BGS vial when the measured
current is approximately 97-99% of the predetermined
current, voltage is then applied at positivie polarity; (D)
separation of zones occur. k refers to the retention factor of
analyte x, y and z
(Quirino and Terabe, 1998b).
33
2.7 Schematic diagram of sweeping of analytes in MEKC under
low electroosmotic flow. (a) Starting situation, injection of
S prepared in a matrix having a conductivity similar to that
of the BGS; (b) application of voltage at negative polarity,
micelles emanating from the cathodic side sweeping analyte
molecules; (c) the injected analyte zone is assumed
completely swept (Shao and Tseng, 2005).
35
2.8 Flow chart of research methodology of separation TCDD
and TCDF.
39
2.9 Flow chart of research methodology of separation of the
three hydrophilic OPPs viz. phosphamidon, dicrotophos and
monocrotophos.
40
3.1 Chemical structure for TCDF and TCDD. 42
3.2 SPE disc extraction setup in the extraction of analytes from
water samples.
50
3.3 Summary of the methodology of MEKC separation
involved in the separation of TCDF and TCDD.
51
xvii
4.1 Electropherogram of TCDD and TCDF at 40 ppm each in
1,4-dioxane. Run buffer: 20 mM di-sodium tetraborate
decahydrate, 20 mM sodium cholate and 5% (v/v)
acetonitrile at a final running buffer pH: 9.16-9.22. Injection
time: 1 s at 50 mbar. Wavelength: 225 nm. Separation
voltage: 25 kV. Total capillary length: 48.5 cm, effective
length: 40 cm.
56
4.2 The effect of acetonitrile percentage on the migration
window for the MEKC separation of TCDF and TCDD
(n=3).
57
4.3 Electropherogram of TCDF with different percentages of
acetonitrile (MeCN) in BGS at 0 % v/v, % v/v, 10 % v/v, 15
% v/v and 20 % v/v. At 20 % v/v, the TCDF peak appeared
before peak X. Separation conditions are the same as in
Figure 4.1.
58
4.4 Effect of acetonitrile fraction on migration time of TCDF
and TCDD at 0% v/v MeCN, 5% v/v MeCN, 10% v/v
MeCN, 15% v/v MeCN and 20% v/v MeCN. Separation
conditions remain the same as in Figure 4.1.
59
4.5 Effect of different percentages of acetonitrile in running
buffer on (A) migration time and (B) efficiency on the
separation of -TCDF and TCDD.
60
4.6 Electropherogram of TCDF and peak X at 15% v/v
methanol. Running buffer conditions: 20 mM sodium
cholate, 20 mM sodium tetraborate-decahydrate at a final
buffer pH: 9.16-9.22. Wavelength: 225 nm. Both test
analytes at 100 ppm each in 1,4-dioxane. Hydrodynamic
injection at 50 mbar for 1s. Separation voltage, 25 kV;
temperature, 25ºC; total capillary length, 48.5 cm; effective
length, 40 cm.
64

xviii
4.7 Peak shouldering for TCDD at 9.147 min (circle) at 20%
v/v methanol. MEKC conditions as in Figure 4.5.
64
4.8 Electropherogram of the effect of the % of MeOH on the
separation of TCDF and TCDD. Separation conditions
remain the same as in Figure 4.5. The peaks between TCDF
and TCDD are suspected to be from the 1,4-dioxane.
67
4.9 Peak resolution for TCDF (measured relative to peak X
mentioned in section 4.2.2) at 15% v/v MeCN, 15% v/v
MeOH and various percentages of mixed modifier.
Separation conditions similar to Figure 4.1.
67
4.10 Effect of (A) 15% v/v MeCN (B) 15% v/v MeOH (C) 5%
v/v MeCN-MeOH (1:1), (D) 5% v/v MeCN-MeOH (3:1)
and (E) 5% v/v MeCN-MeOH (1:3) on the separation of
TCDD. MEKC separation conditions remain
identical as in Figure 4.1.
69
4.11 Effect of (A) 15% v/v MeCN (B) 15% v/v MeOH (C) 5%
v/v MeCN-MeOH (1:1), (D) 5% v/v MeCN-MeOH (3:1)
and (E) 5% v/v MeCN-MeOH (1:3) on the separation
efficiency of TCDF (enlarged). Peak X refers to an
unknown peak due to the 1,4-dioxane used. MEKC
separation conditions similar to Figure 4.10.
70
4.12 Effect of modifier on (A) migration time, (B) peak area, (C)
peak heights and (D) efficiency of TCDF and TCDD.
72
4.13 Electropherograms of TCDF and TCDD at 4 ppm each in
different media used. (A) ethanol, (B) water and (C) buffer.
(B) and (C) are analytes dissolved in aqueous matrix while
(A) is analyte dissolved in non-aqueous matrix. Running
buffer conditions as in Figure 4.5 but with 5% v/v MeCN-
MeOH (3:1).
75

xix
4.14 Electropherogram of TCDF in the presence of (A) ethanol,
(B) water and (C) buffer matrix. TCDF: 4 ppm; running
buffer conditions similar to Fig 4.13.
76
4.15 Comparison of sample matrix effect based on (A) separation
efficiency, (B) peak area and (D) peak height. (C) shows the
enlarged peak areas as circled in (B) for TCDF. Error bars
are in standard errors.
78
5.1 Calibration curves based on peak height for (A) TCDF and
(B) TCDD using NM-MEKC. Separation buffer: 20 mM
sodium cholate, 20 mM sodium tetraborate-decahydrate and
5% v/v MeCN/MeOH (3:1) at a final buffer pH 9.16-9.22.
Separation wavelength: 225 nm. Separation voltage: 25 kV.
Hydrodynamicinjection for 1s at 50 mbar. Capillary total
length: 48.5 cm. Effective length: 40 cm.
81
5.2 Electropherogram of three replicated runs for the separation
of TCDF (40 ppm) and TCDD (15 ppm) in NM-MEKC
under the same conditions as in Figure 5.1.
83
5.3 Variations in N for (A) TCDF and (B) TCDD in the
concentration used in the calibration curve in NM-MEKC.
84
5.4 Electropherograms showing the effect of different injection
times on peak shapes of TCDD and TCDF. Separation
buffer: 20 mM sodium cholate, 20 mM sodium tetraborate-
decahydrate and 5% v/v MeCN-MeOH (3:1) at a final
buffer pH 9.16-9.22. Separation wavelength, 225 nm;
separation voltage, 25 kV; hydrodynamic injection of
samples varied from 1 s, 4 s, 10 s, 20 s, 30 s, 40 s and 50 s.
Capillary total length: 48.5 cm; effective length: 40 cm.
87

xx
5.5 Influence of injection time on (A1) peak area, (A2) enlarged
for TCDF peak area, (B) peak height and (C) efficiency on
the separation of TCDF and TCDD. Hydrodynamic
injection pressure constant at 50 mbar.
88
5.6 Calibration curves based on peak height for (A) TCDF and
(B) TCDD using NSM-MEKC.Injection time at 50 mbar for
10 s. Separation conditions remain similar to Figure 5.4.
89
5.7 Electropherogram of three successive replicated runs for the
separation of TCDF and TCDD in NSM-MEKC under same
conditions as in Figure 5.4 but with an injection time of 10
s.
90
5.8 Variations in N in the concentration range for (A) TCDF
and (B) TCDD used in the calibration curve in NSM-
MEKC.
92
5.9 Effect of polarity switching time on (A1) peak area and
(B1) peak height for both analytes. (A2) enlarged line graph
of peak area for TCDF. (B2) enlarged line graph of peak
height for TCDF.
94
5.10 Electropherogram of REPSM with different polarity
switching times. TCDF at 4 ppm (circled peak) while
TCDD at 1.5 ppm. Separation buffer: 20 mM sodium
cholate, 20 mM sodium tetraborate-decahydrate and 5% v/v
MeCN/MeOH (3:1) at a final buffer pH 9.16-9.22.
Separation wavelength, 225 nm; separation voltage, 25 kV.
Hydrodynamic injection of sample at 50 mbar for 100 s
followed by electrokinetic injection of buffers at -25 kV for
20 s. Total capillary length: 48.5 cm. Effective length: 40.0
cm.
96
5.11 Calibration curves based on peak height for (a) TCDF and
(b) TCDD using REPSM. Injection time set at 50 mbar for
100 s. Electrokinetic injection at -25 kV for 20 s. Separation
conditions similar to Figure 5.10.
97

xxi
5.12 Variations in N with the concentration for (A) TCDF and
(B) TCDD used in the calibration curve in REPSM-MEKC.
Conditions remain the same as in Figure 5.10.
98
5.13 Effect of different concentrations of NaCl (0-300 mM) on
(A) peak area, (B) peak height and (C) efficiency for both
TCDF and TCDF. Separation buffer: 20 mM sodium
cholate, 20 mM sodium tetraborate-decahydrate and 5% v/v
(3:1 acetonitrile-methanol) at a final buffer pH 9.16-9.22.
Separation wavelength: 225 nm. Separation voltage: 25 kV.
Hydrodynamic injection of sample at 50 mbar for 10 s.
Total capillary length: 48.5 cm. Effective capillary length:
40 cm.
101
5.14 HCSSM-MEKC electropherograms with different
concentration of NaCl. TCDF at 2 ppm while TCDD at 0.3
ppm. Peak for TCDF is shown by the circle drawn around
the peak. Separation buffer: 20 mM sodium cholate, 20
mM sodium tetraborate-decahydrate and 5% v/v MeCN-
MeOH (3:1) at a final buffer pH 9.16-9.22. Separation
wavelength: 225 nm. Separation voltage: 25 kV.
Hydrodynamic injection of sample at 50 mbar for 10 s.
Total capillary length: 48.5 cm. Effective capillary length:
40 cm.
102
5.15 Calibration curves based on peak height for (a) TCDF and
(b) TCDD using HCSSM. Injection time set at 50 mbar for
10 s. NaCl concentration in sample matrix at 200 mM.
Separation conditions similar to Figure 5.14.
103
5.16 Variations in efficiency, N in the concentration range for
(A) TCDF and (B) TCDD used in the calibration curve in
HCSSM-MEKC. Separation conditions similar to Figure
5.14.
105
xxii
5.17 Electropherogram of sweeping with different concentration
of sodium cholate in sample matrix at (A) 5 mM, (B) 10
mM and (C) 20 mM. Separation buffer: 20 mM sodium
cholate, 20 mM sodium tetraborate-decahydrate and 5% v/v
MeCN-MeOH (3:1) at a final buffer pH 9.16-9.22.
Separation wavelength, 225 nm; separation voltage, 25 kV.
Hydrodynamic injection of sample at 50 mbar for 5 s. Total
capillary length: 48.5 cm. Effective length: 40.0 cm. TCDF
at 2 ppm while TCDD at 0.5 ppm.
107
5.18 Electropherogram of TCDF (2ppm) and TCDD (0.5 ppm)
under FESI-MEKC conditions. Analytes were mixed with
20 mM sodium cholate and deionized water. Samples were
electrokinetically injected at -20 kV, 100 s after
hydrodynamic injection of water plug for 5 s at 50 mbar.
Separation conditions remain the same as in Figure 5.18.
108
5.19 Electropherograms of SPDE-HCSSM of TCDF and TCDD
spiked with 50 ng. Separation buffer: 20 mM sodium
cholate, 20 mM sodium tetraborate-decahydrate and 5% v/v
MeCN-MeOH (3:1) at a final buffer pH 9.16-9.22.
Separation wavelength, 225 nm; separation voltage, 25 kV.
Hydrodynamic injection of sample at 50 mbar for 10 s.
Total capillary length: 48.5 cm. Effective capillary length:
40 cm.
111
5.20 Electropherograms of pulp mill effluent water obtained as
tabulated in Table 5.17. (A) treated A, (B) treated B, (C)
untreated A and (D) untreated B.
112

xxiii
6.1 Comparison of intensity of (1) dicrotophos, (2)
monocrotophos and (3) phosphamidon at different detection
wavelengths which are 225 nm and 195 nm under the same
running buffer conditions. Separation buffer: 20 mM
phosphate at buffer pH 2.3, 10 mM SDS and 10% v/v
methanol. Separation wavelength, 225 nm; separation
voltage, -25 kV; hydrodynamic injection for 50 s at 50
mbar. Capillary total length, 48.5 cm; effective length, 40
cm.
116
6.2 The influence of different wavelengths on peak area
response for dicrotophos, monocrotophos and
phosphamidon. Separation conditions is similar Figure 6.1.
117
6.3 The influence of different wavelengths on peak height
intensity for dicrotophos, monocrotophos and
phosphamidon. Separation conditions is similar to Figure
6.2.
118
6.4 Calibration curves based on (A) peak areas and (B) peak
heights for the separation of hydrophilic OPPs in RM-
MEKC. Separation conditions remain the same as in Figure
6.3.
119
6.5 Electropherogram of (1) dicrotophos, (2) monocrotophos
and (3) phosphamidon at 100 ppm each when injected in
triplicates. Separation conditions remain the same as in
Figure 6.4.
120
6.6 Variations in efficiency, N in the concentration range for
dicrotophos, monocrotophos and phosphamidon using RM-
MEKC. Separation conditions of Figure 6.5.
121
6.7 Schematic diagram of the priniciple of stacking with reverse
migrating micelles in MEKC. EOF, electroosmotic flow;
SB, stacking boundary.
122

xxiv
6.8 Calibration curves based on (A) peak areas and (B) peak
heights for the separation of hydrophilic OPPs in SRMM-
MEKC. Separation buffer: 20 mM phosphate at buffer pH
2.3, 10 mM SDS and 10% v/v methanol. Separation
wavelength: 225 nm. Separation voltage: -25 kV.
Hydrodynamic injection for 50 s at 50 mbar. Capillary total
length: 48.5 cm. Effective length: 40 cm.
123
6.9 Separation of hydrophilic OPPs using SRMM-MEKC at
mixture at (A) 10 ppm, (B) 20 ppm and (C) 30 ppm for
(1)dicrotophos, (2) monocrotophos and (3) phosphamidon.
Separation conditions remain the same as in Figure 6.8.
124
6.10 Variations in N in the concentration range for dicrotophos,
monocrotophos and phosphamidon using SRMM-MEKC.
Separation conditions similar to Figure 6.9.
125
6.11 Electropherograms of extracted blank pond water (A) and of
dicrotophos (1), monocrotophos (2) and phosphamidon (3)
at (B) 0.5 µg and (C) 1 µg. Separation buffer: 20 mM
phosphate at buffer pH 2.3, 10 mM SDS and 10% v/v
methanol. Separation wavelength, 225 nm; separation
voltage, -25 kV; hydrodynamic injection for 50 s at 50
mbar. Capillary total length, 48.5 cm and effective length,
40 cm.
129

xxvii
LIST OF SYMBOLS
D, d - Diameter (µm)
Ip - Sample plug length
L - Length (cm)
N - Efficiency
P - Pressure (mbar)
r2 - Correlation coefficient
Rs - Peak resolution
T - Temperature (˚C)
tm - Migration time
Vp - Volume of sample loaded
α - Selectivity
η - Viscosity
xxviii
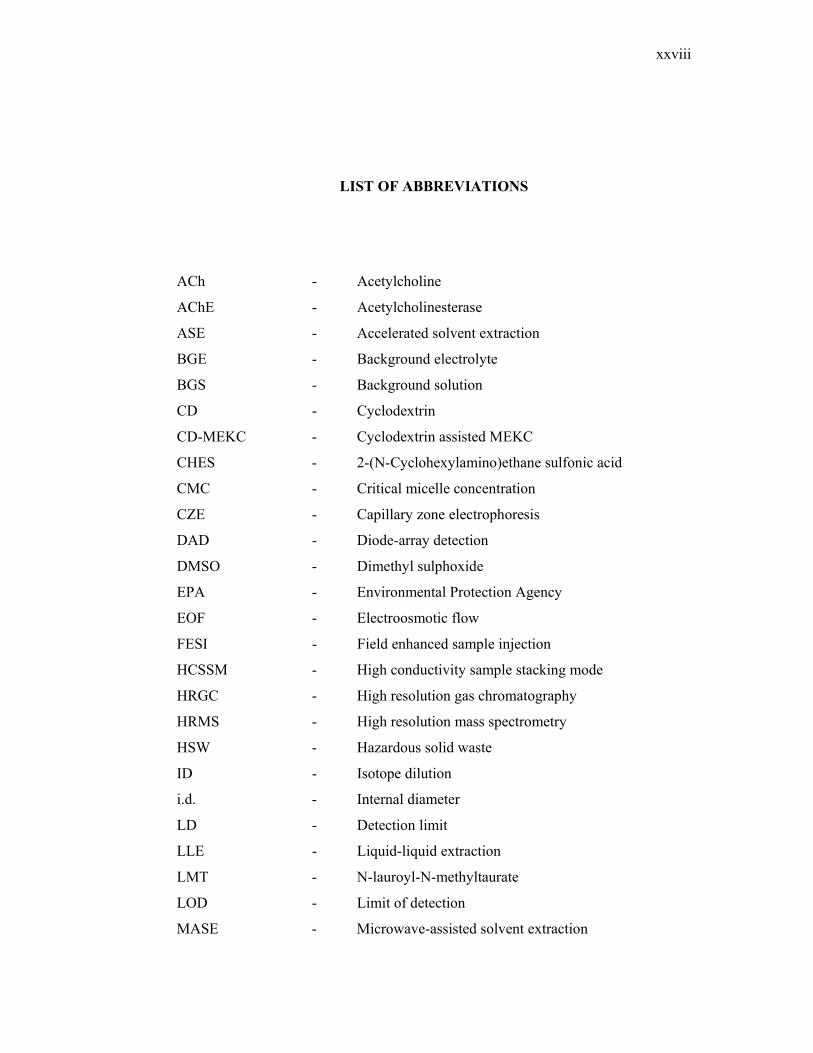
LIST OF ABBREVIATIONS
ACh - Acetylcholine
AChE - Acetylcholinesterase
ASE - Accelerated solvent extraction
BGE - Background electrolyte
BGS - Background solution
CD - Cyclodextrin
CD-MEKC - Cyclodextrin assisted MEKC
CHES - 2-(N-Cyclohexylamino)ethane sulfonic acid
CMC - Critical micelle concentration
CZE - Capillary zone electrophoresis
DAD - Diode-array detection
DMSO - Dimethyl sulphoxide
EPA - Environmental Protection Agency
EOF - Electroosmotic flow
FESI - Field enhanced sample injection
HCSSM - High conductivity sample stacking mode
HRGC - High resolution gas chromatography
HRMS - High resolution mass spectrometry
HSW - Hazardous solid waste
ID - Isotope dilution
i.d. - Internal diameter
LD - Detection limit
LLE - Liquid-liquid extraction
LMT - N-lauroyl-N-methyltaurate
LOD - Limit of detection
MASE - Microwave-assisted solvent extraction

xxix
MeCN - Acetonitrile
MEKC - Micellar electrokinetic chromatography
MeOH - Methanol
MSPD - Matrix solid phase dispersion
MSW - Municipal solid waste incinerator
NACE - Non-aqueous capillary electrophoresis
NaCl - Sodium chloride
NM - Normal mode
NSM - Normal stacking mode
OPPs - Organophosphorous Pesticides
PBDE - Polybrominated diphenyl ether
PCB - Polychlorinated biphenyls
PCDD - Polychlorinated dibenzodioxins
PCDF - Polychlorinated dibenzofurans
PLE - Pressurized liquid extraction
poly-SUS - Polysodium undecyl sulfate
REPSM - Reversed electrode polarity stacking mode
RSD - Residual standard deviation
SC - Sodium cholate
SDS - Sodium dodecyl sulphate
SEF - Sensitivity enhancement factor
SPE - Solid phase extraction
SPDE - Solid phase disc extraction
SPME - Solid phase microextraction
SDME - Single drop microextraction
SPMD - Semi permeable membrane devices
SRM - Standard Reference Material
SRMM - Stacking with reverse migrating micelles
SRW - Stacking with reverse migrating micelles and a water
plug
TEF - Toxic Equivalent Factors
TEQ - Toxic Equivalent Concentrations
TCDD - Tetrachlorodibenzodioxins
- 2,3,7,8-tetracholordibenzo-p-dioxin

xxx
TCDF - Tetrachlorodibenzofurans
- 2,3,7,8-tetrachlorodibenzo-p-furan
UV - Ultraviolet
xxxi
LIST OF APPENDICES
List of Publications 152
List of Presentations 153

1
CHAPTER I
INTRODUCTION
1.1 Background
Since its introduction in the late 1980s, micellar electrokinetic
chromatography (MEKC) has been widely used in the pharmaceutical industry and in
environmental analysis. MEKC is a mode of capillary electrophoresis able to
separate both ionic and neutral analytes with the usage of charged micelles in a single
run. Separation by electrophoresis is obtained via differential migration of solutes of
charged species in an electric field performed in narrow-bore capillaries with inner
diameter (i.d) of 25-75 µm filled only with buffer. Its advantages lie in its flexibility
in manipulating various parameters on-column in order to obtain the best separation
and to improve sensitivity. Furthermore, separation time is faster compared to
conventional methods such as gas chromatography and high performance liquid
chromatography with very little sample and solvent requirement.
2
1.2 Summary
This study was conducted into two parts as two different separation
conditions were used. The first part was the study on separating polychlorinated
dibenzo-p-dioxins (2,3,7,8-tetrachlorodibenzo-p-dioxin) and polychlorinated
dibenzo-p-furans (2,3,7,8-tetrachlorodibenzo-p-furan) which were conducted under
basic conditions. The second part was the study of three hydrophilic
organophosphorous pesticides (OPPs) under acidic buffer conditions. The three
hydrophilic organophosphorous pesticides were monocrotophos, dicrotophos and
phosphamidon. This chapter summarizes every chapter covered in this work.
Chapter 2 introduces the background behind this work. It explains in detail
the physical and chemical properties of the test analytes which are the
polychlorinated compounds (PCDDs and PCDFs) and the hydrophilic pesticides.
The potential routes of PCDDs and PCDFs in humans and wildlife are also
discussed. While for the OPPs, we touched on the toxicity of the pesticides. Various
extraction and detection methods are also discussed for both class of analytes in this
chapter. On-line preconcentration methods using MEKC are also discussed in detail.
The objectives of this study and the problem statements are also covered.
Chapter 3 discusses the experimental methods used in this work. The
instrumental aspect covers the capillary electrophoresis system used for our analysis
and the extraction set-up used. Conditioning of the capillary was also discussed in
detail for both polychlorinated compounds and pesticides analysis. For both
polychlorinated compounds and the pesticides, the methodology used in optimizing
parameters and online preconcentration techniques used are found in Chapter 3.
Sample preparation and extraction methods for both analytes are covered in Chapter
3.
Chapter 4 covers the optimization of parameters used in the MEKC analysis
of TCDF and TCDD. The parameters optimized are the fraction of organic modifier
used in the running buffer in order to improve peak resolution. Single modifiers used
were methanol and acetonitrile at various percentages in the running buffer. These

3
were then compared with mixed modifier mode at different fractions of acetonitrile
and methanol in the running buffer. The second parameter involved the type of
sample matrix used. In aqueous mode, the analytes were diluted in water and in the
same fraction as the running buffer. While for non-aqueous mode, analytes were
diluted in the organic solvent which was ethanol. Different sample matrixes were
investigated to study the effect of the sample matrix on separation efficiency.
Chapter 5 explores the various on-line preconcentration techniques used to
reduce the detection limit for both TCDF and TCDD. Five types of on-line
preconcentration techniques were used which were normal stacking mode (NSM),
reversed electrode polarity stacking mode (REPSM), high conductivity sample
stacking mode (HCSSM), sweeping and field-enhanced sample injection (FESI).
Out of the five, the on-line preconcentration technique which gives the best limit of
detection (LOD) would be chosen to be applied to the real sample. HCSSM was
chosen as the optimized stacking method. This is then followed by off-line
preconcentration technique which is solid phase disc extraction (SPDE) to further
reduce the existing limit of detection (LOD) by offering sample enrichment. SPDE
is also able to do sample clean-up by removing interference in the matrix that would
interfere with the analysis. The combined HCSSM-SPDE was then applied to real
sample analysis of spiked deionised water and effluent water obtained from a pulp
mill at Temerloh, Pahang.
Chapter 6 involves the analysis of three hydrophilic OPPs which are
dicrotophos, monocrotophos and phosphamidon. In this chapter, the analysis using
MEKC was conducted under acidic conditions. This section discusses the
wavelength optimization for analyzing the three analytes using diode-array detection
(DAD). The wavelength that offers the best peak area and peak height was used in
the stacking method. Stacking with reverse migrating micelles (SRMM) was used to
reduce the detection limit (LODs) of the three analytes. This is followed by solid
phase disc extraction (SPDE) in order to reduce the LODs further by offering sample
enrichment and clean-up. The combined SRMM-SPDE was then applied to
analyzing spiked pond water obtained from the UTM lake.

4
Chapter 7 presents the conclusions and suggestions for further studies. This
chapter summarizes the results obtained throughout the study such as the optimized
conditions and recovery studies from the extraction method. Suggestions are
presented and discussed for further improvement of the study for future usage.

5
CHAPTER II
LITERATURE STUDY
2.1 Organic Pollutants
Persistent organic pollutants (POPs) are prone to long range transport as they
can be transported via the atmosphere and through water as leachate therefore being
carried to the upper levels of the atmosphere and deposited in remote areas. Even as
remote as the polar regions of the earth. Some of these chemicals have toxic
properties and have the ability to accumulate in biota due to high lipophicity and
resistance towards biodegradation such as dioxins.
Pesticides are another class of pollutants which covers a wide range of
substances such as insecticides, acaricides, fungicides, mollusicides, nematocides,
rodenticides and herbicides (Hamilton and Crossley, 2004). Organophosphorous
(OPP) pesticides have gradually replaced organochlorine compounds in the past 15-
20 years in agriculture, horticulture etc. as they are generally less toxic compared to
organochlorine compounds. But due to their high acute toxicity, they are hazardous
to workers who use them.

6
2.2 Chlorinated Dioxins and Dibenzofurans
“Dioxins” is a generic name given to 75 polychlorinated dibenzo-p-dioxins
(PCDDs) and 135 polychlorinated dibenzofurans (PCDFs). The most toxic PCDD
congener is 2,3,7,8-tetrachlorodibenzo-p-dioxin (2,3,7,8-TCDD) while another
closely related compound is 2,3,7,8-tetrachlorodibenzo-p-furan (2,3,7,8-TCDF)
(Choudhary et al., 1983). The toxicity of PCDDs and PCDFs is dependent on the
chemical structure of the compound. Dioxins and dibenzofurans chlorinated in the 2,
3, 7, and 8 positions have been demonstrated to be carcinogens. The general
structures of PCDDs and PCDFs are shown in Figure 2.1. The isomers with the
highest acute toxicities have 4-6 chlorine atoms and they have their four lateral
positions substituted for chlorine with an LD50 values in the range 1-100 µg/kg for
the most sensitive animal species (Choudhary et al., 1983). Therefore, the
Environmental Protection Agency (EPA) has made dioxin as one of the most toxic
chemicals regulated by EPA to be the subject of a series of agency-assessment dating
back to the 1980s (U.S. EPA 613, 1984, U.S. EPA 1613, 1994 and U.S. EPA 8280A,
1996). Its extreme toxicity requires very sensitive and highly specific analytical
techniques due to different isomers having different biological and toxicological
properties.
Figure 2.1: General structures of A) polychlorinated dibenzo-p-dioxins, PCDDs and B) polychlorinated dibenzofurans, PCDFs.
A) B)

7
2.2.1 Physical and Chemical Properties of 2,3,7,8-TCDF and 2,3,7,8-TCDD
The physical and chemical properties of 2,3,7,8-TCDF and 2,3,7,8-TCDD are
shown in Table 2.1. The extremely low water solubilities and vapor pressures
contribute to the difficulty in determining these and related physico-chemical
properties (e.g., Kow and Henry’s law constant) of these compounds. In general, the
melting point increases and the vapor pressures and water solubilities of PCDDs and
PCDFs decreases with the increase in number of chlorine substitutes. These
hydrophobic compounds are generally colorless solids and are soluble in organic
solvents. Generally they are thermally stable but decompose only at extreme heating
around 700°C. log Kow refers to the logarithm of the partition coefficients
octanol/water and it is sometimes known as log P. Due to their high log Kow, PCDDs
and PCDFs would partition between sediment or biota and water in a concentration
ratio between 106 to 107 (Choudhary et al., 1983). This characteristic gives them the
potential to accumulate in food chains due to their resistance towards metabolism or
chemical degradation.
Table 2.1: Physical and chemical properties of 2,3,7,8-TCDF and 2,3,7,8-TCDD.
Properties Compound
2,3,7,8-TCDF 2,3,7,8-TCDD
Molecular Weight 305.96 322
Melting Point, °C 219-221 305-306
Vapor Pressure, mm Hg at
25°C
9.21 x 10⁻⁷ 7.4 x 10⁻¹⁰
Water Solubility 0.42 µgL-1 19.3 ngL-1
Thermal Decomposition No Data 700°C
log Kow 5.82 7.02
Henry’s Law Constant
(atm-m3/mol)
1.48 x 10⁻⁵ 1.62 x 10⁻⁵

8
2.2.2 Toxicity of PCDDs and PCDFs
PCDDs and PCDFs have known toxicity and 2,3,7,8-tetrachlorodibenzo-p-
dioxin (TCDD) is the most toxic congener. Risk evaluation posed by their toxicity is
done using toxic equivalent factors (TEFs) (Danielsson et al., 2005). It was adopted
for the purpose of assessing cancer risk. The isomer TCDD appears to be the most
potent therefore in the TEF scheme it was assigned a TEF of 1.0. Table 2.2 shows
the TEFs for chlorinated dibenzodioxins and chlorinated dibenzofurans. Meanwhile
the toxic equivalent concentrations or TEQ values are defined as the summed
products of congener concentrations and corresponding TEFs and represent the
TCDD toxic potencies of the samples (Korytár et al., 2004).
Table 2.2: Toxicity Equivalent Factors (TEF) for chlorinated dibenzodioxins and chlorinated dibenzofurans (U.S EPA 8290A, 1998).
Analyte TEF
2,3,7,8- TCDD 1.00 1,2,3,7,8- PeCDD 0.50 1,2,3,6,7,8-HxCDD 0.10 1,2,3,7,8,9-HxCDD 0.10 1,2,3,4,7,8-HxCDD 0.10 1,2,3,4,6,7,8-HpCDD 0.01 1,2,3,4,6,7,8,9-OCDD 0.001 2,3,7,8-TCDF 0.1 1,2,3,7,8-PeCDF 0.05 2,3,4,7,8-PeCDF 0.5 1,2,3,6,7,8-HxCDF 0.1 1,2,3,7,8,9-HxCDF 0.1 1,2,3,4,7,8-HxCDF 0.1 2,3,4,6,7,8-HxCDF 0.1 1,2,3,4,6,7,8-HpCDF 0.01 1,2,3,4,7,8,9-HpCDF 0.01 1,2,3,4,6,7,8,9-OCDF 0.001
This compounds proceed through the binding to a soluble intracellular
protein, the aryl hydrocarbon receptor (AhR) which then deregulates expression of
key genes under the Ah receptor (Reiner et al., 2006). This then elicits Ah receptor-

9
mediated biochemical and toxic responses causing enzyme induction,
immunotoxicity, tumor promotion, developmental toxicity, chloracne, etc. (Behnisch
et al., 2001). The major pathway of human exposure to dioxins is food with a daily
intake ranging from 2 to 10 pg TEQ kg-1 body weight and per day for a 60 kg adult in
industrialized countries (Baeyens et al., 2004). Consequently, the separation,
identification and quantification of the most toxic isomers become important.
2.2.3 Potential Routes of PCDDs and PCDFs Exposure In Wildlife and
Humans
There are various ways PCDDs and PCDFs can enter the food chain and into
the biological systems of wildlife and humans. A majority of these routes are via
industrial processes.
2.2.3.1 Commercial and Technical Products
During the 1960s and 1970s there was evidence of phenoxy herbicides such
as 2,4,5-T (2,4,5-trichlorophenol) and other chlorophenoxy acids, pentachlorophenol
and other chlorinated phenols and PCBs (Kamrin and Rodgers, 1985 and
Baeyens et al., 2001) referred to as technical products being contaminated with
PCDD and PCDF. The major contaminant in 2,4,5-T is TCDD which was formed
from 2,4,5-trichlorophenol during the manufacturing of herbicides which made
significant amounts of TCDD being released into the atmosphere through herbicide
usage. Pentachlorophenol is mainly used as wood preservatives in which numerous
congeners of PCDDs and PCDFs were found with the chlorine numbers bigger than
6 (Nakamata and Ohi, 2003 and Lacorte et al., 2003). Commercial polychlorinated
biphenyl (PCB) mixtures contain PCDF in ppm amounts whereas PCDDs weren’t
detected causing PCBs to be phased out in the 1980s as a dielectric fluid in
capacitors and transformers.

10
2.2.3.2 Municipal Incinerators and Hazardous Waste Incinerators
The occurrence of PCDFs and PCDDs beside other chlorinated compounds in
fly ash from municipal solid waste (MSW) incinerators and hazardous waste
incinerators (HSW) has been well documented (Gough, 1986; Fiedler, 1996;
Kim et al., 2001 and Ferré-Huguet et al., 2005). With respect to the formation of
PCDDs and PCDFs, chloroethenes and chloroethines played the role as precursors.
The formation of PCDDs and PCDFs from chloroethenes and chloroethines could
only occur under pyrolytic conditions at temperatures above 400°C which matches
the environment in an incinerator. It was also discovered that complex thermal
reactions as the result of poor combustion could also be the cause of PCDDs and
PCDFs (Pandelova et al., 2006). Another potential source of PCDDs and PCDFs in
MSWs are from the wet scrubbers found in the flue gas cleaning systems in MSWs
and HSWs (Kreisz et al., 1996 and Hübner et al., 2005). This was due to plastics
(polypropylene and butyl rubber) applied in the area of the wet scrubbing system
(packed rubber, coating material). This material can be considered as hazardous
waste as it is strongly contaminated with PCDD/F. Therefore, the efficiency of the
incinerator is important in reducing the emission of these compounds.
2.2.3.3 Food Products
It is generally accepted that a majority of human exposure to PCDDs and
PCDFs is through the diet. This is because the mixture of dioxins and furans emitted
from combustion sources are in both the gaseous and particulate phase therefore
being adsorbed on airborne particulate or in sediments before being ingested by
humans. Most studies report fish and seafood being the main route of exposure
(>95%) (Gómara et al., 2005; Oh et al., 2005 and Turyk et al., 2006) followed by
oils and fats (Bocio and Domingo, 2005). In humans, children receive higher doses
of PCDD/Fs from food on body weight basis compared to adults (Charnley and
Kimbrough, 2005) such as in infants through contaminated breast milk

11
(How-Ran et al., 2005) and in baby food contaminated by ball clay (Hayward and
Bolger, 2005) although children have the ability to eliminate dioxins more rapidly
compared to adults. Following several episodic dioxin contamination incidents such
as during the Belgian animal feed-and-food crisis in 1999 (Behnisch et al., 2001) the
European Community (EC) has set maximum residue limits (MRLs) for dioxins in
various foods which were adopted on October 24, 2001 (Baeyens et al., 2004).
MRLs for foodstuffs are on a fat basis expressed in pg PCDD/F TEQ g-1 fat and have
been set to 1 for pork, 2 for poultry, mixed animal fat and fish oil for human
consumption while 3 for ruminants. For liver it was at 6, 3 for milk and eggs and
0.75 for vegetable oil. In order to reduce the presence of dioxins in feed and food, a
revision is planned to set lower levels by the year 2006.
2.3 Organophosphorous Pesticides (OPPs)
Organophosphorous (OPPs) pesticides have gradually replaced
organochlorine compounds in the past 15-20 years in agriculture, horticulture etc.
They are widely used in agriculture and animal production for the control of various
insects. They have higher acute toxicity than chlorinated pesticides but have the
advantage of being more rapidly degraded in the environment compared to
organochlorine compounds. There are 2 classes of OPPs depending on their
hydrophobicity. Hydrophilic OPPs include phosphamidon, dicrotophos and
monocrotophos. These class of OPPs were chosen as they are not easily detectable
in biological samples and aqueous conditions due to the alkylating activity of
organophosphate esters as they are very reactive. In modern agricultural practices,
excessive application of pesticides has caused serious environmental problems. The
leaching of pesticides into surface and groundwater is through bypass flow either in
solution or suspended in colloidal matter. This can cause poor pest control, crop
injury and increased loss of pesticides or accumulation of pesticides in the soil.

12
2.3.1 Physical and Chemical Properties
The functions and physical properties of the hydrophilic OPPs which are
phosphamidon, dicrotophos and monocrotophos are shown in Table 2.3. Referring
to Table 2.3, the log Kow refers to the logarithmic of octanol/water partition
coefficient which indicates the hydrophobicity of the analytes. Higher Kow refers to
increasing hydrophobicity. Phosphamidon is the most hydrophobic with a Kow of
0.795 while the most hydrophilic is monocrotophos with Kow of -1.97. OPPs are
generally esters, amides or thiol derivatives of phosphoric, phosphonic,
phosphorothioic or phosphonothioic acids (Lucio et al., 1986). The general
structural formula is shown in Figure 2.2 while the chemical structures for
phosphamidon, dicrotophos and monocrotophos are shown in Figure 2.3.
Table 2.3: Functions and physical properties of the three hydrophilic OPPs
Name
log Kow Function H2O Solubility, (g/L) (Zhu et al., 2005)
Ref.
Phosphamidon, 0.795 insecticides nematicides
299.69 Rabindranathan et al., 2003
Dicrotophos
-0.50 insecticides 237.20 Maul et al., 2005
Monocrotophos
-1.97 acaricides insecticides
223.16 Vijay et al., 2005
PR1
R2
O(S)
X
Figure 2.2: General structure of organophosphorous pesticides.

13
Figure 2.3: The chemical structures of (A) phosphamidon, (B) dicrotophos and (C) monocrotophos.
R1 and R2 are usually simple alkyl or aryl groups both of which may be
bonded directly to the phosphorous atom (phosphinates) or linked via –O-, or –S-
(phosphates) or R1 bonded directly and R2 via one of the above groups
(phosphonates). In phosphoroamidates, carbon is linked to phosphorous through an
–NH group. X can be any of a wide variety of substituted and branched aliphatic,
aromatic or heterocyclic groups, linked to phosphorous via a bond of some labiality
(usually –O- or –S-) known as the leaving group. The double bonded atom may be
oxygen or sulfur, and related compounds would be called phosphates or
phosphorothioates. The P=O form of a thioate ester known as the oxon is often
incorporated into the trivial name.
14
2.3.2 Toxicity of OPPs
OPPs work by inhibiting the acetychlolinesterase enzyme (AChE) in the
nervous system and subsequent accumulation of toxic levels of endogenous
acetylcholine (ACh) in nervous tissue and effector organs in both insects and
mammals (Aprea et al., 2002). Acetylcholinesterase is essential for acetylcholine.
In mammals, ACh is the chemical transmitter of nerve impulses at endings of post
ganglionic nerve fibers, somatic motor nerves to skeletal muscle and certain synapses
in the central nervous system. Therefore the accumulation of ACh causes signs that
mimic nicotinic, muscarinic and central nervous system actions of ACh. In fatal
cases this leads to disruption of nerve functions, convulsions, respiratory failure
which untreated would lead to asphyxiation. Muscarinic and nicotinic symptoms
include diarrhea, urination, miosis, bronchospasm, emesis, lacrimation and salivation
(Tarbah et al., 2001).
The alkylating activity of organophosphate esters explain why it is very
difficult to detect OPPs in food, in animal or human tissue or in blood; as they are
very reactive. Their instability in aqueous solutions especially in blood is due to the
presence of esterases. For example, phosphamidon is easily degraded into dimethyl
phosphate in the presence of blood or urine. Therefore, a highly sensitive, simple
and rapid method for quantification of unchanged OPPs in aqueous and biological
samples is required.
2.4 Sample Extraction and Clean-Up Strategies of Organic Pollutants
Extraction and clean-up strategies are needed for environmental samples
containing organic pollutants due to the presence of matrix interference which could
reduce the detection sensitivity of the method. Furthermore, extraction offers sample
enrichment which are able to concentrate the organic pollutants in the sample by
various folds as the analytes are usually at trace level.

15
2.4.1 Methods For The Extraction Of Organic Pollutants
Once the sample has been collected, extraction is needed to extract the
analyte concerned from environmental samples such as water samples, lipids etc. in a
volume that is sufficient for analysis. Several extraction techniques have been
introduced and the most popularly used due to its economical set up is Soxhlet
extraction. It was developed by Professor von Soxhlet in 1879. Soxhlet extraction
has been used in the extraction of OPPs from solid matter such as soil or grass before
being analysed with gas chromatography (GC-NPD) achieving a limit of detection
(LOD) of 10 µgkg-1 (Andreu and Pico, 2004). Analysis of PCDD/Fs has been done
on sediments (U.S. EPA 613, 1984; U.S. EPA 1613, 1994; U.S. EPA 8280A, 1996
and Suarez et al., 2006), water (Wenning et al., 1999), fly ash (Byung-Hoon et al.,
2005) and biological samples such as blood and serum (Focant and Pauw, 2002). Its
drawbacks are that it is very time consuming with one extraction taking up to 48
hours and require large amounts of organic solvents such as toluene or benzene. An
alternative would be to use accelerated solvent extraction (ASE) which uses
conventional liquid solvents at elevated pressures (1500-2000 psi) and temperatures
(50-200ºC) with extraction time reduced to 10-20 minutes per sample with only 10-
20 mL of solvent (Byung-Hoon et al., 2005). An even faster extraction method
would be to use a microwave oven giving the name microwave-assisted solvent
extraction (MASE) with an extraction time of 30 s for each seven cycles and at
recoveries exceeding 95% (Liem, 1999). MASE has the advantage of high sample
throughput and relatively small extraction times needed. Shorter extraction times
also prevent problems of degradation.
Pressurized liquid extraction (PLE) is similar to liquid-liquid extraction
(LLE) and uses increased temperatures and pressure and works according to static
extraction with superheated liquids. It was originally launched by Dionex Inc. in
1995 and called accelerated solvent extraction (ASETM) and is heavily used in the
extraction of dioxins and furans from environmental samples (Richter et al., 1997;
Saito et al., 2003; Focant et al., 2004 and Todaka et al., 2007). In practice the
stainless steel extraction cell containing the sample can be heated up to 200ºC and
pressurized to 3000 psi and the whole extraction process takes 10 minutes. Another

16
method besides ASE is PLE which is also commonly used in environmental analysis
especially in polychlorinated compounds (Kiguchi et al., 2006; Kiguchi et al., 2007
and Wiberg et al., 2007). Although PLE offers a higher degree of automation, yet it
is more expensive and still requires sample clean-up after extraction (Pirard and
Pauw, 2005), especially in the lipid rich biological samples that require large
amounts for dioxin analysis, PLE is not suitable to accommodate such a large
amount of sample as in Soxhlet extraction. In the extraction of OPPs, 9 part
acetonitrile and 1 part methanol was used as the extraction solvent before being
analysed with gas chromatography/mass spectrometry (GC/MS) (Menzinger et al.,
2000). PLE was combined with dimethyl sulfoxide/acetonitrile/hexane partitioning
for dioxin analysis in lipid-rich biological matrices under 2000 psi and ≥ 180ºC thus
reducing the amount of lipids generated making sulfuric acid treatment unnecessary
(Kitamura et al., 2004).
Solid phase extraction (SPE) is a widely used sample-preparation technique
for the isolation of selected analytes in a mobile phase which are transferred to the
solid phase and are retained for the duration of the sampling process. SPE is
commonly used in extraction of pesticides (Nordmeyer, K. and Their, H., 1999;
Schenck and Donoghue, 2000 and Wong, et al., 2003). Elution with solvents is then
carried out to extract the analyte from the solid phase (Poole, 2003). Some of the
various sorbents that have been used for extraction purposes from different matrices
for PCDDs, PCDFs, OPPs and PCBs are shown in Table 2.4. Based on Table2.4, the
most commonly used catridge is the C18 catridge which is suitable for organic
pollutants. SPE is easier and faster compared to conventional LLE and requires less
solvent. Furthermore, it easily automated and coupled with other clean-up system
(Focant et al., 2004) which cuts costs and reduces sample loss. Another similar
version to SPE is semipermeable membrane devices (SPMD) which was used to
extract PCDD/Fs from pulp mill effluents in the form of polyethylene tubes
containing triolein to trap these analytes from sludge (Koistinen et al., 1998).
Solid phase microextraction (SPME) a miniaturized technique is a new, fast
and simple sample preparation technique that uses coated fused-silica fibers to
extract analytes from aqueous or gaseous samples. SPME has been developed
17
rapidly for pesticide residues and dioxin analysis detection in soils (Cubas et al.,
2004), gases from thermal pyrolisis (Chia et al., 2004) and vegetables etc. A
recently developed approach in the detection of OPPs residues using SPME coupled
with SnO2 gas sensor has increased the detection sensitivity of the SPME fibre
(Xingjiu et al., 2004). A 100 µm poly(dimethylsiloxane) fiber was used in the
detection of OPPs in wines with a limit of detection below 5 ppb (Lόpez-Blanco et
al., 2005). Besides SPME, there are other similar types such as single drop
microextraction (SDME) which uses a microdrop of the solvent that is suspended
directly at the tip of the microsyringe needle that is immersed in a stirred aqueous
sample solution (Ahmadi et al., 2006). This approach has been able to solve the
limited lifetime of the SPME fibre and sample carry over. Matrix solid phase
dispersion (MSPD) that homogenized the vegetables in C18 sorbent and elution with
ethyl acetate was used in determination of fungicide residues which was simple and
less labor intensive (Kristenseon et al., 2004).
2.4.2 Clean-up Procedures for Organic Pollutants
During the extraction step, many interfering organic components are co-
extracted from environmental soil samples together with analytes. In the case of
dioxin analysis in biological samples, the most important task would be to remove
large quantities of lipids in the sample. As dioxin levels are extremely low, accurate
analysis of dioxins requires large amount of samples and the removal of lipids. In
order to remove lipids, acetone/hexane is commonly used followed by sulfuric acid
treatment to remove lipids. Yet this process is lengthy and conducive to emulsion
formulation that results in dioxin loss (Focant et al., 2004). Kitamura et al. used
tandem multi-layer silica gel-activated carbon (MLS-AC) column chromatography as
a rapid clean-up measure and has the potential to greatly reduce the amount of lipid
extracted by 1/100 causing sulfuric acid treatment unnecessary (Kitamura et al.,
2004). Silver nitrate silica column has been able to separate polybrominated
diphenyl ethers (PBDEs) from PCDDs and PCDFs which can’t be achieved with
merely a multi-layer silica column (Liu et al, 2006).

18
Tab
le 2
.4:
Exam
ple
of v
ario
us s
orbe
nts
used
in
SPE
for
the
anal
ysis
of
poly
chlo
rinat
ed d
iben
zodi
oxin
s, po
lych
lorin
ated
dib
enzo
fura
ns,
poly
chlo
rinat
ed b
iphe
nyls
(PC
Bs)
and
org
anop
hosp
horo
us p
estic
ides
(OPP
s) fr
om v
ario
us m
atric
es.
Ana
lyte
s M
atri
x So
rben
t E
lutin
g
Solv
ent
Ana
lytic
al
met
hod
LO
D
Ref
.
PCD
D/F
M
ilk
Non
-end
capp
ed
C18
bon
ded
silic
a.
hexa
ne
GC
-HR
MS
0.10
p
g/g
Foca
nt e
t al
., 20
04
So
il Si
lica
gel,
N
a 2SO
4 5%
2-p
ropa
nol
in h
exan
e (3
mL)
H
RG
C-M
S N
S G
awlik
et
al. ,
2000
Wat
er
SPE
Spee
disk
s Et
hano
l/tol
uene
(7
0:30
) H
PLC
0.
009
µg/g
M
artín
ez-
Cor
ed e
t al
., 20
00
Ef
fluen
t -C
18 b
onde
d si
lica.
-C
18 S
peed
isks
Et
hano
l/tol
uene
(7
0:30
) G
C-H
RM
S N
S 4.
2 pg
/L
Tayl
or e
t al
. , 19
95
and
Puja
das e
t al
. , 20
01
PCB
W
ater
C
18 E
mpo
re d
iscs
n-
pent
ane
GC
-µEC
D
NS
Wes
tbom
et
al.,
200
4
Hum
an
seru
m
Endc
appe
d
C18
bon
ded
silic
a.
n-he
xane
/DC
M
(1:1
v/v
) G
C-µ
ECD
0.
0012
- 0.
0026
ngm
L-1
Čon
ka e
t al
., 20
05
So
ils
and
sedi
men
ts
Ph+C
18+A
l D
iol+
C18
+Al
Ace
toni
trile
G
C-M
S-SI
M
NS
Dąb
row
ska
et a
l., 2
003
OPP
s So
il M
olec
ular
ly im
prin
ted
poly
mer
s (M
IP)
Dei
onis
ed
wat
er
LC-M
S N
S M
oulle
c et
al
., 20
06
W
ater
, po
tato
es a
nd g
rain
M
odifi
ed st
yren
e-di
viny
lben
zene
po
lym
er
Ace
tone
C
E-M
EKC
7-
150
ngm
L-1
Pére
z-R
uiz
et a
l., 2
005
W
ater
C
18 b
onde
d si
lica.
M
etha
nol
CE-
MEK
C
0.01
-0.1
ngm
L-1Sü
sse
et
al. ,
1996
*N
ote:
DC
M:d
ichl
orom
etha
ne. N
S: N
ot st
ated
.

19
Although silica column chromatography is popularly used, there have been
alternative sorbents such as XAD-2 resin (Suarez et al., 2006) and selective elution
from an AX-21activated charcoal/Silica gel chromatographic column based on
molecular relative planarity (Wenning et al, 1999). Florisil fractionation
chromatography was used to separate PCBs from PCDDs and PCDFs as activated
carbon chromatography gave inconsistent results (Liu et al., 2006). With human
blood samples, cleanup involved gel permeation chromatography and carbon-fiber
chromatography prior to HRGC/HRMS analysis (Kim et al., 2005).
2.5 Identification and Quantification of Organic Pollutants
In this section we are going to discuss the various detection methods used to
detect polychlorinated compounds and organophosphorous pesticides and their limits
of detection.
2.5.1 Gas Chromatography
Nowadays, gas chromatography (GC) plays an important role in
identification and quantification of organic pollutants in the environment. GC has
gone through many stages of developments from the classical packed column GC, to
capillary-GC columns and the need for multi-dimensional GC techniques (GC × GC)
(Santos and Galceran, 2002). Various methods of GC analysis for some examples of
PCDD/Fs from selected matrix are shown in Table 2.5 while Table 2.6 shows the GC
analysis of some examples of OPPs in selected matrix. From Table 2.5, HRGC-
HRMS has played an important role in detection of PCDD/Fs. HRGC-HRMS is
commonly used compared to other methods due to the very high detection sensitivity
achieving as low as pg level (Focant et al., 2006). For the OPPs, either GC-ECD or
GC-NPD has been used in the detection of pesticides in environmental samples.
Detection limits using GC are also satisfactory for pesticides achieving to as low as
0.2 µgL-1 (Ahmadi et al., 2006).

20
For the identification and quantification purpose, mass spectrometry (MS) is
the best suited and most widely used detection method. For greater sensitivity beside
low resolution MS (LRMS), high resolution MS (HRMS) and tandem mass
spectrometry (MS-MS) have also been used in the detection of OPPs and PCDD/Fs
in environmental samples. Limits of detection have been improved from the sub part
per million (ppm) level down to as low as part per trillion (ppt) or part per
quadrillion (ppq) level (Singh and Kulshrestha, 1997). Gas chromatography (GC)
coupled to 13C-based isotope dilution (ID) high-resolution (HR) mass spectrometry
(MS) is the hyphenated instrumentation of choice to measure ultra-trace levels till as
low as sub-picogram levels and it is also known as GC-IDHRMS (Focant et al.,
2006).
Yet GC analysis has its limitations in which it has a limited polarity range
that is not suitable for polar compounds commonly found in pesticides. For example
in GC-IDHRMS, the extracts must be free of any matrix interferences responsible for
ion-suppression. Furthermore, it requires a large amount of organic solvent that is
not environmentally friendly and a large amount of sample in GC analysis.
Therefore, alternative analytical methods are needed.
2.5.2 Micellar Electrokinetic Chromatography
Separation by electrophoresis is obtained via differential migration of solutes
of charged species in an electric field performed in narrow-bore capillaries with inner
diameter (i.d) of 25-75 µm filled only with buffer (Pyell, 2001). Micellar
electrokinetic chromatography (MEKC) is a hybrid of electrophoresis and
chromatography which can separate both neutral and ionic substance on the basis of
the chromatographic principle of partitioning the solute between the micelle and the
buffer solution giving differential migration of the two phases which was developed
by Terabe (Terabe, 1989). MEKC is becoming an advantageous tool for
determination of organic compounds such as shown for certain samples in Table 2.7.
Its flexibility in manipulating various parameters on-column in order to obtain the

21
best separation and to improve sensitivity makes it promising to be used for further
analysis of organic pollutants. Furthermore, separation time is faster compared to
conventional methods such as gas chromatography and high performance liquid
chromatography with very little sample and solvent is required.
2.5.3 Types of Surfactants
The separation of neutral analytes by MEKC is driven by the use of
surfactants at a level in the running buffer above its’ critical micelle formation
(CMC). The CMC is the concentration above which micelles start to form and its
value decreases with increasing concentration of the electrolyte counter ion (Fuguet
et al., 2005). This is due to the effect of the electrolyte neutralizing the charge at the
micelle surface reducing the electrostatic repulsion between them, thus improving
micellization. Knowing the CMC of surfactant at the buffering concentration to be
used is important as surfactant concentration below the CMC would prevent the
formation of micelles. These micelles are important to provide the micellar phase in
order for separation of analytes to occur. Sodium dodecyl sulphate (SDS), a
commonly used surfactant in MEKC has a CMC of 8.1 mM at 25°C in pure water
which differs in different electrolyte and a low Kraft point of 16°C in pure water
(Muijiselaar, et al., 1997). This characteristic enables it to be commonly used in
MEKC and furthermore it is cheaper compared to other surfactants. The Kraft point
refers to the temperature at which the solubility of the surfactant is lower than the
CMC.

22
Tab
le 2
.5: S
ome
exam
ples
of G
C a
naly
sis u
sed
for P
CD
D/F
s.
A
naly
tes
Mat
rix
Det
ecto
r L
OD
R
ef.
PCD
D/F
M
ilk
GC
-HR
MS
(GC
x G
C) -
µEC
D
0.10
pg/
g fa
t 70
-90
fg
Foca
nt a
nd P
auw
, 200
2 K
oryt
ár e
t al.,
200
4
Efflu
ent
GC
-HR
MS
GC
-MS
HPL
C
GC
-MS
GC
-MS
NS
NS
0.1
pg
NS
NS
43 n
g/L
Wes
tbom
et a
l., 2
004
Čon
ka e
t al.,
200
5 N
akam
ata
and
Ohi
, 200
3 M
artín
ez-C
ored
et a
l.,
1999
K
oist
inen
, et a
l., 1
999
Góm
ez e
t al.,
200
7
Sedi
men
ts
HR
GC
/HR
MS
HR
GC
/HR
MS
GC
-MS
GC
-MS
HR
GC
/HR
MS
GC
-MS
HR
GC
/HR
MS
NS
NS
NS
NS
NS
2.2-
77.2
ng/
g N
S
Gar
dina
li et
al.,
199
6 Li
u et
al.,
200
6 H
ashi
mot
o et
al.,
199
5 G
awlik
et a
l., 2
000
Suar
ez e
t al.,
200
6 C
hia
et a
l., 2
004
Pand
elov
a et
al.,
200
6
A
ir H
RG
C/H
RM
S H
RG
C/H
RM
S H
RG
C/H
RM
S
NS
NS
NS
Ass
uncã
o et
al.,
200
5 H
übne
r et a
l., 2
005
Byu
ng-H
oon
et a
l., 2
005
H
uman
seru
m
GC
-µEC
D
GC
-ID
HR
MS
0.00
12-
0.00
26 n
gmL-1
2 pg
/L
Čon
ka e
t al.,
200
5 Fo
cant
et a
l., 2
006
Shel
lfish
and
seaf
ood
GC
-µEC
D
NS
Góm
ara
et a
l., 2
005
*Not
e: N
ot st
ated
(NS)
.

23
Tab
le 2
.6: S
ome
exam
ples
of G
C a
naly
sis u
sed
for O
PPs.
A
naly
tes
Mat
rix
Det
ecto
r L
OD
R
ef.
OPP
s O
il R
apid
GC
-FPD
0.
003-
0.
0015
mg/
kg
Dug
o et
al.,
200
5
Sp
ices
G
C-E
CD
-FID
NS
Dan
is e
t al.,
200
2
B
iolo
gica
l sam
ples
G
C/P
ND
0.01
mgL
-1
Tarb
ah e
t al.,
200
1
W
ater
G
C-N
PD
0.
2-5.
0 µg
L-1
Ahm
adi e
t al.,
200
6
Fr
uits
G
C-F
TD
GC
-NPD
4-
20 µ
gkg-1
N
S B
oual
d et
al.,
200
0 B
arek
et a
l., 2
003
GC
-MS
0.
03-0
.06
mgL
-1G
itahi
et a
l., 2
002
Se
dim
ents
G
C-E
CD
N
S Y
ou e
t al.,
200
4
G
C-E
CD
1 µg
kg-1
A
ybar
-Muñ
oz e
t al.,
200
5
V
eget
able
s G
C-µ
ECD
, G
C-(
EI)M
S
5.7
µgkg
-1
Abo
u-A
rab
et a
l., 2
001
*Not
e: N
ot st
ated
(NS)
.

24
Tab
le 2
.7: S
ome
exam
ples
of d
eter
min
atio
n of
org
anic
pol
luta
nts u
sing
MEK
C.
C
ompo
und
Run
ning
buf
fer
LO
D
Ref
. PC
DD
/F
100
mM
SD
S-40
mM
γ-C
D, 5
M u
rea
solu
tion
(pH
9.0
).
0.1
ppm
O
tsuk
a et
al.,
199
9
Poly
chlo
rinat
ed
biph
enyl
s 0.
090
M C
HES
(pH
10.
0), 2
M u
rea,
0.1
1 M
SD
S, 0
.079
M β
-CD
an
d 0.
024
M γ
-CD
. 0.
08 M
CH
ES (p
H 1
0.0)
, 2 M
ure
a, 0
.09
M S
DS,
0.0
72 M
β-C
D
and
0.02
5 M
γ-C
D.
7.5
mM
bor
ate,
40%
(v/v
) ace
toni
trile
buf
fere
d at
pH
9.2
usi
ng
0.5%
(w/v
) pol
ysod
ium
und
ecyl
sulfa
te (p
oly-
SUS)
as t
he m
icel
le
.
40 m
gL-1
10
0-50
0 m
gL-1
N
S
Mar
ina
et a
l., 1
996
Ben
ito e
t al.,
199
7 Ed
war
ds a
nd S
ham
si, 2
000
OPP
s 20
mM
pho
spha
te b
uffe
r (pH
7.5
), 75
mM
SD
S SD
S, so
dium
cho
late
, sod
ium
deo
xych
olat
e an
d El
vaci
te 2
669
as
mic
elle
s at v
ario
us c
once
ntra
tions
with
eith
er p
hosp
hate
or b
orat
e bu
ffer
. 20
mM
sodi
um te
trabo
rate
(pH
9.1
), 10
mM
β-c
yclo
dext
rin, 1
20
mM
SD
S.
7-15
0 ng
L-1
NS
4-52
0 ng
L-1
Pére
z-R
uiz
et a
l., 2
005
Bag
heri
et a
l., 2
004
Agu
ilar e
t al.,
199
7
Phen
olic
co
mpo
unds
25
mM
SD
S in
25
mM
pho
spha
te-5
0 m
M b
orat
e bu
ffer
(pH
7.0
). 0.
04-0
.08
µgL-1
Wat
anab
e et
al.,
199
8
Ani
line
de
rivat
ives
50
mM
sodi
um la
uryl
sulfo
acet
ate
(LSA
),0.0
2 M
bor
ate-
phos
phat
e (p
H 7
.0).
NS
Take
da e
t al.,
199
8
*Not
e: N
ot st
ated
(NS)
. SD
S: so
dium
dod
ecyl
sulp
hate
, CH
ES: 2
-(N
-Cyc
lohe
xyla
min
o)et
hane
sulfo
nic
acid
.

25
Alkanesulfonate surfactants which are industrial products such as sodium N-
lauroyl-N-methyltaurate (LMT) are generally more stable than SDS at extreme pH
values but are not commonly used due to lower purity. A newer surfactant, sodium
lauroylsulfoacetate proved to be suitable as a micelle in the separation of aniline
derivatives (Takeda et al., 1998). Macromolecular surfactants such as poly (methyl
methacrylate-ethyl acrylate-methacrylic) acid (Elvacite 2669) (Watanabe et al., 1998)
and polysodium undecyl sulfate (poly-SUS) (Edwards and Shamsi, 2000) proved to
be ideal for moderate to highly hydrophobic compounds. They have the advantage
of a zero CMC thus precise micellar concentrations can be prepared irrespective of
temperature and buffer compositions. Bile salts such as sodium cholate (SC) and
sodium deoxycholate are a group of natural and chiral surfactants possessing
steroidal structures. They can separate neutral enantiomers and mixtures containing
both chiral and achiral compounds (Fuguet et al., 2002). They however cannot be
utilized in acidic conditions.
A relatively new area is the use of mixed micelles. The addition of either an
ionic or a non-ionic surfactant can alter the hydrophilic surface of the micelles even
at low concentration. This could introduce additional interactions which could
improve selectivity. It was reported of high separation efficiency in the separation of
eight aromatic compounds without an increase in current and Joule Heating with the
use of an ionic surfactant (SDS) with a non-ionic surfactant (Tween 20) which also
improved detection limits (Wang et al., 2004). Shang et al. utilized CD-MEKC with
mixed micelle separation involving SDS-SC in the separation of five
hydroxyanthraquinoids, thus creating a three pseudostationary phase system (Shang
and Yuan, 2003).
2.5.4 Organic Modifier Effect
The resolution, Rs between two peaks at times are less than 1.5 which is more
prevalent in hydrophobic compounds as they would completely solubilise in the
micelle (Bretnall and Clarke, 1995). In order to achieve baseline separation and to
26
enhance selectivity, organic modifiers can also be added to alter the partition constant
between the pseudostationary phase and the running buffer (Bretnall and Clarke,
1995) by enhancing the solubility in the aqueous buffer (Szökő et al., 1996). This is
done by reducing the retention factors of strongly bound solutes to the micelles, to
lengthen the migration time window and to enhance selectivities (Thorsteinsdóttir et
al., 1999). Addition of organic modifiers reduces the zeta potential, ζ at the capillary
wall-mobile phase interface which reduces the electroosmotic flow (EOF) resulting
in higher resolution at the expense of a longer analysis time. Examples of organic
modifier used in enhancing resolution includes methanol (Wan Ibrahim et al., 2005),
acetonitrile (Persson-Stubberud and Ǻström, 1998 and Weinberger and Lurie, 1999 ),
acetone, dimethyl sulphoxide (DMSO) and 2-propanol (Bretnall and Clarke, 1995).
Acetonitrile gave better peak resolution and peak shape in the separation of insulin as
stated by Deng et al., 2002. In addition acetonitrile improved the solubility of
running buffer components preventing the formation of air bubble peaks as compared
to other solvents.
2.5.5 Matrix Effect
Sample matrix has practical implications on both resolution and quantization
which may either improve or worsen the separation depending upon the CE
conditions used. Matrix effects are more profound in larger than small sample
injections. If the samples to be injected were to be dissolved in an adequate and
suitable sample matrix, narrower peaks would be produced, allowing greater volumes
of sample to be injected (Acedo-Valenzuela et al., 2004). In MEKC, most
hydrophobic compounds are not very soluble in water therefore most samples are
prepared in fully organic solvent such as in methanol or in a mixture of two solvent
systems (Otsuka et al., 1999) to aqueous rich media (Riekkola, et al., 2000). The
addition of organic solvent necessitates the solubilization which could effect the
separation. Due to convenience, most samples were preferred to be diluted in
aqueous rich media provided they are miscible in water. But with aqueous media,
due to the higher thermal conductivity there is a lower resistance towards heat

27
transfer compared to non-aqueous media (Quirino et al., 1999). Due to this, there is
an evidence of higher Joule heating in using aqueous media. Therefore, a very small
capillary internal diameter (i.d) is required to effectively dissipate the heat.
Examples of non-aqueous media include highly polar organic solvent such as
acetonitrile (Persson-Stubberud and Ǻström, 1998) to reduce this problem. Low heat
production leads to enhanced separation efficiency owing to reduced longitudinal
diffusion and uniform temperature distribution. The preparation of samples in
different media would give conductivity differences with respect to the separation
buffer which would influence the intensity of the peak area, peak height and
separation efficiency.
The type of media used in preparing the samples is important especially in
online concentration techniques whereby the type of media used is defined in terms
of conductivity differences in reference to the separating buffer. If the sample is
dissolved in a solution that has a lower conductivity (low ionic strength) than of the
background solution (BGS) such as in water or in the buffer matrix (20 or 100 times
lower concentration compared to the running buffer), it resembles the stacking
phenomenon which improves peak intensity and separation efficiency (Kim and
Terabe, 2003). Most people choose to prepare sample simply in organic solvents as
analysis can be performed easily and may remain stable for certain time. If the
sample were to be prepared in buffer matrix, each run requires fresh buffer with the
sample as the sample would degrade or destabilize in the buffer. Therefore a few
micro liters of sample needs to be prepared before hand which is a severe constraint
if the amount of real sample is small.
2.6 On-line Preconcentration Techniques in MEKC
The advantage of using CE is that only a few nanolitres of sample per
injection is required and CE is an energy efficient and more environmentally method
as it uses less organic and/or aqueous solvent. However detection sensitivity as
compared to gas chromatography has not been satisfactory due to the low UV

28
sensitivity contributed by its short path-length and minute injection volumes in order
to maintain high efficiency (Jiang and Lucy, 2002). A solution to this problem
would be to use on-column preconcentration techniques such as stacking and
sweeping. Stacking methods include normal stacking mode (NSM), reversed
electrode polarity stacking mode (REPSM), high conductivity sample stacking mode
(HCSSM) and field-enhanced sample injection (FESI)
2.6.1 Stacking
Stacking involves dissolving the neutral analytes in a solution that has a lower
conductivity than that of the BGS and injected as a long plug than that in normal
injection into the capillary which has been previously conditioned with anionic
micellar BGS (Quirino and Terabe, 1997a). The stacking method for MEKC is
illustrated in Figure 2.4. In the method, the sample is dissolved in a lower
conductivity solution in comparison to the BGS and injected as a long plug than in
normal injection. Sample stacking occurs as analytes cross the stacking that
separates the high field sample zone and low field BGS zone. Due to the boundary
difference in electric field, analytes in the sample zone would then move quickly then
slow down when they reach the low field BGS zone. Therefore, ions are stacked at
the boundary of the two zones (SB) (Quirino and Terabe, 1997a).
The simplest mode of stacking would be normal stacking mode (NSM) which
can be carried out under basic or acidic conditions that involves injecting a long plug
of low conductivity solution containing sample into the capillary previously filled
with high conductivity separation solution or background solution (BGS) (Quirino
and Terabe, 1997b). The stacking mechanisms in NSM are similar to that as
illustrated in Figure 2.4 under basic conditions. If it were to be under acidic
conditions, the polarity would be reversed and the samples would migrate from
negative to positive polarity. Quirino and Terabe managed to achieve almost an
order of magnitude improvement in detection limit for resorcinol (Quirino and

29
Terabe, 1997b). It has also been used to detect pesticides in foods achieving a LOD
of 60-70 ppb (Hernández-Borges et al., 2005).
Figure 2.4: Schematic diagram of the principle of sample stacking in MEKC. SB is the stacking boundary. EOF is the electrooosmotic flow. (Quirino and Terabe, 1997a).
Besides NSM, reversed electrode polarity stacking mode (REPSM) can also
be used under basic conditions. Figure 2.5 is the schematic diagram of REPSM
stacking mechanism of analytes in MEKC. Firstly, (Fig 2.5A), long hydrodynamic
injection of sample in low conductivity matrix is injected after conditioning the
capillary with high conductivity BGS. Followed by (Fig 2.5B), application of
voltage at negative polarity with both inlet and outlet vials containing the BGS. Fig
2.5C and Fig 2.5D is the switching of polarity from negative to positive when current
reaches 97-99% of the actual value. Voltage is maintained until all the analytes have
been detected. The conditions remain the same as in NSM but with electrokinetic
injection of micelles from the BGS at negative polarity to facilitate stacking of
analytes and removal of the sample matrix. Once the current reaches 97-99% of the
predetermined current, polarity is switched to positive to enable separation and
detection of stacked zones (Carabias-Martínez, 2003). Although REPSM gave much
greater sensitivity enhancement around 85, yet if polarity was switched later, a loss
of the more polar analytes would be observed as these compounds are being pumped
30
out from the capillary by the EOF and they are not retained in the micelle (Núñez,
2001; Süsse and Müller, 1996; Nevado et al., 2002 and Quirino and Terabe, 1998a).
This is because stacking efficiency depends on analyte retention factors. Analytes
with higher retention factors, k which are usually more hydrophobic are more
efficiently stacked. These analytes are able to withstand the EOF while for a more
polar analyte they would have been removed along with the EOF from the capillary,
thus causing sample loss. In CZE, REPSM is also known as large volume sample
stacking (Albert et al., 1997; Smyth et al., 1997; Núñez et al., 2001; Leung et al.,
2002 and Laamanen et al., 2006).
High-conductivity sample stacking mode (HCSSM) uses a high-conductivity
sample matrix to transfer field amplification from sample zone to the separation
buffer promoting stacking. This can be carried out by adding salt such as sodium
chloride to the sample matrix giving LODs in the nanomolar range (Palmer and
Landers, 2000). The critical factors for stacking to occur are that the sample anion
has a larger charge-to-mass ratio than the run buffer micelle and the ionic strength of
the sample matrix is higher than the run buffer (Palmer, 2004). The sample matrix
must contain a co-ion with a higher intrinsic electrophoretic mobility than the micelle
to guarantee the formation of a pseudo-steady-state boundary between the micelle
and co-ion component in the sample region (Jiang and Lucy, 2002). This stacking
method was able to analyze nitroaromatic explosives in seawater achieving detection
limits of 0.1 ppm (Giordano et al., 2006). High salt stacking was also used in the
determination of pesticides in fruits and natural waters achieving limits of detections
(LODs) within the µg/L range (Molina and Silva, 2000).

31
Figure 2.5: Schematic diagram of stacking of analytes during REPSM. (A) Before stacking; (B) micelles enter the capillary and carry with it neutral analytes a, k(ax)>k(ay)>k(az); (C) micelles and neutral analytes stack at the concentration boundary (B2) and (B1) and polarity is switched later to positive; (D) separation and later detection of zones. Retention factor is referred with the symbol k. ax, ay and az refer to the stacking boundary for analyte x, analyte y and analyte z. (Quirino and Terabe, 1997b)
Field enhanced sample injection (FESI) is another stacking method with the
sample being prepared in a low-conductivity micellar matrix at neutral pH which is
electrokinetically injected at negative polarity (Quirino and Terabe, 1998b). The
mechanisms of FESI-MEKC are illustrated in Figure 2.6. Before sample injection, a
water plug is introduced at the inlet end of the capillary filled with BGS as shown in
Figure 2.6A. Sample prepared in micellar matrix is placed in the inlet position and
polarity applied in negative mode. Due to the enhanced field of the water plug,
which generates electrophoretic velocities that are greater than the bulk EOF flow,
micelles and neutral analytes solubilized in them thus entering the capillary as shown
in Figure 2.6B. Once the current has reached 97-99%, the voltage is shut off and the
sample vial replaced with the BGS vial in Figure 2.6C. Separation voltage is then
applied at positive polarity for separation (Figure 2.6D). FESI was coupled with
reverse migrating micelles in MEKC (FESI-RMM) in acidic conditions in the

32
analysis of flavonoids found in Epimedium brevicornum Maxim, a Chinese medicinal
herb achieving 360 fold improvement in detection sensitivity (Wang et al., 2003).
FESI-RMM has also been used in the determination of saponins in ginseng achieving
an LOD of 1.7-6.3 µg/mL (Wang et al., 2006). FESI was also used in determination
of pesticides in food and water samples with LODs from 0.02-0.08 mg/L under
electrokinetic injection at 10 kV for 35 s (Hernández-Borges et al., 2005).
Stacking in acidic conditions offer greater choice compared to basic
conditions which requires the suppression of the EOF. Large volume stacking with
polarity switching by Albert et al. in the analysis of anions involves hydrodynamic
introduction of a large sample plug followed by application of negative voltage at the
injection extremity (Albert et al., 1997). The large solvent plug were then
electroosmotically pushed out of the capillary while the anions stack at the boundary
between the sample zone and the background electrolyte. This was then followed by
separation voltage at positive polarity. A 20-fold increased in sensitivity has been
achieved. This stacking method carried out in aqueous conditions whereby the
buffers are prepared in fully aqueous media but Blanco et al. have demonstrated that
non-aqueous CE (NACE) whereby buffers were prepared in methanol is also possible
which performed superior to aqueous conditions (Blanco et al., 2005).
Stacking with reverse migrating micelles (SRMM) is performed by preparing
the sample in a low conductivity matrix and introduced hydrodynamically at the
cathodic end and then separation voltage is applied at negative polarity at the
injection end (Quirino et al., 2000; Chou et al., 2005). The concept is similar to NSM
but as for NSM the stacking is conducted under basic conditions. It is simpler
compared to REPSM as no polarity switching is required. SRMM was applied to the
trace analysis of multi-residue pesticides in water and vegetables with off-line solid-
phase extraction achieving LOD of 0.1 µg/L (Silva et al., 2003). SRMM has been
able to reduce the LOD of melatonin to 30ng/mL and was applied to the analysis of
this hormone in human serum (Musijowski et al., 2006).
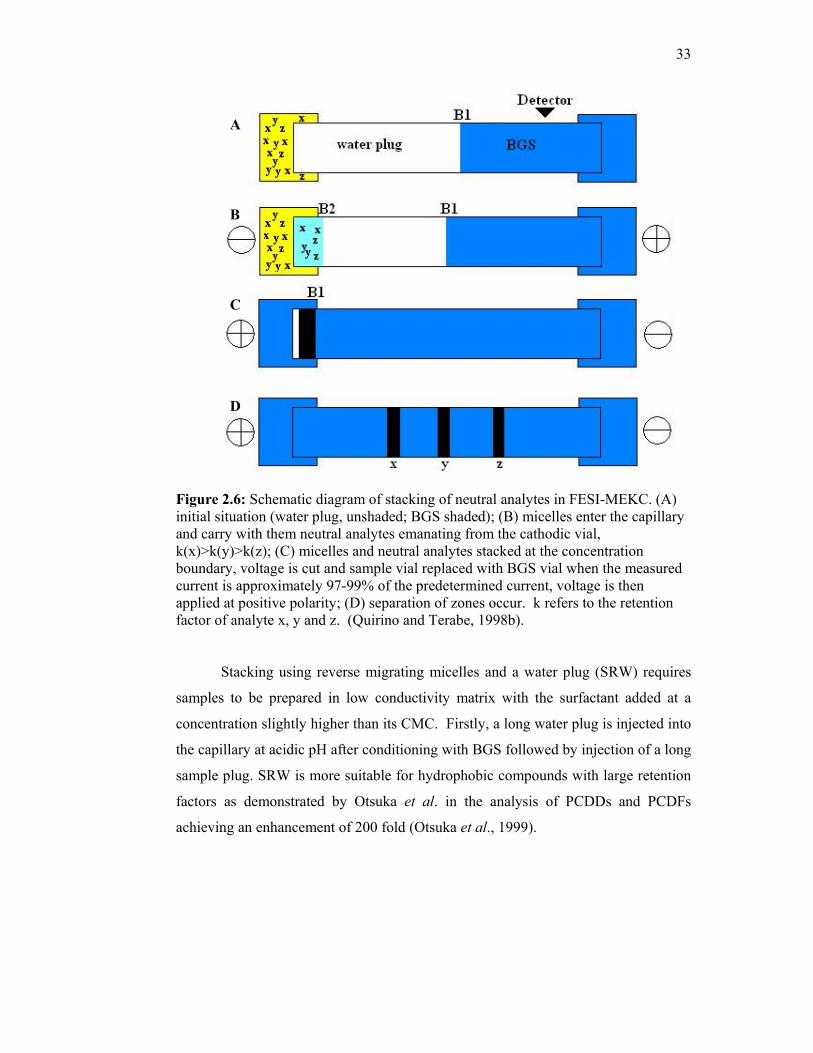
33
Figure 2.6: Schematic diagram of stacking of neutral analytes in FESI-MEKC. (A) initial situation (water plug, unshaded; BGS shaded); (B) micelles enter the capillary and carry with them neutral analytes emanating from the cathodic vial, k(x)>k(y)>k(z); (C) micelles and neutral analytes stacked at the concentration boundary, voltage is cut and sample vial replaced with BGS vial when the measured current is approximately 97-99% of the predetermined current, voltage is then applied at positive polarity; (D) separation of zones occur. k refers to the retention factor of analyte x, y and z. (Quirino and Terabe, 1998b).
Stacking using reverse migrating micelles and a water plug (SRW) requires
samples to be prepared in low conductivity matrix with the surfactant added at a
concentration slightly higher than its CMC. Firstly, a long water plug is injected into
the capillary at acidic pH after conditioning with BGS followed by injection of a long
sample plug. SRW is more suitable for hydrophobic compounds with large retention
factors as demonstrated by Otsuka et al. in the analysis of PCDDs and PCDFs
achieving an enhancement of 200 fold (Otsuka et al., 1999).
A
B
C
D

34
2.6.2 Sweeping
Sweeping is where analytes are picked up and concentrated by the micelle
that penetrates the sample zone devoid of micelle. This process is explained in
Figure 2.7. This technique generally uses very low pH buffers to suppress the EOF
achieving an enhancement of 500 times (Huang and Lin, 2005). The analytes are
prepared in a matrix with the same conductivity as the background solution (BGS)
which can either be neutral or charged analytes (Huang et al., 2006). The injected
length of a neutral analyte zone is theoretically narrowed by a factor equal to 1/(1+k)
(k, retention factor) and the concentration can be increased approximately by a factor,
1+k (Quirino and Terabe, 1999 and Quirino et al., 2000). These were under
conditions of relatively constant electric fields, throughout the capillary, negligible
electroosmotic flow, and neutral analytes prepared in a matrix void of the micelle.
Sweeping is dependent on the retention factor of the analyte, therefore it is suitable
for strongly retained analytes. Sweeping is basically used for highly hydrophobic
analytes which have high k values. Drugs such as flunitrazepam (Huang et al., 2006),
steroids (Jen et al., 2003) and ketamine (Chen et al., 2004) have been detected using
sweeping MEKC in biological fluids achieving sensitivity enhancements ranging
from 110 to as high as 800 times. Sweeping has also been used in the detection of
trace amounts of pesticides in real samples (Silva et al., 2003 and Otsuka et al.,
2003). Sweeping was able to determine of steroids in plasma and urine samples with
good sensitivity within the ngmL-1 range (Chen et al., 2004b).

35
Figure 2.7: Schematic diagram of sweeping of analytes in MEKC under low electroosmotic flow. (a) Starting situation, injection of S prepared in a matrix having conductivity similar to that of the BGS; (b) application of voltage at negative polarity, micelles emanating from the cathodic side sweeping analyte molecules; (c) the injected analyte zone is assumed completely swept (Shao and Tseng, 2005).
2.7 Problem Statement
Analysis of PCDDs and PCDFs has usually been carried out using capillary
gas chromatography (cGC) such as cGC-MS and cGC-ECD (Singh and Kulshrestha,
1997). cGC-MS provides high resolution and high sensitivity can be attained.
However, this method requires rather large amount of sample, and hence it requires
high cost and time consuming pre-treatment of the sample. By applying MEKC to
the analysis of PCDDs, we can expect to reduce the sample amount as well as obtain
a simple method that requires less energy, less organic solvents or aqueous solvent
and environmentaly friendly method. 2,3,7,8-TCDD is the most commonly analyzed
isomer as it is the most toxic congener. Analysis has also been carried out on other
tetraCDD/CDFs, other isomers chlorinated in the 2,3,7 and 8 positions,
pentaCDD/CDFs, hexaCDD/CDFs, heptaCDD/CDFs and octaCDD/CDF (Gómara et
al., 2005). The studies done using MEKC involved 1247-/1248-TCDD isomer pair
mixture (Grainger et al., 1996). Another study by Otsuka involved dibenzofuran,
dibenzo-p-dioxin, 2,3- and 2,7-dichlorodibenzo-p-dioxins and 2,3,7-
trichlorodibenzo-p-dioxin (Otsuka et al., 1999). This study compared normal CD-
MEKC and SRW-CD-MEKC. The LOD (S/N=3) obtained were around 20 ppm with
normal CD-MEKC. The LOD reduced greatly to 0.1 ppm with SRW-CD-MEKC.

36
This creates opportunity to further reduce the existing LOD as this sort of level is
insufficient for real sample analysis. Thus far, no study has been conducted on
2,3,7,8-TCDD and 2,3,7,8-TCDF using MEKC. Therefore this study was carried out
to see whether MEKC is feasible in separating both compounds under minimal
analysis time as compared to conventional methods such as GC in addition to
reducing the limit of detection further by coupling on-line and off-line concentration
techniques. The off-line concentration method to be used would be solid phase
extraction. The optimized method would then be applied to analyzing effluent from
industrial wastewater obtained from a pulp mill.
Despite its extremely high separation efficiency, short analysis time and wide
application range, yet CE-MEKC cannot achieve detection limits as low as in GC or
HPLC which can reach to as low as part per trillion (ppt) or part per quadrillion
(ppq). This is due to the short optical path length of the UV detection cell which is
equal to the capillary diameter. Furthermore, poor concentration sensitivity is also
due to minute injection volumes needed to maintain high efficiency. Therefore,
further method development is required in order to improve detection sensitivity.
The usage of different detectors such as laser-induced fluorescence, electrochemical
or amperometric detection and installation of capillaries with extended detection path
length (Z-shaped or bubble cell) is costly and involve complex hardware and
maintenance. Therefore method development using online preconcentration
techniques in order to improve the detection limit is important in MEKC. However,
as preconcentration techniques have their limitations, off-line preconcentration
techniques such as solid phase extraction (SPE) are needed. The coupling of off-line
and on-line concentration techniques, can reduce the limit of detection greatly.
As for the hydrophilic OPPs, they are one of the most commonly used
pesticides in industrialized countries and are an important source of environmental
contamination especially in water bodies. The wide introduction of synthetic organic
pesticides posed to chemists many new analytical tasks associated with the
determination of these pesticides and the products of their decomposition which are
frequently more toxic compared to the original compounds. Therefore, the analysis
of pesticide residues requires methods capable of determining the analytes at ppb, ppt
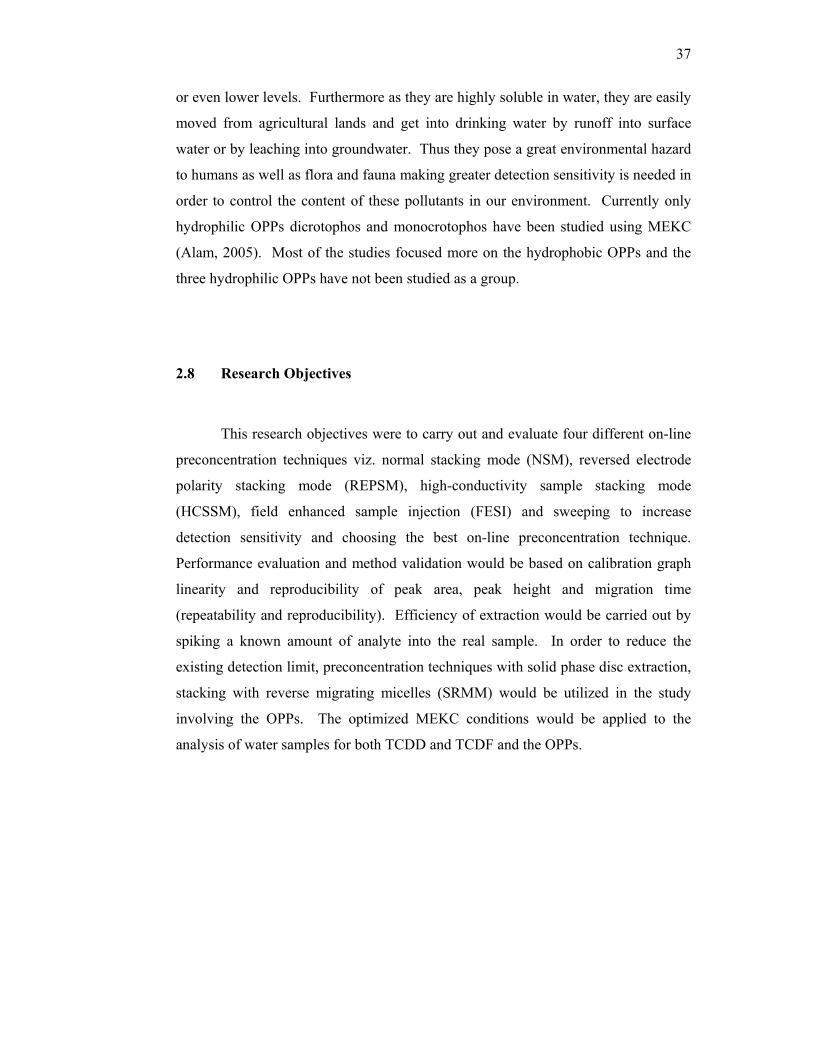
37
or even lower levels. Furthermore as they are highly soluble in water, they are easily
moved from agricultural lands and get into drinking water by runoff into surface
water or by leaching into groundwater. Thus they pose a great environmental hazard
to humans as well as flora and fauna making greater detection sensitivity is needed in
order to control the content of these pollutants in our environment. Currently only
hydrophilic OPPs dicrotophos and monocrotophos have been studied using MEKC
(Alam, 2005). Most of the studies focused more on the hydrophobic OPPs and the
three hydrophilic OPPs have not been studied as a group.
2.8 Research Objectives
This research objectives were to carry out and evaluate four different on-line
preconcentration techniques viz. normal stacking mode (NSM), reversed electrode
polarity stacking mode (REPSM), high-conductivity sample stacking mode
(HCSSM), field enhanced sample injection (FESI) and sweeping to increase
detection sensitivity and choosing the best on-line preconcentration technique.
Performance evaluation and method validation would be based on calibration graph
linearity and reproducibility of peak area, peak height and migration time
(repeatability and reproducibility). Efficiency of extraction would be carried out by
spiking a known amount of analyte into the real sample. In order to reduce the
existing detection limit, preconcentration techniques with solid phase disc extraction,
stacking with reverse migrating micelles (SRMM) would be utilized in the study
involving the OPPs. The optimized MEKC conditions would be applied to the
analysis of water samples for both TCDD and TCDF and the OPPs.

38
2.9 Scope of Work
The overall study would focus on MEKC with diode array detection (DAD)
in separation of selected organic pollutants which are TCDD and TCDF and selected
hydrophilic organophosphorous pesticides (OPPs) viz. phosphamidon,
monocrotophos and dicrotophos. The study on TCDD and TCDF focus on the
optimization of separation conditions using MEKC with diode-array detection and
using the optimized condition to perform on-line preconcentration techniques. The
on-line preconcentration techniques include normal stacking mode (NSM), reversed
electrode polarity stacking mode (REPSM), high-conductivity sample stacking mode
(HCSSM), field enhanced sample injection (FESI) and sweeping. The on-line
preconcentration techniques giving the best LOD for both analytes will be selected
for the analysis of real sample (water sample). Off-line SPDE will also be performed
to reduce the LOD to a level useful for environmental purpose such as in water
sample analysis. In the analysis of the selected hydrophilic OPPs, we would be using
diode-array detection in optimizing the wavelength for the three analytes. The
buffer, organic modifier and surfactant concentration have already been optimized in
a previous study and therefore would be used in this study. We would then proceed
to stacking with reverse migrating micelles (SRMM) to reduce the limit of detection.
Off-line SPDE would also be used in order for the method to be applied to water
sample analysis. The flow chart for the research methodology of TCDF and TCDD
are shown in Figure 2.8 while for the three hydrophilic OPPs the flow chart is shown
in Figure 2.9.
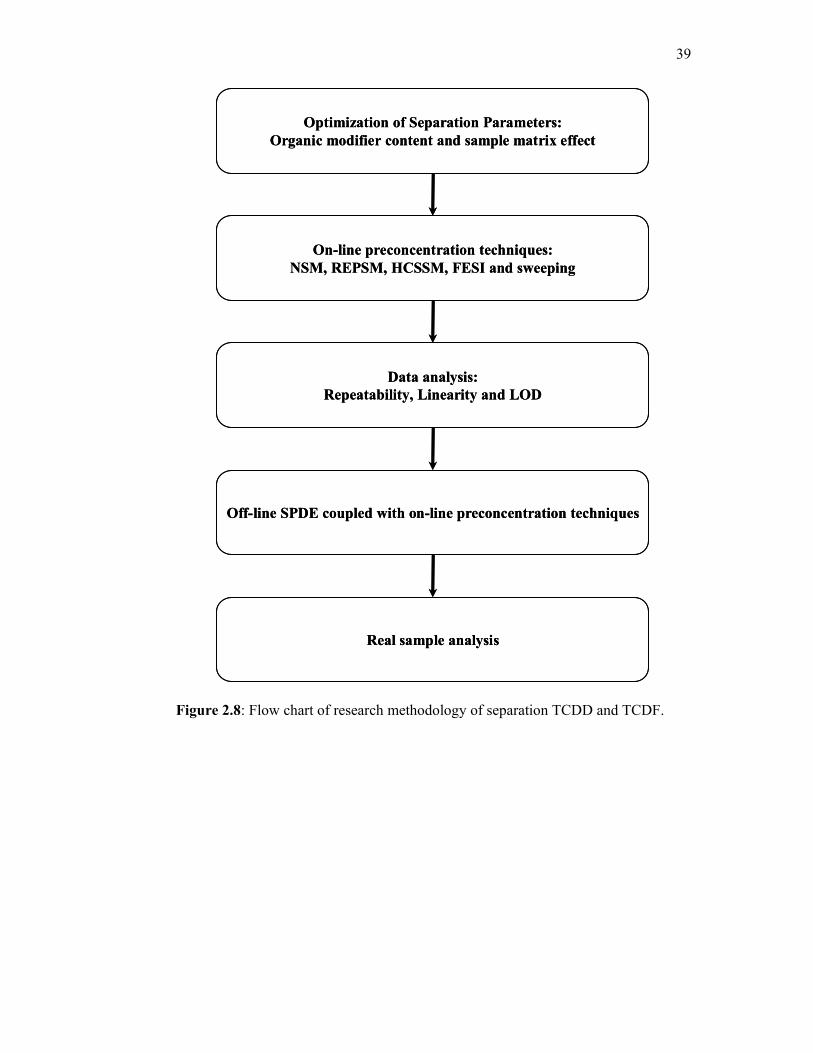
39
Optimization of Separation Parameters:Organic modifier content and sample matrix effect
On-line preconcentration techniques:NSM, REPSM, HCSSM, FESI and sweeping
Data analysis:Repeatability, Linearity and LOD
Off-line SPDE coupled with on-line preconcentration techniques
Real sample analysis
Optimization of Separation Parameters:Organic modifier content and sample matrix effect
On-line preconcentration techniques:NSM, REPSM, HCSSM, FESI and sweeping
Data analysis:Repeatability, Linearity and LOD
Off-line SPDE coupled with on-line preconcentration techniques
Real sample analysis
Figure 2.8: Flow chart of research methodology of separation TCDD and TCDF.

40
`
Optimisation conditions from previous study (Alam, 2005):Separation buffer: 20 mM phosphate (pH 2.3), 10
mM SDS and 10% v/v methanol, Separation voltage: -25 kVHydrodynamic sample injection for 10 s at 50 mbar
Wavelength Optimisation:195, 205, 220, 225 and 230 nm
Stacking With Reverse Migrating Micelles (SRMM)
Off-line SPDE coupled with on-line preconcentration techniques.
Real sample analysis
Figure 2.9: Flow chart of research methodology of separation of the three hydrophilic OPPs viz. phosphamidon, dicrotophos and monocrotophos.

41
CHAPTER III
EXPERIMENTAL
3.1 Introduction
In this chapter, the reagents, instrumentations and experimental designs used
in this research are discussed in detail.
3.2 Reagents
Analytical reagent (AR) grade sodium cholate was from Wako, Japan while
AR grade Di-sodium tetraborate decahydrate, Na2B4O7.10H2O and AR grade
anhydrous sodium sulphate, was obtained from Fisher Chemicals (UK). Sodium
dodecyl sulphate (SDS) was from Fischer Scientific (Loughborough, UK). Di-
sodiumhydrogen phosphate and sodium hydroxide pellets were from Riedel-de Haen
(Seelze, Germany). Hydrochloric acid (0.1 M) was from Sigma (St. Louis, MO,
USA). HPLC grade acetonitrile and HPLC grade methanol were obtained from J.T.
Baker (California, USA). ACS grade toluene, dicloromethane and concentrated
sulphuric acid were obtained from J. T. Baker Inc. (New Jersey, USA) while
denatured absolute ethanol was obtained from HmbG Chemicals (Germany). The
polychlorinated dioxins (PCDDs) and polychlorinated furans (PCDFs) which were
2,3,7,8-tetrachlorodibenzo-p-furan (TCDF) and 2,3,7,8-tetrachlorodibenzo-p-dioxin
42
(TCDD) as test analytes were from AccuStandard (New Haven, Connecticut, USA).
Stock solutions of TCDF at 800 ppm and TCDD at 670
ppm were prepared in HPLC grade 1,4-dioxane obtained from BDH Laboratory
Reagents, UK. AR grade hydrophilic organophosphorous pesticides chosen were
phosphamidon, dicrotophos and monocrotophos, obtained from Dr. Ehrenstorfers
GmbH laboratory (Augsburg, Germany). Stock solutions of these pesticides were
prepared in methanol at 1000 ppm. Deionised water was obtained from Milipore
UltraPure Water System purified up to 18 MΩ. Figure 3.1 shows the chemical
structure of TCDF and TCDD.
Figure 3.1: Chemical structure for TCDF and TCDD.
TCDF TCDD
O
Cl
Cl
Cl
Cl
O
OCl
Cl
Cl
Cl
3.3 Instrumentations
MEKC separations of TCDF, TCDD and the three hydrophilic
organophosphorous pesticides (OPPs) were conducted on a Agilent capillary
electrophoresis system (220V Agilent Capillary Electrophoresis System, Hanover,
Germany) equipped with a diode array detector with the optimum wavelength set at
225 nm. Data acquisition and system control was carried out by the 3D-CE
ChemStation Software by Agilent Technologies. Standard bare fused silica
capillaries from Agilent Technologies (Hanover, Germany) with 48.5 cm total
length, 40 cm effective length and 50 µm i.d. were utilized to perform the separation.
Injection offset was set at 4 mm with a constant temperature within 25ºC ± 1ºC.
Polypropylene vials (1 mL) from Agilent Technologies (Hanover, Germany) were
used to place samples, buffers and other solutions in the electrophoretic systems.

43
All samples and buffer solutions were filtered through a 0.45 µm nylon filter
disc from Whatman (New Jersey, USA). The final buffering solution pH was
measured by a Cyberscan 500 pH meter from Eutech Instruments Pte. Ltd.
(Singapore). Samples were introduced hydrodynamically at a constant pressure of
50 mbar at different time span and are mentioned as appropriate. Separation voltage
remained constant at 25 kV at positive polarity for the analysis of the two
polychlorinated compounds under basic condition while for the OPPs, separation
voltage was at -25 kV under acidic conditions. Conductivities were measured with a
Horiba ES 12 conductivity meter (Kyoto, Japan).
Envi-DiskTM octadecyl (C18) disks (47 mm i.d., 0.5 mm thick) were
supplied by Supelco (Bellefonte, PA, USA). These C18 disks were to be used in the
solid phase extraction of TCDF and TCDD and OPPs from water samples. Samples
were extracted with a Sigma Aldrich vacuum manifold system hooked up to the A-
3S Aspirator supplied by Eyena, (Tokyo Rikakikai Co. Ltd). Filtration was carried
out twice using a 47 mm diameter, 0.45 µm cellulose acetate membrane filter
provided by Whatman (New Jersey, USA) for the water samples.
3.4 Conditioning of the Capillary
At the beginning of each day, the capillary was flushed for 10 min with 1N
NaOH to activate the silanol groups of the capillary followed by 20 min of deionized
water, and 5 min of running buffer. Before each sample injection, the capillary was
rinsed for 5 min with 0.1N NaOH, followed by 5 min with the running buffer. In
between runs, high pressure water was passed through the capillary for 10 min to
flush out any impurities and to ensure a longer capillary life followed by 3 min of 1N
NaOH, and 3 min of the running buffer to ensure reproducibility. At the end of the
day, the capillary was flushed with 20 min of water followed by 20 min of air. Both
ends of the capillary were dipped in deionized water before shutting down for the
day.
44
For the analysis of OPPs, the capillary was flushed for 10 min with 0.1 M
NaOH to activate the silanol groups of the capillary followed by 10 min of deionized
water followed by 10 min of running buffer at the beginning of the day. Before each
sample injection, the capillary was rinsed for 5 min with 0.1M NaOH, followed by 5
min with deionised water before flushing with 5 min of running buffer. With
separations in acidic buffers, continuous flushing with deionised water for
approximately 15 min in between runs was necessary to clean the capillary properly
with the usual EOF characteristics. To end the day, the capillary was flushed with
water for 20 min followed by air for 20 min. Both ends of the capillary were dipped
in deionized water before shutting down for the day. Peak identification was
performed by injection of single solution of the respective standard under similar
conditions and comparison based on migration times.
3.5 Procedures for MEKC Separation of TCDF and TCDD.
The MEKC separation of TCDF and TCDD such as optimization of
parameters and online concentration techniques are discussed in detail in this section.
3.5.1 Preliminary Investigation For The Separation of TCDF and TCDD
MEKC separations of the two analytes were performed with 20 mM Di-
sodium tetraborate decahydrate buffer containing 20 mM of sodium cholate (SC) as
the chiral surfactant. The effect of various percentages of acetonitrile (MeCN) on the
migration time and separation efficiency were investigated using 5-20% MeCN. The
final buffer pH range after combining all components was 9.16-9.22. Standard
samples of TCDD (40 ppm) and TCDF (40 ppm) were injected individually to obtain
their individual migration time. This is then followed by a mixture of the two
analytes (100 ppm each) for the optimization step. Hydrodynamic injections were
made by applying a pressure at 50 mbar to the sample vial for 1 s. Separations were
45
carried out with positive polarity (anodic injection) at 25 kV at a constant
temperature of 25°C.
3.5.2 Evaluation of Organic Modifier Effect on The Separation of TCDF and
TCDD
Normal mode MEKC separations of the two analytes were performed with
the running buffer described in Section 3.5.1. The effects of various percentages of
methanol (MeOH) on migration time and separation efficiency were investigated
using 5-20% v/v of each organic modifier in separate running buffer vials. This was
followed by investigation using mixed modifiers, namely 5% v/v of MeCN-MeOH
(1:1 v/v), 5% v/v of MeCN-MeOH (3:1 v/v) and 5% v/v of MeCN-MeOH (1:3 v/v).
The addition of 5% v/v mixed modifier to the background solution was chosen as it
gave reasonable baseline separation of less than 8 min. The final buffer pH range
after combining all components was 9.16-9.3. A mixture of TCDD and TCDF (100
ppm each) was injected into the system after determination of their individual
migration times. The concentration of each test solution used throughout this
investigation was 100 ppm unless noted otherwise. Hydrodynamic injections were
made by applying pressure at 50 mbar to the sample vial for 1 s. Separation runs
were carried out with positive polarity (anodic injection) at 25 kV at a constant
temperature of 25°C. Performance was evaluated based on peak resolution,
separation efficiency, migration time, peak height and peak area intensity.
3.5.3 Separation Efficiency of TCDF and TCDD Under Different Sample
Matrix
Normal mode MEKC separations of the two analytes were performed with
the running buffer described in section 3.5.2 but with added 5% v/v mixed modifier
consisting MeOH-MeCN (1:3 v/v). The final buffer after combining all components
had a pH range of 9.16-9.3. To study the sample matrix effect on separation, 4 ppm

46
of TCDD and TCDF mixture were prepared in three different media: ethanol, water
and buffer. From the stock solution, the test analytes were diluted with water to give
a 50 ppm solution. From the 50 ppm solution, 4 ppm of the test analytes were
prepared in various matrices which are water, buffer and ethanol. For the preparation
of test analytes in ethanol, the test analytes were diluted in ethanol directly from the
stock solution. This was to provide a non-aqueous environment. For samples
prepared in buffer matrix they were prepared in buffer and modifier in proportions
similar to those used in the running buffer. Each set of conditions was carried out in
triplicates.
3.5.4 Normal Stacking Mode in the Separation of TCDF and TCDD
Running buffer conditions and pH remain the same as in Section 3.5.3. We
did not use SDS as we did not obtain any separation during our preliminary
investigation. This maybe due to the analytes higher hydrophobicity compared to the
polychlorinated dioxins used in Otsuka’s study (Otsuka et al., 1999). Firstly, we
optimized the injection time under hydrodynamic injection at constant pressure of
50 mbar to initiate stacking. In order to study the effect of injection time on peak
sensitivity and separation efficiency, 1 ppm of TCDD and 2 ppm of TCDF (due to its
lower absorbance) compared to TCDD were prepared as mixture in water under
normal stacking (NS) mode MEKC (NSM-MEKC). The injection times used in the
study were 1 s, 4 s, 10 s, 20 s, 30 s, 40 s and 50 s. From the optimized injection time
obtained, calibration graphs of both TCDF and TCDD were constructed using
external standard method and the LOD was calculated using the 3Sy/m formula
where Sy refers to the relative standard deviation obtained from the calibration curve
through least square fit (scatter of measured values around the regression line) while
m refers to the slope of the calibration curve. The LODs obtained from NSM-MEKC
was then compared with normal mode (NM-MEKC). Normal mode refers to an
injection time of 50 mbar for 1 s.

47
3.5.5 Reversed Electrode Polarity Stacking Mode
The stacking procedure for reversed electrode polarity stacking mode
(REPSM) is as follows: the capillary was filled with the background electrolyte
(BGE) and then a long plug of sample, prepared in water (low conductivity matrix)
was introduced via hydrodynamic injection at 50 mbar for 100 s (plug length; 50
mm). A high voltage at negative polarity (-25 kV) was then applied to remove the
sample matrix from the capillary. Current decreases due to the electrical resistance
caused by the lower conductivity sample plug. The current increased again once the
sample plug was removed from the capillary. Polarity was switched to normal mode
(25 kV) once current reached 95-99% of the original value.
3.5.6 High Conductivity Sample Stacking Mode
In high conductivity sample stacking mode (HCSSM), the samples were
prepared in sodium chloride solution and injected hydrodynamically at 50 mbar for
10 s. The concentration of sodium chloride in the sample was optimized in the range
of 0-300 mM NaCl. The optimal concentration would be the one giving the
maximum sensitivity with the least peak broadening.
3.5.7 Sweeping
Samples were prepared in a non-micellar matrix without the surfactant and
pH maintained at the same pH as the separating buffer. The conductivity of the
matrix was maintained at the same value as the separating buffer and adjusted with a
few drops of borate from the stock solution.
48
3.5.8 Field-Enhanced Sample Injection
In field-enhanced sample injection MEKC (FESI-MEKC), a long water plug
was hydrodynamically injected after conditioning the capillary with buffer. This was
followed by electrokinetic injection (EKI) performed at negative polarity. The
capillary was flushed at high pressure with water for long periods. The injection end
of the capillary was placed on a micellar sample solution before electrokinetic
injection. When the current flowing through the capillary when both ends of the
capillary filled with BGS reaches 97-99% of the current under normal separation, the
voltage was turned off and the inlet vial containing the sample prepared in a micellar
solution was replaced by the BGS. Voltage was then applied with positive polarity
for separation to take place.
3.6 Off-line Preconcentration Using Solid Phase Disc Extraction
Off-line preconcentration using solid phase disc extraction (SPDE) was
carried out on water samples spiked with TCDF and TCDD with the aim of lowering
the LOD by coupling off-line SPDE and on-line preconcentration technique. The
optimized extraction step was then applied to analyzing effluent sample from a pulp
mill at Temerloh, Pahang.
3.6.1 Sample Preparation
Before extracting the analytes, 1 L deionized water was spiked with 50 ng of
both analytes in separate 1 L glass flasks in order to investigate the recovery of the
method. Procedure blanks were prepared with deionized water in 1 L glass flasks.
The sample was then acidified to pH 3 with 50% v/v H2SO4 and 5 mL of methanol
was added to the sample before making up the volume to 1 L. The samples were
then left to equilibrate for 30 minutes before loading unto the SPDE. The final

49
concentration of both analytes after diluting to 1 L were 0.05 ppb respectively. For
the real sample analysis, effluent samples were obtained from a pulp mill at
Temerloh, Pahang and the whole procedure is repeated in the same way.
3.6.2 Solid Phase Disc Extraction
Solid phase disc extraction, SPDE is another extraction method whereby
discs are used as the extraction phase instead of cartridges to accommodate for larger
sample volumes. Firstly, the reservoir and SPE disc were prerinsed with 70:30%
(v/v) ethanol-toluene and placed under vacuum for 5 min to remove any impurities
that may cause analyte loss during extraction. These impurities contribute to analyte
loss when the analytes adsorb strongly to these impurities. Thus during extraction
there would be substantial loss. To the disc, 25 mL methanol was added and left in
contact with the disc for 3 min to condition its hydrophobic surface. Vacuum was
then applied and the methanol was drawn through. Before the disc went dry, 50 mL
of deionized water was added to the reservoir. This critical step ensured that the
surface of the disc is not dry before sampling. Before all the water was drawn
through the disc, the sample was added. After the entire sample had been drawn
through, the disc was air-dried for 5 min. A test tube was placed in the filter flask for
sample extract collection. 30 mL of elution solvent consisting of ethanol-toluene
(70:30 v/v) were used to elute the PCDDs and PCDFs from the disc. The elution
step was repeated twice with 30 mL of the elution solvent. This combination allows
for the action of a strong solvent like toluene to elute/extract PCDD and PCDF and
ethanol to address the residual water left on the SPE disc. The first rinse remained in
contact with the surface of the disk for 20 min, to achieve acceptable extraction of
PCDDs and PCDFs from the particulate matter. For the second rinse, a dropper was
used to rinse the sides of the reservoir before the solvent was sucked through the
disc. The total solvent volume used to elute the disc is 60 mL. Sodium sulphate was
then used to dry the extract before the extract was transferred to a round bottom flask
and the solvent evaporated to 1 mL with a rotary evaporator before being
concentrated under nitrogen stream to dryness. The concentrated extract was then
made up to a final volume of 1 mL. The total volume consisted of 0.8 mL of

50
deionized water and 0.2 mL of sodium chloride solution for analysis with HCSSM-
MEKC. This procedure was also applied to the effluent samples but at 475 mL of
sample was provided. The extraction apparatus setup is shown in Figure 3.2. SRM
of TCDF and TCDD were not used due to financial constraints.
Figure 3.2: SPE disc extraction setup in the extraction of analytes from water samples.
Reservoir
Disc
Waste
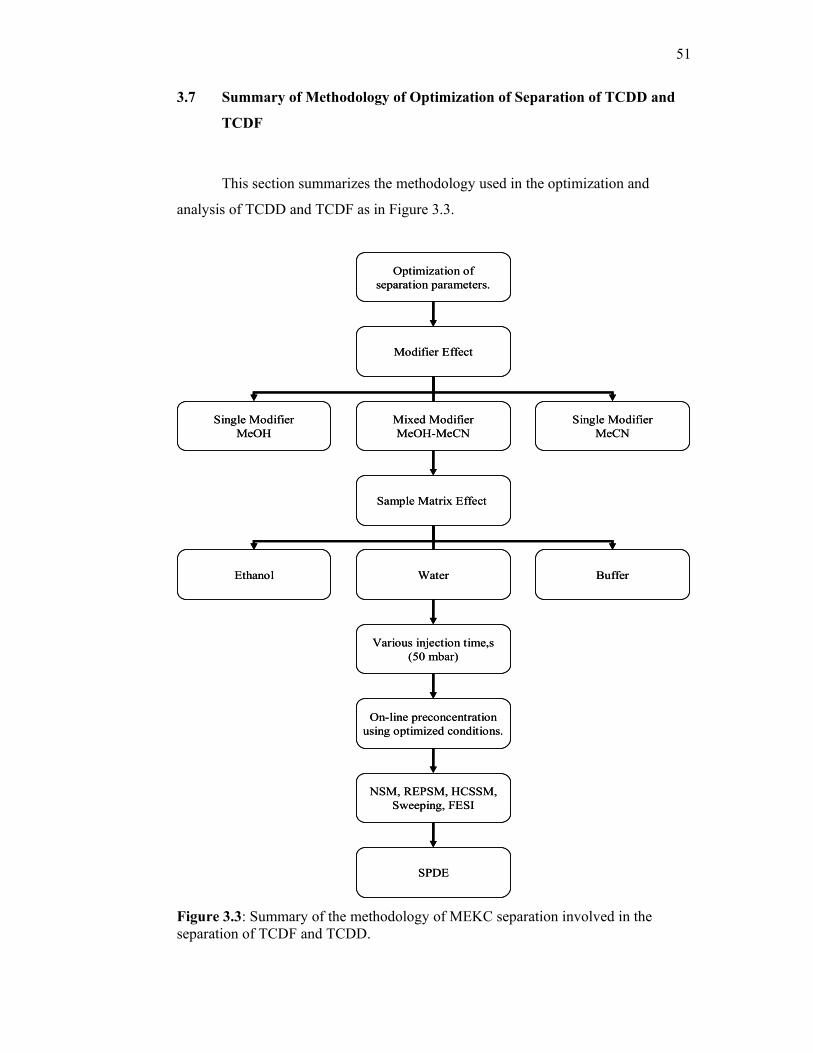
51
3.7 Summary of Methodology of Optimization of Separation of TCDD and
TCDF
This section summarizes the methodology used in the optimization and
analysis of TCDD and TCDF as in Figure 3.3.
Optimization ofseparation parameters.
Modifier Effect
Single ModifierMeOH
Mixed ModifierMeOH-MeCN
Single ModifierMeCN
Sample Matrix Effect
Ethanol BufferWater
Various injection time,s(50 mbar)
On-line preconcentrationusing optimized conditions.
NSM, REPSM, HCSSM,Sweeping, FESI
SPDE
Optimization ofseparation parameters.
Modifier Effect
Single ModifierMeOH
Mixed ModifierMeOH-MeCN
Single ModifierMeCN
Sample Matrix Effect
Ethanol BufferWater
Various injection time,s(50 mbar)
On-line preconcentrationusing optimized conditions.
NSM, REPSM, HCSSM,Sweeping, FESI
SPDE
Figure 3.3: Summary of the methodology of MEKC separation involved in the separation of TCDF and TCDD.

52
The flow chart in Figure 3.3 summarizes the methodology of the separation
of both analytes from the optimization of the parameters down to the online
concentration techniques used. The optimized on-line preconcentration technique
used would then be combined with off-line preconcentration which is solid phase
disc extraction (SPDE).
3.8 Procedures for MEKC Separation of Hydrophilic Organophosphorous
Pesticides
The following section would discuss on the MEKC separation and
optimization carried out in the detection of three selected hydrophilic
organophosphorous pesticides.
3.8.1 Wavelength Optimisation in the Separation of OPPs Under Acidic
Conditions
As diode-array detection was used, the OPPs were monitored under five
different wavelengths simultaneously in order to find the optimum wavelength for
respective analytes. Separate solutions (100 ppm) of each standard was injected
separately under identical conditions and detected simultaneously at five different
wavelengths which were 195, 205, 220, 225 and 230 nm, while determining the
migration times of the analytes. This was followed by injecting the standards which
were 100 ppm each as a mixture and analyzed at five different wavelengths to
determine whether their absorption would be influenced by the presence of the other
OPPs. Method performance was evaluated based on peak area and peak height
intensity.
53
3.8.2 Stacking With Reverse Migrating Micelles in the Analysis of OPPs
Samples were prepared in water with concentrations 10 times lower
compared to RM-MEKC and injected at 50 mbar for 50 s. The optimized conditions
have been described in a previous study (Alam, 2005). The calibration standards
used were in the range of 10, 20 and 30 ppm.
3.9 Off-line Preconcentration Using Solid Phase Disc Extraction of OPPs
Off-line preconcentration using solid phase disc extraction was carried out to
reduce the limit of detection for the OPPs. SPDE was chosen as it gave faster
analysis time and reduced plugging for large volumes of water due to the larger
surface to volume ratio.
3.9.1 Sample Preparation
Before extraction, 250 mL of UTM pond water sample was spiked with 1µg
and 0.5 µg of a mixture of pesticides in order to investigate the recovery of the
method. Procedure blanks were also prepared with unspiked pond water. The final
concentrations of the OPPs in pond water were 4 ppb and 2 ppb respectively.
3.9.2 Extraction
The reservoir and SPE disc were pre-rinsed with 20 mL dichloromethane to
remove residues of environmental matrices and impurities from the manufacturing
processes and then placed under vacuum for 5 min. To the disc, 25 mL methanol
was added and left in contact with the disc for 3 min to condition its hydrophobic

54
surface. Vacuum was then applied to draw the methanol through. Before the disc
went dry, 50 mL of deionized water was added to the reservoir. This critical step
was to ensure that the surface of the disc did not go dry. Before all the water was
drawn through the disc, the spiked pond water (250 mL) was added. After the entire
sample had been drawn through, the disc was air-dried for 5 min. A test tube was
placed in the filter flask for sample extract collection. The elution solvent used was
20 mL of methanol at only one step. Sodium sulphate was then used to dry the
extract from any moisture before the extract was transferred to a round bottom flask
and the solvent evaporated to 1 mL with a rotary evaporator before being
concentrated under nitrogen stream to dryness. The concentrated extract was then
reconstituted to a final volume of 1 mL with deionised water.
3.9.3 Method Validation of Extraction Process
The method using Envi-DiskTM octadecyl (C18) disks in the extraction step
was validated with 250 mL pond water spiked with 1 µg of a mixture containing
dicrotophos, monocrotophos and phosphamidon while another batch contained
0.5 µg of the same compounds as in the previous mixture. Thus, after dilution in
250 mL of water the actual concentration would be 4 ppb and 2 ppb for the three
OPPs. Accuracy expressed as recovery (%) and precision (repeatability, % RSD)
were obtained from three replicates of the analysis in different series of the samples.
For recovery studies, it is advisable to use standard reference material (SRM).
However, SRM of the three pesticides is available commercially, thus the use of
spiked samples justify its usage here for the method validation process. Limits of
detection (LODs) of the three OPPs and the linearity of the method were determined.

55
CHAPTER IV
OPTIMIZATION OF SEPARATION PARAMETERS IN MICELLAR
ELECTROKINETIC CHROMATOGRAPHY
4.1 Introduction
In this chapter, MEKC separations of TCDF and TCDD through optimizing
various separation parameters which include fraction of organic modifier added to
the running buffer and the effect of different sample matrix on the separation of these
two test compounds are discussed.
4.2 Preliminary Investigation on the Separation Of TCDF and TCDD Using
MEKC
A preliminary investigation was carried out to determine the migration time
of both analytes. This was then followed by carrying out the necessary optimization
steps to enhance separation.

56
4.2.1 Confirmation of Individual Peaks
Prior to optimization of analyte separation, solutions of TCDD and TCDF
were injected individually at 40 ppm each to determine their respective migration
times before injecting them as a mixture. Both analytes had a slower migration time
compared to the solvent peak (1,4-dioxane) which appeared before TCDF and TCDD
(Figure 4.1). This was due to 1,4-dioxane having a smaller molecular weight
compared to TCDF and TCDD and a higher polarity and solubility in water.
Therefore, the analytes partition more in the aqueous phase than in the micelle giving
a higher mobility compared to TCDD and TCDF. TCDF has a smaller molecular
weight compared to TCDD and the polarity is higher which explains its higher
electrophoretic mobility compared to TCDD. TCDD has a higher hydrophobicity and
therefore it is more incorporated into the micelle giving it a longer migration time
compared to TCDF. 1,4-dioxane appeared as a very sharp and intense peak at 2.762
min. Both analytes were separated within 8 min with TCDF detected at 3.123 min
while TCDD was detected at 7.867 min.
Figure 4.1: Electropherogram of TCDD and TCDF at 40 ppm each in 1,4-dioxane. Run buffer: 20 mM di-sodium tetraborate decahydrate, 20 mM sodium cholate and 5% (v/v) acetonitrile at a final running buffer pH: 9.16-9.22. Injection time: 1 s at 50 mbar. Wavelength: 225 nm. Separation voltage: 25 kV. Total capillary length: 48.5 cm, effective length: 40 cm.
1,4-dioxane
TCDF
TCDD
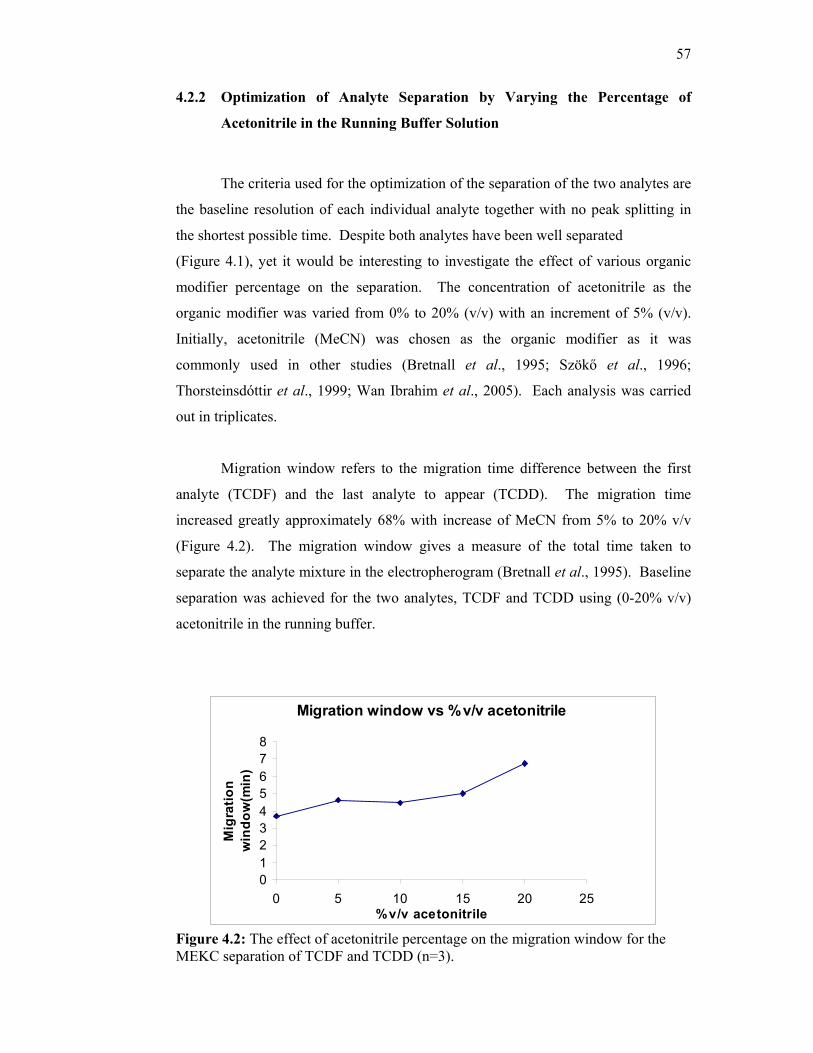
57
4.2.2 Optimization of Analyte Separation by Varying the Percentage of
Acetonitrile in the Running Buffer Solution
The criteria used for the optimization of the separation of the two analytes are
the baseline resolution of each individual analyte together with no peak splitting in
the shortest possible time. Despite both analytes have been well separated
(Figure 4.1), yet it would be interesting to investigate the effect of various organic
modifier percentage on the separation. The concentration of acetonitrile as the
organic modifier was varied from 0% to 20% (v/v) with an increment of 5% (v/v).
Initially, acetonitrile (MeCN) was chosen as the organic modifier as it was
commonly used in other studies (Bretnall et al., 1995; Szökő et al., 1996;
Thorsteinsdόttir et al., 1999; Wan Ibrahim et al., 2005). Each analysis was carried
out in triplicates.
Migration window refers to the migration time difference between the first
analyte (TCDF) and the last analyte to appear (TCDD). The migration time
increased greatly approximately 68% with increase of MeCN from 5% to 20% v/v
(Figure 4.2). The migration window gives a measure of the total time taken to
separate the analyte mixture in the electropherogram (Bretnall et al., 1995). Baseline
separation was achieved for the two analytes, TCDF and TCDD using (0-20% v/v)
acetonitrile in the running buffer.
Migration window vs %v/v acetonitrile
012345678
0 5 10 15 20 25% v/v acetonitrile
Mig
ratio
n w
indo
w(m
in)
Figure 4.2: The effect of acetonitrile percentage on the migration window for the MEKC separation of TCDF and TCDD (n=3).
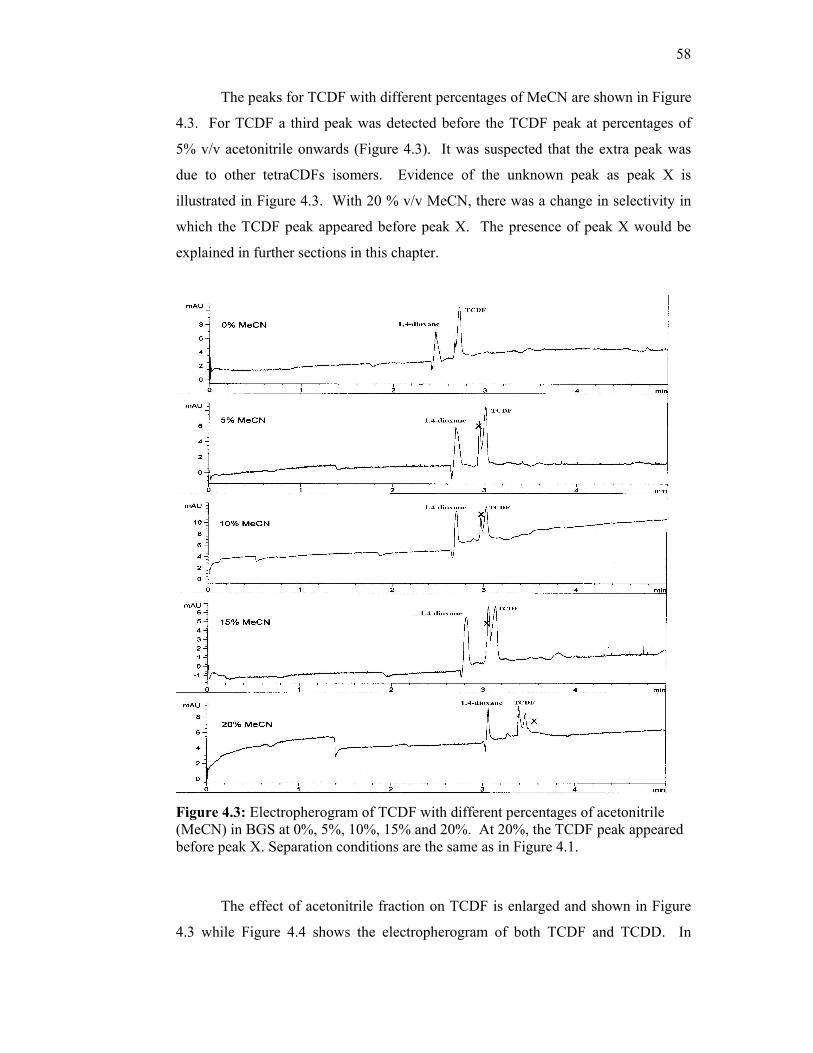
58
The peaks for TCDF with different percentages of MeCN are shown in Figure
4.3. For TCDF a third peak was detected before the TCDF peak at percentages of
5% v/v acetonitrile onwards (Figure 4.3). It was suspected that the extra peak was
due to other tetraCDFs isomers. Evidence of the unknown peak as peak X is
illustrated in Figure 4.3. With 20 % v/v MeCN, there was a change in selectivity in
which the TCDF peak appeared before peak X. The presence of peak X would be
explained in further sections in this chapter.
Figure 4.3: Electropherogram of TCDF with different percentages of acetonitrile (MeCN) in BGS at 0%, 5%, 10%, 15% and 20%. At 20%, the TCDF peak appeared before peak X. Separation conditions are the same as in Figure 4.1.
The effect of acetonitrile fraction on TCDF is enlarged and shown in Figure
4.3 while Figure 4.4 shows the electropherogram of both TCDF and TCDD. In

59
general, the migration time of both analytes increases with increasing fraction of
acetonitrile in the running buffer as illustrated in Figure 4.5A. Generally, the effect
of increasing the fraction of acetonitrile is more significant for TCDD, the more
hydrophobic component compared to TCDF. Acetonitrile has greater effect on the
solubility of TCDD which is more hydrophobic compared to TCDF in the aqueous
buffer.
Figure 4.4: Effect of acetonitrile fraction on migration time of TCDF andTCDD at 0% v/v MeCN, 5% v/v MeCN, 10% v/v MeCN, 15% v/v MeCN and 20% v/v MeCN. Separation conditions as in Figure 4.1.
The organic modifier greatly increased the migration time of both analytes
from 10% v/v acetonitrile to 20% v/v acetonitrile as illustrated in Figure 4.5A.
While for TCDF, the change in migration time is less significant. The separation
efficiency of TCDF improved greatly from 15% to 20% v/v acetonitrile. While for

60
TCDD, the separation efficiency decreased from 5% to 20% v/v acetonitrile. At 20%
v/v, the symmetry of the TCDD peak deteriorated and peak broadening was obvious
(Figure 4.4). Figure 4.5 shows that TCDD achieved the lowest efficiency at 20%
v/v.
0
2
4
6
8
10
12
0 5 10 15 20 25
%v/v acetonitrile
Mig
ratio
n, m
in
TCDF TCDD
0100002000030000400005000060000700008000090000
0 5 10 15 20
%v/v acetonitrile
N(ef
ficie
ncy
in p
late
num
bers
)
TCDF TCDD
Figure 4.5: Effect of different percentages of acetonitrile in running buffer on (A) migration time and (B) efficiency on the separation of TCDF and TCDD.
If one were to comment on the best fraction of acetonitrile suitable for a
mixture of these two analytes, then 5 % v/v acetonitrile would be best as it gave the
best efficiency and repeatability for both analytes as shown by Table 4.1. The
efficiency obtained was 20,200 for TCDF and 85,600 for TCDD.
A
B

61
Table 4.1: Repeatability of migration time, peak areas and peak height for TCDF and TCDD under different fractions of acetonitrile in running buffer. Separation conditions as in Figure 4.1.
% RSD (n=3) % MeCN Parameters TCDF TCDD
0 Migration time 0.15 1.04 Peak area 19.91 21.18 Peak height 4.81 23.56
5 Migration time 0.73 1.71
Peak area 10.24 3.13 Peak height 1.83 6.28
10 Migration time 0.25 0.80
Peak area 37.42 19.26 Peak height 8.99 22.15
15 Migration time 0.551 0.064
Peak area 12.968 13.916 Peak height 11.007 13.607
20 Migration time 0.331 1.569
Peak area 41.503 36.126 Peak height 36.541 32.433
The use of organic modifiers is often avoided due to reproducibility problems
as evaporation of the organic solvent from the electrolyte (Bretnall et al., 1995)
buffer can occur especially during the generation of heat as high voltage is applied
during separation. Adsorption onto the capillary during between runs can also cause
repeatability problems which can be reduced by flushing the capillary with running
buffer for a longer time (Weinberger and Lurie, 1995). This experiment was
repeated with longer flushing time of the capillary with the run buffer compared to
the previous experiment and the repeatability for migration time and peak area and
height improved. The repeatability for both migration time, peak area and peak
height are shown in Table 4.1 for both analytes. The highest RSDs for both peak
area and peak height were obtained with 20% v/v acetonitrile. Therefore for
quantification purposes, it is not recommended to use high concentration of
acetonitrile above 20% v/v. At higher concentrations of acetonitrile, destabilization
of the micelle may occur as its critical micelle concentration is altered (Weinberger
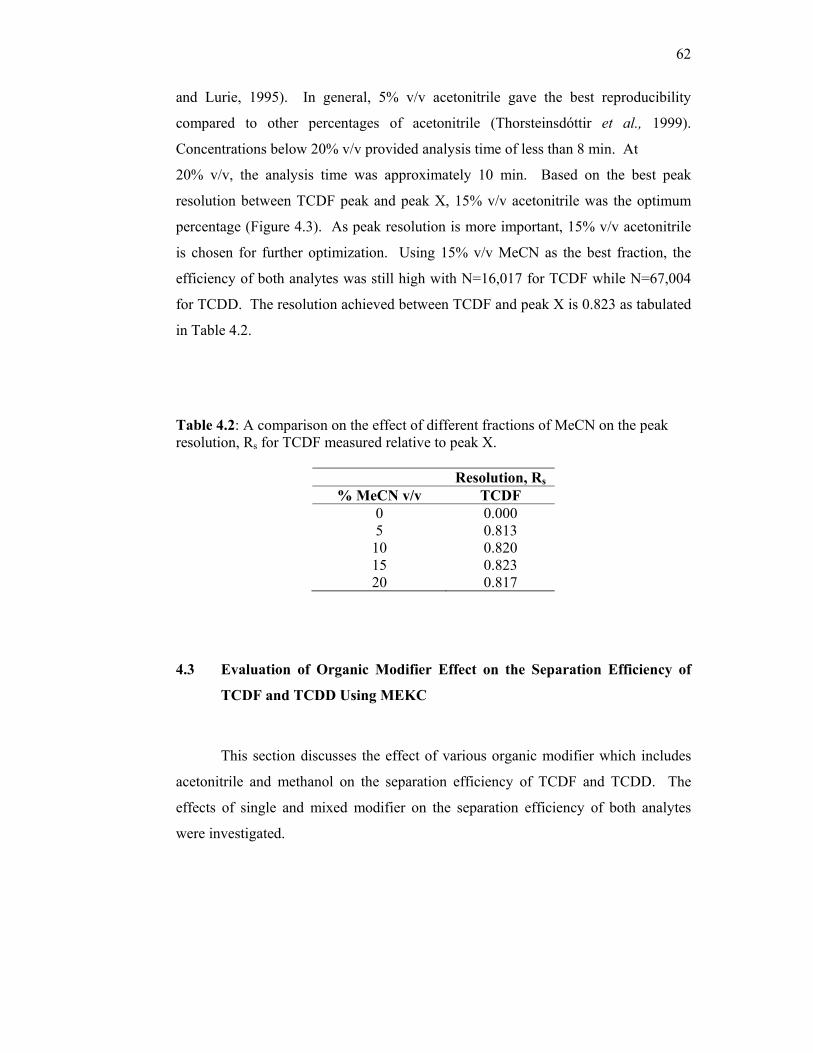
62
and Lurie, 1995). In general, 5% v/v acetonitrile gave the best reproducibility
compared to other percentages of acetonitrile (Thorsteinsdóttir et al., 1999).
Concentrations below 20% v/v provided analysis time of less than 8 min. At
20% v/v, the analysis time was approximately 10 min. Based on the best peak
resolution between TCDF peak and peak X, 15% v/v acetonitrile was the optimum
percentage (Figure 4.3). As peak resolution is more important, 15% v/v acetonitrile
is chosen for further optimization. Using 15% v/v MeCN as the best fraction, the
efficiency of both analytes was still high with N=16,017 for TCDF while N=67,004
for TCDD. The resolution achieved between TCDF and peak X is 0.823 as tabulated
in Table 4.2.
Table 4.2: A comparison on the effect of different fractions of MeCN on the peak resolution, Rs for TCDF measured relative to peak X.
Resolution, Rs % MeCN v/v TCDF
0 0.000 5 0.813 10 0.820 15 0.823 20 0.817
4.3 Evaluation of Organic Modifier Effect on the Separation Efficiency of
TCDF and TCDD Using MEKC
This section discusses the effect of various organic modifier which includes
acetonitrile and methanol on the separation efficiency of TCDF and TCDD. The
effects of single and mixed modifier on the separation efficiency of both analytes
were investigated.

63
4.3.1 Comparison of Separation Performance Between Acetonitrile and
Methanol
Methanol and acetonitrile were used by many researchers in enhancing
separation in MEKC. Both organic modifiers were investigated at concentration
ranging from 5% to 20% v/v in the running buffer and the criteria used for the
optimization was based on peak resolution between the TCDF peak and another
unknown peak referred to as peak X as in section 4.2.2 that migrated closely with it.
The behavior of acetonitrile (Section 4.2.2) with increasing concentration increased
the migration time window giving a better resolution but at the expense of longer
analysis time as has been reported in another study (Szökő et al., 1996).
For methanol, no peak resolution between TCDF and peak X was achieved
using 0 to 5% v/v. Peak resolution then improved for 5-15% v/v but decreased
slightly at 20% v/v as shown in Table 4.3. The optimum concentration of methanol
was at 15% v/v in the running buffer with a migration window of 5.02 min and RS
1.03 (Figure 4.6) based on the best peak resolution value between TCDF and peak X.
In this study, acetonitrile gave a better baseline and peak shape especially for TCDD
compared to methanol which gave an obvious peak shouldering for TCDD (Figure
4.7). The appearance of the three peaks between TCDF and TCDD was suspected to
be due to the solvent used which was 1,4-dioxane that would be confirmed in Section
4.4, page 77.
Table 4.3: A comparison on the effect of different fractions of MeOH on the peak resolution, Rs for TCDF measured relative to peak X.
Resolution, Rs % MeOH v/v TCDF
0 0.000 5 0.000 10 0.680 15 1.030 20 0.965

64
time/min
Figure 4.6: Electropherogram of TCDF and peak X at 15% v/v methanol. Running buffer conditions: 20 mM sodium cholate, 20 mM sodium tetraborate-decahydrate at a final buffer pH: 9.16-9.22. Wavelength: 225 nm. Both test analytes at 100 ppm each in 1,4-dioxane. Hydrodynamic injection at 50 mbar for 1s. Separation voltage, 25 kV; temperature, 25ºC; total capillary length, 48.5 cm, effective length, 40 cm.
time/min
Figure 4.7: Peak shouldering for TCDD at 9.147 min (circle) with 20% v/v methanol. MEKC conditions as in Figure 4.5.
A comparison was made between acetonitrile and methanol in terms of
migration time, resolution, efficiency and selectivity (Table 4.4). Acetonitrile gave a
shorter migration time for both analytes. Acetonitrile gave better peak resolution,
efficiency and selectivity for TCDD while for TCDF methanol gave better peak
resolution, efficiency and selectivity. Therefore the usage of mixed modifier might
be able to give better performances for both analytes as both analytes behaved
differently in different organic modifier.
TCDF
X
1,4-dioxane
TCDF
TCDD
Peak shouldering

65
Table 4.4: A comparison of the effect of 15% v/v MeCN and 15% v/v MeOH on the migration time (tm), resolution (Rs), efficiency (N) and selectivity (α) of TCDF and TCDD MEKC separation.
Organic Modifier Parameters TCDF TCDD 15% v/v MeCN Migration time
(tm),s 3.122 7.815
Resolution (Rs) 0.823 5.673 Efficiency (N) 16017 67004 Selectivity (α) 1.043 1.090 15% v/v MeOH Migration time
(tm),s 3.541 9.147
Resolution (Rs) 1.03 2.753 Efficiency (N) 40191 21477 Selectivity (α) 1.067 1.047
The relative standard deviation, RSD of TCDF and TCDD for both migration
time, peak area and peak height is shown in Table 4.5. The highest RSD for both
peak area and peak height was obtained with 10% v/v methanol for TCDD which
implies that there is a destability with interaction between the micelle and the organic
modifier (Szökő et al., 1996). The reproducibility improved from 15 to 20% v/v
methanol. At higher concentrations of methanol, destabilization of the micelle may
occur as its critical micelle concentration is altered which occurred at 20% v/v
methanol (Bretnall et al., 1995). In general, 15% v/v acetonitrile gave the best RSD
in terms of peak height and migration time for TCDF and TCDD while for peak area,
15% v/v methanol gave the best RSD for TCDD while for TCDF it was 5% v/v
methanol. The optimum percentage of methanol was chosen at 15% v/v as it gave
the best peak resolution between TCDF and peak X at Rs 1.03 (Table 4.3). 15% v/v
methanol also gave the minimum %RSD for migration time for TCDF (0.21%) and
TCDD (1.16%) and peak heights for TCDF (0.053%) while TCDD with 2.46%
(Table 4.5). %RSD obtained for TCDD was also reasonable with 1.15% but not for
TCDF which achieved 32.56%.

66
Table 4.5: Repeatability of migration time, peak area and peak height for TCDF and TCDD under different fractions of methanol, MeOH in running buffer. Separation conditions the same as in Figure 4.1.
% RSD (n=3) % MeOH Parameters TCDF TCDD
5 Migration time 1.34 3.27 Peak area 9.37 13.59 Peak height 29.43 34.55
10 Migration time 4.76 9.07 Peak area 11.00 69.31 Peak height 57.15 69.34
15 Migration time 0.21 1.16 Peak area 32.56 1.15 Peak height 0.053 2.46
20 Migration time 9.53 2.69 Peak area 16.14 0.50 Peak height 2.28 2.78
Figure 4.8 shows the effect of different methanol percentage on the separation
of TCDD and TCDF. Based on the electropherogram, the peak shouldering at TCDD
is obvious at 15% v/v MeOH and at 20% v/v MeOH there was serious peak
broadening for TCDD. Based on the electropherogram, 15% v/v gave the best peak
resolution between TCDF and peak X as compared to other fractions. This further
strengthens our choice of 15% v/v as the optimum methanol fraction. It was also
shown that increasing the percentage of methanol from 15% to 20% v/v worsened the
peak tailing in TCDD which maybe due to the mismatch between the buffering
system and the hydrophobicity of the analyte (Wan Ibrahim et al., 2005). At 20%
v/v, the second peak, peak X that appeared after TCDF, was not detected. This
shows that in terms of resolution, 15% v/v methanol performed better than other
fractions in the background solution (BGS).

67
Figure 4.8: Electropherogram of the effect of the % of MeOH on the separation of TCDF and TCDD. Separation conditions remain the same as in Figure 4.5. The peaks between TCDF and TCDD are suspected to be from the 1,4-dioxane.

68
4.3.2 Comparison Of Mixed Modifier With Single Organic Modifier On
Separation Performance
Both 15% v/v acetonitrile and 15% v/v methanol which gave reasonable
separations with the best reproducibility and peak resolution were then compared
with mixed modifier of acetonitrile (MeCN) and methanol (MeOH) which were
5% v/v MeCN-MeOH (1:1), 5% v/v MeCN-MeOH (3:1) and 5% v/v MeCN-
MeOH(1:3). 5% v/v was chosen as a preliminary value to investigate the effect of
mixed modifier. If the 5% proved to be sufficient, further increments would not be
necessary. This combination was chosen to investigate the effect of mixed modifier
on the separation performance as compared to single modifier. Comparisons were
done based on peak resolution, baseline stability, peak height, peak area, migration
time and peak efficiency. Mixed modifier was used as TCDF gave a better response
in methanol while TCDD in acetonitrile. Therefore, the usage of mixed modifier
might be able to compensate for both differences. 15% v/v methanol gave the best
peak resolution for the TCDF peak (Figure 4.9). The addition of methanol gave the
best peak resolution of TCDF as compared to acetonitrile alone. The addition of
mixed modifier consisting of 5% v/v MeCN-MeOH (3:1) and 5% v/v MeCN-MeOH
(1:3) also gave better separation compared to acetonitrile.
0.00
0.20
0.40
0.60
0.80
1.00
1.20
1.40
Modifier composition
RS
15% v/v MeCN15% v/v MeOH5% v/v MeCN-MeOH (1:1)5% v/v MeCN-MeOH (3:1)5% v/v MeOH-MeCN (3:1)
Figure 4.9: Peak resolution for TCDF (measured relative to peak X mentioned in section 4.2.2) at 15% v/v MeCN, 15% v/v MeOH and various percentages of mixed modifier. Separation conditions as in to Figure 4.1.

69
In terms of baseline stability, mixed modifiers gave a much better stability
compared to 15% v/v MeCN and 15% v/v MeOH. In addition, the mixed modifier
also gave better peak shapes with higher intensity for TCDD peak as shown in Figure
4.10 that shows the enlarged section for TCDD peak. Peak tailing for TCDD
worsened with the usage of methanol in mixed modifier but lessened when there was
a higher percentage of MeCN. MeCN-MeOH (1:1) and MeCN-MeOH (3:1) gave
considerably better baselines, peak shapes and a higher stability compared to MeCN-
MeOH (1:3) which destabilized after each run which can prove to be impractical
when time is a concern.
Figure 4.10: Effect of (A) 15% v/v MeCN (B) 15% v/v MeOH (C) 5% v/v MeCN-MeOH (1:1), (D) 5% v/v MeCN-MeOH (3:1) and (E) 5% v/v MeCN-MeOH (1:3) on the separation of TCDD. MEKC separation conditions as in Figure 4.1.

70
Figure 4.11 shows part of an electropherogram with the enlarged section for
TCDF for 15 % MeCN, 15 % MeOH and the mixed modifiers. Based on Figure
4.11, the resolution between TCDF and peak X improved with the usage of mixed
modifiers such as MeCN-MeOH (1:1), MeCN-MeOH (3:1) and MeCN-MeOH (1:3).
Quantitatively, MeCN-MeOH (1:3) gave the best resolution according to Figure 4.9
but it was very unstable and therefore, 5% v/v MeCN-MeOH (3:1) was chosen as the
optimum mixed modifier.
min Figure 4.11: Effect of (A) 15% v/v MeCN (B) 15% v/v MeOH (C) 5% v/v MeCN-MeOH (1:1), (D) 5% v/v MeCN-MeOH (3:1) and (E) 5% v/v MeCN-MeOH (1:3) on the separation efficiency of TCDF (enlarged). Peak X refers to an unknown peak due to the 1,4-dioxane used. MEKC separation conditions as in to Figure 4.10.

71
Comparison of efficiency, peak heights, peak area and migration time were
made for 15% v/v MeCN, 15% v/v MeOH and mixed modifier as in 5% v/v MeCN-
MeOH (1:1), 5% v/v MeCN-MeOH (3:1)and 5% v/v MeCN-MeOH (1:3) as shown
in Figure 4.12. For migration time, peak area, peak height and efficiency there was
only a slight difference for the TCDF peak as compared to the TCDD peak for pure
acetonitrile, pure methanol and mixed modifiers. This maybe due to the TCDF
having a lower hydrophobicity compared to TCDD giving it a lesser interaction with
the micelle and easily incorporated into the running buffer. The addition of
acetonitrile to the running buffer lengthens the migration time for TCDD while
increasing the fraction of methanol in mixed modifier as in MeCN-MeOH (1:3) gave
TCDD the shortest migration time. This might be due to the increased fraction of
methanol decreases the association of TCDD with the micelles. Peak area, peak
height and efficiency was highest for TCDD at 5% v/v MeCN-MeOH (1:3)
compared to other fractions. This shows that increasing the amount of methanol in
the running buffer increases the peak height, peak area and efficiency of TCDF and
TCDD. But it also gave lower stability while increasing the amount of methanol in
the running buffer. As in MeCN-MeOH (1:3), the buffer destabilized after the first
run shown by a sudden current drop which is impractical and not economical in the
long run. Due to this reason, further comparisons were judged based on repeatability
of migration time, peak area and peak height which are important in quantitative
analysis.
The repeatability was obtained by injecting the sample under constant
experimental conditions for 3 times. The effect of different organic modifiers on the
relative standard deviation (%RSD) on migration time, peak area and peak height on
the separation of TCDF and TCDD are shown in Table 4.6.

72
Figure 4.12: Effect of modifier on (A) migration time, (B) peak area, (C) peak heights and (D) efficiency of TCDF and TCDD.

73
Table 4.6: The effect of different organic modifiers on the relative standard deviation (% RSD) of migration time, peak area and peak height for TCDF and TCDD.
% RSD (n=3)
Fraction, % v/v Parameters TCDF TCDD 15% MeCN Migration time 0.551 0.064
Peak area 12.968 13.916 Peak height 11.007 13.607
15% MeOH Migration time 0.213 1.163 Peak area 32.563 1.150 Peak height 0.053 2.463
5% MeCN-MeOH (1:1) Migration time 0.067 0.303 Peak area 28.860 2.637 Peak height 16.189 0.908
5% MeCN-MeOH (3:1) Migration time 0.764 0.444 Peak area 17.272 9.704 Peak height 9.342 1.312
5% MeCN-MeOH (1:3) Migration time 2.368 5.060 Peak area 18.440 8.209 Peak height 3.473 3.821
The mixed modifier that gave the lowest % RSD for migration time was
MeCN-MeOH (1:1) with % RSD of 0.07% for TCDF and 0.30% for TCDD. The %
RSD of migration time for both TCDF and TCDD for all mixed modifiers are less
than 1% except for TCDF with 5% v/v MeCN-MeOH (1:3) which is about 2.4%
RSD and for TCDD with 5% v/v MeCN-MeOH (1:3) which is at least 5% RSD. The
% RSD of peak height is much better compared to the RSD of peak area for both
analytes at all mixed modifier composition used with TCDD sharing a % RSD of
peak height less than 10%. The lowest peak height % RSD for TCDD is with 5% v/v
MeCN-MeOH (1:1) and the higher % RSD is with 5% v/v MeCN-MeOH (1:3) i.e
3.8% while the highest peak height % RSD for TCDF is with 5% v/v MeCN-MeOH
(1:1) i.e. 16%. The % RSD of peak area in mixed modifier for TCDD is much better
(1-10%) compared to the % RSD of peak area for TCDF (17-28%) which has a lower
UV absorption compared to TCDD at the same concentration. The poor repeatability
for peak area, might be due to the inconsistent evaporation of organic modifier from
the open run buffer (Thorsteinsdόttir et al., 1999). The high % RSD obtained for
TCDF maybe due to the smaller absorption obtained for this analyte, thus it is more
vulnerable to any slight errors. This would give it a higher % RSD compared to
74
TCDD. Therefore, for further study, the composition selected was 5% v/v MeCN-
MeOH (3:1).
4.4 Investigation of Sample Matrix Effect on the Separation Efficiency
Sample matrix has been shown to affect the separation efficiency of analytes.
Thus, this study compares the separation performance between aqueous and non-
aqueous media.
4.4.1 Baseline Stability and Unknown Peak Elimination
Sample matrix has practical implications on both resolution and quantization
which may either improve or worsen the separation depending upon the capillary
electrophoresis conditions used (Riekkola et al., 2000). Therefore, in this work, the
analytes were dissolved in selected media (ethanol, water and buffer) to find the most
suitable sample matrix (solvent) for our analytes based on peak area and peak height
intensity, separation efficiency and baseline stability. Furthermore, it is hoped that
the three peaks that appear between TCDF and TCDD and peak X (section 4.3.1)
could be eliminated and their sources verified.
Figure 4.13 shows an electropherogram for the separation of TCDF and
TCDD prepared under different media but used under identical experimental
conditions. The deviations in the migration time of (C) were due to the experiment
for (C) media being carried on a different day. Both (B) and (C) gave satisfactory
baseline but analytes dissolved in water gave higher sensitivity (B) due to the
stacking effect. In (A), the downward peak before TCDF was due to the ethanol
peak.

75
Figure 4.13: Electropherograms of TCDF and TCDD at 4 ppm each in different media used. (A) ethanol, (B) water and (C) buffer. (B) and (C) are analytes dissolved in aqueous matrix while (A) is analyte dissolved in non-aqueous matrix. Running buffer conditions as in Figure 4.5 but with 5% v/v MeCN-MeOH (3:1).
The use of a non-aqueous matrix ethanol gave an unknown peak that co-
migrated before the TCDF peak as shown in Figure 4.14. The same phenomenon

76
was also observed when we dissolved the analyte in 1,4-dioxane as stated in Section
4.3.1. In aqueous matrix TCDF appeared as a single peak. We suspect this maybe
due to unmatched buffer and sample zone when the sample was prepared in organic
solvent (Wan Ibrahim et al., 2005). This finding corroborated with the claim made
by the manufacturer of TCDF (Accustandards) that the standard provided is pure.
Figure 4.14: Electropherogram of TCDF in the presence of (A) ethanol, (B) water and (C) buffer matrix. TCDF: 4 ppm; running buffer conditions similar to Fig 4.13.

77
4.4.2 Comparison of Peak Area, Peak Height and Separation Efficiency In
Different Sample Matrix
Comparison of the sample matrix effect was done based on peak area, peak
height and separation efficiency. Figure 4.15 shows the effect of the different sample
matrices on separation efficiency, peak area and peak height.
TCDF and TCDD prepared in water matrix gave the highest peak area (Fig
4.15B) and peak height (Fig 4.15C) with considerable efficiency (Fig 4.15A).
Analytes prepared in buffer matrix gave the highest peak efficiency which is seen in
Figure 4.15 (A) with very sharp peaks especially for TCDD. The intense peak height
and area obtained for water matrix reflects an increase in plate number compared to
analyte prepared in organic solvent. This phenomenon is also known as normal
stacking mode which is the enhancement of the sample zone field by preparing the
neutral analytes in water giving stacking via on-column micellization (Wan Ibrahim
et al., 2005).
As both TCDF and TCDD are very hydrophobic and are non-polar
compounds, they require solubilization in organic solvents such as 1,4-dioxane and
ethanol. Yet the addition of ethanol (Figure 4.15 A-C) to the sample greatly reduced
the peak area, peak height and efficiency considerably in comparison to water and
buffer matrix except for the peak areas of TCDF. This was consistent with a reported
work by Shihabi and Hinsdale, 1995. This was due to alteration of the analyte’s
distribution between the micelle and aqueous phase. This can be seen by the
absorbance of t0 which refers to the intense downward peak of ethanol which implies
that a large portion of the analytes remain in the aqueous phase unsolubilized by the
micelle as can be seen in Figure 4.14.

78
Figure 4.15: Comparison of sample matrix effect based on (A) separation efficiency, (B) peak area and (D) peak height. (C) shows the enlarged peak areas as circled in (B) for TCDF. Error bars are in standard errors.
Sharper peaks are an indication of improved separation efficiency. Analytes
prepared in buffer matrix gave better efficiency giving sharper peaks compared to
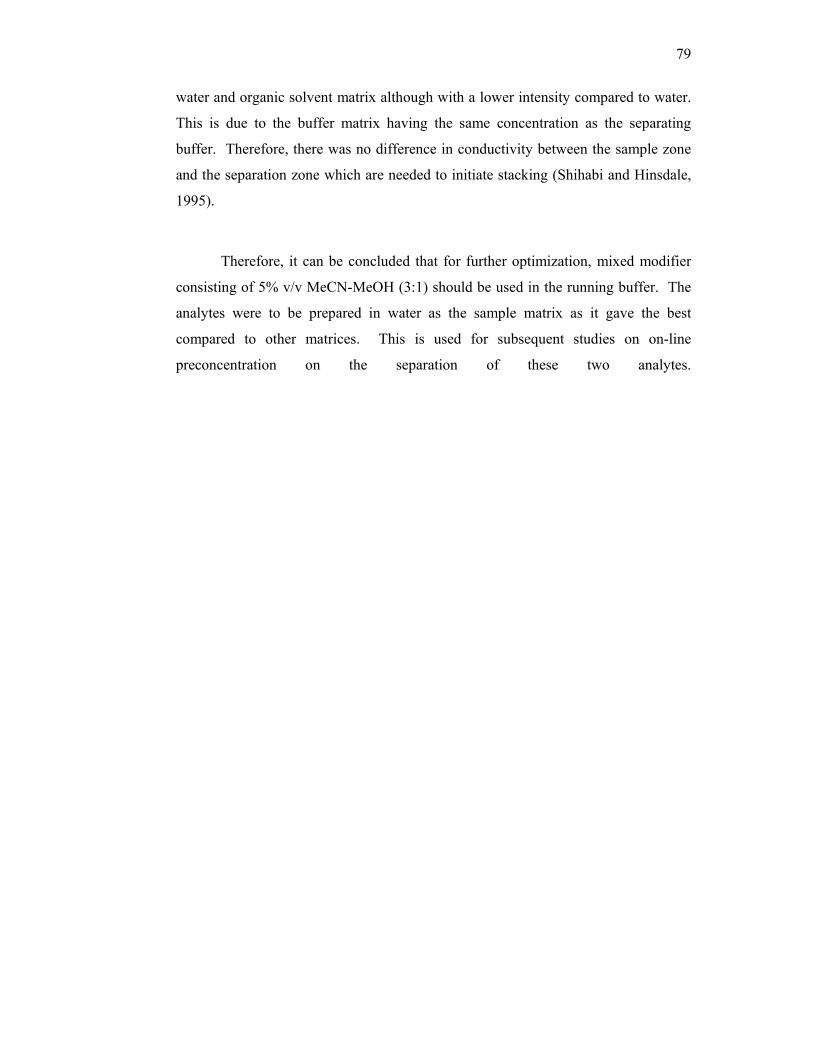
79
water and organic solvent matrix although with a lower intensity compared to water.
This is due to the buffer matrix having the same concentration as the separating
buffer. Therefore, there was no difference in conductivity between the sample zone
and the separation zone which are needed to initiate stacking (Shihabi and Hinsdale,
1995).
Therefore, it can be concluded that for further optimization, mixed modifier
consisting of 5% v/v MeCN-MeOH (3:1) should be used in the running buffer. The
analytes were to be prepared in water as the sample matrix as it gave the best
compared to other matrices. This is used for subsequent studies on on-line
preconcentration on the separation of these two analytes.

80
CHAPTER V
ON-LINE AND OFF-LINE PRECONCENTRATION TECHNIQUES FOR
ANALYSIS OF TCDF AND TCDD
5.1 Introduction
This chapter discusses the on-line and off-line concentration techniques used
in improving the detection limit of TCDF and TCDD. The optimum offline and
online concentration techniques were combined in the analysis of effluent water
samples obtained from a pulp-mill factory from Temerloh, Pahang. The offline
preconcentration technique to be used would be solid phase disc extraction (SPDE).
5.2 Normal Mode MEKC
Normal mode MEKC (NM-MEKC) has been used in the preliminary
determination of limit of detection of both analytes under basic conditions.
5.2.1 Normal Mode MEKC (NM-MEKC)
NM-MEKC in basic buffer, the injection time was for 1 s at 50 mbar. Both
TCDF and TCDD were baseline separated using the optimized conditions obtained

81
earlier which were 20 mM sodium cholate, 20 mM borate buffer and mixed modifier
5% v/v MeCN-MeOH (3:1). The final buffer pH was set at 9.16-9.23. However for
2 ppm TCDF, the injection time was not sufficient to detect it. This was because
TCDF has a lower UV absorbtivity compared to TCDD which was detectable even at
1 ppm.
5.2.2 Calibration Lines, Linearity (r2), LODs
The LODs are calculated on the basis of peak heights since the linearity with
peak areas is not good. Calibration curves obtained for TCDF and TCDD were
analysed with four different concentrations of standard mixtures; 10, 20, 30 and 40
ppm for TCDF and 2.5, 5.0, 10.0 and 15.0 ppm for TCDD. The calibration curves
obtained for both TCDF and TCDD are shown in Figure 5.1 (A) and Figure 5.1 (B)
respectively. The linear, equations and LODs for both analytes are presented in
Table 5.1.
Figure 5.1: Calibration curves based on peak height for (A) TCDF and (B) TCDD using NM-MEKC. Separation buffer: 20 mM sodium cholate, 20 mM sodium tetraborate-decahydrate and 5% v/v MeCN-MeOH (3:1) with final buffer pH 9.16-9.22. Separation wavelength: 225 nm. Separation voltage: 25 kV. Hydrodynamic injection for 1s at 50 mbar. Capillary total length: 48.5 cm. Effective length: 40 cm.

82
The LOD for TCDD is lower compared to the LOD for TCDF. A more
intense peak was obtained for TCDD compared to TCDF. Both analytes show a
linear relationship between peak height and concentration in the range 10-40 ppm for
TCDF and 2.5-15 ppm for TCDD. The r2 values are all above 0.99 with the LOD for
TCDF being 2.20 ppm and 1.71 ppm for TCDD at a S/N=3.
Table 5.1: Equation of calibration curves, correlation coefficients, r2, LODs (at S/N = 3) using NM-MEKC on the basis of calibration curves in Figure 5.1.
ANALYTES EQUATION r2 LOD (S/N = 3), ppm TCDF y = 0.0295x + 0.1644 0.9979 2.20
TCDD y = 0.3841x – 0.1509 0.9930 1.71
5.2.3 Repeatability and Efficiency (N)
Repeatabilities of migration time, peak height and peak area for each analyte
are given in Table 5.2. Migration times of both TCDF and TCDD peaks are uniquely
reproduced with RSDs below 1 % while RSDs for peak heights and peak areas are in
the acceptable range of 3-10 %. The electropherogram of three intraday replicated
runs are shown in Figure 5.2. The two small peaks appearing between TCDF and
TCDD are from the 1,4-dioxane used in preparing the stock solutions.
Table 5.2: Repeatability of migration time , peak area and peak height (mAU) in the separation of TCDF and TCDD using NM-MEKC. ANALYTES % RSD, n=3
Migration time Peak Height Peak Area TCDF 0.16 3.70 10.08 TCDD 0.58 4.36 3.08

83
Figure 5.2: Electropherogram of three replicated runs for the separation of TCDF (40 ppm) and TCDD (15 ppm) in NM-MEKC under identical conditions as in Figure 5.1.
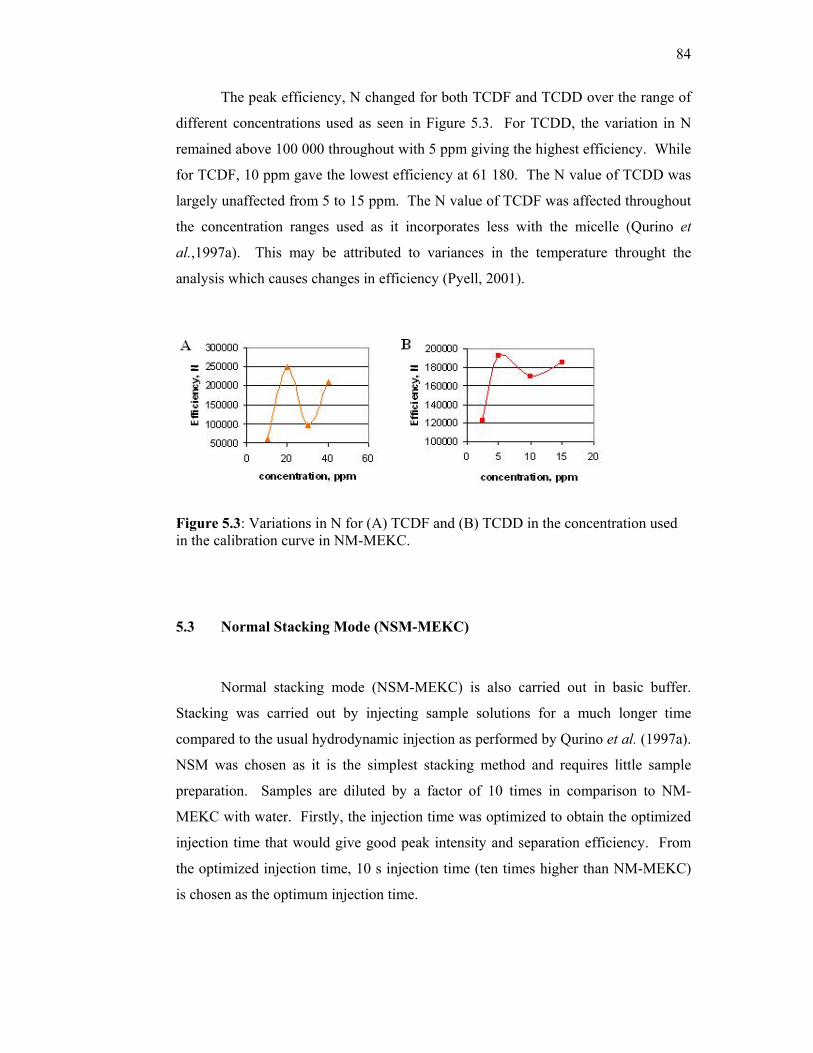
84
The peak efficiency, N changed for both TCDF and TCDD over the range of
different concentrations used as seen in Figure 5.3. For TCDD, the variation in N
remained above 100 000 throughout with 5 ppm giving the highest efficiency. While
for TCDF, 10 ppm gave the lowest efficiency at 61 180. The N value of TCDD was
largely unaffected from 5 to 15 ppm. The N value of TCDF was affected throughout
the concentration ranges used as it incorporates less with the micelle (Qurino et
al.,1997a). This may be attributed to variances in the temperature throught the
analysis which causes changes in efficiency (Pyell, 2001).
Figure 5.3: Variations in N for (A) TCDF and (B) TCDD in the concentration used in the calibration curve in NM-MEKC.
5.3 Normal Stacking Mode (NSM-MEKC)
Normal stacking mode (NSM-MEKC) is also carried out in basic buffer.
Stacking was carried out by injecting sample solutions for a much longer time
compared to the usual hydrodynamic injection as performed by Qurino et al. (1997a).
NSM was chosen as it is the simplest stacking method and requires little sample
preparation. Samples are diluted by a factor of 10 times in comparison to NM-
MEKC with water. Firstly, the injection time was optimized to obtain the optimized
injection time that would give good peak intensity and separation efficiency. From
the optimized injection time, 10 s injection time (ten times higher than NM-MEKC)
is chosen as the optimum injection time.

85
5.3.1 Optimization of Injection Time
Only minute volumes of sample are loaded into the capillary in order to
maintain high efficiency. With respect to sample overloading, the injection plug
length determined by the injection time is critical. Therefore, in optimizing the
injection time, performances are based on peak area and peak height intensity and
also on peak efficiency.
The injection used was 1, 4, 10, 20, 30, 40 and 50 s. Based on the injection
time, the plug length, Ip and volume of sample loaded, Vp were calculated and
compared with the length left for separation. The volume was calculated using the
Hagen-Poiseuille equation as shown in equation 5.1:
Vp = ∆Pd4πt (equation 5.1) 128ηL
∆P = pressure difference across the capillary
d = capillary inner diameter (µm)
t = time (s)
η = buffer viscosity (1 at 25˚C)
L = total capillary length (cm)
The limit of detection is proportional to the injected sample zone. The
optimum injection time should also allow high separation efficiency because in real
sample analysis numerous unknown matrix effects would lead to the appearance of
unidentified peaks when on-line concentration techniques are used (Huang and Lin,
2005).
An increase in injection time from normal sample injection at 50 mbar for 1 s
resulted in an increase in peak area and peak height for both TCDF (2 ppm) and
TCDD (1 ppm). The same observation was also reported by Süsse and Müller
(1996). At normal injection time of 1 s, 2 ppm of TCDF was detected at a very low
intensity (Figure 5.4). There is evidence of peak broadening for both analytes with
increasing injection time till it reached 50 s whereby the peak height for TCDD and

86
TCDF broadened. The calculated volume of sample loaded, Vp, injected plug
length, Ip, % of sample length and % of length left for separation is indicated in
Table 5.3. Based on Table 5.3, the % of remaining length for separation decreases
with increasing plug length. This can explain for the reduction in migration time
when the run is carried out till 50 s. The longer the injection plug length, the shorter
the remaining length for separation to take place and thus the shorter the migration
time (Figure 5.4). Although, the % of remaining length for separation seems high,
due to the short migration time of both analytes, it is not advisable to increase the
injection plug length further to avoid peak overlapping.
Table 5.3: Injection volume and plug length as a function of pressure, time and capillary id. % of sample plug and corresponding % of remaining length available for separation is also indicated. Injection time x pressure, mbars
Vp, nL Ip, mm % of sample plug
% of remaining length for separation
50 1.5 0.75 0.15 99.8 200 6.0 3.00 0.62 99.4 500 15.0 7.50 1.55 98.5 1000 30.0 15.00 3.09 97.0 1500 45.0 22.50 4.64 95.4 2000 60.0 30.00 6.19 93.8 2500 75.0 37.50 7.73 92.3
Vp = plug volume L = 48.5 cm η = 1 Ip = plug lengths T = 25˚C
There was an increase in peak height for TCDF till it reached a maximum at
30 s while for TCDD it reached a maximum at 40 s before decreasing with a further
increase in injection time, s (Figure 5.5B). This may be due to the sample plug being
too long generating a strong laminar flow. This laminar flow is the result of a
mismatch of the EOF velocity in the sample and buffer zones (Wang, 2003). There
is also an increase in peak height followed by a reduction in peak efficiency. Peak
efficiency for TCDF was good (above hundred thousand) till a 40 s injection time is
used. While for TCDD, the peak efficiency deteriorated from 10 s onwards. In order
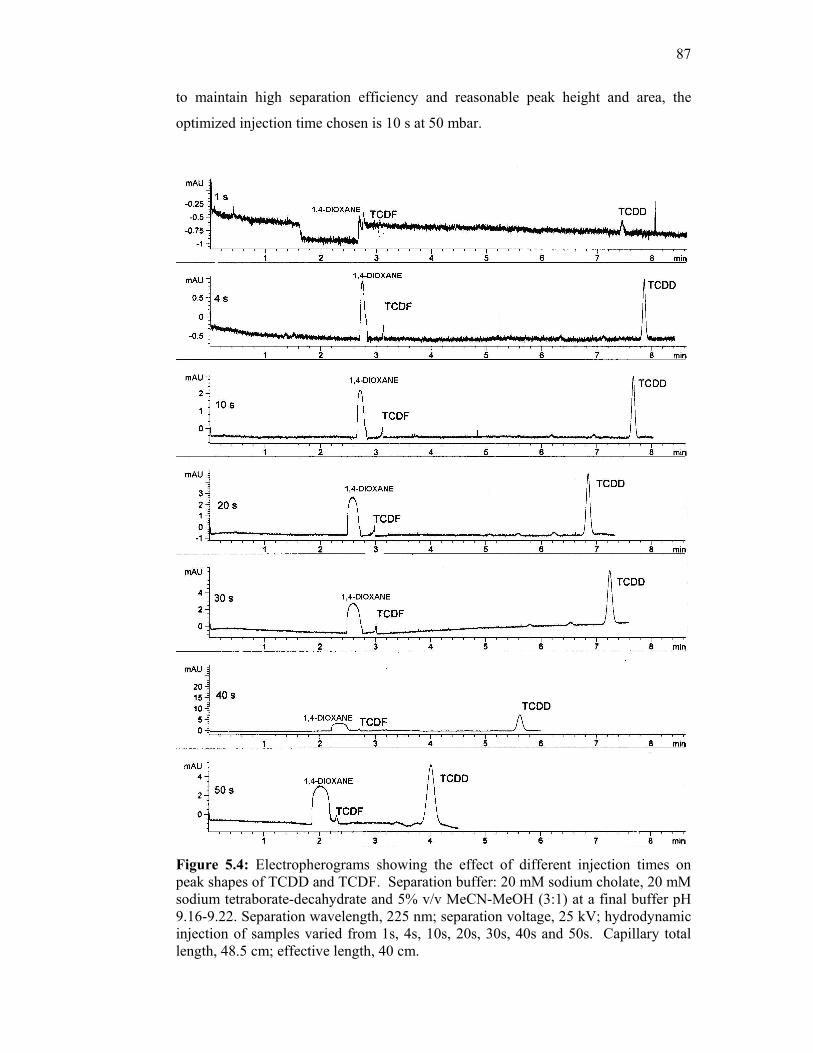
87
to maintain high separation efficiency and reasonable peak height and area, the
optimized injection time chosen is 10 s at 50 mbar.
Figure 5.4: Electropherograms showing the effect of different injection times on peak shapes of TCDD and TCDF. Separation buffer: 20 mM sodium cholate, 20 mM sodium tetraborate-decahydrate and 5% v/v MeCN-MeOH (3:1) at a final buffer pH 9.16-9.22. Separation wavelength, 225 nm; separation voltage, 25 kV; hydrodynamic injection of samples varied from 1s, 4s, 10s, 20s, 30s, 40s and 50s. Capillary total length, 48.5 cm; effective length, 40 cm.
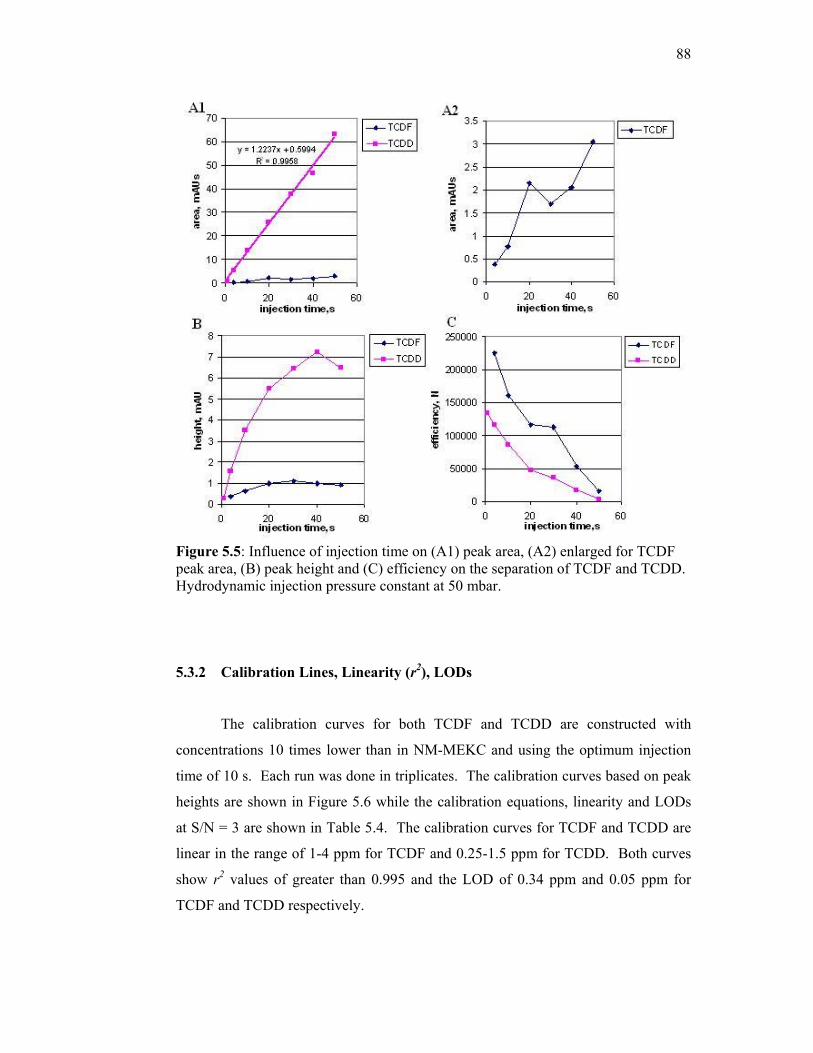
88
Figure 5.5: Influence of injection time on (A1) peak area, (A2) enlarged for TCDF peak area, (B) peak height and (C) efficiency on the separation of TCDF and TCDD. Hydrodynamic injection pressure constant at 50 mbar.
5.3.2 Calibration Lines, Linearity (r2), LODs
The calibration curves for both TCDF and TCDD are constructed with
concentrations 10 times lower than in NM-MEKC and using the optimum injection
time of 10 s. Each run was done in triplicates. The calibration curves based on peak
heights are shown in Figure 5.6 while the calibration equations, linearity and LODs
at S/N = 3 are shown in Table 5.4. The calibration curves for TCDF and TCDD are
linear in the range of 1-4 ppm for TCDF and 0.25-1.5 ppm for TCDD. Both curves
show r2 values of greater than 0.995 and the LOD of 0.34 ppm and 0.05 ppm for
TCDF and TCDD respectively.

89
Table 5.4: Equation of calibration curves, r2, and LODs (for S/N = 3) based on the calibration curves in Figure 5.6.
ANALYTES EQUATION r2 LOD (S/N = 3), ppm TCDF y = 0.1827x + 0.1572 0.9950 0.34
TCDD y = 3.3013x + 1.6329 0.9993 0.05
Figure 5.6: Calibration curves based on peak height for (A) TCDF and (B) TCDD using NSM-MEKC. Injection time at 50 mbar for 10 s. Separation conditions as in Figure 5.4.
5.3.3 Repeatability, Reproducibility and Efficiency
The repeatability of migration time, peak height and peak area for each
analyte are given in Table 5.5. Migration times of both TCDF and TCDD peaks are
highly reproduced with RSDs below 1 % while RSDs for peak heights and peak
areas are in the acceptable range of 0.9-6%. Electropherogram of three intraday
replicated runs are shown in Figure 5.7 as carried out on 17 November 2006.

90
Table 5.5: Repeatability of migration time, peak height and peak area for TCDF and TCDD using NSM. ANALYTES % RSD, n=3
Migration time Peak Height Peak Area TCDF 0.50 6.35 6.89 TCDD 0.34 0.92 2.08
Figure 5.7: Electropherogram of three successive replicated runs for the separation TCDF and TCDD in NSM-MEKC under same conditions as in Figure 5.4 but with an injection time of 10 s.

91
Reproducibility (n=5) for migration time, peak area and peak height in the
separation of TCDF and TCDD over four consecutive days with n=5 per day are
given in Table 5.6. The migration time % RSD for both analytes are in the
acceptable range of 3.8-4.8 % while for peak area it was at 9.7 % for TCDF and for
TCDD it was reasonably low at 5.5 %. The peak height % RSD for TCDF was 10.8
% and for TCDD was acceptable at 7.0 %. Interday RSDs are higher compared to
intraday RSDs due to different surrounding temperature on different days which
might influence the capillary temperature and hence the migration time, peak height
and peak area. Furthermore, this might be due to the different ways of preparing
buffers on different days. In this experiment, buffers are freshly prepared after every
four runs in order to maintain stability. To avoid errors, the buffers were prepared in
large quantities for 4 days for 20 runs.
Table 5.6: Reproducibility of migration time (min), peak area (mAUs) and peak height (mAU) for TCDF and TCDD ANALYTES % RSD, n=5
Migration time Peak Height Peak Area TCDF 3.76 10.75 9.72 TCDD 4.75 7.01 5.45
* Note: Analysis was carried out for four consecutive days with (n=5) per day.
Peak efficiency, N, greatly increased for TCDF from 1 to 3 ppm then dropped
at 4 ppm. Generally the efficiency is lower compared to NM-MEKC with
efficiencies below 100 000. While for TCDD, the efficiency remained satisfactory
and better compared to TCDF for all concentrations with efficiencies above 110 000
with a minimum at 0.5 ppm (Figure 5.8). However the efficiency is poorer compared
to NM-MEKC due to the longer sample plug being injected which gave broader
sample zones although N is above 110 000. N can be concentration dependent as a
higher concentration is more prone to peak broadening due to longitudinal diffusion
with a higher concentration.
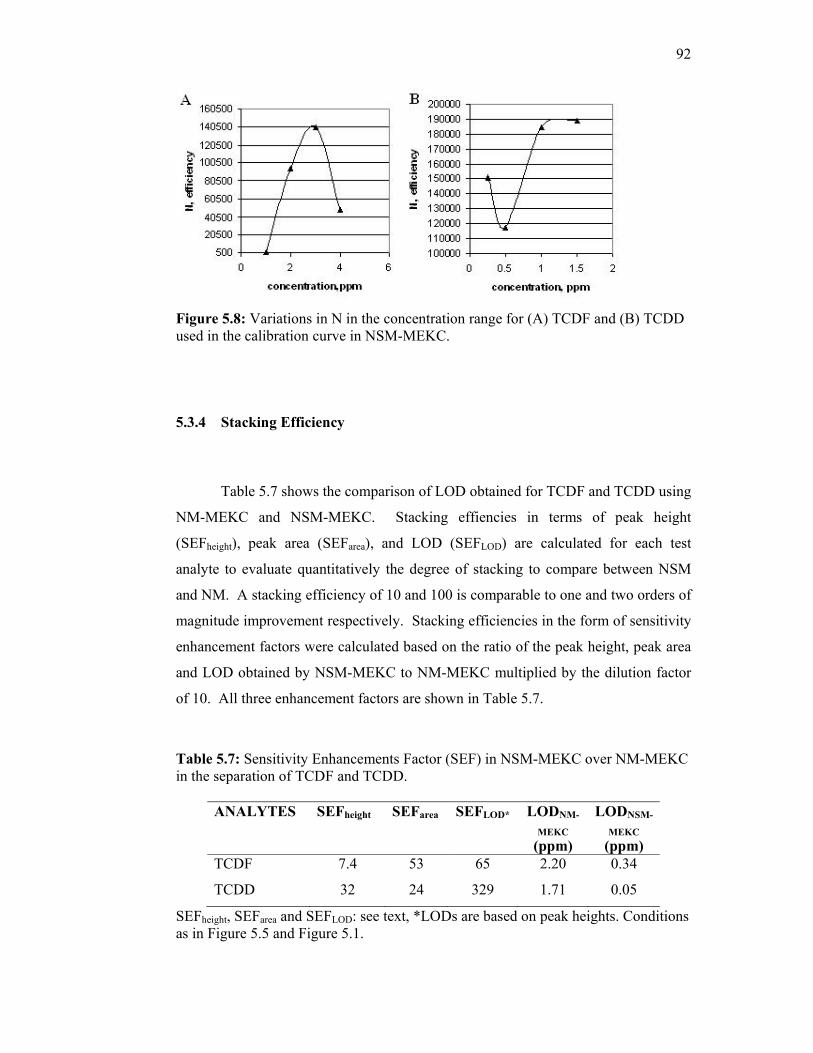
92
Figure 5.8: Variations in N in the concentration range for (A) TCDF and (B) TCDD used in the calibration curve in NSM-MEKC.
5.3.4 Stacking Efficiency
Table 5.7 shows the comparison of LOD obtained for TCDF and TCDD using
NM-MEKC and NSM-MEKC. Stacking effiencies in terms of peak height
(SEFheight), peak area (SEFarea), and LOD (SEFLOD) are calculated for each test
analyte to evaluate quantitatively the degree of stacking to compare between NSM
and NM. A stacking efficiency of 10 and 100 is comparable to one and two orders of
magnitude improvement respectively. Stacking efficiencies in the form of sensitivity
enhancement factors were calculated based on the ratio of the peak height, peak area
and LOD obtained by NSM-MEKC to NM-MEKC multiplied by the dilution factor
of 10. All three enhancement factors are shown in Table 5.7.
Table 5.7: Sensitivity Enhancements Factor (SEF) in NSM-MEKC over NM-MEKC in the separation of TCDF and TCDD.
ANALYTES SEFheight SEFarea SEFLOD* LODNM-
MEKC (ppm)
LODNSM-
MEKC (ppm)
TCDF 7.4 53 65 2.20 0.34
TCDD 32 24 329 1.71 0.05
SEFheight, SEFarea and SEFLOD: see text, *LODs are based on peak heights. Conditions as in Figure 5.5 and Figure 5.1.

93
SEFarea gave a much higher value for both analytes compared to SEFheight but
this implies that with stacking, peaks broadened in NSM. Similarly, LODs were
improved by almost 65 times lower for TCDF and 329 fold lower for TCDD. A
sensitivity enhancement of 7.4-32 fold was obtained with the NSM-MEKC (based on
peak height). However the LOD obtained so far is still insufficient for real sample
analysis of TCDF and TCDD. Therefore, additional on-line preconcentration
methods needs to be investigated such as reversed electrode polarity switching mode
(REPSM).
5.4 Reversed Electrode Polarity Stacking Mode (REPSM)
Reversed electrode polarity stacking mode was used as it has been able to
provide enhancement approximately up to a hundred fold improvement in detection
sensitivity (Süsse and Müller, 1996; Nevabo et al., 2002 and Carabias-Martínez et
al., 2003). As the efficiency of stacking is dependent on the analyte’s retention
factors, k (Quirino and Terabe, 1997b; and Puig et al., 2005). Higher k values imply
higher hdyrophobicity thus are more efficiently stacked. Therefore, REPSM would
stand a good chance in reducing the detection sensitivities of both analytes.
5.4.1 Influence Of Various Stacking Periods
The concentration effect depends strongly on the chosen period during the
stacking step with reversed polarity. The right moment for switching polarity is very
important to avoid back-flush of the more polar analyte causing sample loss (Núñez
et al., 2001 and Laamanen et al., 2006). This depends on the electrophoretic velocity
of the sodium cholate micelle, the electroosmotic flow and the distribution of the
analytes between the micellar and aqueous phase. Figure 5.9 shows the effect of
polarity reversal time on the peak area and peak height intensity of both analytes.

94
020406080
100120140
19 21 23 25 time,s
Pea
k ar
ea, m
AUs
TCDFTCDD
05
101520253035
19 21 23 25 time,s
Peak
hei
ght,
mA
U
TCDFTCDD
0
2
4
6
8
10
19 21 23 25 27
time, s
Pea
k ar
ea, m
AU
s
TCDF
1.451.501.551.601.651.701.751.80
19 21 23 25 27
time, s
mA
U
TCDF
Figure 5.9: Effect of polarity switching time on (A1) peak area and (B1) peak height for both analytes. (A2) enlarged line graph of peak area for TCDF. (B2) enlarged line graph of peak height for TCDF.
The stacking period for polarity reversal gave a more profound effect on the
peak area and peak height intensity for TCDD as compared to TCDF. This is
because TCDD is more retained effectively in the micelle due to its higher
hydrophobicity compared to TCDF. Based on Figure 5.9, the most intense peak
height for both analytes was obtained at 20 s which was also obtained for the most
intense peak area. Therefore, for further quantization purposes, 20 s was chosen as
the optimized polarity reversal time. Table 5.8 shows the corresponding percentage
of current with the polarity switching time. Figure 5.10 is the electropherogram of
separation of TCDF and TCDD at different stacking periods.
A1 B1
A2 B2

95
Table 5.8: Corresponding percentage of original current, % with polarity switching time,s used in REPSM.
Polarity Switching Time,s Percentage of Original Current, %
19.0 97 20.0 82 23.0 94 24.5 89 25.0 96
Higher percentages of current gave lower intensities for the peak area and
peak height intensities for both analytes. At 20 s, the percentage of current obtained
was at 82%. Increasing the stacking period from 20 s onwards increased peak
broadening for both analytes especially for TCDD. Switching the polarity later
would result in the loss of the more polar analytes as can be seen in Figure 5.10
where the intensity of TCDF decreases with later polarity switching due to increase
in the percentage of current. For a solute that is not stacked (low retention factors),
reducing the percentage of current when the polarities are switched will increase the
volume of injected sample compared to the volume injected when polarity is
switched later (eg 99%) (Quirino and Terabe, 1997b). In the case of polar analytes, if
the percentage of current is too high, focalization of these analytes would not occur
as they would have been pushed out off the capillary by the EOF. Based on literature
review, most polarity switching occurs when the percentage of current reaches 90-
99% (Smyth et al., 1997; Leung et al., 2002 and Hernández-Borges et al., 2005).
However, this percentage range was not suitable as under 99%, TCDF peak was not
detected. Therefore, the ideal percentage of current chosen was at 82%.

96
Figure 5.10: Electropherogram of REPSM with different polarity switching times. TCDF at 4 ppm (circled peak) while TCDD at 1.5 ppm. Separation buffer: 20 mM sodium cholate, 20 mM sodium tetraborate-decahydrate and 5% v/v MeCN-MeOH (3:1) at a final buffer pH 9.16-9.22. Separation wavelength, 225 nm; separation voltage, 25 kV. Hydrodynamic injection of sample at 50 mbar for 100 s followed by electrokinetic injection of buffers at -25 kV for 20 s. Total capillary length: 48.5 cm. Effective length: 40.0 cm.

97
5.4.2 Calibration lines, linearity (r2) and LODs
The calibration curves for TCDF are constructed with concentrations 20 times
lower than in NM-MEKC and each run is done in triplicates. For TCDD the
concentration was 100 times lower compared to NM-MEKC. The calibration curves
based on peak heights are shown in Figure 5.11 while the calibration equations,
linearity and LODs at S/N = 3 for each analyte are shown in Table 5.9. Both graphs
are linear in the concentration range 0.5 to 2.0 ppm for TCDF and 0.025 to 0.15 ppm
for TCDD. The correlation coefficient, r2 are 0.997 for TCDF while it is 0.9998 for
TCDD. LODs calculated based on peak heights for TCDF are 130 ppb while for
TCDD it is much lower at 3 ppb as shown in Table 5.9.
Table 5.9: Equation of calibration curves, r2, LODs (for S/N = 3) on the basis of calibration curves in Figure 5.11 using REPSM.
ANALYTES EQUATION r2 LOD (S/N = 3), ppb TCDF y = 0.3054x + 0.831 0.9970 130
TCDD y = 109.46x + 2.3197 0.9998 3
Figure 5.11: Calibration curves based on peak height for (a) TCDF and (b) TCDD using REPSM. Injection time set at 50 mbar for 100 s. Electrokinetic injection at -25 kV for 20 s. Separation conditions as in Figure 5.10.

98
5.4.3 Repeatability and Efficiency
Repeatabilities of migration time, peak height and peak area for each analyte
are given in Table 5.10. Migration times of both TCDF and TCDD peaks are
uniquely reproduced with % RSDs below 1% while %RSDs for peak heights and
peak areas are in the acceptable range of 0.11-9.4% for online concentration
techniques (Carabias-Martínez et al., 2003).
Table 5.10: Repeatability of migration time, peak area and peak height in the separation of TCDF and TCDD using REPSM.
ANALYTES %RSD, n=3 Migration time Peak Height Peak Area
TCDF 0.12 7.75 2.16 TCDD 0.32 0.11 9.37
N greatly decreased for TCDF from 0.5 to 1 ppm before increasing to 2 ppm.
Generally, N was lower compared to NM-MEKC with efficiencies below 100,000.
TCDD gave a lower efficiency compared to TCDF for all concentrations as shown in
Figure 5.12. The efficiency for TCDF and TCDD was poorer compared to NM-
MEKC. This maybe due to the longer sample plug being injected which gave
broader sample zones.
Figure 5.12: Variations in N with the concentration for (A) TCDF and (B) TCDD used in the calibration curve in REPSM-MEKC. Conditions as in Figure 5.10.

99
5.4.4 Stacking Efficiency
Stacking effiencies in terms of peak height (SEFheight), peak area (SEFarea),
and LOD (SEFLOD) are calculated for each test analyte to evaluate quantitatively the
degree of stacking to compare between REPSM and NM. Stacking efficiencies in
the form of sensitivity enhancement factors are calculated based on the ratio of peak
heights, peak areas and LODs obtained by REPSM to NM which are multiplied by
dilution factors. All three enhancement factors are shown in Table 5.11.
Table 5.11: Sensitivity enhancement factors (SEF) in REPSM over NM-MEKC in the separation of TCDF and TCDD.
ANALYTES SEFheight SEFarea SEFLOD* LODNM-
MEKC (ppb)
LODREPSM (ppb)
TCDF 42 124 338 2200 130
TCDD 666 997 57000 1710 3
SEFheight, SEFarea and SEFLOD: see text, *LODs are based on peak heights.
SEFarea gave a much higher value for both analytes compared to SEFheight but
this implies that with stacking, peaks broadened in REPSM. Similarly, LODs were
improved by almost 338 times lower for TCDF and 57 000 times lower for TCDD.
The sensitivity enhancement for TCDD was much better compared to TCDF as
TCDD was more retained in the micelle compared to TCDF. Due to this, TCDF was
easily removed from the capillary when polarity reversal was used as it is being
pushed out by the EOF more easily compared to TCDD.
5.5 High Conductivity Sample Stacking Mode (HCSSM)-MEKC
Stacking in high salt matrix is only evident when the sample matrix conductivity
is higher than the separation buffer conductivity. This caused stacking of the
micelles at the sample/separation buffer interface. The critical factors for stacking to
occur are that the sample anion has a larger charge-to-mass ratio than the run buffer

100
micelle and the ionic strength of the sample matrix is higher than the run buffer
(Palmer and Landers, 2000 and Palmer, 2004). The sample matrix must contain a co-
ion with a higher intrinsic electrophoretic mobility than the micelle to guarantee the
formation of a pseudo-steady-state boundary between the micelle and co-ion
component in the sample region (Jiang and Lucy, 2002). Thus in this study, we
would like to study the feasibility of HCSSM in improving the detection sensitivity
of TCDD and TCDF using sodium cholate as the micelle and addition of sodium
chloride to the sample matrix to initiate stacking.
5.5.1 Optimization of Sodium Chloride Concentration
In high conductivity sample stacking mode (HCSSM), samples are prepared
in a high conductivity medium in order to focalize the micelles in the sample-
separation buffer interface; consequently, neutral analytes are swept by the grouped
micelles at the interface. It is a simple procedure as it only requires the addition of a
high salt concentration to the sample. This work studied the effect of addition of
sodium chloride in the range of 0-300 mM on the stacking of TCDD and TCDF.
Samples with sodium chloride concentration in the range of 0-300 mM were
prepared and the effect it had on peak area, peak height and efficiency is shown in
Figure 5.13. Figure 5.14 shows the electropherogram of HCSSM under different
concentrations of sodium chloride.
The trend shown in Figure 5.13 was also observed by Palmer and Landers
(2000). Peak area and peak height intensity increased for both analytes from
0-200 mM followed by depreciation at 300 mM. While for separation efficiency, the
efficiency, N decreased from 50 mM to a minimum at 300 mM. At 300 mM NaCl,
peak shape deteriorated badly. There was serious peak tailing for the TCDD peak at
300 mM. A possible explanation for the decrease in stacking efficiencies at higher
sodium chloride concentrations maybe due to the high sodium ion concentrations
producing a co-ion layer around the surfactant micelle that is less diffuse than with

101
lower sodium chloride concentrations (Palmer, 2004). This hinders the interaction
between the analyte and the micelle thus reducing the stacking efficiency. The
deterioration of peak efficiency could be due to the disappearance of the pseudo-
steady-state boundary between the micelle and co-ion component. The conductivity
of the sample matrix increases, thus the electrophoretic movement of co-ion against
EOF is further slowed down causing poor stacking (destacking). Therefore, we
choose 200 mM NaCl as the optimal NaCl concentration.
Figure 5.13: Effect of different concentrations of NaCl (0-300 mM) on (A) peak area, (B) peak height and (C) efficiency for both TCDF and TCDF. Separation buffer: 20 mM sodium cholate, 20 mM sodium tetraborate-decahydrate and 5% v/v MeCN-MeOH (3:1) at a final buffer pH 9.16-9.22. Separation wavelength: 225 nm. Separation voltage: 25 kV. Hydrodynamic injection of sample at 50 mbar for 10 s. Total capillary length: 48.5 cm. Effective capillary length: 40 cm.
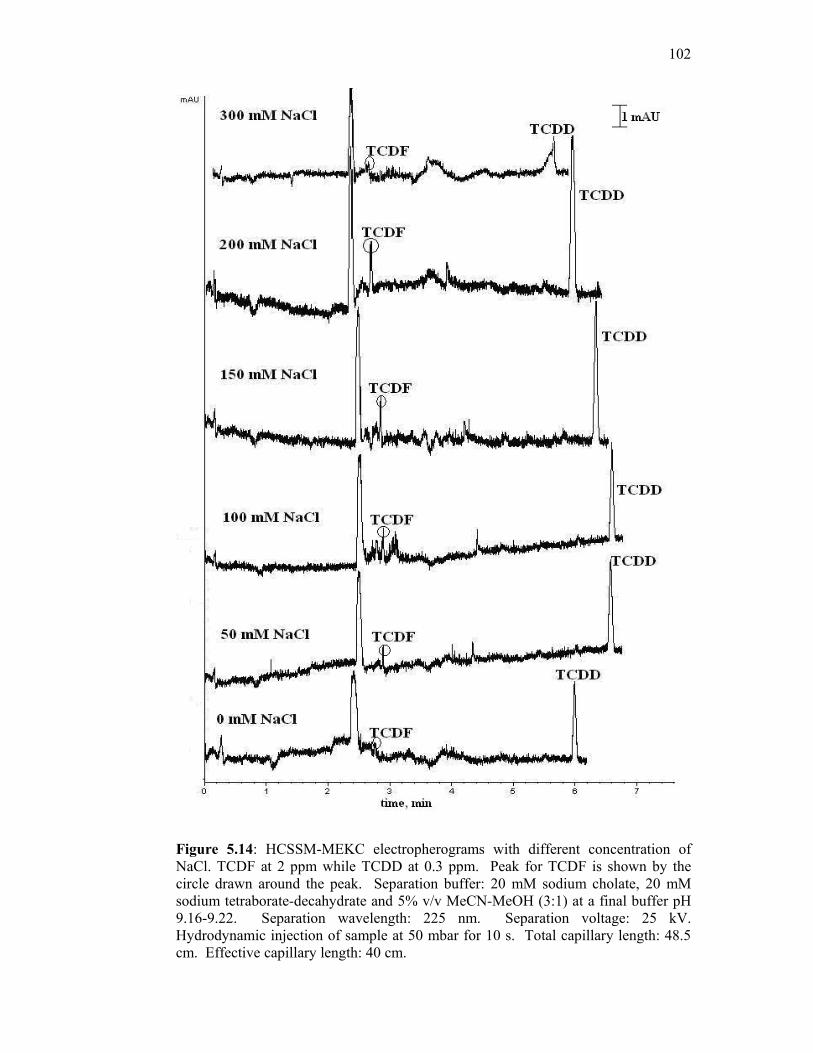
102
Figure 5.14: HCSSM-MEKC electropherograms with different concentration of NaCl. TCDF at 2 ppm while TCDD at 0.3 ppm. Peak for TCDF is shown by the circle drawn around the peak. Separation buffer: 20 mM sodium cholate, 20 mM sodium tetraborate-decahydrate and 5% v/v MeCN-MeOH (3:1) at a final buffer pH 9.16-9.22. Separation wavelength: 225 nm. Separation voltage: 25 kV. Hydrodynamic injection of sample at 50 mbar for 10 s. Total capillary length: 48.5 cm. Effective capillary length: 40 cm.

103
5.5.2 Calibration lines, linearity (r2) and LODs
The calibration curves for TCDF and TCDD are constructed with
concentrations 10 times lower than in NM-MEKC and each run was done in
triplicates. The calibration curves based on peak heights are shown in Figure 5.15
while the calibration equations, linearity and LODs are shown in Table 5.12.
The calibration curves are linear in the concentration range of 1-4 ppm for
TCDF and 0.25-1.5 ppm for TCDD with good correlation, r2 of 0.9999. The LOD
obtained for both analytes with a signal to noise ratio of three are within the ppb
range with the LOD for TCDF at 46.0 ppb while TCDD at 18.5 ppb. The LOD for
TCDF is better with HCSSM compared to REPSM (130 ppb), however for TCDD,
the LOD is better with REPSM (3 ppb) compared to HCSSM.
Table 5.12: Equation of calibration curves, r2, LODs (at S/N = 3) for TCDF and TCDD based on calibration curves in Figure 5.15.
ANALYTES EQUATION r2 LOD (S/N = 3), ppb TCDF y = 0.1549x + 0.3888 0.9999 46.0
TCDD y = 0.4581x + 1.5843 0.9999 18.5
Figure 5.15: Calibration curves based on peak height for (a) TCDF and (b) TCDD using HCSSM. Injection time set at 50 mbar for 10 s. NaCl concentration in sample matrix at 200 mM. Separation conditions similar to Figure 5.14.

104
5.5.3 Repeatability, Reproducibility and Efficiency
Repeatability and reproducibility of migration time, peak height and peak
area for each analyte are given in Table 5.13. The reproducibility of migration time,
peak height and peak area for each analyte are also given as in Table 5.14.The RSDs
were determined by triplicate injections of 2 ppm TCDF and 0.3 ppm TCDD. While
in the determination of reproducibilities, five injections (n=5) were carried out daily
for four consecutive days. The repeatability of migration times of both TCDF and
TCDD peaks were highly reproduced with RSDs below 0.3% while RSDs for peak
heights and peak areas were in the acceptable range of 0.6-3.9%. The
reproducibilities of the migration times for both analytes did not exceed 4.28% while
for peak height it was in the range of 10.33-19.71%. As for peak area, the range was
from 7.34-10.93%.
Table 5.13: Repeatability of migration time (min), peak area (mAUs) and peak height (mAU) in the separation of TCDF and TCDD. ANALYTES %RSD, n=3
Migration time Peak Height Peak Area TCDF 0.29 1.38 3.90 TCDD 0.12 0.80 0.60
Table 5.14: Reproducibility over four consecutive days with n=5 per day of migration time (min), peak area (mAUs) and peak height (mAU) in the separation of TCDF and TCDD using HCSSM. TCDF is at 2 ppm while TCDD is at 0.3 ppm. ANALYTES %RSD, n=3
Migration time Peak Height Peak Area TCDF 2.33 19.71 10.93 TCDD 4.28 10.33 7.34

105
For TCDF, N greatly decreased from 1 to 2 ppm then increased for 4 ppm.
Generally the value of N was lower compared to NM-MEKC with efficiencies below
100,000. While for TCDD, the efficiency remained lower compared to TCDF for all
concentrations with efficiencies below 50 000 with a minimum at 0.5 ppm as in
Figure 5.16. Yet the efficiency was poorer compared to NM-MEKC due to the longer
sample plug being injected which gave broader sample zones.
Figure 5.16: Variations in efficiency, N in the concentration range for (A) TCDF and (B) TCDD used in the calibration curve in HCSSM. Separation conditions similar to Figure 5.14.
5.5.4 Stacking Efficiency
Stacking effiencies in terms of peak height (SEFheight), peak area (SEFarea),
and LOD (SEFLOD) were calculated for each test analyte to evaluate quantitatively
the degree of stacking to compare between HCSSM and NM. Stacking efficiencies
in the form of sensitivity enhancement factors were calculated using the ratio of peak
heights, peak areas and LODs obtained from HCSSM and NM which were multiplied
with the dilution factors. All three enhancement factors are shown in Table 5.15.
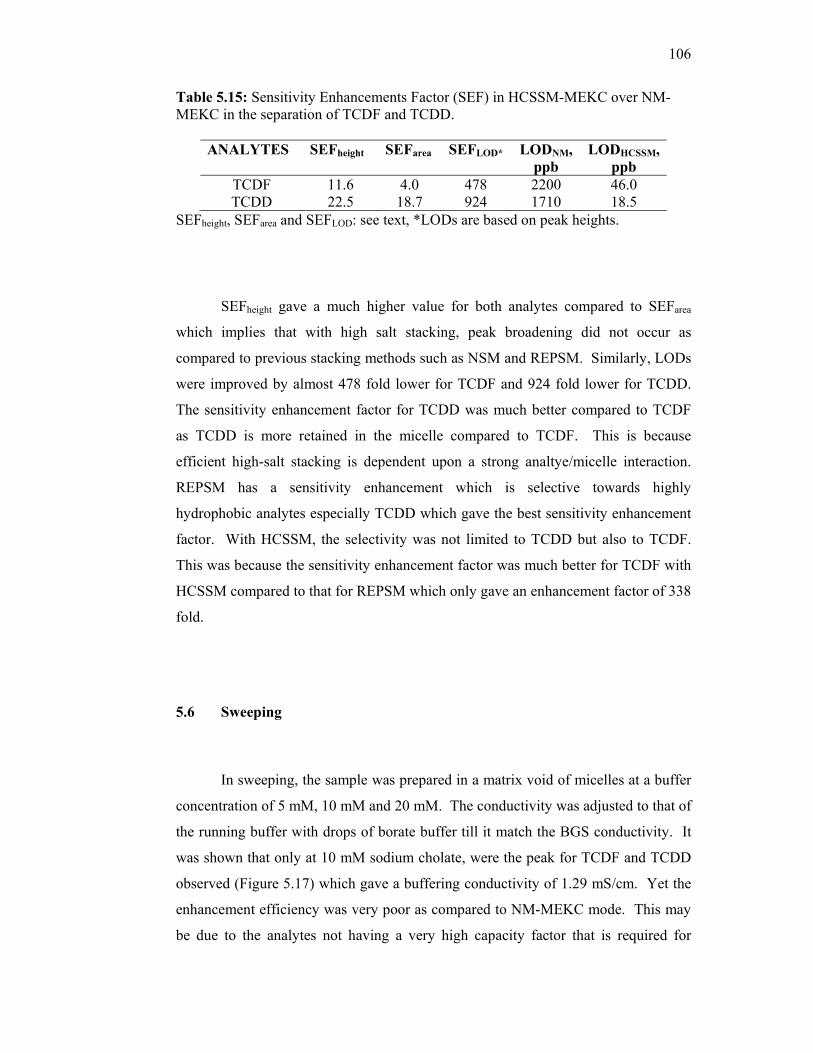
106
Table 5.15: Sensitivity Enhancements Factor (SEF) in HCSSM-MEKC over NM-MEKC in the separation of TCDF and TCDD.
ANALYTES SEFheight SEFarea SEFLOD* LODNM, ppb
LODHCSSM, ppb
TCDF 11.6 4.0 478 2200 46.0 TCDD 22.5 18.7 924 1710 18.5
SEFheight, SEFarea and SEFLOD: see text, *LODs are based on peak heights.
SEFheight gave a much higher value for both analytes compared to SEFarea
which implies that with high salt stacking, peak broadening did not occur as
compared to previous stacking methods such as NSM and REPSM. Similarly, LODs
were improved by almost 478 fold lower for TCDF and 924 fold lower for TCDD.
The sensitivity enhancement factor for TCDD was much better compared to TCDF
as TCDD is more retained in the micelle compared to TCDF. This is because
efficient high-salt stacking is dependent upon a strong analtye/micelle interaction.
REPSM has a sensitivity enhancement which is selective towards highly
hydrophobic analytes especially TCDD which gave the best sensitivity enhancement
factor. With HCSSM, the selectivity was not limited to TCDD but also to TCDF.
This was because the sensitivity enhancement factor was much better for TCDF with
HCSSM compared to that for REPSM which only gave an enhancement factor of 338
fold.
5.6 Sweeping
In sweeping, the sample was prepared in a matrix void of micelles at a buffer
concentration of 5 mM, 10 mM and 20 mM. The conductivity was adjusted to that of
the running buffer with drops of borate buffer till it match the BGS conductivity. It
was shown that only at 10 mM sodium cholate, were the peak for TCDF and TCDD
observed (Figure 5.17) which gave a buffering conductivity of 1.29 mS/cm. Yet the
enhancement efficiency was very poor as compared to NM-MEKC mode. This may
be due to the analytes not having a very high capacity factor that is required for

107
sweeping since it has already been concluded that the EOF velocity has no role in
enhancing the sensitivity. It may also be due to the pseudostationary phase used
which influences the capacity factor of the analytes which appears to be unsuitable
for the analyte used.
Figure 5.17: Electropherogram of sweeping with different concentration of sodium cholate in sample matrix at (A) 5 mM, (B) 10 mM and (C) 20 mM. Separation buffer: 20 mM sodium cholate, 20 mM sodium tetraborate-decahydrate and 5% v/v MeCN-MeOH (3:1) at a final buffer pH 9.16-9.22. Separation wavelength, 225 nm; separation voltage, 25 kV. Hydrodynamic injection of sample at 50 mbar for 5 s. Total capillary length: 48.5 cm. Effective length: 40.0 cm. TCDF at 2 ppm while TCDD at 0.5 ppm.
5.7 Field-Enhanced Sample Injection (FESI)
Field-enhanced sample injection, FESI was tried out on both analytes as
sweeping was not successful in improving the detection. Furthermore, the injection
of a water plug before electrokinetic injection of sample provides a higher electric
field at the tip of the capillary, which will eventually improve the sample stacking
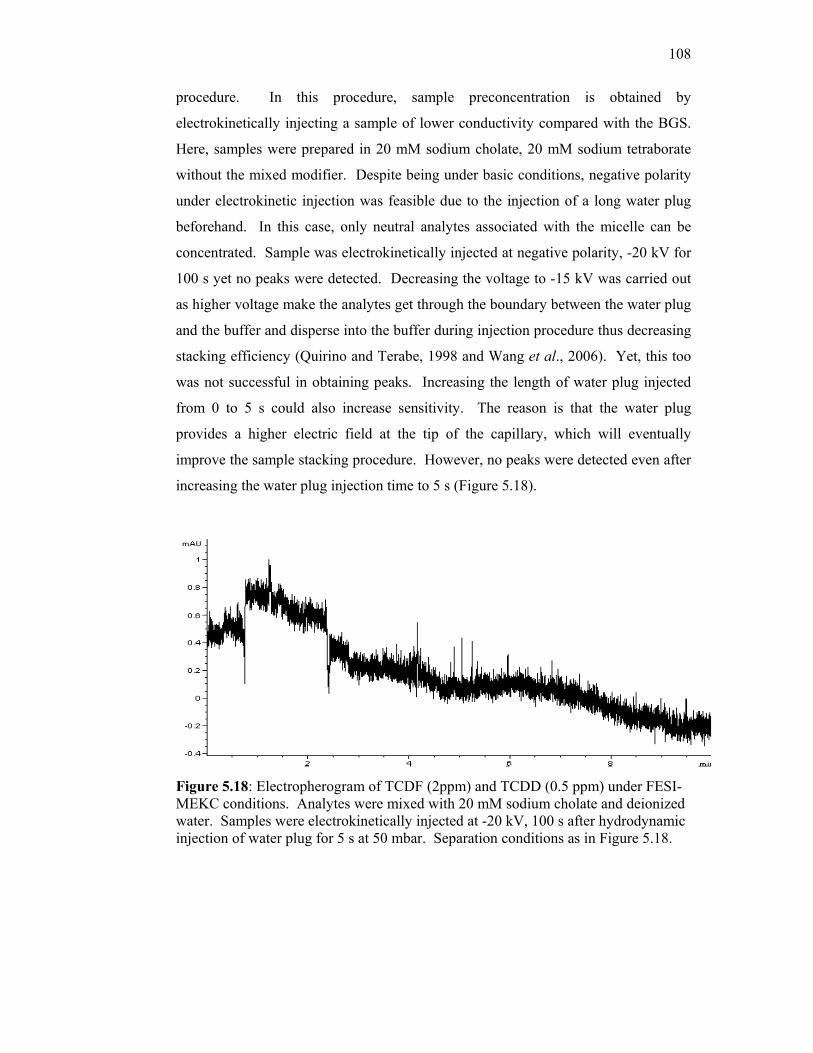
108
procedure. In this procedure, sample preconcentration is obtained by
electrokinetically injecting a sample of lower conductivity compared with the BGS.
Here, samples were prepared in 20 mM sodium cholate, 20 mM sodium tetraborate
without the mixed modifier. Despite being under basic conditions, negative polarity
under electrokinetic injection was feasible due to the injection of a long water plug
beforehand. In this case, only neutral analytes associated with the micelle can be
concentrated. Sample was electrokinetically injected at negative polarity, -20 kV for
100 s yet no peaks were detected. Decreasing the voltage to -15 kV was carried out
as higher voltage make the analytes get through the boundary between the water plug
and the buffer and disperse into the buffer during injection procedure thus decreasing
stacking efficiency (Quirino and Terabe, 1998 and Wang et al., 2006). Yet, this too
was not successful in obtaining peaks. Increasing the length of water plug injected
from 0 to 5 s could also increase sensitivity. The reason is that the water plug
provides a higher electric field at the tip of the capillary, which will eventually
improve the sample stacking procedure. However, no peaks were detected even after
increasing the water plug injection time to 5 s (Figure 5.18).
Figure 5.18: Electropherogram of TCDF (2ppm) and TCDD (0.5 ppm) under FESI-MEKC conditions. Analytes were mixed with 20 mM sodium cholate and deionized water. Samples were electrokinetically injected at -20 kV, 100 s after hydrodynamic injection of water plug for 5 s at 50 mbar. Separation conditions as in Figure 5.18.

109
5.8 Off-line Preconcentration Technique With Solid Phase Disc Extraction
(SPDE)
In this section, we are combining off-line preconcentration with on-line
preconcentration techniques in order to reduce the existing LOD for both analytes.
The optimized on-line preconcentration technique used was HCSSM which gave
LODs in the ppb range. For environmental samples, the ability to detect within ppb
range is still not sufficient. Therefore, we decided to combine both off-line (SPDE)
and on-line preconcentration (HCSSM) techniques in order to improve on the LODs
through sample enrichment during extraction. Furthermore, off-line preconcentration
(SPDE) are also used as sample clean-up prior to CE analysis.
Both TCDF and TCDD are present at very low concentrations in water with a
high proportion in the particulate matter. Solid phase disc extraction (SPDE) has
proven to be an effective method in extracting PCDDs and PCDFs from both the
water and the particle phase as it avoids previous separation of the two phases, the
liquid-liquid extraction for the aqueous and the Soxhlet extraction for the particulate
phase thus avoiding the formation of emulsions between both phases (EPA Method
8290A, 1998 and Gawlik et al., 2000). As deionized water was used as the sample
matrix, therefore we assume that this is particulate-free samples thus PCDDs and
PCDFs tend to adsorb to the walls of the sample container or filtration (Taylor et al,
1995). Therefore, it is critical to rinse the sides of the reservoir and the sample
container to achieve the best possible recoveries. According to the EPA Method 613,
the method detection limit for industrial wastewater using gas chromatography was
0.002 µg/L (U.S. EPA Method 613, May 1984).
Our experiment during the validation step shows that no clogging of the disc
was observed for the spiked deionized water since it was free of particulate matter.
Thus filtering was not necessary in this study. 1 L deionized water was spiked with
50 ng of TCDF and TCDD both in separate 1 L glass flasks before being loaded onto
the reservoir. The total extraction time from the time of conditioning is around 45
minutes. The time of analysis is dependent on the type of disc used (Pujadas et al.,
2001). Analysis with Speedisk gave an extraction time of 15 min.

110
After spiking into water, the actual concentration of both analytes were 0.05
ppb once diluted into 1 L of deionized water This is then followed by recovery
studies of the method. Table 5.16 shows the results of the recovery studies with 50
ng of spiked analytes. Figure 5.19 shows the electropherogram of the extraction of
both concentrations used in the validation study for TCDF and TCDD.
Table 5.16: Recovery and repeatability of extraction of TCDF and TCDD from spiked water using SPDE. Congener Spiked amount Recovered
amount Recovery (%) Repeatability
(%RSD) TCDF 50 ng 54 ng 108 5.9 TCDD 50 ng 55 ng 110 6.9
Based on the recovery study, the spiking at 50 ng gave good recovery for
TCDF, 108% and for TCDD, 110%. Based on the results, this proves that SPDE is
sufficient for quantitative analysis at very low concentrations. This method has
proven to be repeatable with RSDs % falling within the acceptable range of 5.9-
18.17% (Kiguchi et al., 2007). The preconcentration factor calculated from spiking
into 1 L of water to reconstitution to 1 mL is 1000 fold. Thus this shows that this
method is able to detect up to a concentration of 0.05 ppb. Therefore, the LODs for
coupling offline concentration methods (SPDE) with online concentration technique
(HCSSM-MEKC) for TCDF is 46 ppt while it is 18.5 ppt for TCDD.
The optimized SPDE-HCSSM technique was then applied to real sample
analysis. The sample used was effluent samples from a pulp mill. The same sample
preparation and extraction procedures were carried out as in the method validation
procedures. The effluents were divided into two categories which were untreated
effluent (A and B) and treated effluent (A and B). The effluents at 475 mL each had
to be filtered twice due to the presence of suspended particles. The results of the
extraction are shown in Table 5.17 and their electropherograms in Figure 5.20.
Based on the results, it shows that treating the effluent lowers the amount of TCDF

111
and TCDD till it was not detected in sample treated B for TCDD. Overall, the study
proves that the concentration of both these analytes fall within the ppb range. This
shows that the method SPDE-HCSSM developed was sufficient to detect TCDF and
TCDD for environmental samples.
Figure 5.19: Electropherograms of SPDE-HCSSM of TCDF and TCDD spiked with 50 ng. Separation buffer: 20 mM sodium cholate, 20 mM sodium tetraborate-decahydrate and 5% v/v MeCN-MeOH (3:1) at a final buffer pH 9.16-9.22. Separation wavelength, 225 nm; separation voltage, 25 kV. Hydrodynamic injection of sample at 50 mbar for 10 s. Total capillary length: 48.5 cm. Effective capillary length: 40 cm.
Table 5.17: Concentration of TCDF and TCDD discovered in pulp-mill treated and untreated effluent. ND: Not detected. Effluent TCDF, ppb TCDD, ppb Untreated A 87 14 Untreated B 19 2 Treated A 22 10 Treated B 10 ND

112
Figure 5.20: Electropherograms of pulp mill effluent water obtained as tabulated in Table 5.17. (A) treated A, (B) treated B, (C) untreated A and (D) untreated B.

113
5.9 Conclusions
Five types of online concentration were investigated which were normal
stacking mode (NSM-MEKC), reversed electrode polarity stacking mode (REPSM),
high conductivity sample stacking mode (HCSSM), sweeping and field-enhanced
sample injection (FESI-MEKC). The optimized on-line preconcentration technique
was HCSSM as it gave good LODs for both TCDF (46 ppb) and TCDD (18.5 ppb)
within the ppb range. Yet this was still insufficient to be applied to environmental
samples such as water samples. Off-line preconcentration such as solid phase disc
extraction (SPDE) are used to improve on the existing LOD by offering a sample
enrichment step which can go as high as 1000 fold. Furthermore, SPDE is also used
for sample clean-up by reducing interference from the sample matrix. TCDF and
TCDD were successfully extracted from 1 L deionized water using SPDE and using
HCSSM-MEKC as the on-line preconcentration method. The total enrichment
factors achieved were 1000 fold and existing LOD was successfully reduced by 1000
fold. The HCSSM-MEKC-SPDE method achieved a LOD of 46 ppt for TCDF and
18.5 ppt for TCDD with reproducibilities within the acceptable range of 5.9-18.17%.
Recoveries were in the range of 76.9-110%. The developed method was able to
detect both analytes within the ppb range as shown in the pulp-mill effluent samples.
Treating the effluent before release to surface water helps to reduce the presence of
TCDF and TCDD which should be a practice to avoid environmental pollution.

114
CHAPTER VI
SEPARATION OF HYDROPHILIC ORGANOPHOSPHOROUS
PESTICIDES USING MICELLAR ELECTROKINETIC
CHROMATOGRAPHY WITH ACIDIC BUFFER
6.1 Introduction
Organophosphorous pesticides (OPPs) are divided into hydrophobic and
hydrophilic categories. The study focuses on 3 selected hydrophilic OPPs which are
phosphamidon, dicrotophos and monocrotophos whose structures are shown in
Figure 2.3 while their properties are shown in Table 2.3. In this study, optimized
separation parameters such as surfactant concentration, buffer concentration, the
presence of organic modifier, buffering pH and separation voltage have already been
determined from a previous study (Alam, 2005). The main objective of this work is
to reduce the detection limits in order to be applied to environmental samples. From
the previous study, the LOD (S/N) attained was in the sub-ppm level (Alam, 2005).
The detection used was a UV detector set at 230 nm. In the current study a diode-
array detector (DAD) was used at the optimized wavelength (195, 205, 220, 225 and
230 nm).

115
6.2 Reverse Mode Micellar Electrokinetic Chromatography
Separation for the three OPPs were conducted under acidic conditions but
with the help of diode-array detection (DAD). The DAD allowed the analysis of the
three OPPs under five different wavelengths simultaneously in order to find the best
wavelength for the respective analytes which were not possible in the previous study.
Obtaining the best wavelength for all three analytes would greatly improve on the
detection sensitivity of the three analytes.
6.2.1 Wavelength Optimization
The DAD wavelength detection was optimized at several values (Table 6.1).
Irrespective of the wavelength of detection, the migration times of all the pesticides
did not vary greatly. Dicrotophos gave the fastest migration time at 2.30 min
followed by monocrotophos at 6.90 min and phosphamidon at 7.68 min. The
analytes at 100 ppm each were analyzed in mixture form at five wavelengths
simultaneously and the results are summarized as in Table 6.1 while the
electropherograms for the respective analytes at their optimized wavelengths are
shown in Figure 6.1. Phosphamidon gave the longest migration time as it is the most
hydrophobic among the three OPPs thus it complexes strongly with the micelle.
Monocrotophos showed the highest absorbance at 225 nm while dicrotophos and
phosphamidon at 195 nm.

116
Table 6.1: Summary of wavelength optimization for dicrotophos, monocrotophos and phosphamidon. Separation conditions: separation buffer contained 20 mM phosphate (pH 2.3), 10 mM SDS and 10% v/v methanol; samples at 100 ppm each prepared in methanol; applied potential -25kV; hydrodynamic sample injection for 10 s at 50 mbar. Total capillary length, 48.5 cm; effective length, 40 cm.
Dicrotophos Monocrotophos PhosphamidonExperimental wavelength, nm
195 √ √ √ 205 √ √ √ 220 √ √ √ 225 √ √ √ 230 √ √ √
Optimized wavelength, nm
195 √ √ 205 220 225 √ 230
Figure 6.1: Comparison of intensity of (1) dicrotophos, (2) monocrotophos and (3) phosphamidon at different detection wavelengths which are 225 nm and 195 nm under the same running buffer conditions. Separation buffer: 20 mM phosphate at buffer pH 2.3, 10 mM SDS and 10% v/v methanol. Separation wavelength, 225 nm; separation voltage, -25 kV; hydrodynamic injection for 50 s at 50 mbar. Capillary total length, 48.5 cm; effective length, 40 cm.
min
min
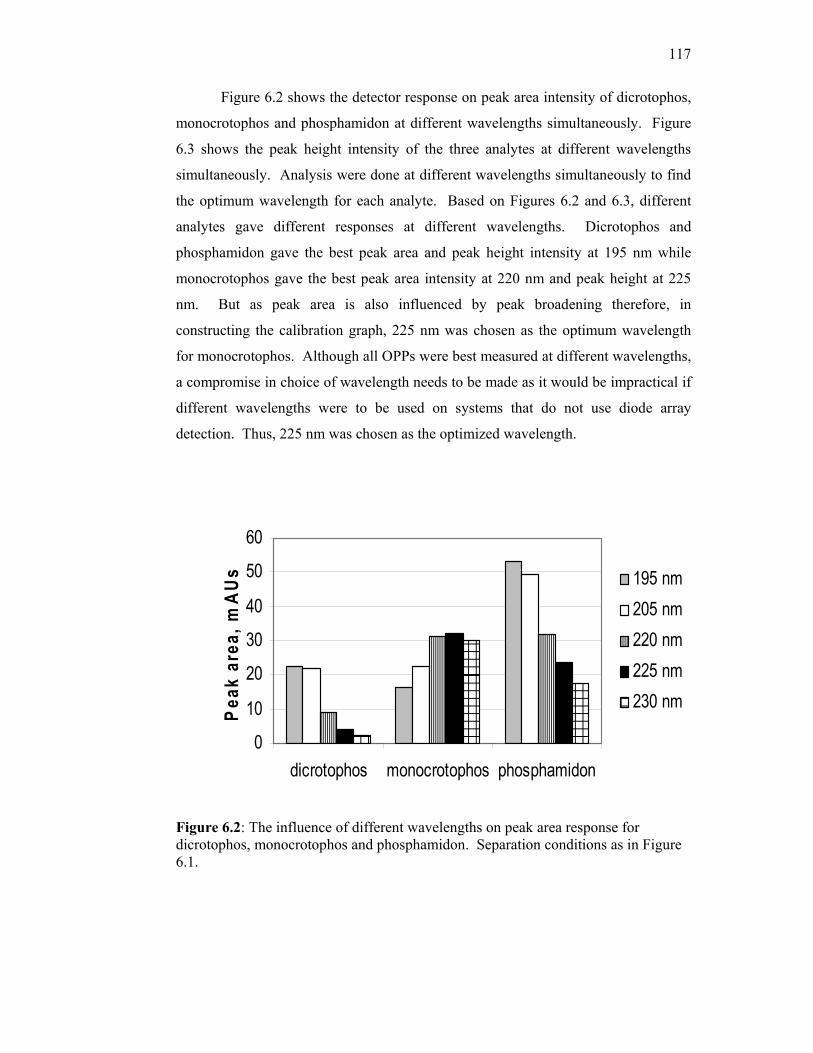
117
Figure 6.2 shows the detector response on peak area intensity of dicrotophos,
monocrotophos and phosphamidon at different wavelengths simultaneously. Figure
6.3 shows the peak height intensity of the three analytes at different wavelengths
simultaneously. Analysis were done at different wavelengths simultaneously to find
the optimum wavelength for each analyte. Based on Figures 6.2 and 6.3, different
analytes gave different responses at different wavelengths. Dicrotophos and
phosphamidon gave the best peak area and peak height intensity at 195 nm while
monocrotophos gave the best peak area intensity at 220 nm and peak height at 225
nm. But as peak area is also influenced by peak broadening therefore, in
constructing the calibration graph, 225 nm was chosen as the optimum wavelength
for monocrotophos. Although all OPPs were best measured at different wavelengths,
a compromise in choice of wavelength needs to be made as it would be impractical if
different wavelengths were to be used on systems that do not use diode array
detection. Thus, 225 nm was chosen as the optimized wavelength.
0
10
20
30
40
50
60
dicrotophos monocrotophos phosphamidon
Peak
are
a, m
AUs 195 nm
205 nm220 nm225 nm230 nm
Figure 6.2: The influence of different wavelengths on peak area response for dicrotophos, monocrotophos and phosphamidon. Separation conditions as in Figure 6.1.
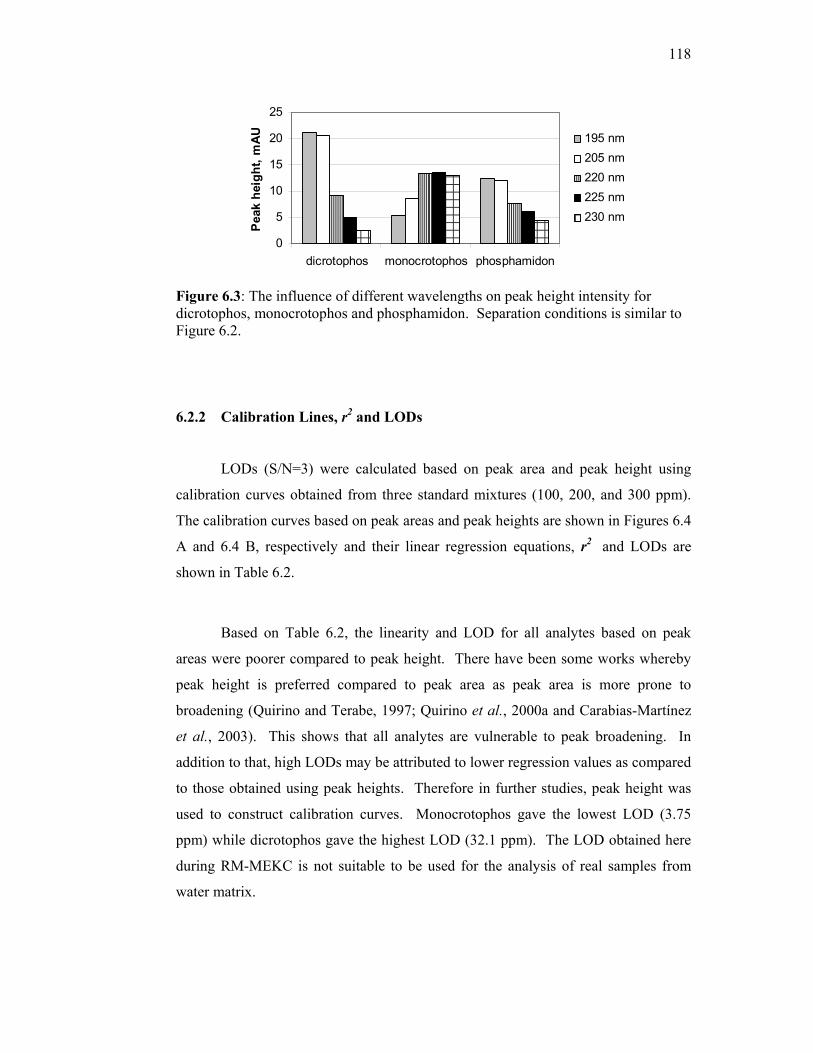
118
0
5
10
15
20
25
dicrotophos monocrotophos phosphamidonP
eak
heig
ht, m
AU 195 nm205 nm220 nm225 nm230 nm
Figure 6.3: The influence of different wavelengths on peak height intensity for dicrotophos, monocrotophos and phosphamidon. Separation conditions is similar to Figure 6.2.
6.2.2 Calibration Lines, r2 and LODs
LODs (S/N=3) were calculated based on peak area and peak height using
calibration curves obtained from three standard mixtures (100, 200, and 300 ppm).
The calibration curves based on peak areas and peak heights are shown in Figures 6.4
A and 6.4 B, respectively and their linear regression equations, r2 and LODs are
shown in Table 6.2.
Based on Table 6.2, the linearity and LOD for all analytes based on peak
areas were poorer compared to peak height. There have been some works whereby
peak height is preferred compared to peak area as peak area is more prone to
broadening (Quirino and Terabe, 1997; Quirino et al., 2000a and Carabias-Martínez
et al., 2003). This shows that all analytes are vulnerable to peak broadening. In
addition to that, high LODs may be attributed to lower regression values as compared
to those obtained using peak heights. Therefore in further studies, peak height was
used to construct calibration curves. Monocrotophos gave the lowest LOD (3.75
ppm) while dicrotophos gave the highest LOD (32.1 ppm). The LOD obtained here
during RM-MEKC is not suitable to be used for the analysis of real samples from
water matrix.

119
Table 6.2: Regression equation, r2, LODs (S/N = 3) on the basis of calibration curves in Figure 6.4. Dicrotophos Monocrotophos PhosphamidonPeak Area
Regression Equation
y = 0.0099x + 1.9787 y = 0.2216x + 5.9466 y = 0.1738x + 2.6492
R2 0.9944 0.9657 0.9577 LOD,
ppm 89.1 80.0 89.2
Peak Height
Regression Equation
y = 0.0112x + 2.7425
y = 0.0774x + 5.6633
y = 0.0328x + 2.1086
r2 = 0.9944 = 0.9999 = 0.9981 LOD,
ppm 32.1 3.75 18.6
Figure 6.4: Calibration curves based on (A) peak areas and (B) peak heights for the separation of hydrophilic OPPs in RM-MEKC. Separation conditions remain the same as in Figure 6.3.
6.2.3 Repeatabilities and Efficiency, N
Repeatability in the form of % RSDs for migration time, peak area and peak
height in the separation of dicrotophos, monocrotophos and phosphamidon are given
in Table 6.3. The %RSDs for all analytes for migration time, peak height and peak
area are all lower than % except for the peak area of phosphamidon at 7.24%. Figure
6.5 shows the electropherograms of 100 ppm of the analytes in triplicates.

120
Table 6.3: Intraday %RSD of migration time (min), peak area (mAUs) and peak height (mAU) in the separation of dicrotophos, monocrotophos and phosphamidon at three replicates each at 100 ppm. ANALYTES %RSD, n=3
Migration time (min)
Peak Height (mAU)
Peak Area (mAUs)
Dicrotophos 2.95 4.47 2.96 Monocrotophos 1.06 2.37 1.73 Phosphamidon 1.09 4.72 7.24
Figure 6.5: Electropherogram of (1) dicrotophos, (2) monocrotophos and (3) phosphamidon at 100 ppm each when injected in triplicates. Separation conditions as in Figure 6.4.
Figure 6.6 shows the effect of different concentration on the separation
efficiency of the three analytes. N increases from 100-200 ppm for dicrotophos and
monocrotophos then decreases sharply when concentration increases to 300 ppm.
For phosphamidon, N does not change significantly on increasing concentration.
Efficiency is significantly poor for dicrotophos peak as compared to other peaks. As
all three peaks are well separated, therefore there is the possibility of increasing the
injection volume in order to improve sensitivity which may also result in poorer
efficiency.
min
min
min

121
0
50000
100000
150000
200000
250000
300000
0 100 200 300 400concentration, ppm
Effic
ienc
y, N
dicrotophos monocrotophos phosphamidon
Figure 6.6: Variations in efficiency, N in the concentration range for dicrotophos, monocrotophos and phosphamidon using RM-MEKC. Separation conditions of Figure 6.5.
6.3 Stacking With Reverse Migrating Micelles
Stacking with reverse migrating micelles (SRMM) technique employs an
acidic micellar background solution (BGS) to reduce the electroosmotic flow (EOF).
Therefore, the velocity of the micelles are higher than the EOF in SRMM and
samples are prepared in purified water or in low conductivity matrix and injected for
a longer time compared to the normal injection as shown in Figure 6.7. Figure 6.7
illustrates the basic model of sample stacking. Sample stacking occurs as the neutral
analytes complexed with the charged micelles cross a boundary that separates regions
of the high electric field (low conductivity) sample zone and the low electric (high
conductivity) BGS zone. Sample solutions are introduced at the cathodic end of the
capillary and then separation voltage is applied with negative polarity at the injection
end. As the buffer used is in acidic conditions, thus the EOF would be suppressed
greatly which moves towards the anodic end. This creates a push for the sample
matrix to move toward the cathodic end for detection.

122
Figure 6.7: Schematic diagram of the principle of stacking with reverse migrating micelles in MEKC. EOF, electroosmotic flow; SB, stacking boundary.
Sample solutions are introduced hydrodynamically in this experiment at the
cathodic end of the capillary and then separation voltage is applied with negative
polarity at the injection end. In this work, hydrodynamic injection at 50 mbar for 50
s was used instead of 100 s as it was discovered that the LOD at 100 s was higher
compared to at 50 s. In addition to that, there was peak broadening when 100 s was
used.
6.3.1 Calibration Lines, r2 and LODs
LODs (S/N=3) were calculated based on peak area and peak height using
calibration curves obtained from three standard mixtures at a concentration 10 times
lower than the concentrations used in RM-MEKC (10, 20 and 30 ppm). The
calibration curves based on peak areas and peak heights are shown in Figures 6.8 A
and 6.8 B and their respective linear equations, r2 and LODs are shown in Table 6.4.
Three electropherograms from each mixture of OPPs are shown in Figure 6.9.
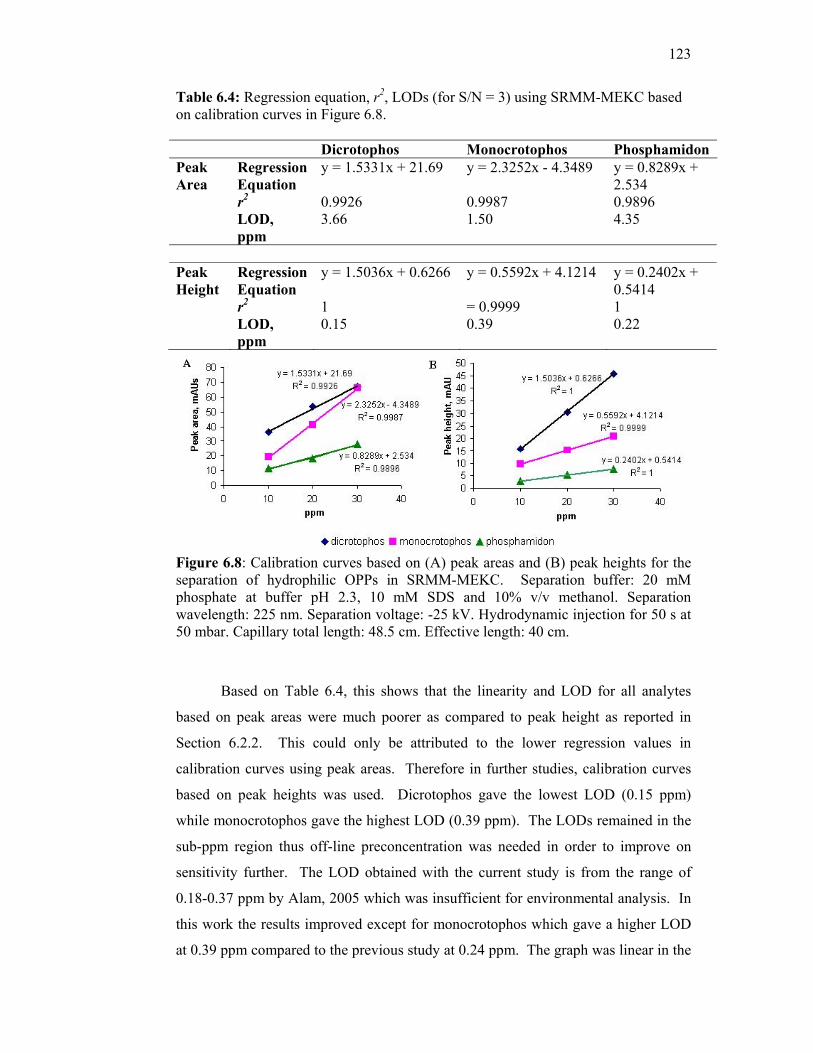
123
Table 6.4: Regression equation, r2, LODs (for S/N = 3) using SRMM-MEKC based on calibration curves in Figure 6.8. Dicrotophos Monocrotophos PhosphamidonPeak Area
Regression Equation
y = 1.5331x + 21.69 y = 2.3252x - 4.3489 y = 0.8289x + 2.534
r2 0.9926 0.9987 0.9896 LOD,
ppm 3.66 1.50 4.35
Peak Height
Regression Equation
y = 1.5036x + 0.6266
y = 0.5592x + 4.1214
y = 0.2402x + 0.5414
r2 1 = 0.9999 1 LOD,
ppm 0.15 0.39 0.22
Figure 6.8: Calibration curves based on (A) peak areas and (B) peak heights for the separation of hydrophilic OPPs in SRMM-MEKC. Separation buffer: 20 mM phosphate at buffer pH 2.3, 10 mM SDS and 10% v/v methanol. Separation wavelength: 225 nm. Separation voltage: -25 kV. Hydrodynamic injection for 50 s at 50 mbar. Capillary total length: 48.5 cm. Effective length: 40 cm.
Based on Table 6.4, this shows that the linearity and LOD for all analytes
based on peak areas were much poorer as compared to peak height as reported in
Section 6.2.2. This could only be attributed to the lower regression values in
calibration curves using peak areas. Therefore in further studies, calibration curves
based on peak heights was used. Dicrotophos gave the lowest LOD (0.15 ppm)
while monocrotophos gave the highest LOD (0.39 ppm). The LODs remained in the
sub-ppm region thus off-line preconcentration was needed in order to improve on
sensitivity further. The LOD obtained with the current study is from the range of
0.18-0.37 ppm by Alam, 2005 which was insufficient for environmental analysis. In
this work the results improved except for monocrotophos which gave a higher LOD
at 0.39 ppm compared to the previous study at 0.24 ppm. The graph was linear in the

124
concentration range studied (10-30 ppm for the three OPPs). The correlation
coefficient, r2 for peak height is excellent showing good correlation between peak
height and concentration of OPPs (much better compared to peak area).
Figure 6.9: Separation of hydrophilic OPPs using SRMM-MEKC at mixture at (A) 10 ppm, (B) 20 ppm and (C) 30 ppm for (1)dicrotophos, (2) monocrotophos and (3) phosphamidon. Separation conditions as in Figure 6.8.
6.3.2 Repeatability and Efficiency, N
Table 6.5 shows the repeatability (%RSD) of migration time, peak height and
peak area for dicrotophos, monocrotophos and phosphamidon. The repeatabilities of
the three parameters for the three analytes were satisfactory with a value of less than
5%. This shows that SRMM-MEKC under acidic conditions is stable and gives good
reproducibility. A study conducted by Quirino et al. (2000b) that showed SRMM-
MEKC gave poor reproducibility in the range of 5-7% for migration time which was
due to difference in local electroosmotic flow between the sample zone and
background solution (BGS) zone. In this study, this issue did not cause a major
problem in the migration time reproducibility.
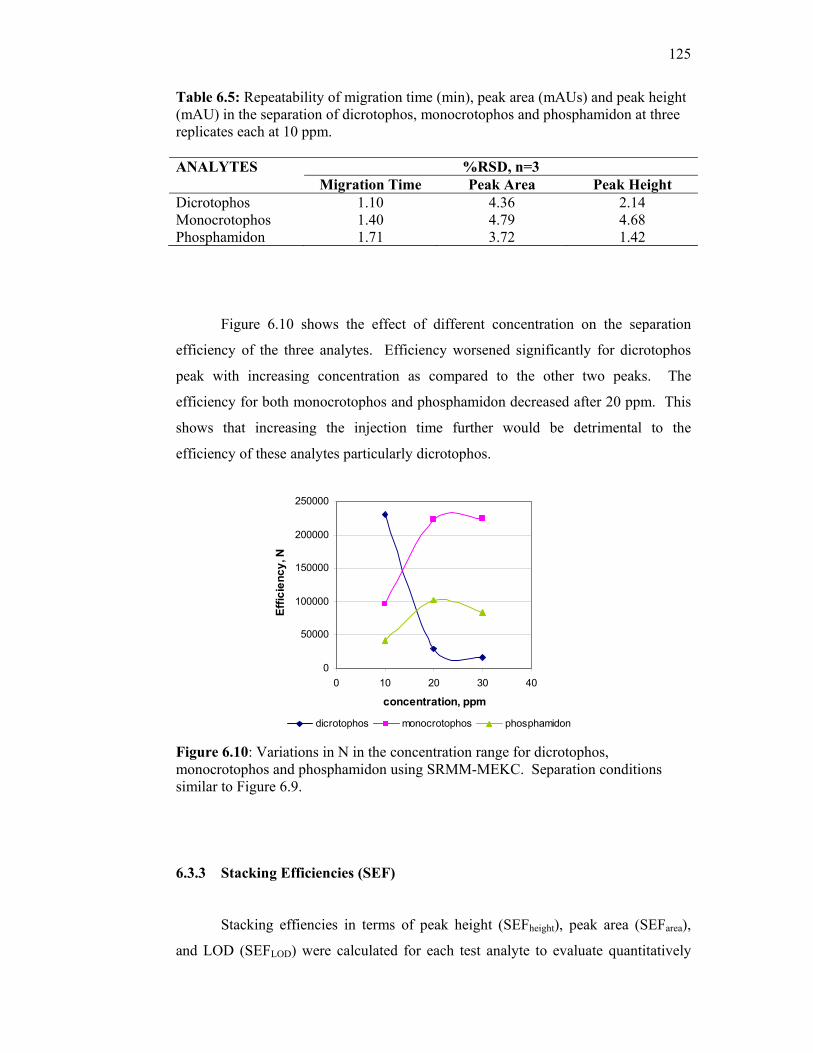
125
Table 6.5: Repeatability of migration time (min), peak area (mAUs) and peak height (mAU) in the separation of dicrotophos, monocrotophos and phosphamidon at three replicates each at 10 ppm. ANALYTES %RSD, n=3
Migration Time Peak Area Peak Height Dicrotophos 1.10 4.36 2.14 Monocrotophos 1.40 4.79 4.68 Phosphamidon 1.71 3.72 1.42
Figure 6.10 shows the effect of different concentration on the separation
efficiency of the three analytes. Efficiency worsened significantly for dicrotophos
peak with increasing concentration as compared to the other two peaks. The
efficiency for both monocrotophos and phosphamidon decreased after 20 ppm. This
shows that increasing the injection time further would be detrimental to the
efficiency of these analytes particularly dicrotophos.
0
50000
100000
150000
200000
250000
0 10 20 30 40
concentration, ppm
Effic
ienc
y, N
dicrotophos monocrotophos phosphamidon
Figure 6.10: Variations in N in the concentration range for dicrotophos, monocrotophos and phosphamidon using SRMM-MEKC. Separation conditions similar to Figure 6.9.
6.3.3 Stacking Efficiencies (SEF)
Stacking effiencies in terms of peak height (SEFheight), peak area (SEFarea),
and LOD (SEFLOD) were calculated for each test analyte to evaluate quantitatively

126
the degree of stacking to compare between RM-MEKC and SRMM-MEKC. Stacking
efficiencies in the form of sensitivity enhancement factors were calculated using the
ratio of peak heights, peak areas and LODs obtained from SRMM-MEKC and RM-
MEKC which were multiplied with the dilution factors. Here the dilution factor is
10. All three enhancement factors are shown in Table 6.6.
Table 6.6: Sensitivity Enhancement Factors in SRMM-MEKC over RM-MEKC in the separation of dicrotophos, monocrotophos and phosphamidon. Conditions as in Figure 6.10.
ANALYTES SEFheight SEFarea SEFLOD* Dicrotophos 76 132 2140 Monocrotophos 7 9 96 Phosphamidon 7 6 85
SEFheight, SEFarea and SEFLOD: see text, *LODs are based on peak heights.
SEFarea gave a higher value for dicrotophos and monocrotophos compared to
SEFheight but this implies that with stacking, peaks broadened in SRMM-MEKC
especially for dicrotophos. LODs were calculated based on peak heights as peak
height gave a much better linearity compared to peak areas. Dicrotophos was most
efficiently stacked achieving a stacking efficiency (SEFLOD) of 2140 fold.
Monocrotophos is the least efficiently stacked. This was due to monocrotophos
being the least hydrophobic thus it is the least complexed with the micelle.

127
6.4 Off-line Preconcentration Technique With Solid Phase Disc Extraction
(SPDE)
In the determination of pesticides in water, a sample pretreatment step
includes the analyte enrichment as well as the removal of matrix components. This is
commonly carried out using solid-phase extraction (SPE) in the form of cartridges
and disc devices. SPE benefits from low intrinsic costs, shorter processing times, low
solvent consumption, simpler processing procedures and easier automation. SPE has
been commonly used in pesticide multiresidue analysis such as in fruits and
vegetables, eggs and wine with gas chromatography detection methods. There have
also been coupling of SPE with on-line stacking methods in capillary electrophoresis
in order to lower the detection sensitivity especially in environmental analysis of
pesticides using SPE catridges (Silva et al., 2003 and Süsse and Müller, 1996). In
this study, solid phase extraction in the form of discs was used in these two step
enrichment process of dicrotophos, monocrotophos and phosphamidon with the use
of SRMM-MEKC as an online stacking method.
The maximum concentration of individual pesticides in drinking water
allowed by the European Community legislation is 0.1 µg/L. Therefore, analyte
preconcentration prior to MEKC determination is required in order to reach
sensitivity below the legal limits. To provide a reference value, blank pond water
was passed through the SPE discs too and no peak signals were detected. Figure 6.11
shows the electropherograms of blank runs and spiked pond water at 1 µg and 0.5 µg
into 250 mL of pond water. The concentration of the analytes once diluted in 250
mL of pond water is 4 ppb and 2 ppb respectively. The enrichment factor used is 250
times thus the final concentration when reconstituted to 1 mL of water before CE
analysis is 1 ppm and 0.5 ppm.
Based on the recovery studies as stated in Table 6.7, the spiking at higher
concentration (1.0 µg) gave better recovery for the three analytes in the range of
(96.2-132)%. While at 0.5 µg the recovery was lower in the range of (74-117)%.
Based on the results, this proves that SPDE is sufficient for quantitative analysis at
low concentrations as after being diluted in 250 mL of water, the concentration of the
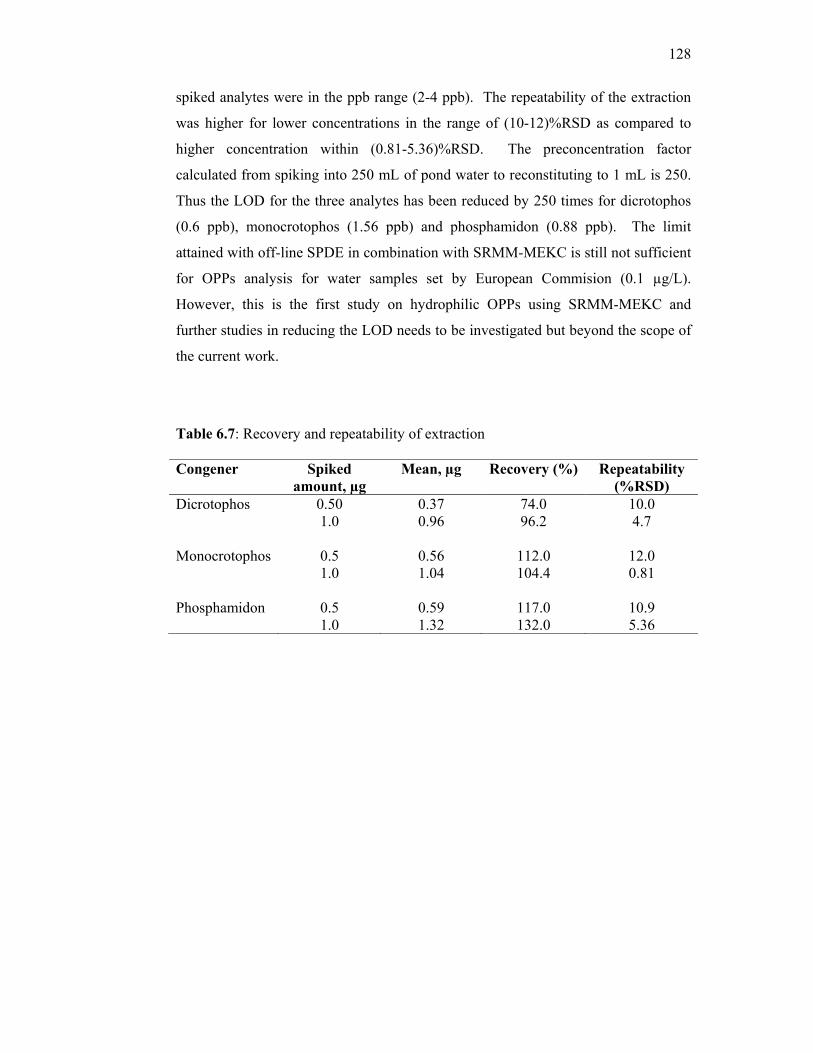
128
spiked analytes were in the ppb range (2-4 ppb). The repeatability of the extraction
was higher for lower concentrations in the range of (10-12)%RSD as compared to
higher concentration within (0.81-5.36)%RSD. The preconcentration factor
calculated from spiking into 250 mL of pond water to reconstituting to 1 mL is 250.
Thus the LOD for the three analytes has been reduced by 250 times for dicrotophos
(0.6 ppb), monocrotophos (1.56 ppb) and phosphamidon (0.88 ppb). The limit
attained with off-line SPDE in combination with SRMM-MEKC is still not sufficient
for OPPs analysis for water samples set by European Commision (0.1 µg/L).
However, this is the first study on hydrophilic OPPs using SRMM-MEKC and
further studies in reducing the LOD needs to be investigated but beyond the scope of
the current work.
Table 6.7: Recovery and repeatability of extraction Congener Spiked
amount, µg Mean, µg Recovery (%) Repeatability
(%RSD) Dicrotophos 0.50 0.37 74.0 10.0 1.0 0.96 96.2 4.7 Monocrotophos 0.5 0.56 112.0 12.0 1.0 1.04 104.4 0.81 Phosphamidon 0.5 0.59 117.0 10.9
1.0 1.32 132.0 5.36
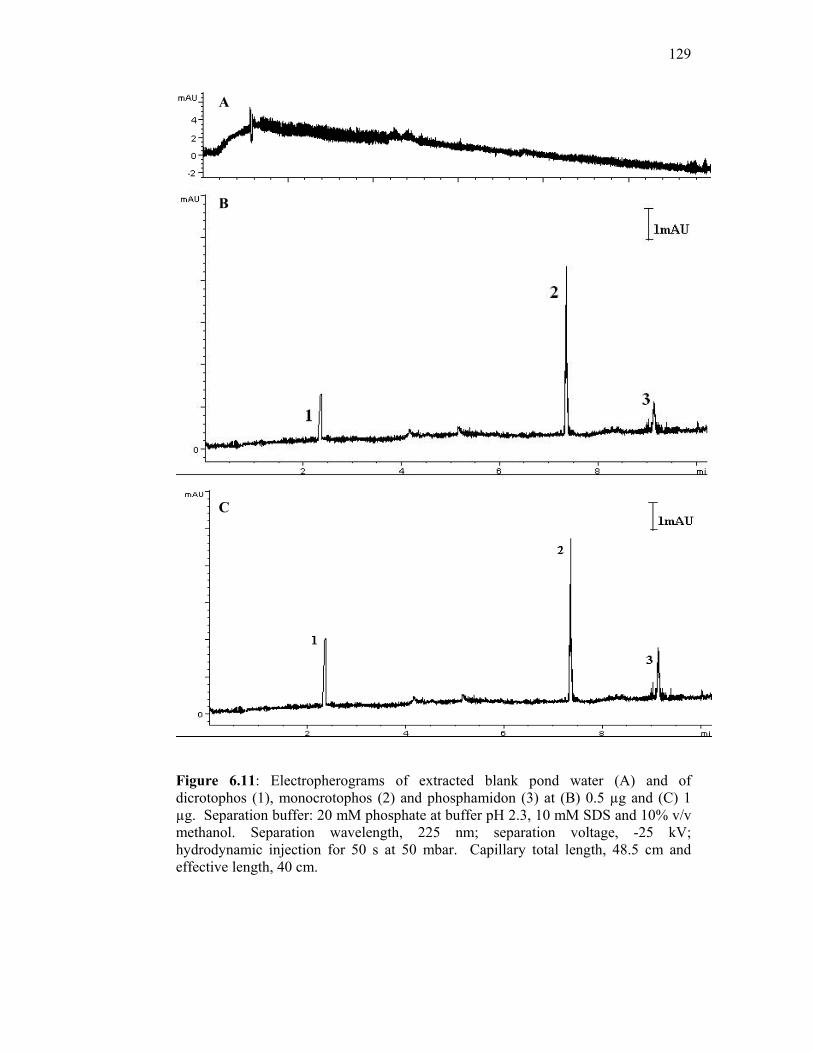
129
Figure 6.11: Electropherograms of extracted blank pond water (A) and of dicrotophos (1), monocrotophos (2) and phosphamidon (3) at (B) 0.5 µg and (C) 1 µg. Separation buffer: 20 mM phosphate at buffer pH 2.3, 10 mM SDS and 10% v/v methanol. Separation wavelength, 225 nm; separation voltage, -25 kV; hydrodynamic injection for 50 s at 50 mbar. Capillary total length, 48.5 cm and effective length, 40 cm.
A
B
C

130
CHAPTER VII
CONCLUSIONS AND FUTURE DIRECTIONS
7.1 Conclusions
MEKC separations of the TCDF and TCDD were successfully performed with
the running buffer of 20 mM di-sodium tetraborate decahydrate buffer containing 20
mM of sodium cholate as the chiral surfactant with 5% v/v mixed modifier MeCN-
MeOH (3:1). It is noteworthy to mention that baseline separation was achieved with a
total analysis time of below 8 min with an optimum wavelength at 225 nm, separation
voltage at 25 kV with hydrodynamic injection for 10 s at 50 mbar. This is the first ever
study conducted specifically on TCDF and TCDD using MEKC with DAD. Although
literature review states that sodium dodecyl sulphate (SDS) as the surfactant with
phosphate as the running buffer is sufficient for good separation, yet it was not achieved
in this study. Instead SDS failed to provide any separation of the two analytes.
Phosphate was also investigated as the running buffer during our preliminary
investigation but in terms of baseline stability and peak intensity, borate performed
superior to phosphate. Based on the influence of different sample matrices, the analytes
were then prepared in water for further optimization as it gave a superior intensity and
baseline stability as compared to buffer matrix and organic matrix (in ethanol).

131
After obtaining the optimized conditions from optimization of parameters which
include organic modifier content and sample matrix, on-line preconcentration techniques
were then carried out. A summary of the on-line preconcentration techniques LODs
were shown in Table 7.1. While Table 7.2 shows the %RSD of migration time, peak
area and peak height for both analytes using the selected on-line preconcentration
methods used. Five on-line preconcentration techniques were used which were normal
stacking mode (NSM-MEKC), reversed electrode polarity stacking mode (REPSM),
high conductivity sample stacking mode (HCSSM), sweeping and field-enhanced
sample injection (FESI-MEKC). Overall, HCSSM gave the best performance to be
applied to water samples giving an LOD of 46 ppb for TCDF while for TCDD it was
18.5 ppb. Korytár et al. obtained a LOD of 70 fg for TCDF while for TCDD was at 90
fg using gas chromatography (Korytár et al., 2004). As stated by the EPA Method 613,
the LOD for TCDF and TCDD were 0.002 ppb thus, in order to achieve that level of
detection, off-line concentration techniques using solid phase disc extraction (SPDE) is
needed for sample enrichment. The detection limits was reduced by 1000 times after
reducing 1 L of deionized water to 1 mL, thus achieving an LOD of 46 ppt and 18.5 ppt
for TCDF and TCDD, respectively. These limits are still above the detection limits set
by the EPA using gas chromatography. As this was the first study conducted on the
usage of MEKC to the detection of these two specific congeners, the results achieved
appear to be promising if compared to the results achieved thus far for TCDD and TCDF
using MEKC which was only in the sub-ppm range (Otsuka et al., 1999). The combined
method using HCSSM-SPDE achieved 46 000 fold SEF for the LOD of both analytes.
Table 7.1: LODs (for S/N = 3) obtained using the three online preconcentration techniques as compared to normal mode (NM) for TCDF and TCDD.
ANALYTES LODNM (ppb)
LODNSM (ppb)
LODREPSM (ppb)
LODHCSSM (ppb)
LODHCSSM-
SPDE (ppt) TCDF 2200 340 130 46 46 TCDD 1710 50 3 18.5 18.5

132
Table 7.2: Repeatabilities for migration time, peak area and peak height for both analytes using the three online preconcentration techniques as compared to normal mode (NM) for TCDF and TCDD. Sweeping and FESI were not successful in enhancing the detection of both analytes.
%RSD, n=3 TCDF TCDD NM Migration
Time 0.16 0.58
Peak Area 3.70 4.36 Peak Height 10.08 3.08
NSM Migration Time
0.50 0.34
Peak Area 6.35 0.92 Peak Height 6.89 2.08
REPSM Migration Time
0.12 0.32
Peak Area 7.75 0.11 Peak Height 2.16 9.37
HCSSM Migration Time
0.29 0.12
Peak Area 1.38 0.80 Peak Height 3.90 0.60
Hydrophilic organophosphorous pesticides which consisted of dicrotophos,
monocrotophos and phosphamidon were successfully separated using acidic buffer
consisting of 20 mM sodium dihydrogenphosphate, 10 mM sodium dodecyl sulphate
and 10% v/v methanol using as reverse mode MEKC (RM-MEKC). Baseline separation
was achieved for the three analytes in less than 10 min which was much shorter
compared to the previous study which achieved an analysis time of below 30 min
(Alam, 2005). The separation voltage applied was -25 kV at detection wavelength 225
nm. This was due to the shorter capillary used in this study. The LODs using RM-
MEKC obtained were 32.1 ppm (dicrotophos), 3.75 ppm (monocrotophos) and 18.6 ppm
(phosphamidon). According to the European Community legislation for the detection
limits for OPPs is 0.1 µgL-1 in water samples.

133
In order to achieve lower detection limits, on-line preconcentration techniques
was needed. Stacking with reverse migrating micelles (SRMM) at a longer
hydrodynamic sample injection time of 50 s at 50 mbar was chosen. Higher injection
times were not chosen as there were peak broadening and reduction in peak efficiency.
In SRMM, the samples were dissolved in water to enhance stacking by providing a low
conductivity zone. The usage of stacking has been able to reduce the LODs by varying
stacking efficiencies with dicrotophos being stacked most efficiently achieving an
SEFheight of 76. The SEFheight obtained for the three OPPs were in the range of 7-76. In
order to enhance detection sensitivity, solid phase disc extraction (SPDE) was employed
to provide sample enrichment and to extract out the analytes from pond water sample
obtained from UTM Lake. Natural water sample was chosen as these pesticides are
mostly found in water due to their high hydrophilicity. With a sample enrichment factor
of 250, the detection limits were successfully improved with reasonable recoveries
ranging from (74-132)%. The LODs achieved were 0.6 ppb for dicrotophos, 1.56 ppb
for monocrotophos and 0.88 ppb for phosphamidon when applied to real water sample.
More work is required in order to achieve the stipulated detection limits in for
application in real sample analysis thus making capillary electrophoresis as a method
comparable to high performance liquid chromatography and gas chromatography.
Overall, this study has shown that with MEKC it is possible to achieve detection
limits of ppt range for TCDF and TCDD and ppb range for the three OPPs. This is an
important development as it shows with further developments, MEKC can be
established as alternative methods to gas chromatography (GC) and high performance
liquid chromatography (HPLC) for environmental analysis. Furthermore, with the
flexibility it offers in optimizing various parameters to enhance separation, MEKC is
more economical compared to GC and HPLC. Continuation of off-line SPDE reduce
the LOD 1000 fold for TCDF and TCDD and 250 fold for the three hydrophilic OPPs.

134
7.2 Future Directions
As the coupling of SPDE and HCSSM-MEKC is the first method conducted on
the analysis of TCDF and TCDD, it is advisable to devise an extraction method that is
more economical and environmentally friendly. This is because the SPDE used in this
method requires large volumes of organic solvents which would not be economical in a
commercial lab. Thus, an alternative extraction method such as single drop
microextraction (SDME) or solid phase microextraction (SPME) that does not require
large volume of organic solvent would be investigated in the future. In addition, Z-
shaped detection cells or high sensitivity capillaries could be used in improving the
detection sensitivity of polychlorinated compounds and the three hydrophilic
organophosphorous pesticides. As for both analytes, water samples were used as the
real sample. The analysis can be extended by using biological fluids such as blood and
animal fatty tissue as the real sample. This is important especially for the
polychlorinated compounds which are highly hydrophobic and thus reside more in
animal fat rather than being excreted into the urine. For the analysis of hydrophilic
OPPs, different online concentration methods such as high salt stacking and non-
aqueous capillary electrophoresis (NACE) could be investigated in their response
towards the detection of the three hydrophilic OPPs. This research can also include
various types of pesticides and organic pollutants with varying hydrophobicities.
Further research and development is required as the usage of MEKC involving
polychlorinated compounds and hydrophilic OPPs is scarce.

135
REFERENCES
Abou-Arab, A. A. K. and Abou Donia, M. A. (2001). Pesticide residues in some
Egyptian spices and medicinal plants as affected by processing. Food Chem. 72.
439-445.
Acedo-Valenzuela, M., Galeano-Díaz, T., Mora-Díez, N. and Silva-Rodríguez, A.
(2004). Determination of neutral and cationic herbicides in water by micellar
elctrokinetic capillary chromatography. Anal. Chim. Acta. 519. 65-71.
Aguilar, M., Farran, A., Serra, C., Sepaniak, M. J. and Whitaker, K. W. (1997). Use of
different surfactants (sodium dodecyl sulfate, bile salts and ionic polymers) in
micellar electrokinetic capillary chromatography. Application to the separation
of organophosphorous pesticides. J. Chromatogr. A 778. 201-205.
Ahmadi, F., Assadi, Y., Hosseini, S. M. R. M. and Rezaee, M. (2006). Determination of
organophosphorous pesticides in water samples by single drop microextraction
and gas chromatography-flame photometric detector. J. Chromatogr. A. 1101.
307-312.
Alam, S. M. M. (2005). Separation of organophosphorous pesticides using micellar
electrokinetic chromatography. Universiti Teknologi Malaysia: Ph.D. Thesis.
Albert, M., Debusschere, L., Demesmay, C. and Rocca, J. L. (1997). Large volume
stacking for quantitative analysis of anions in capillary electrophoresis I. Large-
volume stacking with polarity swithching. J. Chromatogr. A. 757. 281-289.

136
Andreu, V. and Picó, Y. (2004). Determination of pesticides and their degradation
products in soil: critical review and comparison of methods. Trends Anal. Chem.
23. 772-789.
Aprea, C., Colosio, C., Mammone, T., Minoia, C. and Maroni, M. (2002). Biological
monitoring of pesticide exposure: a review of analytical methods. J. Chromatogr.
B. 769. 191-219.
Assuncão, J. V. de, Pesquero, C. R., Bruns, R. E. and Carvalho, L. R. F. (2005). Dioxins
and furans in the atmosphere of São Paulo City, Brazil. Chemosphere 58. 1391-
1398.
Aybar-Muñoz, J., Fernández-González, E., Garcia-Ayuso, L. E., González-Casado, A.
and Cuadros-Rodríguez, L. (2005). Semiqualitative method for detection of
pesticide residues over established limits in vegetables by use of GC-µECD and
GC-(EI)MS. Chromatographia. 61. 505-513.
Baeyens, W., Verstraete, F. and Goeyens, L. (2004). Editiorial: Elucidation of sources,
pathways and fate of dioxins, furans and PCBs requires performant analysis
techniques. Talanta 63. 1095-1100.
Bagheri, H., Saraji, M. and Barcelό, D. (2004). Evaluation of polyaniline as a sorbent for
SPE of a variety of polar pesticides from water followed by CD-MEKC-DAD.
Chromatographia. 59. 283-289.
Barek, S., Paisse, O. and Grenier-Loustalot, M. (2003). Analysis of pesticide residues in
essential oils of citrus fruit by GC-MS and HPLC-MS after solid-phase
extraction. Anal. Bioanal. Chem. 376. 157-161.
Behnisch, P. A., Hosoe, K. and Sakai, S. (2001). Combinatorial bio/chemical analysis of
dioxin and dioxin-like compounds in waste recycling, feed/food, humans/wildlife
and the environment. Environ. Int. 27. 495-519.
Benito, I., Saz, J. M., Marina, M. L., Jiménez-Barbero, J., González, M. J., and Diez-
Masa, J. C. (1997). Micellar electrokinetic capillary chromatographic separation
of polychlorinated biphenyl congeners. J. Chromatogr. A 778. 77-85.
Blanco, E., Casais, M. C., Mejuto, M. C. and Cela, R. (2005). Comparative study of
aqueous and non-aqueos capillary electrophoresis in the separation of
137
halogenated phenolic and bisphenolic compounds in water samples. J.
Chromatogr. A. 1068. 189-199.
Bocio, A. and Domingo, J. L. (2005). Daily intake of polychlorinated dibenzo-p-
dioxins/polychlorinated dibenzofurans (PCDD/PCDFs) in foodstuffs consumed
in Tarragona, Spain: a review of recent studies (2001-2003) on human
PCDD/PCDF exposure through the diet. Environ. Res. 97. 1-9.
Bouald, A., Martin-Esteban, A., Fernández, P. and Cámara, C. (2000). Microwave-
assisted extraction method for the determination of atrazine and four
organophosphorous pesticides in oranges by gas chromatography (GC).
Fresenius J. Anal. Chem. 367. 291-294.
Bretnall, A. E. and Clarke, G. S. (1995). Investigation and Optimization of the Use of
Organic Modifiers in Micellar Electrokinetic Chromatography. J. Chromatogr.
A 716. 49-55.
Byung-Hoon, K., Se-Jin, L., Su-Jung, M. and Yoon-Seok, C. (2005). A case study of
dioxin monitoring in and around an industrial waste incinerator in Korea.
Chemosphere. 58. 1589-1599.
Carabias-Martínez, R., Rodríguez-Gonzalo, E., Revilla-Ruiz, P. and Domínguez-
Álvarez, J. (2003). Solid-phase extraction and sample stacking-micellar
electrokinetic capillary chromatography for the determination of multiresidues of
herbicides and metabolites. J. Chromatogr. A. 990. 291-302.
Charnley, G. and Kimbrough, R. D. (2005). Overview of exposure, toxicity and risks to
children from current levels of 2,3,7,8-tetrachlorodibenzo-p-dioxin and related
compounds in the USA. Food and Chem. Toxicol. 44. 601-615.
Chen, M., Chou, S. and Lin, C. (2004). Determination of corticosterone and 17-
hydroxycorticosterone in plasma and urine samples by sweeping techniques
using micellar electrokinetic chromatography. J. Chromatogr. B. 801. 347-353.
Chia, K., Lee, T. and Huang, S. (2004). Simple device for the solid-phase
microextraction screening of polychlorodibenzo-p-dioxins and
polychlorodibenzofurans in heavily contaminated soil samples. Anal. Chim.
Acta. 527. 157-162.

138
Chou, Y., Huang, W., Chen, C., Lin, S., Wu, H. and Chen, S. (2005). Trace analysis of
zotepine and its active metabolism in plasma by capillary electrophoresis with
solid phase extraction and head-column field-amplified sample stacking. J.
Chromatogr. A. 1087. 189-196.
Choudhary, G. L. H. Keith and C. Rappe (1983). Chlorinated Dioxins and
Dibenzofurans in the Total Environment. Butterworth Publishers.
Čonka, K., Drobná. B., Kočan, A. and Petrík, J. (2005). Simple solid-phase extraction
method for determination of polychlorinated biphenyls and selected
organochlorine pesticides in human serum. J. Chromatogr. A. 1084. 33-38.
Cubas, A. L. V., Carusek, E. , Debacher, N. A. and de Souza, I. G. (2004). Use of solid-
phase microextraction to monitor gases resulting from thermal plasma pyrolysis.
Chromatographia. 60. 85-88.
Dąbrowska, H., Dąbrowski, Ł., Biziuk, M., Gaca, J. and Namieśnik, J. (2003). Solid-
phase extraction clean-up of soil and sediment extracts for the determination of
various types of pollutants in a single run. J. Chromatogr. A. 1003. 29-42.
Danielsson, C., Wiberg, K., Korytár, P., Bergek, S., Brinkman, U. A. Th and Haglund,
P. (2005). Trace analysis of polychlorinated dibenzo-p-dioxins, dibenzofurans
and WHO polychlorinated biphenyls in food using comprehensive two-
dimensional gas chromatography with electron-capture detection. J. Chromatogr.
A. 1086. 61-70.
Danis, T., Sakkas, V., Stratis, I., Albanis, T. A. (2002). Pesticide multiresidue analysis in
fresh and canned peaches using solid phase extraction and gas chromatography
techniques. Bull. Environ. Contam. Toxicol. 69. 674-681.
Deng, B., Liu, Z., Luo, G, Ma, H. and Duan, M. (2002). Rapid quantitative
determination and assessment of insulin in oil formulation by micellar
electrokinetic chromatography. J. Pharm.Biomed. Anal. 27. 73-80.
Dugo, G., Bella, G. D., Torre, L. L. and Saitta, M. (2005). Rapid GC-FPD determination
and organophosphorous pesticide residues in Sicillian and Apulian olive oil.
Food Control. 16. 435-438.

139
Edwards, S. H., Shamsi, S. A. (2000). Micellar electrokinetic chromatography of
polychlorinated biphenyl congeners using a polymeric surfactant as the
pseudostationary phase. J. Chromatogr. A 903. 227-236.
Environmental Protection Agency Method 1613 (1994). Tetra- through Octa-
Chlorinated Dioxins and Furans by Isotope Dilution HRGC/HRMS (Revision B):
Environmental Protection Agency.
Environmental Protection Agency Method 613 (1984): 2,3,7,8-Tetrachlorodibenzo-p-
Dioxin: Environmental Protection Agency.
Environmental Protection Agency Method 8280A (1996): The Analysis Of
Polychlorinated Dibenzo-p-Dioxins and Polychlorinated Dibenzo Furans by
High Resolution Gas Chromatography/Low Resolution Mass Spectrometry
(HRGC/LRMS) (Revision 1): Environmental Protection Agency.
Environmental Protection Agency Method 8290A(1998): .Polychlorinated
Dibenzodioxins (pcdds) and Polychlorinated Dibenzofurans (pcdfs) by High
Resolution Gas Chromatography/High Resolution Mass Spectrometry
(HRGC/HRMS) (Revision 1): Environmental Protection Agency.
Ferré-Huguet, N., Nadal, M., Schumacher, M. and Domingo, J. L. (2005).
Environmental impact and human health risks of polychlorinated dibenzo-p-
dioxins and dibenzofurans in the vicinity of a new hazardous waste incinerator:
A case study. Environ. Sci. Technol. 40. 61-66.
Fiedler, H. (1996). Sources of PCDD/PCDF and impact on the environment.
Chemosphere. 32. 55-64.
Focant, J. and Pauw, E. D. (2002). Fast automated extraction and clean-up of biological
fluids for polychlorinated dibenzo-p-dioxins, dibenzofurans and coplanar
polychlorinated biphenyls analysis. J. Chromatogr. B 776. 199-212.
Focant, J., Eppe, G., Massart, A., Scholl, G., Pirard, C., Pauw, E. D. (2006). High-
throughput biomonitoring of dioxins and polychlorinated biphenyls at the sub-
picogram level in human serum. J. Chromatogr. A. 1130. 97-107.
Focant, J., Pirard, C. and Pauw, E. D. (2004). Automated sample preparation-
fractionation for the measurement of dioxins and related compounds in
biological matrices: a review. Talanta 63. 1101-1113.

140
Fuguet, E., Ráfols, C., Bosch, E., Abraham, M. H. and Rosés, M. (2002). Solute-solvent
interactions in micellar electrokinetic chromatography III. Characterization of the
selectivity of micellar electrokinetic chromatography systems. J. Chromatogr. A.
942. 237-248.
Fuguet, E., Ráfols, C., Rosés, M. and Bosch, E. (2005). Critical micelle concentration of
surfactants in aqueous buffered and unbuffered systems. Anal. Chim. Acta. 548.
95-100.
Gardinali, P. R., Wade, T. L., Chambers, L. and Brooks, J. M. (1996). A complete
method for the quantitative analysis of planar, mono and diortho PCB’s,
polychlorinated dibenzo-p-dioxins and furans in environmental samples.
Chemosphere. 32. 1-11.
Gawlik, B. M., Martens, D., Schramm, K-W, Ketrup, A., Lamberry, A. and Muntau, H.
(2000). On the presence of PCDD/Fs and other chlorinated hydrocarbons in the
second generation of the European Reference Soil Set-the EUROSOILS.
Fresenius J. Anal. Chem. 368. 407-411.
Giordano, B. C., Copper, C. L. and Collins, G. E. (2006). Micellar electrokinetic
chromatography and capillary electrochromatography of nitroaromatic
explosives in seawater. Electrophoresis. 27. 778-786.
Gitahi, S. M., Harper, D. M., Muchini, S. M., Tole, M. P. and Ngángá, R. N. (2002).
Organochlorine and organophosphorous pesticides concentrations in water,
sediment and selected organisms in Lake Naivasha (Kenya). Hydrobiologia. 488.
123-128.
Gómara, B., Bordajandi, L. R., Fernández, M. A., Herrero, L., Abad, E., Abalos, M.,
Rivera, J. and González, M. J. (2005). Levels and Trends of Polychlorinated
dibenzo-p-dioxins/furans (PCDD/Fs) and Dioxin-like polychlorinated biphenyls
(PCBs) in Spanish commercial fish and shellfish products, 1995-2003. J. Agric.
Food. Chem. 53. 8406-8413.
Gómez, M. J., Bueno, M. J. M., Lacorte, S., Fernández-Alba, A. R. and Agüera, A.
(2007). Pilot survey monitoring pharmaceutical related compounds in a sewage
treatment plant located on the Medittaranean Coast. Chemosphere. 66. 993-
1002.

141
Gough, M. (1986). Dioxin, Agent Orange: The fact. Plenum Press.
Grainger, J., McClure, P. C., Liu, Z., Botero, B., Sirimanne, S., Patterson, D. G. Jr.,
Sener, M., Gilly, C., Kimata, K., Hosoya, K., Araki, T., Tanaka, N. and Terabe,
S. (1996). Isomer identification of chlorinated dibenzo-p-dioxins by orthogonal
spectroscopic and chromatographic techniques. Chemosphere. 32. 13-23.
Hamilton, D. and S. Crossley (2004). Pesticide Residues in Food and Drinking Water:
Human Exposure and Risk”. 3rd ed. Wiley Series in Agrochemicals and Plant
Protection.
Hashimoto, S., Matsuda, M., Wakimoto, T. and Tatsukawa, R. (1995). Simple sampling
and analysis of PCDDs and PCDFs in Japanese coastal seawater. Chemosphere.
30. 1979-1986.
Hayward, D. G. and Bolger, P. M. (2005). Tetrachlorodibenzo-p-dioxin in baby food
made from chicken produced before and after the termination of ball clay use in
chicken feed in the United States. Environ. Res. 99. 307-313.
Hernández-Borges, J., Cifuentes, A., Garcia-Montelongo, F. J. and Rodriguez-Delgado,
M. (2005). Combining solid-phase microextraction and on-line preconcentration-
capillary electrophoresis for sensitive analysis of pesticides in foods.
Electrophoresis. 26. 980-989.
How-Ran, C., Shu-Li, W., Pen-Hua, S., Hui-Yen, Y., Sheng-Tsung, Y. and Päpke, O.
(2005). Levels of polychlorinated dibenzo-p-dioxins and dibenzofurans in
primipara breast milk from Taiwan: estimation of dioxins and furans intake for
breastfeed infants. J. Hazard. Mater. A121. 1-10.
Huang, C., Jen, H., Wang, R. and Hsieh, Y. (2006). Sweeping technique combined with
micellar electrokinetic chromatography for the simultaneous determination of
flunitrazepam and its major metabolites. J. Chromatogr. A. 1110. 240-244.
Huang, H. and Lin, C. (2005). Methanol plug assisted sweeping-micellar electrokinetic
chromatography for the determination of dopamine in urine by violet light
emitting diode-induced fluorescence detection. J. Chromatogr. B. 816. 113-119.
Hübner, C., Boos, R. and Prey, T. (2005). In-field measurements of PCDD/F emissions
from domestic heating appliances for solid fuels. Chemosphere. 58. 367-372.
142
Jen, H., Tsai, Y., Su, H. and Hsieh, Y. (2006). On-line preconcentration and
determination of ketamine and norketamine by micellar electrokinetic
chromatography Complementary method to gas chromatography/mass
spectrometry. J. Chromatogr. A. 1111. 159-165.
Jiang, J. and Lucy, C. A. (2002). Determination of alkylphosphonic acids using micellar
electrokinetic chromatography with laser-induced fluorescence detection and
high-salt stacking. J. Chromatogr. A. 966. 239-244.
Kamrin, M. A. and P. W. Rodgers (1985). Dioxins in the Environment. Hemisphere
Publishing Corporation.
Kiguchi, O., Saitoh, K. and Ogawa, N. (2007). Simultaneous extraction of
polychlorinated dibenzo-p-dioxins, polychlorinated dibenzofurans and coplanar
polychlorinated biphenyls from contaminated soil using pressurized liquid
extraction. J. Chromatogr. A. 1144. 262-268.
Kim, B., Ikonomou, M. G., Lee, S., Kim, H. and Chang, Y. (2005). Concentrations of
polybrominated diphenyl ethers, polychlorinated dibenzo-p-dioxins and
dibenzofurans and polychlorinated biphenyls in human blood samples from
Korea. Sci. Total Environ. 336. 45-56.
Kim, J-B. and Terabe, S. (2003). On-line sample preconcentration techniques in micellar
electrokinetic chromatography. J. Pharm.Biomed. Anal. 30. 1625-1643.
Kim, Y., Sun, Y. L., Myungsoo, K. and Shin, D. K. (2001). The survey of PCDDs and
PCDFs in the ambient air of the urban and industrial sites in Korea, 1998-99.
Chemosphere. 43. 501-506.
Kitamura, K., Takazawa, Y., Hashimoto, S., Choi, J., Ito, H. and Morita, M. (2004).
Effective extraction method for dioxin analysis from lipid-rich biological
matrices using a combination of pressurized liquid extraction and dimethyl
sulfoxide/acetonitrile/hexane partitioning. Anal. Chim. Acta. 512. 27-37.
Koistinen, J., Lehtonen, M., Tukia, K., Soimasuo, M., Lahtipera, M. and Oikari, A.
(1998). Identification of lipophilic pollutants discharged from a Finnish pulp and
paper mill. Chemosphere. 37. 219-235.
Korytár, P., Danielsson, C., Leonards, P. E. G., Haglund, P., Boer, J. d and Brinkman, U.
A. Th. (2004). Separation of seventeen 2,3,7,8-substituted polychlorinated
143
dibenzo-p-dioxins and dibenzofurans and 12 dioxin-like polychlorinated
biphenyls by comprehensive two-dimensional gas chromatography with electron-
capture detection. J. Chromatogr. A. 1038. 189-199.
Kreisz, S., Hunsinger, H. and Vogg, H. (1996). Wet scrubbers-a potential PCDD/F
source? Chemosphere. 32. 73-78.
Kristenseon, E. M., Shahmiri, S., Slooten, C. J., Vreuls, R. J. J. and Brinkman, U. A. Th.
(2004). Matrix solid-phase dispersion micro-extraction of pesticides from single
insects with subsequent GC-MS analysis. Chromatographia. 59. 315-320.
Laamanen, P., Blanco, E., Cela, R. and Matilainen, R. (2006). Improving sensitivity in
simultaneous determination of copper carboxylates by nonaqueous capillary
electrophoresis. J. Chromatogr. A. 1110. 261-267.
Lacorte, S., Latorre, A., Barcelό, D., Rigol, A., Malmqvist, A., Welander, T. (2003).
Organic compounds in paper-mill process waters and effluents. Trends Anal.
Chem. 22. 725-737.
Leung, S. and Mello, A. J. de. (2002). Electrophoretic analysis of amines using reversed-
phase, reversed-polarity, head-column field-amplified sample stacking and laser-
induced fluorescence detection. J. Chromatogr. A. 979. 171-178.
Liem, A. K. D. (1999). Important developments in methods and techniques for the
determination of dioxins and PCBs in foodstuffs and human tissues. Trends Anal.
Chem. 18. 499-507.
Liu, H., Zhang, Q., Song, M., Jiang, G. and Cai, Z. (2006). Method development for the
analysis of polybrominated diphenyl ethers, polychlorinated biphenyls,
polychlorinated dibenzo-p-dioxins and dibenzo-furans in single extract of
sediment samples. Talanta. 70. 20-25.
Liu, H., Zhang, Q., Song, M., Jiang, G. and Cai, Z. (2006). Separation of
polybrominated diphenyl ethers, polychlorinated biphenyls, polychlorinated
dibenzo-p-dioxins and dibenzo-furans in environmental samples using silica gel
and florisil fractionation chromatography. Anal. Chim. Acta. 557. 314-320.
Lucio G. Costa, Corrado L. Galli and Sheldon D. Murphy (1986). Toxicology of
Pesticides: Experimental, Clinical and Regulatory Perspectives”. NATO ASI
Series.

144
Lόpez-Blanco, C., Gόmez-Álvarez, S., Rey-Garrote, M., Cancho-Grande, B.and Sinal-
Gándara, J. (2005). Determination of carbamates and organophosphorous
pesticides in SDME-GC in natural water. Anal. Bioanal. Chem. 383. 557-561.
Marina, M. L., Benito, I., Díez-Masa, J. C. and González, M. J. (1996). Separation of
chiral polychlorinated biphenyls by micellar electrokinetic chromatography using
β- and γ-cyclodextrin mixtures in the separation buffer. J. Chromatogr. A. 752.
265-270.
Martínez-Cored, M., Pujadas, E. and Díaz-Ferrero, Coll, M., Martí, R. and Broto-Puig,
F., Comellas, L. and Rodríguez-Larena, M. C. (1999). Fractionation of
polychlorinated dibenzo-p-dioxins, polychlorinated dibenzofurans and planar
polychlorinated biphenyls by high performance liquid chromatography on a
pyrenyl-silica column. Fresenius J. Anal. Chem. 364. 576-583.
Maul, J. D., Farris, J. L. and Lydy, M. J. (2005). Interaction of chemical cues from fish
tissues and organophosphorous pesticides on Ceriodaphnia dubia survival.
Environ. Pollut. 141. 90-97.
Menzinger, F., Schmitt-Kopplin, Ph., Freitag, D. and Kettrup, A. (2000). Analysis of
agrochemicals by capillary electrophoresis. J. Chromatogr. A. 891. 45-67.
Molina, M. and Silva, M. (2000). Rapid determination of fungicides in fruit juices by
micellar electrokinetic chromatography: Use of organic modifiers to enhance
selectivity and on-column high-salt stacking to improve sensitivity.
Electrophoresis. 21. 3625-3633.
Moullec, S. L, Bégos, A., Pichon, V. and Bellier, B. (2006). Selective extraction of
organophosphorous nerve agent degradation products by molecularly imprinted
solid-phase extraction. J. Chromatogr. A. 1108. 7-13.
Muijiselaar, P. G., Otsuka, K. and Terabe, S. (1997). Micelles as pseudo-stationary
phases in micellar electrokinetic chromatography. J. Chromatogr. A 780. 41-61.
Musijowski, J., Poboży, E. and Trojanowicz, M. (2006). On-line preconcentration
techniques in determination of precursors/metabolites using micellar
electrokinetic chromatography. J. Chromatogr. A. 1104. 337-345.
Nakamata, K. and Ohi, H. (2003). Examination of polychlorinated dibenzo-p-dioxins
and polychlorinated dibenzofurans in process water of kraft pulp bleaching mill
145
using chlorine dioxide from the aspect of environmental quality. J. Wood Sci. 49.
525-530.
Nevado, J. J. B., Flores, J. R., Peñalvo, G. C. and Fariñas, N. R. (2002). Determination
of sildenafil citrate and its main metabolite by sample stacking with polarity
switching using micellar electrokinetic chromatography. J. Chromatogr. A. 953.
279-286
Nordmeyer, K. and Their, H. (1999). Solid-phase extraction for replacing
dichloromethane partitioning in pesticide multiresidue analysis. Z. Lebensm
Unters Forsch A. 208. 259-263.
Núñez, O., Moyano, E., Puignou, L. and Galceran, M. T. (2001). Sample stacking with
matrix removal for the determination of paraquat, diquat and difenzoquat in
water by capillary electrophoresis. J. Chromatogr. A. 912. 353-361.
Oh, J. R., Hong, S. H., Shim, W. J. and Kannan, N. (2005). A survey of polychlorinated
dibenzo-p-dioxins and furans in Korean seafood-a congener-specific approach.
Mar. Pollut. Bul. 50. 1121-1145.
Otsuka, K., Hayashibara, H., Yamauchi, S., Quirino, J. P., Terabe, S. (1999). Highly-
sensitive micellar electrokinetic chromatographic analysis of dioxin-related
compounds using on-line concentration. J. Chromatogr. A. 853. 413-420.
Otsuka, K., Matsumura, M., Kim, J. and Terabe, S. (2003). On-line preconcentration and
enantioselective separation of triadimenol by electrokinetic chromatography
using cyclodextrins as chiral selectors. J. Pharm.Biomed. Anal. 30. 1861-1867.
Palmer, J. and Landers, J. P. (2000). Stacking neutral analytes in capillary electrokinetic
chromatography with high-salt sample matrixes. Anal. Chem. 72. 1941-1943.
Palmer, J. F. (2004). High-salt stacking principles and sweeping: comments and
contrasts on mechanisms for high-sensitivity analysis in capillary
electrophoresis. J. Chromatogr. A. 1036. 95-100.
Pandelova, M., Lenoir, D. and Schramm, K.-W. (2006). Correlation between PCDD/F,
PCB and PCBz in coal/waste combustion. Influence of various inhibitors.
Chemosphere. 62. 1196-1205.

146
Pérez-Ruiz, T., Martínez-Lozano, C., Sanz, A. and Bravo, E. (2005). Determination of
organophosphorous pesticides in water, vegetables and grain by automated SPE
and MEKC. Chromatographia. 61. 493-498.
Persson-Stubberud, K. and Ǻström, O. (1998). Separation of ibuprofen, codein
phosphate, their degradation products and impurities by capillary electrophoresis.
I. Method development and optimization with fraction factorial design. J.
Chromatogr. A. 798. 307-314.
Pirard, C. and Pauw, E. D. (2005). Uptake of polychlorodibenzo-p-dioxins,
polychlorodibenzofurans and coplananr polychlorobiphenyls in chickens.
Environ. Int. 31. 585-591.
Poole, C. F. (2003). New trends in solid-phase extraction. Trends Anal. Chem. 22. 362-
373.
Puig, P., Borrull, F., Caluli, M. and Aguilar, C. (2005). Sample stacking for the analysis
of eight penicillin antibiotics by micellar electrokinetic capillary
chromatography. Electrophoresis. 26. 954-961.
Pujadas, E., Diaz-Ferrero, J., Martí, R., Broto-Puig, F., Comellas, L. and Rodríguez-
Larena, M. C. (2001). Application of the new C18 speedisksTM . Chemosphere 43
449-454.
Pyell, U. (2001). Micellar electrokinetic chromatography-From theoretical concepts to
real samples (Review). Fresenius J. Anal. Chem. 371. 691-703.
Quirino, J. and Terabe, S. (1997). On-line concentration of neutral analytes for micellar
electrokinetic chromatography II. Reversed electrode polarity stacking mode. J.
Chromatogr. A. 791. 255-267.
Quirino, J. P and Terabe, S. (1997). On-line concentration of neutral analytes for
micellar electrokinetic chromatography I. Normal Stacking Mode. J.
Chromatogr. A. 781. 119-128.
Quirino, J. P and Terabe, S. (1998). On-line concentration of neutral analytes for
micellar electrokinetic chromatography IV. Field-enhanced sample injection. J.
Chromatogr. A. 798. 251-257.

147
Quirino, J. P, Inoue, N. and Terabe, S. (2000). Reversed migration micellar
electrokinetic chromatography with off-line and on-line concentration analysis of
pheynylurea herbicides. J. Chromatogr. A. 892. 187-194.
Quirino, J. P, Terabe, S., Otsuka, K., Vincent, J. B. and Vigh, G. (1999). Sample
concentration by sample stacking and sweeping using microemulsion and a
single-isomer sulphated β-cyclodextrin as pseudostationary phase in
electrokinetic chromatography. J. Chromatogr. A. 838. 3-10.
Quirino, J. P. and Terabe, S. (1999). Sweeping of analyte zones in electrokinetic
chromatography. Anal. Chem. 71. 1638-1644.
Rabindranathan, S., Devipriya, S. and Yesodharan, S. (2003). Photocatalytic degradation
of phosphamidon on semiconductor oxides. J. Hazard. Mater. B102. 217-229.
Reiner, J. E., Clement, R. E., Okey, A. B. and Marvin, C. H. (2006). Advances in
analytical techniques for polychlorinated dibenzo-p-dioxins, polychlorinated
dibenzofurans and dioxin-like PCBs. Anal. Bional. Chem. 7. 216-232.
Richter, B. E., Ezzell, J. L., Knowles, E., Hoefler, F., Mattulat, A. K. R., Schentwinkel,
M., Waddell, D. S., Gobran, T. and Khurans, V. (1997). Extraction of
polychlorinated dibenzo-p-dioxins and polychlorinated dibenzofurans from
environmental samples using accelerated solvent extraction (ASE).
Chemosphere. 34. 975-987.
Riekkola, M., Jussila, M., Porras, S. P. and Valkó, I. E. (2000). Non-aqueous capillary
electrophoresis. J. Chromatogr. A. 892. 155-170.
Saito, K. Takekuma, M., Ogawa, M., Kobayashi, S., Sugawara, Y., Ishizuka, M.,
Nakagawa, H. and Matsuki, Y. (2003). Extraction and clean-up methods of
dioxins in house dust from two cities in Japan using accelerated solvent
extraction and a disposable multi-layer silica-gel cartridges. Chemosphere. 53.
137-142.
Santos, F. J. and Galceran, M. T. (2002). The application of gas chromatography to
environmental analysis. Trends Anal. Chem. 21. 672-685.
Shang, X and Yuan, Z. (2003). Determination of hydroxyanthraquinoids in Rhubarb by
cyclodextrin-modified micellar electrokinetic chromatography using a mixed

148
micellar system of sodium dodecyl sulfate and sodium cholate. J.
Pharm.Biomed. Anal. 31. 75-81.
Shcenck, F. J. and Donoghue, D. J. (2000). Determination of organochlorine and
organophosphorous pesticide residues in eggs using a solid phase extraction
cleanup. J. Agric. Food. Chem. 48. 6412-6145.
Shihabi, Z. K. and Hinsdale, M. E. (1995). Sample matrix effects in micellar
electrokinetic capillary electrophoresis. J. Chromatogr. B. 66. 75-83.
Silva, C., Lima, E. C. de and Tavares, M. F. M. (2003). Investigation of
preconcentration strategies for the trace analysis of multi-residue pesticides in
real samples by capillary electrophoresis. J. Chromatogr. A. 1014. 159-165.
Singh, S. A. and Kulshrestha, G. (1997). Gas chromatographic analysis of
polychlorinated dibenzo-p-dioxins and dibenzofurans. J. Chromatogr. A. 774.
97-109.
Smyth, W. F., Harland, G. B., McClean, S., McGrath, G. and Oxspring, D. (1997).
Effect of on-capillary large volume sample stacking on limits of detection in the
capillary zone electrophoretic determination of selected drugs, dyes and metal
chelates. J. Chromatogr. A. 772. 161-169.
Suarez, M. P., Rifai, H. S., Palachek, R., Dean, K. and Koenig, L. (2006). Distribution of
polychlorinated dibenzo-p-dioxins and dibenzofurans in suspended sediments,
dissolved phase and bottom sediment in the Houston Ship Channel.
Chemosphere 62. 417-429.
Sun, S. and Tseng, H. (2005). Sensitivity improvement on detection of Coptidis
alkaloids by sweeping in capillary electrophoresis. J. Pharm.Biomed. Anal. 37.
39-45.
Süsse, H. and Müller, H. (1996). Pesticide analysis by micellar electrokinetic capillary
chromatography. J. Chromatogr. A. 730. 337-343.
Szökő, É., Gyimesi, J., Barcza, L., Magyar, K. (1996). Determination of binding
constants and the influence of methanol on the separation of drug enantiomers in
cyclodextrin modified capillary electrophoresis. J. Chromatogr. A. 745. 181-187.

149
Takeda, S., Wakida, S., Yamane, M., Siroma, Z., Higashi, K. and Terabe, S. (1998). Use
of several anionic surfactants for the separation of aniline derivatives in micellar
electrokinetic chromatography. J. Chromatogr. A 817. 59-63.
Tarbah, F. A., Mahler, H., Temme, O. and Daldrup, T. (2001). An analytical method for
the rapid screening of organophosphate pesticides in human biological samples
and foodstuffs. Forensic Sci. Int. 121. 126-133.
Taylor, K. Z., Waddell, D. S., Reiner, E. J. and MacPherson, K. A. (1995). Direct
elution of solid phase extraction disks for the determination of polychlorinated
dibenzo-p-dioxins and polychlorinated dibenzofurans in effluent samples. Anal.
Chem. 67. 1186-1190.
Terabe, S. (1989). Electrokinetic chromatography: an interface between electrophoresis
and chromatography. Trends Anal. Chem. 8. 12-134.
Thorsteinsdóttir, M., Ringbom, C., Westerlund, D., Andersson, G. and Kaufman, P.
(1999). Multivariate evaluation of organic modifier effect on the separation
performance of peptides in micellar electrokinetic chromatography. J.
Chromatogr. A. 831. 293-309.
Todaka, S., Hirahawa, H., Hori, T., Tobishi, K., Iida, T. and Furue, M. (2007).
Concentration of polychlorinated dibenzo-p-dioxins, polychlorinated
dibenzofurans and non-ortho and mono-ortho polychlorinated biphenyls in blood
of Yusho patients. Chemosphere. 66. 1983-1989.
Turyk, M., Anderson, H. A., Hanrahan, L. P., Falk, C., Steenport, D. N., Needham, L.
L., Patterson, D. G. Jr., Freels, S., Persky, V. and the Great Lakes Consortium.
(2006). Relationship of serum levels of individual PCB, dioxin and furan
congeners and DDE with Great Lakes sport-caught fish consumption. Environ.
Res. 100. 173-183.
Vijay A. K. B. Gundi, Reddy, B. R. (2005). Degradation of monocrotophos in soils.
Chemosphere. 62. 396-403.
Wan Ibrahim, Wan Aini, Alam S. M. M. and Sulaiman, A. B. (2005). Organic modifier
and effect of sample matrix on the separation of organophosphorous pesticides in
micellar electrokinetic chromatography. Malaysian J. Chem. 7. 26-31.

150
Wang, M., Wu, D., Yao, Q and Shen, X. (2004). Separation and selectivity in micellar
electrokinetic chromatography using sodium dodecyl sulfate micelles or Tween
20-modified mixed micelles. Anal. Chim. Acta. 519. 73-78.
Wang, S., Wu, Y., Ju, Y., Chen, X., Zheng, W. and Hu, Z. (2003). On-line concentration
by field-enhanced sample injection with reverse migrating micelles in micellar
electrokinetic capillary chromatography for the analysis of flavonoids in
Epimedium brevicornum Maxim. J. Chromatogr. A. 1017. 27-34.
Wang, S., Ye, S. and Cheng, Y. (2006). Separation and on-line concentration of
saponins from Panax notoginseng by micellar electrokinetic chromatography. J.
Chromatogr. A. 1109. 279-284.
Watanabe, T., Yamamoto, A., Nagai, S. and Terabe, S. (1998). Micellar electrokinetic
chromatography as an alternative to high-performance liquid chromatography for
separation and determination of phenolic compounds in Japanese spirituous
liquor. J. Chromatogr. A 793. 409-413.
Weinberger, R. and Lurie, I. S. (1991). Micellar electrokinetic chromatography of illicit
drug substances. Anal. Chem. 63 823-827.
Wenning, R. J., Mathur, D. B., Paustenbach, D. J., Stephenson, M. J., Folwarkow, S. and
Luksemburg, W. J. (1999). Polychlorinated dibenzo-p-dioxins and dibenzofurans
in storm water outfalls adjacent to urban areas and petroleum refineries in San
Francisco Bay, California. Arch. Environ. Contam. Toxicol. 37. 290-301.
Westbom, R., Thörneby, L., Zorita S., Mathiasson, L. and Björklund, E. (2004).
Development of a solid-phase extraction method for the determination of
polychlorinated biphenyls in water. J. Chromatogr. A. 1033. 1-8.
Wong, J. W., Webster, M. G., Halverson, C. A., Hengel, M. J., Ngim, K. K and Ebeler,
S. E. (2003). Multiresidue pesticide analysis in wines by solid phase extraction
and capillary gas chromatography-mass spectrometric detection with selective
ion monitoring. J. Agric. Food. Chem. 51. 1148-1161.
Xingjiu, H., Yufeng, S., Fanli, M and Jinhuai, L. (2004). New approach for the detection
of organophosphorous pesticide in cabbage using SPME/SnO2 gas sensor:
principle and preliminary experiment. Sens. Actuators B102. 235-240.

151
You, J., Weston, D. P. and Lydy, M. J. (2004). A sonication extraction method for the
analysis of pyrethroid, organophosphate and organochlorine pesticides from
sediment by gas chromatography with electron-capture detection. Arch. Environ.
Contam. Toxicol. 47. 141-147.
Zhang, L. and Sun, M. (2005). Field-amplified sample injection and in-capillary
derivatization for sensitivity improvement of the electrophoretic determination of
histamine. J. Chromatogr. A. 1100. 230-235.

152
APPENDICES
LIST OF PUBLICATIONS
1. Wan Aini Wan Ibrahim, Sharain Liew Yen Ling, Mohd Marsin Sanagi, “Organic
Modifier Influence on the Separation of 2,3,7,8-TCDD and 2,3,7,8-TCDF using
Micellar electrokinetic Chromatography”, Buletin Kimia, 22, 2006, 1-10 (ISSN
0127-8711).
2. Wan Aini Wan Ibrahim, Sharain Liew Yen Ling, Mohd Marsin Sanagi, “Sample
Matrix Effect on the Separation of 2,3,7,8-tetrachlorodibenzo-p-dioxin (TCDD)
and 2,3,7,8-tetrachlorodibenzo-p-furan TCDF) using Micellar Electrokinetic
Chromatography”, ACGC Chemical Research Communications, 2007, 21, 30-
33.
3. Wan Aini Wan Ibrahim, Sharain Liew Yen Ling, Mohd Marsin Sanagi,
“Analysis of dioxin and furan related compounds and organophosphorous
pesticides using micellar electrokinetic choramtography (MEKC)” (under
preparation for submission to J. Chromatogr. A.).

153
LIST OF PRESENTATIONS
1. Wan Aini Wan Ibrahim, Sharain Liew Yen Ling, Mohd Marsin Sanagi, “On-line
preconcentration in micellar electrokinetic chromatography for analysis of
dioxin-related compounds.” 30th International Symposium On Capillary
Chromatography. Dalian, China. 5th-7th June 2007.
2. Wan Aini Wan Ibrahim, Sharain Liew Yen Ling, Mohd Marsin Sanagi,
“Preliminary Investigation on the Separation of 2,3,7,8-TCDF and 2,3,7,8-TCDD
using Micellar Electrokinetic Chromatography (MEKC).” Poster presentation at
the 18th Simposium Kimia Analisis Malaysia (SKAM-18). Universiti Teknologi
Malaysia, Skudai, Johor, Malaysia. September 12-14, 2005.