Embed Size (px)
Citation preview
VPH-PRISM D3.6
Theme: ICT-2011.5.2 - Virtual Physiological Human
1.
VPH-PRISM
Virtual Physiological Human: Personalized Predictive Breast Cancer Therapythrough Integrated Tissue Micro-Structure Modeling
Grant Agreement Number: 601040
Report and module for quantitativetemporal change tracking
Deliverable 3.6
Lead Partner: Fraunhofer MEVIS (FME)Author(s): L. Wang, C. Stoecker, J. Georgii, J. Peters, M. Harz (FME)Work Package No.: 3Estimated delivery date: Sep 11 2015 Actual delivery date: Sep 14 2015Nature: Report(R)Dissemination level: Public (PU)
This project has received funding from the European Union’s Seventh Framework Program forresearch, technological development and demonstration under grant agreement no 601040.
1
VPH-PRISM D3.6
Contents
1 Algorithm description 41.1 Registration of longitudinal breast MRI . . . . . . . . . . . . . . . . . . . . . . . 4
1.1.1 Automatic breast segmentation . . . . . . . . . . . . . . . . . . . . . . . 41.1.2 Initial affine transform . . . . . . . . . . . . . . . . . . . . . . . . . . . . 51.1.3 Deformable image registration . . . . . . . . . . . . . . . . . . . . . . . 5
1.2 Spatial linking of lesions . . . . . . . . . . . . . . . . . . . . . . . . . . . . . . . . 61.3 Lesion characteristic parameters extraction . . . . . . . . . . . . . . . . . . . . 71.4 Impact and Outreach . . . . . . . . . . . . . . . . . . . . . . . . . . . . . . . . . . 8
2 Algorithm evaluation 102.1 Technical evaluation study . . . . . . . . . . . . . . . . . . . . . . . . . . . . . . . 10
2.1.1 Data sets . . . . . . . . . . . . . . . . . . . . . . . . . . . . . . . . . . . . 102.1.2 Evaluation and Comparison . . . . . . . . . . . . . . . . . . . . . . . . . 10
2.2 Clinical evaluation study . . . . . . . . . . . . . . . . . . . . . . . . . . . . . . . . 122.2.1 Clinical study setup . . . . . . . . . . . . . . . . . . . . . . . . . . . . . . 122.2.2 Results . . . . . . . . . . . . . . . . . . . . . . . . . . . . . . . . . . . . . . 13
3 Modules implementation 14
2

VPH-PRISM D3.6
Introduction
Quantitative investigation of the temporal change of lesions is an important task in the appli-cations such as follow-up examination in breast cancer screening and neoadjuvant chemother-apy monitoring. Normally, the chemotherapy response is explored by taking MR images,such as T2-weighted, dynamic contrast enhanced MRI (DCE-MRI) or diffusion weighted im-ages (DWI) sequences. However, current clinical workstations lack the ability to efficientlydeal with prior breast MR images. In this deliverable, algorithms and modules are devel-oped to facilitate the workflow for investigating longitudinal studies with regular intervals.The modules developed involve temporal image registration, automatic linkage of findingsin longitudinal studies, and extraction of clinically relevant parameters describing local orregional change of lesion characteristics. The extracted lesion characteristic parameters willbe evaluated and used in the tumor extent model, which plays an essential role for decisionmaking and planning of tumor resection surgeries.
The report of this deliverable is organized into following sections. First, a detailed algo-rithmic description of the modules and methods developed in this task is given. These aretested in two comprehensive evaluation studies from the technical and the clinical aspects,and we report setup and the corresponding results. In the end, the implementation and userinterface of these modules under the MeVisLab platform are elucidated.
3
VPH-PRISM D3.6
1 Algorithm description
1.1 Registration of longitudinal breast MRI
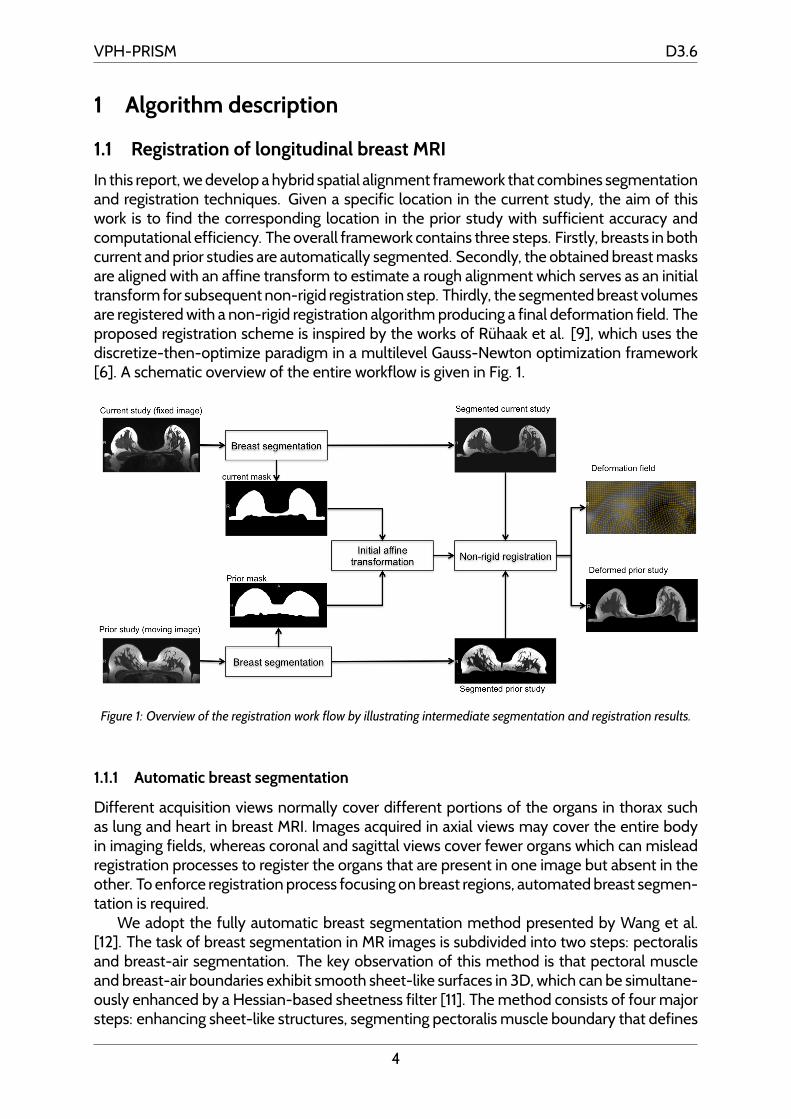
In this report, we develop a hybrid spatial alignment framework that combines segmentationand registration techniques. Given a specific location in the current study, the aim of thiswork is to find the corresponding location in the prior study with sufficient accuracy andcomputational efficiency. The overall framework contains three steps. Firstly, breasts in bothcurrent and prior studies are automatically segmented. Secondly, the obtained breast masksare aligned with an affine transform to estimate a rough alignment which serves as an initialtransform for subsequent non-rigid registration step. Thirdly, the segmented breast volumesare registered with a non-rigid registration algorithm producing a final deformation field. Theproposed registration scheme is inspired by the works of Ruhaak et al. [9], which uses thediscretize-then-optimize paradigm in a multilevel Gauss-Newton optimization framework[6]. A schematic overview of the entire workflow is given in Fig. 1.
Figure 1: Overview of the registration work flow by illustrating intermediate segmentation and registration results.
1.1.1 Automatic breast segmentation
Different acquisition views normally cover different portions of the organs in thorax suchas lung and heart in breast MRI. Images acquired in axial views may cover the entire bodyin imaging fields, whereas coronal and sagittal views cover fewer organs which can misleadregistration processes to register the organs that are present in one image but absent in theother. To enforce registration process focusing on breast regions, automated breast segmen-tation is required.
We adopt the fully automatic breast segmentation method presented by Wang et al.[12]. The task of breast segmentation in MR images is subdivided into two steps: pectoralisand breast-air segmentation. The key observation of this method is that pectoral muscleand breast-air boundaries exhibit smooth sheet-like surfaces in 3D, which can be simultane-ously enhanced by a Hessian-based sheetness filter [11]. The method consists of four majorsteps: enhancing sheet-like structures, segmenting pectoralis muscle boundary that defines
4
VPH-PRISM D3.6
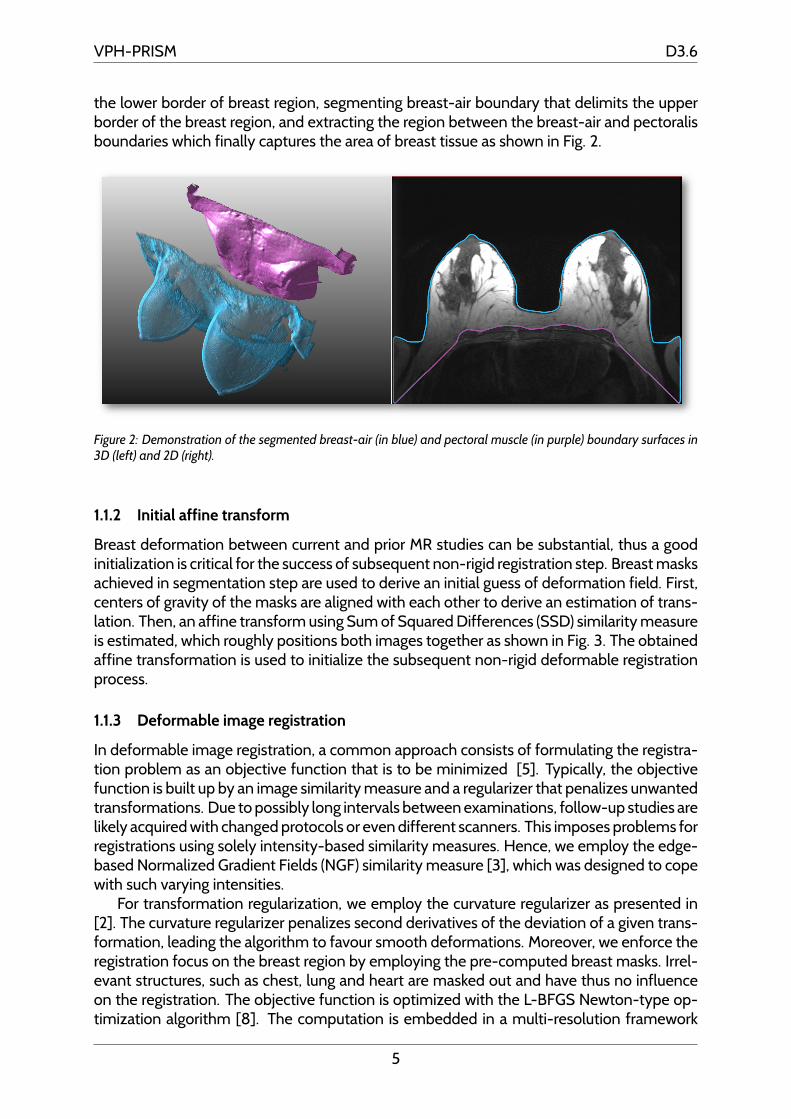
the lower border of breast region, segmenting breast-air boundary that delimits the upperborder of the breast region, and extracting the region between the breast-air and pectoralisboundaries which finally captures the area of breast tissue as shown in Fig. 2.
Figure 2: Demonstration of the segmented breast-air (in blue) and pectoral muscle (in purple) boundary surfaces in3D (left) and 2D (right).
1.1.2 Initial affine transform
Breast deformation between current and prior MR studies can be substantial, thus a goodinitialization is critical for the success of subsequent non-rigid registration step. Breast masksachieved in segmentation step are used to derive an initial guess of deformation field. First,centers of gravity of the masks are aligned with each other to derive an estimation of trans-lation. Then, an affine transform using Sum of Squared Differences (SSD) similarity measureis estimated, which roughly positions both images together as shown in Fig. 3. The obtainedaffine transformation is used to initialize the subsequent non-rigid deformable registrationprocess.
1.1.3 Deformable image registration
In deformable image registration, a common approach consists of formulating the registra-tion problem as an objective function that is to be minimized [5]. Typically, the objectivefunction is built up by an image similarity measure and a regularizer that penalizes unwantedtransformations. Due to possibly long intervals between examinations, follow-up studies arelikely acquired with changed protocols or even different scanners. This imposes problems forregistrations using solely intensity-based similarity measures. Hence, we employ the edge-based Normalized Gradient Fields (NGF) similarity measure [3], which was designed to copewith such varying intensities.
For transformation regularization, we employ the curvature regularizer as presented in[2]. The curvature regularizer penalizes second derivatives of the deviation of a given trans-formation, leading the algorithm to favour smooth deformations. Moreover, we enforce theregistration focus on the breast region by employing the pre-computed breast masks. Irrel-evant structures, such as chest, lung and heart are masked out and have thus no influenceon the registration. The objective function is optimized with the L-BFGS Newton-type op-timization algorithm [8]. The computation is embedded in a multi-resolution framework
5
VPH-PRISM D3.6
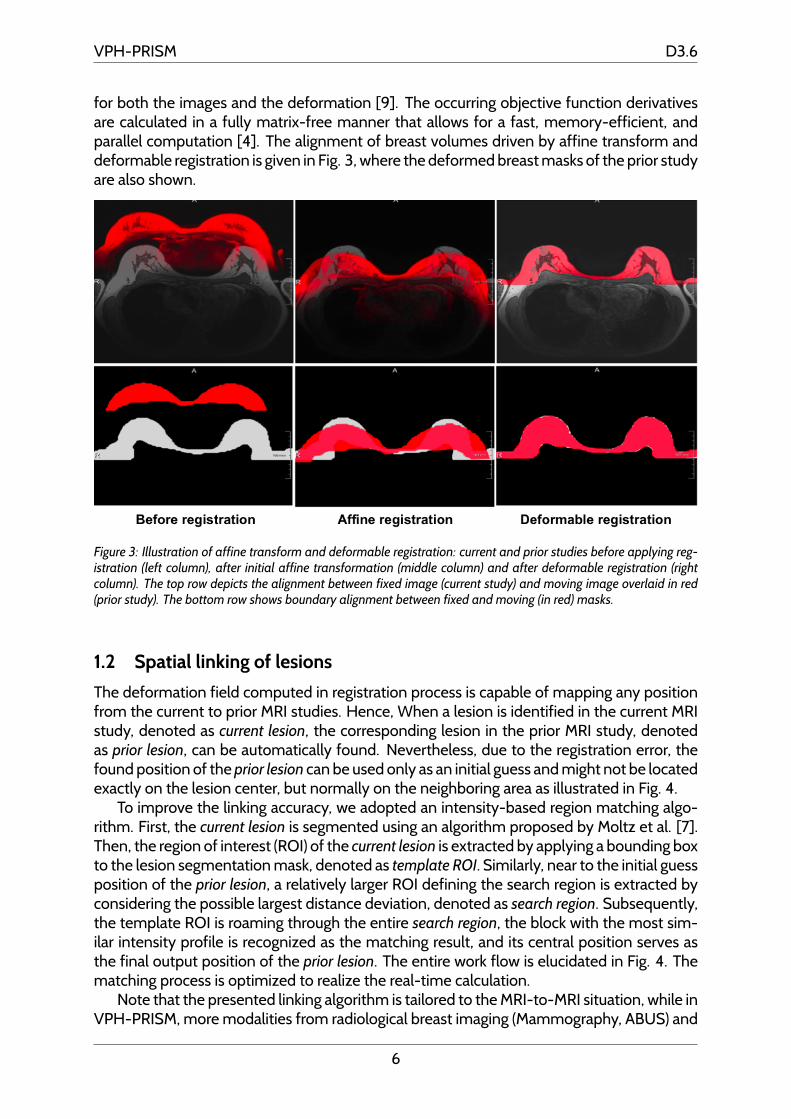
for both the images and the deformation [9]. The occurring objective function derivativesare calculated in a fully matrix-free manner that allows for a fast, memory-efficient, andparallel computation [4]. The alignment of breast volumes driven by affine transform anddeformable registration is given in Fig. 3, where the deformed breast masks of the prior studyare also shown.
Figure 3: Illustration of affine transform and deformable registration: current and prior studies before applying reg-istration (left column), after initial affine transformation (middle column) and after deformable registration (rightcolumn). The top row depicts the alignment between fixed image (current study) and moving image overlaid in red(prior study). The bottom row shows boundary alignment between fixed and moving (in red) masks.
1.2 Spatial linking of lesions
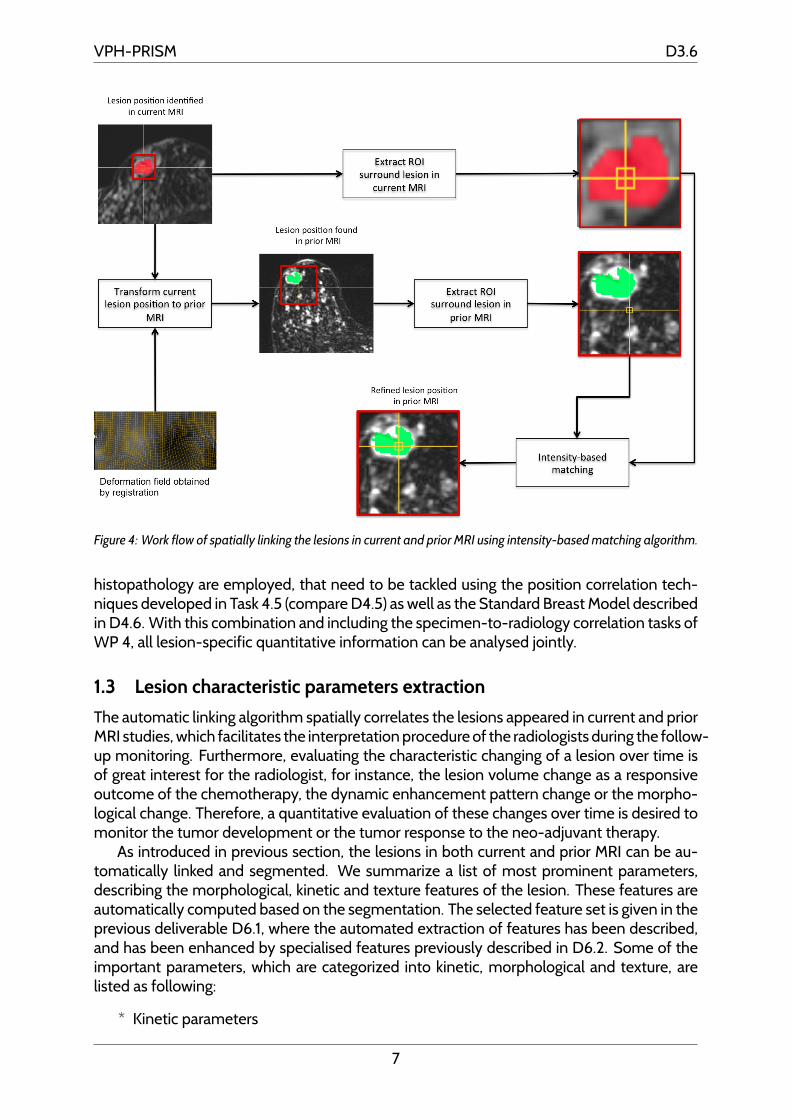
The deformation field computed in registration process is capable of mapping any positionfrom the current to prior MRI studies. Hence, When a lesion is identified in the current MRIstudy, denoted as current lesion, the corresponding lesion in the prior MRI study, denotedas prior lesion, can be automatically found. Nevertheless, due to the registration error, thefound position of the prior lesion can be used only as an initial guess and might not be locatedexactly on the lesion center, but normally on the neighboring area as illustrated in Fig. 4.
To improve the linking accuracy, we adopted an intensity-based region matching algo-rithm. First, the current lesion is segmented using an algorithm proposed by Moltz et al. [7].Then, the region of interest (ROI) of the current lesion is extracted by applying a bounding boxto the lesion segmentation mask, denoted as template ROI. Similarly, near to the initial guessposition of the prior lesion, a relatively larger ROI defining the search region is extracted byconsidering the possible largest distance deviation, denoted as search region. Subsequently,the template ROI is roaming through the entire search region, the block with the most sim-ilar intensity profile is recognized as the matching result, and its central position serves asthe final output position of the prior lesion. The entire work flow is elucidated in Fig. 4. Thematching process is optimized to realize the real-time calculation.
Note that the presented linking algorithm is tailored to the MRI-to-MRI situation, while inVPH-PRISM, more modalities from radiological breast imaging (Mammography, ABUS) and
6
VPH-PRISM D3.6
Figure 4: Work flow of spatially linking the lesions in current and prior MRI using intensity-based matching algorithm.
histopathology are employed, that need to be tackled using the position correlation tech-niques developed in Task 4.5 (compare D4.5) as well as the Standard Breast Model describedin D4.6. With this combination and including the specimen-to-radiology correlation tasks ofWP 4, all lesion-specific quantitative information can be analysed jointly.
1.3 Lesion characteristic parameters extraction
The automatic linking algorithm spatially correlates the lesions appeared in current and priorMRI studies, which facilitates the interpretation procedure of the radiologists during the follow-up monitoring. Furthermore, evaluating the characteristic changing of a lesion over time isof great interest for the radiologist, for instance, the lesion volume change as a responsiveoutcome of the chemotherapy, the dynamic enhancement pattern change or the morpho-logical change. Therefore, a quantitative evaluation of these changes over time is desired tomonitor the tumor development or the tumor response to the neo-adjuvant therapy.
As introduced in previous section, the lesions in both current and prior MRI can be au-tomatically linked and segmented. We summarize a list of most prominent parameters,describing the morphological, kinetic and texture features of the lesion. These features areautomatically computed based on the segmentation. The selected feature set is given in theprevious deliverable D6.1, where the automated extraction of features has been described,and has been enhanced by specialised features previously described in D6.2. Some of theimportant parameters, which are categorized into kinetic, morphological and texture, arelisted as following:
* Kinetic parameters
7
VPH-PRISM D3.6
* Peak enhancement
* Washout-rate
* Uptake-rate
* Time-to-Peak
* Initial area under kinetic curve at 30s
* SER: signal enhancement ratio
* Curvature at peak point
* Morphological parameters
* Volume
* Margin sharpness
* Margin variance
* Circularity
* Irregularity
* Convexity
* Elongation
* Skewness
* Flatness
* Textural parameters
* Haralick features
* Local binary pattern
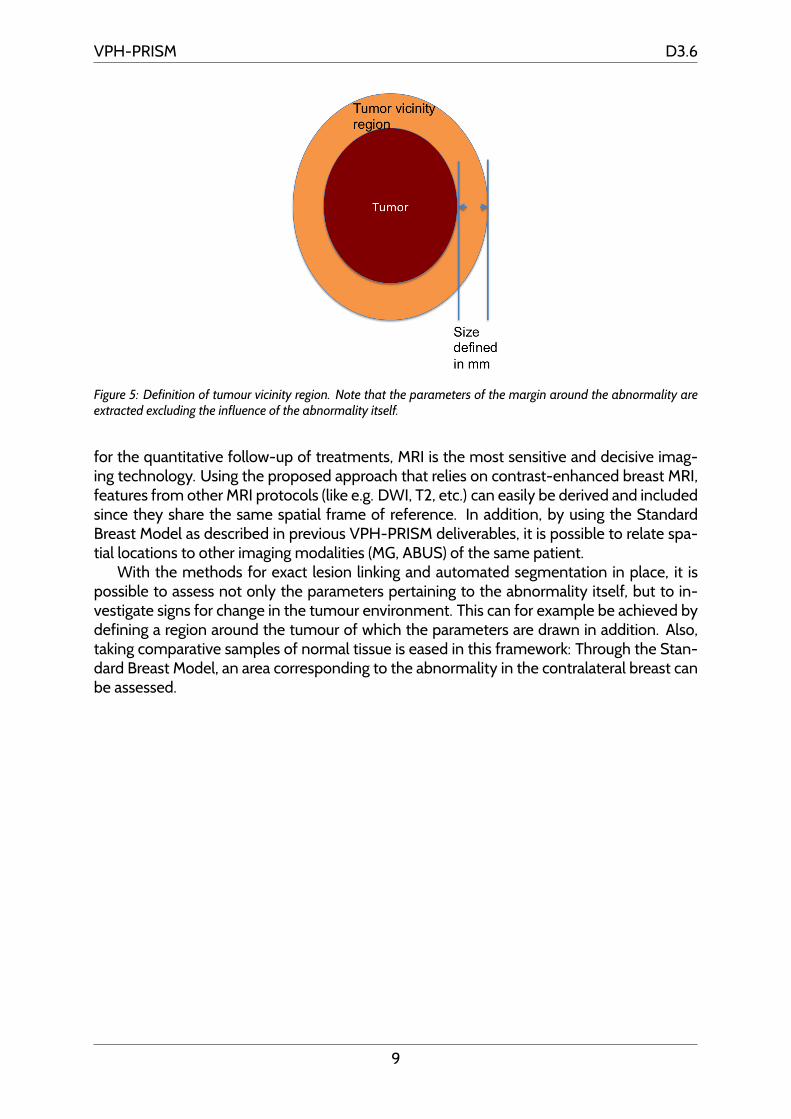
Moreover, in order to reflect the change of the tissue in the vicinity of tumour, the moduleallows to specify a margin (in mm) around the automatically segmented abnormality. In thismargin, the same parameters as above are extracted. By specifying this margin multipletimes, and in increasing size, models can be created that relate the radiological parametersto ones derived from the correlated digital histopathology.1 Figure 5 sketches the definitionof the vicinity used in the implementation.
1.4 Impact and Outreach
The descriptive features for quantitative lesion change tracking are similar to those uploadedinto the VPH-PRISM database. The important novelty of the methods and tools describedin this report is the dedicated approach to derive decision aid from visualisation and analysisof such parameters over time. This is enabled through reliable automated lesion linking.
The quantitative change tracking is most complicated in breast MRI, which is why theproject focus was set to this modality. Both for the screening of the high-risk population and
1Parameters derived from histopathology are detailed in D5.4, and the tools for spatial correlation in theDeliverables of Work Package 4. In addition, the demonstrators of WP 7 provide aid for side-by-side manualhistopathology to radiology correlation and annotation to assess surgical outcomes.
8
VPH-PRISM D3.6
Figure 5: Definition of tumour vicinity region. Note that the parameters of the margin around the abnormality areextracted excluding the influence of the abnormality itself.
for the quantitative follow-up of treatments, MRI is the most sensitive and decisive imag-ing technology. Using the proposed approach that relies on contrast-enhanced breast MRI,features from other MRI protocols (like e.g. DWI, T2, etc.) can easily be derived and includedsince they share the same spatial frame of reference. In addition, by using the StandardBreast Model as described in previous VPH-PRISM deliverables, it is possible to relate spa-tial locations to other imaging modalities (MG, ABUS) of the same patient.
With the methods for exact lesion linking and automated segmentation in place, it ispossible to assess not only the parameters pertaining to the abnormality itself, but to in-vestigate signs for change in the tumour environment. This can for example be achieved bydefining a region around the tumour of which the parameters are drawn in addition. Also,taking comparative samples of normal tissue is eased in this framework: Through the Stan-dard Breast Model, an area corresponding to the abnormality in the contralateral breast canbe assessed.
9
VPH-PRISM D3.6
2 Algorithm evaluation
2.1 Technical evaluation study
2.1.1 Data sets
A collection of 29 individual subjects with 58 breast dynamic contrast enhanced MRI (DCE-MRI) follow up images were acquired from a screening program running in Radboud Univer-sity Medical Center (Nijmegen, Netherlands). For each subject, two consecutive follow-upMRI studies with a time interval of 1 year were available. Current MRI examinations wereperformed in 2011 with a 3 Tesla Siemens scanner (MAGNETOM Skyra), with a dedicatedbreast coil (CP Breast Array, Siemens, Erlangen). Subjects were scanned in prone positionand transversal view with following imaging parameters: 448 × 448 × 160; slice thickness:1 mm; voxel spacing: 0.8036 × 0.8036 mm; flip angle: 20 degrees; repetition time: 5.03ms; echo time: 2.06 ms.
Prior MRI examinations were performed in 2010 with a 3 Tesla Siemens scanner (MAG-NETOM Trio) with the same breast coils. However, subjects were scanned in prone positionand coronal view with following imaging parameters: 384 × 192 × 160; slice thickness: 1mm; voxel spacing: 0.9375 × 0.9375 mm; flip angle: 13 degrees; repetition time: 735 ms;echo time: 2.39 ms. Current and prior DCE-MRI scans have 5 and 6 time points, respectively.Pre-contrast images were used for registration in this work.
2.1.2 Evaluation and Comparison
Three metrics were used to quantitatively evaluate alignment accuracy of the proposedmethod: Dice Similarity Coefficient [10] (DSC), boundary distance error (BDE) and landmarkdistance error (LDE). Dice similarity coefficient validates the volumetric overlap between de-formed breast of prior studies and breasts of current studies. Higher registration accuracyshould deliver better overlapping ratio.
Moreover, agreement of breast-air boundaries and pectoral muscle boundaries are ofgreat interest for investigation, because it measures how well the breasts with different com-pression and shapes coincide after performing registration. Hence, we define the metric ofboundary distance error as the distance between the boundary surfaces of current and de-formed prior breasts.
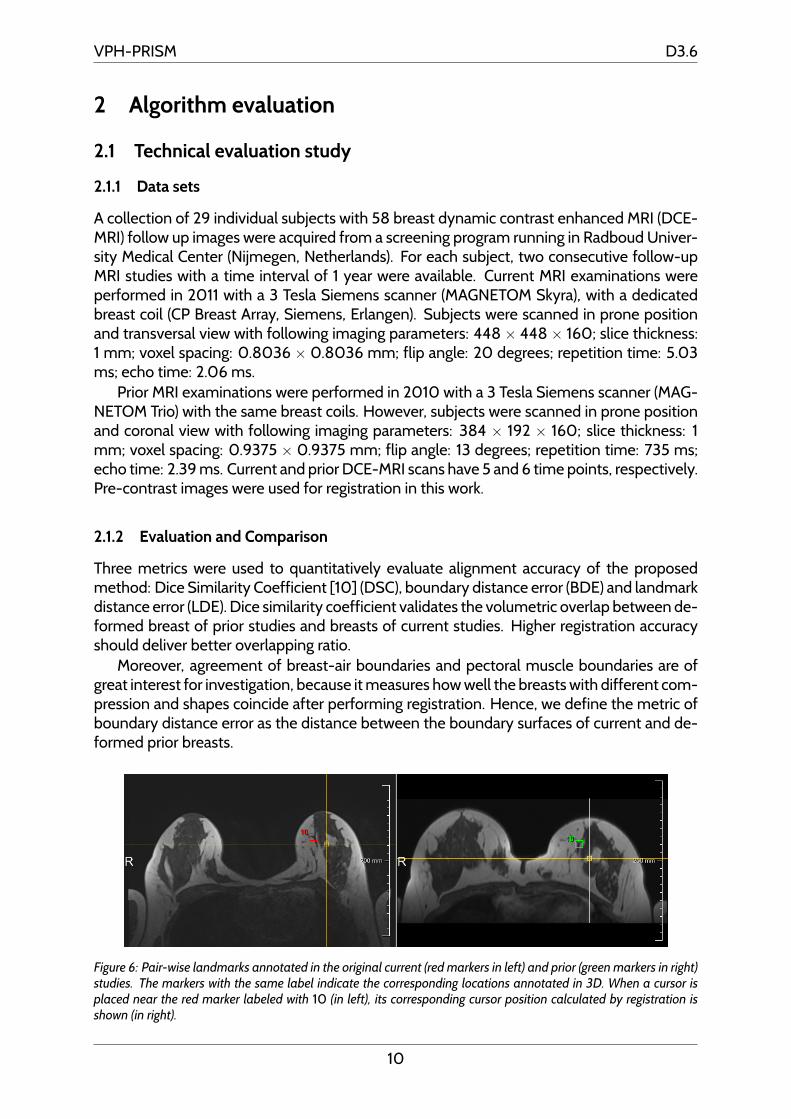
Figure 6: Pair-wise landmarks annotated in the original current (red markers in left) and prior (green markers in right)studies. The markers with the same label indicate the corresponding locations annotated in 3D. When a cursor isplaced near the red marker labeled with 10 (in left), its corresponding cursor position calculated by registration isshown (in right).
10
VPH-PRISM D3.6
DSC and BDE are able to quantify the consistencies of breast volumes and boundaries.However, the registration accuracy of breast parenchyma tissues inside the breasts can notbe reflected directly by DSC and BDE. The most direct way to quantify the alignment qualityof internal breast parenchyma tissue is to annotate a few corresponding landmarks in bothcurrent and prior studies and measure their distances after deformation. Therefore, an expe-rienced radiologist manually identified salient anatomical landmarks on each pair of currentand prior studies for all subjects. The radiologist tried to spread the landmarks through entirebreast volumes. More specifically, landmark pairs were manually annotated by investigatingsubtracted images. Afterwards, all landmarks were visually validated on axial, sagittal andcoronal planes. Nipples were marked in all breast volumes, while prominent vessels andglandular tissue margins were annotated when they occurred in both current and prior stud-ies. As a result, a total of 10 pairs of corresponding landmarks were set for each current-priorpair (see Fig. 6).
Markers annotated in a prior study were deformed onto the corresponding current study,and the distance between deformed landmarks and fixed landmarks was computed. Thelandmark distance error (LDE) is defined as the averaged distance of all pairs of landmarksannotated for a subject, given in the following equation:
LDE =
n∑i=1
dist(Lci ,D(Lp
i ))
n(1)
where Lc and Lp are the current and prior markers; D refers to the deformation trans-form; n is the number of marker pairs. All distances refer to the root mean square distances(RMSD). Regarding computational expense, the average computation time per volume was24.55 seconds for breast segmentation and 7.33 seconds for registration on a machine witha 3.2GHz Quad-Core CPU and 12 GB RAM.
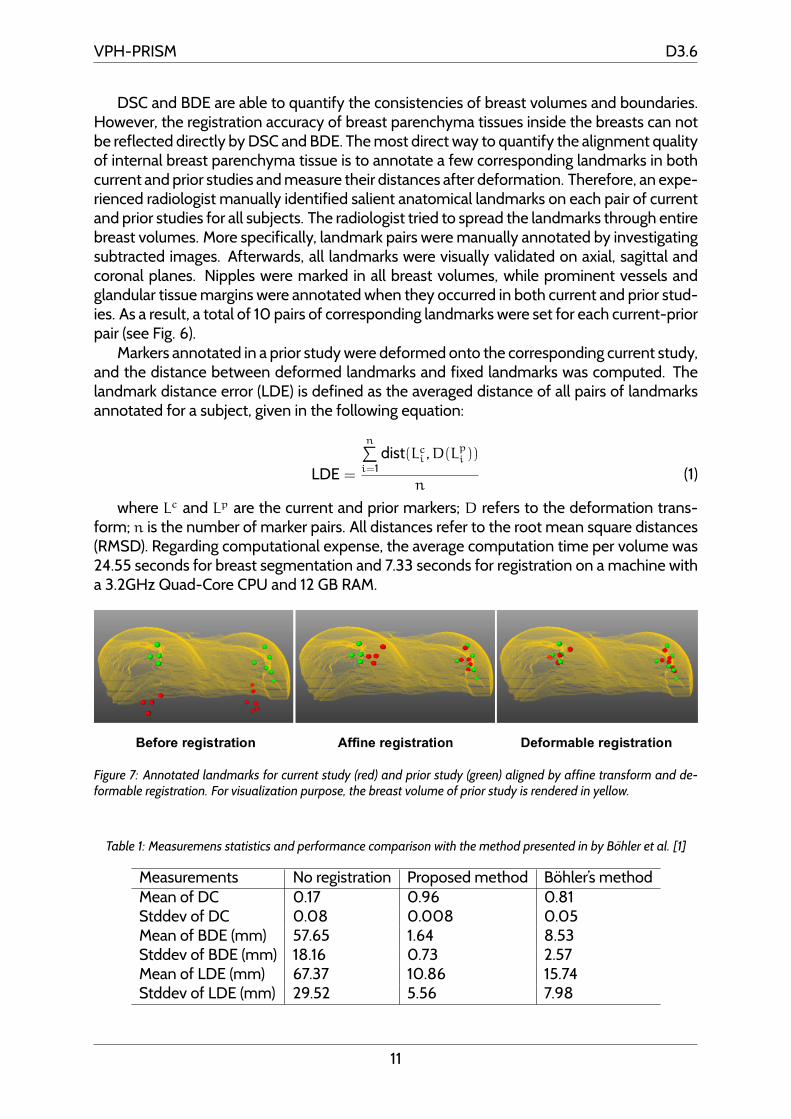
Figure 7: Annotated landmarks for current study (red) and prior study (green) aligned by affine transform and de-formable registration. For visualization purpose, the breast volume of prior study is rendered in yellow.
Table 1: Measuremens statistics and performance comparison with the method presented in by Bohler et al. [1]
Measurements No registration Proposed method Bohler’s methodMean of DC 0.17 0.96 0.81Stddev of DC 0.08 0.008 0.05Mean of BDE (mm) 57.65 1.64 8.53Stddev of BDE (mm) 18.16 0.73 2.57Mean of LDE (mm) 67.37 10.86 15.74Stddev of LDE (mm) 29.52 5.56 7.98
11
VPH-PRISM D3.6
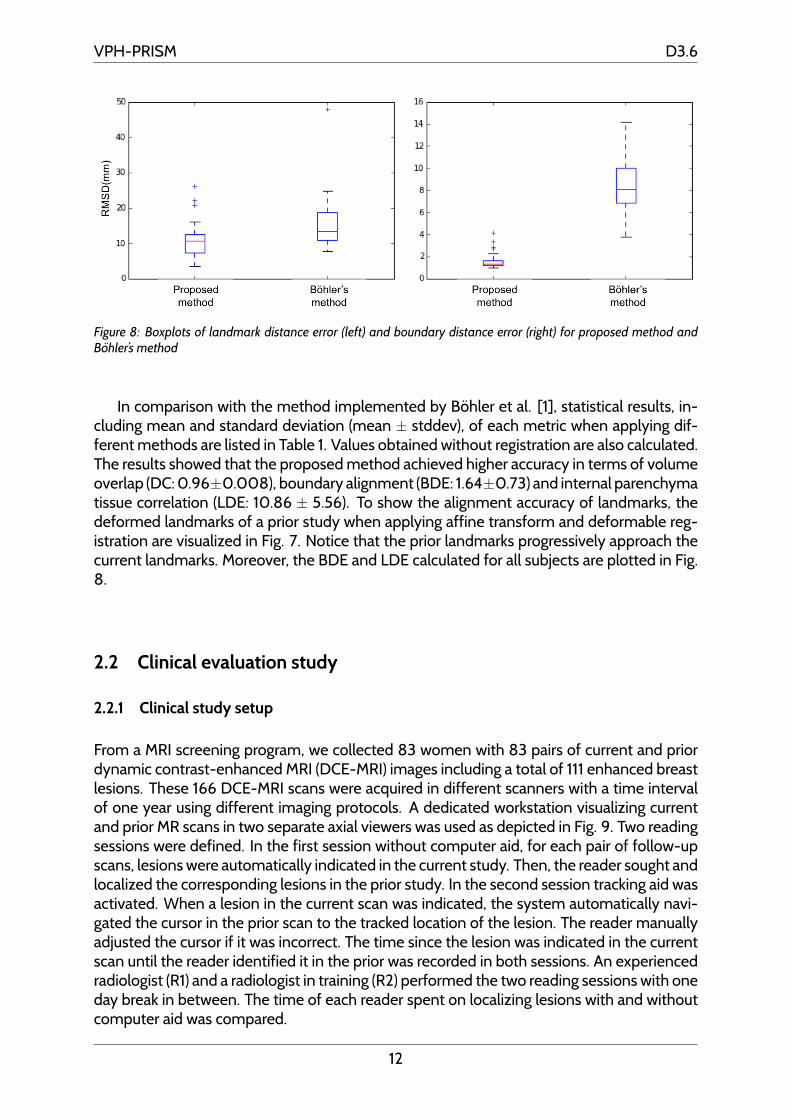
Figure 8: Boxplots of landmark distance error (left) and boundary distance error (right) for proposed method andBohler’s method
In comparison with the method implemented by Bohler et al. [1], statistical results, in-cluding mean and standard deviation (mean ± stddev), of each metric when applying dif-ferent methods are listed in Table 1. Values obtained without registration are also calculated.The results showed that the proposed method achieved higher accuracy in terms of volumeoverlap (DC: 0.96±0.008), boundary alignment (BDE: 1.64±0.73) and internal parenchymatissue correlation (LDE: 10.86 ± 5.56). To show the alignment accuracy of landmarks, thedeformed landmarks of a prior study when applying affine transform and deformable reg-istration are visualized in Fig. 7. Notice that the prior landmarks progressively approach thecurrent landmarks. Moreover, the BDE and LDE calculated for all subjects are plotted in Fig.8.
2.2 Clinical evaluation study
2.2.1 Clinical study setup
From a MRI screening program, we collected 83 women with 83 pairs of current and priordynamic contrast-enhanced MRI (DCE-MRI) images including a total of 111 enhanced breastlesions. These 166 DCE-MRI scans were acquired in different scanners with a time intervalof one year using different imaging protocols. A dedicated workstation visualizing currentand prior MR scans in two separate axial viewers was used as depicted in Fig. 9. Two readingsessions were defined. In the first session without computer aid, for each pair of follow-upscans, lesions were automatically indicated in the current study. Then, the reader sought andlocalized the corresponding lesions in the prior study. In the second session tracking aid wasactivated. When a lesion in the current scan was indicated, the system automatically navi-gated the cursor in the prior scan to the tracked location of the lesion. The reader manuallyadjusted the cursor if it was incorrect. The time since the lesion was indicated in the currentscan until the reader identified it in the prior was recorded in both sessions. An experiencedradiologist (R1) and a radiologist in training (R2) performed the two reading sessions with oneday break in between. The time of each reader spent on localizing lesions with and withoutcomputer aid was compared.
12

VPH-PRISM D3.6
Figure 9: The software prototype used in clinical evaluation study: current and prior subtraction images are visualizedin left and right viewers. For the lesion indicated in current study, its position in prior study is automatically given bythe tracking system.
2.2.2 Results
The two readers succeeded to identify all the lesions in prior studies with and without theuse of the tracking tool. Average localization time without tracking aid was 14.5 ± 13.4 and20.8 ± 11.1 seconds for R1 and R2, respectively. Average localization time with tracking aidwas 7.5 ± 7.8 and 11.0 ± 6.6 seconds for R1 and R2, respectively.
13
VPH-PRISM D3.6
3 Modules implementation
For temporal assessments and comparisons of changes between current and prior images,a spatial correlation and synchronization for longitudinal studies (current/prior registration)was integrated into the software prototype developed in MevisLab platform. The softwareprototype is depicted in Fig. 10.
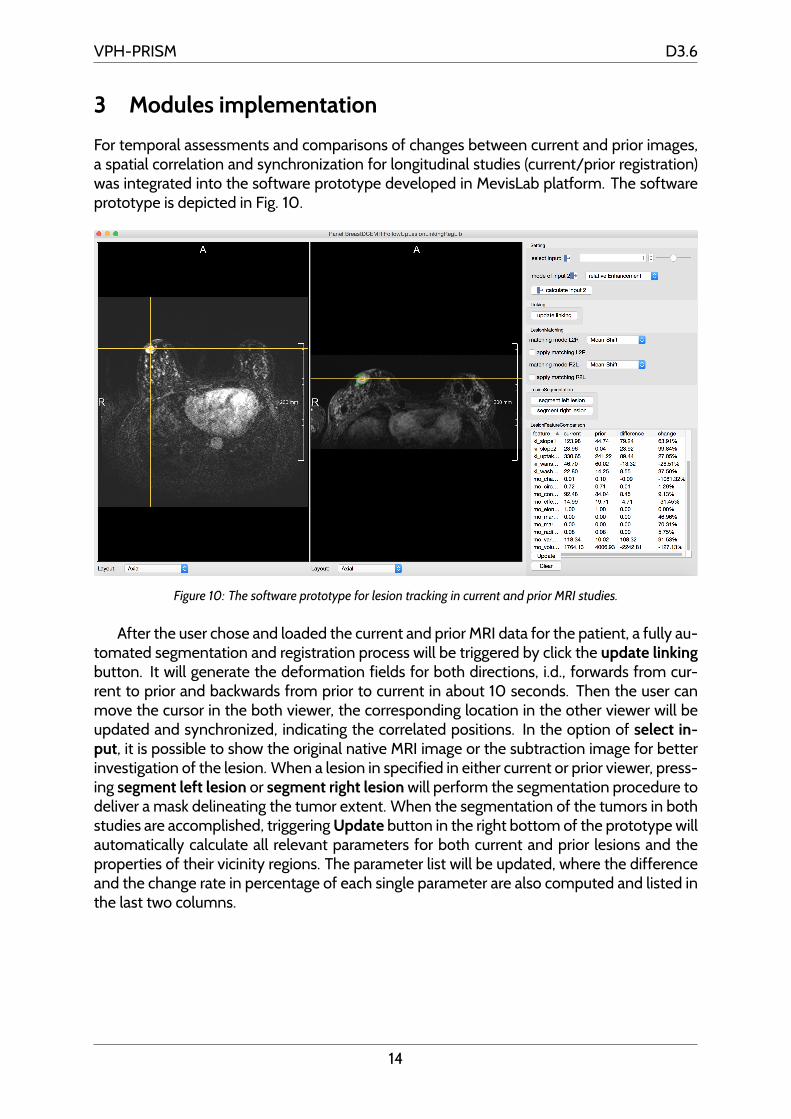
Figure 10: The software prototype for lesion tracking in current and prior MRI studies.
After the user chose and loaded the current and prior MRI data for the patient, a fully au-tomated segmentation and registration process will be triggered by click the update linkingbutton. It will generate the deformation fields for both directions, i.d., forwards from cur-rent to prior and backwards from prior to current in about 10 seconds. Then the user canmove the cursor in the both viewer, the corresponding location in the other viewer will beupdated and synchronized, indicating the correlated positions. In the option of select in-put, it is possible to show the original native MRI image or the subtraction image for betterinvestigation of the lesion. When a lesion in specified in either current or prior viewer, press-ing segment left lesion or segment right lesion will perform the segmentation procedure todeliver a mask delineating the tumor extent. When the segmentation of the tumors in bothstudies are accomplished, triggering Update button in the right bottom of the prototype willautomatically calculate all relevant parameters for both current and prior lesions and theproperties of their vicinity regions. The parameter list will be updated, where the differenceand the change rate in percentage of each single parameter are also computed and listed inthe last two columns.
14
VPH-PRISM D3.6
References
[1] Boehler, T., Schilling, K., Bick, U., Hahn, H.: Deformable Image Registration of Follow-Up Breast Magnetic Resonance Images. In: Biomedical Image Registration SE - 2, vol.6204, pp. 13–24 (2010)
[2] Fischer, B., Modersitzki, J.: Curvature based image registration. Journal of MathematicalImaging and Vision 18(1), 81–85 (2003)
[3] Haber, E., Modersitzki, J.: Intensity gradient based registration and fusion of multi-modal images. Methods of Information in Medicine 46, 292–9 (2007)
[4] Konig, L., Ruhaak, J.: A Fast and Accurate Parallel Algorithm for Non-Linear ImageRegistration using Normalized Gradient Fields. In: IEEE International Symposium onBiomedical Imaging: From Nano to Macro. pp. 580–583 (2014)
[5] Modersitzki, J.: Numerical Methods for Image Registration. Oxford University Press(2004)
[6] Modersitzki, J.: FAIR: Flexible Algorithms for Image Registration. SIAM (2009)
[7] Moltz, J.H., Bornemann, L., Kuhnigk, J.M., Dicken, V., Peitgen, E., Meier, S., Bolte, H.,Fabel, M., Bauknecht, H.C., Hittinger, M., Kieß ling, A., Pusken, M., Peitgen, H.O.: Ad-vanced Segmentation Techniques for Lung Nodules, Liver Metastases, and EnlargedLymph Nodes in CT Scans. IEEE Journal of Selected Topics in Signal Processing 3(1),122–134 (Feb 2009)
[8] Nocedal, J., Wright, S.: Numerical optimization. Springer (1999)
[9] Ruhaak, J., Heldmann, S., Kipshagen, T., Fischer, B.: Highly Accurate Fast Lung CT Reg-istration. In: SPIE Medical Imaging, Image Processing. pp. 86690Y–86690Y–9 (2013)
[10] Sørensen, T.: A Method of Establishing Groups of Equal Amplitude in Plant SociologyBased on Similarity of Species Content and Its Application to Analyses of the Vege-tation on Danish Commons. Biologiske Skrifter Det Kongelige Danske VidenskabernesSelskab, I kommission hos E. Munksgaard (1948)
[11] Wang, L., Filippatos, K., Friman, O., Hahn, H.K.: Fully automated segmentation of thepectoralis muscle boundary in breast MR images. vol. 7963, pp. 796309—-796309––8(2011)
[12] Wang, L., Platel, B., Ivanovskaya, T., Harz, M., Hahn, H.K.: Fully automatic breast seg-mentation in 3d breast mri. pp. 1024–1027 (2012)
15