Embed Size (px)
Citation preview

VRT – my experiences as a grower
WMG Updates 2015Erin Cahill

“Insanity is doing the same thing over and over again and
expecting a different result”
Albert Einstein

OverviewBackground Steps to adoptionTools usedExamplesSummary
Summary
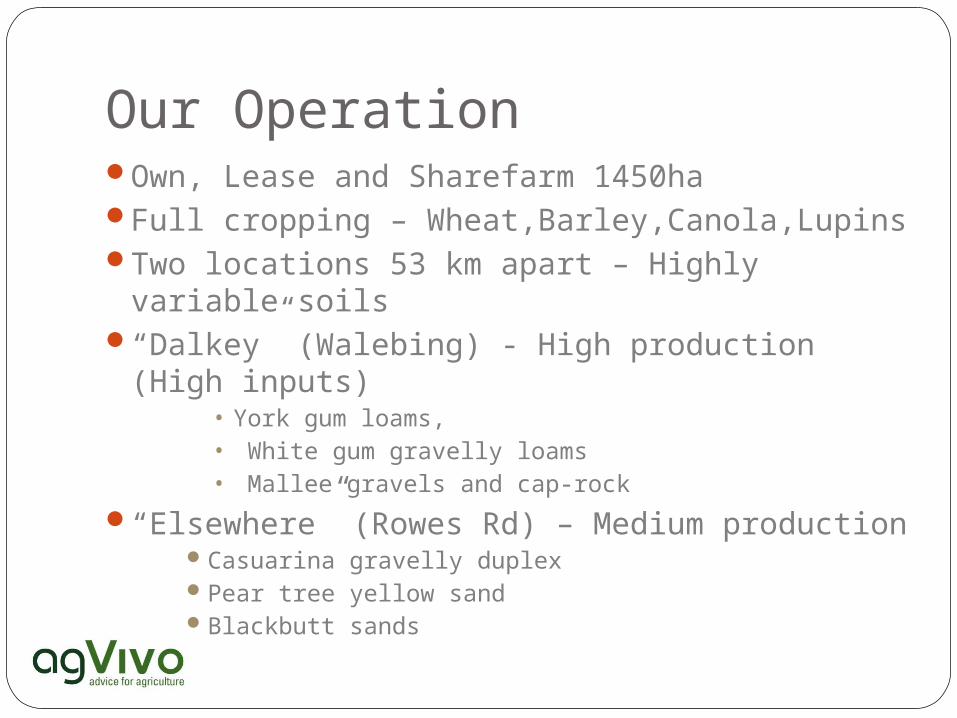
Our OperationOwn, Lease and Sharefarm 1450haFull cropping – Wheat,Barley,Canola,LupinsTwo locations 53 km apart – Highly variable
soils“Dalkey” (Walebing) - High production (High
inputs)• York gum loams,• White gum gravelly loams• Mallee gravels and cap-rock
“Elsewhere” (Rowes Rd) – Medium productionCasuarina gravelly duplex Pear tree yellow sandBlackbutt sands

VR – the journey so far
Yield mapping since 2007 (Case AFS)Auto steer 2007 ( JD Greenstar)Mapped all paddock boundaries 2007Prior to 2009 varying rates paddock to paddock
but not within (except K).2009 > map based variable rate post-em
nitrogen only2008 and 2009 collected PCD data for whole farm

VR – the journey so far
2009 – New Morris airseeder tank (Topcon controller)
2010 began map based VR at seeding -Issues with different systems talking to each other
-map prep clunky and time consumingBeginning 2012 converted airseeder to Greenstar 2012 EM 38/ radiometric survey part of farm2014 completed EM 38/ radiometric survey rest of
farm
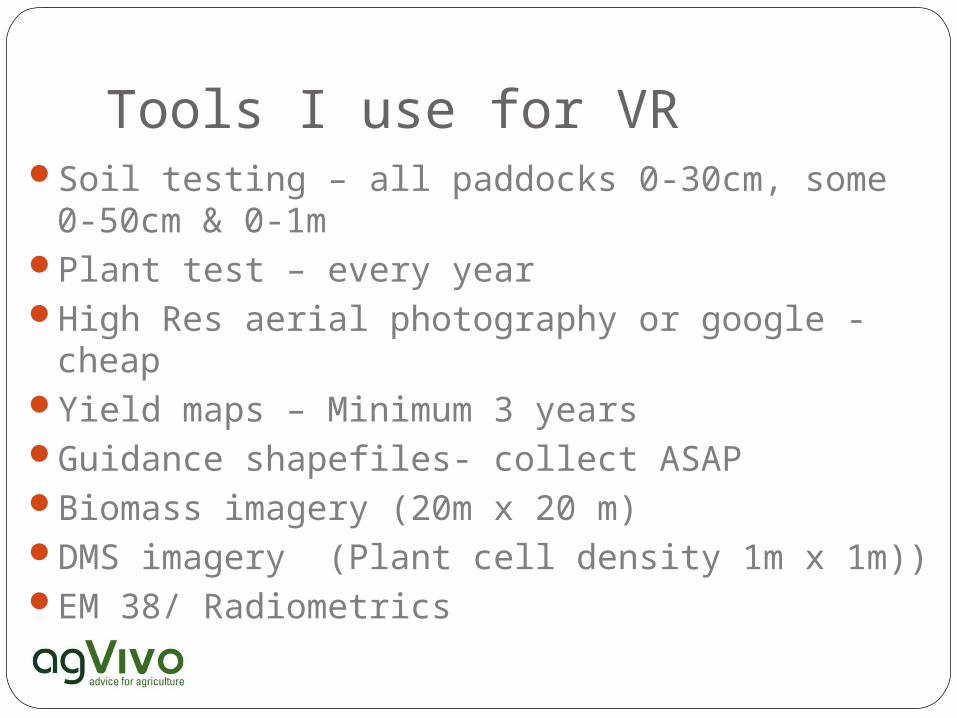
Tools I use for VRSoil testing – all paddocks 0-30cm, some 0-50cm
& 0-1mPlant test – every yearHigh Res aerial photography or google -cheapYield maps – Minimum 3 yearsGuidance shapefiles- collect ASAPBiomass imagery (20m x 20 m) DMS imagery (Plant cell density 1m x 1m))EM 38/ Radiometrics

Tools I use for VRJD ApexSMS advanced (yield maps)VA GatewayGoogle EarthI Pad – ground truthingPenetrometerShovel !
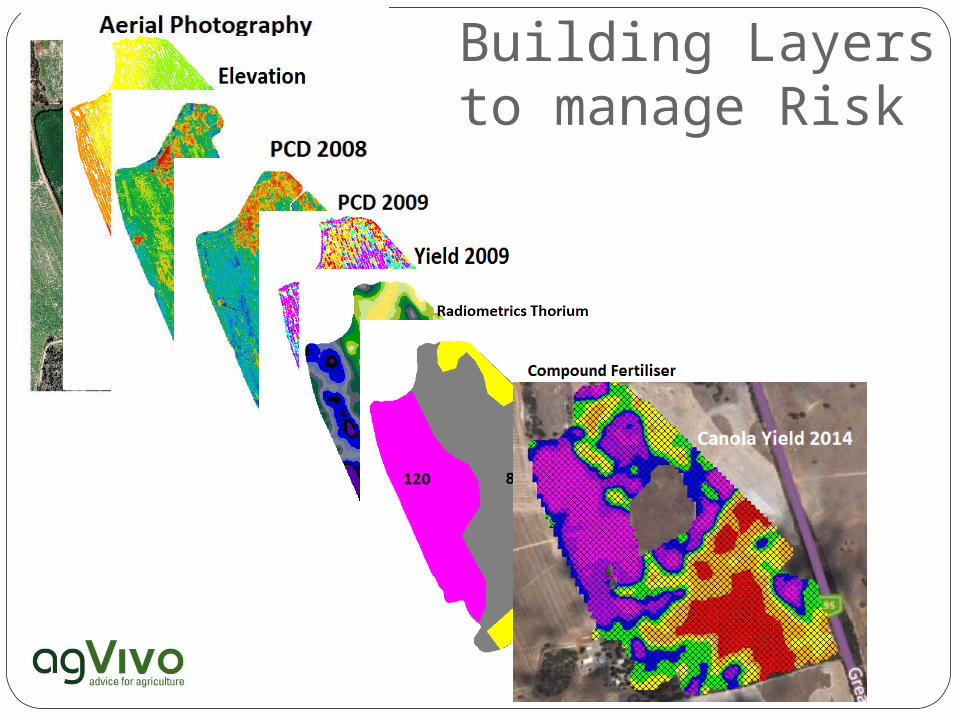
Building Layers to manage Risk
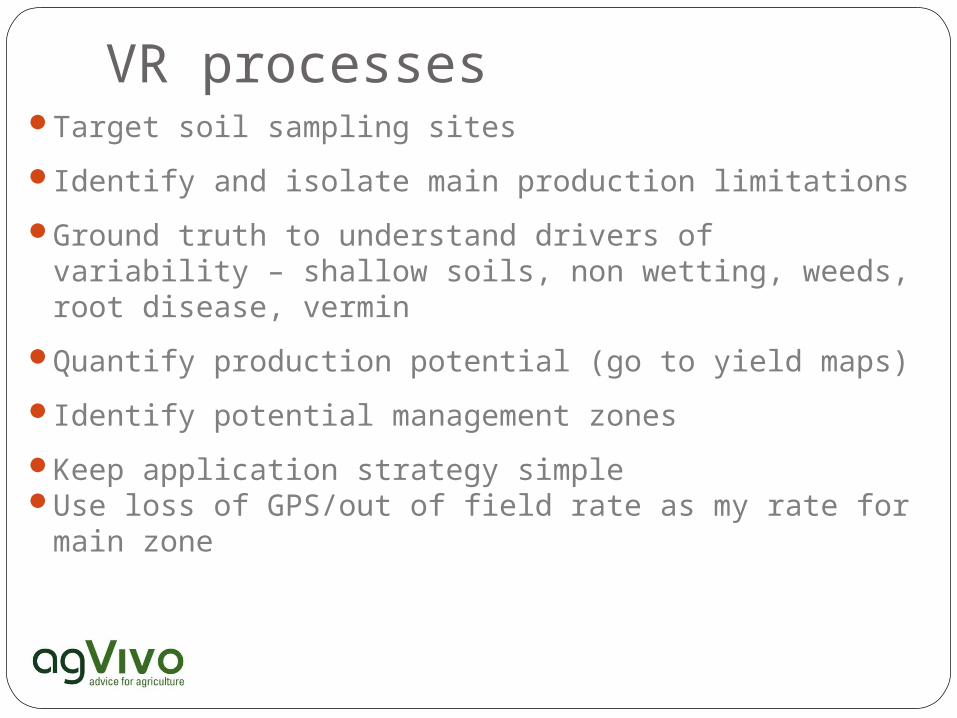
VR processesTarget soil sampling sites
Identify and isolate main production limitations
Ground truth to understand drivers of variability – shallow soils, non wetting, weeds, root disease, vermin
Quantify production potential (go to yield maps)
Identify potential management zones
Keep application strategy simpleUse loss of GPS/out of field rate as my rate for
main zone
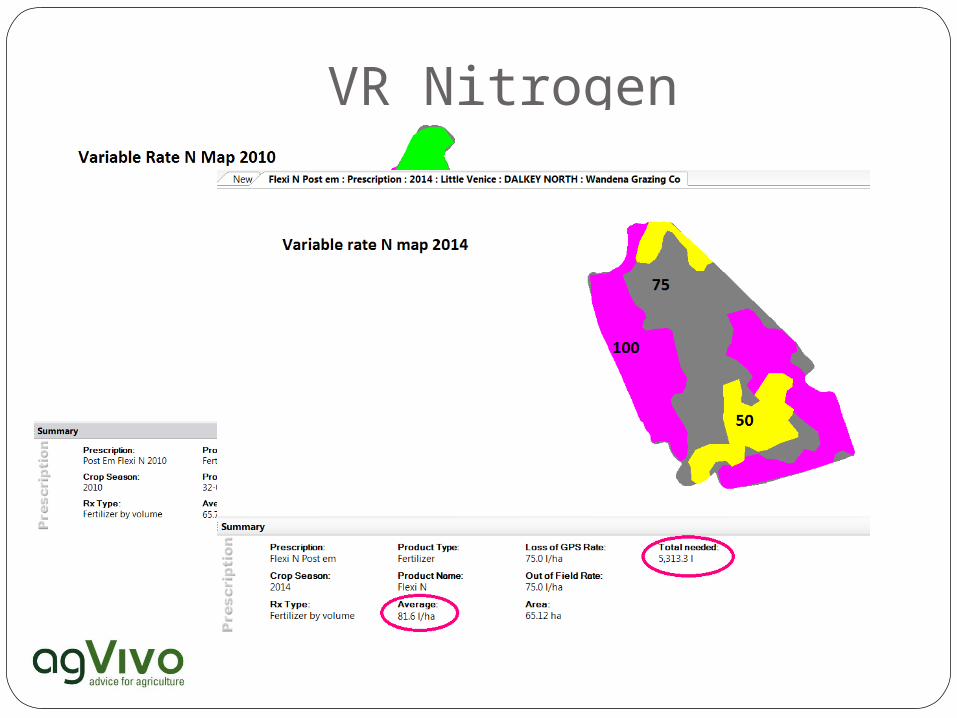
VR Nitrogen
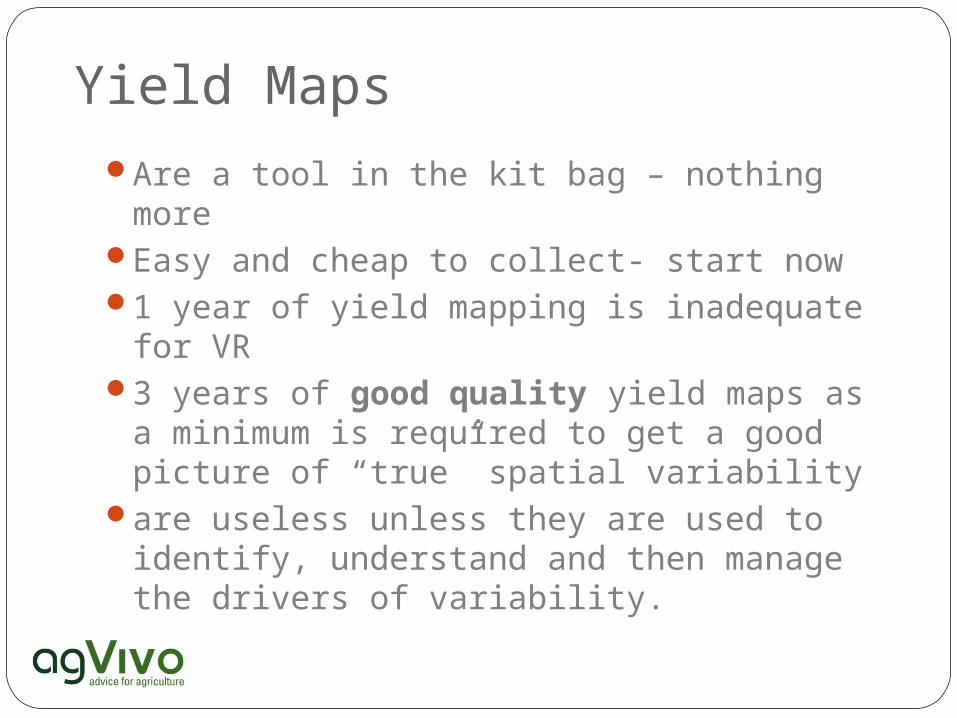
Yield Maps Are a tool in the kit bag – nothing moreEasy and cheap to collect- start now1 year of yield mapping is inadequate for
VR 3 years of good quality yield maps as a
minimum is required to get a good picture of “true” spatial variability
are useless unless they are used to identify, understand and then manage the drivers of variability.

VR ProcessKeep simple- 3-4 zones per paddockKeep Zone boundaries practical for machineryMake rate changes worthwhile
- Min 20-25 kg/ha Compound (3-4 kg/ha P) - Min 25-30 l/h a Flexi N (10-13 kg/ha N)
Better matching of inputs to yield potentialWe are not using less fertiliser (just using it
better)

VR Nitogen – Manually Done

VR simple example

Weed mapping
Wild oats Spray all (80 ha & $2000)
Or patch spray (28 ha & $700)

Results2010 Average N saving $7-8/ha2012 Average N saving $15-16/haSignificant grain quality improvements (malt
barley)Yields achieved in the most productive parts of
paddocks have increasedNot wasting $ on poor/constrained areasCompound fert better allocation of $ (no real
saving)Identifing more areas to “fix”

SummaryPick your GPS/VR system and fit machinery
around it (one system throughout is best)Try not to be the guinea pig Collect good data even if you aren’t using it
nowUse documentation systemsLimit guess workBe clear about what you are varying and whyGround truth Don’t over commit in the early stages- time
hungry

SummaryVR applications need constant re-evaluation
– what was once a poor area may become a productive one if limitations are rectified
Use Check strips and analyse outcomesDon’t vary rates just for the sake of itRemember the goals are improved
productivity and profitability

Thankyou & Questions
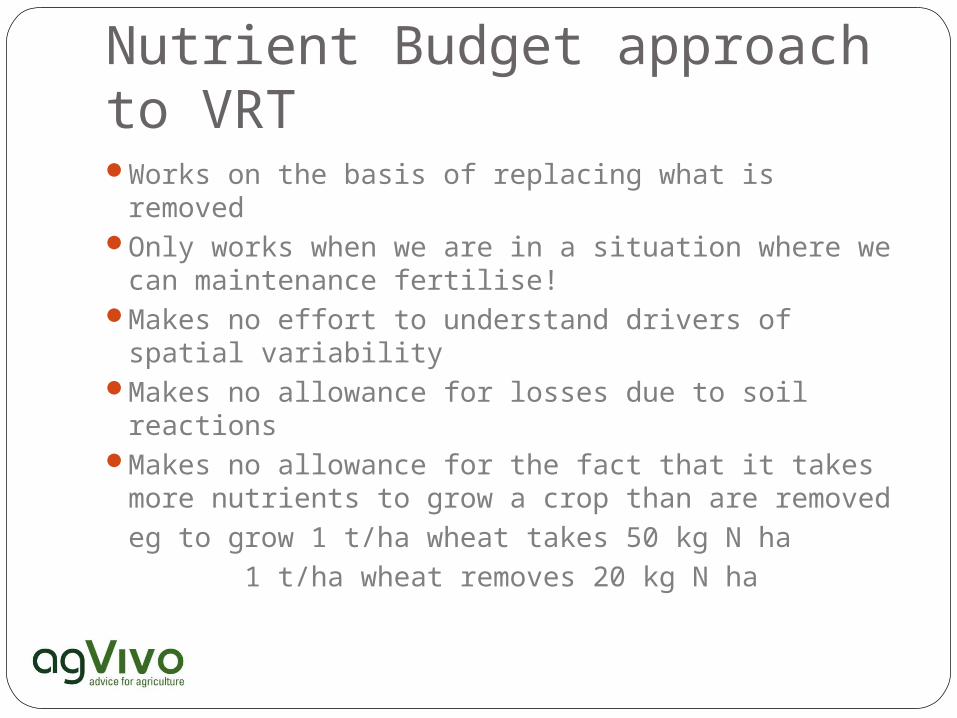
Nutrient Budget approach to VRTWorks on the basis of replacing what is removedOnly works when we are in a situation where we
can maintenance fertilise!Makes no effort to understand drivers of spatial
variabilityMakes no allowance for losses due to soil reactions Makes no allowance for the fact that it takes more
nutrients to grow a crop than are removed eg to grow 1 t/ha wheat takes 50 kg N ha
1 t/ha wheat removes 20 kg N ha
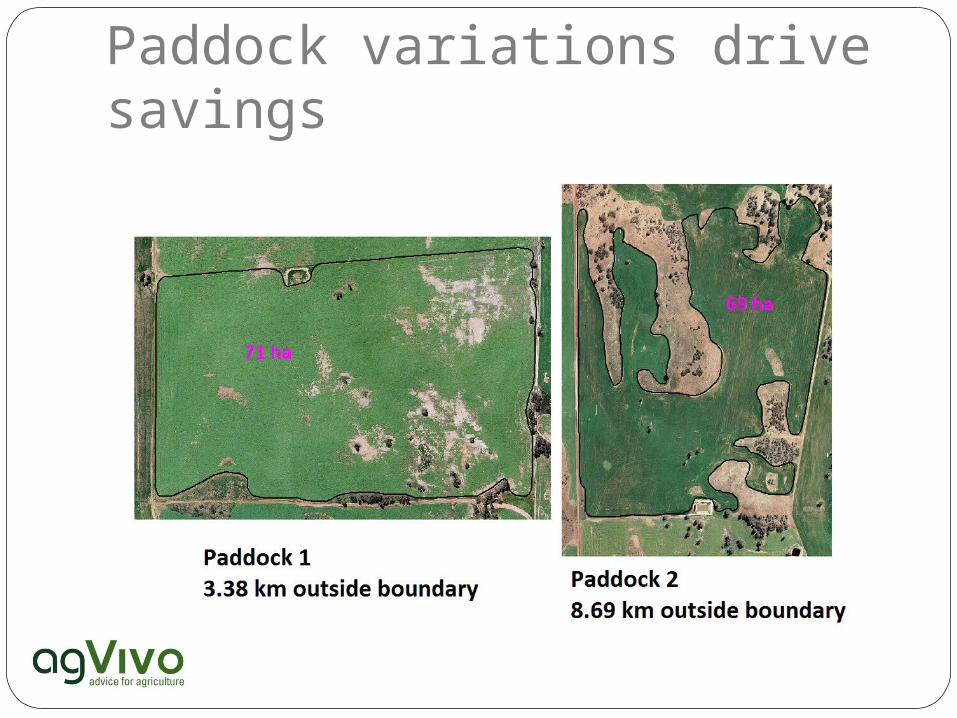
Paddock variations drive savings
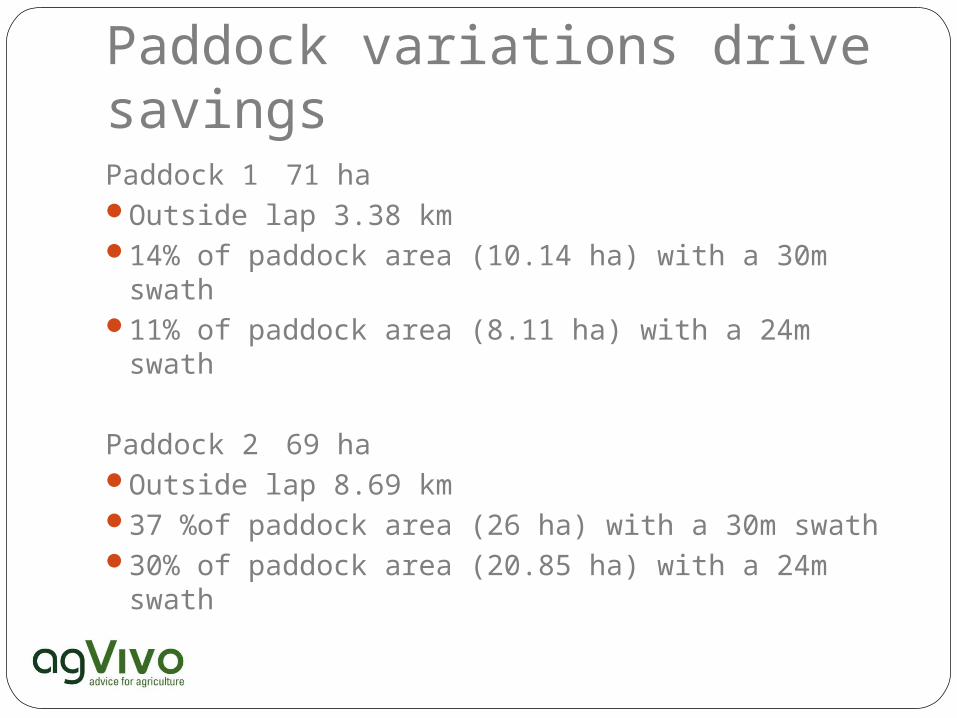
Paddock 1 71 haOutside lap 3.38 km 14% of paddock area (10.14 ha) with a 30m
swath11% of paddock area (8.11 ha) with a 24m swath
Paddock 2 69 haOutside lap 8.69 km37 %of paddock area (26 ha) with a 30m swath30% of paddock area (20.85 ha) with a 24m
swath
Paddock variations drive savings

Understand biggest limiting factor