Embed Size (px)
Citation preview
1
VSIT, Vibrating Brown FieldsNet Importer Oil & Gas Crisis and
Solutions
2
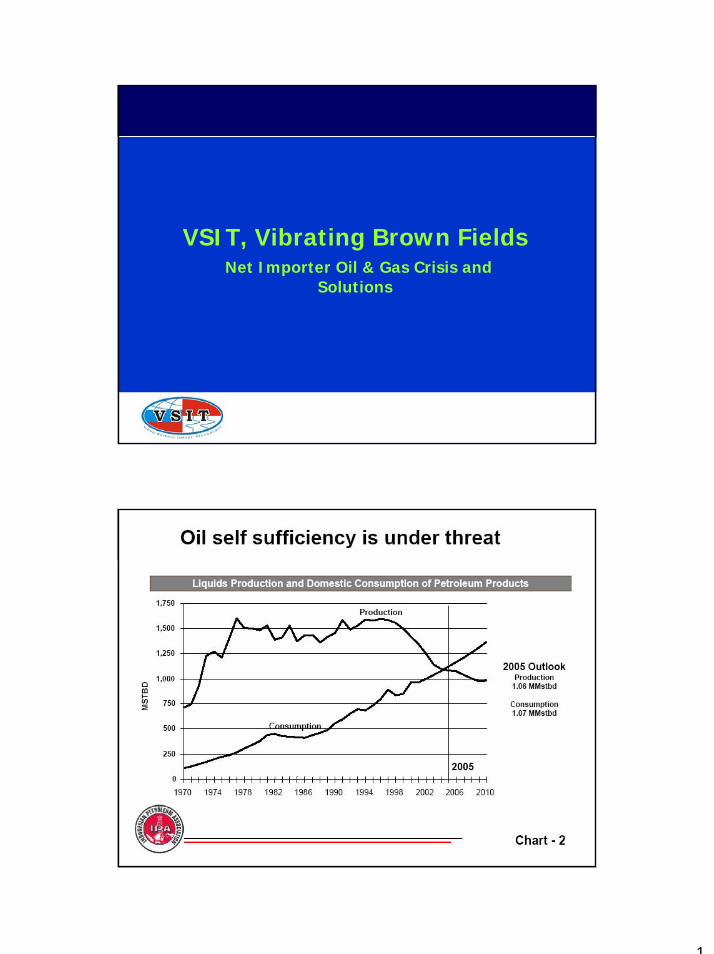
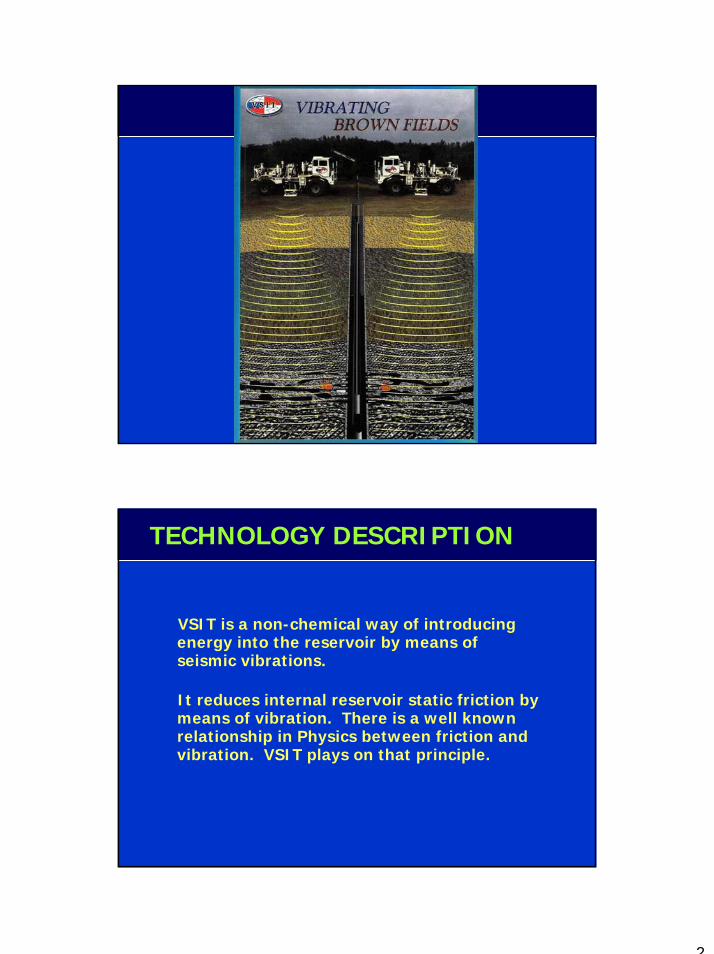
VSIT is a non-chemical way of introducing energy into the reservoir by means of seismic vibrations.
TECHNOLOGY DESCRIPTION
It reduces internal reservoir static friction by means of vibration. There is a well knownrelationship in Physics between friction and vibration. VSIT plays on that principle.
3
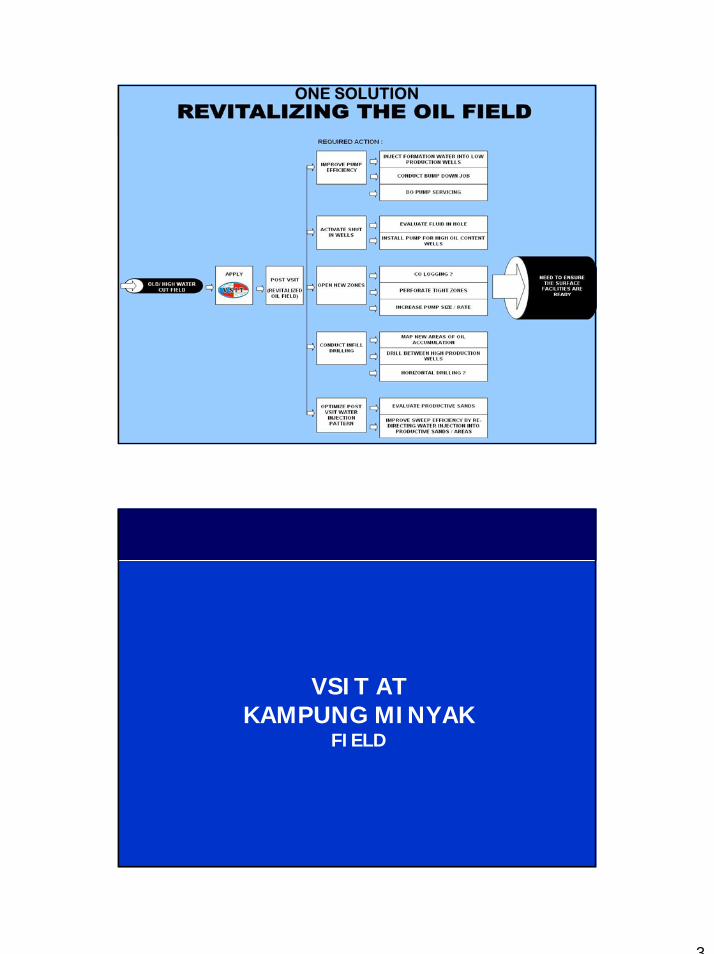
ONE SOLUTION
VSIT ATKAMPUNG MINYAK
FIELD
4
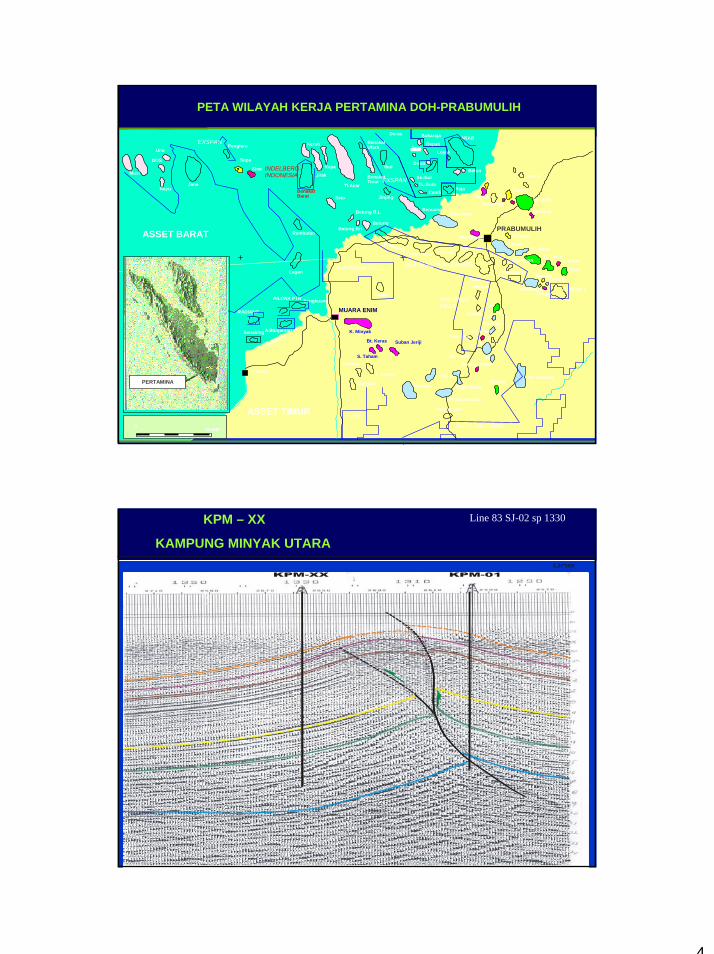
PETA WILAYAH KERJA PERTAMINA DOH-PRABUMULIH
TL.Gula
Musi
DOS
Uno
RayuJene
Penglero Keruh
Lagan
Rambutan
BenakatBarat
Kaya
Jirak
Selo
Tl.Akar
BenakatUtara
Ibul
BenakatTinur
Jinjing
Betung B.L
Betung Brt
Deras Sukaraja
Depati
Loyak
Dewa
Se.Ibul
Raja
BenuangG.Kemala
PandanPetanang
Pbm Barat
Jambu
Lembak
Tl.JimarTT.Barat
TT.Timur
Tj.Miring T
LimauLimau timur
Belimbing
Betung
TupaiHarimau
Kijang
Siamang
Air Lubai
Beringin
B A
D F
E
H
KuangAir Serdang
Pagar Dewa
Prabumenang
Paninjauan
Merbau
K. Minyak
Bt. Keras Suban Jeriji
S. TahamKijahan
L. Langu
BangkoTSM-1
Candi
Karangan
Karangan
TEBING TINGGI
MUARA ENIM
Limau barat
Jaya
JOB P-TALISMAN 0 25 KM
Betun
ABAB
Bunian
Sopa
Kemang
Tundan
Singa
EEQ
Tepus
Tj.Bulan
Ogan
Kupang
RADIANT
PILONA PTR
Senabing
Sengkuang
A.Banjarsari
LAHAT
S. Lematang
AMERADA HESS
INDELBERGINDONESIA
EXSPAN
EXSPAN
JOB SEAUNION ENERGY
PERTAMINA
Sina
A.Padiam
Karang Dewa
AMERADA HESS
TangaiSukananti
PRABUMULIH
ASSET TIMUR
ASSET BARAT
KPM – XX
KAMPUNG MINYAK UTARA
Line 83 SJ-02 sp 1330
5
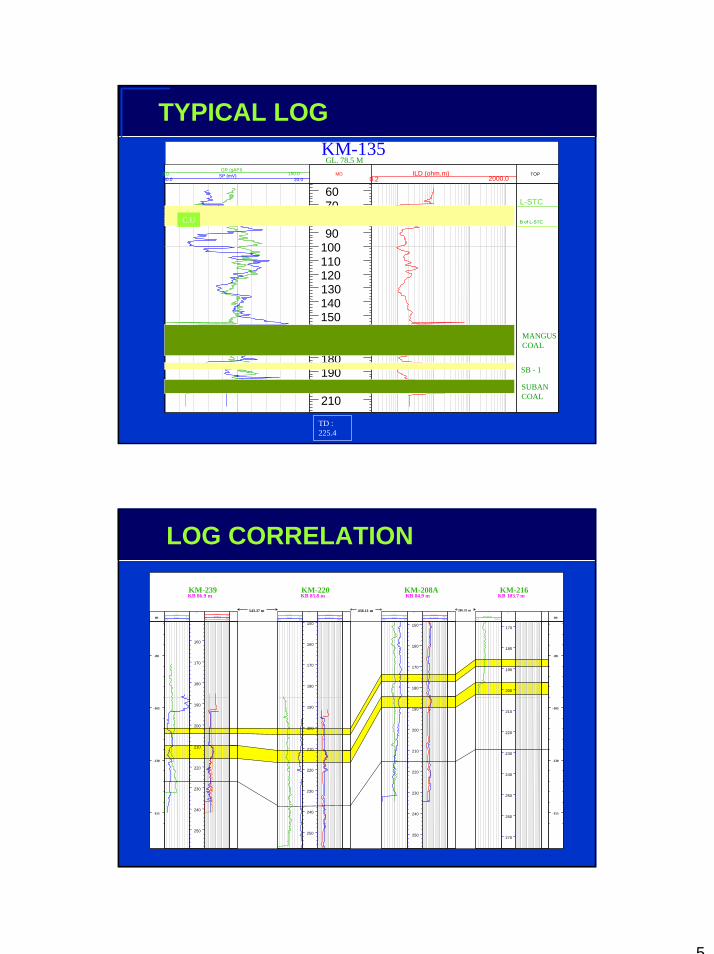
KM-135GR (gAPI)
0.0 150.0SP (mV)-80.0 20.0
MD
60708090
100110120130140150160170180190200210
ILD (ohm.m)0.2 2000.0
TOP
L-STC
B of L-STC
MANGUS COAL
TD : 225.4
SUBAN COAL
SB - 1
C.U
GL. 78.5 M
TYPICAL LOG
L-STC
U-STC
-80
-105
-130
-155
-80
-105
-130
-155
KB 86.9 mKM-239
gr
GR (gAPI)0.0 200.0
SP (mV)-10.0 60.0
depth
160
170
180
190
200
210
220
230
240
250
rt
ILD (ohm.m)0.2 2000.0
ILM (ohm.m)0.2 2000.0
SFLU (ohm.m)0.2 2000.0
top
L-STC
KB 85.8 mKM-220
gr
GR (gAPI)0.0 200.0
SP (mV)-80.0 20.0
depth
150
160
170
180
190
200
210
220
230
240
250
rt
ILD (ohm.m)0.2 2000.0
SFLU (ohm.m)0.2 2000.0
top
L-STC
KB 84.9 mKM-208A
gr
GR (gAPI)0.0 200.0
SP (mV)-80.0 20.0
depth
150
160
170
180
190
200
210
220
230
240
250
rt
ILD (ohm.m)0.2 2000.0
SFLU (ohm.m)0.2 2000.0
top
L-STC
KB 103.7 mKM-216
gr
GR (gAPI)0.0 200.0
depth
170
180
190
200
210
220
230
240
250
260
270
rt top
L-STC
543.37 m 436.11 m 280.35 m
m m
LOG CORRELATION
6
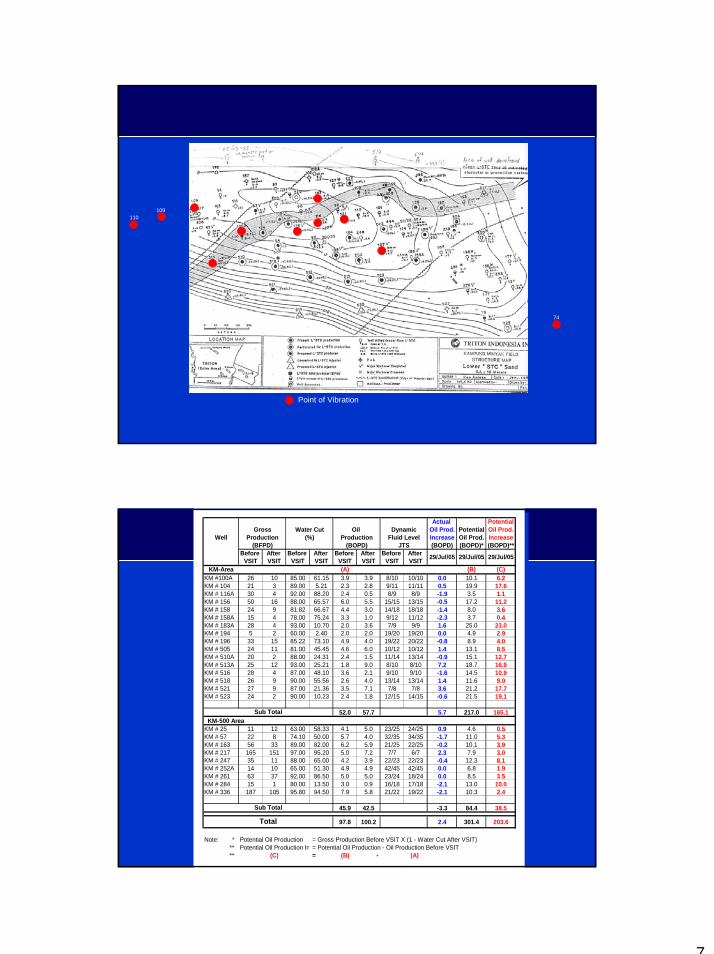
7
Point of Vibration
110109
74
Actual PotentialOil Prod. Potential Oil Prod.
Well Increase Oil Prod. Increase(BOPD) (BOPD)* (BOPD)**
Before After Before After Before After Before After VSIT VSIT VSIT VSIT VSIT VSIT VSIT VSIT
KM-Area (A) (B) (C)KM #100A 26 10 85.00 61.15 3.9 3.9 8/10 10/10 0.0 10.1 6.2KM # 104 21 3 89.00 5.21 2.3 2.8 9/11 11/11 0.5 19.9 17.6KM # 116A 30 4 92.00 88.20 2.4 0.5 8/9 8/9 -1.9 3.5 1.1KM # 156 50 16 88.00 65.57 6.0 5.5 15/15 13/15 -0.5 17.2 11.2KM # 158 24 9 81.82 66.67 4.4 3.0 14/18 18/18 -1.4 8.0 3.6KM # 158A 15 4 78.00 75.24 3.3 1.0 9/12 11/12 -2.3 3.7 0.4KM # 183A 28 4 93.00 10.70 2.0 3.6 7/9 9/9 1.6 25.0 23.0KM # 194 5 2 60.00 2.40 2.0 2.0 19/20 19/20 0.0 4.9 2.9KM # 196 33 15 85.22 73.10 4.9 4.0 19/22 20/22 -0.8 8.9 4.0KM # 505 24 11 81.00 45.45 4.6 6.0 10/12 10/12 1.4 13.1 8.5KM # 510A 20 2 88.00 24.31 2.4 1.5 11/14 13/14 -0.9 15.1 12.7KM # 513A 25 12 93.00 25.21 1.8 9.0 8/10 8/10 7.2 18.7 16.9KM # 516 28 4 87.00 48.10 3.6 2.1 9/10 9/10 -1.6 14.5 10.9KM # 518 26 9 90.00 55.56 2.6 4.0 13/14 13/14 1.4 11.6 9.0KM # 521 27 9 87.00 21.36 3.5 7.1 7/8 7/8 3.6 21.2 17.7KM # 523 24 2 90.00 10.23 2.4 1.8 12/15 14/15 -0.6 21.5 19.1
52.0 57.7 5.7 217.0 165.1 KM-500 AreaKM # 25 11 12 63.00 58.33 4.1 5.0 23/25 24/25 0.9 4.6 0.5KM # 57 22 8 74.10 50.00 5.7 4.0 32/35 34/35 -1.7 11.0 5.3KM # 163 56 33 89.00 82.00 6.2 5.9 21/25 22/25 -0.2 10.1 3.9KM # 217 165 151 97.00 95.20 5.0 7.2 7/7 6/7 2.3 7.9 3.0KM # 247 35 11 88.00 65.00 4.2 3.9 22/23 22/23 -0.4 12.3 8.1KM # 252A 14 10 65.00 51.30 4.9 4.9 42/45 42/45 0.0 6.8 1.9KM # 261 63 37 92.00 86.50 5.0 5.0 23/24 18/24 0.0 8.5 3.5KM # 284 15 1 80.00 13.50 3.0 0.9 16/18 17/18 -2.1 13.0 10.0KM # 336 187 105 95.80 94.50 7.9 5.8 21/22 19/22 -2.1 10.3 2.4
45.9 42.5 -3.3 84.4 38.5
97.8 100.2 2.4 301.4 203.6
Note: * Potential Oil Production = Gross Production Before VSIT X (1 - Water Cut After VSIT) ** Potential Oil Production In = Potential Oil Production - Oil Production Before VSIT ** (C) = (B) - (A)
Total
GrossProduction
(BFPD)
Water Cut
Sub Total
(%)Oil
Production(BOPD)
DynamicFluid Level
JTS
29/Jul/05 29/Jul/05
Sub Total
29/Jul/05
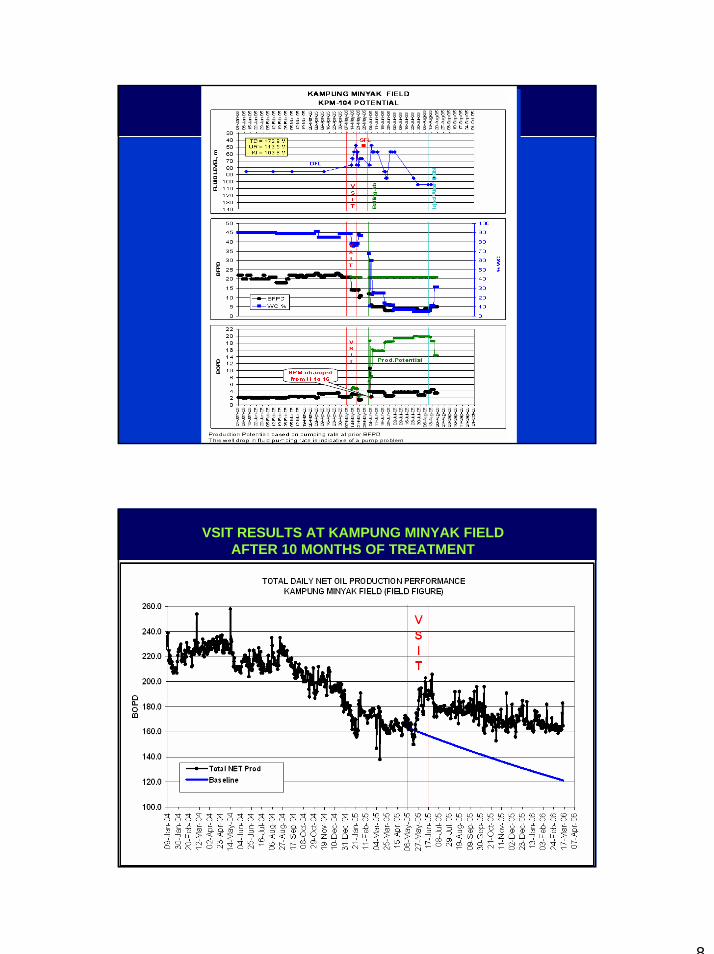
8
VSIT RESULTS AT KAMPUNG MINYAK FIELDAFTER 10 MONTHS OF TREATMENT
9
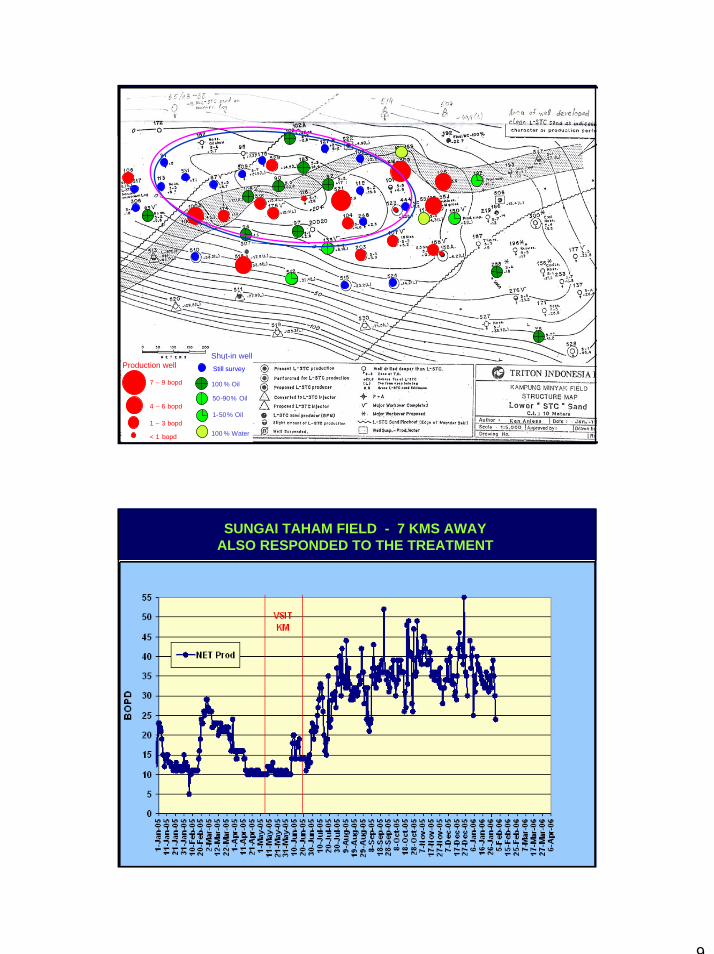
Production well
7 – 9 bopd
4 – 6 bopd
1 – 3 bopd
< 1 bopd
100 % Oil
50-90% Oil
1-50% Oil
100 % Water
Still survey
Shut-in well
SUNGAI TAHAM FIELD - 7 KMS AWAYALSO RESPONDED TO THE TREATMENT
10
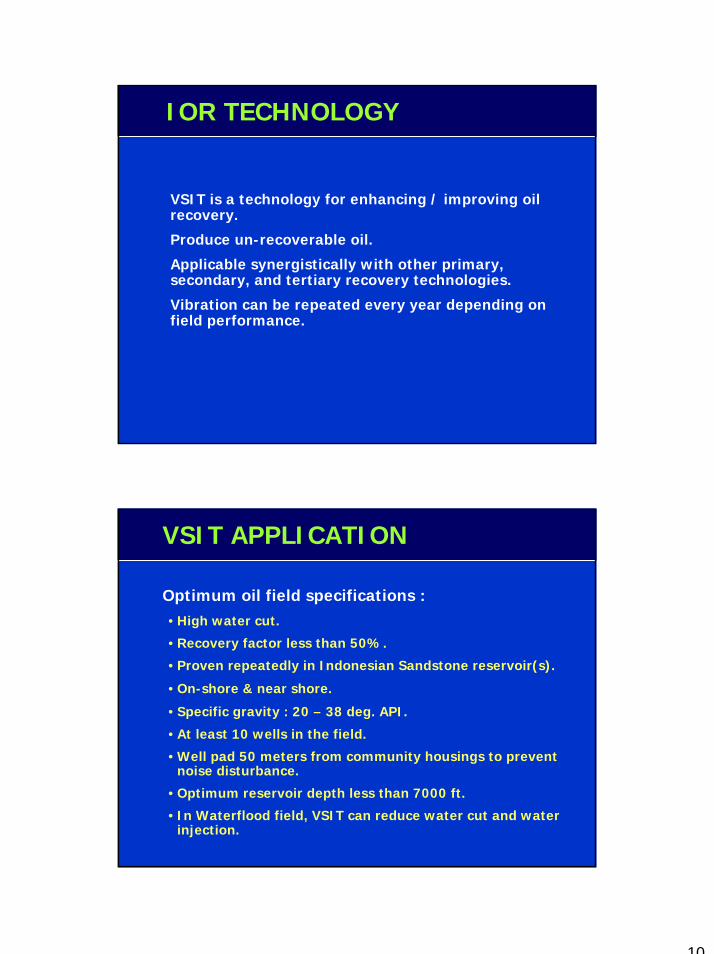
IOR TECHNOLOGY
VSIT is a technology for enhancing / improving oil recovery.
Produce un-recoverable oil.
Applicable synergistically with other primary, secondary, and tertiary recovery technologies.
Vibration can be repeated every year depending on field performance.
Optimum oil field specifications :• High water cut.
• Recovery factor less than 50%.
• Proven repeatedly in Indonesian Sandstone reservoir(s).
• On-shore & near shore.
• Specific gravity : 20 – 38 deg. API.
• At least 10 wells in the field.
• Well pad 50 meters from community housings to prevent noise disturbance.
• Optimum reservoir depth less than 7000 ft.
• In Waterflood field, VSIT can reduce water cut and water injection.
VSIT APPLICATION
11
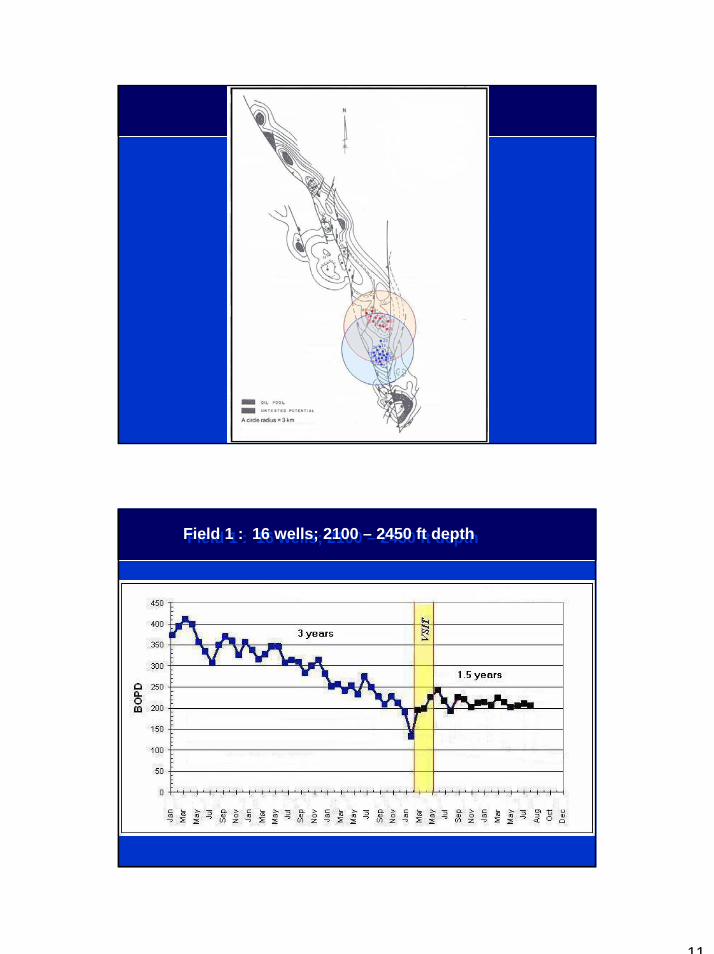
Field 1 : 16 wells; 2100 – 2450 ft depth Field 1 : 16 wells; 2100 – 2450 ft depth
12
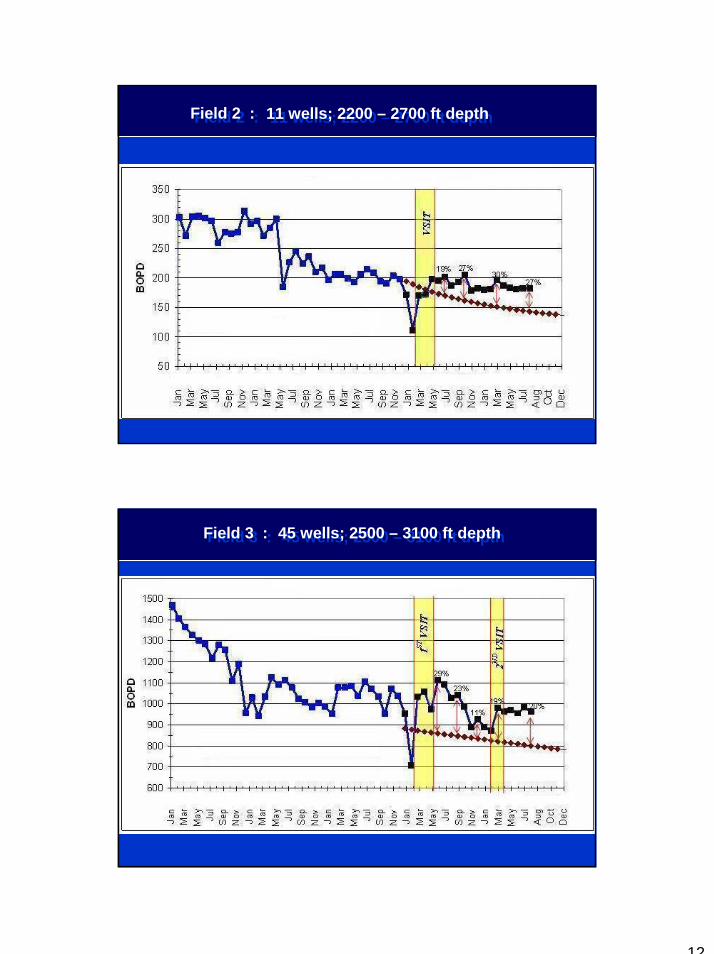
Field 2 :Field 2 : 11 wells; 2200 – 2700 ft depth11 wells; 2200 – 2700 ft depth
Field 3 :Field 3 : 45 wells; 2500 – 3100 ft depth45 wells; 2500 – 3100 ft depth
13
3,500,000
3,700,000
3,900,000
4,100,000
4,300,000
4,500,000
4,700,000
4,900,000
5,100,000
5,300,000
5,500,000
5,700,000
5,900,000
6,100,000
6,300,000
6,500,000
6,700,000
01-J
an-9
9
02-M
ar-9
9
01-M
ay-9
9
30-J
un-9
9
29-A
ug-9
9
28-O
ct-9
9
27-D
ec-9
9
25-F
eb-0
0
25-A
pr-0
0
24-J
un-0
0
23-A
ug-0
0
22-O
ct-0
0
21-D
ec-0
0
19-F
eb-0
1
20-A
pr-0
1
19-J
un-0
1
18-A
ug-0
1
17-O
ct-0
1
16-D
ec-0
1
14-F
eb-0
2
15-A
pr-0
2
14-J
un-0
2
13-A
ug-0
2
12-O
ct-0
2
11-D
ec-0
2
09-F
eb-0
3
10-A
pr-0
3
09-J
un-0
3
08-A
ug-0
3
07-O
ct-0
3
06-D
ec-0
3
04-F
eb-0
4
Wat
er In
ject
ion
(BB
LS)
80,000
90,000
100,000
110,000
120,000
130,000
140,000
150,000
160,000
170,000
180,000
190,000
200,000
210,000
220,000
230,000
240,000
BO
PD
WI
BOPD
Expon. (BOPD)
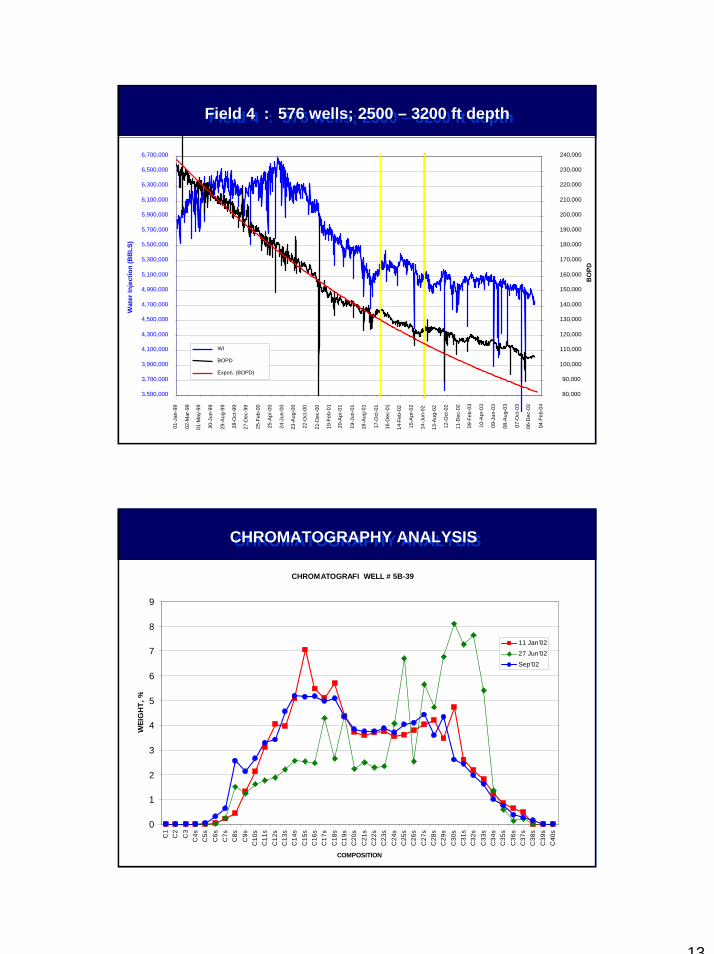
Field 4 : 576 wells; 2500 – 3200 ft depthField 4 : 576 wells; 2500 – 3200 ft depth
CHROMATOGRAFI WELL # 5B-39MINAS FIELD
0
1
2
3
4
5
6
7
8
9
C1
C2
C3
C4s
C5s
C6s
C7s
C8s
C9s
C10
sC
11s
C12
sC
13s
C14
sC
15s
C16
sC
17s
C18
sC
19s
C20
sC
21s
C22
sC
23s
C24
sC
25s
C26
sC
27s
C28
sC
29s
C30
sC
31s
C32
sC
33s
C34
sC
35s
C36
sC
37s
C38
sC
39s
C40
s
COMPOSITION
WEI
GH
T, %
11 Jan'02
27 Jun'02
Sep'02
CHROMATOGRAFI WELL # 5B-39
0
1
2
3
4
5
6
7
8
9
C1
C2
C3
C4s
C5s
C6s
C7s
C8s
C9s
C10
sC
11s
C12
sC
13s
C14
sC
15s
C16
sC
17s
C18
sC
19s
C20
sC
21s
C22
sC
23s
C24
sC
25s
C26
sC
27s
C28
sC
29s
C30
sC
31s
C32
sC
33s
C34
sC
35s
C36
sC
37s
C38
sC
39s
C40
s
COMPOSITION
WEI
GH
T, %
11 Jan'0227 Jun'02
Sep'02
CHROMATOGRAPHY ANALYSISCHROMATOGRAPHY ANALYSIS
14
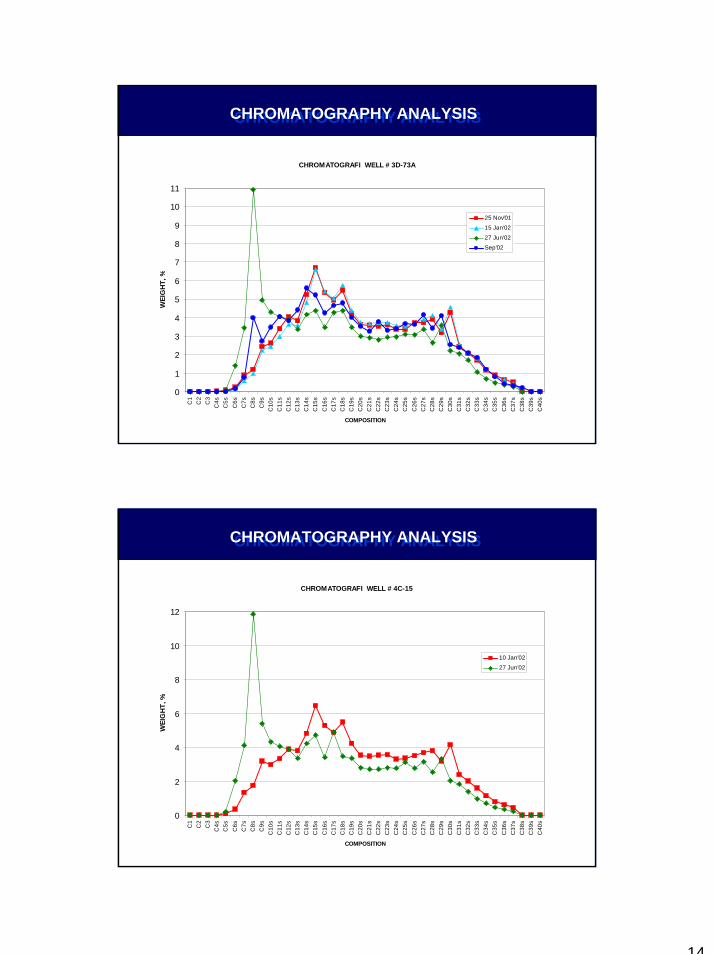
CHROMATOGRAFI WELL # 3D-73A
0
1
2
3
4
5
6
7
8
9
10
11C
1C
2C
3C
4sC
5sC
6sC
7sC
8sC
9sC
10s
C11
sC
12s
C13
sC
14s
C15
sC
16s
C17
sC
18s
C19
sC
20s
C21
sC
22s
C23
sC
24s
C25
sC
26s
C27
sC
28s
C29
sC
30s
C31
sC
32s
C33
sC
34s
C35
sC
36s
C37
sC
38s
C39
sC
40s
COMPOSITION
WEI
GH
T, %
25 Nov'01
15 Jan'02
27 Jun'02
Sep'02
CHROMATOGRAPHY ANALYSISCHROMATOGRAPHY ANALYSIS
CHROMATOGRAFI WELL # 4C-15
0
2
4
6
8
10
12
C1
C2
C3
C4s
C5s
C6s
C7s
C8s
C9s
C10
sC
11s
C12
sC
13s
C14
sC
15s
C16
sC
17s
C18
sC
19s
C20
sC
21s
C22
sC
23s
C24
sC
25s
C26
sC
27s
C28
sC
29s
C30
sC
31s
C32
sC
33s
C34
sC
35s
C36
sC
37s
C38
sC
39s
C40
s
COMPOSITION
WEI
GH
T, %
10 Jan'02
27 Jun'02
CHROMATOGRAPHY ANALYSISCHROMATOGRAPHY ANALYSIS
15
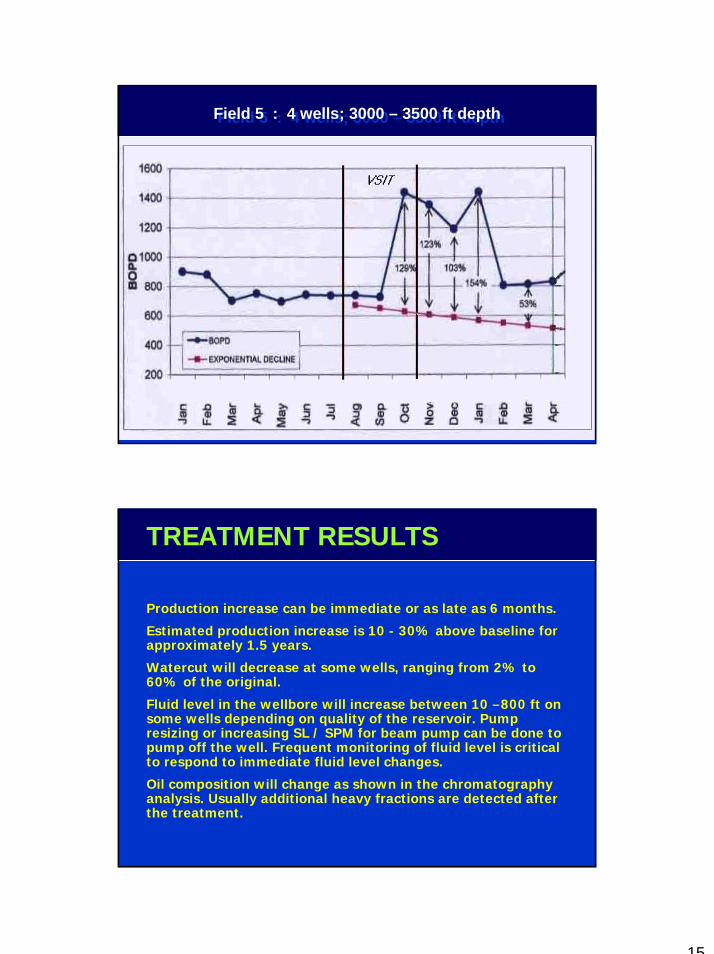
Field 5 : 4 wells; 3000 – 3500 ft depthField 5 : 4 wells; 3000 – 3500 ft depth
TREATMENT RESULTS
Production increase can be immediate or as late as 6 months.
Estimated production increase is 10 - 30% above baseline for approximately 1.5 years.
Watercut will decrease at some wells, ranging from 2% to 60% of the original.
Fluid level in the wellbore will increase between 10 –800 ft on some wells depending on quality of the reservoir. Pump resizing or increasing SL / SPM for beam pump can be done to pump off the well. Frequent monitoring of fluid level is critical to respond to immediate fluid level changes.
Oil composition will change as shown in the chromatography analysis. Usually additional heavy fractions are detected after the treatment.

16
TREATMENT RESULTS
Reservoir response is depending on type of reservoir, quality, depth, and remaining reserves.
Treatment range is around 3 kilometers radius but can be more, depending on the geological situation.
Shut-in wells / observation wells can be re-produced when there is a decrease in watercut.
Opening tighter zone(s) is recommended since it can be an oil productive interval after vibration.