Embed Size (px)
Citation preview

VSP AND WELL LOGS FROM A SHALLOW TEST WELL
Joe Wong, Soo K. Miong, Laurence R. Bentley, and Robert R. Stewart
Geoscience Department, University of Calgary, Calgary, Canada
Abstract
Shallow VSP and geophysical well logging surveys were undertaken in a 127 m-deep well
drilled at the Rothney Astrophysical Observatory site near Priddis, Alberta. The well was drilled
through interbedded sands and shales of the Tertiary Paskapoo formation. A suite of geophysical well
logs (including natural gamma-ray, single-point resistance, focused-beam resistivity, density, neutron-
neutron, caliper, temperature, and SP) was acquired in the open hole immediately after drilling. After
PVC casing was inserted into the well and grouted to the formation rocks, we obtained natural gamma-
ray and full-waveform sonic logs. The logs were useful for delineating the sandstone and shale beds,
and for providing hydrogeological information at the well site. For the VSP surveys, we used a 5.5 kg
sledge hammer source with a downhole clamping 3C geophone. From the full-waveform sonic logs and
VSP data, we determined P-wave velocities to lie between 1.7 to 3.0 km/s. Standard VSP processing
resulted in a corridor stack of up-going reflections that correlate reasonably well with a 1-D synthetic
seismogram constructed from the density and P-wave velocity logs.
Introduction
The Tertiary Paskapoo formation in the Foothills region of Alberta is the groundwater source for
over 100,000 water wells, and characterizing the formation hydrogeologically is a major undertaking by
government and university institutions (Grasby et al., 2006; Natural Resources Canada, 2007). The
Paskapoo formation is comprised mainly of shales and sandstones. We report here on the application of
geophysical well-logging and vertical seismic profiling to investigate the geology and hydrogeology in
the near-surface rocks of the Paskapoo formation.
Recently, the CREWES Project at the University of Calgary had a test well drilled on University
land at the site of Rothney Astrophysical Observatory near Priddis, Alberta. The vertical well penetrated
the Paskapoo Formation to a depth of 137 m. We retained a contractor to conduct geophysical well
logging in this well before PVC casing was installed. Soon after, the Geoscience Department held its
2007 Geophysics Field School at and near the Observatory over a period of two weeks in August and
September. One activity carried out by students was the acquisition of VSP data and geophysical logs in
the cased test well. In addition to introducing students to basic field procedures, the exercise resulted in
interesting datasets useful for supporting groundwater studies of the Paskapoo formation.
The Test Well
Aaron Water Well Drilling Company of Dewinton, Alberta, drilled the test well using an air-
rotary rig. Drilling of the well was done over several days in mid-August, 2007, to a depth of 137 m
with an open-hole diameter of 156 mm. The well was completed by inserting steel casing to a depth of
5.5 m with a projection of 0.61 m above ground level. To prevent long-term collapse of the well, a
quarter-inch-thick (6.35 mm), 4.0-inch-ID (102 mm) PVC casing was inserted to a depth of 127 m.
There was a one-day delay between the end of drilling and the insertion of the PVC casing, so that open-
hole geophysical logging could be done. During this delay, rock detritus washed out of fracture zones
fell to the well bottom and caused the loss of 10 m of well depth. Because the well was not intended to

produce water for domestic or commercial use, there is no well screen, and the PVC casing is closed off
at the bottom and not perforated. Following standard procedure in Alberta for the completion of shallow
water wells, the PVC casing was sealed to the rock with a combination of bentonite grout and bentonite
pellets to prevent vertical groundwater flow.
Figure 1: The University of Calgary test well. The brown material around the casing is a bentonite seal
used to prevent vertical groundwater flow.
Figure 1 shows the construction details of the well and the geological materials it encountered.
The geological log is an interpretation of cuttings described by the driller and the resistivity and natural
gamma-ray logs shown on the figure. According to the driller, water-bearing zones were encountered
during drilling at depths of 24 to 28 m, 52 to 63 m, and 116 to 122 m. The open-hole static water level
was 30 m below ground surface after the drilling ended at the target depth of 137 m.

Open-hole Well Logs
After the target depth of 137 m was reached, but before the well was cased, a contractor (Roke
Oil Enterprises Limited) was retained to provide a suite of geophysical logs in the open hole. These logs
are presented on Figures 1 and 2.
The 16-inch normal resistivity log and natural gamma-ray log, shown on Figures 1 and 2(a), have
variations that follow closely the beds of shales and sandstones within the Paskapoo formation. Shale
layers coincide with low resistivity values and high gamma-ray activity; sandstone beds coincide with
higher resistivities and lower gamma-ray activity. Other open-hole logs vary with lithology in similar
fashion. For example, peaks on the neutron-neutron log (Figure 2a) and focused-beam resistivity log
(Figure 2b) can be correlated with sandstone, while troughs can be correlated with shale. The density
and caliper logs (Figure 2a) indicate significant fracturing in the upper 60 m of the well.
Figure 2a: Open-hole geophysical logs in the U of C test well.
The SP (spontaneous potential) and temperature logs on Figure 2b appear to behave oddly. Both
logs are relatively flat with broad maxima occurring at depths between 80 m and 90 m. The sharp peaks
on the SP log are probably measurement errors. Usually, SP logs follow variations in lithology and
permeability, with SP lows associated with shales and SP highs associated with sandstones. Steps and
linear gradients on a temperature log usually indicate water inflow and outflow, and flow between
permeable zones. The local peaks on the present SP and temperature logs near 85 m are consistent with
a zone of weak groundwater inflow near the base of the large sandstone unit that extends from
approximately 63 m to 90 m in depth. The temperature log was taken within hours after drilling was
completed, so that thermal equilibrium had not been reached.

Figure 1 shows the water-bearing zones depths of 24 to 28 m, 52 to 63 m, and 116 to 122 m as
reported by the driller. We can relate these zones to the lithology interpreted from the resistivity and
gamma-ray logs, and to fractures indicated by the caliper and density logs.
The near-surface aquifer at 24 to 28 m flowed at a rate of 15 gallons/min. The driller measured
the total dissolved solids (TDS) in this water to be about 300 ppm, declaring this to indicate excellent
groundwater quality. The large fracture at 20 m, and fractures in the alternating thin beds of sandstone
and shale at depths between 22 m and 29 m, are likely the source for the fast-flowing water.
Figure 2b: Open-hole geophysical logs from the U of C test well.
The open-hole static water level at 30 m coincides with the large fracture at the same depth.
Listening to the well after drilling had been completed but before casing was installed, we could hear the
sound of falling water. The static level and the sound of falling water suggest that the fractured
sandstones above 30 m are a source of water, but the fracture at 30 m is a sink. That the fracture at 30 m
is a large sink was confirmed during sealing of the well with bentonite grout. The grout is a slurry of
water and bentonite that is pumped from the surface to fill the gap between the casing and the rock
formation through a flexible plastic tube called a tremmie pipe. The slurry filled the gap effectively
from the well bottom up to a depth of 30 m. But then a large volume was pumped into the gap without
the grout level ever rising above 30 m. In the end, the driller poured solid bentonite pellets into the gap
to complete sealing the top 30 m of the well.
The water-bearing zone from 52 to 63 m coincides with a sandstone layer characterized by low
gamma counts and high resistivity. The density and caliper logs show that this sandstone is fractured.
The water-bearing zone between 116 and 122 is not supported by any compelling evidence on the
geophysical logs. However, just above 116 m, the gamma-ray logs show beds with higher sandstone
content overlying a shale layer; these may have enough porosity to be a groundwater source.

Cased-Hole Well Logs
The 2007 Geophysical Field School was held at the Geophysical Test Site at the Rothney
Observatory, and one of the activities was well-logging using a Mount Sopris Instruments Matrix II
geophysical logging system in the test well. The system hardware includes natural gamma-ray, single-
point resistance, spontaneous potential, and full-waveform sonic tools. Because the well was cased with
PVC, we used only the natural gamma-ray tool and the full-waveform sonic (FWS) tool.
Figure 3: Cased-hole natural gamma-ray log and FWS log for the Rx-1 receiver recorded by
field school attendees in the U of C test well.
To provide coupling to the rock for full-waveform sonic logging, the cased well was filled from
the surface with water. The PVC casing is made up of 20 ft (6.1 m) sections threaded together, and slow
leakage takes place through the threads. At the time of the field school, the water level inside the well
was about 6 m below ground level.
The FWS tool consists of a small piezoelectric transmitter near the bottom of the tool; three
piezoelectric receivers (Rx-1, Rx-2, and Rx-3) are located 0.914 m, 1.22 m, and 1.52 m above the

transmitter. In recording full waveforms, the transmitter was driven by a pulse with dominant frequency
of about 15 kHz. For each of the three receivers, we acquired seismograms 525 digital points long with
4 µsec sampling at depth intervals of 10 cm. Figure 3 shows a typical gamma ray log and a typical Rx-1
FWS log of raw seismograms from the cased test well.
Figure 4: Six cased-hole gamma-ray logs acquired during the field school in the cased well, showing
excellent repeatability. The blue profile on (a) is the gamma-ray log in the uncased well. On (g), the red
profile is the average of the six logs minus 100 API units; the blue profile shows the standard deviations.
Over the two-week period of the field school, multiple gamma-ray logs and FWS logs were
acquired in the cased well. Figure 4 displays six of the gamma-ray logs to indicate how well the results
repeat. The blue plot on Figure 4(a) is the gamma-ray log obtained before the well was cased. The
open-hole and cased-hole gamma-ray logs are almost identical; the only effect of the PCV casing is to
decrease slightly the number of gamma rays reaching the detector. On Figure 4(g), the red profile is the
average of the six cased-hole gamma-ray logs minus a constant 100 API units; the blue profile shows the
standard deviation of the six logs. The standard deviation values are about 4 to 8 API units, or about 3
to 10 per cent of the average values. The small mismatches between individual logs are due to
differences both in logging speeds and in eccentric positioning of the gamma-ray tool in the well.
Figure 5 shows two sets of FWS waveforms recorded on two different days. Before plotting, we
applied an Ormsby bandpass filter (corner frequencies at 10-16-50-80 kHz) and automatic gain control
(AGC) to each trace. We see good repeatability of the FWS logs for all three receivers.
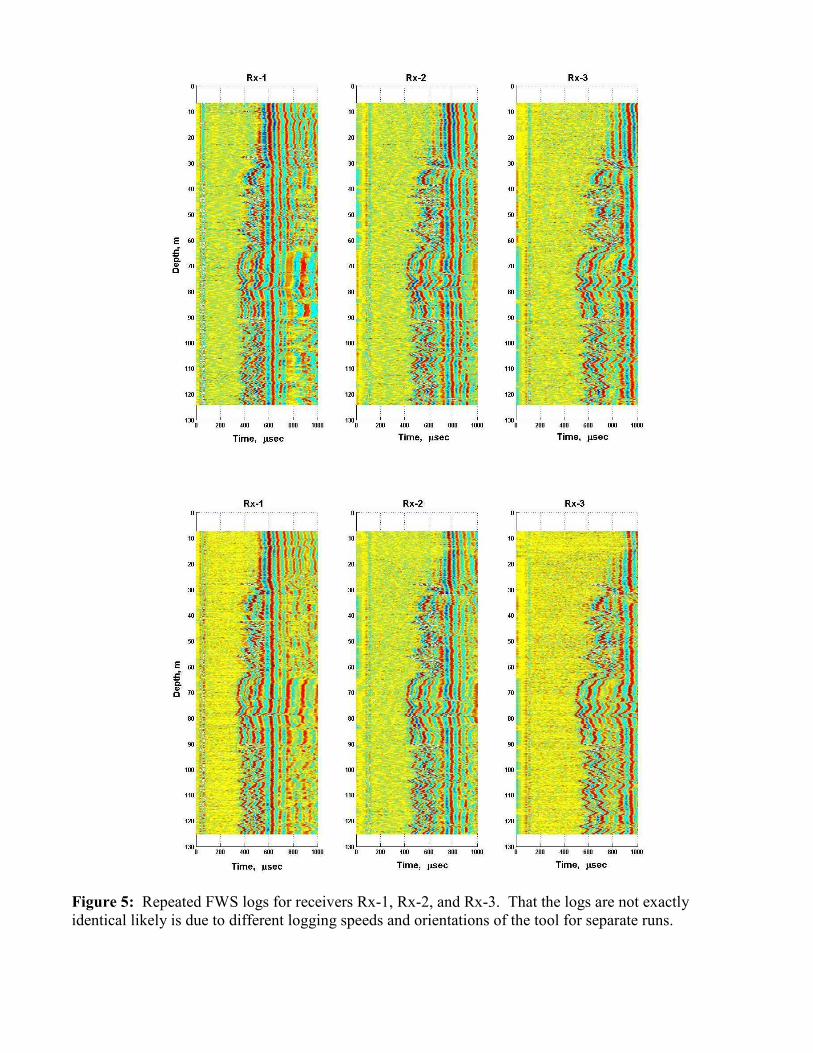
Figure 5: Repeated FWS logs for receivers Rx-1, Rx-2, and Rx-3. That the logs are not exactly
identical likely is due to different logging speeds and orientations of the tool for separate runs.

Figure 6: FWS logs for receivers Rx-1, Rx-2, and Rx-3 after AGC to enhance the clarity of the first
breaks. The AGC facilitates interactive and automatic time picking.
The first arrivals on the raw FWS log of Figure 3 have small amplitudes, and picking reliable
first-break times on the unprocessed seismograms is difficult. To improve the clarity of the first arrivals,
we can apply automatic gain control (AGC) to the traces before displaying them. This was done on
Figure 6 for all three receivers. After AGC, interactive or automatic picking of first-break times with
greater reliability can be accomplished. At depths above 20 m, first arrivals through the rock formation
appear to be lost in noise even with AGC. The poor signal amplitudes at these depths indicate poor
coupling between the formation rocks and the well casing, possibly due to uneven sealing by the
bentonite pellets.
Figure 7 shows the first-break times picked interactively for the three FWS receivers at depths
below 20 m. Also shown are logs of P-wave slowness and P-wave velocity calculated from the Rx-1
and Rx-2 picks. The picks from the Rx-3 receiver were not considered because they are less reliable.
The blue profiles were calculated from the Rx-1 picks and a source-detector distance of .914 m, while
the green profiles were calculated from the Rx-2 picks and a source-detector distance of 1.22 m. The
red profiles are the averages of the Rx-1 and Rx-2 values. Comparing the velocity profiles with the
natural gamma-ray log on the left-hand side of the figure, we see that the lower velocities (2.0 to 2.2
km/sec) coincide with high gamma-ray activity associated with shales. Higher velocities (2.5 to 3.0
km/sec) coincide with low gamma-ray activity associated with sandstones.

Figure 7: (a) Natural gamma-ray log; (b) FWS transit times for receivers Rx-1 (blue ), Rx-2 (green),
and Rx-3 (red); (c) calculated slowness for Rx-1 (blue), Rx-2 (green), and their average (red); (d) P-
wave velocity for Rx-1 (blue), Rx-2 (green), and their average (red).
Vertical Seismic Profiling
Vertical seismic profiles were recorded in the U of C test well with a 5.5 kg sledge-
hammer source and a downhole Geostuff BHG-2 clamping 3C geophone receiver. We recorded with a
24-channel Geometrics Geode seismic acquisition module controlled by a Panasonic CF-30 Toughbook
computer. Separate ends of conducting wires were attached to the metal head of the sledge hammer and
an aluminum strike cylinder. The metal head striking the aluminum cylinder closed the triggering
circuit of the seismograph, initiating digital sampling of the received signals. This arrangement
provided a reliable zero time.
The downhole geophone was lowered into the well by guiding the attaching cable over a sheave
wheel mounted over the wellhead. The top of the sheave wheel was 1.1 m above ground level.
Geophone depths have been corrected for the sheave wheel elevation, and so are referenced to ground
level. The downhole geophone occupied depths ranging from 2 m to 92 m at half-meter intervals. We
recorded the VSP seismograms with a sampling rate of 0.25 ms, a record length of 1000 ms, and a high
cut filter of 500 Hz.
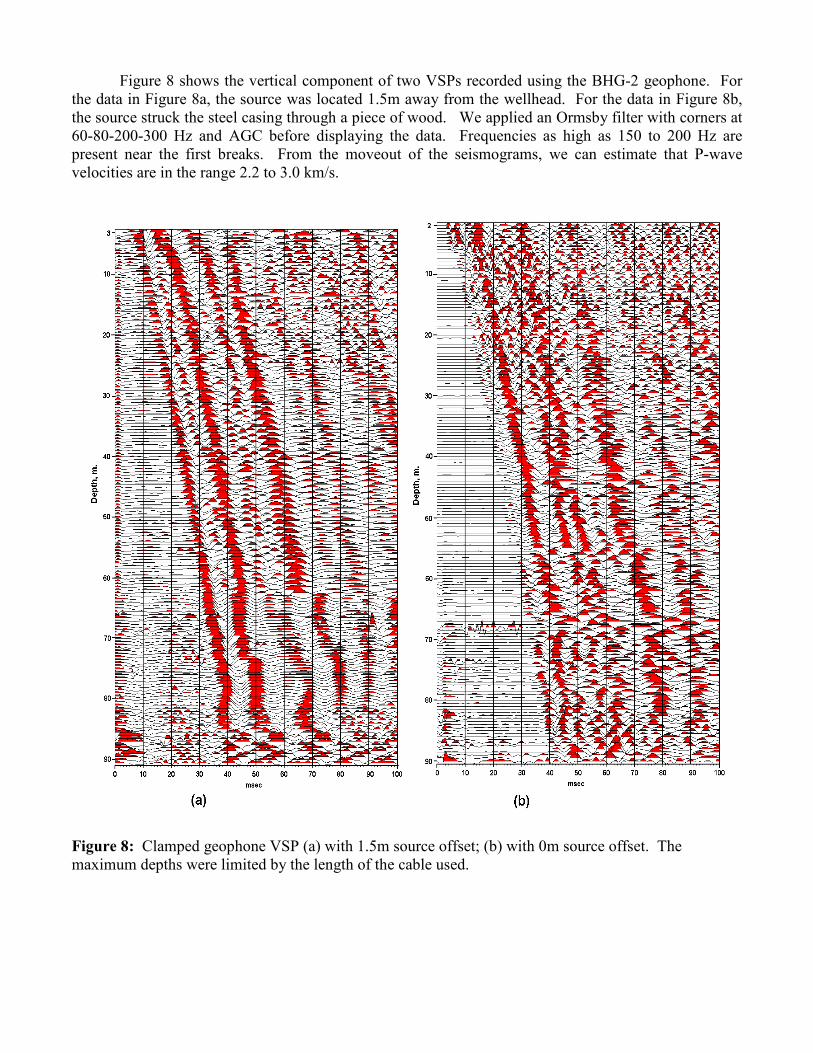
Figure 8 shows the vertical component of two VSPs recorded using the BHG-2 geophone. For
the data in Figure 8a, the source was located 1.5m away from the wellhead. For the data in Figure 8b,
the source struck the steel casing through a piece of wood. We applied an Ormsby filter with corners at
60-80-200-300 Hz and AGC before displaying the data. Frequencies as high as 150 to 200 Hz are
present near the first breaks. From the moveout of the seismograms, we can estimate that P-wave
velocities are in the range 2.2 to 3.0 km/s.
Figure 8: Clamped geophone VSP (a) with 1.5m source offset; (b) with 0m source offset. The
maximum depths were limited by the length of the cable used.
Processing zero offset VSP data
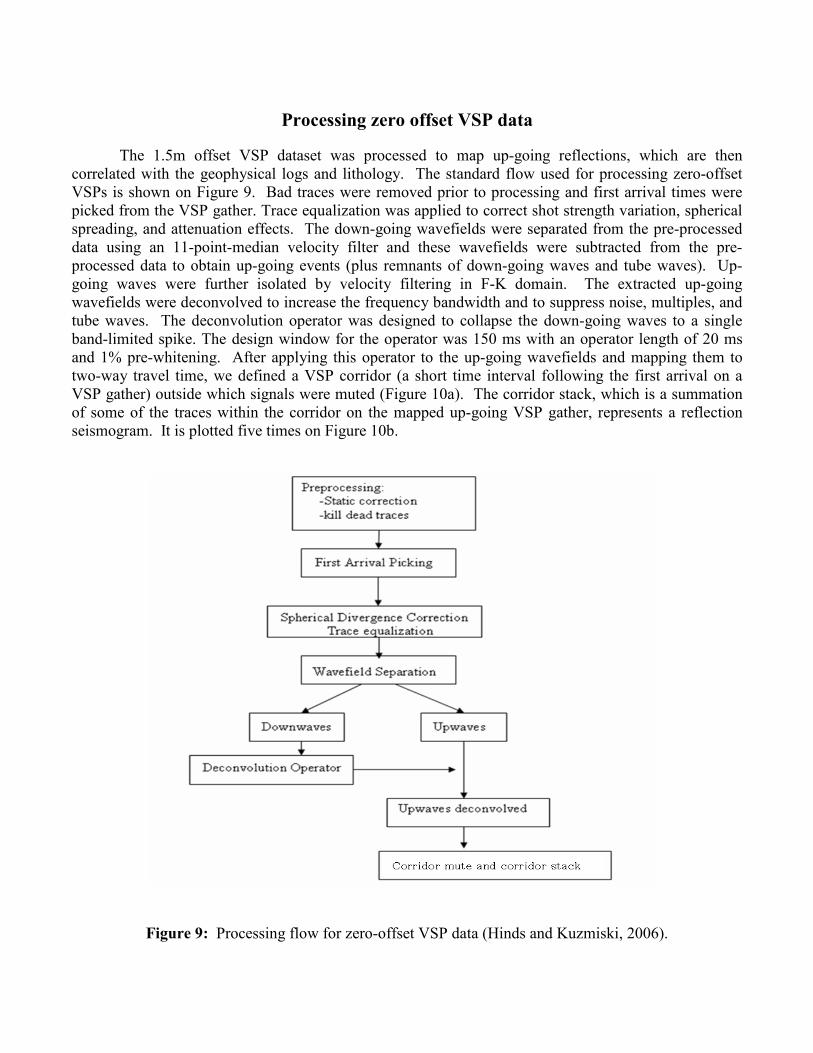
The 1.5m offset VSP dataset was processed to map up-going reflections, which are then
correlated with the geophysical logs and lithology. The standard flow used for processing zero-offset
VSPs is shown on Figure 9. Bad traces were removed prior to processing and first arrival times were
picked from the VSP gather. Trace equalization was applied to correct shot strength variation, spherical
spreading, and attenuation effects. The down-going wavefields were separated from the pre-processed
data using an 11-point-median velocity filter and these wavefields were subtracted from the pre-
processed data to obtain up-going events (plus remnants of down-going waves and tube waves). Up-
going waves were further isolated by velocity filtering in F-K domain. The extracted up-going
wavefields were deconvolved to increase the frequency bandwidth and to suppress noise, multiples, and
tube waves. The deconvolution operator was designed to collapse the down-going waves to a single
band-limited spike. The design window for the operator was 150 ms with an operator length of 20 ms
and 1% pre-whitening. After applying this operator to the up-going wavefields and mapping them to
two-way travel time, we defined a VSP corridor (a short time interval following the first arrival on a
VSP gather) outside which signals were muted (Figure 10a). The corridor stack, which is a summation
of some of the traces within the corridor on the mapped up-going VSP gather, represents a reflection
seismogram. It is plotted five times on Figure 10b.
Figure 9: Processing flow for zero-offset VSP data (Hinds and Kuzmiski, 2006).
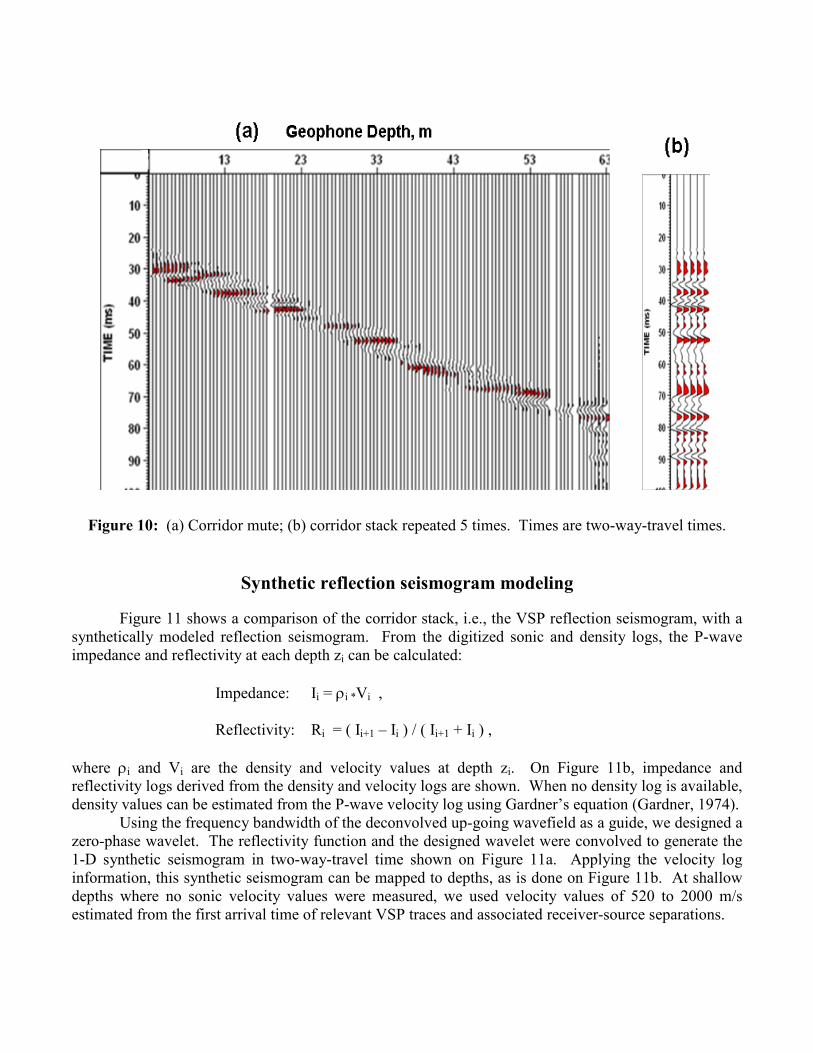
Figure 10: (a) Corridor mute; (b) corridor stack repeated 5 times. Times are two-way-travel times.
Synthetic reflection seismogram modeling
Figure 11 shows a comparison of the corridor stack, i.e., the VSP reflection seismogram, with a
synthetically modeled reflection seismogram. From the digitized sonic and density logs, the P-wave
impedance and reflectivity at each depth zi can be calculated:
Impedance: Ii = ρi *Vi ,
Reflectivity: Ri = ( Ii+1 – Ii ) / ( Ii+1 + Ii ) ,
where ρi and Vi are the density and velocity values at depth zi. On Figure 11b, impedance and
reflectivity logs derived from the density and velocity logs are shown. When no density log is available,
density values can be estimated from the P-wave velocity log using Gardner’s equation (Gardner, 1974).
Using the frequency bandwidth of the deconvolved up-going wavefield as a guide, we designed a
zero-phase wavelet. The reflectivity function and the designed wavelet were convolved to generate the
1-D synthetic seismogram in two-way-travel time shown on Figure 11a. Applying the velocity log
information, this synthetic seismogram can be mapped to depths, as is done on Figure 11b. At shallow
depths where no sonic velocity values were measured, we used velocity values of 520 to 2000 m/s
estimated from the first arrival time of relevant VSP traces and associated receiver-source separations.

Correlation of synthetic reflection, corridor stack, and well logs
We see from Figure 11a that the general wave shape of the corridor stack bears some
resemblance to the 1-D synthetic seismogram. Discrepancies between the VSP corridor stack and the
synthetic reflection seismogram are possibly due to VSP noise from imperfectly-removed down-going
waves and tube waves, as well as mismatches in frequency content and geometry. As expected, the
synthetic reflection seismogram (mapped to depth on Figure 11b) correlates well with the gamma-ray
and P-wave velocity logs.
The corridor stack can also be mapped to depth. This has been done on the right side of Figure
11b. The VSP reflections appear to be associated with changes in the P-wave velocity, density, and
gamma-ray logs. These in turn are associated with boundaries between sandstone and shale beds (see
Figure 1).
Figure 11: (a) VSP corridor stack and 1-D synthetic seismograms displayed with two-way-travel time.
(b) Depth correlation of 1-D synthetic seismogram with well logs.

Conclusion
The geophysical well logs and VSPs presented in this study give useful information regarding
the near-surface geological and hydrogeological characteristics of the Paskapoo Formation at the
Rothney Observatory site near Priddis, Alberta.
Natural gamma-ray, resistivity, and neutron-neutron logs delineate the shale/sandstone bedding
with good precision. Open-hole density and caliper logs clearly indicate fracturing in the top 60 m of
the well. A large fracture at 20 m depth and fractured thin sandstone beds (identified by the gamma log
and density and caliper logs) appears to be the source of fast-flowing groundwater that the driller
estimated came from depths of 24 m to 28 m. Another large fracture, identified at a depth of 30 m by
the density and caliper logs, acted as a groundwater sink in the uncased well. The temperature and SP
logs indicated that, within a thick sandstone unit, there is a zone of warmer water inflow not identified
by the driller at approximately 85 m. A driller-identified water-bearing zone, extending from 116 m to
122 m, does not have an apparent geophysical log signature. However, gamma-ray logs do indicate an
interface at 116 m, where beds with higher sandstone content overlie beds with higher shale content.
Full-waveform sonic (FWS) logs closely mimic the natural gamma-ray log. First-arrival times
picked interactively from the FWS logs gave P-wave velocities that are in the range 2.0 to 2.2 km/s for
shale, and in the range 2.6 to 3.0 km/s for sandstone.
We acquired excellent zero-offset and 1.5-m-offset VSPs with a sledge hammer source and a
downhole clamping geophone down to depths of 92 m. The 1.5-m-offset dataset was analyzed with
standard zero-offset VSP processing to obtain a corridor stack of the up-going reflections. Prominent
events on the VSP corridor stack correlated reasonably well with a synthetic 1-D seismogram generated
from the density and P-wave velocity logs, and with some boundaries between sandstone and shale beds.
We conclude that open-hole and cased-hole well logs and VSP in the shallow test well provided
useful information regarding stratigraphy and fracturing and their relationship to water flow. This
information could not have been obtained from the driller’s report alone.
References
Gardner, G.H.F., Gardner, L. W., and Gregory, A.R., 1974, Formation velocity and density –the
diagnostic basis for stratigraphic traps: Geophysics, 39, 770-780.
Grasby, S., Chen, Z., Hablin, T, Sweet, A., and Wozniak, P, 2006, Paskapoo groundwater study,
Geological Survey of Canada presentation on website,
http://ess.nrcan.gc.ca/gm/reports/pdf/grasby_paskapoo_e.pdf .
Hinds, R. and Kuzmiski, R., 2006, Borehole Geophysics: Theory and Practice, SEG Continuing
education.
Natural Resources Canada, 2007, Paskapoo groundwater study, abstract on website,
http://ess.nrcan.gc.ca/2002_2006/gwp/p3/a7/index_e.php .
Acknowledgment
This study has been supported by the Alberta Ingenuity Centre for Water Research, NSERC, and
the sponsors of the CREWES Project. We thank Advanced Geophysical Corporation for giving access
to ProMAX seismic processing software, and GEDCO Limited for providing access to VISTA seismic
processing software.