Embed Size (px)
Citation preview

vSphere Monitoring andPerformanceUpdate 211 APR 2019VMware vSphere 6.7VMware ESXi 6.7vCenter Server 6.7

You can find the most up-to-date technical documentation on the VMware website at:
https://docs.vmware.com/
If you have comments about this documentation, submit your feedback to
VMware, Inc.3401 Hillview Ave.Palo Alto, CA 94304www.vmware.com
Copyright © 2010-2019 VMware, Inc. All rights reserved. Copyright and trademark information.
vSphere Monitoring and Performance
VMware, Inc. 2

Contents
About vSphere Monitoring and Performance 7
1 Monitoring Inventory Objects with Performance Charts 9Performance Chart Types 10
Data Counters 10
Metric Groups in vSphere 12
Data Collection Intervals 12
Data Collection Levels 13
View Performance Charts 14
Performance Charts Options Available Under the View Menu 15
Overview Performance Charts 16
Clusters 16
Data centers 27
Datastores and Datastore Clusters 31
Hosts 42
Resource Pools 68
vApps 75
Virtual Machines 79
Working with Advanced and Custom Charts 108
View Advanced Performance Charts 108
View Advanced Performance Charts in the vSphere Client 109
Change Advanced Chart Settings 109
Create a Custom Advanced Chart 110
Delete a Custom Advanced Chart View 110
Save Chart Data to a File 111
Troubleshoot and Enhance Performance 111
Solutions for Consistently High CPU Usage 111
Solutions for Memory Performance Problems 113
Solutions for Storage Performance Problems 113
Solutions for Disk Performance Problems 114
Solutions for Poor Network Performance 115
Empty Performance Charts 117
2 Monitoring Guest Operating System Performance 118Enable Statistics Collection for Guest Operating System Performance Analysis 118
View Performance Statistics for Windows Guest Operating Systems 118
3 Monitoring Host Health Status 120
VMware, Inc. 3

Monitor Health Status in the vSphere Client 121
Monitor Hardware Health Status 121
Reset Health Status Sensors in the vSphere Client 122
Reset Health Status Sensors 122
4 Monitoring vSphere Health 124Check vSphere Health in vSphere Client 124
5 Monitoring Events, Alarms, and Automated Actions 126View Events in the vSphere Web Client 129
View Events in the vSphere Client 129
View System Logs 129
Export Events Data 130
Consolidating Identical Events 130
Enabling Events Burst Filter 131
Streaming Events to a Remote Syslog Server 133
Redirect vCenter Server Appliance Log Files to Another Machine 134
Configure Streaming of Events to a Remote Syslog Server 135
Retention of Events in the vCenter Server Database 136
Configure Database Settings 136
View Triggered Alarms and Alarm Definitions 137
Live Refresh of Recent Tasks and Alarms 137
Set an Alarm in the vSphere Web Client 138
Create or Edit Alarms 139
Specify Alarm Name, Description, and Type 140
Specify How a Condition-Based or State-Based Alarm is Triggered 140
Specify How an Event-Based Alarm is Triggered 141
Specify Alarm Actions 142
Set an Alarm in the vSphere Client 148
Create or Edit Alarms 148
Specify Alarm Name, Description, and Target 149
Specify Alarm Rules 149
Specify Alarm Reset Rules 152
Review and Enable Alarm 154
Acknowledge Triggered Alarms 154
Reset Triggered Event Alarms 155
Preconfigured vSphere Alarms 155
6 Monitoring Solutions with the vCenter Solutions Manager 161View Solutions and vServices 161
Monitoring Agents 162
vSphere Monitoring and Performance
VMware, Inc. 4

Monitoring vServices 162
7 Monitoring the Health of Services and Nodes 164View the Health Status of Services and Nodes 164
8 Performance Monitoring Utilities: resxtop and esxtop 166Using the esxtop Utility 166
Using the resxtop Utility 167
Using esxtop or resxtop in Interactive Mode 168
Interactive Mode Command-Line Options 168
CPU Panel 170
CPU Power Panel 173
Memory Panel 174
Storage Adapter Panel 177
Storage Device Panel 179
Virtual Machine Storage Panel 181
Network Panel 182
Interrupt Panel 183
Using Batch Mode 183
Prepare for Batch Mode 183
Use esxtop or resxtop in Batch Mode 183
Batch Mode Command-Line Options 184
Using Replay Mode 184
Prepare for Replay Mode 185
Use esxtop in Replay Mode 185
Replay Mode Command-Line Options 185
9 Using the vimtop Plug-In to Monitor the Resource Use of Services 187Monitor Services By Using vimtop in Interactive Mode 187
Interactive Mode Command-Line Options 187
Interactive Mode Single-Key Commands for vimtop 188
10 Monitoring Networked Devices with SNMP and vSphere 190Using SNMP Traps with vCenter Server 190
Configure SNMP Settings for vCenter Server 191
Configure SNMP for ESXi 192
Configure the SNMP Agent for Polling 193
Configure ESXi for SNMPv1 and SNMPv2c 193
Configure ESXi for SNMP v3 195
Configure the Source of Hardware Events Received by the SNMP Agent 201
Configure the SNMP Agent to Filter Notifications 201
vSphere Monitoring and Performance
VMware, Inc. 5

Configure SNMP Management Client Software 202
SNMP Diagnostics 203
Monitor Guest Operating Systems with SNMP 203
VMware MIB Files 203
SNMPv2 Diagnostic Counters 205
11 System Log Files 207View System Log Entries 207
View System Logs on an ESXi Host 207
System Logs 208
ESXi System Logs 208
vSphere Client Logs 208
Export System Log Files 209
Export System Log Files using vSphere Web Client 210
ESXi Log Files 211
Upload Logs Package to a VMware Service Request 212
Configure Syslog on ESXi Hosts 212
Configuring Logging Levels for the Guest Operating System 213
Change the Number of Virtual Machine Log Files 214
Control When to Switch to New Virtual Machine Log Files 214
Collecting Log Files 215
Set Verbose Logging 215
Collect vSphere Log Files 216
Collect ESXi Log Files 216
ESXi Log File Locations 216
Configure Log Filtering on ESXi Hosts 217
Turn Off Compression for vpxd Log Files 218
ESXi VMkernel Files 219
vSphere Monitoring and Performance
VMware, Inc. 6

About vSphere Monitoring andPerformance
VMware provides several tools to help you monitor your virtual environment and to locate the source ofpotential issues and current problems.
Performance Charts Allow you to see performance data on a variety of system resourcesincluding CPU, Memory, Storage, and so on.
PerformanceMonitoring Command-line Utilities
Allow you to access detailed information on system performance throughthe command line.
Host Health Allows you to quickly identify which hosts are healthy and which areexperiencing problems.
Events, Alerts, andAlarms
Allow you to configure alerts and alarms and to specify the actions thesystem should take when they are triggered.
System Log Files System logs contain additional information about activities in your vSphereenvironment.
Intended AudienceThe content in this section is intended for vSphere administrators who perform the following tasks:
n Monitor the health and performance of physical hardware backings for the virtual environment.
n Monitor the health and performance of virtual devices in the virtual environment.
n Troubleshoot problems in the system.
n Configure alarms.
n Configure SNMP messages.
Virtual machine administrators also might find the section on Chapter 2 Monitoring Guest OperatingSystem Performance helpful.
vSphere Web Client and vSphere ClientInstructions in this guide reflect the vSphere Client (an HTML5-based GUI). You can also use theinstructions to perform the tasks by using the vSphere Web Client (a Flex-based GUI).
VMware, Inc. 7

Tasks for which the workflow differs significantly between the vSphere Client and the vSphere Web Clienthave duplicate procedures that provide steps according to the respective client interface. The proceduresthat relate to the vSphere Web Client, contain vSphere Web Client in the title.
Note In vSphere 6.7 Update 1, almost all of the vSphere Web Client functionality is implemented in thevSphere Client. For an up-to-date list of any remaining unsupported functionality, see FunctionalityUpdates for the vSphere Client.
vSphere Monitoring and Performance
VMware, Inc. 8

Monitoring Inventory Objectswith Performance Charts 1The vSphere statistics subsystem collects data on the resource usage of inventory objects. Data on awide range of metrics is collected at frequent intervals, processed, and archived in the vCenter Serverdatabase. You can access statistical information through command-line monitoring utilities or by viewingperformance charts in the vSphere Web Client.
Counters and Metric GroupsvCenter Server systems and hosts use data counters to query for statistics. A data counter is a unit ofinformation relevant to a given inventory object or device. Each counter collects data for a differentstatistic in a metric group. For example, the disk metric group includes separate data counters to collectdata for disk read rate, disk write rate, and disk usage. Statistics for each counter are rolled up after aspecified collection interval. Each data counter consists of several attributes that are used to determinethe statistical value collected.
For a complete list and description of performance metrics, see the vSphere API Reference.
Note Counters that are introduced in later versions might not contain data from hosts of earlier versions.For details, see the VMware Knowledge Base.
Collection Levels and Collection IntervalsCollection levels determine the number of counters for which data is gathered during each collectioninterval. Collection intervals determine the time period during which statistics are aggregated, calculated,rolled up, and archived in the vCenter Server database. Together, the collection interval and collectionlevel determine how much statistical data is collected and stored in your vCenter Server database.
Data AvailabilityReal-time data appears in the performance charts only for hosts and virtual machines that are poweredon. Historical data appears for all supported inventory objects, but might be unavailable during certaincircumstances.
This chapter includes the following topics:
n Performance Chart Types
VMware, Inc. 9

n Data Counters
n Metric Groups in vSphere
n Data Collection Intervals
n Data Collection Levels
n View Performance Charts
n Performance Charts Options Available Under the View Menu
n Overview Performance Charts
n Working with Advanced and Custom Charts
n Troubleshoot and Enhance Performance
Performance Chart TypesPerformance metrics are displayed in different types of charts, depending on the metric type and object.
Table 1-1. Performance Chart Types
Chart Type Description
Line chart Displays metrics for a single inventory object. The data for each performance counter is plotted on a separateline in the chart. For example, a network chart for a host can contain two lines: one showing the number ofpackets received, and one showing the number of packets transmitted.
Bar chart Displays storage metrics for datastores in a selected data center. Each datastore is represented as a bar in thechart. Each bar displays metrics based on the file type: virtual disks, snapshots, swap files, and other files.
Pie chart Displays storage metrics for a single object, based on the file types, or virtual machines. For example, a piechart for a datastore can display the amount of storage space occupied by the virtual machines taking up thelargest space.
Stacked chart Displays metrics for the child objects that have the highest statistical values. All other objects are aggregated,and the sum value is displayed with the term Other. For example, a host's stacked CPU usage chart displaysCPU usage metrics for the 10 virtual machines on the host that are consuming the most CPU. The Otheramount contains the total CPU usage of the remaining virtual machines.
The metrics for the host itself are displayed in separate line charts.
Stacked charts are useful in comparing the resource allocation and usage across multiple hosts or virtualmachines. By default, the 10 child objects with the highest data counter values are displayed.
Data CountersEach data counter includes several attributes that are used to determine the statistical value collected.See the vSphere API Reference for a complete list and description of supported counters.
vSphere Monitoring and Performance
VMware, Inc. 10

Table 1-2. Data Counter Attributes
Attribute Description
Unit of Measurement Standard in which the statistic quantity is measured.
n Kilobytes (KB) – 1024 bytes
n Kilobytes per second (KBps) – 1024 bytes per second
n Kilobits (kb) – 1000 bits
n Kilobits per second (kbps) – 1000 bits per second
n Megabytes (MB)
n Megabytes per second (MBps)
n Megabits (Mb), megabits per second (Mbps)
n Megahertz (MHz)
n Microseconds (µs)
n Milliseconds (ms)
n Number (#)
n Percent (%)
n Seconds (s)
Description Text description of the data counter.
Statistics Type Measurement used during the statistics interval. Related to the unit of measurement.
n Rate – Value over the current statistics interval
n Delta – Change from previous statistics interval.
n Absolute – Absolute value (independent of the statistics interval).
Rollup Type Calculation method used during the statistics interval to roll up data. Determines the type of statisticalvalues that are returned for the counter.
n Average – Data collected during the interval is aggregated and averaged.
n Minimum – The minimum value is rolled up.
n Maximum – The maximum value is rolled up.
The Minimum and Maximum values are collected and displayed only in statistics level 4. Minimum andmaximum rollup types are used to capture peaks in data during the interval. For real-time data, thevalue is the current minimum or current maximum. For historical data, the value is the averageminimum or average maximum.
For example, the following information for the CPU usage chart shows that the average is collected atstatistics level 1. The minimum and maximum values are collected at statistics level 4.
n Counter: usage
n Unit: Percentage (%)
n Rollup Type: Average (Minimum/Maximum)
n Collection Level: 1 (4)
n Summation – Data collected is summed. The measurement displayed in the chart represents the sumof data collected during the interval.
n Latest – Data collected during the interval is a set value. The value displayed in the performance chartsrepresents the current value.
Collection level Number of data counters used to collect statistics. Collection levels range from 1 to 4, with 4 having themost counters.
Note Be careful when you set a higher collection level, as the process requires significant increase ofresource usage. For more information, see Data Collection Levels .
vSphere Monitoring and Performance
VMware, Inc. 11

Metric Groups in vSphereThe performance data collection subsystem for vSphere collects performance data on various inventoryitems and their devices. Data counters define individual performance metrics. Performance metrics areorganized into logical groups based on the object or object device. Statistics for one or more metrics canbe displayed in a chart.
Table 1-3. Metric Groups
Metric group Description
Cluster Services Performance statistics for clusters configured by using vSphere Distributed Resource Scheduler, vSphere HighAvailability, or both.
CPU CPU utilization per host, virtual machine, resource pool, or compute resource.
Datastore Statistics for datastore utilization.
Disk Disk utilization per host, virtual machine, or datastore. Disk metrics include I/O performance, such as latency andread/write speeds, and utilization metrics for storage as a finite resource.
Memory Memory utilization per host, virtual machine, resource pool, or compute resource. The value obtained is one ofthe following:
n For virtual machines, memory refers to the guest physical memory. Guest physical memory is the amount ofphysical memory presented as a virtual-hardware component to the virtual machine, at creation time, andmade available when the virtual machine is running.
n For hosts, memory refers to the machine memory. Machine memory is the RAM that is installed on thehardware that comprises the host.
Network Network utilization for both physical and virtual network interface controllers (NICs) and other network devices.The virtual switches that support connectivity among all components, such as hosts, virtual machines, VMkernel.
Power Energy usage statistics per host.
Storage Adapter Data traffic statistics per host bus adapter (HBA).
Storage Path Data traffic statistics per path.
System Overall system availability, such as the system heartbeat and uptime. These counters are available directly fromhosts and from vCenter Server.
Virtual Disk Disk utilization and disk performance metrics for virtual machines.
Virtual Flash Virtual flash counters.
Virtual MachineOperations
Virtual machine power and provisioning operations in a cluster or data center.
vSphereReplication
Statistics for the virtual machine replication performed by VMware vCenter Site Recovery Manager.
Data Collection IntervalsCollection intervals determine the duration for which statistics are aggregated, calculated, rolled up, andarchived. Together, the collection interval and collection level determine how much statistical data isgathered and stored in your vCenter Server database.
vSphere Monitoring and Performance
VMware, Inc. 12

Table 1-4. Collection Intervals
Collection Interval/Archive Length
CollectionFrequency Default Behavior
1 Day 5 Minutes Real-time statistics are rolled up to create one data point every 5 minutes. Theresult is 12 data points every hour and 288 data points every day. After 30minutes, the six data points collected are aggregated and rolled up as a data pointfor the 1-Week time range.
You can change the interval duration and archive length of the 1-Day collectioninterval by configuring the statistics settings.
1 Week 30 Minutes 1-Day statistics are rolled up to create one data point every 30 minutes. The resultis 48 data points every day and 336 data points every week. Every 2 hours, the 12data points collected are aggregated and rolled up as a data point for the 1-Monthtime range.
You cannot change the default settings of the 1-Week collection interval.
1 Month 2 Hours 1-Week statistics are rolled up to create one data point every 2 hours. The resultis 12 data points every day and 360 data points every month (assuming a 30-daymonth). After 24 hours, the 12 data points collected are aggregated and rolled upas a data point for the 1-Year time range.
You cannot change the default settings of the 1-Month collection interval.
1 Year 1 Day 1-Month statistics are rolled up to create one data point every day. The result is365 data points each year.
You can change the archive length of the 1-Year collection interval by configuringthe statistics settings.
Note If you change the duration of data collection intervals you might need to allocate more storageresources.
Data Collection LevelsEach collection interval has a default collection level that determines the amount of data gathered andwhich counters are available for display in the charts. Collection levels are also referred to as statisticslevels.
vSphere Monitoring and Performance
VMware, Inc. 13

Table 1-5. Statistics Levels
Level Metrics Best Practice
Level 1 n Cluster Services (VMware Distributed Resource Scheduler) – allmetrics
n CPU – cpuentitlement, totalmhz, usage (average), usagemhz
n Disk – capacity, maxTotalLatency, provisioned, unshared, usage(average), used
n Memory – consumed, mementitlement, overhead, swapinRate,swapoutRate, swapused, totalmb, usage (average), vmmemctl(balloon)
n Network – usage (average), IPv6
n System – heartbeat, uptime
n Virtual Machine Operations – numChangeDS, numChangeHost,numChangeHostDS
Use for long-term performance monitoringwhen device statistics are not required.
Level 1 is the default Collection Level forall Collection Intervals.
Level 2 n Level 1 metrics
n CPU – idle, reservedCapacity
n Disk – All metrics, excluding numberRead and numberWrite.
n Memory – All metrics, excluding memUsed and maximum andminimum rollup values.
n Virtual Machine Operations – All metrics
Use for long-term performance monitoringwhen device statistics are not requiredbut you want to monitor more than thebasic statistics.
Level 3 n Level 1 and Level 2 metrics
n Metrics for all counters, excluding minimum and maximum rollupvalues.
n Device metrics
Use for short-term performancemonitoring after encountering problems orwhen device statistics are required.
Because of the large quantity oftroubleshooting data retrieved andrecorded, use level 3 for the shortest timeperiod (Day or Week collection interval).
Level 4 All metrics supported by the vCenter Server, including minimum andmaximum rollup values.
Use for short-term performancemonitoring after encountering problems orwhen device statistics are required.
Because of the large quantity oftroubleshooting data retrieved andrecorded, use level 4 for the shortestamount of time.
Note When you increase the collection level, the storage and system requirements might change. Youmight need to allocate more system resources to avoid a decrease in the performance.
View Performance ChartsThe vCenter Server statistics settings, the type of object selected, and the features that are enabled onthe selected object determine the amount of information displayed in charts. Charts are organized intoviews. You can select a view to see related data together on one screen. You can also specify the timerange, or data collection interval. The duration extends from the selected time range to the present time.
vSphere Monitoring and Performance
VMware, Inc. 14

Overview charts display multiple data sets in one panel to evaluate different resource statistics, displaythumbnail charts for child objects. It also displays charts for a parent and a child object. Advanced chartsdisplay more information than overview charts, are configurable, and can be printed or exported. You canexport data in the PNG, JPEG, or CSV formats. See View Advanced Performance Charts.
Procedure
1 Select a valid inventory object in the vSphere Web Client.
Overview and advanced performance charts are available for datacenter, cluster, host, resource pool,vApp, and virtual machine objects. Overview charts are also available for datastores and datastoreclusters. Performance charts are not available for network objects.
2 Click the Monitor tab, and click Performance.
3 Select a view.
Available views depend on the type of object. For views that might contain many charts in a largeenvironment, the vSphere Web Client displays the charts distributed on multiple pages. You can usethe arrow buttons to navigate between pages.
4 Select a predefined or custom time range.
Performance Charts Options Available Under the ViewMenuThe performance chart options that you can access under the View menu vary depending on the type ofinventory object you select.
For example, the Virtual Machines view is available when you view host performance charts only if thereare virtual machines on the selected host. Likewise, the Fault Tolerance view for virtual machineperformance charts is available only when that feature is enabled for the selected virtual machine.
Table 1-6. Performance Chart Views by Inventory Object
Object View List Items
Data center n Storage - space utilization charts for datastores in the data center, including space by file type and storagespace used by each datastore in the data center.
n Clusters - thumbnail CPU and memory charts for each cluster, and stacked charts for total CPU andmemory usage in the data center. This view is the default.
Datastore anddatastore cluster
n Space - space utilization charts for the datastore:
n space utilization by file type
n space utilization by virtual machine
n space usage
n Performance - performance charts for the datastore or datastore cluster and for virtual machine disks onthe resource.
Note The Performance view for datastores is only available when all hosts that are connected to the datastoresare ESX/ESXi 4.1 or greater. The Performance view for datastore clusters is only available when the StorageDRS is enabled.
vSphere Monitoring and Performance
VMware, Inc. 15

Table 1-6. Performance Chart Views by Inventory Object (continued)
Object View List Items
Cluster n Home - CPU and memory charts for the cluster.
n Resource Pools & Virtual Machines - thumbnail charts for resource pools and virtual machines, andstacked charts for total CPU and memory usage in the cluster.
n Hosts - thumbnail charts for each host in the cluster, and stacked charts for total CPU, memory, disk usage,and network usage.
Host n Home - CPU, memory, disk, and network charts for the host.
n Virtual Machines - thumbnail charts for virtual machines, and stacked charts for total CPU usage and totalmemory usage on the host.
Resource Pooland vApps
n Home - CPU and memory charts for the resource pool.
n Resource Pools & Virtual Machines - thumbnail charts for resource pools, and virtual machines andstacked charts for CPU and memory usage in the resource pool or vApp.
Virtual Machine n Storage - space utilization charts for the virtual machine: space by file type, space by datastore, and totalgigabytes.
n Fault Tolerance - CPU and memory charts that display comparative metrics for the fault-tolerant primaryand secondary virtual machines.
n Home - CPU, memory, network, host (thumbnail charts), and disk usage charts for the virtual machine.
Overview Performance ChartsThe overview performance charts display the most common metrics for an object in the inventory. Usethese charts to monitor and troubleshoot performance problems.
The metrics provided in Overview performance charts are a subset of those collected for hosts and thevCenter Server. For a complete list of all metrics collected by hosts and the vCenter Server, see thevSphere API Reference.
ClustersThe cluster charts contain information about CPU, disk, memory, and network usage for clusters. Thehelp topic for each chart contains information about the data counters displayed in that chart. Thecollection level set for vCenter Server determines the available counters.
CPU (MHz)The CPU (MHz) chart displays CPU usage for the cluster.
Cluster Counters
This chart is located in the Home view of the Cluster Performance tab.
vSphere Monitoring and Performance
VMware, Inc. 16

Table 1-7. Data Counters
Chart Label Description
Usage Sum of the average CPU usage values, in Megahertz, of all virtual machines in the cluster.
n Counter: usagemhz
n Stats Type: Rate
n Unit: Megahertz (MHz)
n Rollup Type: Average (Minimum/Maximum)
n Collection Level: 1 (4)
Total Total amount of CPU resources available in the cluster. The maximum value is equal to the number ofcores multiplied by the frequency of the processors.
For example, a cluster has two hosts, each of which has four CPUs that are 3 GHz each, and one virtualmachine that has two virtual CPUs.
VM totalmhz = 2 vCPUs * 3000 MHz = 6000 MHz
Host totalmhz = 4 CPUs * 3000 MHz = 12000 MHz
Cluster totalmhz = 2 x 4 * 3000 MHz = 24000 MHz
n Counter: totalmhz
n Stats Type: Rate
n Unit: Megahertz (MHz)
n Rollup Type: Summation
n Collection Level: 1
Chart Analysis
A short spike in CPU usage indicates that you are making the best use of cluster resources. However, ifthe value is constantly high, the CPU demanded is likely greater than the CPU capacity available. A highCPU usage value can lead to increased ready time and processor queuing of the virtual machines on thehosts in the cluster.
If performance is impacted, consider taking the following actions.
Table 1-8. CPU Performance Enhancement Advice
# Resolution
1 Verify that VMware Tools is installed on each virtual machine.
2 If the cluster is not a DRS cluster, enable DRS. To enable DRS, perform the following tasks:
1 Select the cluster, and click the Configure tab.
2 Under Services, click vSphere DRS.
3 click Edit.
An Edit Cluster Settings dialog box opens.
4 Click Turn ON vSphere DRS, and click OK.
3 If the cluster is a DRS cluster:
n Increase the number of hosts, and migrate one or more virtual machines to the new host.
n Check the aggressiveness threshold. If the value is low, increase the threshold. This might help avoid hot spots in thecluster.
4 Migrate one or more virtual machines to a new host.
5 Upgrade the physical CPUs or cores on each host in the cluster if necessary.
vSphere Monitoring and Performance
VMware, Inc. 17

Table 1-8. CPU Performance Enhancement Advice (continued)
# Resolution
6 Enable CPU-saving features, such as TCP Segmentation Offload.
7 Replace software I/O with the dedicated hardware, such as iSCSI HBAs or TCP Segmentation Offload NICs.
CPU UsageThe cluster CPU Usage charts monitor the CPU utilization of the hosts, resource pools, and virtualmachines in the cluster. This chart displays the 10 child objects in the cluster with the most CPU usage.
This chart is located in the Resource Pools and Virtual Machines view of the Cluster Performance tab.
Table 1-9. Data Counters
Chart Label Description
<host>, <resource pool>, or<virtual machine>
Amount of CPU actively used by the host, resource pool, or virtual machine in the cluster.
n Counter: usagemhz
n Stats Type: Rate
n Unit: MegaHertz (MHz)
n Rollup Type: Average (Minimum/Maximum)
n Collection Level: 1 (4)
Chart Analysis
A short spike in CPU usage indicates that you are making the best use of cluster resources. However, ifthe value is constantly high, the CPU demanded is likely greater than the CPU capacity available. A highCPU usage value can lead to increased ready time and processor queuing of the virtual machines on thehosts in the cluster.
If performance is impacted, consider taking the following actions.
Table 1-10. CPU Performance Enhancement Advice
# Resolution
1 Verify that VMware Tools is installed on each virtual machine.
2 If the cluster is not a DRS cluster, enable DRS. To enable DRS, perform the following tasks:
1 Select the cluster, and click the Configure tab.
2 Under Services, click vSphere DRS.
3 click Edit.
An Edit Cluster Settings dialog box opens.
4 Click Turn ON vSphere DRS, and click OK.
3 If the cluster is a DRS cluster:
n Increase the number of hosts, and migrate one or more virtual machines to the new host.
n Check the aggressiveness threshold. If the value is low, increase the threshold. This might help avoid hot spots in thecluster.
4 Migrate one or more virtual machines to a new host.
5 Upgrade the physical CPUs or cores on each host in the cluster if necessary.
vSphere Monitoring and Performance
VMware, Inc. 18

Table 1-10. CPU Performance Enhancement Advice (continued)
# Resolution
6 Enable CPU-saving features, such as TCP Segmentation Offload.
7 Replace software I/O with the dedicated hardware, such as iSCSI HBAs or TCP Segmentation Offload NICs.
Disk (KBps)The Disk (KBps) chart displays the disk I/O of the 10 hosts in the cluster with the most disk usage.
This chart is located in the Hosts view of the cluster Performance tab.
Table 1-11. Data Counters
Chart Label Description
host_name Average data I/O rate across all hosts in the cluster.
n Counter: usage
n Stats Type: Rate
n Unit: Kilobytes per second (KBps)
n Rollup Type: Average (Minimum/Maximum)
n Collection Level: 1 (4)
Chart Analysis
Use the disk charts to monitor average disk loads and to determine trends in disk usage. For example,you might notice a performance degradation with applications that frequently read from and write to thehard disk. If you see a spike in the number of disk read or write requests, check whether any suchapplications were running then.
The best ways to determine if your vSphere environment is experiencing disk problems is to monitor thedisk latency data counters. You can use the advanced performance charts to view these statistics.
n The kernelLatency data counter measures the average amount of time, in milliseconds, that theVMkernel spends processing each SCSI command. For best performance, the value must be 0 -1milliseconds. If the value is greater than 4 ms, the virtual machines on the host are trying to sendmore throughput to the storage system than the configuration supports. Check the CPU usage, andincrease the queue depth.
n The deviceLatency data counter measures the average amount of time, in milliseconds, to complete aSCSI command from the physical device. Depending on your hardware, a number greater than 15 msindicates probable problems with the storage array. Move the active VMDK to a volume with morespindles or add disks to the LUN.
n The queueLatency data counter measures the average amount of time taken per SCSI command inthe VMkernel queue. This value must always be zero. If not, the workload is too high and the arraycannot process the data fast enough.
If the disk latency values are high, or if you notice other problems with disk I/O performance, considertaking the following actions.
vSphere Monitoring and Performance
VMware, Inc. 19

Table 1-12. Disk I/O Performance Enhancement Advice
# Resolution
1 Increase the virtual machine memory. It allows more operating system caching, which reduces I/O activity. Note: It mightrequire you to increase the host memory. Increasing memory might reduce the need to store data because databases canutilize the system memory to cache data and avoid disk access.
To verify that virtual machines have adequate memory, check swap statistics in the guest operating system. Increase theguest memory, but not to an extent that leads to excessive host memory swapping. Install VMware Tools so that memoryballooning can occur.
2 Defragment the file systems on all guests.
3 Disable antivirus on-demand scans on the VMDK and VMEM files.
4 Use the vendor's array tools to determine the array performance statistics. When too many servers simultaneously accesscommon elements on an array, the disks might have trouble keeping up. To increase throughput, consider array-sideimprovements.
5 Use Storage vMotion to migrate I/O-intensive virtual machines across multiple hosts.
6 Balance the disk load across all physical resources available. Spread heavily used storage across LUNs that are accessedby different adapters. Use separate queues for each adapter to improve disk efficiency.
7 Configure the HBAs and RAID controllers for optimal use. Verify that the queue depths and cache settings on the RAIDcontrollers are adequate. If not, increase the number of outstanding disk requests for the virtual machine by adjusting theDisk.SchedNumReqOutstanding parameter. For more information, see vSphere Storage.
8 For resource-intensive virtual machines, separate the virtual machine's physical disk drive from the drive with the systempage file. It alleviates disk spindle contention during periods of high use.
9 On systems with sizable RAM, disable memory trimming by adding the line MemTrimRate=0 to the virtual machine's VMXfile.
10 If the combined disk I/O is higher than a single HBA capacity, use multipathing or multiple links.
11 For ESXi hosts, create virtual disks as preallocated. When you create a virtual disk for a guest operating system, selectAllocate all disk space now. The performance degradation associated with reassigning additional disk space does notoccur, and the disk is less likely to become fragmented.
12 Use the most current host hardware.
Memory (MB)The Memory (MB) chart displays consumed memory for the cluster. The chart appears only at collectionlevel 1.
This chart is located in the Home view of the cluster Performance tab.
vSphere Monitoring and Performance
VMware, Inc. 20

Table 1-13. Data Counters
Chart Label Description
Consumed Amount of host machine memory used by all powered on virtual machines in the cluster. A cluster'sconsumed memory consists of virtual machine consumed memory and overhead memory. It does notinclude host-specific overhead memory, such as memory used by the service console or VMkernel.
n Counter: consumed
n Stats Type: Absolute
n Unit: Megabytes (MB)
n Rollup Type: Average (Minimum/Maximum)
n Collection Level: 1 (4)
Total Total amount of machine memory of all hosts in the cluster that is available for virtual machine memory(physical memory for use by the Guest OS) and virtual machine overhead memory.
Memory Total = Aggregate host machine memory - (VMkernel memory + Service Console memory +other service memory)
Note The totalmb data counter is the same as the effectivemem data counter, which is supported onlyfor backward compatibility.
n Counter: totalmb
n Stats Type: Absolute
n Unit: Megabytes (MB)
n Rollup Type: Average (Minimum/Maximum)
n Collection Level: 1 (4)
Chart Analysis
Memory usage is not an indicator of performance problems. Memory can be high if a host is swapping orballooning, which can result in virtual machine guest swapping. In such cases, check for other problems,such as CPU over-commitment or storage latencies.
If you have constantly high memory usage in a cluster, resource pool, or vApp, consider taking thefollowing actions.
Table 1-14. Memory Performance Enhancement Advice
# Resolution
1 Verify that VMware Tools is installed on each virtual machine.
2 Verify that the balloon driver is enabled. The balloon driver is installed with VMware Tools and is critical to performance. TheVMkernel regularly reclaims unused virtual machine memory by ballooning and swapping. Generally, it does not impact virtualmachine performance.
3 If the balloon value is high, check the resource shares, reservations, and limits for the virtual machines and resource pools onthe hosts. Verify that the host's settings are adequate and not lower than those set for the virtual machine. If free memory isavailable on the hosts and the virtual machines are experiencing high swap or balloon memory, the virtual machine (orresource pool, if it belongs to one) has reached its resource limit. Check the maximum resource limit set on that host.
vSphere Monitoring and Performance
VMware, Inc. 21

Table 1-14. Memory Performance Enhancement Advice (continued)
# Resolution
4 If the cluster is not a DRS cluster, enable DRS. To enable DRS, perform the following tasks:
1 Select the cluster, and click the Configure tab.
2 Under Services, click vSphere DRS.
3 click Edit.
An Edit Cluster Settings dialog box opens.
4 Click Turn ON vSphere DRS, and click OK.
5 If the cluster is a DRS cluster:
n Increase the number of hosts, and migrate one or more virtual machines to the new host.
n Check the aggressiveness threshold. If the value is low, increase the threshold. It might help avoid hot spots in thecluster.
6 Add more physical memory to one or more hosts.
Memory (MB)The Memory (MB) chart displays memory data counters for clusters. The chart appears at all collectionlevels except level 1.
Description
This chart is located in the Home view of the cluster Performance tab.
Note These data counter definitions are for hosts. At the cluster level, the values are collected andtotaled. The counter values in the chart represent the aggregate amounts of the host data. The countersthat appear in the chart depend on the collection level set for your vCenter Server.
Table 1-15. Data Counters
Chart Label Description
Active Sum of the active guest physical memory of all powered on virtual machines on the host,plus memory used by basic VMkernel applications. Active memory is estimated by theVMkernel.
n Counter: active
n Stats Type: Absolute
n Unit: Megabytes (MB)
n Rollup Type: Average (Minimum/Maximum)
n Collection Level: 2 (4)
Balloon Sum of the guest physical memory reclaimed by the balloon driver for all powered on virtualmachines on the host.
n Counter: vmmemctl
n Stats Type: Absolute
n Unit: Megabytes (MB)
n Rollup Type: Average (Minimum/Maximum)
n Collection Level: 1 (4)
vSphere Monitoring and Performance
VMware, Inc. 22

Table 1-15. Data Counters (continued)
Chart Label Description
Consumed Amount of machine memory used on the host.
Consumed memory includes virtual machine memory, service console memory, andVMkernel memory.
consumed memory = total host memory - free host memory
n Counter: consumed
n Stats Type: Absolute
n Unit: Megabytes (MB)
n Rollup Type: Average (Minimum/Maximum)
n Collection Level: 1 (4)
Granted Sum of the guest physical memory granted for all powered on virtual machines. Grantedmemory is mapped to the host's machine memory.
Granted memory for a host includes the shared memory of each virtual machine on the host.
n Counter: granted
n Stats Type: Absolute
n Unit: Megabytes (MB)
n Rollup Type: Average (Minimum/Maximum)
n Collection Level: 2 (4)
Swap Used Sum of the memory swapped by all powered on virtual machines on the host.
n Counter: swapused
n Stats Type: Absolute
n Unit: Megabytes (MB)
n Rollup Type: Average (Minimum/Maximum)
n Collection Level: 2 (4)
Total Aggregate total memory available to the cluster.
n Counter: totalmb
n Stats Type: Absolute
n Unit: Megabytes (MB)
n Rollup Type: Average (Minimum/Maximum)
n Collection Level: 1 (4)
Chart Analysis
To ensure best performance, the host memory must be large enough to accommodate the active memoryof the virtual machines. The active memory can be smaller than the virtual machine memory size. Itallows you to over-provision memory, but still ensures that the virtual machine active memory is smallerthan the host memory.
Transient high-usage values usually do not cause performance degradation. For example, memory usagecan be high when several virtual machines are started at the same time or when a spike occurs in virtualmachine workload. However, a consistently high memory usage value (94% or greater) indicates that thehost is probably lacking the memory required to meet the demand. If the active memory size is the sameas the granted memory size, the demand for memory is greater than the memory resources available. Ifthe active memory is consistently low, the memory size might be too large.
vSphere Monitoring and Performance
VMware, Inc. 23

If the memory usage value is high, and the host has high ballooning or swapping, check the amount offree physical memory on the host. A free memory value of 6% or less indicates that the host cannothandle the demand for memory. It leads to memory reclamation, which might degrade performance.
If the host has enough free memory, check the resource shares, reservation, and limit settings of thevirtual machines and resource pools on the host. Verify that the host settings are adequate and not lowerthan those set for the virtual machines.
If the host has little free memory available, or if you notice a degradation in performance, consider takingthe following actions.
Table 1-16. Memory Performance Enhancement Advice
# Resolution
1 Verify that VMware Tools is installed on each virtual machine. The balloon driver is installed with VMware Tools and is criticalto performance.
2 Verify that the balloon driver is enabled. The VMkernel regularly reclaims unused virtual machine memory by ballooning andswapping. Generally, it does not impact virtual machine performance.
3 Reduce the memory space on the virtual machine, and correct the cache size if it is too large. This frees up memory for othervirtual machines.
4 If the memory reservation of the virtual machine is set to a value much higher than its active memory, decrease thereservation setting so that the VMkernel can reclaim the idle memory for other virtual machines on the host.
5 Migrate one or more virtual machines to a host in a DRS cluster.
6 Add physical memory to the host.
Memory ConsumedThe Memory Consumed chart displays memory usage for the 10 child objects in the cluster with the mostconsumed memory.
For resource pools and virtual machines in a cluster, this chart is located in the Resource Pools &Virtual Machines view of the cluster Performance tab. For hosts in a cluster, this chart is located in theHosts view of the cluster Performance tab.
Table 1-17. Data Counters
Chart Label Description
resource_pool,virtual_machine, orhost
Amount of machine memory used by all resource pools and virtual machines in the cluster or by all hostsin the cluster, depending on the cluster view.
Consumed memory includes virtual machine memory, service console memory, and VMkernel memory.
consumed memory = total host memory - free host memory
n Counter: consumed
n Stats Type: Absolute
n Unit: MegaBytes (MB)
n Rollup Type: Average (Minimum/Maximum)
n Collection Level: 1 (4)
vSphere Monitoring and Performance
VMware, Inc. 24

Chart Analysis
Memory usage is not an indicator of performance problems. Memory can be high if a host is swapping orballooning, which can result in virtual machine guest swapping. In such cases, check for other problems,such as CPU over-commitment or storage latencies.
If you have constantly high memory usage in a cluster, resource pool, or vApp, consider taking thefollowing actions.
Table 1-18. Memory Performance Enhancement Advice
# Resolution
1 Verify that VMware Tools is installed on each virtual machine.
2 Verify that the balloon driver is enabled. The balloon driver is installed with VMware Tools and is critical to performance. TheVMkernel regularly reclaims unused virtual machine memory by ballooning and swapping. Generally, it does not impact virtualmachine performance.
3 If the balloon value is high, check the resource shares, reservations, and limits for the virtual machines and resource pools onthe hosts. Verify that the host's settings are adequate and not lower than those set for the virtual machine. If free memory isavailable on the hosts and the virtual machines are experiencing high swap or balloon memory, the virtual machine (orresource pool, if it belongs to one) has reached its resource limit. Check the maximum resource limit set on that host.
4 If the cluster is not a DRS cluster, enable DRS. To enable DRS, perform the following tasks:
1 Select the cluster, and click the Configure tab.
2 Under Services, click vSphere DRS.
3 click Edit.
An Edit Cluster Settings dialog box opens.
4 Click Turn ON vSphere DRS, and click OK.
5 If the cluster is a DRS cluster:
n Increase the number of hosts, and migrate one or more virtual machines to the new host.
n Check the aggressiveness threshold. If the value is low, increase the threshold. It might help avoid hot spots in thecluster.
6 Add more physical memory to one or more hosts.
Network (Mbps)The Network (Mbps) chart displays network speed for the 10 hosts in the cluster with the most networkusage.
This chart is located in the Hosts view of the Cluster Performance tab.
Table 1-19. Data Counters
Chart Label Description
<host> Average rate at which data is transmitted and received across all NIC instances on the host.
n Counter: usage
n Stats Type: Rate
n Unit: Megabits per second (Mbps)
n Rollup Type: Average (Minimum/Maximum)
n Collection Level: 1 (4)
vSphere Monitoring and Performance
VMware, Inc. 25

Chart Analysis
Network performance depends on the application workload and network configuration. Dropped networkpackets indicate a bottleneck in the network. To determine whether packets are being dropped, useesxtop or the advanced performance charts to examine the droppedTx and droppedRx network countervalues.
If packets are being dropped, adjust the virtual machine shares. If packets are not being dropped, checkthe size of the network packets and the data receive and transfer rates. In general, the larger the networkpackets, the faster the network speed. When the packet size is large, fewer packets are transferred,which reduces the amount of CPU required to process the data. When network packets are small, morepackets are transferred but the network speed is slower because more CPU is required to process thedata.
Note In some instances, large packets might result in a high network latency. To check the networklatency, use the VMware AppSpeed performance monitoring application or a third-party application.
If packets are not being dropped and the data receive rate is slow, the host is probably lacking the CPUresources required to handle the load. Check the number of virtual machines assigned to each physicalNIC. If necessary, perform load balancing by moving virtual machines to different vSwitches or by addingmore NICs to the host. You can also move virtual machines to another host or increase the host CPU orvirtual machine CPU.
If you experience network-related performance problems, also consider taking the following actions.
Table 1-20. Networking Performance Enhancement Advice
# Resolution
1 Verify that VMware Tools is installed on each virtual machine.
2 If possible, use vmxnet3 NIC drivers, which are available with VMware Tools. They are optimized for high performance.
3 If virtual machines running on the same host communicate with each other, connect them to the same vSwitch to avoidtransferring packets over the physical network.
4 Assign each physical NIC to a port group and a vSwitch.
5 Use separate physical NICs to handle the different traffic streams, such as network packets generated by virtual machines,iSCSI protocols, vMotion tasks.
6 Ensure that the physical NIC capacity is large enough to handle the network traffic on that vSwitch. If the capacity is notenough, consider using a high-bandwidth physical NIC (10 Gbps). Alternatively, consider moving some virtual machines to avSwitch with a lighter load or to a new vSwitch.
7 If packets are being dropped at the vSwitch port, increase the virtual network driver ring buffers where applicable.
8 Verify that the reported speed and duplex settings for the physical NIC match the hardware expectations and that thehardware is configured to run at its maximum capability. For example, verify that NICs with 1 Gbps are not reset to 100 Mbpsbecause they are connected to an older switch.
9 Verify that all NICs are running in full duplex mode. Hardware connectivity problems might result in a NIC resetting itself to alower speed or half duplex mode.
10 Use vNICs that are TCP Segmentation Offload (TSO)-capable, and verify that TSO-Jumbo Frames are enabled wherepossible.
vSphere Monitoring and Performance
VMware, Inc. 26

Data centersThe data center charts contain information about CPU, disk, memory, and storage usage for data centers.The help topic for each chart contains information about the data counters displayed in that chart. Thecounters available are determined by the collection level set for vCenter Server.
CPU (MHz)The CPU (MHz) chart displays CPU usage for the 10 clusters in the data center with the most CPUusage.
This chart is located in the Clusters view of the Datacenters Performance tab.
Table 1-21. Data Counters
Chart Label Description
<cluster> Amount of CPU currently in use by the cluster. The active CPU usage is approximately equal to the ratio ofthe used CPU cycles to the available CPU cycles.
The maximum possible value is the frequency of the processors multiplied by the number of cores. Forexample, a two-way SMP virtual machine using 4000MHz on a host that has four 2GHz processors is using50% of the CPU (4000 ÷ 4 × 2000) = 0.5).
n Counter: usagemhz
n Stats Type: Rate
n Unit: MegaHertz (MHz)
n Rollup Type: Average (Minimum/Maximum)
n Collection Level: 1 (4)
Chart Analysis
A short spike in CPU usage indicates that you are making the best use of cluster resources. However, ifthe value is constantly high, the CPU demanded is likely greater than the CPU capacity available. A highCPU usage value can lead to increased ready time and processor queuing of the virtual machines on thehosts in the cluster.
If performance is impacted, consider taking the following actions.
Table 1-22. CPU Performance Enhancement Advice
# Resolution
1 Verify that VMware Tools is installed on each virtual machine.
2 If the cluster is not a DRS cluster, enable DRS. To enable DRS, perform the following tasks:
1 Select the cluster, and click the Configure tab.
2 Under Services, click vSphere DRS.
3 click Edit.
An Edit Cluster Settings dialog box opens.
4 Click Turn ON vSphere DRS, and click OK.
3 If the cluster is a DRS cluster:
n Increase the number of hosts, and migrate one or more virtual machines to the new host.
n Check the aggressiveness threshold. If the value is low, increase the threshold. This might help avoid hot spots in thecluster.
vSphere Monitoring and Performance
VMware, Inc. 27

Table 1-22. CPU Performance Enhancement Advice (continued)
# Resolution
4 Migrate one or more virtual machines to a new host.
5 Upgrade the physical CPUs or cores on each host in the cluster if necessary.
6 Enable CPU-saving features, such as TCP Segmentation Offload.
7 Replace software I/O with the dedicated hardware, such as iSCSI HBAs or TCP Segmentation Offload NICs.
Memory (MB)The Memory (MB) chart displays the average amount of consumed memory for the 10 clusters in the datacenter with the most consumed memory.
This chart is located in the Clusters view of the Datacenters Performance tab.
Table 1-23. Data Counters
Chart Label Description
<cluster> Amount of host machine memory used by all powered on virtual machines in the cluster.
n Counter: consumed
n Stats Type: Absolute
n Unit: MegaBytes (MB)
n Rollup Type: Average (Minimum/Maximum)
n Collection Level: 1 (4)
Chart Analysis
A cluster's consumed memory consists of virtual machine consumed memory and overhead memory. Itdoes not include host-specific overhead memory, such as memory used by the service console orVMkernel.
If you experience problems with cluster memory usage, use the thumbnail cluster charts to examinememory usage for each cluster and increase memory resources if needed.
If the cluster is a DRS cluster, check the aggressiveness threshold. If the value is low, increase thethreshold. Increasing the threshold might help avoid hot spots in the cluster.
Space used by Datastore in GBThe Space used by Datastore in GB chart displays the 10 datastores in the data center with the mostused disk space.
This chart is located in the Storage view of the Datacenter Performance tab.
vSphere Monitoring and Performance
VMware, Inc. 28

Table 1-24. Data Counters
Chart Label Description
<datastore> Amount of used storage space on the 10 datastores with the most used space.
n Counter: used
n Stats Type: Absolute
n Unit: GigaBytes (GB)
n Rollup Type: Latest
n Collection Level: 1
Chart Analysis
The datastore is at full capacity when the used space is equal to the capacity. Allocated space can belarger than datastore capacity, for example, when you have snapshots and thin-provisioned disks. Ifpossible, you can provision more space to the datastore, or you can add disks to the datastore or useshared datastores.
If snapshot files are consuming high datastore space, consider consolidating them to the virtual disk whenthey are no longer needed. Consolidating the snapshots deletes the redo log files and removes thesnapshots from the vSphere Web Client user interface. For information about consolidating the datacenter, see the vSphere documentation.
Space Utilization By File TypeThe Space Utilization By File Type chart displays datastore space usage for virtual disks, swap files,snapshot files, and other virtual machine files.
Note This chart does not show historical statistics. It only shows the most recently available data, whichmay be up to 30 minutes late, depending on when the last statistics rollup occurred. In addition, statisticsare not collected across all datastores at one time. They are collected asynchronously.
The Space Utilization by File Type chart is located in the Storage view of the data center Performancetab.
vSphere Monitoring and Performance
VMware, Inc. 29

Datastore Counters
Table 1-25. Data Counters
File Type Description
Virtual Disks Amount of disk space used by virtual disk files.
Virtual disk files store the contents of the virtual machine's hard disk drive. It includes information that youwrite to a virtual machine's hard disk, such as the operating system, program files, and data files. The fileshave the extension .vmdk and appear as a physical disk drive to a guest operating system.
Note Delta disks, which also have an extension .vmdk, are not included in this file type.
n Counter: used
n Stats Type: Absolute
n Unit: Gigabytes (GB)
n Rollup Type: Latest
n Collection Level: 1 (4)
Swap Files Amount of disk space used by swap files.
Swap files back up the virtual machine's physical memory.
n Counter: used
n Stats Type: Absolute
n Unit: Gigabytes (GB)
n Rollup Type: Latest
n Collection Level: 1 (4)
Snapshots Amount of disk space used by virtual machine snapshot files.
Snapshot files store information about virtual machine snapshots. They include snapshot state files anddelta disk files. A snapshot state file stores the running state of the virtual machine at the time of thesnapshot. It has the extension .vmsn. A delta disk file stores the updates made by the virtual machine tothe virtual disks after a snapshot is taken.
n Counter: used
n Stats Type: Absolute
n Unit: Gigabytes (GB)
n Rollup Type: Latest
n Collection Level: 1 (4)
Other VM Files Amount of disk space used by all other virtual machine files, such as configuration files and log files.
n Counter: used
n Stats Type: Absolute
n Unit: Gigabytes (GB)
n Rollup Type: Latest
n Collection Level: 1 (4)
Other Amount of disk space used by all other non-virtual machine files, such as documentation files and backupfiles.
Free Space Amount of disk space not currently in use.
Total Space Amount of disk space available to the datastore. It defines the datastore capacity. The chart displays theinformation for datastores but not for data centers.
total space = virtual disk space + swap file space + snapshot space + other VM file space + other space +free space
vSphere Monitoring and Performance
VMware, Inc. 30

Chart Analysis
The datastore is at full capacity when the used space is equal to the capacity. Allocated space can belarger than datastore capacity, for example, when you have snapshots and thin-provisioned disks. Ifpossible, you can provision more space to the datastore, or you can add disks to the datastore or useshared datastores.
If snapshot files are consuming high datastore space, consider consolidating them to the virtual disk whenthey are no longer needed. Consolidating the snapshots deletes the redo log files and removes thesnapshots from the vSphere Web Client user interface. For information about consolidating the datacenter, see the vSphere documentation.
Datastores and Datastore ClustersThe datastore charts contain information about disk usage for datastores or the datastores that are part ofa cluster. The help topic for each chart contains information about the data counters displayed in thatchart. The counters available are determined by the collection level set for vCenter Server.
Space in GBThe Space in GB chart displays space usage data counters for datastores.
This chart is located in the Space view of the datastore or datastore cluster Performance tab.
vSphere Monitoring and Performance
VMware, Inc. 31

Table 1-26. Data Counters
Chart Label Description
Allocated Amount of physical space provisioned by an administrator for the datastore. It is the storage size up towhich files on the datastore can grow. Allocated space is not always in use.
n Counter: provisioned
n Stats Type: Absolute
n Unit: Gigabytes (GB)
n Rollup Type: Latest
n Collection Level: 1
Used Amount of physical datastore space in use.
n Counter: used
n Stats Type: Absolute
n Unit: Gigabytes (GB)
n Rollup Type: Latest
n Collection Level: 1
Capacity Maximum capacity of the datastore.
capacity = virtual machine file space + non-virtual machine file space + free space
Note Storage data is collected and updated in the overview charts every 30 minutes. Therefore, if yourefresh the datastore, the capacity value might only be updated in the datastore Summary tab, and not inthe overview charts.
n Counter: capacity
n Stats Type: Absolute
n Unit: Gigabytes (GB)
n Rollup Type: Latest
n Collection Level: 1
Chart Analysis
The datastore is at full capacity when the used space is equal to the capacity. Allocated space can belarger than datastore capacity, for example, when you have snapshots and thin-provisioned disks. Ifpossible, you can provision more space to the datastore, or you can add disks to the datastore or useshared datastores.
If snapshot files are consuming high datastore space, consider consolidating them to the virtual disk whenthey are no longer needed. Consolidating the snapshots deletes the redo log files and removes thesnapshots from the vSphere Web Client user interface. For information about consolidating the datacenter, see the vSphere documentation.
Space Utilization By File TypeThe Space Utilization by File Type chart displays space used by virtual disks, swap files, snapshot files,and other virtual machine files on the datastore or the datastore cluster.
Note This chart does not show historical statistics. It only shows the most recently available data, whichmay be up to 30 minutes late, depending on when the last statistics rollup occurred. In addition, statisticsare not collected across all datastores at one time. They are collected asynchronously.
vSphere Monitoring and Performance
VMware, Inc. 32

The Space Utilization by File Type chart is located in the Storage view of the datastore Performance tab.The counters can also be displayed for datastore cluster charts.
Datastore Counters
Table 1-27. Data Counters
File Type Description
Virtual Disks Amount of disk space used by virtual disk files.
Virtual disk files store the contents of the virtual machine's hard disk drive. It includes information that youwrite to a virtual machine's hard disk, such as the operating system, program files, and data files. The fileshave the extension .vmdk and appear as a physical disk drive to a guest operating system.
Note Delta disks, which also have an extension .vmdk, are not included in this file type.
n Counter: used
n Stats Type: Absolute
n Unit: Gigabytes (GB)
n Rollup Type: Latest
n Collection Level: 1 (4)
Swap Files Amount of disk space used by swap files.
Swap files back up the virtual machine's physical memory.
n Counter: used
n Stats Type: Absolute
n Unit: Gigabytes (GB)
n Rollup Type: Latest
n Collection Level: 1 (4)
Snapshots Amount of disk space used by virtual machine snapshot files.
Snapshot files store information about virtual machine snapshots. They include snapshot state files anddelta disk files. A snapshot state file stores the running state of the virtual machine at the time of thesnapshot. It has the extension .vmsn. A delta disk file stores the updates made by the virtual machine tothe virtual disks after a snapshot is taken.
n Counter: used
n Stats Type: Absolute
n Unit: Gigabytes (GB)
n Rollup Type: Latest
n Collection Level: 1 (4)
Other VM Files Amount of disk space used by all other virtual machine files, such as configuration files and log files.
n Counter: used
n Stats Type: Absolute
n Unit: Gigabytes (GB)
n Rollup Type: Latest
n Collection Level: 1 (4)
Other Amount of disk space used by all other non-virtual machine files, such as documentation files and backupfiles.
vSphere Monitoring and Performance
VMware, Inc. 33

Table 1-27. Data Counters (continued)
File Type Description
Free Space Amount of disk space not currently in use.
Total Space Amount of disk space available to the datastore. It defines the datastore capacity. The chart displays theinformation for datastores but not for data centers.
total space = virtual disk space + swap file space + snapshot space + other VM file space + other space +free space
Chart Analysis
The datastore is at full capacity when the used space is equal to the capacity. Allocated space can belarger than datastore capacity, for example, when you have snapshots and thin-provisioned disks. Ifpossible, you can provision more space to the datastore, or you can add disks to the datastore or useshared datastores.
If snapshot files are consuming high datastore space, consider consolidating them to the virtual disk whenthey are no longer needed. Consolidating the snapshots deletes the redo log files and removes thesnapshots from the vSphere Web Client user interface. For information about consolidating the datacenter, see the vSphere documentation.
Space used by Datastore in GBThe Space used by Datastore in GB chart displays the 10 datastores in the data center with the mostused disk space.
This chart is located in the Storage view of the Datacenter Performance tab.
Table 1-28. Data Counters
Chart Label Description
<datastore> Amount of used storage space on the 10 datastores with the most used space.
n Counter: used
n Stats Type: Absolute
n Unit: GigaBytes (GB)
n Rollup Type: Latest
n Collection Level: 1
Chart Analysis
The datastore is at full capacity when the used space is equal to the capacity. Allocated space can belarger than datastore capacity, for example, when you have snapshots and thin-provisioned disks. Ifpossible, you can provision more space to the datastore, or you can add disks to the datastore or useshared datastores.
If snapshot files are consuming high datastore space, consider consolidating them to the virtual disk whenthey are no longer needed. Consolidating the snapshots deletes the redo log files and removes thesnapshots from the vSphere Web Client user interface. For information about consolidating the datacenter, see the vSphere documentation.
vSphere Monitoring and Performance
VMware, Inc. 34

Space Utilization by Virtual MachineThe Space Utilization by Virtual Machine chart displays the amount of space used by the five virtualmachines with the most space used on the datastore or the datastores in the cluster.
Note This chart does not show historical statistics. It only shows the most recently available data, whichmay be up to 30 minutes late, depending on when the last statistics rollup occurred. In addition, statisticsare not collected across all datastores at one time. They are collected asynchronously.
The Space Utilization by Virtual Machine chart is located in the Space view of the datastore Performancetab. The counter can also be displayed for datastore cluster charts.
Table 1-29. Data Counters
Chart Label Description
virtual_machine Amount of datastore space used by the five virtual machines with the most used datastorespace.
n Counter: used
n Stats Type: Absolute
n Unit: Gigabytes (GB)
n Rollup Type: Latest
n Collection Level: 1
Chart Analysis
The datastore is at full capacity when the used space is equal to the capacity. Allocated space can belarger than datastore capacity, for example, when you have snapshots and thin-provisioned disks. Ifpossible, you can provision more space to the datastore, or you can add disks to the datastore or useshared datastores.
If snapshot files are consuming high datastore space, consider consolidating them to the virtual disk whenthey are no longer needed. Consolidating the snapshots deletes the redo log files and removes thesnapshots from the vSphere Web Client user interface. For information about consolidating the datacenter, see the vSphere documentation.
Space Allocated by Datastore in GBThe Space allocated by Datastore in GB displays the top 10 datastores, virtual machines in the datastore-cluster with most provisioned space.
This chart is located in the Space view of the Datacenter Performance tab.
vSphere Monitoring and Performance
VMware, Inc. 35

Table 1-30. Data Counters
Chart Label Description
<datastore> Amount of provisioned storage space on the top 10 datastores with the most provisionedspace.
n Counter: provisioned
n Stats Type: Absolute
n Unit: KiloBytes (KB)
n Rollup Type: Latest
n Collection Level: 1
Chart Analysis
The datastore is at full capacity when the used space is equal to the capacity. Allocated space can belarger than datastore capacity, for example, when you have snapshots and thin-provisioned disks. Ifpossible, you can provision more space to the datastore, or you can add disks to the datastore or useshared datastores.
If snapshot files are consuming high datastore space, consider consolidating them to the virtual disk whenthey are no longer needed. Consolidating the snapshots deletes the redo log files and removes thesnapshots from the vSphere Web Client user interface. For information about consolidating the datacenter, see the vSphere documentation.
Space Capacity by Datastore in GBThe Space capacity by Datastore in GB displays the top 10 configured size of the datastores in thedatastore cluster.
This chart is located in the Space view of the Datacenter Performance tab.
Table 1-31. Data Counters
Chart Label Description
<datastore> Configured size of the datastores in the datastore cluster.
n Counter: capacity
n Stats Type: Absolute
n Unit: KiloBytes (KB)
n Rollup Type: Latest
n Collection Level: 1
Chart Analysis
The datastore is at full capacity when the used space is equal to the capacity. Allocated space can belarger than datastore capacity, for example, when you have snapshots and thin-provisioned disks. Ifpossible, you can provision more space to the datastore, or you can add disks to the datastore or useshared datastores.
vSphere Monitoring and Performance
VMware, Inc. 36

If snapshot files are consuming high datastore space, consider consolidating them to the virtual disk whenthey are no longer needed. Consolidating the snapshots deletes the redo log files and removes thesnapshots from the vSphere Web Client user interface. For information about consolidating the datacenter, see the vSphere documentation.
Storage I/O Control Normalized LatencyThis chart displays the normalized latency in microseconds on the datastore. Storage I/O Controlmonitors latency to detect congestion on the datastore. This metric computes a weighted response timeacross all hosts and VMs accessing the datastore. I/O count is used as the weight for the response time.It captures the device level latency and does not include any queuing inside the hypervisor storage stackor inside the VM. It is adjusted for the I/O size. High latencies that are the result of large I/Os arediscounted so as not to make the datastore seem slower than it really is. Data for all virtual machines iscombined. This chart displays zero values when Storage I/O Control is disabled.
This chart is located in the Performance view of the datastore Performance tab. ThesizeNormalizedDatastoreLatency counter can also be displayed for datastore cluster charts.
Table 1-32. Data Counters
Chart Label Description
Storage I/O ControlNormalized Latency
Storage I/O Control monitors latency to detect congestion on the datastore.
n Counter: sizeNormalizedDatastoreLatency
n Stats Type: Absolute
n Unit: Microseconds
n Rollup Type: Average
n Collection Level: 3
Storage I/O Control Aggregate IOPsThis chart displays the number of I/O operations per one second on the datastore, aggregated across allhosts, and virtual machines accessing this datastore. The chart displays zero values when Storage I/OControl is disabled.
This chart is located in the Performance view of the datastore or the datastore cluster Performance tab.The counter can be displayed for datastore and datastore cluster charts.
Table 1-33. Data Counters
Chart Label Description
Storage I/O Control Aggregate IOPs Number of I/O operations per second on the datastore, aggregated across all hosts, andvirtual machines accessing the datastore.
n Counter: datastoreIops
n Stats Type: Absolute
n Unit: Number
n Rollup Type: Average
n Collection Level: 3
vSphere Monitoring and Performance
VMware, Inc. 37

Storage I/O Control ActivityThis chart displays the percentage of time during which Storage I/O Control actively controlled latency ofthe datastore.
This chart is located in the Performance views of the datastore Performance tabs. The counter can alsobe displayed for datastore cluster charts.
Table 1-34. Data Counters
Chart Label Description
Storage I/O ControlActivity
This is the percentage of time during which the Storage I/O Control actively controlled the I/O latencyfor the datastore.
n Counter: siocActiveTimePercentage
n Stats Type: Absolute
n Unit: Percent
n Rollup Type: Average
n Collection Level: 3
Average Device Latency per HostThis chart displays the average amount of latency on a host device. The chart displays the 10 hosts withthe highest device latency.
This chart is located in the Performance view of the datastore Performance tab.
Table 1-35. Data Counters
Chart Label Description
Average Device Latencyper Host
Measures the amount of time, in milliseconds, to complete a SCSI command issued from the physicaldevice.
n Counter: deviceLatency
n Stats Type: Absolute
n Unit: Milliseconds (ms)
n Rollup Type: Average
n Collection Level: 3
Maximum Queue Depth per HostThis chart displays maximum queue depth that hosts are currently maintaining for the datastore. WhenStorage I/O is enabled, queue depth can change over time when congestion is detected at the array.
This chart is located in the Performance view of the datastore Performance tab. The chart displaysinformation about the ten hosts with the highest values.
vSphere Monitoring and Performance
VMware, Inc. 38

Table 1-36. Data Counters
Chart Label Description
Max Queue Depth per Host Maximum queue depth. Queue depth is the number of commands the SCSI driver queues tothe HBA.
n Counter: maxQueueDepth
n Stats Type: Absolute
n Unit: Number
n Rollup Type: Average
n Collection Level: 3
Read IOPs per HostThis chart displays the per-host disk read rates for a datastore. The chart displays information about theten hosts with the highest values.
This chart is located in the Performance view of the datastore Performance tab.
Table 1-37. Data Counters
Chart Label Description
Read IOPs per Host Number of disk read commands completed on each disk on the host, per second.
Read rate = blocks read per second × block size
n Counter: numberReadAveraged
n Stats Type: Rate
n Unit: Number
n Rollup Type: Average
n Collection Level: 3
Write IOPs Per HostThis chart displays the per-host disk write rates for a datastore. The chart displays information about the10 hosts with the highest values.
This chart is located in the Performance view of the datastore Performance tab.
Table 1-38. Data Counters
Chart Label Description
Write IOPs per Host Number of disk write commands completed on each disk on the host, per second.
Write rate = blocks written per second × block size
n Counter: numberWriteAveraged
n Stats Type: Rate
n Unit: Number
n Rollup Type: Average
n Collection Level: 3
vSphere Monitoring and Performance
VMware, Inc. 39

Average Read Latency per Virtual Machine DiskThis chart displays the top ten virtual machine disks with the highest average read latency in milliseconds.Data is not displayed when the virtual machine is powered off.
This chart is located in the Performance view of the datastore Performance tab. The counter can alsobe displayed for datastore cluster charts.
Table 1-39. Data Counters
Chart Label Description
Average Read Latencyper Virtual Machine Disk
Latency measures the time used to process a SCSI command issued by the guest OS to the virtualmachine. The kernel latency is the time VMkernel takes to process an I/O request. The device latencyis the time it takes the hardware to handle the request.
Total latency = kernelLatency + deviceLatency.
n Counter: totalReadLatency
n Stats Type: Absolute
n Unit: Milliseconds (ms)
n Rollup Type: Average
n Collection Level: 3
Average Write Latency per Virtual Machine DiskThis chart displays the top ten virtual machine disks with the highest average write latency inmilliseconds. Data is not displayed when the virtual machine is powered off.
This chart is located in the Performance view of the datastore Performance tab. The counter can alsobe displayed for datastore cluster charts.
Table 1-40. Data Counters
Chart Label Description
Average Write Latencyper Virtual Machine Disk
Latency measures the time used to process a SCSI command issued by the guest OS to the virtualmachine. The kernel latency is the time VMkernel takes to process an I/O request. The device latencyis the time it takes the hardware to handle the request.
Total latency = kernelLatency + deviceLatency.
n Counter: totalWriteLatency
n Stats Type: Absolute
n Unit: Milliseconds (ms)
n Rollup Type: Average
n Collection Level: 3
Read IOPs per Virtual Machine DiskThis chart displays the top ten virtual machines with the highest number of read operations. Data is notdisplayed when the virtual machine is powered off.
This chart is located in the Performance view of the datastore Performance tab. The counter can alsobe displayed for datastore cluster charts.
vSphere Monitoring and Performance
VMware, Inc. 40

Table 1-41. Data Counters
Chart Label Description
Read IOPs per VirtualMachine Disk
Number of disk read commands completed on each virtual machine disk, per second.
Read rate = blocks read per second × block size
n Counter: numberReadAveraged
n Stats Type: Rate
n Unit: Number
n Rollup Type: Average
n Collection Level: 3
Write IOPs Per Virtual Machine DiskThis chart displays the 10 virtual machines with the highest number of write operations. Data is notdisplayed when the virtual machine is powered off.
This chart is located in the Performance view of the datastore Performance tab. The counter can alsobe displayed for datastore cluster charts.
Table 1-42. Data Counters
Chart Label Description
Write IOPs per VirtualMachine Disk
Number of disk write commands completed on each virtual machine disk on the host.
Write rate = blocks read per second × block size
n Counter: numberWriteAveraged
n Stats Type: Rate
n Unit: Number
n Rollup Type: Average
n Collection Level: 3
Virtual Machine Observed Latency per DatastoreThis chart displays the average datastore latency as observed by the virtual machines.
This chart is located in the Performance view of the datastore cluster Performance tab.
Table 1-43. Data Counters
Chart Label Description
VM observed latencyreport per Datastore
This is the average datastore latency as observed by the virtual machines in the datastore cluster.
n Counter: datastoreVMObservedLatency
n Stats Type: Absolute
n Unit: Microseconds
n Rollup Type: Latest
n Collection Level: 3
vSphere Monitoring and Performance
VMware, Inc. 41

HostsThe hosts charts contain information about CPU, disk, memory, network, and storage usage for hosts.The help topic for each chart contains information about the data counters displayed in that chart. Thecounters available are determined by the collection level set for vCenter Server.
CPU (%)The CPU (%) chart displays CPU usage for the host.
This chart is located in the Home view of the Host Performance tab.
Table 1-44. Data Counters
Chart Label Description
Usage Actively used CPU, as a percentage of the total available CPU, for each physicalCPU on the host.
Active CPU is approximately equal to the ratio of the used CPU to the available CPU.
Available CPU = # of physical CPUs × clock rate.
100% represents all CPUs on the host. For example, if a four-CPU host is running avirtual machine with two CPUs, and the usage is 50%, the host is using two CPUscompletely.
n Counter: usage
n Stats Type: Rate
n Unit: Percentage (%)
n Rollup Type: Average (Minimum/Maximum)
n Collection Level: 1 (4)
Chart Analysis
A short spike in CPU usage indicates that you are making the best use of the host resources. However, ifthe value is constantly high, the host is probably lacking the CPU required to meet the demand. A highCPU usage value can lead to increased ready time and processor queuing of the virtual machines on thehost.
If performance is impacted, consider taking the following actions.
Table 1-45. CPU Performance Enhancement Advice
# Resolution
1 Verify that VMware Tools is installed on every virtual machine on the host.
2 Set the CPU reservations for all high-priority virtual machines to guarantee that they receive the CPU cycles required.
3 Reduce the number of virtual CPUs on a virtual machine to only the number required to execute the workload. For example, asingle-threaded application on a four-way virtual machine only benefits from a single vCPU. But the hypervisor's maintenanceof the three idle vCPUs takes CPU cycles that could be used for other work.
4 If the host is not already in a DRS cluster, add it to one. If the host is in a DRS cluster, increase the number of hosts andmigrate one or more virtual machines onto the new host.
vSphere Monitoring and Performance
VMware, Inc. 42

Table 1-45. CPU Performance Enhancement Advice (continued)
# Resolution
5 Upgrade the physical CPUs or cores on the host if necessary.
6 Use the newest version of hypervisor software, and enable CPU-saving features such as TCP Segmentation Offload, largememory pages, and jumbo frames.
CPU (MHz)The CPU (MHz) chart displays CPU usage for the host.
This chart is located in the Home view of the Host Performance tab.
Table 1-46. Data Counters
Chart Label Description
Usage The sum, in megahertz, of the actively used CPU of all powered on virtual machineson a host.
The maximum possible value is the frequency of the processors multiplied by thenumber of processors. For example, if you have a host with four 2GHz CPUs running avirtual machine that is using 4000MHz, the host is using two CPUs completely.
4000 ÷ (4 × 2000) = 0.50
n Counter: usagemhz
n Stats Type: Rate
n Unit: MegaHertz (MHz)
n Rollup Type: Average (Minimum/Maximum)
n Collection Level: 1 (4)
Chart Analysis
A short spike in CPU usage indicates that you are making the best use of the host resources. However, ifthe value is constantly high, the host is probably lacking the CPU required to meet the demand. A highCPU usage value can lead to increased ready time and processor queuing of the virtual machines on thehost.
If performance is impacted, consider taking the following actions.
Table 1-47. CPU Performance Enhancement Advice
# Resolution
1 Verify that VMware Tools is installed on every virtual machine on the host.
2 Set the CPU reservations for all high-priority virtual machines to guarantee that they receive the CPU cycles required.
3 Reduce the number of virtual CPUs on a virtual machine to only the number required to execute the workload. For example, asingle-threaded application on a four-way virtual machine only benefits from a single vCPU. But the hypervisor's maintenanceof the three idle vCPUs takes CPU cycles that could be used for other work.
4 If the host is not already in a DRS cluster, add it to one. If the host is in a DRS cluster, increase the number of hosts andmigrate one or more virtual machines onto the new host.
vSphere Monitoring and Performance
VMware, Inc. 43

Table 1-47. CPU Performance Enhancement Advice (continued)
# Resolution
5 Upgrade the physical CPUs or cores on the host if necessary.
6 Use the newest version of hypervisor software, and enable CPU-saving features such as TCP Segmentation Offload, largememory pages, and jumbo frames.
CPU UsageThe CPU Usage chart displays CPU usage of the 10 virtual machines on the host with the most CPUusage.
This chart is located in the Virtual Machines view of the host Performance tab.
Table 1-48. Counters
Name Description
virtual_machine Amount of CPU actively being used by each virtual machine on the host. 100% represents all CPUs.
For example, if a virtual machine has one virtual CPU that is running on a host with four CPUs andthe CPU usage is 100%, the virtual machine is using one CPU resource.
virtual CPU usage = usagemhz ÷ (number of virtual CPUs × core frequency)
Note The host's view of the CPU usage, not the guest operating system view.
n Counter: usage
n Stats Type: Rate
n Unit: Percentage (%). Precision is to 1/100%. A value between 0 and 100.
n Rollup Type: Average (Minimum/Maximum)
n Collection Level: 1 (4)
Chart Analysis
A short spike in CPU usage or CPU ready indicates that you are making the best use of the virtualmachine resources. However, if the CPU usage value for a virtual machine is above 90% and the CPUready value is above 20%, performance is being impacted.
If performance is impacted, consider taking the following actions.
Table 1-49. CPU Performance Enhancement Advice
# Resolution
1 Verify that VMware Tools is installed on every virtual machine on the host.
2 Set the CPU reservations for all high-priority virtual machines to guarantee that they receive the CPU cycles required.
3 Compare the CPU usage value of a virtual machine with the CPU usage of other virtual machines on the host or in theresource pool. The stacked line chart on the host's Virtual Machine view shows the CPU usage for virtual machines on thehost.
4 Determine whether the high ready time for the virtual machine resulted from its CPU usage time reaching the CPU limitsetting. If so, increase the CPU limit on the virtual machine.
5 Increase the CPU shares to give the virtual machine more opportunities to run. The total ready time on the host might remainat the same level if the host system is constrained by CPU. If the host ready time doesn't decrease, set the CPU reservationsfor high-priority virtual machines to guarantee that they receive the required CPU cycles.
vSphere Monitoring and Performance
VMware, Inc. 44

Table 1-49. CPU Performance Enhancement Advice (continued)
# Resolution
6 Increase the amount of memory allocated to the virtual machine. This decreases disk and or network activity for applicationsthat cache. This might lower disk I/O and reduce the need for the host to virtualize the hardware. Virtual machines withsmaller resource allocations generally accumulate more CPU ready time.
7 Reduce the number of virtual CPUs on a virtual machine to only the number required to execute the workload. For example, asingle-threaded application on a four-way virtual machine only benefits from a single vCPU. But the hypervisor's maintenanceof the three idle vCPUs takes CPU cycles that could be used for other work.
8 If the host is not already in a DRS cluster, add it to one. If the host is in a DRS cluster, increase the number of hosts andmigrate one or more virtual machines onto the new host.
9 Upgrade the physical CPUs or cores on the host if necessary.
10 Use the newest version of hypervisor software, and enable CPU-saving features such as TCP Segmentation Offload, largememory pages, and jumbo frames.
Disk (KBps)The Disk (KBps) chart displays disk I/O of the host.
This chart is located in the Home view of the host Performance tab.
Table 1-50. Data Counters
Chart Label Description
Usage Average data I/O rate across all LUNs on the host.
n Counter: usage
n Stats Type: Rate
n Unit: Kilobytes per second (KBps)
n Rollup Type: Average (Minimum/Maximum)
n Collection Level: 1 (4)
Chart Analysis
Use the disk charts to monitor average disk loads and to determine trends in disk usage. For example,you might notice a performance degradation with applications that frequently read from and write to thehard disk. If you see a spike in the number of disk read or write requests, check whether any suchapplications were running then.
The best ways to determine if your vSphere environment is experiencing disk problems is to monitor thedisk latency data counters. You can use the advanced performance charts to view these statistics.
n The kernelLatency data counter measures the average amount of time, in milliseconds, that theVMkernel spends processing each SCSI command. For best performance, the value must be 0 -1milliseconds. If the value is greater than 4 ms, the virtual machines on the host are trying to sendmore throughput to the storage system than the configuration supports. Check the CPU usage, andincrease the queue depth.
vSphere Monitoring and Performance
VMware, Inc. 45

n The deviceLatency data counter measures the average amount of time, in milliseconds, to complete aSCSI command from the physical device. Depending on your hardware, a number greater than 15 msindicates probable problems with the storage array. Move the active VMDK to a volume with morespindles or add disks to the LUN.
n The queueLatency data counter measures the average amount of time taken per SCSI command inthe VMkernel queue. This value must always be zero. If not, the workload is too high and the arraycannot process the data fast enough.
If the disk latency values are high, or if you notice other problems with disk I/O performance, considertaking the following actions.
Table 1-51. Disk I/O Performance Enhancement Advice
# Resolution
1 Increase the virtual machine memory. It allows more operating system caching, which reduces I/O activity. Note: It mightrequire you to increase the host memory. Increasing memory might reduce the need to store data because databases canutilize the system memory to cache data and avoid disk access.
To verify that virtual machines have adequate memory, check swap statistics in the guest operating system. Increase theguest memory, but not to an extent that leads to excessive host memory swapping. Install VMware Tools so that memoryballooning can occur.
2 Defragment the file systems on all guests.
3 Disable antivirus on-demand scans on the VMDK and VMEM files.
4 Use the vendor's array tools to determine the array performance statistics. When too many servers simultaneously accesscommon elements on an array, the disks might have trouble keeping up. To increase throughput, consider array-sideimprovements.
5 Use Storage vMotion to migrate I/O-intensive virtual machines across multiple hosts.
6 Balance the disk load across all physical resources available. Spread heavily used storage across LUNs that are accessedby different adapters. Use separate queues for each adapter to improve disk efficiency.
7 Configure the HBAs and RAID controllers for optimal use. Verify that the queue depths and cache settings on the RAIDcontrollers are adequate. If not, increase the number of outstanding disk requests for the virtual machine by adjusting theDisk.SchedNumReqOutstanding parameter. For more information, see vSphere Storage.
8 For resource-intensive virtual machines, separate the virtual machine's physical disk drive from the drive with the systempage file. It alleviates disk spindle contention during periods of high use.
9 On systems with sizable RAM, disable memory trimming by adding the line MemTrimRate=0 to the virtual machine's VMXfile.
10 If the combined disk I/O is higher than a single HBA capacity, use multipathing or multiple links.
11 For ESXi hosts, create virtual disks as preallocated. When you create a virtual disk for a guest operating system, selectAllocate all disk space now. The performance degradation associated with reassigning additional disk space does notoccur, and the disk is less likely to become fragmented.
12 Use the most current host hardware.
Disk Rate (KBps)The Disk Rate chart displays disk read and write rates for LUNs on a host, including average rates.
This chart is located in the Home view of the host Performance tab.
vSphere Monitoring and Performance
VMware, Inc. 46

Table 1-52. Data Counters
Chart Label Description
Read Number of disk read commands completed on each disk on the host, per second. Theaggregate number of all disk read commands is also displayed in the chart.
Read rate = blocksRead per second × blockSize
n Counter: read
n Stats Type: Rate
n Unit: Kilobytes per second (KBps)
n Rollup Type: Average
n Collection Level: 3
Write Number of disk write commands completed on each disk on the host, per second. Theaggregate number of all disk write commands is also displayed in the chart.
Write rate = blocksWritten per second × blockSize
n Counter: write
n Stats Type: Rate
n Unit: Kilobytes per second (KBps)
n Rollup Type: Average
n Collection Level: 3
Chart Analysis
Use the disk charts to monitor average disk loads and to determine trends in disk usage. For example,you might notice a performance degradation with applications that frequently read from and write to thehard disk. If you see a spike in the number of disk read or write requests, check whether any suchapplications were running then.
The best ways to determine if your vSphere environment is experiencing disk problems is to monitor thedisk latency data counters. You can use the advanced performance charts to view these statistics.
n The kernelLatency data counter measures the average amount of time, in milliseconds, that theVMkernel spends processing each SCSI command. For best performance, the value must be 0 -1milliseconds. If the value is greater than 4 ms, the virtual machines on the host are trying to sendmore throughput to the storage system than the configuration supports. Check the CPU usage, andincrease the queue depth.
n The deviceLatency data counter measures the average amount of time, in milliseconds, to complete aSCSI command from the physical device. Depending on your hardware, a number greater than 15 msindicates probable problems with the storage array. Move the active VMDK to a volume with morespindles or add disks to the LUN.
n The queueLatency data counter measures the average amount of time taken per SCSI command inthe VMkernel queue. This value must always be zero. If not, the workload is too high and the arraycannot process the data fast enough.
If the disk latency values are high, or if you notice other problems with disk I/O performance, considertaking the following actions.
vSphere Monitoring and Performance
VMware, Inc. 47

Table 1-53. Disk I/O Performance Enhancement Advice
# Resolution
1 Increase the virtual machine memory. It allows more operating system caching, which reduces I/O activity. Note: It mightrequire you to increase the host memory. Increasing memory might reduce the need to store data because databases canutilize the system memory to cache data and avoid disk access.
To verify that virtual machines have adequate memory, check swap statistics in the guest operating system. Increase theguest memory, but not to an extent that leads to excessive host memory swapping. Install VMware Tools so that memoryballooning can occur.
2 Defragment the file systems on all guests.
3 Disable antivirus on-demand scans on the VMDK and VMEM files.
4 Use the vendor's array tools to determine the array performance statistics. When too many servers simultaneously accesscommon elements on an array, the disks might have trouble keeping up. To increase throughput, consider array-sideimprovements.
5 Use Storage vMotion to migrate I/O-intensive virtual machines across multiple hosts.
6 Balance the disk load across all physical resources available. Spread heavily used storage across LUNs that are accessedby different adapters. Use separate queues for each adapter to improve disk efficiency.
7 Configure the HBAs and RAID controllers for optimal use. Verify that the queue depths and cache settings on the RAIDcontrollers are adequate. If not, increase the number of outstanding disk requests for the virtual machine by adjusting theDisk.SchedNumReqOutstanding parameter. For more information, see vSphere Storage.
8 For resource-intensive virtual machines, separate the virtual machine's physical disk drive from the drive with the systempage file. It alleviates disk spindle contention during periods of high use.
9 On systems with sizable RAM, disable memory trimming by adding the line MemTrimRate=0 to the virtual machine's VMXfile.
10 If the combined disk I/O is higher than a single HBA capacity, use multipathing or multiple links.
11 For ESXi hosts, create virtual disks as preallocated. When you create a virtual disk for a guest operating system, selectAllocate all disk space now. The performance degradation associated with reassigning additional disk space does notoccur, and the disk is less likely to become fragmented.
12 Use the most current host hardware.
Disk Requests (Number)The Disk Requests chart displays disk usage for the host.
This chart is located in the Home view of the host Performance tab.
vSphere Monitoring and Performance
VMware, Inc. 48

Table 1-54. Data Counters
Chart Label Description
Read Requests Number of disk read commands completed on each LUN on the host. Theaggregate number of all disk read commands is also displayed in the chart.
n Counter: numberRead
n Stats Type: Absolute
n Unit: Number
n Rollup Type: Summation
n Collection Level: 3
Write Requests Number of disk write commands completed on each LUN on the host. Theaggregate number of all disk write commands is also displayed in the chart.
n Counter: numberWrite
n Stats Type: Absolute
n Unit: Number
n Rollup Type: Summation
n Collection Level: 3
Chart Analysis
Use the disk charts to monitor average disk loads and to determine trends in disk usage. For example,you might notice a performance degradation with applications that frequently read from and write to thehard disk. If you see a spike in the number of disk read or write requests, check whether any suchapplications were running then.
The best ways to determine if your vSphere environment is experiencing disk problems is to monitor thedisk latency data counters. You can use the advanced performance charts to view these statistics.
n The kernelLatency data counter measures the average amount of time, in milliseconds, that theVMkernel spends processing each SCSI command. For best performance, the value must be 0 -1milliseconds. If the value is greater than 4 ms, the virtual machines on the host are trying to sendmore throughput to the storage system than the configuration supports. Check the CPU usage, andincrease the queue depth.
n The deviceLatency data counter measures the average amount of time, in milliseconds, to complete aSCSI command from the physical device. Depending on your hardware, a number greater than 15 msindicates probable problems with the storage array. Move the active VMDK to a volume with morespindles or add disks to the LUN.
n The queueLatency data counter measures the average amount of time taken per SCSI command inthe VMkernel queue. This value must always be zero. If not, the workload is too high and the arraycannot process the data fast enough.
If the disk latency values are high, or if you notice other problems with disk I/O performance, considertaking the following actions.
vSphere Monitoring and Performance
VMware, Inc. 49

Table 1-55. Disk I/O Performance Enhancement Advice
# Resolution
1 Increase the virtual machine memory. It allows more operating system caching, which reduces I/O activity. Note: It mightrequire you to increase the host memory. Increasing memory might reduce the need to store data because databases canutilize the system memory to cache data and avoid disk access.
To verify that virtual machines have adequate memory, check swap statistics in the guest operating system. Increase theguest memory, but not to an extent that leads to excessive host memory swapping. Install VMware Tools so that memoryballooning can occur.
2 Defragment the file systems on all guests.
3 Disable antivirus on-demand scans on the VMDK and VMEM files.
4 Use the vendor's array tools to determine the array performance statistics. When too many servers simultaneously accesscommon elements on an array, the disks might have trouble keeping up. To increase throughput, consider array-sideimprovements.
5 Use Storage vMotion to migrate I/O-intensive virtual machines across multiple hosts.
6 Balance the disk load across all physical resources available. Spread heavily used storage across LUNs that are accessedby different adapters. Use separate queues for each adapter to improve disk efficiency.
7 Configure the HBAs and RAID controllers for optimal use. Verify that the queue depths and cache settings on the RAIDcontrollers are adequate. If not, increase the number of outstanding disk requests for the virtual machine by adjusting theDisk.SchedNumReqOutstanding parameter. For more information, see vSphere Storage.
8 For resource-intensive virtual machines, separate the virtual machine's physical disk drive from the drive with the systempage file. It alleviates disk spindle contention during periods of high use.
9 On systems with sizable RAM, disable memory trimming by adding the line MemTrimRate=0 to the virtual machine's VMXfile.
10 If the combined disk I/O is higher than a single HBA capacity, use multipathing or multiple links.
11 For ESXi hosts, create virtual disks as preallocated. When you create a virtual disk for a guest operating system, selectAllocate all disk space now. The performance degradation associated with reassigning additional disk space does notoccur, and the disk is less likely to become fragmented.
12 Use the most current host hardware.
Disk (Number)The Disk (Number) chart displays maximum queue depth for the top ten LUNs on a host.
This chart is located in the Home view of the host Performance tab.
Table 1-56. Data Counters
Chart Label Description
Maximum Queue Depth Maximum queue depth. Queue depth is the number of commands the SCSI driver queues tothe HBA.
n Counter: maxQueueDepth
n Stats Type: Absolute
n Unit: Number
n Rollup Type: Average
n Collection Level: 1
vSphere Monitoring and Performance
VMware, Inc. 50

Chart Analysis
Use the disk charts to monitor average disk loads and to determine trends in disk usage. For example,you might notice a performance degradation with applications that frequently read from and write to thehard disk. If you see a spike in the number of disk read or write requests, check whether any suchapplications were running then.
The best ways to determine if your vSphere environment is experiencing disk problems is to monitor thedisk latency data counters. You can use the advanced performance charts to view these statistics.
n The kernelLatency data counter measures the average amount of time, in milliseconds, that theVMkernel spends processing each SCSI command. For best performance, the value must be 0 -1milliseconds. If the value is greater than 4 ms, the virtual machines on the host are trying to sendmore throughput to the storage system than the configuration supports. Check the CPU usage, andincrease the queue depth.
n The deviceLatency data counter measures the average amount of time, in milliseconds, to complete aSCSI command from the physical device. Depending on your hardware, a number greater than 15 msindicates probable problems with the storage array. Move the active VMDK to a volume with morespindles or add disks to the LUN.
n The queueLatency data counter measures the average amount of time taken per SCSI command inthe VMkernel queue. This value must always be zero. If not, the workload is too high and the arraycannot process the data fast enough.
If the disk latency values are high, or if you notice other problems with disk I/O performance, considertaking the following actions.
Table 1-57. Disk I/O Performance Enhancement Advice
# Resolution
1 Increase the virtual machine memory. It allows more operating system caching, which reduces I/O activity. Note: It mightrequire you to increase the host memory. Increasing memory might reduce the need to store data because databases canutilize the system memory to cache data and avoid disk access.
To verify that virtual machines have adequate memory, check swap statistics in the guest operating system. Increase theguest memory, but not to an extent that leads to excessive host memory swapping. Install VMware Tools so that memoryballooning can occur.
2 Defragment the file systems on all guests.
3 Disable antivirus on-demand scans on the VMDK and VMEM files.
4 Use the vendor's array tools to determine the array performance statistics. When too many servers simultaneously accesscommon elements on an array, the disks might have trouble keeping up. To increase throughput, consider array-sideimprovements.
5 Use Storage vMotion to migrate I/O-intensive virtual machines across multiple hosts.
6 Balance the disk load across all physical resources available. Spread heavily used storage across LUNs that are accessedby different adapters. Use separate queues for each adapter to improve disk efficiency.
7 Configure the HBAs and RAID controllers for optimal use. Verify that the queue depths and cache settings on the RAIDcontrollers are adequate. If not, increase the number of outstanding disk requests for the virtual machine by adjusting theDisk.SchedNumReqOutstanding parameter. For more information, see vSphere Storage.
vSphere Monitoring and Performance
VMware, Inc. 51
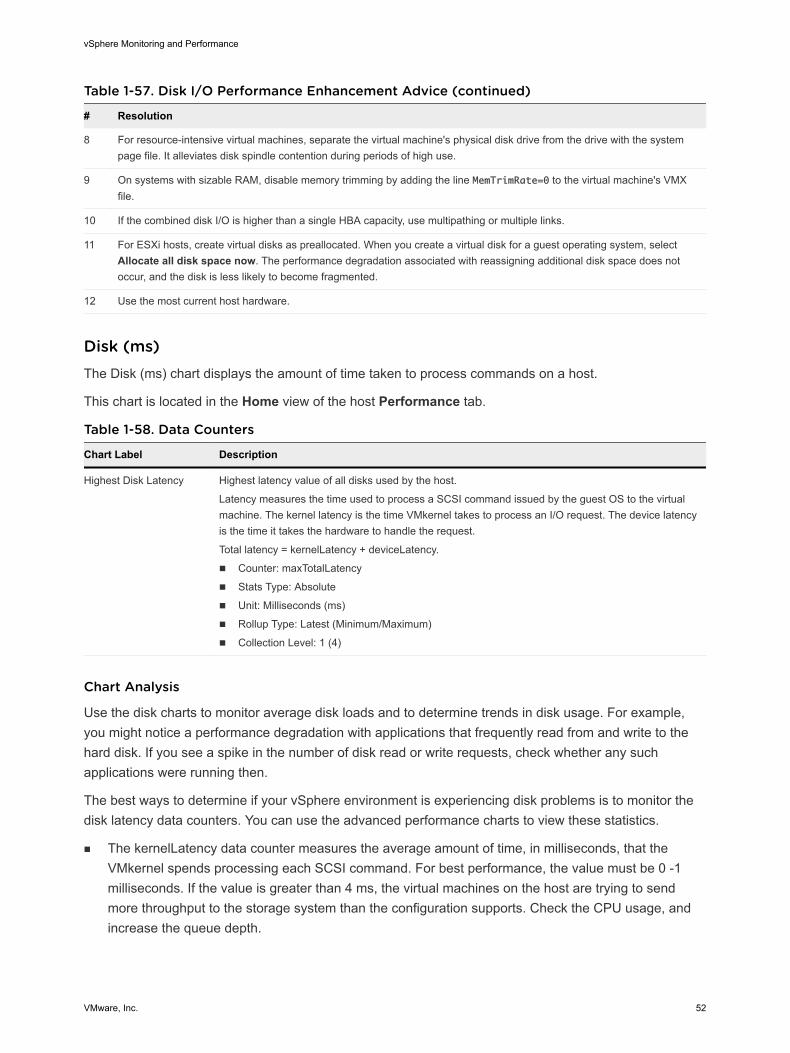
Table 1-57. Disk I/O Performance Enhancement Advice (continued)
# Resolution
8 For resource-intensive virtual machines, separate the virtual machine's physical disk drive from the drive with the systempage file. It alleviates disk spindle contention during periods of high use.
9 On systems with sizable RAM, disable memory trimming by adding the line MemTrimRate=0 to the virtual machine's VMXfile.
10 If the combined disk I/O is higher than a single HBA capacity, use multipathing or multiple links.
11 For ESXi hosts, create virtual disks as preallocated. When you create a virtual disk for a guest operating system, selectAllocate all disk space now. The performance degradation associated with reassigning additional disk space does notoccur, and the disk is less likely to become fragmented.
12 Use the most current host hardware.
Disk (ms)The Disk (ms) chart displays the amount of time taken to process commands on a host.
This chart is located in the Home view of the host Performance tab.
Table 1-58. Data Counters
Chart Label Description
Highest Disk Latency Highest latency value of all disks used by the host.
Latency measures the time used to process a SCSI command issued by the guest OS to the virtualmachine. The kernel latency is the time VMkernel takes to process an I/O request. The device latencyis the time it takes the hardware to handle the request.
Total latency = kernelLatency + deviceLatency.
n Counter: maxTotalLatency
n Stats Type: Absolute
n Unit: Milliseconds (ms)
n Rollup Type: Latest (Minimum/Maximum)
n Collection Level: 1 (4)
Chart Analysis
Use the disk charts to monitor average disk loads and to determine trends in disk usage. For example,you might notice a performance degradation with applications that frequently read from and write to thehard disk. If you see a spike in the number of disk read or write requests, check whether any suchapplications were running then.
The best ways to determine if your vSphere environment is experiencing disk problems is to monitor thedisk latency data counters. You can use the advanced performance charts to view these statistics.
n The kernelLatency data counter measures the average amount of time, in milliseconds, that theVMkernel spends processing each SCSI command. For best performance, the value must be 0 -1milliseconds. If the value is greater than 4 ms, the virtual machines on the host are trying to sendmore throughput to the storage system than the configuration supports. Check the CPU usage, andincrease the queue depth.
vSphere Monitoring and Performance
VMware, Inc. 52

n The deviceLatency data counter measures the average amount of time, in milliseconds, to complete aSCSI command from the physical device. Depending on your hardware, a number greater than 15 msindicates probable problems with the storage array. Move the active VMDK to a volume with morespindles or add disks to the LUN.
n The queueLatency data counter measures the average amount of time taken per SCSI command inthe VMkernel queue. This value must always be zero. If not, the workload is too high and the arraycannot process the data fast enough.
If the disk latency values are high, or if you notice other problems with disk I/O performance, considertaking the following actions.
Table 1-59. Disk I/O Performance Enhancement Advice
# Resolution
1 Increase the virtual machine memory. It allows more operating system caching, which reduces I/O activity. Note: It mightrequire you to increase the host memory. Increasing memory might reduce the need to store data because databases canutilize the system memory to cache data and avoid disk access.
To verify that virtual machines have adequate memory, check swap statistics in the guest operating system. Increase theguest memory, but not to an extent that leads to excessive host memory swapping. Install VMware Tools so that memoryballooning can occur.
2 Defragment the file systems on all guests.
3 Disable antivirus on-demand scans on the VMDK and VMEM files.
4 Use the vendor's array tools to determine the array performance statistics. When too many servers simultaneously accesscommon elements on an array, the disks might have trouble keeping up. To increase throughput, consider array-sideimprovements.
5 Use Storage vMotion to migrate I/O-intensive virtual machines across multiple hosts.
6 Balance the disk load across all physical resources available. Spread heavily used storage across LUNs that are accessedby different adapters. Use separate queues for each adapter to improve disk efficiency.
7 Configure the HBAs and RAID controllers for optimal use. Verify that the queue depths and cache settings on the RAIDcontrollers are adequate. If not, increase the number of outstanding disk requests for the virtual machine by adjusting theDisk.SchedNumReqOutstanding parameter. For more information, see vSphere Storage.
8 For resource-intensive virtual machines, separate the virtual machine's physical disk drive from the drive with the systempage file. It alleviates disk spindle contention during periods of high use.
9 On systems with sizable RAM, disable memory trimming by adding the line MemTrimRate=0 to the virtual machine's VMXfile.
10 If the combined disk I/O is higher than a single HBA capacity, use multipathing or multiple links.
11 For ESXi hosts, create virtual disks as preallocated. When you create a virtual disk for a guest operating system, selectAllocate all disk space now. The performance degradation associated with reassigning additional disk space does notoccur, and the disk is less likely to become fragmented.
12 Use the most current host hardware.
Disk (KBps)The Disk (KBps) chart displays disk usage for the 10 virtual machines on the host with the most diskusage.
vSphere Monitoring and Performance
VMware, Inc. 53

This chart is located in the Virtual Machines view of the host Performance tab.
Table 1-60. Data Counters
Chart Label Description
virtual_machine Sum of the data read from the virtual machine.
n Counter: usage
n Stats Type: Rate
n Unit: KiloBytes per second (KBps)
n Rollup Type: Average (Minimum/Maximum)
n Collection Level: 1 (4)
Chart Analysis
Use the disk charts to monitor average disk loads and to determine trends in disk usage. For example,you might notice a performance degradation with applications that frequently read from and write to thehard disk. If you see a spike in the number of disk read or write requests, check whether any suchapplications were running then.
The best ways to determine if your vSphere environment is experiencing disk problems is to monitor thedisk latency data counters. You can use the advanced performance charts to view these statistics.
n The kernelLatency data counter measures the average amount of time, in milliseconds, that theVMkernel spends processing each SCSI command. For best performance, the value must be 0 -1milliseconds. If the value is greater than 4 ms, the virtual machines on the host are trying to sendmore throughput to the storage system than the configuration supports. Check the CPU usage, andincrease the queue depth.
n The deviceLatency data counter measures the average amount of time, in milliseconds, to complete aSCSI command from the physical device. Depending on your hardware, a number greater than 15 msindicates probable problems with the storage array. Move the active VMDK to a volume with morespindles or add disks to the LUN.
n The queueLatency data counter measures the average amount of time taken per SCSI command inthe VMkernel queue. This value must always be zero. If not, the workload is too high and the arraycannot process the data fast enough.
If the disk latency values are high, or if you notice other problems with disk I/O performance, considertaking the following actions.
Table 1-61. Disk I/O Performance Enhancement Advice
# Resolution
1 Increase the virtual machine memory. It allows more operating system caching, which reduces I/O activity. Note: It mightrequire you to increase the host memory. Increasing memory might reduce the need to store data because databases canutilize the system memory to cache data and avoid disk access.
To verify that virtual machines have adequate memory, check swap statistics in the guest operating system. Increase theguest memory, but not to an extent that leads to excessive host memory swapping. Install VMware Tools so that memoryballooning can occur.
2 Defragment the file systems on all guests.
vSphere Monitoring and Performance
VMware, Inc. 54

Table 1-61. Disk I/O Performance Enhancement Advice (continued)
# Resolution
3 Disable antivirus on-demand scans on the VMDK and VMEM files.
4 Use the vendor's array tools to determine the array performance statistics. When too many servers simultaneously accesscommon elements on an array, the disks might have trouble keeping up. To increase throughput, consider array-sideimprovements.
5 Use Storage vMotion to migrate I/O-intensive virtual machines across multiple hosts.
6 Balance the disk load across all physical resources available. Spread heavily used storage across LUNs that are accessedby different adapters. Use separate queues for each adapter to improve disk efficiency.
7 Configure the HBAs and RAID controllers for optimal use. Verify that the queue depths and cache settings on the RAIDcontrollers are adequate. If not, increase the number of outstanding disk requests for the virtual machine by adjusting theDisk.SchedNumReqOutstanding parameter. For more information, see vSphere Storage.
8 For resource-intensive virtual machines, separate the virtual machine's physical disk drive from the drive with the systempage file. It alleviates disk spindle contention during periods of high use.
9 On systems with sizable RAM, disable memory trimming by adding the line MemTrimRate=0 to the virtual machine's VMXfile.
10 If the combined disk I/O is higher than a single HBA capacity, use multipathing or multiple links.
11 For ESXi hosts, create virtual disks as preallocated. When you create a virtual disk for a guest operating system, selectAllocate all disk space now. The performance degradation associated with reassigning additional disk space does notoccur, and the disk is less likely to become fragmented.
12 Use the most current host hardware.
Memory (%)The Memory (%) chart displays host memory usage.
This chart is located in the Home view of the host Performance tab.
Chart Analysis
To ensure best performance, the host memory must be large enough to accommodate the active memoryof the virtual machines. The active memory can be smaller than the virtual machine memory size. Itallows you to over-provision memory, but still ensures that the virtual machine active memory is smallerthan the host memory.
Transient high-usage values usually do not cause performance degradation. For example, memory usagecan be high when several virtual machines are started at the same time or when a spike occurs in virtualmachine workload. However, a consistently high memory usage value (94% or greater) indicates that thehost is probably lacking the memory required to meet the demand. If the active memory size is the sameas the granted memory size, the demand for memory is greater than the memory resources available. Ifthe active memory is consistently low, the memory size might be too large.
If the memory usage value is high, and the host has high ballooning or swapping, check the amount offree physical memory on the host. A free memory value of 6% or less indicates that the host cannothandle the demand for memory. It leads to memory reclamation, which might degrade performance.
vSphere Monitoring and Performance
VMware, Inc. 55

If the host has enough free memory, check the resource shares, reservation, and limit settings of thevirtual machines and resource pools on the host. Verify that the host settings are adequate and not lowerthan those set for the virtual machines.
If the host has little free memory available, or if you notice a degradation in performance, consider takingthe following actions.
Table 1-62. Memory Performance Enhancement Advice
# Resolution
1 Verify that VMware Tools is installed on each virtual machine. The balloon driver is installed with VMware Tools and is criticalto performance.
2 Verify that the balloon driver is enabled. The VMkernel regularly reclaims unused virtual machine memory by ballooning andswapping. Generally, it does not impact virtual machine performance.
3 Reduce the memory space on the virtual machine, and correct the cache size if it is too large. This frees up memory for othervirtual machines.
4 If the memory reservation of the virtual machine is set to a value much higher than its active memory, decrease thereservation setting so that the VMkernel can reclaim the idle memory for other virtual machines on the host.
5 Migrate one or more virtual machines to a host in a DRS cluster.
6 Add physical memory to the host.
Memory (Balloon)The Memory (Balloon) chart displays balloon memory on a host.
This chart is located in the Home view of the host Performance tab.
Table 1-63. Data Counters
Chart Label Description
Balloon Sum of the guest physical memory reclaimed by the balloon driver for all powered on virtual machineson the host.
n Counter: vmmemctl
n Stats Type: Absolute
n Unit: Megabytes (MB)
n Rollup Type: Average (Minimum/Maximum)
n Collection Level: 1 (4)
Chart Analysis
To ensure best performance, the host memory must be large enough to accommodate the active memoryof the virtual machines. The active memory can be smaller than the virtual machine memory size. Itallows you to over-provision memory, but still ensures that the virtual machine active memory is smallerthan the host memory.
vSphere Monitoring and Performance
VMware, Inc. 56

Transient high-usage values usually do not cause performance degradation. For example, memory usagecan be high when several virtual machines are started at the same time or when a spike occurs in virtualmachine workload. However, a consistently high memory usage value (94% or greater) indicates that thehost is probably lacking the memory required to meet the demand. If the active memory size is the sameas the granted memory size, the demand for memory is greater than the memory resources available. Ifthe active memory is consistently low, the memory size might be too large.
If the memory usage value is high, and the host has high ballooning or swapping, check the amount offree physical memory on the host. A free memory value of 6% or less indicates that the host cannothandle the demand for memory. It leads to memory reclamation, which might degrade performance.
If the host has enough free memory, check the resource shares, reservation, and limit settings of thevirtual machines and resource pools on the host. Verify that the host settings are adequate and not lowerthan those set for the virtual machines.
If the host has little free memory available, or if you notice a degradation in performance, consider takingthe following actions.
Table 1-64. Memory Performance Enhancement Advice
# Resolution
1 Verify that VMware Tools is installed on each virtual machine. The balloon driver is installed with VMware Tools and is criticalto performance.
2 Verify that the balloon driver is enabled. The VMkernel regularly reclaims unused virtual machine memory by ballooning andswapping. Generally, it does not impact virtual machine performance.
3 Reduce the memory space on the virtual machine, and correct the cache size if it is too large. This frees up memory for othervirtual machines.
4 If the memory reservation of the virtual machine is set to a value much higher than its active memory, decrease thereservation setting so that the VMkernel can reclaim the idle memory for other virtual machines on the host.
5 Migrate one or more virtual machines to a host in a DRS cluster.
6 Add physical memory to the host.
Memory (MBps)The Memory (MBps) chart displays the swap in and swap out rates for a host.
This chart is located on the Home view of the Host Performance tab.
vSphere Monitoring and Performance
VMware, Inc. 57

Table 1-65. Data Counters
Chart Label Description
swapinRate Average rate at which memory is swapped in from the host swap file.
n Counter: swapinRate
n Stats Type: Rate
n Unit: MegaBytes per second (MBps)
n Rollup Type: Average (Minimum/Maximum)
n Collection Level: 1 (4)
swapoutRate Average rate at which memory is swapped out to the host swap file.
n Counter: swapoutRate
n Stats Type: Rate
n Unit: MegaBytes per second (MBps)
n Rollup Type: Average (Minimum/Maximum)
n Collection Level: 1 (4)
Chart Analysis
Host memory must be large enough to accommodate virtual machine workload. Transient high-usagevalues usually do not cause performance degradation. For example, memory usage can be high whenseveral virtual machines are started at the same time or when there is a spike in virtual machineworkload.
However, a consistently high memory usage value (94% or greater) indicates the host does not have thememory resources required to meet the demand. If the memory balloon and swap values are not high,performance is probably not affected. If the memory usage value is high, and the host has high ballooningor swapping, check the amount of free physical memory on the host. A free memory value of 6% or lessindicates that the host requires more memory resources.
If the host is not lacking memory resources, check the resource shares, reservation, and limit settings ofthe virtual machines and resource pools on the host. Verify that the host settings are adequate and notlower than those set for the virtual machines.
If the host is lacking memory resources or you notice a degredation in performance, consider taking thefollowing actions.
Table 1-66. Memory Performance Enhancement Advice
# Resolution
1 Verify that VMware Tools is installed on each virtual machine. The balloon driver is installed with VMware Tools and is criticalto performance.
2 Verify that the balloon driver is enabled. The VMkernel regularly reclaims unused virtual machine memory by ballooning andswapping. Generally, this does not impact virtual machine performance.
3 Reduce the memory space on the virtual machine, and correct the cache size if it is too large. This frees up memory for othervirtual machines.
4 If the memory reservation of a virtual machine is set to a value much higher than its active memory, decrease the reservationsetting so that the VMkernel can reclaim the idle memory for other virtual machines on the host.
vSphere Monitoring and Performance
VMware, Inc. 58

Table 1-66. Memory Performance Enhancement Advice (continued)
# Resolution
5 Migrate one or more virtual machines to a host in a DRS cluster.
6 Add physical memory to the host.
Memory (MB)The Memory (MB) chart displays memory data counters for hosts.
This chart is located in the Home view of the host Performance tab.
Note Guest physical memory refers to the virtual hardware memory presented to a virtual machine for itsguest operating system. Machine memory is the actual physical RAM in the host.
Not all counters are collected at collection level 1.
Table 1-67. Data Counters
Chart Label Description
Active Sum of the active guest physical memory of all powered on virtual machines on the host,plus memory used by basic VMKernel applications. Active memory is estimated by theVMkernel and is based on the current workload of the host.
n Counter: active
n Stats Type: Absolute
n Unit: Megabytes (MB)
n Rollup Type: Average (Minimum/Maximum)
n Collection Level: 2 (4)
Balloon Sum of the guest physical memory reclaimed by the balloon driver for all powered on virtualmachines on the host.
n Counter: vmmemctl
n Stats Type: Absolute
n Unit: Megabytes (MB)
n Rollup Type: Average (Minimum/Maximum)
n Collection Level: 1 (4)
Balloon Target Sum of the balloon target memory of all powered on virtual machines on the host.
If the balloon target value is greater than the balloon value, the VMkernel inflates theballoon, causing more virtual machine memory to be reclaimed. If the balloon target value isless than the balloon value, the VMkernel deflates the balloon, which allows the virtualmachine to consume additional memory if needed.
Virtual machines initiate memory reallocation. Therefore, it is possible to have a balloontarget value of 0 and a balloon value greater than 0.
n Counter: vmmemctltarget
n Stats Type: Absolute
n Unit: Megabytes (MB)
n Rollup Type: Average (Minimum/Maximum)
n Collection Level: 2 (4)
vSphere Monitoring and Performance
VMware, Inc. 59

Table 1-67. Data Counters (continued)
Chart Label Description
Consumed Amount of machine memory used on the host.
Consumed memory includes virtual machine memory, service console memory, andVMkernel memory.
consumed memory = total host memory - free host memory
n Counter: consumed
n Stats Type: Absolute
n Unit: Megabytes (MB)
n Rollup Type: Average (Minimum/Maximum)
n Collection Level: 1 (4)
Granted Sum of the guest physical memory granted for all powered on virtual machines. Grantedmemory is mapped to the host's machine memory.
Granted memory for a host includes the shared memory of each virtual machine on the host.
n Counter: granted
n Stats Type: Absolute
n Unit: Megabytes (MB)
n Rollup Type: Average (Minimum/Maximum)
n Collection Level: 2 (4)
Shared Common Amount of machine memory shared by all powered on virtual machines.
Shared common memory consists of the entire pool of memory from which sharing ispossible, including the amount of physical RAM required by the guest memory.
memory shared - memory shared common = amount of memory saved on the host fromsharing
n Counter: sharedcommon
n Stats Type: Absolute
n Unit: Megabytes (MB)
n Rollup Type: Average (Minimum/Maximum)
n Collection Level: 2 (4)
Swap Used Sum of the memory swapped by all powered on virtual machines on the host.
n Counter: swapused
n Stats Type: Absolute
n Unit: Megabytes (MB)
n Rollup Type: Average (Minimum/Maximum)
n Collection Level: 2 (4)
Chart Analysis
To ensure best performance, the host memory must be large enough to accommodate the active memoryof the virtual machines. The active memory can be smaller than the virtual machine memory size. Itallows you to over-provision memory, but still ensures that the virtual machine active memory is smallerthan the host memory.
vSphere Monitoring and Performance
VMware, Inc. 60
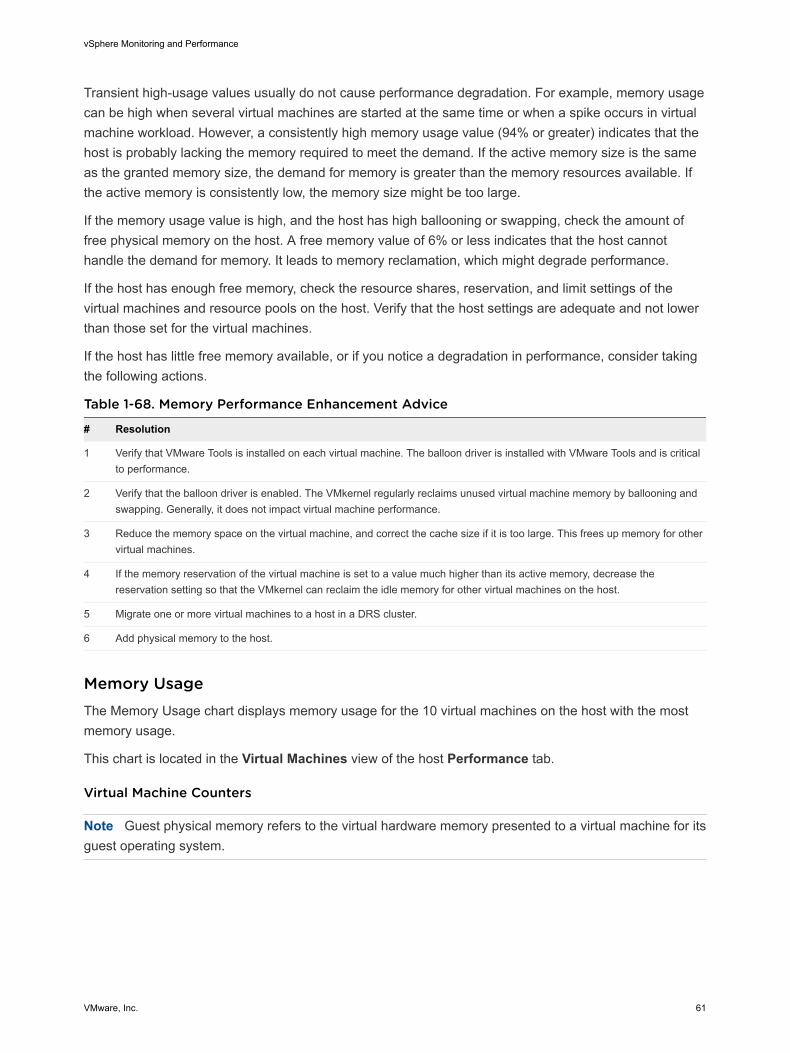
Transient high-usage values usually do not cause performance degradation. For example, memory usagecan be high when several virtual machines are started at the same time or when a spike occurs in virtualmachine workload. However, a consistently high memory usage value (94% or greater) indicates that thehost is probably lacking the memory required to meet the demand. If the active memory size is the sameas the granted memory size, the demand for memory is greater than the memory resources available. Ifthe active memory is consistently low, the memory size might be too large.
If the memory usage value is high, and the host has high ballooning or swapping, check the amount offree physical memory on the host. A free memory value of 6% or less indicates that the host cannothandle the demand for memory. It leads to memory reclamation, which might degrade performance.
If the host has enough free memory, check the resource shares, reservation, and limit settings of thevirtual machines and resource pools on the host. Verify that the host settings are adequate and not lowerthan those set for the virtual machines.
If the host has little free memory available, or if you notice a degradation in performance, consider takingthe following actions.
Table 1-68. Memory Performance Enhancement Advice
# Resolution
1 Verify that VMware Tools is installed on each virtual machine. The balloon driver is installed with VMware Tools and is criticalto performance.
2 Verify that the balloon driver is enabled. The VMkernel regularly reclaims unused virtual machine memory by ballooning andswapping. Generally, it does not impact virtual machine performance.
3 Reduce the memory space on the virtual machine, and correct the cache size if it is too large. This frees up memory for othervirtual machines.
4 If the memory reservation of the virtual machine is set to a value much higher than its active memory, decrease thereservation setting so that the VMkernel can reclaim the idle memory for other virtual machines on the host.
5 Migrate one or more virtual machines to a host in a DRS cluster.
6 Add physical memory to the host.
Memory UsageThe Memory Usage chart displays memory usage for the 10 virtual machines on the host with the mostmemory usage.
This chart is located in the Virtual Machines view of the host Performance tab.
Virtual Machine Counters
Note Guest physical memory refers to the virtual hardware memory presented to a virtual machine for itsguest operating system.
vSphere Monitoring and Performance
VMware, Inc. 61

Table 1-69. Data Counters
Chart Label Description
Usage Amount of guest physical memory currently in use on the virtual machine.
n Counter: usage
n Stats Type: Absolute
n Unit: Percentage (%)
n Rollup Type: Average (Minimum/Maximum)
n Collection Level: 1 (4)
Chart Analysis
A virtual machine's memory size must be slightly larger than the average guest memory usage. Thisenables the host to accommodate workload spikes without swapping memory among guests. Increasingthe virtual machine memory size results in more overhead memory usage.
If sufficient swap space is available, a high balloon value does not cause performance problems.However, if the swapin and swapout values for the host are large, the host is probably lacking the amountof memory required to meet the demand.
If a virtual machine has high ballooning or swapping, check the amount of free physical memory on thehost. A free memory value of 6% or less indicates that the host cannot meet the memory requirements.This leads to memory reclamation, which might degrade performance. If the active memory size is thesame as the granted memory size, demand for memory is greater than the memory resources available. Ifthe active memory is consistently low, the memory size might be too large.
If the host has enough free memory, check the resource shares, reservation, and limit of the virtualmachines and resource pools on the host. Verify that the host settings are adequate and not lower thanthose set for the virtual machine.
If little free memory is available, or if you notice degradation in performance, consider taking the followingactions.
Table 1-70. Memory Performance Enhancement Advice
# Resolution
1 Verify that VMware Tools is installed on each virtual machine. The balloon driver is installed with VMware Tools and is criticalto performance.
2 Verify that the balloon driver is enabled. The VMkernel regularly reclaims unused virtual machine memory by ballooning andswapping. Generally, this does not impact virtual machine performance.
3 Reduce the memory space on the virtual machine, and correct the cache size if it is too large. This frees up memory for othervirtual machines.
4 If the memory reservation of the virtual machine is set to a value much higher than its active memory, decrease thereservation setting so that the VMkernel can reclaim the idle memory for other virtual machines on the host.
5 Migrate one or more virtual machines to a host in a DRS cluster.
6 Add physical memory to the host.
vSphere Monitoring and Performance
VMware, Inc. 62

Network (Mbps)The Network (Mbps) chart displays network usage for the host.
This chart is located in the Home view of the Host Performance tab.
Table 1-71. Host Counters
Chart Label Description
Usage Average rate at which data is transmitted and received across all NIC instances connectedto the host.
n Counter: usage
n Stats Type: Rate
n Unit: Megabits per second (Mbps)
n Rollup Type: Average (Minimum/Maximum)
n Collection Level: 1 (4)
Chart Analysis
Network performance depends on the application workload and network configuration. Dropped networkpackets indicate a bottleneck in the network. To determine whether packets are being dropped, useesxtop or the advanced performance charts to examine the droppedTx and droppedRx network countervalues.
If packets are being dropped, adjust the virtual machine shares. If packets are not being dropped, checkthe size of the network packets and the data receive and transfer rates. In general, the larger the networkpackets, the faster the network speed. When the packet size is large, fewer packets are transferred,which reduces the amount of CPU required to process the data. When network packets are small, morepackets are transferred but the network speed is slower because more CPU is required to process thedata.
Note In some instances, large packets might result in a high network latency. To check the networklatency, use the VMware AppSpeed performance monitoring application or a third-party application.
If packets are not being dropped and the data receive rate is slow, the host is probably lacking the CPUresources required to handle the load. Check the number of virtual machines assigned to each physicalNIC. If necessary, perform load balancing by moving virtual machines to different vSwitches or by addingmore NICs to the host. You can also move virtual machines to another host or increase the host CPU orvirtual machine CPU.
If you experience network-related performance problems, also consider taking the following actions.
Table 1-72. Networking Performance Enhancement Advice
# Resolution
1 Verify that VMware Tools is installed on each virtual machine.
2 If possible, use vmxnet3 NIC drivers, which are available with VMware Tools. They are optimized for high performance.
3 If virtual machines running on the same host communicate with each other, connect them to the same vSwitch to avoidtransferring packets over the physical network.
4 Assign each physical NIC to a port group and a vSwitch.
vSphere Monitoring and Performance
VMware, Inc. 63

Table 1-72. Networking Performance Enhancement Advice (continued)
# Resolution
5 Use separate physical NICs to handle the different traffic streams, such as network packets generated by virtual machines,iSCSI protocols, vMotion tasks.
6 Ensure that the physical NIC capacity is large enough to handle the network traffic on that vSwitch. If the capacity is notenough, consider using a high-bandwidth physical NIC (10 Gbps). Alternatively, consider moving some virtual machines to avSwitch with a lighter load or to a new vSwitch.
7 If packets are being dropped at the vSwitch port, increase the virtual network driver ring buffers where applicable.
8 Verify that the reported speed and duplex settings for the physical NIC match the hardware expectations and that thehardware is configured to run at its maximum capability. For example, verify that NICs with 1 Gbps are not reset to 100 Mbpsbecause they are connected to an older switch.
9 Verify that all NICs are running in full duplex mode. Hardware connectivity problems might result in a NIC resetting itself to alower speed or half duplex mode.
10 Use vNICs that are TCP Segmentation Offload (TSO)-capable, and verify that TSO-Jumbo Frames are enabled wherepossible.
Network Rate (Mbps)The Network Rate chart displays network bandwidth on a host.
The Network Data Transmitted/Received chart for hosts is located in the Home view of the HostPerformance tab.
Table 1-73. Data Counters
Chart Label Description
Data Receive Rate Rate at which data is received across the top ten physical NIC instances on the host. Thisrepresents the bandwidth of the network. The chart also displays the aggregated datareceive rate of all physical NICs.
n Counter: received
n Stats Type: Rate
n Unit: Megabits per second (Mbps)
n Rollup Type: Average
n Collection Level: 3 (4)
Data Transmit Rate Rate at which data is transmitted across the top ten physical NIC instances on the host. Thisrepresents the bandwidth of the network. The chart also displays the aggregated datatransmit rate of all physical NICs.
n Counter: transmitted
n Stats Type: Rate
n Unit: Megabits per second (Mbps)
n Rollup Type: Average
n Collection Level: 3 (4)
vSphere Monitoring and Performance
VMware, Inc. 64

Chart Analysis
Network performance depends on the application workload and network configuration. Dropped networkpackets indicate a bottleneck in the network. To determine whether packets are being dropped, useesxtop or the advanced performance charts to examine the droppedTx and droppedRx network countervalues.
If packets are being dropped, adjust the virtual machine shares. If packets are not being dropped, checkthe size of the network packets and the data receive and transfer rates. In general, the larger the networkpackets, the faster the network speed. When the packet size is large, fewer packets are transferred,which reduces the amount of CPU required to process the data. When network packets are small, morepackets are transferred but the network speed is slower because more CPU is required to process thedata.
Note In some instances, large packets might result in a high network latency. To check the networklatency, use the VMware AppSpeed performance monitoring application or a third-party application.
If packets are not being dropped and the data receive rate is slow, the host is probably lacking the CPUresources required to handle the load. Check the number of virtual machines assigned to each physicalNIC. If necessary, perform load balancing by moving virtual machines to different vSwitches or by addingmore NICs to the host. You can also move virtual machines to another host or increase the host CPU orvirtual machine CPU.
If you experience network-related performance problems, also consider taking the following actions.
Table 1-74. Networking Performance Enhancement Advice
# Resolution
1 Verify that VMware Tools is installed on each virtual machine.
2 If possible, use vmxnet3 NIC drivers, which are available with VMware Tools. They are optimized for high performance.
3 If virtual machines running on the same host communicate with each other, connect them to the same vSwitch to avoidtransferring packets over the physical network.
4 Assign each physical NIC to a port group and a vSwitch.
5 Use separate physical NICs to handle the different traffic streams, such as network packets generated by virtual machines,iSCSI protocols, vMotion tasks.
6 Ensure that the physical NIC capacity is large enough to handle the network traffic on that vSwitch. If the capacity is notenough, consider using a high-bandwidth physical NIC (10 Gbps). Alternatively, consider moving some virtual machines to avSwitch with a lighter load or to a new vSwitch.
7 If packets are being dropped at the vSwitch port, increase the virtual network driver ring buffers where applicable.
8 Verify that the reported speed and duplex settings for the physical NIC match the hardware expectations and that thehardware is configured to run at its maximum capability. For example, verify that NICs with 1 Gbps are not reset to 100 Mbpsbecause they are connected to an older switch.
9 Verify that all NICs are running in full duplex mode. Hardware connectivity problems might result in a NIC resetting itself to alower speed or half duplex mode.
10 Use vNICs that are TCP Segmentation Offload (TSO)-capable, and verify that TSO-Jumbo Frames are enabled wherepossible.
vSphere Monitoring and Performance
VMware, Inc. 65
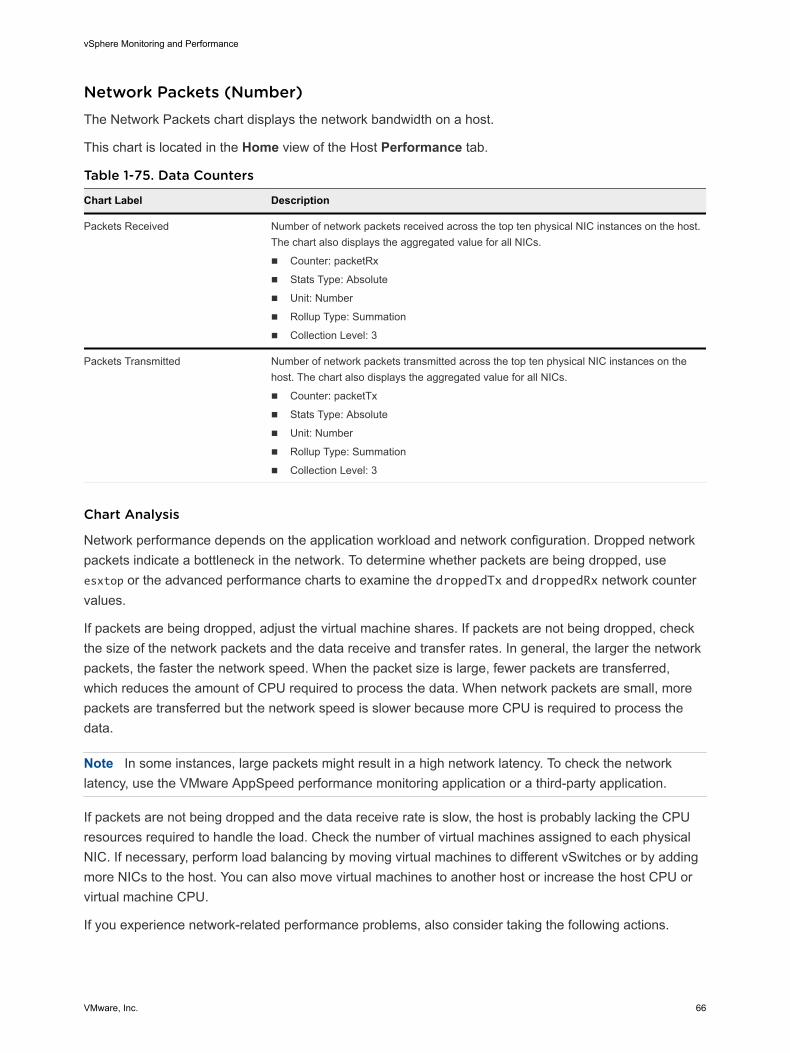
Network Packets (Number)The Network Packets chart displays the network bandwidth on a host.
This chart is located in the Home view of the Host Performance tab.
Table 1-75. Data Counters
Chart Label Description
Packets Received Number of network packets received across the top ten physical NIC instances on the host.The chart also displays the aggregated value for all NICs.
n Counter: packetRx
n Stats Type: Absolute
n Unit: Number
n Rollup Type: Summation
n Collection Level: 3
Packets Transmitted Number of network packets transmitted across the top ten physical NIC instances on thehost. The chart also displays the aggregated value for all NICs.
n Counter: packetTx
n Stats Type: Absolute
n Unit: Number
n Rollup Type: Summation
n Collection Level: 3
Chart Analysis
Network performance depends on the application workload and network configuration. Dropped networkpackets indicate a bottleneck in the network. To determine whether packets are being dropped, useesxtop or the advanced performance charts to examine the droppedTx and droppedRx network countervalues.
If packets are being dropped, adjust the virtual machine shares. If packets are not being dropped, checkthe size of the network packets and the data receive and transfer rates. In general, the larger the networkpackets, the faster the network speed. When the packet size is large, fewer packets are transferred,which reduces the amount of CPU required to process the data. When network packets are small, morepackets are transferred but the network speed is slower because more CPU is required to process thedata.
Note In some instances, large packets might result in a high network latency. To check the networklatency, use the VMware AppSpeed performance monitoring application or a third-party application.
If packets are not being dropped and the data receive rate is slow, the host is probably lacking the CPUresources required to handle the load. Check the number of virtual machines assigned to each physicalNIC. If necessary, perform load balancing by moving virtual machines to different vSwitches or by addingmore NICs to the host. You can also move virtual machines to another host or increase the host CPU orvirtual machine CPU.
If you experience network-related performance problems, also consider taking the following actions.
vSphere Monitoring and Performance
VMware, Inc. 66

Table 1-76. Networking Performance Enhancement Advice
# Resolution
1 Verify that VMware Tools is installed on each virtual machine.
2 If possible, use vmxnet3 NIC drivers, which are available with VMware Tools. They are optimized for high performance.
3 If virtual machines running on the same host communicate with each other, connect them to the same vSwitch to avoidtransferring packets over the physical network.
4 Assign each physical NIC to a port group and a vSwitch.
5 Use separate physical NICs to handle the different traffic streams, such as network packets generated by virtual machines,iSCSI protocols, vMotion tasks.
6 Ensure that the physical NIC capacity is large enough to handle the network traffic on that vSwitch. If the capacity is notenough, consider using a high-bandwidth physical NIC (10 Gbps). Alternatively, consider moving some virtual machines to avSwitch with a lighter load or to a new vSwitch.
7 If packets are being dropped at the vSwitch port, increase the virtual network driver ring buffers where applicable.
8 Verify that the reported speed and duplex settings for the physical NIC match the hardware expectations and that thehardware is configured to run at its maximum capability. For example, verify that NICs with 1 Gbps are not reset to 100 Mbpsbecause they are connected to an older switch.
9 Verify that all NICs are running in full duplex mode. Hardware connectivity problems might result in a NIC resetting itself to alower speed or half duplex mode.
10 Use vNICs that are TCP Segmentation Offload (TSO)-capable, and verify that TSO-Jumbo Frames are enabled wherepossible.
Network (Mbps)The Network (Mbps) chart displays network usage for the 10 virtual machines on the host with the mostnetwork usage.
This chart is located in the Virtual Machines view of the host Performance tab.
Table 1-77. Data Counters
Chart Label Description
<virtual machine> Sum of the data transmitted and received across all virtual NIC instances connected to the virtualmachine.
n Counter: usage
n Stats Type: Rate
n Unit: Megabits per second (Mbps)
n Rollup Type: Average (Minimum/Maximum)
n Collection Level: 1 (4)
Chart Analysis
Network performance depends on the application workload and network configuration. Dropped networkpackets indicate a bottleneck in the network. To determine whether packets are being dropped, useesxtop or the advanced performance charts to examine the droppedTx and droppedRx network countervalues.
vSphere Monitoring and Performance
VMware, Inc. 67

If packets are being dropped, adjust the virtual machine shares. If packets are not being dropped, checkthe size of the network packets and the data receive and transfer rates. In general, the larger the networkpackets, the faster the network speed. When the packet size is large, fewer packets are transferred,which reduces the amount of CPU required to process the data. When network packets are small, morepackets are transferred but the network speed is slower because more CPU is required to process thedata.
Note In some instances, large packets might result in a high network latency. To check the networklatency, use the VMware AppSpeed performance monitoring application or a third-party application.
If packets are not being dropped and the data receive rate is slow, the host is probably lacking the CPUresources required to handle the load. Check the number of virtual machines assigned to each physicalNIC. If necessary, perform load balancing by moving virtual machines to different vSwitches or by addingmore NICs to the host. You can also move virtual machines to another host or increase the host CPU orvirtual machine CPU.
If you experience network-related performance problems, also consider taking the following actions.
Table 1-78. Networking Performance Enhancement Advice
# Resolution
1 Verify that VMware Tools is installed on each virtual machine.
2 If possible, use vmxnet3 NIC drivers, which are available with VMware Tools. They are optimized for high performance.
3 If virtual machines running on the same host communicate with each other, connect them to the same vSwitch to avoidtransferring packets over the physical network.
4 Assign each physical NIC to a port group and a vSwitch.
5 Use separate physical NICs to handle the different traffic streams, such as network packets generated by virtual machines,iSCSI protocols, vMotion tasks.
6 Ensure that the physical NIC capacity is large enough to handle the network traffic on that vSwitch. If the capacity is notenough, consider using a high-bandwidth physical NIC (10 Gbps). Alternatively, consider moving some virtual machines to avSwitch with a lighter load or to a new vSwitch.
7 If packets are being dropped at the vSwitch port, increase the virtual network driver ring buffers where applicable.
8 Verify that the reported speed and duplex settings for the physical NIC match the hardware expectations and that thehardware is configured to run at its maximum capability. For example, verify that NICs with 1 Gbps are not reset to 100 Mbpsbecause they are connected to an older switch.
9 Verify that all NICs are running in full duplex mode. Hardware connectivity problems might result in a NIC resetting itself to alower speed or half duplex mode.
10 Use vNICs that are TCP Segmentation Offload (TSO)-capable, and verify that TSO-Jumbo Frames are enabled wherepossible.
Resource PoolsThe resource pool charts contain information about CPU and memory usage for resource pools. The helptopic for each chart contains information about the data counters displayed in that chart. The countersavailable are determined by the collection level set for vCenter Server.
vSphere Monitoring and Performance
VMware, Inc. 68

CPU (MHz)The CPU (MHz) chart displays CPU usage in the resource pool or vApp.
This chart is located in the Home view of the Resource Pool or vApp Performance tab.
Counters
Table 1-79. Data Counters
Chart Label Description
Usage CPU usage is the sum of the average CPU usage values of the virtual machines in the resource pool or vApp.
CPU usage = number of cores * CPU frequency
n Counter: usagemhz
n Stats Type: Rate
n Unit: Megahertz (MHz)
n Rollup Type: Average (Minimum/Maximum)
n Collection Level: 1 (4)
Chart Analysis
A short spike in CPU usage indicates that you are making the best use of the resources available.However, if the value is constantly high, the CPU demanded is likely greater than the CPU capacityavailable. A high CPU usage value can lead to increased ready time and processor queuing of the virtualmachines in the resource pool. Generally, if the CPU usage value for a virtual machine is above 90% andthe CPU ready value for a virtual machine is above 20%, performance is impacted.
If performance is impacted, consider taking the following actions.
Table 1-80. CPU Performance Enhancement Advice
# Resolution
1 Verify that VMware Tools is installed on each virtual machine.
2 Deploy single-threaded applications on uniprocessor virtual machines instead of SMP virtual machines.
3 Migrate one or more virtual machines to a new host.
4 Upgrade the physical CPUs or cores on each host if necessary.
5 Enable CPU-saving features, such as TCP Segmentation Offload.
6 Replace software I/O with dedicated hardware, such as iSCSI HBAs or TCP Segmentation Offload NICs.
CPU UsageThe CPU Usage chart displays CPU usage of virtual machines in the resource pool or vApp. The chartdisplays the top 10 virtual machines with the highest CPU usage.
This chart is located in the Resource Pools & Virtual Machines view of the Resource Pool or vAppPerformance tab.
vSphere Monitoring and Performance
VMware, Inc. 69
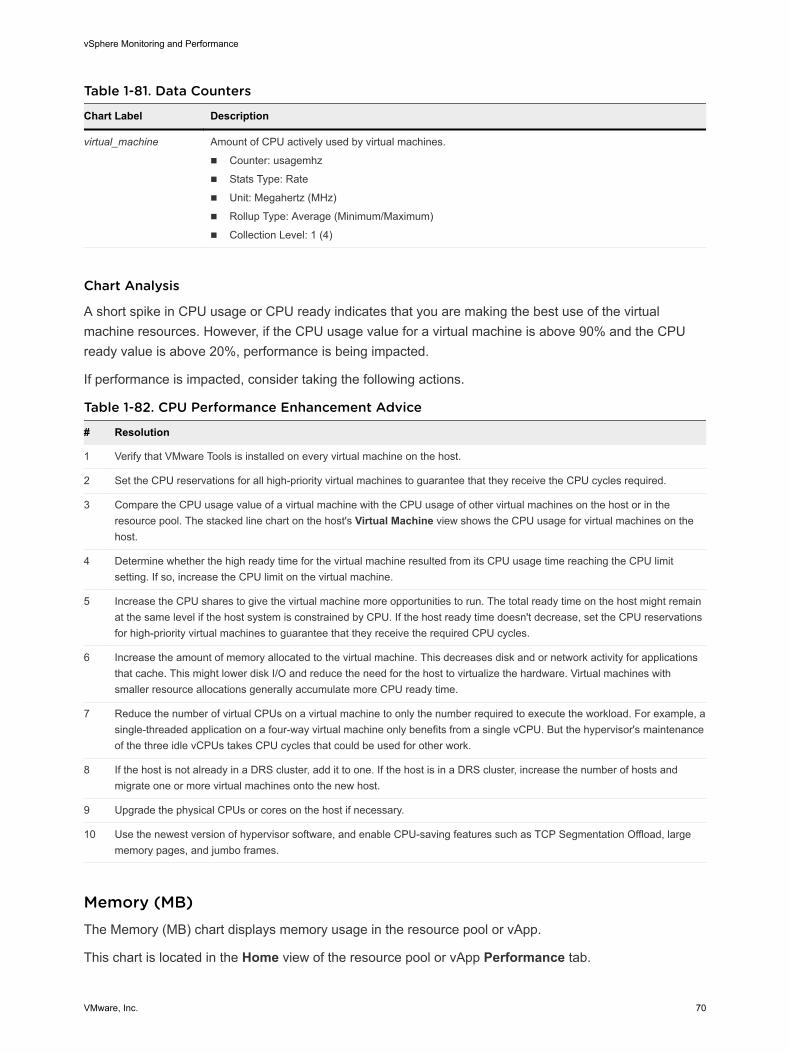
Table 1-81. Data Counters
Chart Label Description
virtual_machine Amount of CPU actively used by virtual machines.
n Counter: usagemhz
n Stats Type: Rate
n Unit: Megahertz (MHz)
n Rollup Type: Average (Minimum/Maximum)
n Collection Level: 1 (4)
Chart Analysis
A short spike in CPU usage or CPU ready indicates that you are making the best use of the virtualmachine resources. However, if the CPU usage value for a virtual machine is above 90% and the CPUready value is above 20%, performance is being impacted.
If performance is impacted, consider taking the following actions.
Table 1-82. CPU Performance Enhancement Advice
# Resolution
1 Verify that VMware Tools is installed on every virtual machine on the host.
2 Set the CPU reservations for all high-priority virtual machines to guarantee that they receive the CPU cycles required.
3 Compare the CPU usage value of a virtual machine with the CPU usage of other virtual machines on the host or in theresource pool. The stacked line chart on the host's Virtual Machine view shows the CPU usage for virtual machines on thehost.
4 Determine whether the high ready time for the virtual machine resulted from its CPU usage time reaching the CPU limitsetting. If so, increase the CPU limit on the virtual machine.
5 Increase the CPU shares to give the virtual machine more opportunities to run. The total ready time on the host might remainat the same level if the host system is constrained by CPU. If the host ready time doesn't decrease, set the CPU reservationsfor high-priority virtual machines to guarantee that they receive the required CPU cycles.
6 Increase the amount of memory allocated to the virtual machine. This decreases disk and or network activity for applicationsthat cache. This might lower disk I/O and reduce the need for the host to virtualize the hardware. Virtual machines withsmaller resource allocations generally accumulate more CPU ready time.
7 Reduce the number of virtual CPUs on a virtual machine to only the number required to execute the workload. For example, asingle-threaded application on a four-way virtual machine only benefits from a single vCPU. But the hypervisor's maintenanceof the three idle vCPUs takes CPU cycles that could be used for other work.
8 If the host is not already in a DRS cluster, add it to one. If the host is in a DRS cluster, increase the number of hosts andmigrate one or more virtual machines onto the new host.
9 Upgrade the physical CPUs or cores on the host if necessary.
10 Use the newest version of hypervisor software, and enable CPU-saving features such as TCP Segmentation Offload, largememory pages, and jumbo frames.
Memory (MB)The Memory (MB) chart displays memory usage in the resource pool or vApp.
This chart is located in the Home view of the resource pool or vApp Performance tab.
vSphere Monitoring and Performance
VMware, Inc. 70

Table 1-83. Data Counters
Chart Label Description
resource_pool or vApp Sum of the active memory used by all virtual machines in the resource pool or vApp. Active memory isdetermined by the VMkernel and includes overhead memory.
memory usage = active memory / configured virtual machine memory size
n Counter: used
n Stats Type: Absolute
n Unit: Megabytes (MB)
n Rollup Type: Average
n Collection Level: 1
Chart Analysis
Memory usage is not an indicator of performance problems. Memory can be high if a host is swapping orballooning, which can result in virtual machine guest swapping. In such cases, check for other problems,such as CPU over-commitment or storage latencies.
If you have constantly high memory usage in a cluster, resource pool, or vApp, consider taking thefollowing actions.
Table 1-84. Memory Performance Enhancement Advice
# Resolution
1 Verify that VMware Tools is installed on each virtual machine.
2 Verify that the balloon driver is enabled. The balloon driver is installed with VMware Tools and is critical to performance. TheVMkernel regularly reclaims unused virtual machine memory by ballooning and swapping. Generally, it does not impact virtualmachine performance.
3 If the balloon value is high, check the resource shares, reservations, and limits for the virtual machines and resource pools onthe hosts. Verify that the host's settings are adequate and not lower than those set for the virtual machine. If free memory isavailable on the hosts and the virtual machines are experiencing high swap or balloon memory, the virtual machine (orresource pool, if it belongs to one) has reached its resource limit. Check the maximum resource limit set on that host.
4 If the cluster is not a DRS cluster, enable DRS. To enable DRS, perform the following tasks:
1 Select the cluster, and click the Configure tab.
2 Under Services, click vSphere DRS.
3 click Edit.
An Edit Cluster Settings dialog box opens.
4 Click Turn ON vSphere DRS, and click OK.
5 If the cluster is a DRS cluster:
n Increase the number of hosts, and migrate one or more virtual machines to the new host.
n Check the aggressiveness threshold. If the value is low, increase the threshold. It might help avoid hot spots in thecluster.
6 Add more physical memory to one or more hosts.
Memory ConsumedThe Memory Consumed chart displays the memory performance of all virtual machines in the resourcepool or vApp.
vSphere Monitoring and Performance
VMware, Inc. 71

This chart is located in the Resource Pools & Virtual Machines view of the resource pool or vAppPerformance tab.
For resource pools and virtual machines in a resource pool or vApp, this chart is located in the ResourcePools & Virtual Machines view of the resource pool or vApp Performance tab.
Table 1-85. Data Counters
Chart Label Description
virtual_machine Amount of host memory used by the virtual machine for its guest operating system's physical memory.Memory overhead is not included in consumed memory.
consumed memory = memory granted - memory saved from page sharing
For example, if a virtual machine has 100 MB of memory that is shared equally with three other virtualmachines, its portion of the shared memory is 25 MB (100 MB ÷ 4 VMs). This amount is counted in thememory consumed data counter.
n Counter: consumed
n Stats Type: Absolute
n Unit: Megabytes (MB)
n Rollup Type: Average (Minimum/Maximum)
n Collection Level: 1 (4)
Chart Analysis
A virtual machine's memory size must be slightly larger than the average guest memory usage. Thisenables the host to accommodate workload spikes without swapping memory among guests. Increasingthe virtual machine memory size results in more overhead memory usage.
If sufficient swap space is available, a high balloon value does not cause performance problems.However, if the swapin and swapout values for the host are large, the host is probably lacking the amountof memory required to meet the demand.
If a virtual machine has high ballooning or swapping, check the amount of free physical memory on thehost. A free memory value of 6% or less indicates that the host cannot meet the memory requirements.This leads to memory reclamation, which might degrade performance. If the active memory size is thesame as the granted memory size, demand for memory is greater than the memory resources available. Ifthe active memory is consistently low, the memory size might be too large.
If the host has enough free memory, check the resource shares, reservation, and limit of the virtualmachines and resource pools on the host. Verify that the host settings are adequate and not lower thanthose set for the virtual machine.
If little free memory is available, or if you notice degradation in performance, consider taking the followingactions.
Table 1-86. Memory Performance Enhancement Advice
# Resolution
1 Verify that VMware Tools is installed on each virtual machine. The balloon driver is installed with VMware Tools and is criticalto performance.
2 Verify that the balloon driver is enabled. The VMkernel regularly reclaims unused virtual machine memory by ballooning andswapping. Generally, this does not impact virtual machine performance.
vSphere Monitoring and Performance
VMware, Inc. 72

Table 1-86. Memory Performance Enhancement Advice (continued)
# Resolution
3 Reduce the memory space on the virtual machine, and correct the cache size if it is too large. This frees up memory for othervirtual machines.
4 If the memory reservation of the virtual machine is set to a value much higher than its active memory, decrease thereservation setting so that the VMkernel can reclaim the idle memory for other virtual machines on the host.
5 Migrate one or more virtual machines to a host in a DRS cluster.
6 Add physical memory to the host.
Memory (MB)The Memory (MB) chart displays memory data counters for resource pools or vApps.
Description
This chart is located in the Home view of the resource pool or vApp Performance tab.
Note These data counter definitions are for virtual machines. At the resource pool level, the values arecollected and totaled. The counter values in the chart represent the aggregate amounts of the virtualmachine data. The counters that appear in the chart depend on the collection level set for your vCenterServer.
Table 1-87. Data Counters
Chart Label Description
Active Sum of the active guest physical memory of all powered on virtual machines in the resourcepool.
n Counter: active
n Stats Type: Absolute
n Unit: Megabytes (MB)
n Rollup Type: Average (Minimum/Maximum)
n Collection Level: 2 (4)
Balloon Sum of the guest physical memory reclaimed by the balloon driver for all powered on virtualmachines in the resource pool.
n Counter: vmmemctl
n Stats Type: Absolute
n Unit: Megabytes (MB)
n Rollup Type: Average (Minimum/Maximum)
n Collection Level: 1 (4)
vSphere Monitoring and Performance
VMware, Inc. 73

Table 1-87. Data Counters (continued)
Chart Label Description
Consumed Amount of the physical memory consumed by the virtual machine for the guest memory.Consumed memory does not include the overhead memory. It includes the shared memoryand memory that might be reserved, but not actually used.
consumed memory = memory granted – memory saved due to memory sharing
n Counter: consumed
n Stats Type: Absolute
n Unit: Megabytes (MB)
n Rollup Type: Average (Minimum/Maximum)
n Collection Level: 1 (4)
Granted Sum of the guest physical memory granted for all powered on virtual machines. Grantedmemory is mapped to the host's machine memory.
n Counter: granted
n Stats Type: Absolute
n Unit: Megabytes (MB)
n Rollup Type: Average (Minimum/Maximum)
n Collection Level: 2 (4)
Shared Amount of the guest physical memory shared with other virtual machines in the resourcepool.
Swapped Sum of the memory swapped by all powered on virtual machines in the resource pool.
n Counter: swapused
n Stats Type: Absolute
n Unit: Megabytes (MB)
n Rollup Type: Average (Minimum/Maximum)
n Collection Level: 2 (4)
Chart Analysis
A virtual machine's memory size must be slightly larger than the average guest memory usage. Thisenables the host to accommodate workload spikes without swapping memory among guests. Increasingthe virtual machine memory size results in more overhead memory usage.
If sufficient swap space is available, a high balloon value does not cause performance problems.However, if the swapin and swapout values for the host are large, the host is probably lacking the amountof memory required to meet the demand.
If a virtual machine has high ballooning or swapping, check the amount of free physical memory on thehost. A free memory value of 6% or less indicates that the host cannot meet the memory requirements.This leads to memory reclamation, which might degrade performance. If the active memory size is thesame as the granted memory size, demand for memory is greater than the memory resources available. Ifthe active memory is consistently low, the memory size might be too large.
If the host has enough free memory, check the resource shares, reservation, and limit of the virtualmachines and resource pools on the host. Verify that the host settings are adequate and not lower thanthose set for the virtual machine.
vSphere Monitoring and Performance
VMware, Inc. 74

If little free memory is available, or if you notice degradation in performance, consider taking the followingactions.
Table 1-88. Memory Performance Enhancement Advice
# Resolution
1 Verify that VMware Tools is installed on each virtual machine. The balloon driver is installed with VMware Tools and is criticalto performance.
2 Verify that the balloon driver is enabled. The VMkernel regularly reclaims unused virtual machine memory by ballooning andswapping. Generally, this does not impact virtual machine performance.
3 Reduce the memory space on the virtual machine, and correct the cache size if it is too large. This frees up memory for othervirtual machines.
4 If the memory reservation of the virtual machine is set to a value much higher than its active memory, decrease thereservation setting so that the VMkernel can reclaim the idle memory for other virtual machines on the host.
5 Migrate one or more virtual machines to a host in a DRS cluster.
6 Add physical memory to the host.
vAppsThe vApp charts contain information about CPU and memory usage for vApps. The help topic for eachchart contains information about the data counters displayed in that chart. The counters available aredetermined by the collection level set for vCenter Server.
CPU (MHz)The CPU (MHz) chart displays CPU usage in the vApp or resource pool.
This chart is located in the Home view of the vApp or resource pool Performance tab.
Counters
Table 1-89. Data Counters
Chart Label Description
Usage CPU usage is the sum of the average CPU usage values of the virtual machines in the resource pool or vApp.
CPU usage = number of cores * CPU frequency
n Counter: usagemhz
n Stats Type: Rate
n Unit: Megahertz (MHz)
n Rollup Type: Average (Minimum/Maximum)
n Collection Level: 1 (4)
Chart Analysis
A short spike in CPU usage indicates that you are making the best use of the resources available.However, if the value is constantly high, the CPU demanded is likely greater than the CPU capacityavailable. A high CPU usage value can lead to increased ready time and processor queuing of the virtualmachines in the resource pool. Generally, if the CPU usage value for a virtual machine is above 90% andthe CPU ready value for a virtual machine is above 20%, performance is impacted.
vSphere Monitoring and Performance
VMware, Inc. 75

If performance is impacted, consider taking the following actions.
Table 1-90. CPU Performance Enhancement Advice
# Resolution
1 Verify that VMware Tools is installed on each virtual machine.
2 Deploy single-threaded applications on uniprocessor virtual machines instead of SMP virtual machines.
3 Migrate one or more virtual machines to a new host.
4 Upgrade the physical CPUs or cores on each host if necessary.
5 Enable CPU-saving features, such as TCP Segmentation Offload.
6 Replace software I/O with dedicated hardware, such as iSCSI HBAs or TCP Segmentation Offload NICs.
CPU UsageThe CPU Usage chart displays CPU usage of each virtual machine in the vApp or resource pool.
This chart is located in the Virtual Machines view of the vApp or resource pool Performance tab.
Table 1-91. Data Counters
Chart Label Description
virtual_machine Amount of CPU actively used by virtual machines.
n Counter: usagemhz
n Stats Type: Rate
n Unit: Megahertz (MHz)
n Rollup Type: Average (Minimum/Maximum)
n Collection Level: 1 (4)
Chart Analysis
A short spike in CPU usage or CPU ready indicates that you are making the best use of the virtualmachine resources. However, if the CPU usage value for a virtual machine is above 90% and the CPUready value is above 20%, performance is being impacted.
If performance is impacted, consider taking the following actions.
Table 1-92. CPU Performance Enhancement Advice
# Resolution
1 Verify that VMware Tools is installed on every virtual machine on the host.
2 Set the CPU reservations for all high-priority virtual machines to guarantee that they receive the CPU cycles required.
3 Compare the CPU usage value of a virtual machine with the CPU usage of other virtual machines on the host or in theresource pool. The stacked line chart on the host's Virtual Machine view shows the CPU usage for virtual machines on thehost.
4 Determine whether the high ready time for the virtual machine resulted from its CPU usage time reaching the CPU limitsetting. If so, increase the CPU limit on the virtual machine.
5 Increase the CPU shares to give the virtual machine more opportunities to run. The total ready time on the host might remainat the same level if the host system is constrained by CPU. If the host ready time doesn't decrease, set the CPU reservationsfor high-priority virtual machines to guarantee that they receive the required CPU cycles.
vSphere Monitoring and Performance
VMware, Inc. 76

Table 1-92. CPU Performance Enhancement Advice (continued)
# Resolution
6 Increase the amount of memory allocated to the virtual machine. This decreases disk and or network activity for applicationsthat cache. This might lower disk I/O and reduce the need for the host to virtualize the hardware. Virtual machines withsmaller resource allocations generally accumulate more CPU ready time.
7 Reduce the number of virtual CPUs on a virtual machine to only the number required to execute the workload. For example, asingle-threaded application on a four-way virtual machine only benefits from a single vCPU. But the hypervisor's maintenanceof the three idle vCPUs takes CPU cycles that could be used for other work.
8 If the host is not already in a DRS cluster, add it to one. If the host is in a DRS cluster, increase the number of hosts andmigrate one or more virtual machines onto the new host.
9 Upgrade the physical CPUs or cores on the host if necessary.
10 Use the newest version of hypervisor software, and enable CPU-saving features such as TCP Segmentation Offload, largememory pages, and jumbo frames.
Memory (MB)The Memory (MB) chart displays memory usage in the vApp or resource pool.
This chart is located in the Home view of the vApp or resource pool Performance tab.
Table 1-93. Data Counters
Chart Label Description
resource_pool or vApp Sum of the active memory used by all virtual machines in the resource pool or vApp. Active memory isdetermined by the VMkernel and includes overhead memory.
memory usage = active memory / configured virtual machine memory size
n Counter: used
n Stats Type: Absolute
n Unit: Megabytes (MB)
n Rollup Type: Average
n Collection Level: 1
Chart Analysis
Memory usage is not an indicator of performance problems. Memory can be high if a host is swapping orballooning, which can result in virtual machine guest swapping. In such cases, check for other problems,such as CPU over-commitment or storage latencies.
If you have constantly high memory usage in a cluster, resource pool, or vApp, consider taking thefollowing actions.
Table 1-94. Memory Performance Enhancement Advice
# Resolution
1 Verify that VMware Tools is installed on each virtual machine.
2 Verify that the balloon driver is enabled. The balloon driver is installed with VMware Tools and is critical to performance. TheVMkernel regularly reclaims unused virtual machine memory by ballooning and swapping. Generally, it does not impact virtualmachine performance.
vSphere Monitoring and Performance
VMware, Inc. 77
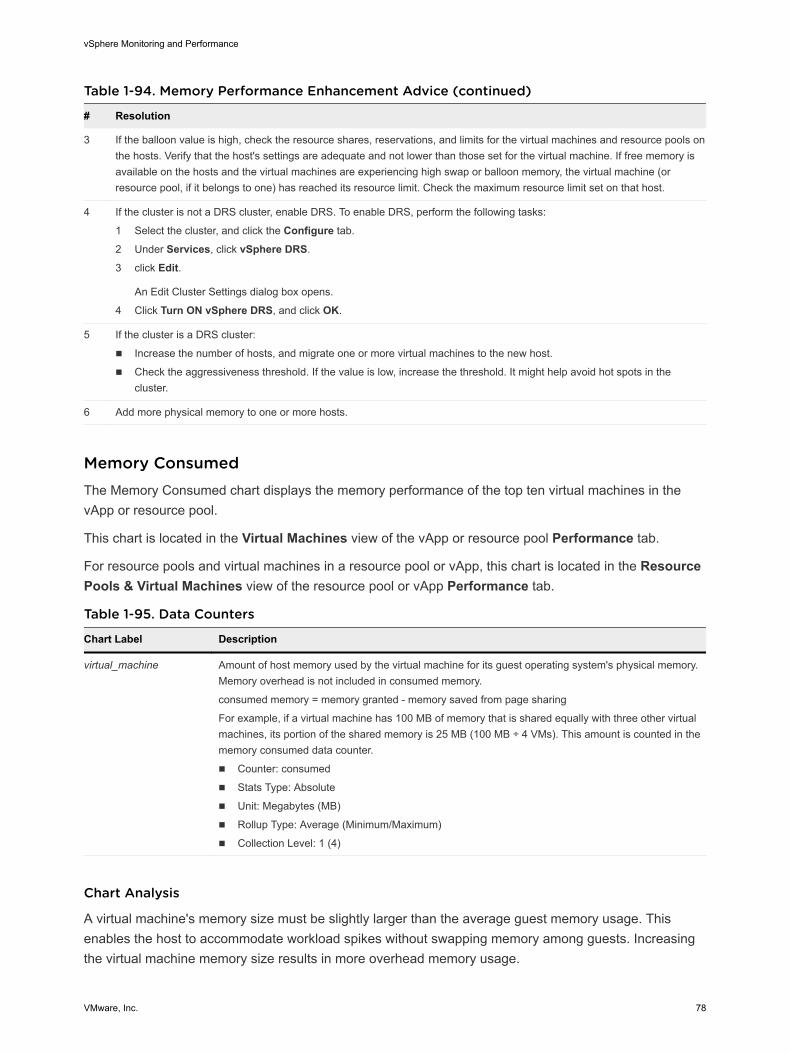
Table 1-94. Memory Performance Enhancement Advice (continued)
# Resolution
3 If the balloon value is high, check the resource shares, reservations, and limits for the virtual machines and resource pools onthe hosts. Verify that the host's settings are adequate and not lower than those set for the virtual machine. If free memory isavailable on the hosts and the virtual machines are experiencing high swap or balloon memory, the virtual machine (orresource pool, if it belongs to one) has reached its resource limit. Check the maximum resource limit set on that host.
4 If the cluster is not a DRS cluster, enable DRS. To enable DRS, perform the following tasks:
1 Select the cluster, and click the Configure tab.
2 Under Services, click vSphere DRS.
3 click Edit.
An Edit Cluster Settings dialog box opens.
4 Click Turn ON vSphere DRS, and click OK.
5 If the cluster is a DRS cluster:
n Increase the number of hosts, and migrate one or more virtual machines to the new host.
n Check the aggressiveness threshold. If the value is low, increase the threshold. It might help avoid hot spots in thecluster.
6 Add more physical memory to one or more hosts.
Memory ConsumedThe Memory Consumed chart displays the memory performance of the top ten virtual machines in thevApp or resource pool.
This chart is located in the Virtual Machines view of the vApp or resource pool Performance tab.
For resource pools and virtual machines in a resource pool or vApp, this chart is located in the ResourcePools & Virtual Machines view of the resource pool or vApp Performance tab.
Table 1-95. Data Counters
Chart Label Description
virtual_machine Amount of host memory used by the virtual machine for its guest operating system's physical memory.Memory overhead is not included in consumed memory.
consumed memory = memory granted - memory saved from page sharing
For example, if a virtual machine has 100 MB of memory that is shared equally with three other virtualmachines, its portion of the shared memory is 25 MB (100 MB ÷ 4 VMs). This amount is counted in thememory consumed data counter.
n Counter: consumed
n Stats Type: Absolute
n Unit: Megabytes (MB)
n Rollup Type: Average (Minimum/Maximum)
n Collection Level: 1 (4)
Chart Analysis
A virtual machine's memory size must be slightly larger than the average guest memory usage. Thisenables the host to accommodate workload spikes without swapping memory among guests. Increasingthe virtual machine memory size results in more overhead memory usage.
vSphere Monitoring and Performance
VMware, Inc. 78

If sufficient swap space is available, a high balloon value does not cause performance problems.However, if the swapin and swapout values for the host are large, the host is probably lacking the amountof memory required to meet the demand.
If a virtual machine has high ballooning or swapping, check the amount of free physical memory on thehost. A free memory value of 6% or less indicates that the host cannot meet the memory requirements.This leads to memory reclamation, which might degrade performance. If the active memory size is thesame as the granted memory size, demand for memory is greater than the memory resources available. Ifthe active memory is consistently low, the memory size might be too large.
If the host has enough free memory, check the resource shares, reservation, and limit of the virtualmachines and resource pools on the host. Verify that the host settings are adequate and not lower thanthose set for the virtual machine.
If little free memory is available, or if you notice degradation in performance, consider taking the followingactions.
Table 1-96. Memory Performance Enhancement Advice
# Resolution
1 Verify that VMware Tools is installed on each virtual machine. The balloon driver is installed with VMware Tools and is criticalto performance.
2 Verify that the balloon driver is enabled. The VMkernel regularly reclaims unused virtual machine memory by ballooning andswapping. Generally, this does not impact virtual machine performance.
3 Reduce the memory space on the virtual machine, and correct the cache size if it is too large. This frees up memory for othervirtual machines.
4 If the memory reservation of the virtual machine is set to a value much higher than its active memory, decrease thereservation setting so that the VMkernel can reclaim the idle memory for other virtual machines on the host.
5 Migrate one or more virtual machines to a host in a DRS cluster.
6 Add physical memory to the host.
Virtual MachinesThe virtual machine charts contain information about CPU, disk, memory, network, storage, and faulttolerance for virtual machines. The help topic for each chart contains information about the data countersdisplayed in that chart. The counters available are determined by the collection level set for vCenterServer.
CPU (%)The CPU (%) chart displays virtual machine CPU usage and ready values.
This chart is located in the Home view of the virtual machine Performance tab.
vSphere Monitoring and Performance
VMware, Inc. 79

Table 1-97. Data Counters
Chart Label Description
Usage Amount of actively used virtual CPU as a percentage of total available CPU.
CPU usage is the average CPU utilization over all available virtual CPUs in the virtual machine.
For example, if a virtual machine with one virtual CPU is running on a host that has four physical CPUs and theCPU usage is 100%, the virtual machine is using one physical CPU completely.
virtual CPU usage = usagemhz ÷ (number of virtual CPUs × core frequency)
Note This is the host's view of the CPU usage, not the guest operating system view.
n Counter: usage
n Stats Type: Rate
n Unit: Percentage (%). Precision is to 1/100%. A value between 0 and 100.
n Rollup Type: Average (Minimum/Maximum)
n Collection Level: 1 (4)
Ready Percentage of time that the virtual machine was ready, but could not get scheduled to run on the physical CPU.
CPU ready time is dependent on the number of virtual machines on the host and their CPU loads. At collection level1, the average CPU ready time of all virtual CPUs on the virtual machine is displayed. At collection level 3, theaverage CPU ready time of each virtual CPU is also displayed.
n Counter: ready
n Stats Type: Rate
n Unit: Percentage (%)
n Rollup Type: Summation
n Collection Level: 1
Chart Analysis
A short spike in CPU usage or CPU ready indicates that you are making the best use of the virtualmachine resources. However, if the CPU usage value for a virtual machine is above 90% and the CPUready value is above 20%, performance is being impacted.
If performance is impacted, consider taking the following actions.
Table 1-98. CPU Performance Enhancement Advice
# Resolution
1 Verify that VMware Tools is installed on every virtual machine on the host.
2 Set the CPU reservations for all high-priority virtual machines to guarantee that they receive the CPU cycles required.
3 Compare the CPU usage value of a virtual machine with the CPU usage of other virtual machines on the host or in theresource pool. The stacked line chart on the host's Virtual Machine view shows the CPU usage for virtual machines on thehost.
4 Determine whether the high ready time for the virtual machine resulted from its CPU usage time reaching the CPU limitsetting. If so, increase the CPU limit on the virtual machine.
5 Increase the CPU shares to give the virtual machine more opportunities to run. The total ready time on the host might remainat the same level if the host system is constrained by CPU. If the host ready time doesn't decrease, set the CPU reservationsfor high-priority virtual machines to guarantee that they receive the required CPU cycles.
6 Increase the amount of memory allocated to the virtual machine. This decreases disk and or network activity for applicationsthat cache. This might lower disk I/O and reduce the need for the host to virtualize the hardware. Virtual machines withsmaller resource allocations generally accumulate more CPU ready time.
vSphere Monitoring and Performance
VMware, Inc. 80

Table 1-98. CPU Performance Enhancement Advice (continued)
# Resolution
7 Reduce the number of virtual CPUs on a virtual machine to only the number required to execute the workload. For example, asingle-threaded application on a four-way virtual machine only benefits from a single vCPU. But the hypervisor's maintenanceof the three idle vCPUs takes CPU cycles that could be used for other work.
8 If the host is not already in a DRS cluster, add it to one. If the host is in a DRS cluster, increase the number of hosts andmigrate one or more virtual machines onto the new host.
9 Upgrade the physical CPUs or cores on the host if necessary.
10 Use the newest version of hypervisor software, and enable CPU-saving features such as TCP Segmentation Offload, largememory pages, and jumbo frames.
CPU Usage (MHz)The CPU Usage (MHz) chart displays virtual machine CPU usage.
This chart is located in the Home view of the Virtual Machine Performance tab.
Table 1-99. Data Counters
Chart Label Description
Usage Amount of actively used virtual CPU.
Note The host's view of the CPU usage, not the guest operating system view.
n Counter: usagemhz
n Stats Type: rate
n Unit: MegaHertz (MHz)
n Rollup Type: Average (Minimum/Maximum)
n Collection Level: 1 (4)
Chart Analysis
A short spike in CPU usage or CPU ready indicates that you are making the best use of the virtualmachine resources. However, if the CPU usage value for a virtual machine is above 90% and the CPUready value is above 20%, performance is being impacted.
If performance is impacted, consider taking the following actions.
Table 1-100. CPU Performance Enhancement Advice
# Resolution
1 Verify that VMware Tools is installed on every virtual machine on the host.
2 Set the CPU reservations for all high-priority virtual machines to guarantee that they receive the CPU cycles required.
3 Compare the CPU usage value of a virtual machine with the CPU usage of other virtual machines on the host or in theresource pool. The stacked line chart on the host's Virtual Machine view shows the CPU usage for virtual machines on thehost.
4 Determine whether the high ready time for the virtual machine resulted from its CPU usage time reaching the CPU limitsetting. If so, increase the CPU limit on the virtual machine.
vSphere Monitoring and Performance
VMware, Inc. 81
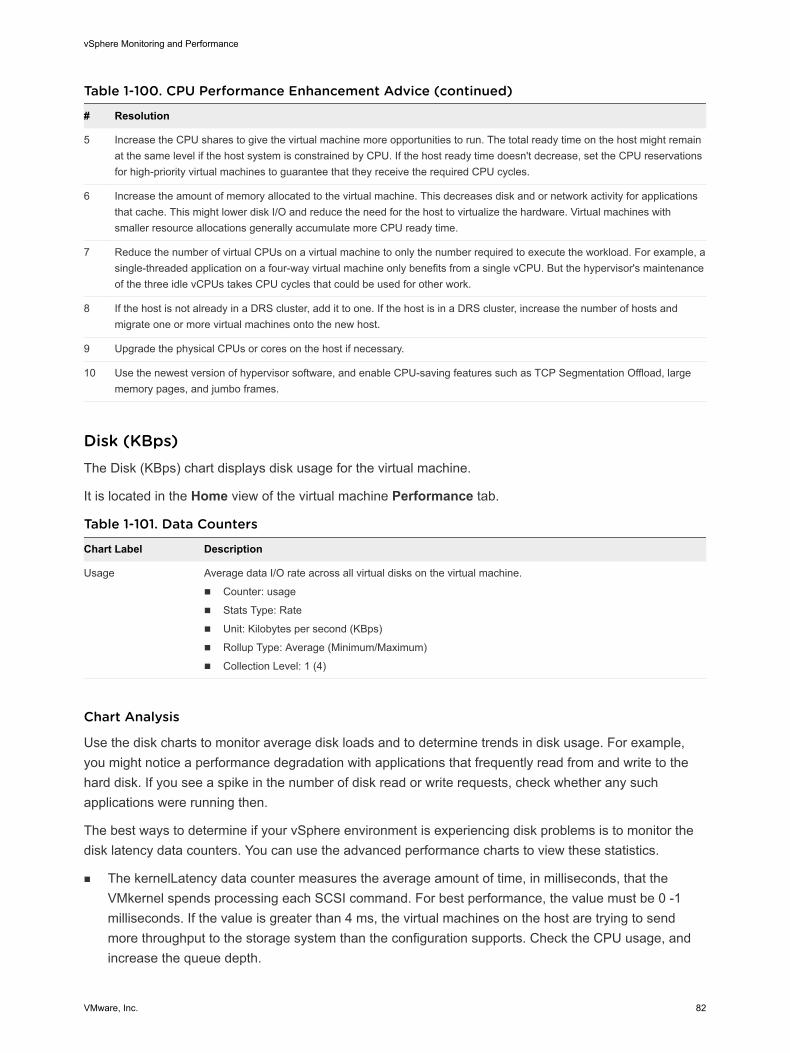
Table 1-100. CPU Performance Enhancement Advice (continued)
# Resolution
5 Increase the CPU shares to give the virtual machine more opportunities to run. The total ready time on the host might remainat the same level if the host system is constrained by CPU. If the host ready time doesn't decrease, set the CPU reservationsfor high-priority virtual machines to guarantee that they receive the required CPU cycles.
6 Increase the amount of memory allocated to the virtual machine. This decreases disk and or network activity for applicationsthat cache. This might lower disk I/O and reduce the need for the host to virtualize the hardware. Virtual machines withsmaller resource allocations generally accumulate more CPU ready time.
7 Reduce the number of virtual CPUs on a virtual machine to only the number required to execute the workload. For example, asingle-threaded application on a four-way virtual machine only benefits from a single vCPU. But the hypervisor's maintenanceof the three idle vCPUs takes CPU cycles that could be used for other work.
8 If the host is not already in a DRS cluster, add it to one. If the host is in a DRS cluster, increase the number of hosts andmigrate one or more virtual machines onto the new host.
9 Upgrade the physical CPUs or cores on the host if necessary.
10 Use the newest version of hypervisor software, and enable CPU-saving features such as TCP Segmentation Offload, largememory pages, and jumbo frames.
Disk (KBps)The Disk (KBps) chart displays disk usage for the virtual machine.
It is located in the Home view of the virtual machine Performance tab.
Table 1-101. Data Counters
Chart Label Description
Usage Average data I/O rate across all virtual disks on the virtual machine.
n Counter: usage
n Stats Type: Rate
n Unit: Kilobytes per second (KBps)
n Rollup Type: Average (Minimum/Maximum)
n Collection Level: 1 (4)
Chart Analysis
Use the disk charts to monitor average disk loads and to determine trends in disk usage. For example,you might notice a performance degradation with applications that frequently read from and write to thehard disk. If you see a spike in the number of disk read or write requests, check whether any suchapplications were running then.
The best ways to determine if your vSphere environment is experiencing disk problems is to monitor thedisk latency data counters. You can use the advanced performance charts to view these statistics.
n The kernelLatency data counter measures the average amount of time, in milliseconds, that theVMkernel spends processing each SCSI command. For best performance, the value must be 0 -1milliseconds. If the value is greater than 4 ms, the virtual machines on the host are trying to sendmore throughput to the storage system than the configuration supports. Check the CPU usage, andincrease the queue depth.
vSphere Monitoring and Performance
VMware, Inc. 82

n The deviceLatency data counter measures the average amount of time, in milliseconds, to complete aSCSI command from the physical device. Depending on your hardware, a number greater than 15 msindicates probable problems with the storage array. Move the active VMDK to a volume with morespindles or add disks to the LUN.
n The queueLatency data counter measures the average amount of time taken per SCSI command inthe VMkernel queue. This value must always be zero. If not, the workload is too high and the arraycannot process the data fast enough.
If the disk latency values are high, or if you notice other problems with disk I/O performance, considertaking the following actions.
Table 1-102. Disk I/O Performance Enhancement Advice
# Resolution
1 Increase the virtual machine memory. It allows more operating system caching, which reduces I/O activity. Note: It mightrequire you to increase the host memory. Increasing memory might reduce the need to store data because databases canutilize the system memory to cache data and avoid disk access.
To verify that virtual machines have adequate memory, check swap statistics in the guest operating system. Increase theguest memory, but not to an extent that leads to excessive host memory swapping. Install VMware Tools so that memoryballooning can occur.
2 Defragment the file systems on all guests.
3 Disable antivirus on-demand scans on the VMDK and VMEM files.
4 Use the vendor's array tools to determine the array performance statistics. When too many servers simultaneously accesscommon elements on an array, the disks might have trouble keeping up. To increase throughput, consider array-sideimprovements.
5 Use Storage vMotion to migrate I/O-intensive virtual machines across multiple hosts.
6 Balance the disk load across all physical resources available. Spread heavily used storage across LUNs that are accessedby different adapters. Use separate queues for each adapter to improve disk efficiency.
7 Configure the HBAs and RAID controllers for optimal use. Verify that the queue depths and cache settings on the RAIDcontrollers are adequate. If not, increase the number of outstanding disk requests for the virtual machine by adjusting theDisk.SchedNumReqOutstanding parameter. For more information, see vSphere Storage.
8 For resource-intensive virtual machines, separate the virtual machine's physical disk drive from the drive with the systempage file. It alleviates disk spindle contention during periods of high use.
9 On systems with sizable RAM, disable memory trimming by adding the line MemTrimRate=0 to the virtual machine's VMXfile.
10 If the combined disk I/O is higher than a single HBA capacity, use multipathing or multiple links.
11 For ESXi hosts, create virtual disks as preallocated. When you create a virtual disk for a guest operating system, selectAllocate all disk space now. The performance degradation associated with reassigning additional disk space does notoccur, and the disk is less likely to become fragmented.
12 Use the most current host hardware.
Disk Rate (KBps)The Disk Rate chart displays disk usage for the virtual machine.
vSphere Monitoring and Performance
VMware, Inc. 83

This chart is located in the Home view of the virtual machine Performance tab. It is available only atcollection levels 3 and 4.
Table 1-103. Data Counters
Chart Label Description
Read Number of disk read commands completed on each virtual disk on the virtual machine, persecond. The aggregate number of all disk read commands per second is also displayed inthe chart.
Read rate = blocksRead per second × blockSize
n Counter: read
n Stats Type: Rate
n Unit: Kilobytes per second (KBps)
n Rollup Type: Average
n Collection Level: 2
Write Number of disk write commands completed on each virtual disk on the virtual machine, persecond. The aggregate number of all disk write commands per second is also displayed inthe chart.
Write rate = blocksWritten per second × blockSize
n Counter: write
n Stats Type: Rate
n Unit: Kilobytes per second (KBps)
n Rollup Type: Average
n Collection Level: 2
Chart Analysis
Use the disk charts to monitor average disk loads and to determine trends in disk usage. For example,you might notice a performance degradation with applications that frequently read from and write to thehard disk. If you see a spike in the number of disk read or write requests, check whether any suchapplications were running then.
The best ways to determine if your vSphere environment is experiencing disk problems is to monitor thedisk latency data counters. You can use the advanced performance charts to view these statistics.
n The kernelLatency data counter measures the average amount of time, in milliseconds, that theVMkernel spends processing each SCSI command. For best performance, the value must be 0 -1milliseconds. If the value is greater than 4 ms, the virtual machines on the host are trying to sendmore throughput to the storage system than the configuration supports. Check the CPU usage, andincrease the queue depth.
n The deviceLatency data counter measures the average amount of time, in milliseconds, to complete aSCSI command from the physical device. Depending on your hardware, a number greater than 15 msindicates probable problems with the storage array. Move the active VMDK to a volume with morespindles or add disks to the LUN.
n The queueLatency data counter measures the average amount of time taken per SCSI command inthe VMkernel queue. This value must always be zero. If not, the workload is too high and the arraycannot process the data fast enough.
vSphere Monitoring and Performance
VMware, Inc. 84

If the disk latency values are high, or if you notice other problems with disk I/O performance, considertaking the following actions.
Table 1-104. Disk I/O Performance Enhancement Advice
# Resolution
1 Increase the virtual machine memory. It allows more operating system caching, which reduces I/O activity. Note: It mightrequire you to increase the host memory. Increasing memory might reduce the need to store data because databases canutilize the system memory to cache data and avoid disk access.
To verify that virtual machines have adequate memory, check swap statistics in the guest operating system. Increase theguest memory, but not to an extent that leads to excessive host memory swapping. Install VMware Tools so that memoryballooning can occur.
2 Defragment the file systems on all guests.
3 Disable antivirus on-demand scans on the VMDK and VMEM files.
4 Use the vendor's array tools to determine the array performance statistics. When too many servers simultaneously accesscommon elements on an array, the disks might have trouble keeping up. To increase throughput, consider array-sideimprovements.
5 Use Storage vMotion to migrate I/O-intensive virtual machines across multiple hosts.
6 Balance the disk load across all physical resources available. Spread heavily used storage across LUNs that are accessedby different adapters. Use separate queues for each adapter to improve disk efficiency.
7 Configure the HBAs and RAID controllers for optimal use. Verify that the queue depths and cache settings on the RAIDcontrollers are adequate. If not, increase the number of outstanding disk requests for the virtual machine by adjusting theDisk.SchedNumReqOutstanding parameter. For more information, see vSphere Storage.
8 For resource-intensive virtual machines, separate the virtual machine's physical disk drive from the drive with the systempage file. It alleviates disk spindle contention during periods of high use.
9 On systems with sizable RAM, disable memory trimming by adding the line MemTrimRate=0 to the virtual machine's VMXfile.
10 If the combined disk I/O is higher than a single HBA capacity, use multipathing or multiple links.
11 For ESXi hosts, create virtual disks as preallocated. When you create a virtual disk for a guest operating system, selectAllocate all disk space now. The performance degradation associated with reassigning additional disk space does notoccur, and the disk is less likely to become fragmented.
12 Use the most current host hardware.
Disk Requests (Number)The Disk Requests chart displays disk usage for the virtual machine.
This chart is located in the Home view of the virtual machine Performance tab. It is available only atcollection levels 3 and 4.
vSphere Monitoring and Performance
VMware, Inc. 85

Table 1-105. Data Counters
Chart Label Description
Read Requests Number of disk read commands completed on each virtual disk on the virtualmachine. The aggregate number of all disk read commands is also displayed inthe chart.
n Counter: numberRead
n Stats Type: Absolute
n Unit: Number
n Rollup Type: Summation
n Collection Level: 3
Write Requests Number of disk write commands completed on each virtual disk on the virtualmachine. The aggregate number of all disk write commands is also displayed inthe chart.
n Counter: numberWrite
n Stats Type: Absolute
n Unit: Number
n Rollup Type: Summation
n Collection Level: 3
Chart Analysis
Use the disk charts to monitor average disk loads and to determine trends in disk usage. For example,you might notice a performance degradation with applications that frequently read from and write to thehard disk. If you see a spike in the number of disk read or write requests, check whether any suchapplications were running then.
The best ways to determine if your vSphere environment is experiencing disk problems is to monitor thedisk latency data counters. You can use the advanced performance charts to view these statistics.
n The kernelLatency data counter measures the average amount of time, in milliseconds, that theVMkernel spends processing each SCSI command. For best performance, the value must be 0 -1milliseconds. If the value is greater than 4 ms, the virtual machines on the host are trying to sendmore throughput to the storage system than the configuration supports. Check the CPU usage, andincrease the queue depth.
n The deviceLatency data counter measures the average amount of time, in milliseconds, to complete aSCSI command from the physical device. Depending on your hardware, a number greater than 15 msindicates probable problems with the storage array. Move the active VMDK to a volume with morespindles or add disks to the LUN.
n The queueLatency data counter measures the average amount of time taken per SCSI command inthe VMkernel queue. This value must always be zero. If not, the workload is too high and the arraycannot process the data fast enough.
If the disk latency values are high, or if you notice other problems with disk I/O performance, considertaking the following actions.
vSphere Monitoring and Performance
VMware, Inc. 86

Table 1-106. Disk I/O Performance Enhancement Advice
# Resolution
1 Increase the virtual machine memory. It allows more operating system caching, which reduces I/O activity. Note: It mightrequire you to increase the host memory. Increasing memory might reduce the need to store data because databases canutilize the system memory to cache data and avoid disk access.
To verify that virtual machines have adequate memory, check swap statistics in the guest operating system. Increase theguest memory, but not to an extent that leads to excessive host memory swapping. Install VMware Tools so that memoryballooning can occur.
2 Defragment the file systems on all guests.
3 Disable antivirus on-demand scans on the VMDK and VMEM files.
4 Use the vendor's array tools to determine the array performance statistics. When too many servers simultaneously accesscommon elements on an array, the disks might have trouble keeping up. To increase throughput, consider array-sideimprovements.
5 Use Storage vMotion to migrate I/O-intensive virtual machines across multiple hosts.
6 Balance the disk load across all physical resources available. Spread heavily used storage across LUNs that are accessedby different adapters. Use separate queues for each adapter to improve disk efficiency.
7 Configure the HBAs and RAID controllers for optimal use. Verify that the queue depths and cache settings on the RAIDcontrollers are adequate. If not, increase the number of outstanding disk requests for the virtual machine by adjusting theDisk.SchedNumReqOutstanding parameter. For more information, see vSphere Storage.
8 For resource-intensive virtual machines, separate the virtual machine's physical disk drive from the drive with the systempage file. It alleviates disk spindle contention during periods of high use.
9 On systems with sizable RAM, disable memory trimming by adding the line MemTrimRate=0 to the virtual machine's VMXfile.
10 If the combined disk I/O is higher than a single HBA capacity, use multipathing or multiple links.
11 For ESXi hosts, create virtual disks as preallocated. When you create a virtual disk for a guest operating system, selectAllocate all disk space now. The performance degradation associated with reassigning additional disk space does notoccur, and the disk is less likely to become fragmented.
12 Use the most current host hardware.
Virtual Disk Requests (Number)The Virtual Disk Requests chart displays virtual disk usage for the virtual machine.
After you click Overview on the Performance tab of the virtual machine, you can view this chart byselecting Home from the View drop-down menu. It is available at collection (display) levels 3 and 4.
vSphere Monitoring and Performance
VMware, Inc. 87
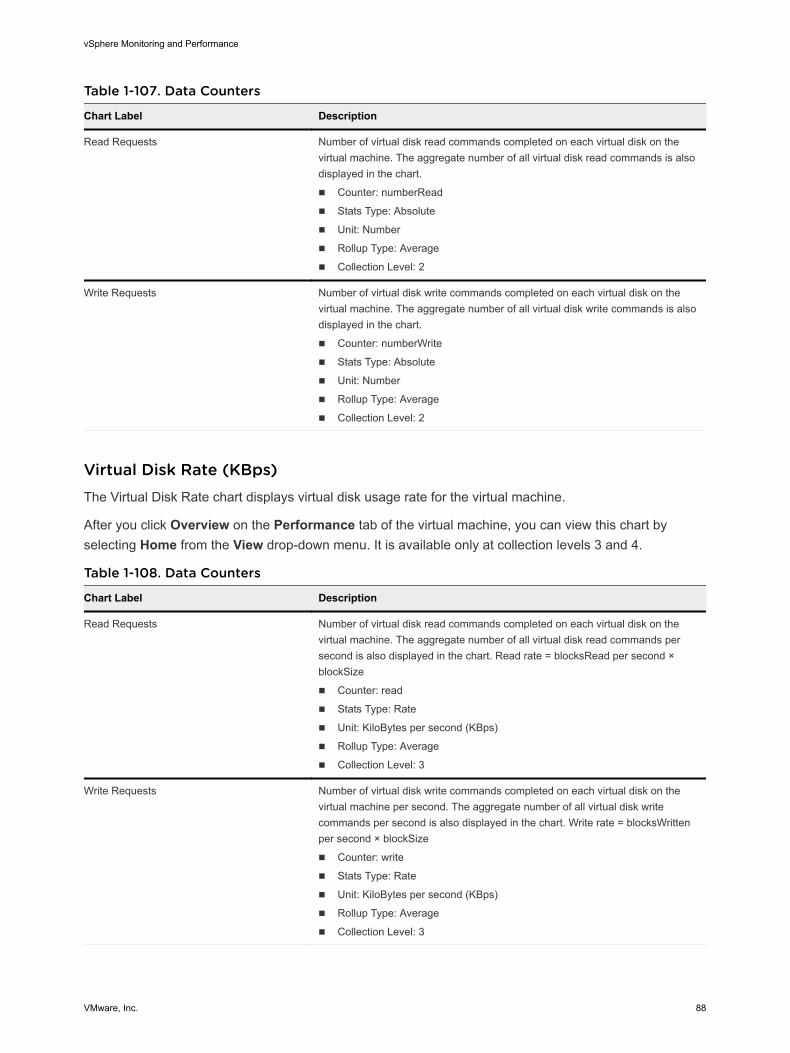
Table 1-107. Data Counters
Chart Label Description
Read Requests Number of virtual disk read commands completed on each virtual disk on thevirtual machine. The aggregate number of all virtual disk read commands is alsodisplayed in the chart.
n Counter: numberRead
n Stats Type: Absolute
n Unit: Number
n Rollup Type: Average
n Collection Level: 2
Write Requests Number of virtual disk write commands completed on each virtual disk on thevirtual machine. The aggregate number of all virtual disk write commands is alsodisplayed in the chart.
n Counter: numberWrite
n Stats Type: Absolute
n Unit: Number
n Rollup Type: Average
n Collection Level: 2
Virtual Disk Rate (KBps)The Virtual Disk Rate chart displays virtual disk usage rate for the virtual machine.
After you click Overview on the Performance tab of the virtual machine, you can view this chart byselecting Home from the View drop-down menu. It is available only at collection levels 3 and 4.
Table 1-108. Data Counters
Chart Label Description
Read Requests Number of virtual disk read commands completed on each virtual disk on thevirtual machine. The aggregate number of all virtual disk read commands persecond is also displayed in the chart. Read rate = blocksRead per second ×blockSize
n Counter: read
n Stats Type: Rate
n Unit: KiloBytes per second (KBps)
n Rollup Type: Average
n Collection Level: 3
Write Requests Number of virtual disk write commands completed on each virtual disk on thevirtual machine per second. The aggregate number of all virtual disk writecommands per second is also displayed in the chart. Write rate = blocksWrittenper second × blockSize
n Counter: write
n Stats Type: Rate
n Unit: KiloBytes per second (KBps)
n Rollup Type: Average
n Collection Level: 3
vSphere Monitoring and Performance
VMware, Inc. 88

Memory (%)The Memory (%) chart monitors virtual machine memory usage.
This chart is located in the Home view of the virtual machine Performance tab.
Virtual Machine Counters
Note Guest physical memory refers to the virtual hardware memory presented to a virtual machine for itsguest operating system.
Table 1-109. Data Counters
Chart Label Description
Usage Amount of guest physical memory currently in use on the virtual machine.
n Counter: usage
n Stats Type: Absolute
n Unit: Percentage (%)
n Rollup Type: Average (Minimum/Maximum)
n Collection Level: 1 (4)
Chart Analysis
A virtual machine's memory size must be slightly larger than the average guest memory usage. Thisenables the host to accommodate workload spikes without swapping memory among guests. Increasingthe virtual machine memory size results in more overhead memory usage.
If sufficient swap space is available, a high balloon value does not cause performance problems.However, if the swapin and swapout values for the host are large, the host is probably lacking the amountof memory required to meet the demand.
If a virtual machine has high ballooning or swapping, check the amount of free physical memory on thehost. A free memory value of 6% or less indicates that the host cannot meet the memory requirements.This leads to memory reclamation, which might degrade performance. If the active memory size is thesame as the granted memory size, demand for memory is greater than the memory resources available. Ifthe active memory is consistently low, the memory size might be too large.
If the host has enough free memory, check the resource shares, reservation, and limit of the virtualmachines and resource pools on the host. Verify that the host settings are adequate and not lower thanthose set for the virtual machine.
If little free memory is available, or if you notice degradation in performance, consider taking the followingactions.
Table 1-110. Memory Performance Enhancement Advice
# Resolution
1 Verify that VMware Tools is installed on each virtual machine. The balloon driver is installed with VMware Tools and is criticalto performance.
2 Verify that the balloon driver is enabled. The VMkernel regularly reclaims unused virtual machine memory by ballooning andswapping. Generally, this does not impact virtual machine performance.
vSphere Monitoring and Performance
VMware, Inc. 89

Table 1-110. Memory Performance Enhancement Advice (continued)
# Resolution
3 Reduce the memory space on the virtual machine, and correct the cache size if it is too large. This frees up memory for othervirtual machines.
4 If the memory reservation of the virtual machine is set to a value much higher than its active memory, decrease thereservation setting so that the VMkernel can reclaim the idle memory for other virtual machines on the host.
5 Migrate one or more virtual machines to a host in a DRS cluster.
6 Add physical memory to the host.
Memory (MB)The Memory (MB) chart displays virtual machine balloon memory.
This chart is located in the Home view of the virtual machine Performance tab.
Table 1-111. Data Counters
Chart Label Description
Balloon Amount of guest physical memory reclaimed from the virtual machine by the balloon driver.
n Counter: vmmemctl
n Stats Type: Absolute
n Unit: Megabytes (MB)
n Rollup Type: Average (Minimum/Maximum)
n Collection Level: 1 (4)
Chart Analysis
A virtual machine's memory size must be slightly larger than the average guest memory usage. Thisenables the host to accommodate workload spikes without swapping memory among guests. Increasingthe virtual machine memory size results in more overhead memory usage.
If sufficient swap space is available, a high balloon value does not cause performance problems.However, if the swapin and swapout values for the host are large, the host is probably lacking the amountof memory required to meet the demand.
If a virtual machine has high ballooning or swapping, check the amount of free physical memory on thehost. A free memory value of 6% or less indicates that the host cannot meet the memory requirements.This leads to memory reclamation, which might degrade performance. If the active memory size is thesame as the granted memory size, demand for memory is greater than the memory resources available. Ifthe active memory is consistently low, the memory size might be too large.
If the host has enough free memory, check the resource shares, reservation, and limit of the virtualmachines and resource pools on the host. Verify that the host settings are adequate and not lower thanthose set for the virtual machine.
If little free memory is available, or if you notice degradation in performance, consider taking the followingactions.
vSphere Monitoring and Performance
VMware, Inc. 90

Table 1-112. Memory Performance Enhancement Advice
# Resolution
1 Verify that VMware Tools is installed on each virtual machine. The balloon driver is installed with VMware Tools and is criticalto performance.
2 Verify that the balloon driver is enabled. The VMkernel regularly reclaims unused virtual machine memory by ballooning andswapping. Generally, this does not impact virtual machine performance.
3 Reduce the memory space on the virtual machine, and correct the cache size if it is too large. This frees up memory for othervirtual machines.
4 If the memory reservation of the virtual machine is set to a value much higher than its active memory, decrease thereservation setting so that the VMkernel can reclaim the idle memory for other virtual machines on the host.
5 Migrate one or more virtual machines to a host in a DRS cluster.
6 Add physical memory to the host.
Memory (MBps)The Memory (MBps) chart displays virtual machine memory swap rates.
This chart is located in the Home view of the Virtual Machine Performance tab.
Table 1-113. Data Counters
Chart Label Description
swapinRate Average rate at which memory is swapped into the virtual machine.
n Counter: swapinRate
n Stats Type: Rate
n Unit: MegaBytes per second (MBps)
n Rollup Type: Average (Minimum/Maximum)
n Collection Level: 1 (4)
swapoutRate Average rate at which memory is swapped out of the virtual machine.
n Counter: swapoutRate
n Stats Type: Rate
n Unit: MegaBytes per second (MBps)
n Rollup Type: Average (Minimum/Maximum)
n Collection Level: 1 (4)
Chart Analysis
A virtual machine's memory size must be slightly larger than the average guest memory usage. Thisenables the host to accommodate workload spikes without swapping memory among guests. Increasingthe virtual machine memory size results in more overhead memory usage.
If there is sufficient swap space, a high balloon value is not a performance issue. However, if the swapinand swapout values for the host are large, the host is probably lacking the memory required to meet thedemand.
vSphere Monitoring and Performance
VMware, Inc. 91

If a virtual machine has high ballooning or swapping, check the amount of free physical memory on thehost. The host might require more memory resources. If it does not, check the resource shares,reservation, and limit of the virtual machines and resource pools on the host. Verify that the host settingsare adequate and not lower than those set for the virtual machine.
If memory usage is high or you notice degradation in performance, consider taking the following actions.
Table 1-114. Memory Performance Enhancement Advice
# Resolution
1 Verify that VMware Tools is installed on each virtual machine. The balloon driver is installed with VMware Tools and is criticalto performance.
2 Verify that the balloon driver is enabled. The VMkernel regularly reclaims unused virtual machine memory by ballooning andswapping. Generally, this does not impact virtual machine performance.
3 Reduce the memory space on the virtual machine, and correct the cache size if it is too large. This frees up memory for othervirtual machines.
4 If the memory reservation of a virtual machine is set to a value much higher than its active memory, decrease the reservationsetting so that the VMkernel can reclaim the idle memory for other virtual machines on the host.
5 Migrate one or more virtual machines to a host in a DRS cluster.
6 Add physical memory to the host.
Memory (MB)The Memory (MB) chart displays memory data counters for virtual machines.
This chart is located in the Home view of the virtual machine Performance tab. It appears only atcollection levels 2, 3, and 4.
In the following descriptions, the guest physical memory refers to the virtual-hardware memory presentedto a virtual machine for its guest operating system. Machine memory is actual physical RAM in the host.Note that not all counters are collected at collection level 1.
vSphere Monitoring and Performance
VMware, Inc. 92

Table 1-115. Data Counters
Chart Label Description
Active Amount of guest physical memory in use by the virtual machine.
Active memory is estimated by VMkernel statistical sampling and represents the actual amount ofmemory the virtual machine needs. The value is based on the current workload of the virtualmachine.
n Counter: active
n Stats Type: Absolute
n Unit: Megabytes (MB)
n Rollup Type: Average (Minimum/Maximum)
n Collection Level: 2 (4)
Balloon Amount of guest physical memory reclaimed from the virtual machine by the balloon driver.
n Counter: vmmemctl
n Stats Type: Absolute
n Unit: Megabytes (MB)
n Rollup Type: Average (Minimum/Maximum)
n Collection Level: 1 (4)
Balloon Target Desired amount of virtual machine balloon memory.
Balloon target memory is estimated by the VMkernel.
If the balloon target amount is greater than the balloon amount, the VMkernel inflates the balloonamount, which reclaims more virtual machine memory. If the balloon target amount is less than theballoon amount, the VMkernel deflates the balloon, which allows the virtual machine to reallocatememory when needed.
n Counter: vmmemctltarget
n Stats Type: Absolute
n Unit: Megabytes (MB)
n Rollup Type: Average (Minimum/Maximum)
n Collection Level: 2 (4)
Consumed Amount of guest physical memory consumed by the virtual machine for guest memory.
Consumed memory does not include overhead memory. It includes shared memory and memorythat might be reserved, but not actually used.
consumed memory = memory granted - memory saved due to memory sharing
n Counter: consumed
n Stats Type: Absolute
n Unit: Megabytes (MB)
n Rollup Type: Average (Minimum/Maximum)
n Collection Level: 1 (4)
vSphere Monitoring and Performance
VMware, Inc. 93

Table 1-115. Data Counters (continued)
Chart Label Description
Shared Amount of guest physical memory available for sharing. Memory sharing occurs throughtransparent page sharing.
n Counter: shared
n Stats Type: Absolute
n Unit: Megabytes (MB)
n Rollup Type: Average (Minimum/Maximum)
n Collection Level: 2 (4)
Swapped The amount of guest physical memory swapped out to the disk by the VMkernel. This data countermeasures VMkernel swapping and not to guest OS swapping.
swapped = swapout – swapin
Note In some cases, vMotion can skew these values and cause a virtual machine to arrive on ahost with some memory already swapped out. As a result, the swapped value can be greater thanthe swapout – swapin value.
n Counter: swapped
n Stats Type: Absolute
n Unit: Megabytes (MB)
n Rollup Type: Average (Minimum/Maximum)
n Collection Level: 2 (4)
Chart Analysis
A virtual machine's memory size must be slightly larger than the average guest memory usage. Thisenables the host to accommodate workload spikes without swapping memory among guests. Increasingthe virtual machine memory size results in more overhead memory usage.
If sufficient swap space is available, a high balloon value does not cause performance problems.However, if the swapin and swapout values for the host are large, the host is probably lacking the amountof memory required to meet the demand.
If a virtual machine has high ballooning or swapping, check the amount of free physical memory on thehost. A free memory value of 6% or less indicates that the host cannot meet the memory requirements.This leads to memory reclamation, which might degrade performance. If the active memory size is thesame as the granted memory size, demand for memory is greater than the memory resources available. Ifthe active memory is consistently low, the memory size might be too large.
If the host has enough free memory, check the resource shares, reservation, and limit of the virtualmachines and resource pools on the host. Verify that the host settings are adequate and not lower thanthose set for the virtual machine.
If little free memory is available, or if you notice degradation in performance, consider taking the followingactions.
vSphere Monitoring and Performance
VMware, Inc. 94

Table 1-116. Memory Performance Enhancement Advice
# Resolution
1 Verify that VMware Tools is installed on each virtual machine. The balloon driver is installed with VMware Tools and is criticalto performance.
2 Verify that the balloon driver is enabled. The VMkernel regularly reclaims unused virtual machine memory by ballooning andswapping. Generally, this does not impact virtual machine performance.
3 Reduce the memory space on the virtual machine, and correct the cache size if it is too large. This frees up memory for othervirtual machines.
4 If the memory reservation of the virtual machine is set to a value much higher than its active memory, decrease thereservation setting so that the VMkernel can reclaim the idle memory for other virtual machines on the host.
5 Migrate one or more virtual machines to a host in a DRS cluster.
6 Add physical memory to the host.
Network (Mbps)The Network (Mbps) chart displays network bandwidth for the virtual machine.
This chart is located in the Home view of the Virtual Machine Performance tab.
Table 1-117. Virtual Machine Counters
Chart Label Description
Usage Average rate at which data is transmitted and received across all virtual NIC instancesconnected to the virtual machine.
n Counter: usage
n Stats Type: Rate
n Unit: Megabits per second (Mbps)
n Rollup Type: Average (Minimum/Maximum)
n Collection Level: 1 (4)
Chart Analysis
Network performance depends on the application workload and network configuration. Dropped networkpackets indicate a bottleneck in the network. To determine whether packets are being dropped, useesxtop or the advanced performance charts to examine the droppedTx and droppedRx network countervalues.
If packets are being dropped, adjust the virtual machine shares. If packets are not being dropped, checkthe size of the network packets and the data receive and transfer rates. In general, the larger the networkpackets, the faster the network speed. When the packet size is large, fewer packets are transferred,which reduces the amount of CPU required to process the data. When network packets are small, morepackets are transferred but the network speed is slower because more CPU is required to process thedata.
Note In some instances, large packets might result in a high network latency. To check the networklatency, use the VMware AppSpeed performance monitoring application or a third-party application.
vSphere Monitoring and Performance
VMware, Inc. 95

If packets are not being dropped and the data receive rate is slow, the host is probably lacking the CPUresources required to handle the load. Check the number of virtual machines assigned to each physicalNIC. If necessary, perform load balancing by moving virtual machines to different vSwitches or by addingmore NICs to the host. You can also move virtual machines to another host or increase the host CPU orvirtual machine CPU.
If you experience network-related performance problems, also consider taking the following actions.
Table 1-118. Networking Performance Enhancement Advice
# Resolution
1 Verify that VMware Tools is installed on each virtual machine.
2 If possible, use vmxnet3 NIC drivers, which are available with VMware Tools. They are optimized for high performance.
3 If virtual machines running on the same host communicate with each other, connect them to the same vSwitch to avoidtransferring packets over the physical network.
4 Assign each physical NIC to a port group and a vSwitch.
5 Use separate physical NICs to handle the different traffic streams, such as network packets generated by virtual machines,iSCSI protocols, vMotion tasks.
6 Ensure that the physical NIC capacity is large enough to handle the network traffic on that vSwitch. If the capacity is notenough, consider using a high-bandwidth physical NIC (10 Gbps). Alternatively, consider moving some virtual machines to avSwitch with a lighter load or to a new vSwitch.
7 If packets are being dropped at the vSwitch port, increase the virtual network driver ring buffers where applicable.
8 Verify that the reported speed and duplex settings for the physical NIC match the hardware expectations and that thehardware is configured to run at its maximum capability. For example, verify that NICs with 1 Gbps are not reset to 100 Mbpsbecause they are connected to an older switch.
9 Verify that all NICs are running in full duplex mode. Hardware connectivity problems might result in a NIC resetting itself to alower speed or half duplex mode.
10 Use vNICs that are TCP Segmentation Offload (TSO)-capable, and verify that TSO-Jumbo Frames are enabled wherepossible.
Network Rate (Mbps)The Network Rate chart displays network usage for virtual machines.
This chart is located in the Home view of the Virtual Machine Performance tab. It appears only atcollection levels 3 and 4.
vSphere Monitoring and Performance
VMware, Inc. 96

Table 1-119. Data Counters
Chart Label Description
Data Receive Rate Rate at which data is received across each virtual NIC instance on the virtual machine.
n Counter: received
n Stats Type: Rate
n Unit: Megabits per second (Mbps)
n Rollup Type: Average
n Collection Level: 2 (4)
Data Transmit Rate Rate at which data is transmitted across each virtual NIC instance on the virtual machine.
n Counter: transmitted
n Stats Type: Rate
n Unit: Megabits per second (Mbps)
n Rollup Type: Average
n Collection Level: 2 (4)
Chart Analysis
Network performance depends on the application workload and network configuration. Dropped networkpackets indicate a bottleneck in the network. To determine whether packets are being dropped, useesxtop or the advanced performance charts to examine the droppedTx and droppedRx network countervalues.
If packets are being dropped, adjust the virtual machine shares. If packets are not being dropped, checkthe size of the network packets and the data receive and transfer rates. In general, the larger the networkpackets, the faster the network speed. When the packet size is large, fewer packets are transferred,which reduces the amount of CPU required to process the data. When network packets are small, morepackets are transferred but the network speed is slower because more CPU is required to process thedata.
Note In some instances, large packets might result in a high network latency. To check the networklatency, use the VMware AppSpeed performance monitoring application or a third-party application.
If packets are not being dropped and the data receive rate is slow, the host is probably lacking the CPUresources required to handle the load. Check the number of virtual machines assigned to each physicalNIC. If necessary, perform load balancing by moving virtual machines to different vSwitches or by addingmore NICs to the host. You can also move virtual machines to another host or increase the host CPU orvirtual machine CPU.
If you experience network-related performance problems, also consider taking the following actions.
Table 1-120. Networking Performance Enhancement Advice
# Resolution
1 Verify that VMware Tools is installed on each virtual machine.
2 If possible, use vmxnet3 NIC drivers, which are available with VMware Tools. They are optimized for high performance.
3 If virtual machines running on the same host communicate with each other, connect them to the same vSwitch to avoidtransferring packets over the physical network.
vSphere Monitoring and Performance
VMware, Inc. 97

Table 1-120. Networking Performance Enhancement Advice (continued)
# Resolution
4 Assign each physical NIC to a port group and a vSwitch.
5 Use separate physical NICs to handle the different traffic streams, such as network packets generated by virtual machines,iSCSI protocols, vMotion tasks.
6 Ensure that the physical NIC capacity is large enough to handle the network traffic on that vSwitch. If the capacity is notenough, consider using a high-bandwidth physical NIC (10 Gbps). Alternatively, consider moving some virtual machines to avSwitch with a lighter load or to a new vSwitch.
7 If packets are being dropped at the vSwitch port, increase the virtual network driver ring buffers where applicable.
8 Verify that the reported speed and duplex settings for the physical NIC match the hardware expectations and that thehardware is configured to run at its maximum capability. For example, verify that NICs with 1 Gbps are not reset to 100 Mbpsbecause they are connected to an older switch.
9 Verify that all NICs are running in full duplex mode. Hardware connectivity problems might result in a NIC resetting itself to alower speed or half duplex mode.
10 Use vNICs that are TCP Segmentation Offload (TSO)-capable, and verify that TSO-Jumbo Frames are enabled wherepossible.
Network Packets (Number)The Network Packets monitors network bandwidth for virtual machines.
This chart is located in the Home view of the Virtual Machine Performance tab. It appears only atcollection levels 3 and 4.
Table 1-121. Data Counters
Chart Label Description
Packets Transmitted Number of network packets transmitted across the top ten virtual NIC instances on thevirtual machine. The chart also displays the aggregated value for each NIC.
n Counter: packetTx
n Stats Type: Absolute
n Unit: Number
n Rollup Type: Summation
n Collection Level: 3
Packets Received Number of network packets received across the top ten virtual NIC instances on the virtualmachine. The chart also displays the aggregated value for each NIC.
n Counter: packetRx
n Stats Type: Absolute
n Unit: Number
n Rollup Type: Summation
n Collection Level: 3
vSphere Monitoring and Performance
VMware, Inc. 98

Chart Analysis
Network performance depends on the application workload and network configuration. Dropped networkpackets indicate a bottleneck in the network. To determine whether packets are being dropped, useesxtop or the advanced performance charts to examine the droppedTx and droppedRx network countervalues.
If packets are being dropped, adjust the virtual machine shares. If packets are not being dropped, checkthe size of the network packets and the data receive and transfer rates. In general, the larger the networkpackets, the faster the network speed. When the packet size is large, fewer packets are transferred,which reduces the amount of CPU required to process the data. When network packets are small, morepackets are transferred but the network speed is slower because more CPU is required to process thedata.
Note In some instances, large packets might result in a high network latency. To check the networklatency, use the VMware AppSpeed performance monitoring application or a third-party application.
If packets are not being dropped and the data receive rate is slow, the host is probably lacking the CPUresources required to handle the load. Check the number of virtual machines assigned to each physicalNIC. If necessary, perform load balancing by moving virtual machines to different vSwitches or by addingmore NICs to the host. You can also move virtual machines to another host or increase the host CPU orvirtual machine CPU.
If you experience network-related performance problems, also consider taking the following actions.
Table 1-122. Networking Performance Enhancement Advice
# Resolution
1 Verify that VMware Tools is installed on each virtual machine.
2 If possible, use vmxnet3 NIC drivers, which are available with VMware Tools. They are optimized for high performance.
3 If virtual machines running on the same host communicate with each other, connect them to the same vSwitch to avoidtransferring packets over the physical network.
4 Assign each physical NIC to a port group and a vSwitch.
5 Use separate physical NICs to handle the different traffic streams, such as network packets generated by virtual machines,iSCSI protocols, vMotion tasks.
6 Ensure that the physical NIC capacity is large enough to handle the network traffic on that vSwitch. If the capacity is notenough, consider using a high-bandwidth physical NIC (10 Gbps). Alternatively, consider moving some virtual machines to avSwitch with a lighter load or to a new vSwitch.
7 If packets are being dropped at the vSwitch port, increase the virtual network driver ring buffers where applicable.
8 Verify that the reported speed and duplex settings for the physical NIC match the hardware expectations and that thehardware is configured to run at its maximum capability. For example, verify that NICs with 1 Gbps are not reset to 100 Mbpsbecause they are connected to an older switch.
9 Verify that all NICs are running in full duplex mode. Hardware connectivity problems might result in a NIC resetting itself to alower speed or half duplex mode.
10 Use vNICs that are TCP Segmentation Offload (TSO)-capable, and verify that TSO-Jumbo Frames are enabled wherepossible.
vSphere Monitoring and Performance
VMware, Inc. 99

Space in GBThe Space in GB chart displays space utilization data counters for virtual machines.
This chart is located in the Storage view of the virtual machine Performance tab.
Table 1-123. Data Counters
Chart Label Description
Allocated Total amount of logical datastore space provisioned by an administrator for the virtualmachine. It is the storage size up to which the virtual machine files on datastores can grow.This includes log files, VMX files, and other miscellaneous files. Allocated space is not alwaysin use.
n Counter: provisioned
n Stats Type: Absolute
n Unit: Gigabytes (GB)
n Rollup Type: Latest
n Collection Level: 1
Used Amount of physical datastore space in use by the virtual machine files.
n Counter: used
n Stats Type: Absolute
n Unit: Gigabytes (GB)
n Rollup Type: Latest
n Collection Level: 1
Not Shared Amount of datastore space that belongs only to this virtual machine and is not shared withother virtual machines. Only unshared space is guaranteed to be reclaimed for the virtualmachine if, for example, it is moved to a different datastore and then back again. The value isan aggregate of all unshared space for the virtual machine, across all datastores.
n Counter: unshared
n Stats Type: Absolute
n Unit: Gigabytes (GB)
n Rollup Type: Latest
n Collection Level: 1
Chart Analysis
The datastore is at full capacity when the used space is equal to the capacity. Allocated space can belarger than datastore capacity, for example, when you have snapshots and thin-provisioned disks. Ifpossible, you can provision more space to the datastore, or you can add disks to the datastore or useshared datastores.
If snapshot files are consuming high datastore space, consider consolidating them to the virtual disk whenthey are no longer needed. Consolidating the snapshots deletes the redo log files and removes thesnapshots from the vSphere Web Client user interface. For information about consolidating the datacenter, see the vSphere documentation.
vSphere Monitoring and Performance
VMware, Inc. 100
Space Utilization by DatastoresThe Space Utilization by Datastores chart displays the amount of space used by a virtual machine ondifferent datastores in the data center.
Note This chart does not show historical statistics. It only shows the most recently available data, whichmay be up to 30 minutes late, depending on when the last statistics rollup occurred. In addition, statisticsare not collected across all datastores at one time. They are collected asynchronously.
The Space Utilization by Datastores chart is located in the Storage view of the virtual machinePerformance tab.
Table 1-124. Data Counters
Chart Label Description
datastore_name Amount of disk space in the datastore currently in use by the virtual machine.
n Counter: used
n Stats Type: Absolute
n Unit: Gigabytes (GB)
n Rollup Type: Latest
n Collection Level: 1
Chart Analysis
The datastore is at full capacity when the used space is equal to the capacity. Allocated space can belarger than datastore capacity, for example, when you have snapshots and thin-provisioned disks. Ifpossible, you can provision more space to the datastore, or you can add disks to the datastore or useshared datastores.
If snapshot files are consuming high datastore space, consider consolidating them to the virtual disk whenthey are no longer needed. Consolidating the snapshots deletes the redo log files and removes thesnapshots from the vSphere Web Client user interface. For information about consolidating the datacenter, see the vSphere documentation.
Space Utilization By File TypeThe Space Utilization by File Type chart displays the datastore usage by virtual machine files.
Note This chart does not show historical statistics. It only shows the most recently available data, whichmay be up to 30 minutes late, depending on when the last statistics rollup occurred. In addition, statisticsare not collected across all datastores at one time. They are collected asynchronously.
The Space Utilization by File Type chart is located in the Storage view of the virtual machinePerformance tab.
vSphere Monitoring and Performance
VMware, Inc. 101

Datastore counters
Table 1-125. Data Counters
File Type Description
Virtual Disks Amount of disk space used by virtual disk files.
Virtual disk files store the contents of the virtual machine's hard disk drive, including information that youwrite to a virtual machine's hard disk - the operating system, program files, and data files. The files havethe extension .vmdk and appear as a physical disk drive to a guest operating system.
Note Delta disks, which also have an extension .vmdk, are not included in this file type.
n Counter: used
n Stats Type: Absolute
n Unit: Gigabytes (GB)
n Rollup Type: Latest
n Collection Level: 1 (4)
Swap Files Amount of disk space used by swap files.
Swap files back up the virtual machine's physical memory.
n Counter: used
n Stats Type: Absolute
n Unit: Gigabytes (GB)
n Rollup Type: Latest
n Collection Level: 1 (4)
Snapshots Amount of disk space used by virtual machine snapshot files.
Snapshot files store information about virtual machine snapshots. They include snapshot state files anddelta disk files. A snapshot state file stores the running state of the virtual machine at the time of thesnapshot. It has the extension .vmsn. A delta disk file stores the updates made by the virtual machine tothe virtual disks after a snapshot is taken.
n Counter: used
n Stats Type: Absolute
n Unit: GigaBytes (GB)
n Rollup Type: Latest
n Collection Level: 1 (4)
Other VM Files Amount of disk space used by all other virtual machine files, such as configuration files and log files.
n Counter: used
n Stats Type: Absolute
n Unit: Gigabytes (GB)
n Rollup Type: Latest
n Collection Level: 1 (4)
Total Space Amount of disk space used by the virtual machine.
total space = virtual disk space + swap file space + snapshot space + other VM file space
vSphere Monitoring and Performance
VMware, Inc. 102

Chart Analysis
The datastore is at full capacity when the used space is equal to the capacity. Allocated space can belarger than datastore capacity, for example, when you have snapshots and thin-provisioned disks. Ifpossible, you can provision more space to the datastore, or you can add disks to the datastore or useshared datastores.
If snapshot files are consuming high datastore space, consider consolidating them to the virtual disk whenthey are no longer needed. Consolidating the snapshots deletes the redo log files and removes thesnapshots from the vSphere Web Client user interface. For information about consolidating the datacenter, see the vSphere documentation.
Fault Tolerance Performance CountersThe fault tolerance charts contain information about CPU and memory for fault tolerant virtual machines.
Note The performance charts and help topics for fault tolerance are available only when you havevSphere Fault Tolerance enabled. If you select a link for a secondary virtual machine in the thumbnailsection of the Resource Pools and Virtual Machines view of the cluster Performance tab, the navigation inthe inventory updates to the primary virtual machine. This occurs because secondary machines are notdisplayed in the inventory.
CPU (MHz)
The CPU (MHz) chart displays virtual CPU usage for fault tolerant virtual machines.
This chart is located in the Fault Tolerance view of the virtual machine Peformance tab. It is availableonly at collection levels 3 and 4.
Table 1-126. Data Counters
Name Description
Usage The average amount of virtual CPU, per CPU instance, in use on the primary andsecondary fault tolerant virtual machines.
n Counter: usagemhz
n Stats Type: Rate
n Unit: Megahertz (MHz)
n Rollup Type: Average (Minimum/Maximum)
n Collection Level: 3 (4)
Chart Analysis
A large discrepancy in CPU usage between the primary and secondary virtual machines might indicateperformance problems. The CPU ready, system, and wait times of each virtual machine should besynchronized. A large discrepancy in these values might indicate performance problems. Consider takingthe following actions.
vSphere Monitoring and Performance
VMware, Inc. 103

Table 1-127. CPU Performance Enhancement Advice
# Resolution
1 Verify that the primary and secondary hosts are in the same CPU model family and have similar CPU configurations. For bestresults, use CPUs with the same stepping level.
2 Verify that the CPU resource reservations set for both virtual machines are consistent within the cluster. VMware HA plans fora worst-case scenario by considering all powered on virtual machines in a cluster and finding the maximum memory andCPU reservations.
3 Verify that the network and datastore connections for both virtual machines are similar.
4 Turn off power management (also known as power-capping) in the BIOS. If power management is enabled, the secondaryhost might enter lower performance, power-saving modes. Such modes can leave the secondary virtual machine withinsufficient CPU resources, potentially making it impossible for the secondary to complete all tasks completed on a primary ina timely fashion.
5 Turn off hyperthreading in the BIOS. If hyperthreading is enabled and the secondary virtual machine is sharing a CPU withanother demanding virtual machine, the secondary virtual machine might run too slowly to complete all tasks completed onthe primary in a timely fashion.
CPU System Time for vCPU (%)
The CPU System Time chart displays virtual CPU usage for fault tolerant virtual machines.
This chart is located in the Fault Tolerance view of the Virtual Machine Peformance tab. It is availableonly at collection levels 3 and 4.
Table 1-128. Data Counters
Chart Label Description
System Amount of time spent on system processes on each virtual CPU in the virtual machine.
Note This is the host view of the CPU usage, not the guest operating system view.
n Counter: system
n Stats Type: Delta
n Unit: Percentage (%)
n Rollup Type: Summation
n Collection Level: 3
Chart Analysis
A large discrepancy in CPU usage between the primary and secondary virtual machines might indicateperformance problems. The CPU ready, system, and wait times of each virtual machine should besynchronized. A large discrepancy in these values might indicate performance problems. Consider takingthe following actions.
Table 1-129. CPU Performance Enhancement Advice
# Resolution
1 Verify that the primary and secondary hosts are in the same CPU model family and have similar CPU configurations. For bestresults, use CPUs with the same stepping level.
2 Verify that the CPU resource reservations set for both virtual machines are consistent within the cluster. VMware HA plans fora worst-case scenario by considering all powered on virtual machines in a cluster and finding the maximum memory andCPU reservations.
vSphere Monitoring and Performance
VMware, Inc. 104

Table 1-129. CPU Performance Enhancement Advice (continued)
# Resolution
3 Verify that the network and datastore connections for both virtual machines are similar.
4 Turn off power management (also known as power-capping) in the BIOS. If power management is enabled, the secondaryhost might enter lower performance, power-saving modes. Such modes can leave the secondary virtual machine withinsufficient CPU resources, potentially making it impossible for the secondary to complete all tasks completed on a primary ina timely fashion.
5 Turn off hyperthreading in the BIOS. If hyperthreading is enabled and the secondary virtual machine is sharing a CPU withanother demanding virtual machine, the secondary virtual machine might run too slowly to complete all tasks completed onthe primary in a timely fashion.
CPU Used Time for vCPU (%)
The CPU Used Time chart displays virtual CPU usage for fault tolerant virtual machines.
This chart is located in the Fault Tolerance view of the Virtual Machine Peformance tab. The chart isavailable only for collection levels 3 and 4.
Table 1-130. Data Counters
Chart Label Description
used Amount of used virtual CPU as a percentage of total available CPU on the primary and secondaryvirtual machines.
A high value indicates excessive use of CPU resources.
n Counter: used
n Stats Type: Delta
n Unit: Percentage (%)
n Rollup Type: Summation
n Collection Level: 1
Chart Analysis
A large discrepancy in CPU usage between the primary and secondary virtual machines might indicateperformance problems. The CPU ready, system, and wait times of each virtual machine should besynchronized. A large discrepancy in these values might indicate performance problems. Consider takingthe following actions.
Table 1-131. CPU Performance Enhancement Advice
# Resolution
1 Verify that the primary and secondary hosts are in the same CPU model family and have similar CPU configurations. For bestresults, use CPUs with the same stepping level.
2 Verify that the CPU resource reservations set for both virtual machines are consistent within the cluster. VMware HA plans fora worst-case scenario by considering all powered on virtual machines in a cluster and finding the maximum memory andCPU reservations.
3 Verify that the network and datastore connections for both virtual machines are similar.
vSphere Monitoring and Performance
VMware, Inc. 105

Table 1-131. CPU Performance Enhancement Advice (continued)
# Resolution
4 Turn off power management (also known as power-capping) in the BIOS. If power management is enabled, the secondaryhost might enter lower performance, power-saving modes. Such modes can leave the secondary virtual machine withinsufficient CPU resources, potentially making it impossible for the secondary to complete all tasks completed on a primary ina timely fashion.
5 Turn off hyperthreading in the BIOS. If hyperthreading is enabled and the secondary virtual machine is sharing a CPU withanother demanding virtual machine, the secondary virtual machine might run too slowly to complete all tasks completed onthe primary in a timely fashion.
Memory Active (MB)
The Memory Active chart displays active memory usage for fault tolerant virtual machines.
This chart is located in the Fault Tolerance view of the Virtual Machine Peformance tab. It is notavailable at collection level 1.
Table 1-132. Data Counters
Chart Label Description
Active Amount of guest physical memory in use by the fault tolerant virtual machine. Active memory isestimated by VMkernel statistical sampling and represents the actual amount of memory thevirtual machine needs. Additional, unused memory may be swapped out or ballooned with noperformance impact.
n Counter: active
n Stats Type: Absolute
n Unit: Megabytes (MB)
n Rollup Type: Average (Minimum/Maximum)
n Collection Level: 2 (4)
Make sure that the primary and secondary virtual machines have enough memory. If thesecondary system is not provisioned well, it might slow down performance of the primary virtualmachine or fail.
Chart Analysis
A virtual machine's memory size must be slightly larger than the average guest memory usage. Thisenables the host to accommodate workload spikes without swapping memory among guests. Increasingthe virtual machine memory size results in more overhead memory usage.
If sufficient swap space is available, a high balloon value does not cause performance problems.However, if the swapin and swapout values for the host are large, the host is probably lacking the amountof memory required to meet the demand.
If a virtual machine has high ballooning or swapping, check the amount of free physical memory on thehost. A free memory value of 6% or less indicates that the host cannot meet the memory requirements.This leads to memory reclamation, which might degrade performance. If the active memory size is thesame as the granted memory size, demand for memory is greater than the memory resources available. Ifthe active memory is consistently low, the memory size might be too large.
vSphere Monitoring and Performance
VMware, Inc. 106

If the host has enough free memory, check the resource shares, reservation, and limit of the virtualmachines and resource pools on the host. Verify that the host settings are adequate and not lower thanthose set for the virtual machine.
If little free memory is available, or if you notice degradation in performance, consider taking the followingactions.
Table 1-133. Memory Performance Enhancement Advice
# Resolution
1 Verify that VMware Tools is installed on each virtual machine. The balloon driver is installed with VMware Tools and is criticalto performance.
2 Verify that the balloon driver is enabled. The VMkernel regularly reclaims unused virtual machine memory by ballooning andswapping. Generally, this does not impact virtual machine performance.
3 Reduce the memory space on the virtual machine, and correct the cache size if it is too large. This frees up memory for othervirtual machines.
4 If the memory reservation of the virtual machine is set to a value much higher than its active memory, decrease thereservation setting so that the VMkernel can reclaim the idle memory for other virtual machines on the host.
5 Migrate one or more virtual machines to a host in a DRS cluster.
6 Add physical memory to the host.
Memory Swapout (MB)
The Memory Swapout chart displays the swapout memory usage for fault tolerant virtual machines.
This chart is located in the Fault Tolerance view of the Virtual Machine Peformance tab. It is notavailable at collection level 1.
Table 1-134. Data Counters
Chart Label Description
Swapout Amount of machine memory written to the VMkernel swap file.
n Counter: swapout
n Stats Type: Absolute
n Unit: MegaBytes
n Rollup Type: Average (Minimum/Maximum)
n Collection Level: 2 (4)
Make sure that the primary and secondary virtual machines have enough memory and that theswapout value is not high. If the secondary system is not provisioned well, it might slow downperformance of the primary virtual machine or fail.
Chart Analysis
A virtual machine's memory size must be slightly larger than the average guest memory usage. Thisenables the host to accommodate workload spikes without swapping memory among guests. Increasingthe virtual machine memory size results in more overhead memory usage.
If there is sufficient swap space, a high balloon value is not a performance issue. However, if the swapinand swapout values for the host are large, the host is probably lacking the memory required to meet thedemand.
vSphere Monitoring and Performance
VMware, Inc. 107

If a virtual machine has high ballooning or swapping, check the amount of free physical memory on thehost. The host might require more memory resources. If it does not, check the resource shares,reservation, and limit of the virtual machines and resource pools on the host. Verify that the host settingsare adequate and not lower than those set for the virtual machine.
If memory usage is high or you notice degradation in performance, consider taking the following actions.
Table 1-135. Memory Performance Enhancement Advice
# Resolution
1 Verify that VMware Tools is installed on each virtual machine. The balloon driver is installed with VMware Tools and is criticalto performance.
2 Verify that the balloon driver is enabled. The VMkernel regularly reclaims unused virtual machine memory by ballooning andswapping. Generally, this does not impact virtual machine performance.
3 Reduce the memory space on the virtual machine, and correct the cache size if it is too large. This frees up memory for othervirtual machines.
4 If the memory reservation of a virtual machine is set to a value much higher than its active memory, decrease the reservationsetting so that the VMkernel can reclaim the idle memory for other virtual machines on the host.
5 Migrate one or more virtual machines to a host in a DRS cluster.
6 Add physical memory to the host.
Working with Advanced and Custom ChartsUse advanced charts, or create your own custom charts, to see more performance data. Advanced chartscan be useful when you are aware of a problem but need more statistical data to pinpoint the source ofthe trouble.
Advanced charts include the following features:
n More information. Hover over a data point in a chart and details about that specific data point aredisplayed.
n Customizable charts. Change chart settings. To create your own charts, save custom settings.
n Export to spreadsheet.
n Save to image file or spreadsheet.
View Advanced Performance ChartsAdvanced charts support data counters that are not supported in other performance charts.
Procedure
1 Navigate to an inventory object in the vSphere Web Client.
2 Click the Monitor tab, and click Performance.
3 Click Advanced.
vSphere Monitoring and Performance
VMware, Inc. 108

4 (Optional) To view a different chart, select an option from the View list.
The amount of historical data displayed in a chart depends on the collection interval and statisticslevel set for vCenter Server.
View Advanced Performance Charts in the vSphere ClientAdvanced charts support data counters that are not supported in other performance charts.
Procedure
1 Navigate to an inventory object in the vSphere Client.
2 Click the Monitor tab, and click Performance.
3 Click Advanced.
4 (Optional) To view a different chart, select an option from the View list.
The amount of historical data displayed in a chart depends on the collection interval and statisticslevel set for vCenter Server.
5 (Optional) To view the selected performance chart in a popup window, click the Popup Chart icon
( ). The chart opens in a new browser window enabling you to navigate within the vSphere Clientwhile keeping the performance chart open in a separate window. You can learn more about thisfeature in this video.
Using Performance Charts in the vSphere Client(http://link.brightcove.com/services/player/bcpid2296383276001?bctid=ref:video_vsphere67_perfcharts)
Change Advanced Chart SettingsYou can customize a performance chart by specifying the objects to monitor, the counters to include, thetime range, and chart type. You can customize preconfigured chart views and create chart views.
Procedure
1 Select an inventory object in the vSphere Web Client.
2 Click the Monitor tab, and click Performance.
3 Click Advanced.
4 Click Chart Options.
5 In Chart Metrics, select a metric group for the chart.
6 Select a time range for the metric group.
Time range options are not active unless you select Custom interval in the Timespan menu.
vSphere Monitoring and Performance
VMware, Inc. 109

If you choose Custom interval, do one of the following.
n Select Last and set the number of hours, days, weeks, or months for the amount of time tomonitor the object.
n Select From and select the beginning and end dates.
You can also customize the time range options by customizing the statistics collection interval setting.
7 In Target Objects, select the inventory objects to display in the chart.
You can also specify the objects using the All or None buttons.
8 Select the chart type.
When selecting the stacked graph option, consider the following.
n You can select only one item from the list of measurements.
n Per-virtual-machine stacked graphs are available only for hosts.
n To display information about the counter’s function and whether the selected metric can bestacked for per-virtual-machine graphs, click a counter description name.
9 In Counters, select the data counters to display in the chart.
You can also specify counters using the All or None buttons. The All button is inactive when thereare more than two different counter units for the corresponding metric group.
10 Click OK.
Create a Custom Advanced ChartYou can create your own charts by saving customized chart settings. New charts are added to the Viewmenu and will appear there only when charts for the selected object are being displayed.
Procedure
1 Select an inventory object in the vSphere Web Client.
2 Click the Monitor tab, click Performance, and navigate to the Chart Options dialog of a chart.
3 Customize chart settings.
4 Click Save Options As....
5 Enter a name for your settings.
6 Click OK.
The chart settings are saved and an entry for your chart is added to the View menu.
Delete a Custom Advanced Chart ViewYou can delete custom chart views from the vSphere Web Client.
Procedure
1 Select an inventory object in the vSphere Web Client.
vSphere Monitoring and Performance
VMware, Inc. 110

2 Click the Monitor tab, and click Performance.
3 Click Advanced.
4 Click Chart Options.
5 Select a chart and click Delete Options.
6 Click OK to confirm deletion.
The chart is deleted, and it is removed from the View menu.
Save Chart Data to a FileYou can save data from the advanced performance charts to a file in various graphic formats or incomma-separated values (CSV) format.
Procedure
1 In the vSphere Web Client, select an inventory object.
2 Click the Monitor tab, and click Performance.
3 Click Advanced.
4 Click the Export icon ( ).
5 Select a file type.
Option Description
To PNG Exports a bitmap image in the PNG format.
To JPEG Exports a bitmap image in the JPEG format.
To CSV Exports plain-text data in the CSV format.
6 Enter a name and location for the file.
7 Click Save.
The file is saved to the location and format you specified.
Troubleshoot and Enhance PerformanceThis section presents tips for identifying and solving performance problems.
The suggestions in this section are not meant to be a comprehensive guide to diagnosing andtroubleshooting problems in the virtual environment. It is meant to provide information about somecommon problems that can be solved without contacting VMware Technical Support.
Solutions for Consistently High CPU UsageTemporary spikes in CPU usage indicate that you are making the best use of CPU resources.Consistently high CPU usage might indicate a problem. You can use the CPU performance charts tomonitor CPU usage for hosts, clusters, resource pools, virtual machines, and vApps.
vSphere Monitoring and Performance
VMware, Inc. 111

Problem
n Host CPU usage constantly is high. A high CPU usage value can lead to increased ready time andprocessor queuing of the virtual machines on the host.
n Virtual machine CPU usage is above 90% and the CPU ready value is above 20%. Applicationperformance is impacted.
Cause
n The host probably is lacking the CPU resources required to meet the demand.
n There might be too many virtual CPUs relative to the number of regular CPUs.
n There might be an IO storage or networking operation that places the CPU in a wait state.
n The Guest OS generates too much load for the CPU.
Solution
u Verify that VMware Tools is installed on every virtual machine on the host.
u Compare the CPU usage value of a virtual machine with the CPU usage of other virtual machines onthe host or in the resource pool. The stacked bar chart on the host's Virtual Machine view shows theCPU usage for all virtual machines on the host.
u Determine whether the high ready time for the virtual machine resulted from its CPU usage timereaching the CPU limit setting. If so, increase the CPU limit on the virtual machine.
u Increase the CPU shares to give the virtual machine more opportunities to run. The total ready timeon the host might remain at the same level if the host system is constrained by CPU. If the host readytime does not decrease, set the CPU reservations for high-priority virtual machines to guarantee thatthey receive the required CPU cycles.
u Increase the amount of memory allocated to the virtual machine. This action decreases disk and ornetwork activity for applications that cache. This might lower disk I/O and reduce the need for the hostto virtualize the hardware. Virtual machines with smaller resource allocations generally accumulatemore CPU ready time.
u Reduce the number of virtual CPUs on a virtual machine to only the number required to execute theworkload. For example, a single-threaded application on a four-way virtual machine only benefits froma single vCPU. But the hypervisor's maintenance of the three idle vCPUs takes CPU cycles that couldbe used for other work.
u If the host is not already in a DRS cluster, add it to one. If the host is in a DRS cluster, increase thenumber of hosts and migrate one or more virtual machines onto the new host.
u Upgrade the physical CPUs or cores on the host if necessary.
u Use the newest version of hypervisor software, and enable CPU-saving features such as TCPSegmentation Offload, large memory pages, and jumbo frames.
vSphere Monitoring and Performance
VMware, Inc. 112

Solutions for Memory Performance ProblemsHost machine memory is the hardware backing for guest virtual memory and guest physical memory.Host machine memory must be at least slightly larger than the combined active memory of the virtualmachines on the host. A virtual machine's memory size must be slightly larger than the average guestmemory usage. Increasing the virtual machine memory size results in more overhead memory usage.
Problem
n Memory usage is constantly high (94% or greater) or constantly low (24% or less).
n Free memory consistently is 6% or less and swapping frequently occurs.
Cause
n The host probably is lacking the memory required to meet the demand. The active memory size is thesame as the granted memory size, which results in memory resources that are not sufficient for theworkload. Granted memory is too much if the active memory is constantly low.
n Host machine memory resources are not enough to meet the demand, which leads to memoryreclamation and degraded performance.
n The active memory size is the same as the granted memory size, which results in memory resourcesthat are not sufficient for the workload.
Solution
u Verify that VMware Tools is installed on each virtual machine. The balloon driver is installed withVMware Tools and is critical to performance.
u Verify that the balloon driver is enabled. The VMkernel regularly reclaims unused virtual machinememory by ballooning and swapping. Generally, this does not impact virtual machine performance.
u Reduce the memory space on the virtual machine, and correct the cache size if it is too large. Thisfrees up memory for other virtual machines.
u If the memory reservation of the virtual machine is set to a value much higher than its active memory,decrease the reservation setting so that the VMkernel can reclaim the idle memory for other virtualmachines on the host.
u Migrate one or more virtual machines to a host in a DRS cluster.
u Add physical memory to the host.
Solutions for Storage Performance ProblemsDatastores represent storage locations for virtual machine files. A storage location can be a VMFSvolume, a directory on Network Attached Storage, or a local file system path. Datastores are platform-independent and host-independent.
Problem
n Snapshot files are consuming a lot of datastore space.
vSphere Monitoring and Performance
VMware, Inc. 113

n The datastore is at full capacity when the used space is equal to the capacity. Allocated space can belarger than datastore capacity, for example, when you have snapshots and thin-provisioned disks.
Solution
n Consider consolidating snapshots to the virtual disk when they are no longer needed. Consolidatingthe snapshots deletes the redo log files and removes the snapshots from the vSphere Web Clientuser interface.
n You can provision more space to the datastore if possible, or you can add disks to the datastore oruse shared datastores.
Solutions for Disk Performance ProblemsUse the disk charts to monitor average disk loads and to determine trends in disk usage. For example,you might notice a performance degradation with applications that frequently read from and write to thehard disk. If you see a spike in the number of disk read/write requests, check if any such applicationswere running then.
Problem
n The value for the kernelLatency data counter is greater than 4 ms.
n The value for the deviceLatency data counter is greater than 15 ms indicates that there are probablyproblems with the storage array.
n The queueLatency data counter measures above zero.
n Spikes in latency.
n Unusual increases in read/write requests.
Cause
n The virtual machines on the host are trying to send more throughput to the storage system than theconfiguration supports.
n The storage array probably is experiencing internal problems.
n The workload is too high and the array cannot process the data fast enough.
Solution
u The virtual machines on the host are trying to send more throughput to the storage system than theconfiguration supports. Check the CPU usage, and increase the queue depth.
u Move the active VMDK to a volume with more spindles or add disks to the LUN.
u Increase the virtual machine memory. It should allow for more operating system caching, which canreduce I/O activity. Note: It may require you to increase the host memory. Increasing memory mightreduce the need to store data because databases can utilize system memory to cache data and avoiddisk access.
vSphere Monitoring and Performance
VMware, Inc. 114

u Check swap statistics in the guest operating system to verify that virtual machines have adequatememory. Increase the guest memory, but not to an extent that leads to excessive host memoryswapping. Install VMware Tools so that memory ballooning can occur.
u Defragment the file systems on all guests.
u Disable antivirus on-demand scans on the VMDK and VMEM files.
u Use the vendor's array tools to determine the array performance statistics. When too many serverssimultaneously access common elements on an array, the disks might have trouble keeping up.Consider array-side improvements to increase throughput.
u Use Storage vMotion to migrate I/O-intensive virtual machines across multiple hosts.
u Balance the disk load across all physical resources available. Spread heavily used storage acrossLUNs that are accessed by different adapters. Use separate queues for each adapter to improve diskefficiency.
u Configure the HBAs and RAID controllers for optimal use. Verify that the queue depths and cachesettings on the RAID controllers are adequate. If not, increase the number of outstanding diskrequests for the virtual machine by adjusting the Disk.SchedNumReqOutstanding parameter.
u For resource-intensive virtual machines, separate the virtual machine's physical disk drive from thedrive with the system page file. This alleviates disk spindle contention during periods of high use.
u On systems with sizable RAM, disable memory trimming by adding the line MemTrimRate=0 to thevirtual machine's VMX file.
u If the combined disk I/O is higher than a single HBA capacity, use multipathing or multiple links.
u For ESXi hosts, create virtual disks as preallocated. When you create a virtual disk for a guestoperating system, select Allocate all disk space now. The performance degradation associated withreassigning additional disk space does not occur, and the disk is less likely to become fragmented.
u Use the most current hypervisor software.
Solutions for Poor Network PerformanceNetwork performance is dependent on application workload and network configuration. Dropped networkpackets indicate a bottleneck in the network. Slow network performance can be a sign of load-balancingproblems.
Problem
Network problems can manifest in many ways:
n Packets are being dropped.
n Network latency is high.
n Data receive rate is low.
vSphere Monitoring and Performance
VMware, Inc. 115

Cause
Network problems can have several causes:
n Virtual machine network resource shares are too few.
n Network packet size is too large, which results in high network latency. Use the VMware AppSpeedperformance monitoring application or a third-party application to check network latency.
n Network packet size is too small, which increases the demand for the CPU resources needed forprocessing each packet. Host CPU, or possibly virtual machine CPU, resources are not enough tohandle the load.
Solution
u Determine whether packets are being dropped by using esxtop or the advanced performance chartsto examine the droppedTx and droppedRx network counter values. Verify that VMware Tools isinstalled on each virtual machine.
u Check the number of virtual machines assigned to each physical NIC. If necessary, perform loadbalancing by moving virtual machines to different virtual switches or by adding more NICs to the host.You can also move virtual machines to another host or increase the host CPU or virtual machineCPU.
u If possible, use vmxnet3 NIC drivers, which are available with VMware Tools. They are optimized forhigh performance.
u If virtual machines running on the same host communicate with each other, connect them to the samevirtual switch to avoid the cost of transferring packets over the physical network.
u Assign each physical NIC to a port group and a virtual switch.
u Use separate physical NICs to handle the different traffic streams, such as network packetsgenerated by virtual machines, iSCSI protocols, vMotion tasks.
u Ensure that the physical NIC capacity is large enough to handle the network traffic on that virtualswitch. If the capacity is not enough, consider using a high-bandwidth physical NIC (10Gbps) ormoving some virtual machines to a virtual switch with a lighter load or to a new virtual switch.
u If packets are being dropped at the virtual switch port, increase the virtual network driver ring bufferswhere applicable.
u Verify that the reported speed and duplex settings for the physical NIC match the hardwareexpectations and that the hardware is configured to run at its maximum capability. For example, verifythat NICs with 1Gbps are not reset to 100Mbps because they are connected to an older switch.
u Verify that all NICs are running in full duplex mode. Hardware connectivity issues might result in aNIC resetting itself to a lower speed or half duplex mode.
u Use vNICs that are TCP Segmentation Offload (TSO)-capable, and verify that TCP SegmentationOffload-Jumbo Frames are enabled where possible.
vSphere Monitoring and Performance
VMware, Inc. 116

Empty Performance ChartsNo graphics or data are displayed in performance charts.
Problem
When data is missing for a performance chart, the chart appears empty and you see the message Nodata available.
Cause
The causes for missing data in performance charts that are described herein are based on theassumption that the default roll-up configuration for the vCenter Server system has not changed. Thecauses include but are not limited to the following scenarios:
n Metrics introduced in ESXi 5.0 are not available for hosts running earlier versions.
n Data is deleted when you remove or add objects to vCenter Server.
n Performance charts data for inventory objects that were moved to a new site by VMware vCenter SiteRecovery Manager is deleted from the old site and not copied to the new site.
n Performance charts data is deleted when you use VMware vMotion across vCenter Server instances.
n Real-time statistics are not available for disconnected hosts or powered off virtual machines.
n Real-time statistics are collected on hosts and aggregated every 5 minutes. After six data points arecollected for approximately 30 minutes, they are rolled up to the vCenter Server database to createthe 1-Day statistic. 1-Day statistics might not be available for 30 minutes after the current time,depending on when the sample period began.
n The 1-Day statistics are rolled up to create one data point every 30 minutes. If a delay occurs in theroll-up operation, the 1-Week statistics might not be available for 1 hour after the current time. It takes30 minutes for the 1-Week collection interval, plus 30 minutes for the 1-Day collection interval.
n The 1-Week statistics are rolled up to create one data point every two hours. If a delay occurs in theroll-up operations, the 1-Month statistics might not be available for 3 hours. It takes 2 hours for the 1-Month collection interval, plus 1 hour for the 1-Week collection interval.
n The 1-Month statistics are rolled up to create one data point every day. If a delay occurs in the roll-upoperations, the statistics might not be available for 1-day and 3 hours. It takes one day for the pastyear collection interval, plus 3 hours for the past month collection interval. During this time, the chartsare empty.
Solution
u There is no solution available.
vSphere Monitoring and Performance
VMware, Inc. 117

Monitoring Guest OperatingSystem Performance 2This section describes how to install and view VMware-specific performance data for virtual machines thatrun Microsoft Windows operating systems. VMware provides performance counters that enable you toview data on many aspects of guest operating system performance for the Microsoft Windows Perfmonutility.
Some virtualization processes dynamically allocate available resources depending on the status, orutilization rates, of virtual machines in the environment. It can make obtaining accurate information aboutthe resource utilization (CPU utilization, in particular) of individual virtual machines, or applicationsrunning within virtual machines, difficult. VMware now provides virtual machine-specific performancecounter libraries for the Windows Perfmon utility. It enables application administrators to access accuratevirtual machine resource utilization statistics from within the Windows Perfmon utility.
You can take advantage of virtualized CPU performance counters to use performance tuning tools insidethe guest operating system. See the vSphere Virtual Machine Administration documentation.
This chapter includes the following topics:
n Enable Statistics Collection for Guest Operating System Performance Analysis
n View Performance Statistics for Windows Guest Operating Systems
Enable Statistics Collection for Guest Operating SystemPerformance AnalysisVMware-specific performance objects are loaded into Microsoft Windows Perfmon and enabled whenVMware Tools is installed.
To display a performance chart for any performance object, you must add counters. See ViewPerformance Statistics for Windows Guest Operating Systems
View Performance Statistics for Windows GuestOperating SystemsYou can display VMware specific statistics in the Microsoft Windows Perfmon utility.
Prerequisites
Verify that a virtual machine with a Microsoft Windows operating system and VMware Tools is installed.
VMware, Inc. 118

Procedure
1 Open a console to the virtual machine and log in.
2 Select Start > Run.
3 Enter Perfmon and press Enter.
4 In the Performance dialog box, click Add .
5 In the Add Counters dialog box, select Use local computer counters.
6 Select a virtual machine performance object.
Virtual machine performance object names begin with VM.
7 Select the counters that you want to display for that object.
8 If the performance object has multiple instances, select the instances you want to display.
9 Click Add.
The Performance dialog box displays data for the selected performance object.
10 Click Close to close the Add Counter dialog box and return to the Performance dialog box.
vSphere Monitoring and Performance
VMware, Inc. 119

Monitoring Host Health Status 3You can use the vSphere Web Client or the vSphere Client to monitor the state of host hardwarecomponents, such as CPU processors, memory, fans, and other components.
The host health monitoring tool allows you to monitor the health of a variety of host hardware componentsincluding:
n CPU processors
n Memory
n Fans
n Temperature
n Voltage
n Power
n Network
n Battery
n Storage
n Cable/Interconnect
n Software components
n Watchdog
n PCI devices
n Other
The host health monitoring tool presents data gathered using Systems Management Architecture forServer Hardware (SMASH) profiles. The information displayed depends on the sensors available on yourserver hardware. SMASH is an industry standard specification providing protocols for managing a varietyof systems in the data center. For more information, see http://www.dmtf.org/standards/smash.
You can monitor host health status either by connecting the vSphere Web Client or the vSphere Clientto avCenter Server system. You can also set alarms to trigger when the host health status changes.
Note The interpretation of hardware monitoring information is specific for each hardware vendor. Yourhardware vendor can help you understand the results of the host hardware components monitoring.
This chapter includes the following topics:
VMware, Inc. 120

n Monitor Health Status in the vSphere Client
n Monitor Hardware Health Status
n Reset Health Status Sensors in the vSphere Client
n Reset Health Status Sensors
Monitor Health Status in the vSphere ClientYou can monitor the health status of host hardware in the vSphere Client
Procedure
1 Select a host in the vSphere Client
2 Click the Monitor tab, and click Hardware Health
3 Select the type of information to view.
Option Description
Sensors Displays all sensors arranged in a tree view. If the status is blank, the healthmonitoring service cannot determine the status of the component.
Alerts and warnings Displays alerts and warnings.
System event log Displays the system event log. You can learn about viewing the hardware health in Tip3: Viewing Hardware Health in this video.
Tips on Host Management in the vSphere Client(http://link.brightcove.com/services/player/bcpid2296383276001?bctid=ref:video_vsphere67_hostmgmt)
Monitor Hardware Health StatusYou can monitor the health status of host hardware in the vSphere Web Client.
Procedure
1 Select a host in the vSphere Web Client navigator.
2 Click the Monitor tab, and click Hardware Status.
vSphere Monitoring and Performance
VMware, Inc. 121

3 Select the type of information to view.
Option Description
Sensors Displays all sensors arranged in a tree view. If the status is blank, the healthmonitoring service cannot determine the status of the component.
n Click the Expand All icon to expand the tree view to show all sensors undereach group.
n Click Collapse All icon to expand the tree view to show descriptive details forevery sensor.
Alerts and warnings Displays alerts and warnings.
System event log Displays the system event log.
Reset Health Status Sensors in the vSphere ClientSome host hardware sensors display data that is cumulative over time. You can reset these sensors toclear the data in them and begin collecting new data.
If you need to preserve sensor data for troubleshooting or other purposes, take a screenshot, export thedata, or download a support bundle before resetting sensors.
Prerequisites
Verify that the vCenter Hardware Status plug-in is enabled.
Procedure
1 Select a host in the vSphere Client
2 Click the Monitor tab, and click Hardware Health
3 Click Reset sensors.
Reset Health Status SensorsSome host hardware sensors display data that is cumulative over time. You can reset these sensors toclear the data in them and begin collecting new data.
If you need to preserve sensor data for troubleshooting or other purposes, take a screenshot, export thedata, or download a support bundle before resetting sensors.
Prerequisites
Verify that the vCenter Hardware Status plug-in is enabled.
Procedure
1 Select a host in the vSphere Web Client navigator.
2 Click the Monitor tab, and click Hardware Status.
vSphere Monitoring and Performance
VMware, Inc. 122

3 Click Reset sensors.
vSphere Monitoring and Performance
VMware, Inc. 123

Monitoring vSphere Health 4vSphere Health enables you to identify and resolve potential issues before they have an impact to yourenvironment. vSphere telemetry data is collected from data-centers globally. This data is further used toanalyze pre-conditions in your vSphere environment related to stability and incorrect configurations.These issues are reported under vSphere Health and resolution recommendations are provided. Itenables VMware to enhance the issue detection without updating the vSphere installation. You can checkthe health of vSphere Host and vCenter Server.
This chapter includes the following topics:
n Check vSphere Health in vSphere Client
Check vSphere Health in vSphere ClientYou can use the vSphere Online health checks to monitor the health of the system. You can run healthchecks and send the data to VMware for advanced analysis.
Prerequisites
n You must participate in the Customer Experience Improvement Program to use online health checks.
n To perform the online health checks, vCenter Server must be able to communicate over the Internet.
Note If Customer Improvement Experience Program (CEIP) is not enabled, the Internet connectivitycheck is unavailable.
Procedure
1 Navigate to vCenter Server or select a host in the vSphere Client navigator
2 Click the Monitor tab, and click Health
3 Expand Online health to check the categories
VMware, Inc. 124

4 Select the type of information to view
Option Description
Customer experience improvementprogram (CEIP)
The CEIP check verifies whether the program is enabled for your vCenter Server. Ifit is not, click the button next to the health check, navigate to the CEIP page, andenroll in the program. To enable CEIP, click Configure CEIP
Online health connectivity The Internet connectivity check verifies that vCenter Server can communicate withvmware.com over the HTTPS/443 interface. If communication is successful, thischeck passes. If communication fails, the check indicates that the Internetconnectivity is not available.
vSphere periodically retests the health check and updates the results.
5 To run the health checks and update the results immediately, click the Retest button.
You can click the Ask VMware button to open a knowledge base article that describes the healthcheck and provides information about how to resolve the issue.
vSphere Monitoring and Performance
VMware, Inc. 125

Monitoring Events, Alarms, andAutomated Actions 5vSphere includes a user-configurable events and alarms subsystem. This subsystem tracks eventshappening throughout vSphere and stores the data in log files and the vCenter Server database. Thissubsystem also enables you to specify the conditions under which alarms are triggered. Alarms canchange state from mild warnings to more serious alerts as system conditions change, and can triggerautomated alarm actions. This functionality is useful when you want to be informed, or take immediateaction, when certain events or conditions occur for a specific inventory object, or group of objects.
EventsEvents are records of user actions or system actions that occur on objects in vCenter Server or on a host.Actions that might be recorded as events include, but are not limited to, the following examples:
n A license key expires
n A virtual machine is powered on
n A user logs in to a virtual machine
n A host connection is lost
Event data includes details about the event such as who generated it, when it occurred, and what type ofevent it is.
The types of events are:
Table 5-1. Event Types
Event Type Description
Error Indicates that a fatal problem has occurred in the system andterminates the process or operation.
Warning Indicates that there is a potential risk to the system which needsto be fixed. This event does not terminate the process oroperation.
VMware, Inc. 126

Table 5-1. Event Types (continued)
Event Type Description
Information Describes that the user or system operation is completedsuccessfully.
Audit Provides important audit log data which is crucial for the securityframework. The audit log data includes information about what isthe action, who did it, when it occurred, and the IP address ofthe user.
You can learn more about this in the vSphere Security guide.
In the vSphere Web Client, event data is displayed in the Monitor tab. See View Events in the vSphereWeb Client.
AlarmsAlarms are notifications that are activated in response to an event, a set of conditions, or the state of aninventory object. An alarm definition consists of the following elements in the vSphere Client:
n Name and description - Provides an identifying label and description.
n Targets - Defines the type of object that is monitored.
n Alarm Rules - Defines the event, condition, or state that triggers the alarm and defines the notificationseverity. It also defines operations that occur in response to triggered alarms.
n Last modified - The last modified date and time of the defined alarm.
An alarm definition consists of the following elements in the vSphere Web Client:
n Name and description - Provides an identifying label and description.
n Alarm type - Defines the type of object that is monitored.
n Triggers - Defines the event, condition, or state that triggers the alarm and defines the notificationseverity.
n Tolerance thresholds (Reporting) - Provides additional restrictions on condition and state triggersthresholds that must be exceeded before the alarm is triggered. Thresholds are not available in thevSphere Web Client.
n Actions - Defines operations that occur in response to triggered alarms. VMware provides sets ofpredefined actions that are specific to inventory object types.
Alarms have the following severity levels:
n Normal – green
n Warning – yellow
n Alert – red
Alarm definitions are associated with the object selected in the inventory. An alarm monitors the type ofinventory objects specified in its definition.
vSphere Monitoring and Performance
VMware, Inc. 127

For example, you might want to monitor the CPU usage of all virtual machines in a specific host cluster.You can select the cluster in the inventory, and add a virtual machine alarm to it. When enabled, thatalarm monitors all virtual machines running in the cluster and triggers when any one of them meets thecriteria defined in the alarm. To monitor a specific virtual machine in the cluster, but not others, select thatvirtual machine in the inventory and add an alarm to it. To apply the same alarms to a group of objects,place those objects in a folder and define the alarm on the folder.
Note You can enable, disable, and modify alarms only from the object in which the alarm is defined. Forexample, if you defined an alarm in a cluster to monitor virtual machines, you can only enable, disable, ormodify that alarm through the cluster. You cannot change the alarm at the individual virtual machine level.
Alarm ActionsAlarm actions are operations that occur in response to the trigger. For example, you can have an emailnotification sent to one or more administrators when an alarm is triggered.
Note Default alarms are not preconfigured with actions. You must manually set what action occurs whenthe triggering event, condition, or state occurs.
This chapter includes the following topics:
n View Events in the vSphere Web Client
n View Events in the vSphere Client
n View System Logs
n Export Events Data
n Consolidating Identical Events
n Streaming Events to a Remote Syslog Server
n Retention of Events in the vCenter Server Database
n View Triggered Alarms and Alarm Definitions
n Live Refresh of Recent Tasks and Alarms
n Set an Alarm in the vSphere Web Client
n Set an Alarm in the vSphere Client
n Acknowledge Triggered Alarms
n Reset Triggered Event Alarms
n Preconfigured vSphere Alarms
vSphere Monitoring and Performance
VMware, Inc. 128

View Events in the vSphere Web ClientYou can view events associated with a single object or view all vSphere events. The events list for aselected inventory object includes events associated with child objects. vSphere keeps information abouttasks and events. It is set to a default period of 30 days and it is configurable.
Procedure
1 Select an inventory object in the vSphere Web Client.
2 Click the Monitor tab, and click Task & Events.
3 Click Events.
4 Select an event to see the details.
5 (Optional) To filter the list, use the filter controls above the list.
6 (Optional) Click a column heading to sort the list.
View Events in the vSphere ClientYou can view events associated with a single object or view all vSphere events. The events list for aselected inventory object includes events associated with child objects. vSphere keeps information abouttasks and events. It is set to a default period of 30 days and it is configurable.
Procedure
1 Select an inventory object in the vSphere Client.
2 Click the Monitor tab, and click Events.
3 Select an event to see the details.
4 (Optional) Click a column heading to sort the list.
5 (Optional) Click the drop-down menu in the column heading:
n To show or hide the columns.
n To filter the list.
View System LogsvSphere records events in the vCenter Server database. System log entries include such information aswho generated the event, when the event was created, and the type of event.
Prerequisites
n Required privilege: Global.Diagnostics
Procedure
1 Select a vCenter Server instance in the vSphere Web Client navigator.
vSphere Monitoring and Performance
VMware, Inc. 129

2 Click Monitor, and click System Logs.
3 From the drop-down menu, select the log.
4 (Optional) Click Show All Lines or Show Next 2000 Lines to see additional log entries.
Export Events DataYou can export all or part of the events data stored in the vCenter Server database.
Prerequisites
Required Role: Read-only
Procedure
1 Select an inventory object in the vSphere Web Client.
2 Click the Monitor tab, and click Events.
3 Click the Export icon ( ).
4 In the Export Events window, specify what types of event information you want to export.
5 Click Generate CSV Report, and click Save.
6 Specify a file name and location and save the file.
Consolidating Identical EventsThe event burst filter monitors the incoming stream of events for identical events over a short time. Tooptimize the storage size of events, events that occur repeatedly are consolidated into a single eventbefore storing them in the database or the remote syslog server.
Event bursts can be seen in various scenarios which include,
n An existing hardware failure.
n An automated solution which logs-in and logs-out of vCenter Server often.
The events burst filter is enabled by default. It consolidates all types of events except those events on thewhite list. An event burst is defined as more than one identical event per second. Two events are identicalif,
n The events are of the same type.
n The events are on the same inventory object.
n The events are issued by the same user.
Note The remaining event-specific data is not used to determine if two events are identical.
vSphere Monitoring and Performance
VMware, Inc. 130

An event burst is detected after seeing 30 identical events for less than 30 seconds. These 30 events arestored in the VC database or the remote syslog server. Consolidation of the bursting events starts fromthe 31st event. The bursting events do not go into the database, but the consolidated event gets stored inthe database.
In cases of bursting events, the burst filter affects only the events that go to the database and remotesyslog stream. Alarms triggered by bursting events and EventHistoryCollector objects are not affected.
n com.vmware.vc.EventBurstStartedEvent - the start of an event burst.
n com.vmware.vc.EventBurstEndedEvent - the end of an event burst.
n com.vmware.vc.AllEventBurstsEndedEvent - the end of all the events bursts.
n com.vmware.vc.EventBurstCompressedEvent - the consolidated event after the event burst.
Each of this event contains,
n eventType - the event type of the bursting event.
n objectId - the entity of the bursting event.
n userName - the user name of the bursting event.
Also the compressed event contains,
n count - the number of identical events since the start of an event burst. The count starts from the 31stevent.
n burstStartTime - Time of the 31st event of an event burst.
Note The timestamps of the burst filter events are not related to the bursting events.
Enabling Events Burst FilterYou can configure the basic and advanced settings for the events burst filter in the advanced vCenterServer settings.
Burst filter can be in the following configurations.
n Enabled: If compressToDb or compressToSyslog are enabled, then the burst filter detects bursts, postsevents for them, and consolidates events before storing them in the database or sending them to theremote syslog server.
n Disabled: The burst filter does not detect bursts, does not post events for them, and does notconsolidate events before storing them in the database or sending them to the remote syslog server.If both compressToDb and compressToSyslog are disabled, then the burst filter detects bursts and postsevents for them but does not consolidate events.
Procedure
1 In the vSphere Client, navigate to the vCenter Server instance.
2 Select the Configure tab.
3 Advanced Settings
vSphere Monitoring and Performance
VMware, Inc. 131

4 Click Edit.
5 In the Filter text box, type vpxd.event, and press Enter.
6 For the basic setting,
a Enable or disable the vpxd.event.burstFilter.compressToDb option.
This option enables you to compress the bursting of events in the database. The default value forthe setting is enabled.
b Enable or disable the vpxd.event.burstFilter.compressToSyslog option.
This option enables you to compress the bursting of events in the syslog server. The default valuefor the setting is disabled.
7 The burst settings are not visible with their default values in Advanced Settings. However, a key-value can be entered for the configuration to take effect.
Note Adding or modifying advanced settings might result in an unstable environment. Configurationparameters cannot be removed once they are added.
a Configure a key-value to enable the config.vpxd.event.burstFilter.enabled option.
This parameter enables burst detection of the VC database and syslog. On disabling burst filter,bursts are not detected and the events are stored in the database or remote syslog server bydefault without compression. The default value is Enabled.
b Configure a key-value to enable the config.vpxd.event.burstFilter.rateEvents option.
You can configure the number of events after which a burst is detected. If the configured limit isreached, the event sequence is considered a burst and is compressed while storing it in the VCdatabase. The default value is 30. If the default is set, then the first 30 events are notcompressed. They are used to detect a burst. If a burst is detected, then a single consolidatedevent with their count replaces the subsequent events after the first 30 events.
Note It does not compress the real-time stream of events like alarms and EventManager propertycollector updates.
c Configure a key-value to enable the config.vpxd.event.burstFilter.rateSeconds option.
This parameter allows you to configure the number of seconds the data is stored for an eventfrom the last time the event occurred. Higher values load the burst filter cache, and the bursts aredetected even if the incoming flow of events is not even. Lower values exert lesser load on burstfilter cache, and bursts may not be detected if there is a temporary halt of incoming events. Thedefault value is 30 seconds.
vSphere Monitoring and Performance
VMware, Inc. 132

d Configure a key-value to enable the config.vpxd.event.burstFilter.cacheSize option.
The number of unique events tracked by the burst filter. When the cache is full, the burst filterstops monitoring the incoming new unique events and passes them through the VC database andsyslog. The default value is 128000.
Note Setting a lower value than default reduces the memory footprint but it also reduces thecapacity to detect bursts for a large inventory.
e Configure a key-value to enable the config.vpxd.event.burstFilter.whitelist option.
You can configure the burst filter to compress all types of events except the events that are on thewhite list. This parameter allows you to separate event types. It can avoid in monitoring few eventtypes by the burst filter. The default value is"vim.event.UserLoginSessionEvent;"vim.event.UserLogoutSessionEvent"
f Configure a key-value to enable the config.vpxd.event.burstFilter.compressRatio option.
When the burst filter starts compressing an event, it posts a compressed event when the burstends or on every X event. If a burst occurs for days, it posts some events instead of muting themall until the burst ends. The default value is 3600. The events are logged every 3600 events.
Note Restart the vmware-vpxd service for all changes to take effect. For more information how torestart services in the vSphere Web Client, see vCenter Server and Host Managementdocumentation.
Streaming Events to a Remote Syslog ServerAfter you enable remote streaming, vCenter Server Appliance starts streaming and only the newlygenerated events are streamed to the remote syslog server.
All syslog messages begin with a specific prefix. You can distinguish the vCenter Server Appliance eventsfrom other syslog messages by their Event prefix.
The syslog protocol limits the length of syslog messages to 1024 characters. Messages that are longerthan 1024 characters split into multiple syslog messages.
In the syslog server, events have the following format:
<syslog-prefix> : Event [eventId] [partInfo] [createdTime] [eventType] [severity] [user] [target]
[chainId] [desc]
Item Description
syslog-prefix Displays the syslog prefix. The <syslog-prefix> is determined by the remote syslog serverconfiguration.
eventId Displays the unique ID of the event message. The default value is Event.
partInfo Displays whether the message is split into parts.
createdTime Displays the time when the event was generated.
eventType Displays the event type.
vSphere Monitoring and Performance
VMware, Inc. 133
Item Description
severity Displays whether the event is a piece information, a warning, or an error.
user Displays the name of the user who generated the event.
target Displays the object the event refers to.
chainId Displays information about the parent or the group ID.
desc Displays the description of the event.
Example: Split of Long Event Message into Multiple SyslogMessagesEvents that are longer than 1024 characters split into multiple syslog messages in the following manner:
<syslog-prefix> : Event [eventId] [1-X] [payload-part-1]
<syslog-prefix> : Event [eventId] [2-X] [payload-part-2]
...
<syslog-prefix> : Event [eventId] [X-X] [payload-part-X]
The X stands for the number of the event message parts.
Redirect vCenter Server Appliance Log Files to Another MachineYou can redirect the vCenter Server Appliance log files to another machine, for example, if you want topreserve storage space on the vCenter Server Appliance.
Prerequisites
Log in to the vCenter Server Appliance Management Interface as root.
Procedure
1 In the vCenter Server Appliance Management Interface, select Syslog Configuration.
2 Click Edit.
3 From the Common Log Level drop-down menu, select the log files to redirect.
Option Description
* All log files are redirected to the remote machine.
info Only informational log files are redirected to the remote machine.
notice Only notices are redirected to the remote machine.
Notice indicates normal but significant condition.
warn Only warnings are redirected to the remote machine.
error Only error messages are redirected to the remote machine.
crit Only critical log files are redirected to the remote machine.
vSphere Monitoring and Performance
VMware, Inc. 134

Option Description
alert Only alerts are redirected to the remote machine.
Alert indicates that action must be taken immediately.
emerg Only emergency log files are redirected to the remote machine.
Emergency indicates that the system stopped responding and cannot be used.
4 In the Remote Syslog Host text box, enter the FQDN or IP address of the machine on which youwant to export the log files.
5 In the Remote Syslog Port text box, enter the port number to use for communication with themachine on which you want to export the log files.
6 From the Remote Syslog Protocol drop-down menu, select the protocol to use.
Option Description
TCP Transmission Control Protocol
UDP User Datagram Protocol
TLS Transport Layer Security
RELP Reliable Event Logging Protocol
7 Click OK.
The new configuration settings are shown in the Remote Syslog Configuration pane.
8 (Optional) To stop redirecting log files to another machine, click Reset.
Configure Streaming of Events to a Remote Syslog ServerYou can also configure writing of events to the vCenter Server Appliance streaming facility. Streamingevents is supported only for the vCenter Server Appliance. The streaming of events to a remote syslogserver is disabled by default. You can enable and configure the streaming of vCenter Server events to aremote syslog server from the vCenter Server Appliance Management Interface.
Procedure
1 In the vSphere Client, navigate to the vCenter Server instance.
2 Select the Configure tab.
3 Under Settings, Select Advanced Settings.
4 Click Edit.
5 In the Filter text box, type vpxd.event, and press Enter.
6 Enable or disable the vpxd.event.syslog option.
The default value for the setting is enabled.
vSphere Monitoring and Performance
VMware, Inc. 135

Retention of Events in the vCenter Server DatabaseYou can configure vCenter Server to retain events in the database for a limited period. Discarding eventsperiodically ensures optimal performance of the database.
In new installations of vCenter Server 6.5, the event clean up option is enabled by default and the defaultnumber of days to retain event messages in the database is 30. You can change this value to the numberof days that you want to retain the event messages in the database.
If you are upgrading or migrating from vCenter Server 6.5 or earlier, and you had the event cleanupoption enabled, your setting to retain events is preserved after the upgrade or migration to vCenter ServerAppliance 6.5.
After the retention period ends, the events are deleted from the database. However, there might belatency in the deletion of the events that are older than the configured retention setting.
Configure Database SettingsYou can configure the maximum number of database connections that can occur simultaneously. To limitthe growth of the vCenter Server database and save storage space, you can configure the database todiscard information about tasks or events periodically.
Note Do not use the database retention options if you want to keep a complete history of tasks andevents for your vCenter Server.
Procedure
1 In the vSphere Client, navigate to the vCenter Server instance.
2 Select the Configure tab.
3 Under Settings, select General.
4 Click Edit.
5 Select Database.
6 In Maximum connections, type a number.
Increase this number if your vCenter Server system performs many operations frequently andperformance is critical. Decrease this number if the database is shared and connections to thedatabase are costly. Do not change this value unless one of these issues pertains to your system.
7 Select the Enabled check box next to Task cleanup to have vCenter Server periodically delete theretained tasks.
8 (Optional) In Tasks retained for, type a value in days.
Information about tasks that are performed on this vCenter Server system is discarded after thespecified number of days.
9 Select the Enabled check box next to Event cleanup to have vCenter Server periodically clean up theretained events.
vSphere Monitoring and Performance
VMware, Inc. 136
10 (Optional) In Events retention, type a value in days.
Information about events for this vCenter Server system is discarded after the specified number ofdays.
11 Click OK.
View Triggered Alarms and Alarm DefinitionsTriggered alarms are visible in several locations throughout the vSphere Web Client.
Procedure
u To view all triggered alarms, click All in the Alarms sidebar panel.
Note The list of alarms in the sidebar refreshes every 120 seconds. For information about changingthe default refresh period, see the VMware knowledge base article at http://kb.vmware.com/kb/2020290.
u To view only newly triggered alarms, click New in the Alarms sidebar panel.
The sidebar panel displays the latest 30 most critical alarms.
u To view acknowledged alarms, click Acknowledged in the Alarms sidebar panel.
u To view alarms triggered on a selected inventory object, click the Monitor tab, click Issues, and clickTriggered Alarms.
u To view a list of available alarm definitions for a selected inventory object, click the Monitor tab, clickIssues, and click Alarm Definitions.
Live Refresh of Recent Tasks and AlarmsYou can configure the vSphere Web Client to live refresh the recent tasks and the alarms that result fromoperations that other users perform in your environment.
By design the vSphere Web Client displays tasks initiated by other users and the resulting alarms fromthese tasks only when you manually refresh the vSphere Web Client. If you want to see the tasks fromother users, or monitor alarms resulting from other users actions, perform the following procedure.
Procedure
1 On the computer where the vSphere Web Client is installed, locate the webclient.properties file.
The location of this file depends on the operating system on which the vSphere Web Client isinstalled.
Operating System File path
Windows C:\ProgramData\VMware\vCenterServer\cfg\vsphere-client
\webclient.properties
vCenter Server Appliance /etc/vmware/vsphere-client/webclient.properties
vSphere Monitoring and Performance
VMware, Inc. 137

2 Open the webclient.properties file, add the following configuration line, and save it.
live.updates.enabled=true
Live refresh of recent tasks and alarms is enabled for the vSphere Web Client.
3 Log out from the vSphere Web Client.
4 Use https://hostname:9443/vsphere-client/ to log in to the vSphere Web Client.
hostname stands for the name or the IP address of the host where vCenter Server system runs.
If you log in to the vSphere Web Client by using the https://hostname/vsphere-client/, youwill see no recent tasks or alarms under the respective Recent Tasks or Alarms portlets in thevSphere Web Client.
In an environment with multiple vCenter Server systems that are connected to the same vCenter ServerSingle-Sign On domain, the vSphere Web Client that you configured for live refresh displays recent tasksand alarms for all the vCenter Server instances in the domain. However, if you log in to a differentvSphere Web Client, you will not see live refresh for recent tasks or alarms for any of the vCenter Serversystems in the vCenter Server Single-Sign On domain.
Example
In this example, you have two vCenter Server instances (A and B) connected to the same vCenter ServerSingle-Sign On domain. With each of the vCenter Server instances, you installed a vSphere Web Clientinstance.
You log in to vSphere Web Client A by using https://hostnameA/vsphere-client/.
You log in to vSphere Web Client B by using https://hostnameB/vsphere-client/.
You enable live refresh of recent tasks and alarms on vSphere Web Client A, and log out from it.
You can observe the following results:
n You log in to vSphere Web Client A from https://hostnameA/vsphere-client/. You do not seeany recent tasks or alarms in the respective Recent Tasks or Alarms portlets.
n You log in to vSphere Web Client A from https://hostnameA:9443/vsphere-client/. You cansee live refresh of recent tasks and alarms for all the users currently performing operations on bothvCenter Server systems in the vCenter Server Single-Sign On domain.
n You log in to vSphere Web Client B from https://hostnameB/vsphere-client/. You can see therecent tasks and alarms of only operations that you perform on vCenter Server system A or vCenterServer system B. Only after you manually refresh the vSphere Web Client B you see the latest recenttasks and alarms that result from operations performed by other users on vCenter Server system Aand vCenter Server system B.
Set an Alarm in the vSphere Web ClientYou can monitor inventory objects by setting alarms on them. Setting an alarm involves selecting the typeof inventory object to monitor, defining when the alarm triggers, for how long the alarm is on, and defining
vSphere Monitoring and Performance
VMware, Inc. 138

actions that are performed as a result of the alarm being triggered. You define alarms in the alarmdefinition wizard. You access the alarm definition wizard from the Monitor tab, under Issues.
When you create an alarm, you select the alarm type, the type of inventory object, and the type of activitythat trigger the alarm. An activity that triggers an alarm can be any of the following:
n A specific condition or a state of the inventory object.
n An event that occurs on the object.
Depending on the type of activity that you choose to monitor, the options on the Triggers page that followthe General page in the alarm definitions wizard, change.
After defining the triggers, define the actions that the trigger causes.
Prerequisites
Log in to the vSphere Web Client.
Required Privilege: Alarms.Create alarm or Alarms.Modify alarm
n Create or Edit Alarms
To monitor your environment, you can create and modify alarm definitions in the vSphere WebClient. You can view alarm settings from any object, but you can modify settings only through theobject on which the alarm is defined.
n Specify Alarm Name, Description, and Type
General settings of an alarm definition include alarm name, description, and type. You can alsoenable and disable the alarm from the general settings page.
n Specify How a Condition-Based or State-Based Alarm is Triggered
You can select and configure the events, states, or conditions that trigger the alarm from theTriggers page of the alarm definition wizard.
n Specify How an Event-Based Alarm is Triggered
You can specify the events, states, or conditions that trigger the alarm on the Triggers page of thealarm definition wizard. On the General page of the alarm definition wizard, if you selected a triggerfor an alarm to be a specific event occurring on the inventory object, perform the followingprocedure.
n Specify Alarm Actions
You can define actions that the system performs when the alarm is triggered or changes status. Youcan enable and disable alarms and alarm actions independently of each other.
Create or Edit AlarmsTo monitor your environment, you can create and modify alarm definitions in the vSphere Web Client. Youcan view alarm settings from any object, but you can modify settings only through the object on which thealarm is defined.
You can access alarm definitions in the Monitor tab. You can create alarm definitions from the Monitortab or from the object pop-up menu.
vSphere Monitoring and Performance
VMware, Inc. 139

Prerequisites
Required Privilege: Alarms.Create alarm or Alarms.Modify alarm
Procedure
u Create or edit alarms in the Monitor tab.
a Select an inventory object, click the Monitor tab, and click Issues.
b Click Alarm Definitions.
c Right-click the list of alarms, and select to add or edit an alarm.
You cannot edit vCenter Server predefined alarms.
u Add an alarm to an object in the object navigator.
a Right-click an inventory object and select Alarms > New Alarm Definition.
Specify Alarm Name, Description, and TypeGeneral settings of an alarm definition include alarm name, description, and type. You can also enableand disable the alarm from the general settings page.
Prerequisites
n Required Privilege: Alarms.Create alarm or Alarms.Modify alarm
n In the alarm definition wizard, click the General page. See Create or Edit Alarms.
Procedure
1 Type a name and description.
2 Select the type of inventory object that this alarm monitors.
3 Select the type of activity that this alarm monitors.
Note Depending on the type of activity that you choose to monitor, the options on the Triggers pagethat follow the General page in the alarm definitions wizard, change.
4 Click the Enable this alarm check-box if you want to enable the alarm immediately after creation.
5 Click Next.
What to do next
Set alarm triggers.
Specify How a Condition-Based or State-Based Alarm is TriggeredYou can select and configure the events, states, or conditions that trigger the alarm from the Triggerspage of the alarm definition wizard.
vSphere Monitoring and Performance
VMware, Inc. 140

The option that you choose on the General page of the alarm definition wizard determine the optionsavailable on the Triggers page. An alarm definition must contain at least one trigger before you can saveit.
For information about defining triggers for an event-based alarm, see Specify How an Event-Based Alarmis Triggered.
You can add multiple triggers and choose whether to trigger the alarm when one or all of them becomeactive.
Prerequisites
n Required Privilege: Alarms.Create alarm or Alarms.Modify alarm
Procedure
1 Select the trigger that you want to change, or click the Add icon to add a trigger.
2 Click in the Trigger column, and select an option from the drop-down menu.
3 Click in the Operator column, and select an option from the drop-down menu.
4 Click in the Warning Condition column, and select an option from the drop-down menu to set thethreshold for triggering a warning.
5 Click in the Critical Condition column, and select an option from the drop-down menu.
6 Click Next.
You selected and configured alarm triggers.
What to do next
Configure actions that follow after the alarm is triggered.
Specify How an Event-Based Alarm is TriggeredYou can specify the events, states, or conditions that trigger the alarm on the Triggers page of the alarmdefinition wizard. On the General page of the alarm definition wizard, if you selected a trigger for an alarmto be a specific event occurring on the inventory object, perform the following procedure.
The option that you choose on the General page of the alarm definition wizard determine the optionsavailable on the Triggers page. An alarm definition must contain at least one trigger before you can saveit.
For information about defining triggers for a condition-based alarm, see Specify How a Condition-Basedor State-Based Alarm is Triggered.
You can add multiple triggers and choose whether to trigger the alarm when one or all of them becomeactive.
Prerequisites
n Required Privilege: Alarms.Create alarm or Alarms.Modify alarm
vSphere Monitoring and Performance
VMware, Inc. 141

Procedure
1 Select the trigger that you want to change, or click the Add icon to add a trigger.
2 Click in the Event column, and select an option from the drop-down menu.
3 Click in the Status column, and select an option from the drop-down menu.
4 (Optional) Configure additional conditions to be met before the alarm triggers.
a Click the Add icon to add an argument.
b Click in the Argument column, and select an option from the drop-down menu.
c Click in the Operator column, and select an option from the drop-down menu.
d Click in the Value column, and enter a value into the text box.
You can add more than one argument.
5 Click Next.
You selected and configured alarm triggers.
What to do next
Configure actions that follow after the alarm is triggered.
Specify Alarm ActionsYou can define actions that the system performs when the alarm is triggered or changes status. You canenable and disable alarms and alarm actions independently of each other.
vCenter Server can perform alarm actions in response to triggered alarms.
Prerequisites
Verify that you have navigated to the Actions page of the alarm definition wizard. See Create or EditAlarms.
Required Privilege: Alarms.Create alarm or Alarms.Modify alarm
n Send Email as an Alarm Action
You can use the SMTP agent included with vCenter Server to send email notifications when alarmsare triggered.
n Send SNMP Traps as an Alarm
The SNMP agent included with vCenter Server can be used to send traps when alarms are triggeredon a vCenter Server instance. The default hardware health alarms send SNMP traps by default.
n Run a Script or a Command as an Alarm Action
You can configure an alarm to run a script or a command in the vSphere Web Client when the alarmis triggered.
vSphere Monitoring and Performance
VMware, Inc. 142

Procedure
1 Select the action that you want to change, or click the Add icon to add one.
2 Click in the Action column, and select an option from the drop-down menu.
3 Click in the Configuration column, and enter configuration information for actions that requireadditional information:
Option Action
Send a notification email Type email addresses, separated by a comma.
Migrate VM Complete the virtual machine migration wizard.
Run a command Take one of the following actions and press Enter:n If the command is a .exe file, enter the full path name of the command and
include any parameters. For example, to run the cmd.exe command in theC:\tools directory, with the alarmName and targetName parameters, type:c:\tools\cmd.exe alarmName targetName
n If the command is a .bat file, enter the full path name of the command as anargument to the c:\windows\system32\cmd.exe command. Include anyparameters. For example, to run the cmd.bat command in the C:\toolsdirectory, with the alarmName and targetName parameters, type:c:\windows\system32\cmd.exe /c c:\tools\cmd.bat alarmName
targetName
For .bat files, the command and its parameters must be formatted into onestring.
4 (Optional) For each alarm status change column, select whether the alarm should be triggered when
the alarm status changes.
Some actions do not support re-triggering when alarm status change.
5 For repeat actions, select the time interval for the repetition.
6 Click Finish.
You configured the alarm general settings, triggers, and actions. The alarm monitors the object on which itis defined, as well as child objects.
Send Email as an Alarm ActionYou can use the SMTP agent included with vCenter Server to send email notifications when alarms aretriggered.
Prerequisites
Ensure that the vCenter Server SMTP agent is properly configured to send email notifications.
Required Privilege: Alarms.Create alarm or Alarms.Modify alarm
Procedure
1 On the Actions page of the alarm definition wizard, click Add to add an action.
vSphere Monitoring and Performance
VMware, Inc. 143

2 In the Actions column, select Send a notification email from the drop-down menu.
3 In the Configuration column, enter recipient addresses. Use commas to separate multipleaddresses.
4 (Optional) Configure alarm transitions and frequency.
vCenter Server Email Agent Notifications
The following tables describe the information that is included in Alarm-based and Event-based emailnotifications. The first table described the information included in all email notifications. The second tabledescribes additional information that is included in Event-based notifications.
Table 5-2. Basic SNMP Email Notification Details
Email Entry Description
Target Object for which the alarm was triggered.
Old Status Previous alarm status. Applies only to state triggers.
New Status Current alarm status. Applies only to state triggers.
Metric Value Threshold value that triggered the alarm. Applies only to metric condition triggers.
Alarm Definition Alarm definition in vCenter Server, including the alarm name and status.
Description Localized string containing a summary of the alarm. For example:
Alarm New_Alarm on host1.vmware.com changed from Gray to Red.
Table 5-3. Additional Notification Details for Alarms Triggered by Events
Detail Description
Event Details VMODL event type name.
Summary Alarm summary, including the event type, alarm name, and target object.
Date Time and date the alarm was triggered.
UserName Person who initiated the action that caused the event to be created. Events caused by an internalsystem activity do not have a UserName value.
Host Host on which the alarm was triggered.
Resource Pool Resource pool on which the alarm was triggered.
Datacenter Data center on which the alarm was triggered.
Arguments Arguments passed with the alarm and their values.
Send SNMP Traps as an AlarmThe SNMP agent included with vCenter Server can be used to send traps when alarms are triggered on avCenter Server instance. The default hardware health alarms send SNMP traps by default.
Prerequisites
Ensure that vCenter Server SNMP agents and ESXi SNMP agents are properly configured.
Ensure that SNMP trap receiver agents are properly configured.
vSphere Monitoring and Performance
VMware, Inc. 144

Required Privilege: Alarms.Create alarm or Alarms.Modify alarm
Procedure
1 On the Actions page of the alarm definition wizard, click Add.
2 In the Actions column, select Send a notification trap from the drop-down menu.
3 (Optional) Configure alarm transitions and frequency.
4 Click Finish to save the alarm settings.
SNMP Trap Notifications
The following table describes the information that is included in vCenter Server and ESXi trapnotifications.
Table 5-4. SNMP Trap Notification Details
Trap Entry Description
Type The state vCenter Server is monitoring for the alarm. Options include Host Processor (or CPU) usage,Host Memory usage, Host State, Virtual Machine Processor (or CPU) usage, Virtual Machine Memoryusage, Virtual Machine State, Virtual Machine Heartbeat.
Name The name of the host or virtual machine that triggers the alarm.
Old Status The alarm status before the alarm was triggered.
New Status The alarm status when the alarm is triggered.
Object Value The object value when the alarm is triggered.
Run a Script or a Command as an Alarm ActionYou can configure an alarm to run a script or a command in the vSphere Web Client when the alarm istriggered.
Use the alarm environment variables to define complex scripts and attach them to multiple alarms orinventory objects. For example, you can write a script that enters the following trouble ticket informationinto an external system when an alarm is triggered:
n Alarm name
n Object on which the alarm was triggered
n Event that triggered the alarm
n Alarm trigger values
When you write the script, include the following environment variables in the script:
n VMWARE_ALARM_NAME
n VMWARE_ALARM_TARGET_NAME
n VMWARE_ALARM_EVENTDESCRIPTION
n VMWARE_ALARM_ALARMVALUE
vSphere Monitoring and Performance
VMware, Inc. 145
You can attach the script to any alarm on any object without changing the script.
The script runs on the vCenter Server machine, and it runs even if you close the vSphere Web Client.
Prerequisites
Required Privilege: Alarms.Create alarm or Alarms.Modify alarm
Procedure
1 On the Actions tab of the alarm definitions wizard, click Add to add an action.
2 In the Actions column, select Run a command from the drop-down menu.
3 In the Configuration column, type script or command information:
For this type of command... Enter this...
EXE executable files Full pathname of the command. For example, to run the cmd.exe command in theC:\tools directory, type:
c:\tools\cmd.exe.
BAT batch file Full pathname of the command as an argument to the c:\windows\system32\cmd.exe command. For example, to run the cmd.bat command in theC:\tools directory, type:
c:\windows\system32\cmd.exe /c c:\tools\cmd.bat.
Note The command and its parameters must be formatted into one string.
If your script does not make use of the alarm environment variables, include any necessaryparameters in the configuration field. Enclose parameters in curly brackets. For example:
c:\tools\cmd.exe {alarmName} {targetName}
c:\windows\system32\cmd.exe /c c:\tools\cmd.bat {alarmName} {targetName}
The script can run on any platform. You must provide the path to the script and argument keys. Forexample:
/var/myscripts/myAlarmActionScript {alarmName} {targetName}
4 (Optional) Configure alarm transitions and frequency.
5 Click Finish to save the alarm settings.
Alarm Environment Variables for Scripts
To simplify script configuration for alarm actions, VMware provides environment variables for VMwarealarms. Use the variables to define more complex scripts and attach them to multiple alarms or inventoryobjects so that the alarm action occurs when the alarm triggers.
vSphere Monitoring and Performance
VMware, Inc. 146

Table 5-5. Alarm Environment Variables
Variable Name Variable Description Supported Alarm Type
VMWARE_ALARM_NAME The name of the triggered alarm. Condition, State, Event
VMWARE_ALARM_ID The MOID of the triggered alarm. Condition, State, Event
VMWARE_ALARM_TARGET_NAME The name of the entity on which thealarm triggered.
Condition, State, Event
VMWARE_ALARM_TARGET_ID The MOID of the entity on which thealarm triggered.
Condition, State, Event
VMWARE_ALARM_OLDSTATUS The old status of the alarm. Condition, State, Event
VMWARE_ALARM_NEWSTATUS The new status of the alarm. Condition, State, Event
VMWARE_ALARM_TRIGGERINGSUMMARY A multiline summary of the alarm. Condition, State, Event
VMWARE_ALARM_DECLARINGSUMMARY A single-line declaration of the alarmexpression.
Condition, State, Event
VMWARE_ALARM_ALARMVALUE The value that triggered the alarm. Condition, State
VMWARE_ALARM_EVENTDESCRIPTION A description of the alarm statuschange event.
Condition, State
VMWARE_ALARM_EVENTDESCRIPTION A description of the event thattriggered the alarm.
Event
VMWARE_ALARM_EVENT_USERNAME The user name associated with theevent.
Event
VMWARE_ALARM_EVENT_DATACENTER The name of the data center in whichthe event occurred.
Event
VMWARE_ALARM_EVENT_COMPUTERESOURCE The name of the cluster or resourcepool in which the event occurred.
Event
VMWARE_ALARM_EVENT_HOST The name of the host on which theevent occurred.
Event
VMWARE_ALARM_EVENT_VM The name of the virtual machine onwhich the event occurred.
Event
VMWARE_ALARM_EVENT_NETWORK The name of the network on whichthe event occurred.
Event
VMWARE_ALARM_EVENT_DATASTORE The name of the datastore on whichthe event occurred.
Event
VMWARE_ALARM_EVENT_DVS The name of the vSphere DistributedSwitch on which the event occurred.
Event
Alarm Command-Line Parameters
VMware provides command-line parameters that function as a substitute for the default alarmenvironment variables. You can use these parameters when running a script as an alarm action for acondition, state, or event alarm.
vSphere Monitoring and Performance
VMware, Inc. 147

The command-line parameters enable you to pass alarm information without having to change an alarmscript. For example, you can use these parameters when you have an external program for which you donot have the source. You can pass in the necessary data by using the substitution parameters, which takeprecedence over the environment variables. You pass the parameters through the Configuration dialogbox in the alarm definition wizard or on a command line.
Table 5-6. Command-Line Parameters for Alarm Action Scripts
Variable Description
{eventDescription} The text of the alarmStatusChange event. The {eventDescription} variable issupported only for Condition and State alarms.
{targetName} The name of the entity on which the alarm is triggered.
{alarmName} The name of the alarm that is triggered.
{triggeringSummary} A summary of the alarm trigger values.
{declaringSummary} A summary of the alarm declaration values.
{oldStatus} The alarm status before the alarm is triggered.
{newStatus} The alarm status after the alarm is triggered.
{target} The inventory object on which the alarm is set.
Set an Alarm in the vSphere ClientIn the vSphere Client you define alarms in the alarm definition wizard. You access the alarm definitionwizard from the Configure tab, under More.
Enhancements to Creating Alarms in the vSphere Client(http://link.brightcove.com/services/player/bcpid2296383276001?bctid=ref:video_vsphere67_alarms)
Create or Edit AlarmsTo monitor your environment, you can create alarm definitions in the vSphere Client . You can accessalarm definitions in the Configure tab.
Create alarms in the Configure tab.
Prerequisites
Required Privilege: Alarms.Create alarm or Alarms.Modify alarm
Procedure
1 Select an inventory object, click the Configure tab, and click More.
2 Click Alarm Definitions.
3 Click Add to add an alarm.
4 Select an alarm, click Enable to enable an alarm.
vSphere Monitoring and Performance
VMware, Inc. 148

5 Select an alarm, click Disable to disable an alarm.
6 Select an alarm, click Delete to delete an alarm.
7 Click Edit to edit an alarm.
8 You can also edit an alarm definition by selecting Monitor > Triggered Alarms
a Select an alarm listed underAlarm Name.
b Click Edit Alarm Definition to edit an alarm.
Specify Alarm Name, Description, and TargetSettings of an alarm definition include alarm name, description, and target.
Prerequisites
n Required Privilege: Alarms.Create alarm or Alarms.Modify alarm
n In the Alarms Definitions page, click Add. See Create an Alarm
Procedure
1 Type a name and description.
2 Select the type of inventory object that this alarm monitors from the Target type drop-down menu
Depending on the type of target that you choose to monitor, the summary that follows the Target,change.
3 Click Next.
Note Depending on the type of activity that you choose to monitor, the options on the Alarm Rulepage, change.
Set alarm rule.
Specify Alarm RulesYou can select and configure the events, states, or conditions that trigger the alarm from the Alarm Rulepage in the New Alarm Definition wizard.
An alarm definition must contain at least one trigger before you can save it.
Prerequisites
Required Privilege: Alarms.Create alarm or Alarms.Modify alarm
Procedure
1 Select a trigger from the drop-down menu.
The combined event triggers are displayed. You can set the rule for a single event only. You mustcreate multiple rules for multiple events.
vSphere Monitoring and Performance
VMware, Inc. 149

2 Click Add Argument to select an argument from the drop-down menu.
It supports ALL based expression, option to select ANY is not available. You must create a separatealarm definition for each trigger. The OR operator is not supported in the vSphere Client. However,you can combine more than one condition trigger with AND operator.
3 Select an operator from the drop-down menu.
4 Select an option from the drop-down menu to set the threshold for triggering an alarm
5 Select severity of the alarm from the drop-down menu.
You can set the condition to either Show as Warning or Show as Critical, but not for both. You mustcreate a separate alarm definition for warning and critical status. Keep the target's current stateoption can be enabled only for an event based alarm condition. For example, if Cannot power offthe VM and Keep the target's current state is selected for an alarm rule, then it cannot becombined with any other alarm rule with different severities like Warning or Critical. These alarmswill not have reset rules as the alarm rule does not change the state of the target object.
6 Send email notifications
a To send email notifications when alarms are triggered, enable Send email notifications.
b In the Email to, enter recipient addresses. Use commas to separate multiple addresses.
7 To send traps when alarms are triggered on a vCenter Server instance, enable Send SNMP traps.
vSphere Monitoring and Performance
VMware, Inc. 150

8 Run scripts
a To run scripts when alarms are triggered, enable Run script.
b In Run this script column, type script or command information:
For this type of command... Enter this...
EXE executable files Full pathname of the command. For example, to run the cmd.exe command inthe C:\tools directory, type:
c:\tools\cmd.exe.
BAT batch file Full pathname of the command as an argument to the c:\windows\system32\cmd.exe command. For example, to run the cmd.bat command inthe C:\tools directory, type:
c:\windows\system32\cmd.exe /c c:\tools\cmd.bat.
Note The command and its parameters must be formatted into one string.
If your script does not make use of the alarm environment variables, include any necessaryparameters in the configuration field. Enclose parameters in curly brackets. For example:
c:\tools\cmd.exe {alarmName} {targetName}
c:\windows\system32\cmd.exe /c c:\tools\cmd.bat {alarmName} {targetName}
The script can run on any platform. You must provide the path to the script and argument keys.For example:
/var/myscripts/myAlarmActionScript {alarmName} {targetName}
9 (Optional) Configure alarm transitions and frequency.
10 Select an advanced action from the drop-down menu.
You can define the advanced actions for virtual machine and hosts. These advanced actions areapplicable only for virtual machines and hosts. There are different sets of advanced actions based ontarget types of virtual machines and hosts.
You can add multiple advanced actions for an alarm.
11 (Optional) Configure frequency for advanced actions.
12 Click Add Another Rule to add an additional rule for an alarm.
13 Click Duplicate Rule to create an identical rule for an alarm.
14 Click Remove Rule to remove an existing rule set for an alarm.
What to do next
Click Next to set the Reset Rule.
vSphere Monitoring and Performance
VMware, Inc. 151

Specify Alarm Reset RulesYou can select and configure the events, states, or conditions that trigger the alarm from the Reset Rulepage in the New Alarm Definition wizard.
You can set the Alarm Reset Rule
Prerequisites
Required Privilege: Alarms.Create alarm or Alarms.Modify alarm
Procedure
1 Enable the Reset the alarm to green option.
2 Select a trigger from the drop-down menu.
The combined event triggers are displayed. You can set the rule for a single event only. You mustcreate multiple rules for multiple events.
3 Click Add Argument to select an argument from the drop-down menu.
It supports ALL based expression, option to select ANY is not available. You must create a separatealarm definition for each trigger. The OR operator is not supported in the vSphere Client. However,you can combine more than one condition trigger with AND operator.
4 Select an operator from the drop-down menu.
5 Send email notifications
a To send email notifications when alarms are triggered, enable Send email notifications.
b In the Email to, enter recipient addresses. Use commas to separate multiple addresses.
6 To send traps when alarms are triggered on a vCenter Server instance, enable Send SNMP traps.
vSphere Monitoring and Performance
VMware, Inc. 152

7 Run scripts
a To run scripts when alarms are triggered, enable Run script.
b In Run this script column, type script or command information:
For this type of command... Enter this...
EXE executable files Full pathname of the command. For example, to run the cmd.exe command inthe C:\tools directory, type:
c:\tools\cmd.exe.
BAT batch file Full pathname of the command as an argument to the c:\windows\system32\cmd.exe command. For example, to run the cmd.bat command inthe C:\tools directory, type:
c:\windows\system32\cmd.exe /c c:\tools\cmd.bat.
Note The command and its parameters must be formatted into one string.
If your script does not make use of the alarm environment variables, include any necessaryparameters in the configuration field. Enclose parameters in curly brackets. For example:
c:\tools\cmd.exe {alarmName} {targetName}
c:\windows\system32\cmd.exe /c c:\tools\cmd.bat {alarmName} {targetName}
The script can run on any platform. You must provide the path to the script and argument keys.For example:
/var/myscripts/myAlarmActionScript {alarmName} {targetName}
8 (Optional) Configure alarm transitions and frequency.
9 Select an advanced action from the Add Advanced Actions drop-down menu.
You can add multiple advanced actions for an alarm reset rule. You can define the advanced actionsfor virtual machines and hosts. These advanced actions are applicable only for virtual machines andhosts. There are different sets of advanced actions based on target types of virtual machines andhosts.
You can add multiple advanced actions for an alarm.
10 (Optional) Configure frequency for advanced actions.
11 Click Add Another Rule to add an additional reset rule for an alarm.
12 Click Duplicate Rule to create an identical reset rule for an alarm.
13 Click Remove Rule to remove an existing reset rule set for an alarm.
Example
Click Next to review the alarm definition.
vSphere Monitoring and Performance
VMware, Inc. 153

Review and Enable AlarmYou can review and enable the alarm in the vSphere Client
After setting the alarm rule, review the alarm before enabling the alarm.
Prerequisites
Required Privilege: Alarms.Create alarm or Alarms.Modify alarm
Procedure
1 Review the Alarm Name, Description, Targets, and Alarm Rule.
2 (Optional) Configure alarm transitions and frequency.
3 Select Enable this alarm to enable the alarm.
The alarm is enabled.
Acknowledge Triggered AlarmsAfter you acknowledge an alarm in the vSphere Client, its alarm actions are discontinued. Alarms are notcleared, or reset when acknowledged.
Acknowledging an alarm lets other users know that you are taking ownership of the issue. For example, ahost has an alarm set to monitor CPU usage. It sends an email to an administrator when the alarm istriggered. The host CPU usage spikes, triggering the alarm which sends an email to the host'sadministrator. The administrator acknowledges the triggered alarm to let other administrators know theproblem is being addressed, and to prevent the alarm from sending more email messages. The alarm,however, is still visible in the system.
Prerequisites
Required privilege: Alarm.Alarm Acknowledge
Procedure
u Right-click the alarm in the Alarms panel and select Acknowledge.
u Acknowledge the alarm in the Monitor tab.
a Select an inventory object in the object navigator.
b Click the Monitor tab.
c Click Issues and Alarms, and click Triggered Alarms.
d Select an alarm and select Acknowledge.
vSphere Monitoring and Performance
VMware, Inc. 154

Reset Triggered Event AlarmsAn alarm triggered by an event might not reset to a normal state if vCenter Server does not retrieve theevent that identifies the normal condition. In such cases, reset the alarm manually in the vSphere Client toreturn it to a normal state.
Prerequisites
Required privilege: Alarm.Set Alarm Status
Procedure
u Right-click an alarm in the Alarms sidebar pane and select Reset to green.
u Reset triggered alarms in the Monitor tab.
a Select an inventory object.
b Click the Monitor tab.
c Click Issues and Alarms, and click Triggered Alarms.
d Select the alarms you want to reset.
Use Shift+left-click or Ctrl+left-click to select multiple alarms is supported in the vSphere WebClient.
e Right-click an alarm and select Reset to Green.
Preconfigured vSphere AlarmsvCenter Server provides a list of default alarms, which monitor the operations of vSphere inventoryobjects. You only need to set up actions for these alarms.
Some alarms are stateless. vCenter Server does not keep data on stateless alarms and neither computesnor displays their status. Stateless alarms cannot be acknowledged or reset. Stateless alarms areindicated by an asterisk next to their name.
Table 5-7. Default vSphere Alarms
Alarm Name Description
Host connection and power state Monitors the power state of the host and whether the host isreachable.
Host CPU usage Monitors host CPU usage.
Host memory usage Monitors host memory usage.
Virtual machine CPU usage Monitors virtual machine CPU usage.
Virtual machine memory usage Monitors virtual machine memory usage.
Datastore usage on disk Monitors datastore disk usage.
Note This alarm controls the Status value for datastores invSphere Web Client. If you disable this alarm, the datastorestatus is displayed as Unknown.
vSphere Monitoring and Performance
VMware, Inc. 155

Table 5-7. Default vSphere Alarms (continued)
Alarm Name Description
Virtual machine CPU ready Monitors virtual machine CPU ready time.
Virtual machine total disk latency Monitors virtual machine total disk latency.
Virtual machine disk commands canceled Monitors the number of virtual machine disk commands that arecanceled.
Virtual machine disk reset Monitors the number of virtual machine bus resets.
License inventory monitoring Monitors the license inventory for compliance.
License user threshold monitoring Monitors whether a user-defined license threshold is exceeded.
License capacity monitoring Monitors whether a license capacity is exceeded.
The host license edition is not compatible with the vCenterServer license edition
Monitors the compatibility of the vCenter Server and host licenceeditions.
Host flash capacity exceeds the licensed limit for Virtual SAN Monitors whether the flash disk capacity on the host exceedsthe limit of the Virtual SAN license.
Expired Virtual SAN license Monitors the expiry of the Virtual SAN license and the end of theevaluation period.
Errors occurred on the disk(s) of a Virtual SAN host Default alarm that monitors whether the host disks in the VirtualSAN cluster have errors.
Timed out starting Secondary VM * Monitors whether starting a secondary virtual machine has timedout. .
No compatible host for Secondary VM Monitors the availability of compatible hosts on which asecondary virtual machine can be created and run.
Virtual machine Fault Tolerance state changed Monitors changes in the Fault Tolerance state of a virtualmachine.
Virtual Machine Fault Tolerance vLockStep interval StatusChanged
Monitors changes in the Fault Tolerance Secondary vLockStepinterval.
Host processor status Monitors the host processors.
Host memory status Monitors host memory usage.
Host hardware fan status Monitors host fans.
Host hardware voltage Monitors host hardware voltage.
Host hardware temperature status Monitors the temperature status of the host hardware.
Host hardware power status Monitors the host power status.
Host hardware system board status Monitors the status of host system boards.
Host battery status Monitors the battery status of hosts.
Status of other host hardware objects Monitors other host hardware objects.
Host storage status Monitors host connectivity to storage devices.
Host IPMI System Event Log status Monitors the capacity of the IPMI system event log.
Host Baseboard Management Controller status Monitors the status of the Baseboard Management Controller.
Host error * Monitors host error and warning events.
vSphere Monitoring and Performance
VMware, Inc. 156

Table 5-7. Default vSphere Alarms (continued)
Alarm Name Description
Virtual machine error * Monitors virtual machine error and warning events.
Host connection failure * Monitors host connection failures.
Unmanaged workload detected on SIOC-enabled datastore Monitors the unmanaged I/O workload on a SIOC-enableddatastore.
Thin-provisioned volume capacity threshold exceeded Monitors whether the thin provisioning threshold on the storagearray exceeds for volumes backing the datastore.
Datastore capability alarm Monitors the change in the capability status for volumes backingthe datastore.
VASA provider disconnected Monitors the changes in the connection state of VASA providers.
VASA Provider certificate expiration alarm Monitors whether VASA provider certificates are getting close totheir expiry date.
VM storage compliance alarm Monitors the virtual disk compliance with the object-basedstorage.
Datastore compliance alarm Monitors wether the virtual disk on the datastore complies withthe object-based storage.
Refreshing CA certificates and CRLs for a VASA provider failed Monitors whether the refreshing of CA certificates and CRLs forsome of the VASA providers has failed.
Insufficient vSphere HA failover resources Monitors the sufficiency of failover cluster resources required forvSphere High Availability.
vSphere HA failover in progress Monitors the failover progress of vSphere High Availability.
Cannot find vSphere HA master agent Monitors whether vCenter Server is able to connect to avSphere High Availability master agent.
vSphere HA host status Monitors the host health status reported by vSphere HighAvailability.
vSphere HA virtual machine failover failed Monitors whether a failover operation that uses vSphere HighAvailability failed.
vSphere HA virtual machine monitoring action Monitors whether vSphere High Availability has restarted avirtual machine.
vSphere HA virtual machine monitoring error Monitors whether vSphere High Availability failed to reset avirtual machine.
vSphere HA VM Component Protection could not power off avirtual machine
Monitors whether vSphere High Availability VM ComponentProtection cannot power off a virtual machine with aninaccessible datastore.
License error * Monitors license errors.
Health status changed * Monitors changes to service and extension health status.
Virtual machine component protection restart error Monitors whether the vSphere HA VM Component Protectionfails to restart a virtual machine.
Storage DRS recommendation Monitors Storage DRS recommendations.
Storage DRS is not supported on a host Monitors and alerts when Storage DRS is not supported on ahost.
vSphere Monitoring and Performance
VMware, Inc. 157

Table 5-7. Default vSphere Alarms (continued)
Alarm Name Description
Datastore cluster is out of space Monitors whether a datastore cluster runs out of disk space.
Datastore is in multiple datacenters Monitors whether a datastore in a datastore cluster is visible inmore than one data center.
vSphere Distributed Switch VLAN trunked status Monitors changes in vSphere Distributed Switch VLAN trunkedstatus.
vSphere Distributed Switch MTU matched status Monitors changes in vSphere Distributed Switch MTU matchedstatus.
vSphere Distributed Switch MTU supported status Monitors changes in vSphere Distributed Switch MTU supportedstatus.
vSphere Distributed Switch teaming matched status Monitors changes in vSphere Distributed Switch teamingmatched status.
Virtual Machine network adapter reservation status Monitors changes in the reservation status of a virtual machinenetwork adapter.
Virtual machine Consolidation Needed status Monitors changes in the virtual machine Consolidation Neededstatus.
Host virtual flash resource status Monitors the Flash Read Cache resource status on the host.
Host virtual flash resource usage Monitors the Flash Read Cache resource usage on the host.
Registration/unregistration of a VASA vendor provider on aVirtual SAN host fails
Default alarm that monitors whether the registration orunregistration of a VASA vendor provider on a Virtual SAN hostfails.
Registration/unregistration of third-party IO filter storageproviders fails on a host
Default alarm that monitors whether vCenter Server fails toregister or unregister third-party IO filter storage providers on ahost.
Service Control Agent Health Alarm Monitors the health status of the VMware Service Control Agent.
Identity Health Alarm Monitors the health status of the Identity Management Service.
vSphere Client Health Alarm Monitors the health status of the vSphere Client.
ESX Agent Manager Health Alarm Monitors the health status of the ESX Agent Manager.
Message Bus Config Health Alarm Monitors the health status of the Message Bus ConfigurationService.
Cis License Health Alarm Monitors the health status of the License Service.
Appliance Management Health Alarm Monitors the health status of the Appliance ManagementService.
vCenter Server Health Alarm Monitors the health status of vCenter Server.
vSphere Monitoring and Performance
VMware, Inc. 158

Table 5-7. Default vSphere Alarms (continued)
Alarm Name Description
Database Health Alarm Monitors the database health status.
When database space reaches 80%, vCenter Server displays awarning event.
When database space reaches 95%, vCenter Server displaysan error event and shuts down. You can clean up the database,or increase database storage capacity, and start vCenter Server.
The alarm is triggered only for PostgreSQL and Microsoft SQLServer database health issues, and does not work with Oracledatabases.
Data Service Health Alarm Monitors the health status of the Data Service.
RBD Health Alarm Monitors the health status of the vSphere Auto Deploy Waiter.
vService Manager Health Alarm Monitors the health status of the vService Manager.
Performance Charts Service Health Alarm Monitors the health status of the Performance Charts Service.
Content Library Service Health Alarm Monitors the health status of the VMware Content LibraryService.
Transfer Service Health Alarm Monitors the health status of the VMware Transfer Service.
VMware vSphere ESXi Dump Collector Health Alarm Monitors the health status of the VMware vSphere ESXi DumpCollector Service.
VMware vAPI Endpoint Service Health Alarm Monitors the health status of the VMware vAPI EndpointService.
VMware vSphere Profile-Driven Storage Service Health Alarm Monitors the health status of the VMware vSphere Profile-DrivenStorage Service.
VMware vFabric Postgres Service Health Alarm Monitors the health status of the VMware vFabric PostgresService.
ESXi Host Certificates Update Failure Status Monitors whether the update of the ESXi host certificates failed.
ESXi Host Certificate Status Monitors the certificate status of an ESXi host.
ESXi Host Certificate Verification Failure Status Monitors whether the verification of an ESXi host certificatefailed.
vSphere vCenter Host Certificate Management Mode Monitors changes in the certificate management mode ofvCenter Server.
Root Certificate Status Monitors whether a root certificate is getting close to itsexpiration date.
GPU ECC Uncorrected Memory Alarm Monitors the GPU ECC uncorrected memory status.
GPU ECC Corrected Memory Alarm Monitors the GPU ECC corrected memory status.
GPU Thermal Condition Alarm Monitors the GPU Thermal condition status.
Network connectivity lost Monitors the network connectivity on a virtual switch.
Network uplink redundancy lost Monitors network uplink redundancy on a virtual switch.
Network uplink redundancy degraded * Monitors network uplink redundancy degradation on a virtualswitch.
VMKernel NIC not configured correctly * Monitors incorrectly configured VMkernel NICs.
vSphere Monitoring and Performance
VMware, Inc. 159

Table 5-7. Default vSphere Alarms (continued)
Alarm Name Description
Cannot connect to storage * Monitors host connectivity to a storage device.
Migration error * Monitors whether a virtual machine cannot be migrated orrelocated, or is orphaned.
Exit standby error Monitors whether a host cannot exit standby mode.
Table 5-8. Deprecated vSphere Alarms
Alarm name Description
Cannot connect to network Monitors the network connectivity on a virtual switch.
IPv6 TSO not supported Monitors whether the IPv6 TSO packets sent by the guestoperating system of a virtual machine are dropped.
SRM Consistency Group Violation Datastore cluster has datastores that belong to different SRMconsistency groups.
Virtual machine high availability error Monitors High Availability errors on a virtual machine.
Cluster high availability error * Monitors High Availability errors on a cluster.
Health status monitoring Monitors changes in the overall health status of vCenter Servercomponents.
Pre-4.1 host connected to SIOC-enabled datastore Monitors whether a host running ESX/ESXi 4.1 or earlier isconnected to a SIOC-enabled datastore.
Host service console swap rates Monitors host service console memory swap rates.
vSphere Monitoring and Performance
VMware, Inc. 160

Monitoring Solutions with thevCenter Solutions Manager 6In the vSphere Web Client, you can view an inventory of installed solutions, view detailed informationabout the solutions, and monitor the solution health status. A solution is an extension of vCenter Serverthat adds new functions to a vCenter Server instance.
VMware products that integrate with vCenter Server are also considered solutions. For example, vSphereESX Agent Manager is a solution provided by VMware to let you manage host agents that add newcapabilities to ESX/ESXi hosts.
You can install a solution to add functionality from third-party technologies to the standard functions ofvCenter Server. Solutions typically are delivered as OVF packages. You can install and deploy solutionsfrom the vSphere Web Client. You can integrate solutions into the vCenter Solutions Manager, whichprovides a view in the vSphere Web Client that lists all solutions.
If a virtual machine or vApp is running a solution, a custom icon represents it in the inventory of thevSphere Web Client. Each solution registers a unique icon to identify that the virtual machine or vApp isbeing managed by that solution. The icons show the power states (powered on, paused, or powered off).The solutions display more than one type of icon if they manage more than one type of virtual machine orvApp.
When you power on or power off a virtual machine or vApp, you are notified that you are performing thisoperation on an entity that is managed by the Solutions Manager. When you attempt an operation on avirtual machine or a vApp that is managed by a solution, an informational warning message appears.
For more information, see the Developing and Deploying vSphere Solutions, vServices, and ESX Agentsdocumentation.
This chapter includes the following topics:
n View Solutions and vServices
n Monitoring Agents
n Monitoring vServices
View Solutions and vServicesIn the vSphere Web Client, you can view information about solutions and vService providers. A vServiceis a service that a solution provides to specific applications that run inside virtual machines and vApps.
VMware, Inc. 161

Procedure
1 Navigate to the vCenter Server system in the object navigator.
2 Double-click the vCenter Server object.
3 Click Extensions.
4 Select a solution.
The Summary tab displays more information about the solution.
5 To view vService provider information, click Monitor, and click vServices.
Monitoring AgentsThe vCenter Solutions Manager displays the vSphere ESX Agent Manager agents that you use to deployand manage related agents on ESX/ESXi hosts.
You can use the Solutions Manager to keep track of whether the agents of a solution are working asexpected. Outstanding issues are reflected by the solution's ESX Agent Manager status and a list ofissues.
When the status of a solution changes, the Solutions Manager updates the ESX Agent Managersummary status and state. Administrators use this status to track whether the goal state is reached.
The agent health status is indicated by a specific color.
Table 6-1. ESX Agent Manager health status
Status Description
Red The solution must intervene for the ESX Agent Manager toproceed. For example, if a virtual machine agent is powered offmanually on a compute resource and the ESX Agent Managerdoes not attempt to power on the agent. The ESX AgentManager reports this action to the solution, and the solutionalerts the administrator to power on the agent.
Yellow The ESX Agent Manager is actively working to reach a goalstate. The goal state can be enabled, disabled, or uninstalled.For example, when a solution is registered, its status is yellowuntil the ESX Agent Manager deploys the solutions agents to allthe specified compute resources. A solution does not need tointervene when the ESX Agent Manager reports its ESX AgentManager health status as yellow.
Green A solution and all its agents have reached the goal state.
Monitoring vServicesA vService is a service or function that a solution provides to virtual machines and vApps. A solution canprovide one or more vServices. These vServices integrate with the platform and are able to change theenvironment in which the vApp or virtual machine runs.
vSphere Monitoring and Performance
VMware, Inc. 162

A vService is a type of service for a virtual machine and a vApp provided by a vCenter extension. Virtualmachines and vApps can have dependencies on vServices. Each dependency is associated with avService type. The vService type must be bound to a particular vCenter extension that implements thatvService type. This vService type is similar to a virtual hardware device. For example, a virtual machinecan have a networking device that at deployment must be connected to a particular network.
The vService Manager allows a solution to connect to operations related to OVF templates:
n Importing OVF templates. Receive a callback when OVF templates with a vService dependency of acertain type are imported.
n Exporting OVF templates. Inserts OVF sections when a virtual machine is exported.
n OVF environment generation. Inserts OVF sections into the OVF environment at the power-oninstance.
The vServices tab in the Solution Manager provides details for each vCenter extension. This informationallows you to monitor vService providers and list the virtual machines or vApps to which they are bound.
vSphere Monitoring and Performance
VMware, Inc. 163

Monitoring the Health ofServices and Nodes 7You can monitor the health status of services and nodes to determine whether problems exist in yourenvironment.
The vSphere Web Client provides an overview of all services and nodes across the management stack ofthe vCenter Server system. A list of default services is available for each vCenter Server instance.
This chapter includes the following topics:
n View the Health Status of Services and Nodes
View the Health Status of Services and NodesIn the vSphere Web Client, you can view the health status of vCenter Server services and nodes.
vCenter Server instances and machines that run vCenter Server services are considered nodes.Graphical badges represent the health status of services and nodes.
Prerequisites
Verify that the user you use to log in to the vCenter Server instance is a member of theSystemConfiguration.Administrators group in the vCenter Single Sign-On domain.
Procedure
1 Log in as administrator@your_domain_name to the vCenter Server instance by using the vSphereWeb Client.
2 On the vSphere Web Client Home page, click System Configuration.
You can view the health status badges for the services and nodes.
Table 7-1. Health States
Badge Icon Description
Good. The health of the object is normal.
Warning. The object is experiencing someproblems.
VMware, Inc. 164

Table 7-1. Health States (continued)
Badge Icon Description
Critical. The object is either not functioning properlyor will stop functioning soon.
Unknown. No data is available for this object.
3 (Optional) In the Services Health and Nodes Health panes, click the hyperlink next to the healthbadge to view all services and nodes in this health state.
For example, in the Services Health pane, click the hyperlink of the Warning health status. In thedialog box that pops up, select a service to view more information about the service and attempt toresolve the health issues of the service.
vSphere Monitoring and Performance
VMware, Inc. 165

Performance MonitoringUtilities: resxtop and esxtop 8The resxtop and esxtop command-line utilities provide a detailed look at how ESXi uses resources inreal time. You can start either utility in one of three modes: interactive (default), batch, or replay.
The fundamental difference between resxtop and esxtop is that you can use resxtop remotely,whereas you can start esxtop only through the ESXi Shell of a local ESXi host.
This chapter includes the following topics:
n Using the esxtop Utility
n Using the resxtop Utility
n Using esxtop or resxtop in Interactive Mode
n Using Batch Mode
n Using Replay Mode
Using the esxtop UtilityYou can run the esxtop utility using the ESXi Shell to communicate with the management interface of theESXi host. You must have root user privileges.
Type the command, using the options you want:
esxtop [-h] [-v] [-b] [-s] [-a] [-c config file] [-R vm-support_dir_path] [-d delay] [-n iterations]
The esxtop utility reads its default configuration from .esxtop50rc on the ESXi system. Thisconfiguration file consists of nine lines.
The first eight lines contain lowercase and uppercase letters to specify which fields appear in which orderon the CPU, memory, storage adapter, storage device, virtual machine storage, network, interrupt, andCPU power panels. The letters correspond to the letters in the Fields or Order panels for the respectiveesxtop panel.
VMware, Inc. 166

The ninth line contains information on the other options. Most important, if you saved a configuration insecure mode, you do not get an insecure esxtop without removing the s from the seventh line ofyour .esxtop50rc file. A number specifies the delay time between updates. As in interactive mode,typing c, m, d, u, v, n, I, or p determines the panel with which esxtop starts.
Note Do not edit the .esxtop50rc file. Instead, select the fields and the order in a running esxtopprocess, make changes, and save this file using the W interactive command.
Using the resxtop UtilityThe resxtop utility is a vSphere CLI command.
Before you can use any vSphere CLI commands, you must either download and install a vSphere CLIpackage or deploy the vSphere Management Assistant (vMA) to your ESXi host or vCenter Serversystem.
Note resxtop is supported only on Linux.
After it is set up, start resxtop from the command line. For remote connections, you can connect to ahost either directly or through vCenter Server.
To launch resxtop and connect to a remote server, enter this command
resxtop --server <hostname> --username <user>
The command-line options listed in the following table are the same as for esxtop (except for the Roption) with additional connection options.
Note resxtop does not use all the options shared by other vSphere CLI commands.
Table 8-1. resxtop Command-Line Options
Option Description
[server] Name of the remote host to connect to (required). If connecting directly to the ESXi host,use the name of that host. If your connection to the ESXi host is indirect (that is, throughvCenter Server), use the name of the vCenter Server system for this option.
[vihost] If you connect indirectly (through vCenter Server), this option should contain the name ofthe ESXi host you connect to. If you connect directly to the host, this option is not used.Note that the host name needs to be the same as what appears in the vSphere WebClient.
[portnumber] Port number to connect to on the remote server. The default port is 443, and unless thisis changed on the server, this option is not needed.
[username] User name to be authenticated when connecting to the remote host. The remote serverprompts you for a password.
You can also use resxtop on a local ESXi host by omitting the server option on the command line. Thecommand defaults to localhost.
vSphere Monitoring and Performance
VMware, Inc. 167
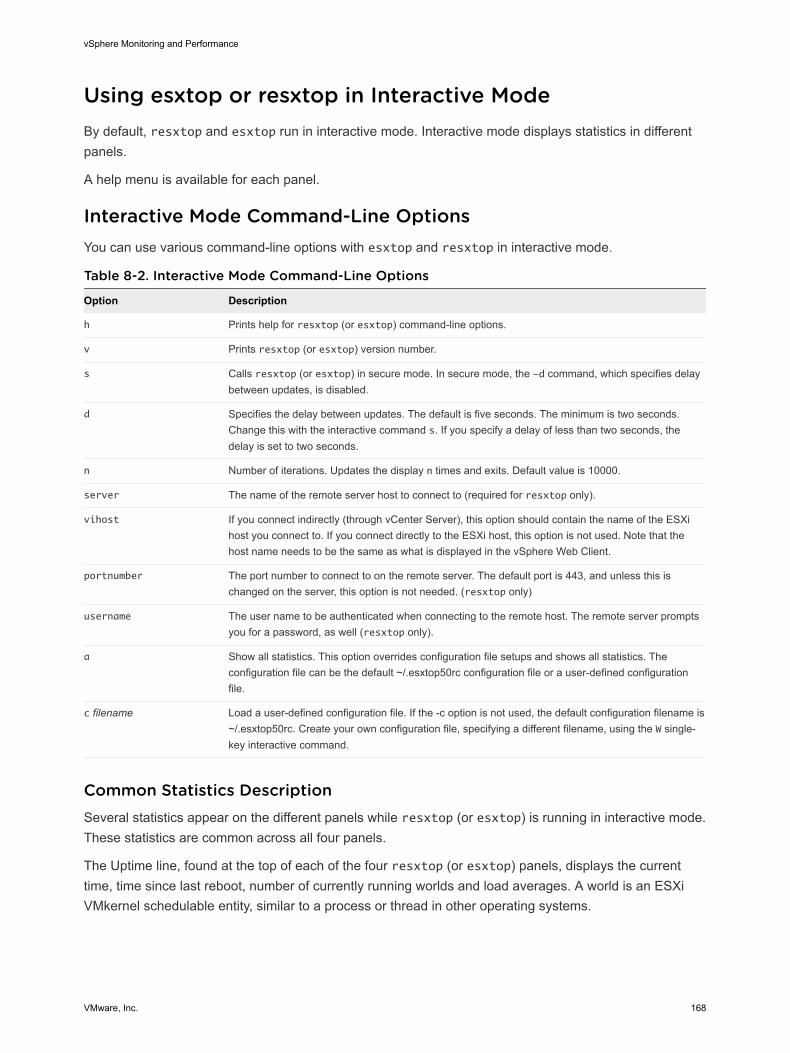
Using esxtop or resxtop in Interactive ModeBy default, resxtop and esxtop run in interactive mode. Interactive mode displays statistics in differentpanels.
A help menu is available for each panel.
Interactive Mode Command-Line OptionsYou can use various command-line options with esxtop and resxtop in interactive mode.
Table 8-2. Interactive Mode Command-Line Options
Option Description
h Prints help for resxtop (or esxtop) command-line options.
v Prints resxtop (or esxtop) version number.
s Calls resxtop (or esxtop) in secure mode. In secure mode, the -d command, which specifies delaybetween updates, is disabled.
d Specifies the delay between updates. The default is five seconds. The minimum is two seconds.Change this with the interactive command s. If you specify a delay of less than two seconds, thedelay is set to two seconds.
n Number of iterations. Updates the display n times and exits. Default value is 10000.
server The name of the remote server host to connect to (required for resxtop only).
vihost If you connect indirectly (through vCenter Server), this option should contain the name of the ESXihost you connect to. If you connect directly to the ESXi host, this option is not used. Note that thehost name needs to be the same as what is displayed in the vSphere Web Client.
portnumber The port number to connect to on the remote server. The default port is 443, and unless this ischanged on the server, this option is not needed. (resxtop only)
username The user name to be authenticated when connecting to the remote host. The remote server promptsyou for a password, as well (resxtop only).
a Show all statistics. This option overrides configuration file setups and shows all statistics. Theconfiguration file can be the default ~/.esxtop50rc configuration file or a user-defined configurationfile.
c filename Load a user-defined configuration file. If the -c option is not used, the default configuration filename is~/.esxtop50rc. Create your own configuration file, specifying a different filename, using the W single-key interactive command.
Common Statistics DescriptionSeveral statistics appear on the different panels while resxtop (or esxtop) is running in interactive mode.These statistics are common across all four panels.
The Uptime line, found at the top of each of the four resxtop (or esxtop) panels, displays the currenttime, time since last reboot, number of currently running worlds and load averages. A world is an ESXiVMkernel schedulable entity, similar to a process or thread in other operating systems.
vSphere Monitoring and Performance
VMware, Inc. 168

Below that the load averages over the past one, five, and fifteen minutes appear. Load averages considerboth running and ready-to-run worlds. A load average of 1.00 means that there is full utilization of allphysical CPUs. A load average of 2.00 means that the ESXi system might need twice as many physicalCPUs as are currently available. Similarly, a load average of 0.50 means that the physical CPUs on theESXi system are half utilized.
Statistics Columns and Order PagesYou can define the order of fields displayed in interactive mode.
If you press f, F, o, or O, the system displays a page that specifies the field order on the top line and shortdescriptions of the field contents. If the letter in the field string corresponding to a field is uppercase, thefield is displayed. An asterisk in front of the field description indicates whether a field is displayed.
The order of the fields corresponds to the order of the letters in the string.
From the Field Select panel, you can:
n Toggle the display of a field by pressing the corresponding letter.
n Move a field to the left by pressing the corresponding uppercase letter.
n Move a field to the right by pressing the corresponding lowercase letter.
Interactive Mode Single-Key CommandsWhen running in interactive mode, resxtop (or esxtop) recognizes several single-key commands.
All interactive mode panels recognize the commands listed in the following table. The command tospecify the delay between updates is disabled if the s option is given on the command line. All sortinginteractive commands sort in descending order.
Table 8-3. Interactive Mode Single-Key Commands
Key Description
h or? Displays a help menu for the current panel, giving a brief summary of commands, and the status of secure mode.
space Immediately updates the current panel.
^L Erases and redraws the current panel.
f or F Displays a panel for adding or removing statistics columns (text boxes) to or from the current panel.
o or O Displays a panel for changing the order of statistics columns on the current panel.
# Prompts you for the number of statistics rows to display. Any value greater than 0 overrides automatic determination ofthe number of rows to show, which is based on window size measurement. If you change this number in one resxtop(or esxtop) panel, the change affects all four panels.
s Prompts you for the delay between updates, in seconds. Fractional values are recognized down to microseconds. Thedefault value is five seconds. The minimum value is two seconds. This command is not available in secure mode.
W Write the current setup to an esxtop (or resxtop) configuration file. This is the recommended way to write a configurationfile. The default filename is the one specified by -c option, or ~/.esxtop50rc if the -c option is not used. You can alsospecify a different filename on the prompt generated by this W command.
q Quit the interactive mode.
c Switch to the CPU resource utilization panel.
vSphere Monitoring and Performance
VMware, Inc. 169

Table 8-3. Interactive Mode Single-Key Commands (continued)
Key Description
p Switch to the CPU Power utilization panel.
m Switch to the memory resource utilization panel.
d Switch to the storage (disk) adapter resource utilization panel.
u Switch to storage (disk) device resource utilization screen.
v Switch to storage (disk) virtual machine resource utilization screen.
n Switch to the network resource utilization panel.
i Switch to the interrupt panel.
CPU PanelThe CPU panel displays server-wide statistics as well as statistics for the individual world, resource pool,and virtual machine CPU utilization.
Resource pools, virtual machines that are running, or other worlds are at times called groups. For worldsbelonging to a virtual machine, statistics for the virtual machine that is running are displayed. All otherworlds are logically aggregated into the resource pools that contain them.
Table 8-4. CPU Panel Statistics
Line Description
PCPU USED(%) A PCPU refers to a physical hardware execution context. It can be a physical CPU core if thehyperthreading is unavailable or disabled, or a logical CPU (LCPU or SMT thread) if the hyperthreading isenabled.
PCPU USED(%) displays the following percentages:
n percentage of CPU usage per PCPU
n percentage of CPU usage averaged over all PCPUs
CPU Usage (%USED) is the percentage of PCPU nominal frequency that was used since the last screenupdate. It equals the total sum of %USED for Worlds that ran on this PCPU.
Note If a PCPU is running at frequency that is higher than its nominal (rated) frequency, then PCPUUSED(%) can be greater than 100%.
If a PCPU and its partner are busy when hyperthreading is enabled, each PCPU account for half of theCPU usage.
PCPU UTIL(%) A PCPU refers to a physical hardware execution context. It can be a physical CPU core if thehyperthreading is unavailable or disabled, or a logical CPU (LCPU or SMT thread) if the hyperthreading isenabled.
PCPU UTIL(%) represents the percentage of real time that the PCPU was not idle (raw PCPU utilization).It displays the percentage CPU utilization per PCPU, and the percentage CPU utilization averaged over allPCPUs.
Note PCPU UTIL(%) might differ from PCPU USED(%) due to power management technologies orhyperthreading.
ID Resource pool ID or virtual machine ID of the resource pool or virtual machine of the world that is running.Alternatively, the world ID of the world that is running.
GID Resource pool ID of the resource pool or virtual machine of the world that is running.
vSphere Monitoring and Performance
VMware, Inc. 170

Table 8-4. CPU Panel Statistics (continued)
Line Description
NAME Name of the resource pool or virtual machine of the world that is running, or name of the world that isrunning.
NWLD Number of members in the resource pool or virtual machine of the world that is running. If a Group isexpanded using the interactive command e, then NWLD for all the resulting worlds is 1.
%STATE TIMES Set of CPU statistics made up of the following percentages. For a world, the percentages are a percentageof one physical CPU core.
%USED Percentage of physical CPU core cycles used by the resource pool, virtual machine, or world. %USEDmight depend on the frequency with which the CPU core is running. When running with lower CPU corefrequency, %USED can be smaller than %RUN. On CPUs which support the turbo mode, CPU frequencycan also be higher than the nominal (rated) frequency, and %USED can be larger than %RUN.
%USED = %RUN + %SYS - %OVRLP
%SYS Percentage of time spent in the ESXi VMkernel on behalf of the resource pool, virtual machine, or world toprocess interrupts and to perform other system activities. This time is part of the time used to calculate%USED.
%USED = %RUN + %SYS - %OVRLP
%WAIT Percentage of time the resource pool, virtual machine, or world spent in the blocked or busy wait state.This percentage includes the percentage of time the resource pool, virtual machine, or world was idle.
100% = %RUN + %RDY + %CSTP + %WAIT
%VMWAIT The total percentage of time the Resource Pool/World spent in a blocked state waiting for events.
%IDLE Percentage of time the resource pool, virtual machine, or world was idle. Subtract this percentage from%WAIT to see the percentage of time the resource pool, virtual machine, or world was waiting for someevent. The difference, %WAIT- %IDLE, of the VCPU worlds can be used to estimate guest I/O wait time.To find the VCPU worlds, use the single-key command e to expand a virtual machine and search for theworld NAME starting with "vcpu". (The VCPU worlds might wait for other events in addition to I/O events,so this measurement is only an estimate.)
%RDY Percentage of time the resource pool, virtual machine, or world was ready to run, but was not providedCPU resources on which to execute.
100% = %RUN + %RDY + %CSTP + %WAIT
%MLMTD (maxlimited)
Percentage of time the ESXi VMkernel deliberately did not run the resource pool, virtual machine, or worldbecause doing so would violate the resource pool, virtual machine, or world's limit setting. Because theresource pool, virtual machine, or world is ready to run when it is prevented from running in this way, the%MLMTD (max limited) time is included in %RDY time.
%SWPWT Percentage of time a resource pool or world spends waiting for the ESXi VMkernel to swap memory. The%SWPWT (swap wait) time is included in the %WAIT time.
EVENT COUNTS/s Set of CPU statistics made up of per second event rates. These statistics are for VMware internal use only.
CPU ALLOC Set of CPU statistics made up of the following CPU allocation configuration parameters.
AMIN Resource pool, virtual machine, or world attribute Reservation.
AMAX Resource pool, virtual machine, or world attribute Limit. A value of -1 means unlimited.
ASHRS Resource pool, virtual machine, or world attribute Shares.
SUMMARY STATS Set of CPU statistics made up of the following CPU configuration parameters and statistics. Thesestatistics apply only to worlds and not to virtual machines or resource pools.
AFFINITY BIT MASK Bit mask showing the current scheduling affinity for the world.
vSphere Monitoring and Performance
VMware, Inc. 171
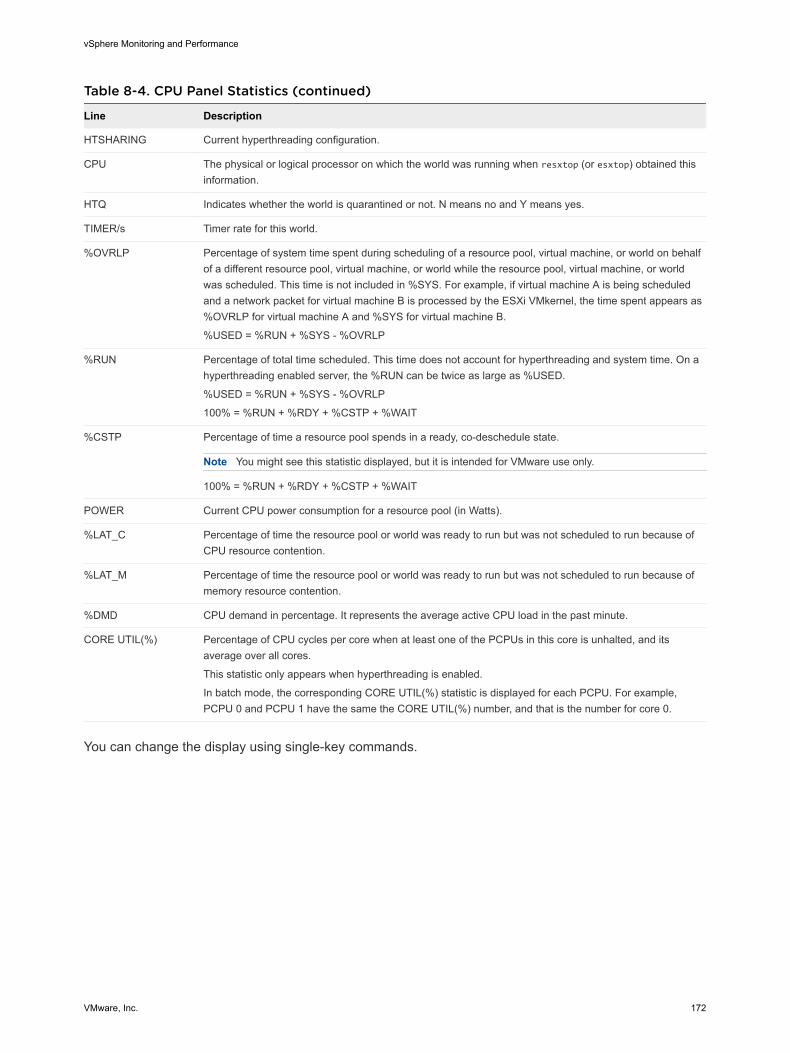
Table 8-4. CPU Panel Statistics (continued)
Line Description
HTSHARING Current hyperthreading configuration.
CPU The physical or logical processor on which the world was running when resxtop (or esxtop) obtained thisinformation.
HTQ Indicates whether the world is quarantined or not. N means no and Y means yes.
TIMER/s Timer rate for this world.
%OVRLP Percentage of system time spent during scheduling of a resource pool, virtual machine, or world on behalfof a different resource pool, virtual machine, or world while the resource pool, virtual machine, or worldwas scheduled. This time is not included in %SYS. For example, if virtual machine A is being scheduledand a network packet for virtual machine B is processed by the ESXi VMkernel, the time spent appears as%OVRLP for virtual machine A and %SYS for virtual machine B.
%USED = %RUN + %SYS - %OVRLP
%RUN Percentage of total time scheduled. This time does not account for hyperthreading and system time. On ahyperthreading enabled server, the %RUN can be twice as large as %USED.
%USED = %RUN + %SYS - %OVRLP
100% = %RUN + %RDY + %CSTP + %WAIT
%CSTP Percentage of time a resource pool spends in a ready, co-deschedule state.
Note You might see this statistic displayed, but it is intended for VMware use only.
100% = %RUN + %RDY + %CSTP + %WAIT
POWER Current CPU power consumption for a resource pool (in Watts).
%LAT_C Percentage of time the resource pool or world was ready to run but was not scheduled to run because ofCPU resource contention.
%LAT_M Percentage of time the resource pool or world was ready to run but was not scheduled to run because ofmemory resource contention.
%DMD CPU demand in percentage. It represents the average active CPU load in the past minute.
CORE UTIL(%) Percentage of CPU cycles per core when at least one of the PCPUs in this core is unhalted, and itsaverage over all cores.
This statistic only appears when hyperthreading is enabled.
In batch mode, the corresponding CORE UTIL(%) statistic is displayed for each PCPU. For example,PCPU 0 and PCPU 1 have the same the CORE UTIL(%) number, and that is the number for core 0.
You can change the display using single-key commands.
vSphere Monitoring and Performance
VMware, Inc. 172

Table 8-5. CPU Panel Single-Key Commands
Command Description
e Toggles whether CPU statistics are displayed expanded or unexpanded.
The expanded display includes CPU resource utilization statistics broken down by individual worlds belongingto a resource pool or virtual machine. All percentages for the individual worlds are percentage of a singlephysical CPU.
Consider these examples:
n If the %Used by a resource pool is 30% on a two-way server, the resource pool is utilizing 30 percent ofone physical core.
n If the %Used by a world belonging to a resource pool is 30 percent on a two-way server, that world isutilizing 30% of one physical core.
U Sorts resource pools, virtual machines, and worlds by the resource pool’s or virtual machine’s %Used column.This is the default sort order.
R Sorts resource pools, virtual machines, and worlds by the resource pool’s or virtual machine’s %RDY column.
N Sorts resource pools, virtual machines, and worlds by the GID column.
V Displays virtual machine instances only.
L Changes the displayed length of the NAME column.
CPU Power PanelThe CPU Power panel displays CPU Power utilization statistics.
On the CPU Power panel, statistics are arranged per physical CPU. A physical CPU is a physicalhardware execution context. It is the physical CPU core when hyper-threading is unavailable or disabled,or a logical CPU (LCPU or SMT thread) when hyper-threading is enabled.
Table 8-6. CPU Power Panel Statistics
Line Description
Power Usage Current total power usage (in Watts).
Power Cap Total power cap (in Watts).
PSTATE MHZ Clock frequency per state.
%USED Percentage of physical CPU nominal frequency used since the last screen update. It is the same asPCPU USED(%) shown in the CPU Screen.
%UTIL Raw physical CPU utilization is the percentage of time that physical CPU was not idle. It is the same asPCPU UTIL(%) shown in the CPU Screen.
%Cx Percentage of time the physical CPU spent in C-State 'x'.
%Px Percentage of time the physical CPU spent in P-State 'x'. On systems with Processor Clocking Control,P-states are not directly visible to ESXi. The esxtop shows the percentage of time spent at full speedunder the heading 'P0' and the percentage of time spent at any lower speed under 'P1'.
%Tx Percentage of time the physical CPU spent in T-State 'x'.
%A/MPERF aperf and mperf are two hardware registers used to keep track of the actual frequency and nominalfrequency of the processor. Displays the real-time aperf to mperf ratio in the last esxtop update period.
%A/MPERF *nominal frequency of the processor = current frequency of the processor
vSphere Monitoring and Performance
VMware, Inc. 173

Memory PanelThe Memory panel displays server-wide and group memory utilization statistics. As on the CPU panel,groups correspond to resource pools, running virtual machines, or other worlds that are consumingmemory.
The first line, found at the top of the Memory panel displays the current time, time since last reboot,number of currently running worlds, and memory overcommitment averages. The memoryovercommitment averages over the past one, five, and fifteen minutes appear. Memory overcommitmentof 1.00 means a memory overcommitment of 100 percent.
Table 8-7. Memory Panel Statistics
Field Description
PMEM (MB) Displays the machine memory statistics for the server. All numbers are in megabytes.
total Total amount of the machine memory in the server.
vmk Amount of the machine memory being used by the ESXi VMkernel.
other Amount of the machine memory being used by everything other thanthe ESXi VMkernel.
free Amount of the machine memory that is free.
VMKMEM (MB) Displays the machine memory statistics for the ESXi VMkernel. All numbers are in megabytes.
managed Total amount of the machine memory managed by the ESXiVMkernel.
min free Minimum amount of the machine memory that the ESXi VMkernelaims to keep free.
rsvd Total amount of the machine memory currently reserved by resourcepools.
ursvd Total amount of the machine memory currently unreserved.
state Current machine memory availability state. Possible values are high,soft, hard and low. High means that the machine memory is not underany pressure and low means that it is.
NUMA (MB) Displays the ESXi NUMA statistics. This line appears only if the ESXi host is running on a NUMAserver. All numbers are in megabytes.
For each NUMA node in the server, two statistics are displayed:
n The total amount of machine memory in the NUMA node that is managed by ESXi.
n The amount of machine memory in the node that is currently free (in parentheses).
Shared memory for the ESXi host might be larger than the total amount of memory if memory isover-committed.
vSphere Monitoring and Performance
VMware, Inc. 174

Table 8-7. Memory Panel Statistics (continued)
Field Description
PSHARE (MB) Displays the ESXi page-sharing statistics. All numbers are in megabytes.
shared Amount of the physical memory that is being shared.
common Amount of the machine memory that is common across worlds.
saving Amount of the machine memory that is saved because of pagesharing.
shared = common + saving
SWAP (MB) Displays the ESXi swap usage statistics. All numbers are in megabytes.
curr Current swap usage.
rclmtgt Where the ESXi system expects the reclaimed memory to be.Memory can be reclaimed by swapping or compression.
r/s Rate at which the memory is swapped in by the ESXi system fromdisk.
w/s Rate at which the memory is swapped to disk by the ESXi system.
ZIP (MB) Displays the ESXi memory compression statistics. All numbers are in megabytes.
zipped Total compressed physical memory.
saved Saved memory by compression.
MEMCTL (MB) Displays the memory balloon statistics. All numbers are in megabytes.
curr Total amount of the physical memory reclaimed using the vmmemctlmodule.
target Total amount of physical memory the ESXi host attempts to reclaimusing the vmmemctl module.
max Maximum amount of the physical memory the ESXi host can reclaimusing the vmmemctl module.
AMIN Memory reservation for this resource pool or virtual machine.
AMAX Memory limit for this resource pool or virtual machine. A value of -1 means Unlimited.
ASHRS Memory shares for this resource pool or virtual machine.
NHN Current home node for the resource pool or virtual machine. This statistic is applicable only onNUMA systems. If the virtual machine has no home node, a dash (-) appears.
NRMEM (MB) Current amount of remote memory allocated to the virtual machine or resource pool. This statistic isapplicable only on NUMA systems.
N% L Current percentage of memory allocated to the virtual machine or resource pool that is local.
MEMSZ (MB) Amount of physical memory allocated to a resource pool or virtual machine. The values are thesame for the VMM and VMX groups.
MEMSZ = GRANT + MCTLSZ + SWCUR + "never touched"
vSphere Monitoring and Performance
VMware, Inc. 175

Table 8-7. Memory Panel Statistics (continued)
Field Description
GRANT (MB) Amount of guest physical memory mapped to a resource pool or virtual machine. The consumedhost machine memory is equal to GRANT - SHRDSVD. The values are the same for the VMM andVMX groups.
CNSM Amount of the memory currently consumed by the virtual machine. The memory currentlyconsumed by the virtual machine is equal to the amount of memory that the VM guest operatingsystem currently uses, excluding the amount of memory saved for sharing if memory sharing isenabled on the VM, excluding the amount of memory saved if some of the VM memory iscompressed. For more information on memory sharing and memory compression, see the vSphereResource Management documentation.
SZTGT (MB) Amount of machine memory the ESXi VMkernel wants to allocate to a resource pool or virtualmachine. The values are the same for the VMM and VMX groups.
TCHD (MB) Working set estimate for the resource pool or virtual machine. The values are the same for theVMM and VMX groups.
%ACTV Percentage of guest physical memory that is being referenced by the guest. This is aninstantaneous value.
%ACTVS Percentage of guest physical memory that is being referenced by the guest. This is a slow movingaverage.
%ACTVF Percentage of guest physical memory that is being referenced by the guest. This is a fast movingaverage.
%ACTVN Percentage of guest physical memory that is being referenced by the guest. This is an estimation.(You might see this statistic displayed, but it is intended for VMware use only.)
MCTL? Memory balloon driver is installed or not. N means no, Y means yes.
MCTLSZ (MB) Amount of physical memory reclaimed from the resource pool by way of ballooning.
MCTLTGT (MB) Amount of physical memory the ESXi system attempts to reclaim from the resource pool or virtualmachine by way of ballooning.
MCTLMAX (MB) Maximum amount of physical memory the ESXi system can reclaim from the resource pool orvirtual machine by way of ballooning. This maximum depends on the guest operating system type.
SWCUR (MB) Current swap usage by this resource pool or virtual machine.
SWTGT (MB) Target where the ESXi host expects the swap usage by the resource pool or virtual machine to be.
SWR/s (MB) Rate at which the ESXi host swaps in memory from disk for the resource pool or virtual machine.
SWW/s (MB) Rate at which the ESXi host swaps resource pool or virtual machine memory to disk.
LLSWR/s (MB) Rate at which memory is read from the host cache. The reads and writes are attributed to the VMMgroup only, LLSWAP statistics are not displayed for the VM group.
LLSWW/s (MB) Rate at which memory is written to the host cache from various sources. The reads and writes areattributed to the VMM group only, LLSWAP statistics are not displayed for the VM group.
CPTRD (MB) Amount of data read from checkpoint file.
CPTTGT (MB) Size of checkpoint file.
ZERO (MB) Resource pool or virtual machine physical pages that are zeroed.
SHRD (MB) Resource pool or virtual machine physical pages that are shared.
SHRDSVD (MB) Machine pages that are saved because of resource pool or virtual machine shared pages.
vSphere Monitoring and Performance
VMware, Inc. 176

Table 8-7. Memory Panel Statistics (continued)
Field Description
OVHD (MB) Current space overhead for resource pool.
OVHDMAX (MB) Maximum space overhead that might be incurred by resource pool or virtual machine.
OVHDUW (MB) Current space overhead for a user world. (You might see this statistic displayed, but it is intendedfor VMware use only.)
GST_NDx (MB) Guest memory allocated for a resource pool on NUMA node x. This statistic is applicable on NUMAsystems only.
OVD_NDx (MB) VMM overhead memory allocated for a resource pool on NUMA node x. This statistic is applicableon NUMA systems only.
TCHD_W (MB) Write working set estimate for resource pool.
CACHESZ (MB) Compression memory cache size.
CACHEUSD (MB) Used compression memory cache.
ZIP/s (MB/s) Compressed memory per second.
UNZIP/s (MB/s) Decompressed memory per second.
Table 8-8. Memory Panel Interactive Commands
Command Description
M Sort resource pools or virtual machines by MEMSZ column. This is the default sort order.
B Sort resource pools or virtual machines by Group Memctl column.
N Sort resource pools or virtual machines by GID column.
V Display virtual machine instances only.
L Changes the displayed length of the NAME column.
Storage Adapter PanelStatistics in the Storage Adapter panel are aggregated per storage adapter by default. Statistics can alsobe viewed per storage path.
Table 8-9. Storage Adapter Panel Statistics
Column Description
ADAPTR Name of the storage adapter.
PATH Storage path name. This name is only visible if the corresponding adapter is expanded. See interactivecommand e in Table 8-10. Storage Adapter Panel Interactive Commands.
NPTH Number of paths.
AQLEN Current queue depth of the storage adapter.
CMDS/s Number of commands issued per second.
READS/s Number of read commands issued per second.
WRITES/s Number of write commands issued per second.
MBREAD/s Megabytes read per second.
vSphere Monitoring and Performance
VMware, Inc. 177

Table 8-9. Storage Adapter Panel Statistics (continued)
Column Description
MBWRTN/s Megabytes written per second.
RESV/s Number of SCSI reservations per second.
CONS/s Number of SCSI reservation conflicts per second.
DAVG/cmd Average device latency per command, in milliseconds.
KAVG/cmd Average ESXi VMkernel latency per command, in milliseconds.
GAVG/cmd Average virtual machine operating system latency per command, in milliseconds.
QAVG/cmd Average queue latency per command, in milliseconds.
DAVG/rd Average device read latency per read operation, in milliseconds.
KAVG/rd Average ESXi VMkernel read latency per read operation, in milliseconds.
GAVG/rd Average guest operating system read latency per read operation, in milliseconds.
QAVG/rd Average queue latency per read operation, in milliseconds.
DAVG/wr Average device write latency per write operation, in milliseconds.
KAVG/wr Average ESXi VMkernel write latency per write operation, in milliseconds.
GAVG/wr Average guest operating system write latency per write operation, in milliseconds.
QAVG/wr Average queue latency per write operation, in milliseconds.
FCMDS/s Number of failed commands issued per second.
FREAD/s Number of failed read commands issued per second.
FWRITE/s Number of failed write commands issued per second.
FMBRD/s Megabytes of failed read operations per second.
FMBWR/s Megabytes of failed write operations per second.
FRESV/s Number of failed SCSI reservations per second.
ABRTS/s Number of commands aborted per second.
RESETS/s Number of commands reset per second.
PAECMD/s The number of PAE (Physical Address Extension) commands per second.
PAECP/s The number of PAE copies per second.
SPLTCMD/s The number of split commands per second.
SPLTCP/s The number of split copies per second.
The following table displays the interactive commands you can use with the storage adapter panel.
Table 8-10. Storage Adapter Panel Interactive Commands
Command Description
e Toggles whether storage adapter statistics appear expanded or unexpanded. Allows you to view storageresource utilization statistics broken down by individual paths belonging to an expanded storage adapter. Youare prompted for the adapter name.
r Sorts by READS/s column.
vSphere Monitoring and Performance
VMware, Inc. 178

Table 8-10. Storage Adapter Panel Interactive Commands (continued)
Command Description
w Sorts by WRITES/s column.
R Sorts by MBREAD/s read column.
T Sorts by MBWRTN/s written column.
N Sorts first by ADAPTR column, then by PATH column. This is the default sort order.
Storage Device PanelThe storage device panel displays server-wide storage utilization statistics.
By default, the information is grouped per storage device. You can also group the statistics per path, perworld, or per partition.
Table 8-11. Storage Device Panel Statistics
Column Description
DEVICE Name of the storage device.
PATH Path name. This name is visible only if the corresponding device is expanded to paths. See the interactivecommand p in Table 8-12. Storage Device Panel Interactive Commands.
WORLD World ID. This ID is visible only if the corresponding device is expanded to worlds. See the interactivecommand e in Table 8-12. Storage Device Panel Interactive Commands. The world statistics are per worldper device.
PARTITION Partition ID. This ID is visible only if the corresponding device is expanded to partitions. See interactivecommand t in Table 8-12. Storage Device Panel Interactive Commands.
NPH Number of paths.
NWD Number of worlds.
NPN Number of partitions.
SHARES Number of shares. This statistic is applicable only to worlds.
BLKSZ Block size in bytes.
NUMBLKS Number of blocks of the device.
DQLEN Current device queue depth of the storage device.
WQLEN World queue depth. This is the maximum number of ESXi VMkernel active commands that the world isallowed to have. This is a per device maximum for the world. It is valid only if the corresponding device isexpanded to worlds.
ACTV Number of commands in the ESXi VMkernel that are currently active. This statistic applies to only worlds anddevices.
QUED Number of commands in the ESXi VMkernel that are currently queued. This statistic applies to only worldsand devices.
%USD Percentage of the queue depth used by ESXi VMkernel active commands. This statistic applies to onlyworlds and devices.
LOAD Ratio of ESXi VMkernel active commands plus ESXi VMkernel queued commands to queue depth. Thisstatistic applies to only worlds and devices.
vSphere Monitoring and Performance
VMware, Inc. 179

Table 8-11. Storage Device Panel Statistics (continued)
Column Description
CMDS/s Number of commands issued per second.
READS/s Number of read commands issued per second.
WRITES/s Number of write commands issued per second.
MBREAD/s Megabytes read per second.
MBWRTN/s Megabytes written per second.
DAVG/cmd Average device latency per command in milliseconds.
KAVG/cmd Average ESXi VMkernel latency per command in milliseconds.
GAVG/cmd Average guest operating system latency per command in milliseconds.
QAVG/cmd Average queue latency per command in milliseconds.
DAVG/rd Average device read latency per read operation in milliseconds.
KAVG/rd Average ESXi VMkernel read latency per read operation in milliseconds.
GAVG/rd Average guest operating system read latency per read operation in milliseconds.
QAVG/rd Average queue read latency per read operation in milliseconds.
DAVG/wr Average device write latency per write operation in milliseconds.
KAVG/wr Average ESXi VMkernel write latency per write operation in milliseconds.
GAVG/wr Average guest operating system write latency per write operation in milliseconds.
QAVG/wr Average queue write latency per write operation in milliseconds.
ABRTS/s Number of commands aborted per second.
RESETS/s Number of commands reset per second.
PAECMD/s Number of PAE commands per second. This statistic applies to only paths.
PAECP/s Number of PAE copies per second. This statistic applies to only paths.
SPLTCMD/s Number of split commands per second. This statistic applies to only paths.
SPLTCP/s Number of split copies per second. This statistic applies to only paths.
The following table displays the interactive commands you can use with the storage device panel.
Table 8-12. Storage Device Panel Interactive Commands
Command Description
e Expand or roll up storage world statistics. This command allows you to view storage resource utilizationstatistics separated by individual worlds belonging to an expanded storage device. You are prompted for thedevice name. The statistics are per world per device.
P Expand or roll up storage path statistics. This command allows you to view storage resource utilizationstatistics separated by individual paths belonging to an expanded storage device. You are prompted for thedevice name.
t Expand or roll up storage partition statistics. This command allows you to view storage resource utilizationstatistics separated by individual partitions belonging to an expanded storage device. You are prompted for thedevice name.
vSphere Monitoring and Performance
VMware, Inc. 180

Table 8-12. Storage Device Panel Interactive Commands (continued)
Command Description
r Sort by READS/s column.
w Sort by WRITES/s column.
R Sort by MBREAD/s column.
T Sort by MBWRTN column.
N Sort first by DEVICE column, then by PATH, WORLD, and PARTITION column. This is the default sort order.
L Changes the displayed length of the DEVICE column.
Virtual Machine Storage PanelThis panel displays virtual machine-centric storage statistics.
By default, statistics are aggregated on a per-resource-pool basis. One virtual machine has onecorresponding resource pool, so the panel displays statistics on a per-virtual-machine basis. You can alsoview the statistics on per-VSCSI-device basis.
Table 8-13. Virtual Machine Storage Panel Statistics
Column Description
ID Resource pool ID or VSCSI ID of VSCSI device.
GID Resource pool ID.
VMNAME Name of the resource pool.
VSCSINAME Name of the VSCSI device.
NDK Number of VSCSI devices
CMDS/s Number of commands issued per second.
READS/s Number of read commands issued per second.
WRITES/s Number of write commands issued per second.
MBREAD/s Megabytes read per second.
MBWRTN/s Megabytes written per second.
LAT/rd Average latency (in milliseconds) per read.
LAT/wr Average latency (in milliseconds) per write.
The following table lists the interactive commands you can use with the virtual machine storage panel.
Table 8-14. Virtual Machine Storage Panel Interactive Commands
Command Description
e Expand or roll up storage VSCSI statistics. Allows you to view storage resource utilization statisticsbroken down by individual VSCSI devices belonging to a group. You are prompted to enter the group ID.The statistics are per VSCSI device.
r Sort by READS/s column.
w Sort by WRITES/s column.
vSphere Monitoring and Performance
VMware, Inc. 181

Table 8-14. Virtual Machine Storage Panel Interactive Commands (continued)
Command Description
R Sort by MBREAD/s column.
T Sort by MBWRTN/s column.
N Sort first by VMNAME column, and then by VSCSINAME column. It is the default sort order.
Network PanelThe Network panel displays server-wide network utilization statistics.
Statistics are arranged by port for each virtual network device configured. For physical network adapterstatistics, see the row in the table that corresponds to the port to which the physical network adapter isconnected. For statistics on a virtual network adapter configured in a particular virtual machine, see therow corresponding to the port to which the virtual network adapter is connected.
Table 8-15. Network Panel Statistics
Column Description
PORT-ID Virtual network device port ID.
UPLINK Y means that the corresponding port is an uplink. N means it is not.
UP Y means that the corresponding link is up. N means it is not.
SPEED Link speed in Megabits per second.
FDUPLX Y means the corresponding link is operating at full duplex. N means it is not.
USED-BY Virtual network device port user.
DTYP Virtual network device type. H means HUB and S means switch.
DNAME Virtual network device name.
PKTTX/s Number of packets transmitted per second.
PKTRX/s Number of packets received per second.
MbTX/s MegaBits transmitted per second.
MbRX/s MegaBits received per second.
%DRPTX Percentage of transmit packets dropped.
%DRPRX Percentage of receive packets dropped.
TEAM-PNIC Name of the physical NIC used for the team uplink.
PKTTXMUL/s Number of multicast packets transmitted per second.
PKTRXMUL/s Number of multicast packets received per second.
PKTTXBRD/s Number of broadcast packets transmitted per second.
PKTRXBRD/s Number of broadcast packets received per second.
The following table displays the interactive commands you can use with the network panel.
vSphere Monitoring and Performance
VMware, Inc. 182

Table 8-16. Network Panel Interactive Commands
Command Description
T Sorts by Mb Tx column.
R Sorts by Mb Rx column.
t Sorts by Packets Tx column.
r Sorts by Packets Rx column.
N Sorts by PORT-ID column. This is the default sort order.
L Changes the displayed length of the DNAME column.
Interrupt PanelThe interrupt panel displays information about the use of interrupt vectors.
Table 8-17. Interrupt Panel Statistics
Column Description
VECTOR Interrupt vector ID.
COUNT/s Total number of interrupts per second. This value is cumulative of the count for every CPU.
COUNT_x Interrupts per second on CPU x.
TIME/int Average processing time per interrupt (in microseconds).
TIME_x Average processing time per interrupt on CPU x (in microseconds).
DEVICES Devices that use the interrupt vector. If the interrupt vector is not enabled for the device, its name is enclosedin angle brackets (< and >).
Using Batch ModeBatch mode allows you to collect and save resource utilization statistics in a file.
After you prepare for batch mode, you can use esxtop or resxtop in this mode.
Prepare for Batch ModeTo run in batch mode, you must first prepare for batch mode.
Procedure
1 Run resxtop (or esxtop) in interactive mode.
2 In each of the panels, select the columns you want.
3 Save this configuration to a file (by default ~/.esxtop50rc) using the W interactive command.
You can now use resxtop (or esxtop) in batch mode.
Use esxtop or resxtop in Batch ModeAfter you have prepared for batch mode, you can use esxtop or resxtop in this mode.
vSphere Monitoring and Performance
VMware, Inc. 183

Procedure
1 Start resxtop (or esxtop) to redirect the output to a file.
For example:
esxtop -b > my_file.csv
The filename must have a .csv extension. The utility does not enforce this, but the post-processingtools require it.
2 Process statistics collected in batch mode using tools such as Microsoft Excel and Perfmon.
In batch mode, resxtop (or esxtop) does not accept interactive commands. In batch mode, the utilityruns until it produces the number of iterations requested (see command-line option n, below, for moredetails), or until you end the process by pressing Ctrl+c.
Batch Mode Command-Line OptionsYou can use batch mode with command-line options.
Table 8-18. Command-Line Options in Batch Mode
Option Description
a Show all statistics. This option overrides configuration file setups and shows all statistics. Theconfiguration file can be the default ~/.esxtop50rc configuration file or a user-defined configuration file.
b Runs resxtop (or esxtop) in batch mode.
c filename Load a user-defined configuration file. If the -c option is not used, the default configuration filename is~/.esxtop41rc. Create your own configuration file, specifying a different filename, using the W single-keyinteractive command.
d Specifies the delay between statistics snapshots. The default is five seconds. The minimum is twoseconds. If a delay of less than two seconds is specified, the delay is set to two seconds.
n Number of iterations. resxtop (or esxtop) collects and saves statistics this number of times, and thenexits.
server The name of the remote server host to connect to (required, resxtop only).
vihost If you connect indirectly (through vCenter Server), this option should contain the name of the ESXi hostyou connect to. If you connect directly to the ESXi host, this option is not used.
Note The host name needs to be the same as what appears in the vSphere Web Client.
portnumber The port number to connect to on the remote server. The default port is 443, and unless this is changedon the server, this option is not needed. (resxtop only)
username The user name to be authenticated when connecting to the remote host. You are prompted by the remoteserver for a password, as well (resxtop only).
Using Replay ModeIn replay mode, esxtop replays resource utilization statistics collected using vm-support.
After you prepare for replay mode, you can use esxtop in this mode. See the vm-support man page.
vSphere Monitoring and Performance
VMware, Inc. 184

In replay mode, esxtop accepts the same set of interactive commands as in interactive mode and runsuntil no more snapshots are collected by vm-support to be read or until the requested number ofiterations are completed.
Prepare for Replay ModeTo run in replay mode, you must prepare for replay mode.
Procedure
1 Run vm-support in snapshot mode in the ESXi Shell.
Use the following command.
vm-support -S -d duration -I interval
2 Unzip and untar the resulting tar file so that esxtop can use it in replay mode.
You can now use esxtop in replay mode.
Use esxtop in Replay ModeYou can use esxtop in replay mode.
Replay mode can be run to produce output in the same style as batch mode (see the command-lineoption b, below).
Note Batch output from esxtop cannot be played back by resxtop.
Snapshots collected by vm-supported can be replayed by esxtop. However, vm-support outputgenerated by ESXi can be replayed only by esxtop running on the same version of ESXi.
Procedure
u To activate replay mode, enter the following at the command-line prompt.
esxtop -R vm-support_dir_path
Replay Mode Command-Line OptionsYou can use replay mode with command-line options.
The following table lists the command-line options available for esxtop replay mode.
Table 8-19. Command-Line Options in Replay Mode
Option Description
R Path to the vm-support collected snapshot’s directory.
a Show all statistics. This option overrides configuration file setups and shows all statistics. Theconfiguration file can be the default ~/.esxtop50rc configuration file or a user-defined configurationfile.
b Runs esxtop in Batch mode.
vSphere Monitoring and Performance
VMware, Inc. 185

Table 8-19. Command-Line Options in Replay Mode (continued)
Option Description
c filename Load a user-defined configuration file. If the -c option is not used, the default configuration filename is~/.esxtop50rc. Create your own configuration file and specify a different filename using the W single-key interactive command.
d Specifies the delay between panel updates. The default is five seconds. The minimum is two seconds.If a delay of less than two seconds is specified, the delay is set to two seconds.
n Number of iterations esxtop updates the display this number of times and then exits.
vSphere Monitoring and Performance
VMware, Inc. 186

Using the vimtop Plug-In toMonitor the Resource Use ofServices 9You can use the vimtop utility plug-in to monitor vSphere services that run in the vCenter ServerAppliance.
vimtop is a tool similar to esxtop, which runs in the environment of the vCenter Server Appliance. Byusing the text-based interface of vimtop in the appliance shell, you can view overall information about thevCenter Server Appliance, and a list of vSphere services and their resource use.
This chapter includes the following topics:
n Monitor Services By Using vimtop in Interactive Mode
n Interactive Mode Command-Line Options
n Interactive Mode Single-Key Commands for vimtop
Monitor Services By Using vimtop in Interactive ModeYou can use the vimtop plug-in to monitor services in real time.
The default view of the vimtop interactive mode consists of the overview tables and the main table. Youcan use single-key commands in interactive mode to switch the view from processes to disks or network.
Procedure
1 From an SSH client application, log in to the vCenter Server Appliance shell.
2 Run the vimtop command to access the plug-in in interactive mode.
Interactive Mode Command-Line OptionsYou can use various command-line options when you run the vimtop command to enter the plug-ininteractive mode.
Table 9-1. Interactive Mode Command-Line Options
Option Description
-h Prints help for the vimtop command-line options.
-v Prints the vimtop version number.
VMware, Inc. 187

Table 9-1. Interactive Mode Command-Line Options (continued)
Option Description
-c filename Loads a user-defined vimtop configuration file. If the -c option is not used, the default configurationfile is /root/vimtop/vimtop.xml.
You can create your own configuration file, specifying a different filename and path by using the Wsingle-key interactive command.
-n number Sets the number of performed iterations before the vimtop exits interactive mode. vimtop updatesthe display number number of times and exits. The default value is 10000.
-p / -d seconds Sets the update period in seconds.
Interactive Mode Single-Key Commands for vimtopWhen running in interactive mode, vimtop recognizes several single-key commands.
All interactive mode panels recognize the commands listed in the following table.
Table 9-2. Interactive Mode Single-Key Commands
Key Names Description
h Show a help menu for the current panel, giving a brief summary of commands, and the status of securemode.
i Show or hide the top line view of the overview panel of the vimtop plug-in.
t Show or hide the Tasks section, which displays information in the overview panel about the tasks currentlyrunning on the vCenter Server instance.
m Show or hide the Memory section in the overview panel.
f Show or hide the CPU section which displays information in the overview panel about all available CPUs.
g Show or hide the CPUs section which displays information in the overview panel about the top 4 physicalCPUs.
spacebar Immediately refreshes the current pane.
p Pause the displayed information about the services resource use in the current panels.
r Refresh the displayed information about the services resource use in the current panels.
s Set refresh period.
q Exit the interactive mode of the vimtop plug-in.
k Displays the Disks view of the main panel.
o Switch the main panel to Network view.
Esc Clear selection or return to the Processes view of the main panel.
Enter Select a service to view additional details.
n Show or hide names of the headers in the main panel.
u Show or hide the measurement units in the headers in the main panel.
left, right arrows Select columns.
up, down arrows Select rows.
vSphere Monitoring and Performance
VMware, Inc. 188

Table 9-2. Interactive Mode Single-Key Commands (continued)
Key Names Description
<,> Move a selected column.
Delete Remove selected column.
c Add a column to the current view of the main panel. Use spacebar to add or remove columns from thedisplayed list.
a Sort the selected column in ascending order.
d Sort the selected column in descending order.
z Clear the sort order for all columns.
l Set width for the selected column.
x Return the column widths to their default values.
+ Expand selected item.
- Collapse selected item.
w Write the current setup to a vimtop configuration file. The default file name is the one specified by -coption, or /root/vimtop/vimtop.xml if the -c option is not used. You can also specify a different filename on the prompt generated by the w command.
vSphere Monitoring and Performance
VMware, Inc. 189
Monitoring Networked Deviceswith SNMP and vSphere 10Simple Network Management Protocol (SNMP) is commonly used by management programs to monitor avariety of networked devices.
vSphere systems run SNMP agents, which can provide information to a management program in at leastone of the following ways:
n In response to a GET, GETBULK, or GETNEXT operation, which is a specific request for information fromthe management system.
n By sending a notification which is an alert sent by the SNMP agent to notify the management systemof a particular event or condition.
Management Information Base (MIB) files define the information that can be provided by manageddevices. The MIB files define managed objects, described by object identifiers (OIDs) and variablesarranged in a hierarchy.
vCenter Server and ESXi have SNMP agents. The agent provided with each product has differentcapabilities.
This chapter includes the following topics:
n Using SNMP Traps with vCenter Server
n Configure SNMP for ESXi
n SNMP Diagnostics
n Monitor Guest Operating Systems with SNMP
n VMware MIB Files
n SNMPv2 Diagnostic Counters
Using SNMP Traps with vCenter ServerThe SNMP agent included with vCenter Server can be used to send traps when vCenter Server startsand when an alarm is triggered on vCenter Server. The vCenter Server SNMP agent functions only as atrap emitter and does not support other SNMP operations, such as receiving GET, GETBULK, and GETNEXTrequests.
VMware, Inc. 190

vCenter Server can send SNMPv1 traps to other management applications. You must configure yourmanagement server to interpret the SNMP traps sent by vCenter Server.
To use the vCenter Server SNMP traps, configure the SNMP settings on vCenter Server and yourmanagement client software to accept the traps from vCenter Server.
The traps sent by vCenter Server are defined in VMWARE-VC-EVENT-MIB.mib.
Configure SNMP Settings for vCenter ServerIf you plan to use SNMP with vCenter Server, you must use the vSphere Web Client to configure theSNMP settings.
Prerequisites
n Verify that the vSphere Web Client is connected to a vCenter Server instance.
n Verify that you have the domain name or IP address of the SNMP receiver, the port number of thereceiver, and the community string.
Procedure
1 In the vSphere Web Client, navigate to a vCenter Server instance.
2 Click the Configure tab.
3 Under Settings, click General.
4 On the vCenter Server Settings central pane, click Edit.
The Edit vCenter Server Settings wizard opens.
5 Click SNMP receivers to edit their settings.
6 Enter the following information for the primary receiver of the SNMP traps.
Option Description
Primary Receiver URL Enter the domain name or IP address of the receiver of SNMP traps.
Enable receiver Select the check box to enable the SNMP receiver.
Receiver port Enter the port number of the receiver to which the SNMP agent sends traps.
If the port value is empty, vCenter Server uses port 162 by default.
Community string Enter the community string that is used for authentication.
7 (Optional) Enter information about other SNMP receivers in the Receiver 2 URL, Receiver 3 URL,and Receiver 4 URL options, and select Enabled.
8 Click OK.
The vCenter Server system is now ready to send traps to the management system you have specified.
vSphere Monitoring and Performance
VMware, Inc. 191

What to do next
Configure your SNMP management software to receive and interpret data from the vCenter Server SNMPagent. See Configure SNMP Management Client Software.
Configure SNMP for ESXiESXi includes an SNMP agent that can send notifications (traps and informs) and receive GET, GETBULK,and GETNEXT requests.
In ESXi 5.1 and later releases, the SNMP agent adds support for version 3 of the SNMP protocol, offeringincreased security and improved functionality, including the ability to send informs. You can use esxclicommands to enable and configure the SNMP agent. You configure the agent differently depending onwhether you want to use SNMP v1/v2c or SNMP v3.
As an alternative to configuring SNMP manually using esxcli commands, you can use host profiles toconfigure SNMP for an ESXi host. See the vSphere Host Profiles documentation for more information.
Note For information on configuring SNMP for ESXi 5.0 or earlier or ESX 4.1 or earlier, see thedocumentation for the appropriate product version.
n Configure the SNMP Agent for Polling
If you configure the ESXi SNMP agent for polling, it can listen for and respond to requests fromSNMP management client systems, such as GET, GETNEXT and GETBULK requests.
n Configure ESXi for SNMPv1 and SNMPv2c
When you configure the ESXi SNMP agent for SNMPv1 and SNMPv2c, the agent supports sendingnotifications and receiving GET requests.
n Configure ESXi for SNMP v3
When you configure the ESXi SNMP agent for SNMPv3, the agent supports sending informs andtraps. SNMPv3 also provides stronger security than SNMPv1 or SNMPv2c, including keyauthentication and encryption.
n Configure the Source of Hardware Events Received by the SNMP Agent
You can configure the ESXi SNMP agent to receive hardware events either from IPMI sensors orCIM indications.
n Configure the SNMP Agent to Filter Notifications
You can configure the ESXi SNMP agent to filter out notifications if you don't want your SNMPmanagement software to receive those notifications.
n Configure SNMP Management Client Software
After you have configured a vCenter Server instance or an ESXi host to send traps, configure yourmanagement client software to receive and interpret those traps.
vSphere Monitoring and Performance
VMware, Inc. 192

Configure the SNMP Agent for PollingIf you configure the ESXi SNMP agent for polling, it can listen for and respond to requests from SNMPmanagement client systems, such as GET, GETNEXT and GETBULK requests.
By default, the embedded SNMP agent listens on UDP port 161 for polling requests from managementsystems. You can use the esxcli system snmp set command with the --port option to configure analternative port. To avoid conflicting with other services, use a UDP port that is not defined in /etc/services.
If you run ESXCLI commands through vCLI, you must supply connection options that specify the targethost and login credentials. If you use ESXCLI commands directly on a host using the ESXi Shell, you canuse the commands as given without specifying connection options. For more information on connectionoptions see vSphere Command-Line Interface Concepts and Examples.
Prerequisites
Configure the ESXi SNMP agent by using the ESXCLI commands. See Getting Started with vSphereCommand-Line Interfaces for more information on how to use ESXCLI.
Procedure
1 Run the esxcli system snmp set command with the --port option to configure the port.
For example, run the following command:
esxcli system snmp set --port port
Here, port is the port the SNMP agent uses to listen for polling requests.
Note The port you specify must not be already in use by other services. Use IP addresses from thedynamic range, port 49152 and up.
2 (Optional) If the ESXi SNMP agent is not enabled, run the following command:
esxcli system snmp set --enable true
Configure ESXi for SNMPv1 and SNMPv2cWhen you configure the ESXi SNMP agent for SNMPv1 and SNMPv2c, the agent supports sendingnotifications and receiving GET requests.
vSphere Monitoring and Performance
VMware, Inc. 193

In SNMPv1 and SNMPv2c, authentication is performed by using community strings. Community stringsare namespaces which contain one or more managed objects. This form of authentication does notsecure the communication between the SNMP agent and the management system. To secure the SNMPcommunication in your environment, use SNMPv3.
Procedure
1 Configure SNMP Communities
To enable the ESXi SNMP agent to send and receive SNMP v1 and v2c messages, you mustconfigure at least one community for the agent.
2 Configure the SNMP Agent to Send SNMP v1 or v2c Notifications
You can use the ESXi SNMP agent to send virtual machine and environmental notifications tomanagement systems.
Configure SNMP CommunitiesTo enable the ESXi SNMP agent to send and receive SNMP v1 and v2c messages, you must configure atleast one community for the agent.
An SNMP community defines a group of devices and management systems. Only devices andmanagement systems that are members of the same community can exchange SNMP messages. Adevice or management system can be a member of multiple communities.
If you run ESXCLI commands through vCLI, you must supply connection options that specify the targethost and login credentials. If you use ESXCLI commands directly on a host using the ESXi Shell, you canuse the commands as given without specifying connection options. For more information on connectionoptions see vSphere Command-Line Interface Concepts and Examples.
Prerequisites
Configure the ESXi SNMP agent by using the ESXCLI commands. See Getting Started with vSphereCommand-Line Interfaces for more information on how to use ESXCLI.
Procedure
u Run the esxcli system snmp set command with the --communities option to configure an SNMPcommunity.
For example, to configure public, East, and West network operation centers communities, run thefollowing command:
esxcli system snmp set --communities public,eastnoc,westnoc
Each time you specify a community with this command, the settings you specify overwrite theprevious configuration. To specify multiple communities, separate the community names with acomma.
vSphere Monitoring and Performance
VMware, Inc. 194

Configure the SNMP Agent to Send SNMP v1 or v2c NotificationsYou can use the ESXi SNMP agent to send virtual machine and environmental notifications tomanagement systems.
To send SNMP v1/v2c notifications with the SNMP agent, you must configure the target (receiver) unicastaddress, community, and an optional port. If you do not specify a port, the SNMP agent sends traps toUDP port 162 on the target management system by default.
To configure SNMP v3 traps, see Configure SNMP v3 Targets.
If you run ESXCLI commands through vCLI, you must supply connection options that specify the targethost and login credentials. If you use ESXCLI commands directly on a host using the ESXi Shell, you canuse the commands as given without specifying connection options. For more information on connectionoptions see vSphere Command-Line Interface Concepts and Examples.
Prerequisites
Configure the ESXi SNMP agent by using the ESXCLI commands. See Getting Started with vSphereCommand-Line Interfaces for more information on how to use ESXCLI.
Procedure
1 Run the esxcli system snmp set command with the --targets option:
esxcli system snmp set --targets target_address@port/community
Here, target_address is the address of the target system, port is the port number to send thenotifications to, and community is the community name.
Each time you specify a target with this command, the settings you specify overwrite all previouslyspecified settings. To specify multiple targets, separate them with a comma.
For example, run the following command for configuring the targets 192.0.2.1@163/westnoc and2001:db8::1@163/eastnoc:
esxcli system snmp set --targets 192.0.2.1@163/westnoc,2001:db8::1@163/eastnoc
2 (Optional) If the ESXi SNMP agent is not enabled, run the following command:
esxcli system snmp set --enable true
3 (Optional) Send a test trap to verify that the agent is configured correctly by running the esxclisystem snmp test command.
The agent sends a warmStart trap to the configured target.
Configure ESXi for SNMP v3When you configure the ESXi SNMP agent for SNMPv3, the agent supports sending informs and traps.SNMPv3 also provides stronger security than SNMPv1 or SNMPv2c, including key authentication andencryption.
vSphere Monitoring and Performance
VMware, Inc. 195

Inform is a notification that the sender resends up to three times or until the receiver acknowledges thenotification.
Procedure
1 Configure the SNMP Engine ID
Every SNMP v3 agent has an engine ID which serves as a unique identifier for the agent. Theengine ID is used with a hashing function to generate keys for authentication and encryption ofSNMP v3 messages.
2 Configure SNMP Authentication and Privacy Protocols
SNMPv3 optionally supports authentication and privacy protocols.
3 Configure SNMP Users
You can configure up to 5 users who can access SNMP v3 information. User names must be nomore than 32 characters long.
4 Configure SNMP v3 Targets
Configure SNMP v3 targets to allow the ESXi SNMP agent to send SNMP v3 traps and informs.
Configure the SNMP Engine IDEvery SNMP v3 agent has an engine ID which serves as a unique identifier for the agent. The engine IDis used with a hashing function to generate keys for authentication and encryption of SNMP v3messages.
If you do not specify an engine ID, when you enable the SNMP agent, an engine ID is automaticallygenerated.
If you run ESXCLI commands through vCLI, you must supply connection options that specify the targethost and login credentials. If you use ESXCLI commands directly on a host using the ESXi Shell, you canuse the commands as given without specifying connection options. For more information on connectionoptions see vSphere Command-Line Interface Concepts and Examples.
Prerequisites
Configure the ESXi SNMP agent by using the ESXCLI commands. See Getting Started with vSphereCommand-Line Interfaces for more information on how to use ESXCLI.
Procedure
u Run the esxcli system snmp set command with the --engineid option to configure the SNMPengine ID.
For example, run the following command:
esxcli system snmp set --engineid id
Here, id is the engine ID and it must be a hexadecimal string between 5 and 32 characters long.
vSphere Monitoring and Performance
VMware, Inc. 196

Configure SNMP Authentication and Privacy ProtocolsSNMPv3 optionally supports authentication and privacy protocols.
Authentication is used to ensure the identity of users. Privacy allows for encryption of SNMP v3messages to ensure confidentiality of data. These protocols provide a higher level of security than isavailable in SNMPv1 and SNMPv2c, which use community strings for security.
Both authentication and privacy are optional. However, you must enable authentication to enable privacy.
The SNMPv3 authentication and privacy protocols are licensed vSphere features and might not beavailable in some vSphere editions.
If you run ESXCLI commands through vCLI, you must supply connection options that specify the targethost and login credentials. If you use ESXCLI commands directly on a host using the ESXi Shell, you canuse the commands as given without specifying connection options. For more information on connectionoptions see vSphere Command-Line Interface Concepts and Examples.
Prerequisites
Configure the ESXi SNMP agent by using the ESXCLI commands. See Getting Started with vSphereCommand-Line Interfaces for more information on how to use ESXCLI.
Procedure
1 (Optional) Run the esxcli system snmp set command with the --authentication option toconfigure authentication.
For example, run the following command:
esxcli system snmp set --authentication protocol
Here, protocol must be either none (for no authentication), SHA1, or MD5.
2 (Optional) Run the esxcli system snmp set command with the --privacy option to configureprivacy.
For example, run the following command:
esxcli system snmp set --privacy protocol
Here, protocol must be either none (for no privacy) or AES128.
Configure SNMP UsersYou can configure up to 5 users who can access SNMP v3 information. User names must be no morethan 32 characters long.
While configuring a user, you generate authentication and privacy hash values based on the user'sauthentication and privacy passwords and the SNMP agent's engine ID. If you change the engine ID, theauthentication protocol, or the privacy protocol after configuring users, the users are no longer valid andmust be reconfigured.
vSphere Monitoring and Performance
VMware, Inc. 197

If you run ESXCLI commands through vCLI, you must supply connection options that specify the targethost and login credentials. If you use ESXCLI commands directly on a host using the ESXi Shell, you canuse the commands as given without specifying connection options. For more information on connectionoptions see vSphere Command-Line Interface Concepts and Examples.
Prerequisites
n Verify that you have configured the authentication and privacy protocols before configuring users.
n Verify that you know the authentication and privacy passwords for each user you plan to configure.Passwords must be at least 7 characters long. Store these passwords in files on the host system.
n Configure the ESXi SNMP agent by using the ESXCLI commands. See Getting Started with vSphereCommand-Line Interfaces for more information on how to use ESXCLI.
Procedure
1 If you are using authentication or privacy, get the authentication and privacy hash values for the userby running the esxcli system snmp hash command with the --auth-hash and --priv-hash flags.
For example, run the following command:
esxcli system snmp hash --auth-hash secret1 --priv-hash secret2
Here, secret1 is the path to the file containing the user's authentication password and secret2 is thepath to the file containing the user's privacy password.
Alternatively, you can pass the --raw-secret flag and specify the passwords directly on the commandline.
For example, you can run the following command:
esxcli system snmp hash --auth-hash authsecret --priv-hash privsecret --raw-secret
The produced output might be the following:
Authhash: 08248c6eb8b333e75a29ca0af06b224faa7d22d6
Privhash: 232ba5cbe8c55b8f979455d3c9ca8b48812adb97
The authentication and privacy hash values are displayed.
2 Configure the user by running the esxcli system snmp set command with the --users flag.
For example, you can run the following command:
esxcli system snmp set --users userid/authhash/privhash/security
The command accepts the following parameters:
Parameter Description
userid The user name.
authhash The authentication hash value.
vSphere Monitoring and Performance
VMware, Inc. 198

Parameter Description
privhash The privacy hash value.
security The level of security enabled for that user, which can be auth (for authentication only), priv (for authentication andprivacy), or none (for no authentication or privacy).
For example, run the following command to configure user1 for access with authentication andprivacy:
esxcli system snmp set --users user1/08248c6eb8b333e75a29ca0af06b224faa7d22d6/
232ba5cbe8c55b8f979455d3c9ca8b48812adb97/priv
You must run the following command to configure user2 for access with no authentication or privacy:
esxcli system snmp set --users user2/-/-/none
3 (Optional) Test the user configuration by running the following command:
esxcli system snmp test --users username --auth-hash secret1 --priv-hash secret2
If the configuration is correct, this command returns the following message: "User username validatedcorrectly using engine id and security level: protocols". Here, protocols indicates the securityprotocols configured.
Configure SNMP v3 TargetsConfigure SNMP v3 targets to allow the ESXi SNMP agent to send SNMP v3 traps and informs.
SNMP v3 allows for sending both traps and informs. An inform message is a type of a message that thesender resends a maximum of three times. The sender waits for 5 seconds between each attempt, unlessthe message is acknowledged by the receiver.
You can configure a maximum of three SNMP v3 targets, in addition to a maximum of three SNMP v1/v2ctargets.
To configure a target, you must specify a hostname or IP address of the system that receives the traps orinforms, a user name, a security level, and whether to send traps or informs. The security level can beeither none (for no security), auth (for authentication only), or priv (for authentication and privacy).
If you run ESXCLI commands through vCLI, you must supply connection options that specify the targethost and login credentials. If you use ESXCLI commands directly on a host using the ESXi Shell, you canuse the commands as given without specifying connection options. For more information on connectionoptions see vSphere Command-Line Interface Concepts and Examples.
Prerequisites
n Ensure that the users who access the traps or informs are configured as SNMP users for both theESXi SNMP agent and the target management system.
n If you are configuring informs, you need the engine ID for the SNMP agent on the remote system thatreceives the inform message.
vSphere Monitoring and Performance
VMware, Inc. 199

n Configure the ESXi SNMP agent by using the ESXCLI commands. See Getting Started with vSphereCommand-Line Interfaces for more information on how to use ESXCLI.
Procedure
1 (Optional) If you are configuring informs, configure the remote users by running the esxcli systemsnmp set command with the --remote-users option.
For example, run the following command:
esxcli system snmp set --remote-users userid/auth-protocol/auth-hash/priv-protocol/priv-hash/
engine-id
The command accepts the following parameters:
Parameter Description
userid The user name.
auth-protocol The authentication protocol, none (for no authentication), MD5, or SHA1.
auth-hash The authentication hash or - if the authentication protocol is none.
priv-protocol The privacy protocol, AES128, or none.
priv-hash The privacy hash, or - if the privacy protocol is none.
engine-id The engine ID of the SNMP agent on the remote system that receives the inform message.
2 Run the esxcli system snmp set command with the --v3targets option.
For example, run the following command:
esxcli system snmp set --v3targets hostname@port/userid/secLevel/message-type
The parameters of the command are as follows.
Parameter Description
hostname The host name or IP address of the management system that receives the traps or informs.
port The port on the management system that receives the traps or informs. If you do not specify a port, the defaultport, 162, is used.
userid The user name.
secLevel The level of authentication and privacy you have configured. Use auth if you have configured authenticationonly, priv if you have configured both authentication and privacy, and none if you have configured neither.
message-type The type of the messages received by the management system. Use trap or inform.
3 (Optional) If the ESXi SNMP agent is not enabled, run the following command:
esxcli system snmp set --enable true
4 (Optional) Send a test notification to verify that the agent is configured correctly by running theesxcli system snmp test command.
The agent sends a warmStart notification to the configured target.
vSphere Monitoring and Performance
VMware, Inc. 200

Configure the Source of Hardware Events Received by the SNMPAgentYou can configure the ESXi SNMP agent to receive hardware events either from IPMI sensors or CIMindications.
IPMI sensors are used for hardware monitoring in ESX/ESXi 4.x and earlier. The conversion of CIMindications to SNMP notifications is available in ESXi 5.0 and later.
If you run ESXCLI commands through vCLI, you must supply connection options that specify the targethost and login credentials. If you use ESXCLI commands directly on a host using the ESXi Shell, you canuse the commands as given without specifying connection options. For more information on connectionoptions see vSphere Command-Line Interface Concepts and Examples.
Prerequisites
Configure the ESXi SNMP agent by using the ESXCLI commands. See Getting Started with vSphereCommand-Line Interfaces for more information on how to use ESXCLI.
Procedure
1 Run the esxcli system snmp set --hwsrc source command to configure the source for hardwareevents.
Here, source is sensors or indications, for hardware event received from IPMI sensors or CIMindications respectively.
2 (Optional) If the ESXi SNMP agent is not enabled, run the following command:
esxcli system snmp set --enable true
Configure the SNMP Agent to Filter NotificationsYou can configure the ESXi SNMP agent to filter out notifications if you don't want your SNMPmanagement software to receive those notifications.
Prerequisites
Configure the ESXi SNMP agent by using the ESXCLI commands. See Getting Started with vSphereCommand-Line Interfaces for more information on how to use ESXCLI.
Procedure
1 Run the esxcli system snmp set command to filter notifications:
esxcli system snmp set --notraps oid_list
Here, oid_list is a list of OIDs for the notifications to filter, separated by commas. This list replacesany OIDs that were previously specified using this command.
vSphere Monitoring and Performance
VMware, Inc. 201

For example, to filter out coldStart (OID 1.3.6.1.4.1.6876.4.1.1.0) and warmStart (OID1.3.6.1.4.1.6876.4.1.1.1) traps, run the following command:
esxcli system snmp set --notraps 1.3.6.1.4.1.6876.4.1.1.0,1.3.6.1.4.1.6876.4.1.1.1
2 (Optional) If the ESXi SNMP agent is not enabled, run the following command:
esxcli system snmp set --enable true
The traps identified by the specified OIDs are filtered out of the output of the SNMP agent, and are notsent to SNMP management software.
What to do next
To clear all notification filters, run the esxcli system snmp set --notraps reset command.
Configure SNMP Management Client SoftwareAfter you have configured a vCenter Server instance or an ESXi host to send traps, configure yourmanagement client software to receive and interpret those traps.
To configure your management client software, specify the communities for the managed device,configure the port settings, and load the VMware MIB files. See the documentation for your managementsystem for specific instructions for these steps.
Prerequisites
To complete this task, download the VMware MIB files from the VMware website: http://communities.vmware.com/community/developer/managementapi. On the Web page, search DownloadingMIB modules.
Procedure
1 In your management software, specify the vCenter Server instance or ESXi host as an SNMP-basedmanaged device.
2 If you are using SNMPv1 or SNMPv2c, set up appropriate community names in the managementsoftware.
These names must correspond to the communities set for the SNMP agent on the vCenter Serverinstance or ESXi host.
3 If you are using SNMPv3, configure users and authentication and privacy protocols to match thoseconfigured on the ESXi host.
4 If you configured the SNMP agent to send traps to a port on the management system other than thedefault UDP port 162, configure the management client software to listen on the port you configured.
vSphere Monitoring and Performance
VMware, Inc. 202

5 Load the VMware MIBs into the management software so you can view the symbolic names forvCenter Server or the host variables.
To prevent lookup errors, load these MIB files in the following order before loading other MIB files:
a VMWARE-ROOT-MIB.mib
b VMWARE-TC-MIB.mib
c VMWARE-PRODUCTS-MIB.mib
The management software can now receive and interpret traps fromvCenter Server or ESXi hosts.
SNMP DiagnosticsYou can use SNMP tools to diagnose configuration problems.
n Run the esxcli system snmp test command from the vSphere CLI set to prompt the SNMP agentto send a test warmStart trap.
n Run the esxcli system snmp get command to display the current configuration of the SNMPagent.
n The SNMPv2-MIB.mib file provides several counters to aid in debugging SNMP problems. SeeSNMPv2 Diagnostic Counters.
n The VMWARE-AGENTCAP-MIB.mib file defines the capabilities of the VMware SNMP agents by productversion. Use this file to determine if the SNMP functionality that you want to use is supported.
Monitor Guest Operating Systems with SNMPYou can use SNMP to monitor guest operating systems or applications running in virtual machines.
The virtual machine uses its own virtual hardware devices. Do not install agents in the virtual machinesthat are intended to monitor physical hardware.
Procedure
u Install the SNMP agents you normally would use for that purpose in the guest operating systems.
VMware MIB FilesVMware MIB files define the information provided by ESXi hosts and vCenter Server to SNMPmanagement software.
You can download these MIB files from http://communities.vmware.com/community/developer/forums/managementapi#SNMP-MIB. On the Web page, search for Downloading MIB modules.
The table VMware MIB Files lists the MIB files provided by VMware and describes the information thateach file provides.
vSphere Monitoring and Performance
VMware, Inc. 203

Table 10-1. VMware MIB Files
MIB File Description
VMWARE-ROOT-MIB.mib Contains VMware’s enterprise OID and top-level OID assignments.
VMWARE-AGENTCAP-MIB.mib Defines the capabilities of the VMware agents by product versions. This file isoptional and might not be supported by all management systems.
VMWARE-CIMOM-MIB.mib Defines variables and trap types used to report on the state of the CIM ObjectManagement subsystem.
VMWARE-ENV-MIB.mib Defines variables and trap types used to report on the state of physical hardwarecomponents of the host computer. Enables conversion of CIM indications to SNMPtraps.
VMWARE-OBSOLETE-MIB.mib For use with versions of ESX/ESXi prior to 4.0. Defines OIDs that have been madeobsolete to maintain backward compatibility with earlier versions of ESX/ESXi.Includes variables formerly defined in the files VMWARE-TRAPS-MIB.mib andVMWARE-VMKERNEL-MIB.mib.
VMWARE-PRODUCTS-MIB.mib Defines OIDs to uniquely identify each SNMP agent on each VMware platform byname, version, and build platform.
VMWARE-RESOURCES-MIB.mib Defines variables used to report information on resource usage of the VMkernel,including physical memory, CPU, and disk utilization.
VMWARE-SYSTEM-MIB.mib The VMWARE-SYSTEM-MIB.mib file is obsolete. Use the SNMPv2-MIB to obtaininformation from sysDescr.0 and sysObjec ID.0.
VMWARE-TC-MIB.mib Defines common textual conventions used by VMware MIB files.
VMWARE-VC-EVENTS-MIB.mib Defines traps sent by vCenter Server. Load this file if you use vCenter Server tosend traps.
VMWARE-VMINFO-MIB.mib Defines variables for reporting information about virtual machines, including virtualmachine traps.
The table Other MIB Files lists MIB files included in the VMware MIB files package that are not created byVMware. These can be used with the VMware MIB files to provide additional information.
Table 10-2. Other MIB Files
MIB File Description
ENTITY-MIB.mib Allows the description of relationships between physical entitiesand logical entities managed by the same SNMP agent. SeeRFC 4133 for more information.
HOST-RESOURCES-MIB.mib Defines objects that are useful for managing host computers.
HOST-RESOURCES-TYPES.mib Defines storage, device, and filesystem types for use with HOST-RESOURCES-MIB.mib.
IEEE8021-BRIDGE-MIB Defines objects for managing devices that support IEEE 802.1D.
IEEE8023-LAG-MIB Defines objects for managing devices that support IEEE802.3ad link aggregation.
IEEE8021-Q-BRIDGE-MIB Defines objects for managing Virtual Bridged Local AreaNetworks.
IF-MIB.mib Defines attributes related to physical NICs on the host system.
vSphere Monitoring and Performance
VMware, Inc. 204

Table 10-2. Other MIB Files (continued)
MIB File Description
IP-MIB.mib Defines objects for managing implementations of the InternetProtocol (IP) in an IP version-independent manner.
IP-FORWARD-MIB.mib Defines objects for managing IP forwarding.
LLDP-V2-MIB.mib Defines objects for managing devices using Linked LayerDiscovery Protocol (LLDP).
SNMPv2-CONF.mib Defines conformance groups for MIBs.
SNMPv2-MIB.mib Defines the SNMP version 2 MIB objects.
SNMPv2-SMI.mib Defines the Structure of Management Information for SNMPversion 2.
SNMPv2-TC.mib Defines textual conventions for SNMP version 2.
TCP-MIB.mib Defines objects for managing devices using the TCP protocol.
UDP-MIB.mib Defines objects for managing devices using the UDP protocol.
SNMPv2 Diagnostic CountersThe SNMPv2-MIB.mib file provides a number of counters to aid in debugging SNMP problems.
Table 10-3. Diagnostic Counters from SNMPv2-MIB lists some of these diagnostic counters.
Table 10-3. Diagnostic Counters from SNMPv2-MIB
Variable ID Mapping Description
snmpInPkts snmp 1 The total number of messages delivered to the SNMP entityfrom the transport service.
snmpInBadVersions snmp 3 The total number of SNMP messages that were delivered tothe SNMP entity and were for an unsupported SNMP version.
snmpInBadCommunityNames snmp 4 The total number of community-based SNMP messagesdelivered to the SNMP entity that used an invalid SNMPcommunity name.
snmpInBadCommunityUses snmp 5 The total number of community-based SNMP messagesdelivered to the SNMP entity that represented an SNMPoperation that was not allowed for the community named in themessage.
snmpInASNParseErrs snmp 6 The total number of ASN.1 or BER errors encountered by theSNMP entity when decoding received SNMP messages.
snmpEnableAuthenTraps snmp 30 Indicates whether the SNMP entity is permitted to generateauthenticationFailure traps. The value of this object overridesany configuration information. It therefore provides a means ofdisabling all authenticationFailure traps.
vSphere Monitoring and Performance
VMware, Inc. 205

Table 10-3. Diagnostic Counters from SNMPv2-MIB (continued)
Variable ID Mapping Description
snmpSilentDrops snmp 31 The total number of Confirmed Class PDUs delivered to theSNMP entity that were silently dropped because the size of areply containing an alternate Response Class PDU with anempty variable-bindings field was greater than either a localconstraint or the maximum message size associated with theoriginator of the request.
snmpProxyDrops snmp 32 The total number of Confirmed Class PDUs delivered to theSNMP entity that were silently dropped because thetransmission of the message to a proxy target failed in amanner other than a time-out such that no Response ClassPDU could be returned.
vSphere Monitoring and Performance
VMware, Inc. 206

System Log Files 11In addition to lists of events and alarms, vSphere components generate assorted logs.
These logs contain additional information about activities in your vSphere environment.
This chapter includes the following topics:
n View System Log Entries
n View System Logs on an ESXi Host
n System Logs
n Export System Log Files
n Export System Log Files using vSphere Web Client
n ESXi Log Files
n Upload Logs Package to a VMware Service Request
n Configure Syslog on ESXi Hosts
n Configuring Logging Levels for the Guest Operating System
n Collecting Log Files
View System Log EntriesYou can view the system logs generated by vSphere components.
These instructions apply only to vCenter Server management nodes.
Procedure
1 In the vSphere Web Client, navigate to a vCenter Server.
2 From the Monitor tab, click System Logs.
3 From the drop-down menu, select the log and entry you want to view.
View System Logs on an ESXi HostYou can use the direct console interface to view the system logs on an ESXi host. These logs provideinformation about system operational events.
VMware, Inc. 207

Procedure
1 From the direct console, select View System Logs.
2 Press a corresponding number key to view a log.
vCenter Server agent (vpxa) logs appear if the host is managed by vCenter Server.
3 Press Enter or the spacebar to scroll through the messages.
4 (Optional) Perform a regular expression search.
a Press the slash key (/).
b Type the text to find.
c Press Enter
The found text is highlighted on the screen.
5 Press q to return to the direct console.
System LogsVMware technical support might request several files to help resolve any issues you might have with theproduct. This section describes the types and locations of log files found on ESXi hosts and vSphere WebClient.
ESXi System LogsYou might need the ESXi system log files to resolve technical issues.
The ESXi system logs can be found in the /var/run/log directory.
vSphere Client LogsYou might need the vSphere Client system log files to resolve technical issues.
Depending on, whether you use a vCenter Server instance that runs on Windows, or a vCenter ServerAppliance, the vSphere Web Client system logs can be found in the location listed in the table.
Table 11-1. Location of vSphere Web Client Logs
vCenter Server System Location
vCenter Server that runs on Windows C:\ProgramData\VMware\vCenterServer\logs\vsphere-
client\logs
vCenter Server Appliance /var/log/vmware/vsphere-client/logs
The main vSphere Client log file is vsphere_client_virgo.log.
vSphere Monitoring and Performance
VMware, Inc. 208
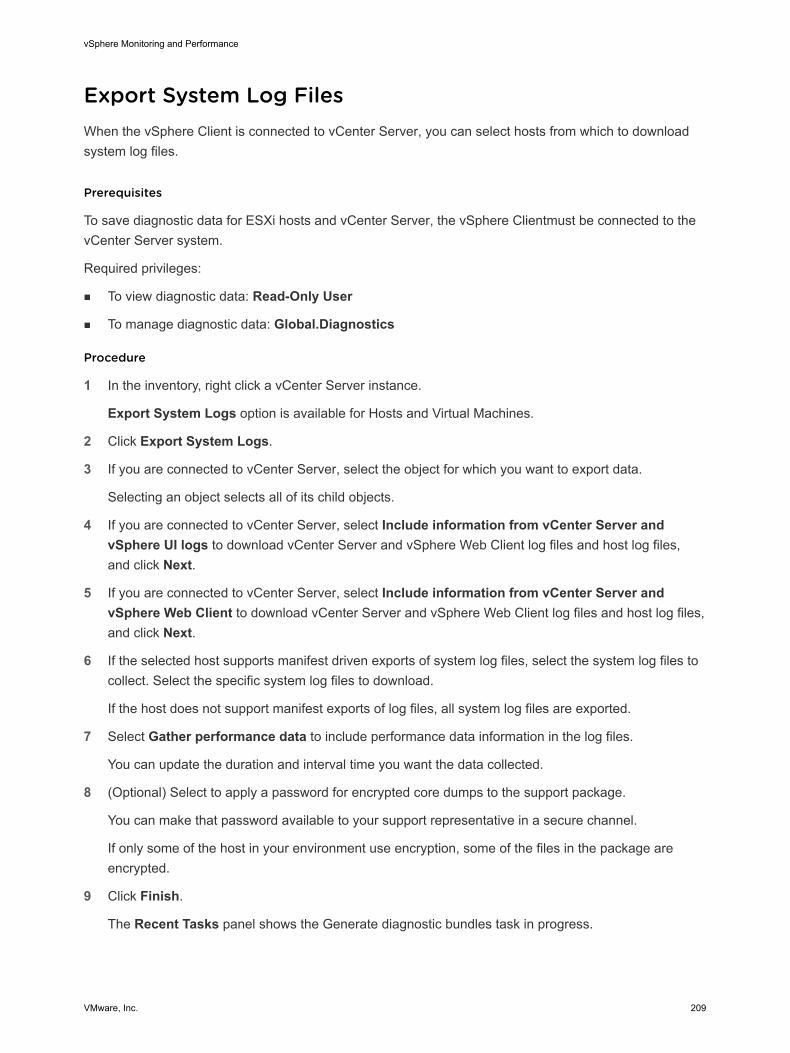
Export System Log FilesWhen the vSphere Client is connected to vCenter Server, you can select hosts from which to downloadsystem log files.
Prerequisites
To save diagnostic data for ESXi hosts and vCenter Server, the vSphere Clientmust be connected to thevCenter Server system.
Required privileges:
n To view diagnostic data: Read-Only User
n To manage diagnostic data: Global.Diagnostics
Procedure
1 In the inventory, right click a vCenter Server instance.
Export System Logs option is available for Hosts and Virtual Machines.
2 Click Export System Logs.
3 If you are connected to vCenter Server, select the object for which you want to export data.
Selecting an object selects all of its child objects.
4 If you are connected to vCenter Server, select Include information from vCenter Server andvSphere UI logs to download vCenter Server and vSphere Web Client log files and host log files,and click Next.
5 If you are connected to vCenter Server, select Include information from vCenter Server andvSphere Web Client to download vCenter Server and vSphere Web Client log files and host log files,and click Next.
6 If the selected host supports manifest driven exports of system log files, select the system log files tocollect. Select the specific system log files to download.
If the host does not support manifest exports of log files, all system log files are exported.
7 Select Gather performance data to include performance data information in the log files.
You can update the duration and interval time you want the data collected.
8 (Optional) Select to apply a password for encrypted core dumps to the support package.
You can make that password available to your support representative in a secure channel.
If only some of the host in your environment use encryption, some of the files in the package areencrypted.
9 Click Finish.
The Recent Tasks panel shows the Generate diagnostic bundles task in progress.
vSphere Monitoring and Performance
VMware, Inc. 209

Some network errors can cause download failures. When you select an individual download in thedialog box, the error message for that operation appears under the name and location of the logbundle file.
The Downloading Log Bundles dialog box appears when the Generating Diagnostic Bundle task isfinished. The download status of each bundle appears in the dialog box.
10 Specify the location to which to save the log files.
The host or vCenter Server generates a .zip file containing the log files.
11 Click Save.
12 Verify the information in the Summary and click Finish to download the log files.
Diagnostic bundles containing log files for the specified objects are downloaded to the location specified.
What to do next
Upload Logs Package to a VMware Service Request.
Export System Log Files using vSphere Web ClientWhen the vSphere Web Client is connected to vCenter Server, you can select hosts from which todownload system log files.
To save diagnostic data for ESXi hosts and vCenter Server, the vSphere Web Client must be connectedto the vCenter Server system.
Required privileges:
n To view diagnostic data: Read-Only User
n To manage diagnostic data: Global.Diagnostics
Procedure
1 In the inventory, navigate to a vCenter Server instance, and click the Monitor tab.
2 Click System Logs.
3 Click Export System Logs.
4 If you are connected to vCenter Server, select the object for which you want to export data.
Selecting an object selects all of its child objects.
5 If you are connected to vCenter Server, select Include information from vCenter Server andvSphere Web Client to download vCenter Server and vSphere Web Client log files and host log files,and click Next.
6 If the selected host supports manifest driven exports of system log files, select the system log files tocollect. Select the specific system log files to download.
If the host does not support manifest exports of log files, all system log files are exported.
vSphere Monitoring and Performance
VMware, Inc. 210

7 Select Gather performance data to include performance data information in the log files.
You can update the duration and interval time you want the data collected.
8 (Optional) Select to apply a password for encrypted core dumps to the support package.
You can make that password available to your support representative in a secure channel.
If only some of the host in your environment use encryption, some of the files in the package areencrypted.
9 Click Finish.
The Recent Tasks panel shows the Generate diagnostic bundles task in progress.
Some network errors can cause download failures. When you select an individual download in thedialog box, the error message for that operation appears under the name and location of the logbundle file.
The Downloading Log Bundles dialog box appears when the Generating Diagnostic Bundle task isfinished. The download status of each bundle appears in the dialog box.
10 Specify the location to which to save the log files.
The host or vCenter Server generates a .zip file containing the log files.
11 Click Save.
12 Verify the information in the Summary and click Finish to download the log files.
Diagnostic bundles containing log files for the specified objects are downloaded to the location specified.
What to do next
Upload Logs Package to a VMware Service Request.
ESXi Log FilesLog files are an important component of troubleshooting attacks and obtaining information aboutbreaches. Logging to a secure, centralized log server can help prevent log tampering. Remote loggingalso provides a long-term audit record.
To increase the security of the host, take the following measures
n Configure persistent logging to a datastore. By default, the logs on ESXi hosts are stored in the in-memory file system. Therefore, they are lost when you reboot the host, and only 24 hours of log datais stored. When you enable persistent logging, you have a dedicated activity record for the host.
n Remote logging to a central host allows you to gather log files on a central host. From that host, youcan monitor all hosts with a single tool, do aggregate analysis, and search log data. This approachfacilitates monitoring and reveals information about coordinated attacks on multiple hosts.
n Configure the remote secure syslog on ESXi hosts by using a CLI such as vCLI or PowerCLI, or byusing an API client.
n Query the syslog configuration to make sure that the syslog server and port are valid.
vSphere Monitoring and Performance
VMware, Inc. 211

See the vSphere Monitoring and Performance documentation for information about syslog setup, and foradditional information on ESXi log files.
Upload Logs Package to a VMware Service RequestIf you already have a Service Request ID with VMware, you can use the vSphere Web Client to uploadthe system log bundles directly to your service request.
Prerequisites
Request a Service Request ID from VMware Technical Support.
Procedure
1 In the vSphere Web Client, navigate to Administration.
2 Click Support, and click Upload File to Service Request.
An Upload File to Service Request dialog box opens.
3 Enter your Service Request ID with VMware.
4 Click Choose File, and select the log bundle you want to attach to your service request with VMware,and click OK.
5 If you protected your support package with a password, provide the password to VMware TechnicalSupport by using a secure channel.
The log bundle is sent to your service request.
Configure Syslog on ESXi HostsYou can use the vSphere Web Client or the esxcli system syslog vCLI command to configure thesyslog service.
For information about using the esxcli system syslog command and other vCLI commands, seeGetting Started with vSphere Command-Line Interfaces.
Procedure
1 In the vSphere Web Client inventory, select the host.
2 Click Configure.
3 Under System, click Advanced System Settings.
4 Filter for syslog.
vSphere Monitoring and Performance
VMware, Inc. 212

5 To set up logging globally, select the setting to change and click Edit.
Option Description
Syslog.global.defaultRotate Maximum number of archives to keep. You can set this number globally and forindividual subloggers.
Syslog.global.defaultSize Default size of the log, in KB, before the system rotates logs. You can set thisnumber globally and for individual subloggers.
Syslog.global.LogDir Directory where logs are stored. The directory can be located on mounted NFS orVMFS volumes. Only the /scratch directory on the local file system is persistentacross reboots. Specify the directory as [datastorename] path_to_file, where thepath is relative to the root of the volume backing the datastore. For example, thepath [storage1] /systemlogs maps to the path /vmfs/volumes/storage1/systemlogs.
Syslog.global.logDirUnique Selecting this option creates a subdirectory with the name of the ESXi host underthe directory specified by Syslog.global.LogDir. A unique directory is useful if thesame NFS directory is used by multiple ESXi hosts.
Syslog.global.LogHost Remote host to which syslog messages are forwarded and port on which theremote host receives syslog messages. You can include the protocol and the port,for example, ssl://hostName1:1514. UDP (default), TCP, and SSL aresupported. The remote host must have syslog installed and correctly configured toreceive the forwarded syslog messages. See the documentation for the syslogservice installed on the remote host for information on configuration.
6 (Optional) To overwrite the default log size and log rotation for any of the logs.
a Click the name of the log that you want to customize.
b Click Edit and enter the number of rotations and the log size you want.
7 Click OK.
Changes to the syslog options take effect immediately.
Configuring Logging Levels for the Guest OperatingSystemVirtual machines can write support and troubleshooting information into a virtual machine log file storedon a VMFS volume. The default settings for virtual machines are appropriate for most situations.
If your environment relies heavily on using vMotion, or if the defaults do not seem suitable for otherreasons, you can modify the logging settings for virtual machine guest operating systems.
New log file creation happens as follows:
n Each time you power on or resume a virtual machine, and each time you migrate a virtual machinewith vMotion, a new log file is created.
n Each time an entry is written to the log, the size of the log is checked. If vmx.log.rotateSize is setto a nondefault value, and the size is over the limit, the next entry is written to a new log. If themaximum number of log files exists, the oldest log file is deleted.
vSphere Monitoring and Performance
VMware, Inc. 213

The default for vmx.log.rotateSize is zero (0), which means new logs are created during power-on,resume, and so on. You can ensure the new log file creation happens more frequently by limiting themaximum size of the log files with the vmx.log.rotateSize configuration parameter.
VMware recommends saving 10-log files, each one limited to no less than 2MB. These values are largeenough to capture sufficient information to debug most problems. If you need logs for a longer time span,you can set vmx.log.keepOld to 20.
Change the Number of Virtual Machine Log FilesYou can change the number of the log files for all virtual machines on an ESXi host or for individual virtualmachines.
This procedure discusses limiting the virtual machine log file number on an individual virtual machine.
To limit the number of log files for all virtual machines on a host, edit the /etc/vmware/config file. If thevmx.log.KeepOld property is not defined in the file, you can add it. For example, to keep ten log files foreach virtual machine, add the following to /etc/vmware/config:
vmx.log.keepOld = "10"
You can use a PowerCLI script to change this property on all the virtual machines on a host.
You can use the log.keepOld parameter to affect all log files, not just the virtual machine log files.
Prerequisites
Turn off the virtual machine.
Procedure
1 Log in to a vCenter Server system using the vSphere Web Client and find the virtual machine.
a In the Navigator, select VMs and Templates.
b Find the virtual machine in the hierarchy.
2 Right-click the virtual machine and click Edit Settings.
3 Select VM Options.
4 Click Advanced and click Edit Configuration.
5 Add or edit the vmx.log.keepOld parameter to the number of files to keep for this virtual machine.
For example, to keep 20 log files and begin deleting the oldest files as new ones are created, enter20.
6 Click OK.
Control When to Switch to New Virtual Machine Log FilesThe vmx.log.rotateSize parameter specifies the log file size at which the switch to new log fileshappens for the logs for individual virtual machines. Use this parameter together with the
vSphere Monitoring and Performance
VMware, Inc. 214

vmx.log.keepOld parameter to ensure acceptable log file sizes without losing critical logginginformation.
The vmx.log.keepOld parameter determines how many virtual machine log file instances the ESXi hostretains before overwriting the first log file. The default value of vmx.log.keepOld is 10, a suitable numberto properly log complex operations such as vMotion. You must increase this number significantly whenyou change the value of vmx.log.rotateSize.
This procedure discusses changing the virtual machine rotate size on an individual virtual machine.
To limit the rotate size for all virtual machines on a host, edit the /etc/vmware/config file. If thevmx.log.KeepOld property is not defined in the file, you can add it. You can use a PowerCLI script tochange this parameter for selected virtual machines on a host.
You can use the log.rotateSize parameter to affect all log files, not just the virtual machine log files.
You can change the value of vmx.log.rotateSize for all virtual machines from the vSphere Web Clientor by using a PowerCLI script.
Prerequisites
Turn off the virtual machine.
Procedure
1 Log in to a vCenter Server system using the vSphere Web Client and find the virtual machine.
a In the Navigator, select VMs and Templates.
b Find the virtual machine in the hierarchy.
2 Right-click the virtual machine and click Edit Settings.
3 Select VM Options.
4 Click Advanced and click Edit Configuration.
5 Add or edit the vmx.log.rotateSize parameter to the maximum file size before log information isadded to a new file.
Alternatively, you can add or edit the first log file if you have more log files than the vmx.log.keepOldparameter specifies.
Specify the size in bytes.
6 Click OK.
Collecting Log FilesVMware technical support might request several files to help resolve technical issues. The followingsections describe script processes for generating and collecting some of these files.
Set Verbose LoggingYou can set the verbose log file specification
vSphere Monitoring and Performance
VMware, Inc. 215

You can only set verbose logging for vpxd logs.
Procedure
1 Select Administration > vCenter Server Settings.
2 Select Logging Options.
3 Select Verbose from the pop-up menu.
4 Click OK.
Collect vSphere Log FilesYou can collect vSphere log files in to a single location.
Procedure
u View the log file using one of the following methods.
Task Action
View the viclient-*.log file Change to the directory, %temp%.
Download the log bundle fromvSphere Web Client connected to avCenter Server system
To download the log bundle, do the following:
a Select Administration > System Configuration.
b From the Objects tab, select Actions > Export Support Bundles...The log bundle is generated as a .zip file. By default, the vpxd logs within thebundle are compressed as .tgz files. You must use gunzip to uncompress thesefiles.
Generate vCenter Server log bundlesfrom a vCenter Server system
Select Start > Programs > VMware > Generate vCenter Server log bundle.
You can use this to generate vCenter Server log bundles even when you areunable to connect to the vCenter Server using the vSphere Web Client.
The log bundle is generated as a .zip file. By default, the vpxd logs within thebundle are compressed as .tgz files. You must use gunzip to uncompress thesefiles.
Collect ESXi Log FilesYou can collect and package all relevant ESXi system and configuration information, a well as ESXi logfiles. This information can be used to analyze the problems.
Procedure
u Run the following script on the ESXi Shell: /usr/bin/vm-support
The resulting file has the following format: esx-date-unique-xnumber.tgz
ESXi Log File LocationsESXi records host activity in log files, using a syslog facility.
vSphere Monitoring and Performance
VMware, Inc. 216

Component Location Purpose
VMkernel /var/log/vmkernel.log Records activities related to virtualmachines and ESXi.
VMkernel warnings /var/log/vmkwarning.log Records activities related to virtualmachines.
VMkernel summary /var/log/vmksummary.log Used to determine uptime and availabilitystatistics for ESXi (comma separated).
ESXi host agent log /var/log/hostd.log Contains information about the agent thatmanages and configures the ESXi hostand its virtual machines.
vCenter agent log /var/log/vpxa.log Contains information about the agent thatcommunicates with vCenter Server (if thehost is managed by vCenter Server).
Shell log /var/log/shell.log Contains a record of all commands typedinto the ESXi Shell as well as shell events(for example, when the shell wasenabled).
Authentication /var/log/auth.log Contains all events related toauthentication for the local system.
System messages /var/log/syslog.log Contains all general log messages andcan be used for troubleshooting. Thisinformation was formerly located in themessages log file.
Virtual machines The same directory as the affectedvirtual machine's configuration files,named vmware.log and vmware*.log. Forexample, /vmfs/volumes/datastore/virtual machine/vwmare.log
Contains virtual machine power events,system failure information, tools statusand activity, time sync, virtual hardwarechanges, vMotion migrations, machineclones, and so on.
Configure Log Filtering on ESXi HostsThe log filtering capability lets you modify the logging policy of the syslog service that is running on anESXi host. You can create log filters to reduce the number of repetitive entries in the ESXi logs and toblacklist specific log events entirely.
Log filters affect all log events that are processed by the ESXi host vmsyslogd daemon, whether they arerecorded to a log directory or to a remote syslog server.
When you create a log filter, you set a maximum number of log entries for the log messages. The logsmessages are generated by one or more specified system components and that match a specifiedphrase. You must enable the log filtering capability and reload the syslog daemon to activate the log filterson the ESXi host.
Important Setting a limit to the amount of logging information, restricts your ability to troubleshootpotential system failures properly. If a log rotate occurs after the maximum number of log entries isreached, you might lose all instances of a filtered message.
vSphere Monitoring and Performance
VMware, Inc. 217

Procedure
1 Log in to the ESXi Shell as root.
2 In the /etc/vmware/logfilters file, add the following entry to create a log filter.
numLogs | ident | logRegexp
where:
n numLogs sets the maximum number of log entries for the specified log messages. After reachingthis number, the specified log messages are filtered and ignored. Use 0 to filter and ignore all thespecified log messages.
n ident specifies one or more system components to apply the filter to the log messages that thesecomponents generate. For information about the system components that generate logmessages, see the values of the idents parameters in the syslog configuration files. The filesare located in the /etc/vmsyslog.conf.d directory. Use a comma-separated list to apply a filterto more than one system component. Use * to apply a filter to all system components.
n logRegexp specifies a case-sensitive phrase with Python regular expression syntax to filter thelog messages by their content.
For example, to set a limit of maximum two-log entries from the hostd component for messages thatresemble the SOCKET connect failed, error 2: No such file or directory phrase with anyerror number, add the following entry:
2 | hostd | SOCKET connect failed, error .*: No such file or directory
Note A line starting with # denotes a comment and the rest of the line is ignored.
3 In the /etc/vmsyslog.conf file, add the following entry to enable the log filtering capability.
enable_logfilters = true
4 Run the esxcli system syslog reload command to reload the syslog daemon and apply theconfiguration changes.
Turn Off Compression for vpxd Log FilesBy default, vCenter Server vpxd log files are rolled up and compressed into .gz files. You can turn off thissetting to leave the vpxd logs uncompressed.
Procedure
1 Log in to the vCenter Server using the vSphere Web Client.
2 Select Administration > vCenter Server Settings.
3 Select Advanced Settings.
4 In the Key text box, type log.compressOnRoll.
vSphere Monitoring and Performance
VMware, Inc. 218

5 In the Value text box, type false.
6 Click Add, and click OK.
ESXi VMkernel FilesIf the VMkernel fails, an error message appears and then the virtual machine reboots. If you specified aVMware core dump partition when you configured your virtual machine, the VMkernel also generates acore dump and error log.
More serious problems in the VMkernel can freeze the machine without an error message or core dump.
vSphere Monitoring and Performance
VMware, Inc. 219


![VMware vSphere 6 Software Description vSphere 6...[PRIMEQUEST(VMware) ]VMware vSphere 6.0 Documentation Center ・vSphere 6 Software Description(this document) vSphere Installation](https://img.pdfslide.net/doc/110x75/5a9f00a07f8b9a71178c28f6/pdfvmware-vsphere-6-software-description-vsphere-6primequestvmware-vmware.jpg)