Embed Size (px)
Citation preview

VTU QUESTION AND ANSWER
UNIT 1
1. Briefly discuss the various design factors to be considered for geometric design of
highway.
( dec2013/jan2014, Dec 2014/Jan 2015,June/July 2015)
(Or)
2. Explain the design control and criteria which governs the design and highway. ( June
2013)
Ans: Factors affecting the geometric designs are as follows.
Design speed: Design speed is the single most important factor that affects the geometric
design. It directly affects the sight distance, horizontal curve, and the length of vertical
curves. Since the speed of vehicles vary with driver, terrain etc., a design speed is adopted
for all the geometric design. Design speed is defined as the highest continuous speed at
which individual vehicles can travel with safety on the highway when weather conditions
are conducive. Design speed is different from the legal speed limit which is the speed limit
imposed to curb a common tendency of drivers to travel beyond an accepted safe speed.
Design speed is also different from the desired speed which is the maximum speed at
which a driver would travel when unconstrained by either track or local geometry.
Topography: It is easier to construct roads with required standards for a plain terrain.
However, for a given design speed, the construction cost increases multi form with the
gradient and the terrain. Therefore, geometric design standards are different for different
terrain to keep the cost of construction and time of construction under control. This is
characterized by sharper curves and steeper gradients.
Traffic factors: It is of crucial importance in highway design, is the traffic data both
current and future estimates. Traffic volume indicates the level of services (LOS) for
which the highway is being planned and directly affects the geometric features such as
width, alignment, grades etc., without traffic data it is very difficult to design any highway.
Design Hourly Volume and Capacity: The general unit for measuring traffic on highway
is the Annual Average Daily Traffic volume, abbreviated as AADT. The traffic flow (or)
volume keeps fluctuating with time, from a low value during off peak hours to the highest
value during the peak hour. It will be uneconomical to design the roadway facilities for the
peak traffic flow. Therefore a reasonable value of traffic volume is decided for the design
and this is called as Design Hourly Volume (DHV) which is determined from extensive

traffic volume studies. The ratio of volume to capacity affects the level of service of the
road. The geometric design is thus based on this design volume, capacity etc.
Environmental and other factors: The environmental factors like air pollution, noise
pollution, landscaping, aesthetics and other global conditions should be given due
considerations in the geometric design of roads.
3. Enumerate the concept of PCU in geometric design of highways. List out the factors
governing PCU. Give some typical values as recommended by IRC.(dec2013/jan2014,
june/july2013, June/July 2015)
Ans: Passenger Car Unit (PCU): Different classes of vehicles such as cars, vans, buses, trucks,
auto rickshaw, motor cycles, pedal cycles etc. are found to use the common roadway facilities
without segregation. The flow of traffic with unrestricted mixing of different vehicle classes forms
the ‗Mixed Traffic Flow‘. In a mixed traffic condition, the traffic flow characteristics are very
much complex when compared to homogeneous traffic consisting of passenger cars only. It is very
difficult to estimate the traffic volume and capacity of roadway facilities under mixed traffic flow.
Hence the different vehicle classes are converted to one common standard vehicle unit. It is
common practice to consider the passenger car as the standard vehicle unit to convert the other
vehicle classes and this unit is called Passenger Car Unit (or) PCU. Thus in a mixed traffic flow,
traffic volume and capacity are generally expressed as pcu / hr (or) pcu / lane/ hr and traffic
density as pcu / km length of lane.
Factors affecting PCU Values:
Vehicles characteristics such as dimensions, power, speed, acceleration and braking
characteristics.
Transverse and longitudinal gaps (or) clearances between moving vehicles which depends
upon speed, driver characteristics.
Traffic stream characteristics such as composition of different vehicle classes, mean speed
and speed distribution of mixed traffic stream, volume to capacity ratio etc.
Roadway characteristics such as road geometrics includes gradient, curve etc., rural or urban
road, presence of intersections and the types of intersections.
Regulation and control of traffic such as speed limit, one-way traffic, presence of different
traffic control devices etc.
Environmental and climatic conditions

PCU values suggested by IRC:
4. Explain the geometric elements to be considered for the design of highway(June/july2013)
(Or)
5. Explain the objects of highway geometric design. List the various geometric elements to
be considered in the highway design.(dec2014)
Ans: The geometric design of highways deals with the dimensions and layout of visible features of
the highway. The emphasis of the geometric design is to address the requirement of the driver and
the vehicle such as safety, comfort, efficiency, etc. The features normally considered are the cross
section elements, sight distance consideration, horizontal curvature, gradients, and intersection.
The design of these features is to a great extend influenced by driver behavior and psychology,
vehicle characteristics, track characteristics such as speed and volume. The objective of geometric
design is to provide maximum efficiency, in traffic operations with maximum safety at reasonable
cost. The emphasis of the geometric design is to address the requirement of the driver and the
vehicle such as safety, comfort, efficiency, etc.
Geometric design of highways deals with the following elements:
Cross-section elements Sight distance considerations
Horizontal alignment details
Vertical alignment details
Intersection elements
6. Explain significance of design speed and design vehicle in the geometries(June/july2013,
Dec 2014/Jan 2015)
Ans: Design speed: Design speed is the single most important factor that affects the geometric
design. It directly affects the sight distance, horizontal curve, and the length of vertical curves.
Since the speed of vehicles vary with driver, terrain etc., a design speed is adopted for all the

geometric design. Design speed is defined as the highest continuous speed at which individual
vehicles can travel with safety on the highway when weather conditions are conducive. Design
speed is different from the legal speed limit which is the speed limit imposed to curb a
common tendency of drivers to travel beyond an accepted safe speed. Design speed is also
different from the desired speed which is the maximum speed at which a driver would travel
when unconstrained by either track or local geometry. A ―Design Vehicle‖ is a selected
motor vehicle, the weight, dimensions and operating characteristics of which are used to
establish highway design controls to accommodate vehicles of a designated type. The
dimensions and operating characteristics of a vehicle profoundly influence the geometric
design aspects such as radii, width of pavements, clearances, parking geometries etc. The
weight of axles and the weight of the vehicles affect the structural design of the pavement and
structures, as also the operating characteristics of vehicles on grades. Because of its crucial
importance, the standardization of the dimensions and weights of design vehicles is the first
step in formulating geometric design standards. This has been done in most countries. In India,
the current standard of the Indian Roads Congress is generally followed. The AASHTO
standards represent American practice. In U.K., the Ministry of Transport Regulations governs
the features of the design vehicle.
Types of design vehicles: The AASHTO Standard on Urban Streets (Ref. 4) classifies the
following broad types of design vehicles:
The IRC Standard contains only commercial vehicles of the following types:
1. Single unit truck.
2. Semi-trailer.
3. Truck-trailer combination.
7. Explain the important functional aspects of geometric design.(Jun/jul2013)
Ans: The functional aspects of geometric design are as follows:
To ensure the design of Cross-section elements - It includes cross slope, various widths of
road
To design Sight distance considerations - It the visible land ahead of the driver at
horizontal and vertical curves and at intersections for the safe movements of vehicles.
To ensure the design of Horizontal alignment - Horizontal curves are introduced to change
the direction of road. It includes features like super elevation, radius of curve, transition
curve.
To ensure the design of Vertical alignment - Its components like gradient, vertical curves
(i.e., summit curve and valley curve) sight distance and design of length of curves.
To ensure the design of Intersection elements – Proper design of intersection is very much
essential for the safe and efficient traffic movements. Its features like layout, capacity, etc.

UNIT 2
1. List the important pavement surface characteristics and explain briefly: i) Friction and
factors affecting friction; ii) Pavement unevenness. (Dec 2014, June/July 2013)
Ans: Friction:
Friction between the wheel and the pavement surface is a crucial factor in the design of horizontal
curves and thus the safe operating speed. Further, it also affect the acceleration and deceleration
ability of vehicles. Lack of adequate friction can cause skidding or slipping of vehicles.
Skidding happens when the path traveled along the road surface is more than the
circumferential movement of the wheels due to friction
Slip occurs when the wheel revolves more than the corresponding longitudinal movement
along the road.
Various factors that affect friction are:
Type of the pavement (like bituminous, concrete, or gravel),
Condition of the pavement (dry or wet, hot or cold, etc), Condition of the tyre (new
or old), and
Speed and load of the vehicle.
The frictional force that develops between the wheel and the pavement is the load acting
multiplied by a factor called the coefficient of friction and denoted as f. The choice of the
value of f is a very complicated issue since it depends on many variables. IRC suggests the
coefficient of longitudinal friction as 0.35-0.4 depending on the speed and coefficient of
lateral friction as 0.15. The former is useful in sight distance calculation and the latter in
horizontal curve design.
Unevenness:
It is always desirable to have an even surface, but it is seldom possible to have such a one.
Even if a road is constructed with high quality pavers, it is possible to develop unevenness
due to pavement failures. Unevenness affects the vehicle operating cost, speed, riding
comfort, safety, fuel consumption and wear and tear of tyres. Unevenness index is a
measure of unevenness which is the cumulative measure of vertical undulations of the
pavement surface recorded per unit horizontal length of the road. An unevenness index
value less than 1500 mm/km is considered as good, a value less than 2500 mm.km is

satisfactory up to speed of 100 kmph and values greater than 3200 mm/km is considered as
uncomfortable even for 55 kmph
2. Write notes on the following and mention the IRC standards: i) Carriage way ii) Right
of way. (Dec 2013, June/July 2015)
Ans: Carriage way Width of the carriage way or the width of the pavement depends on the width
of the traffic lane and number of lanes. Width of a traffic lane depends on the width of the vehicle
and the clearance. Side clearance improves operating speed and safety. The maximum permissible
width of a vehicle is 2.44 and the desirable side clearance for single lane traffic is 0.68 m. This
requires minimum of lane width of 3.75 m for a single lane road However, the side clearance
required is about 0.53 m, on both side and 1.06 m in the center. Therefore, a two lane road require
minimum of 3.5 meter for each lane .The desirable carriage way width recommended by IRC is
given in Table below.
Right of way:
Right of way (ROW) or land width is the width of land acquired for the road, along its alignment. It
should be adequate to accommodate all the cross-sectional elements of the highway and may
reasonably provide for future development. To prevent ribbon development along highways, control
lines and building lines may be provided. Control line is a line which represents the nearest limits of
future uncontrolled building activity in relation to a road. Building line represents a line on either side
of the road; between which and the road no building activity is permitted at all.

The right of way width is governed by: Width of formation:
It depends on the category of the highway and width of roadway and road margins.
Height of embankment or depth of cutting: It is governed by the topography and the vertical
alignment.
Side slopes of embankment or cutting: It depends on the height of the slope, soil type etc.
Drainage system and their size which depends on rainfall, topography etc.
Sight distance considerations: On curves etc. there is restriction to the visibility on the inner
side of the curve due to the presence of some obstructions like building structures etc.
Reserve land for future widening: Some land has to be acquired in advance anticipating future
developments like widening of the road.
The importance of reserved land is emphasized by the following. Extra width of land is
available for the construction of roadside facilities. Land acquisition is not possible later,
because the land may be occupied for various other purposes (buildings, business etc.) The
normal ROW requirements for built up and open areas as specified by IRC is given in table
above. A typical cross section of a ROW is given in figure below.

Drive ways: Drive ways connect the highway with commercial establishment like fuel
stations, service stations,etc. Drive ways should be properly designed and located fairly away
from an intersection.
3. Draw the typical cross sections of the following roads indicating all the details: i) NH - in
cutting ii) SH - in embankment. (Dec 2014)
Ans:
4. What is camber? What are the objectives of providing camber? When straight and
parabolic cambers are preferred? List the functions of camber. Discuss the factors
governing camber. Explain different shapes of camber with help of neat sketches (
dec2013/jan2014)
Ans: Camber or cant is the cross slope provided to raise middle of the road surface in the
transverse direction to drain of rain water from road surface.
The objectives of providing camber are:
Surface protection especially for gravel and bituminous roads
Sub-grade protection by proper drainage
Quick drying of pavement which in turn increases safety Too steep slope is undesirable for
it will erode the surface.
Camber is measured in 1 in n or n% (Eg. 1 in 50 or 2%) and the value depends on the type of
pavement surface. The values suggested by IRC for various categories of pavement is given in
Table below .The common types of camber are parabolic, straight, or combination of them

5. What is right of way? State the factors influencing right of way (June/july 2014, Dec
2013 )
Ans: Right of way (ROW) or land width is the width of land acquired for the road, along its
alignment. It should be adequate to accommodate all the cross-sectional elements of the highway
and may reasonably provide for future development.
To prevent ribbon development along highways, control lines and building lines may be provided.
Control line is a line which represents the nearest limits of future uncontrolled building activity in
relation to a road. Building line represents a line on either side of the road; between which and the
road no building activity is permitted at all.
The right of way width is governed by:
Width of formation: It depends on the category of the highway and width of roadway and
road margins.
Height of embankment or depth of cutting: It is governed by the topography and the
vertical alignment.
Side slopes of embankment or cutting: It depends on the height of the slope, soil type etc.
Drainage system and their size which depends on rainfall, topography etc.
Sight distance considerations: On curves etc. there is restriction to the visibility on the inner
side of the curve due to the presence of some obstructions like building structures etc.
Reserve land for future widening: Some land has to be acquired in advance anticipating
future developments like widening of the road.
6. What Objectives of providing transition curves (Dec 2013)
Ans: Transition curve is provided to change the horizontal alignment from straight to circular
curve gradually and has a radius which decreases from infinity at the straight end (tangent point) to
the desired radius of the circular curve at the other end (curve point)
There are five objectives for providing transition curve and are given below:
To introduce gradually the centrifugal force between the tangent point and the beginning
of the circular curve, avoiding sudden jerk on the vehicle. This increases the comfort of
passengers.
To enable the driver turn the steering gradually for his own comfort and security,
To provide gradual introduction of super elevation, and
To provide gradual introduction of extra widening.
To enhance the aesthetic appearance of the road.
7. Mention the various cross-sectional elements to be designed for a pavement and explain
them briefly. (June 2013, May/ June 2014)
Ans: Geometric design of highways deals with the following elements:
Cross-section elements
Sight distance considerations
Horizontal alignment details
Vertical alignment details
Intersection elements
I. Cross-section elements- It includes cross slope, various widths of road (i.e., width of
pavement, formation width and road land width), surface characteristics and features
in the road margins.
II. Sight distance considerations- It the visible land ahead of the driver at horizontal and
vertical curves and at intersections for the safe movements of vehicles.

III. Horizontal alignment- Horizontal curves are introduced to change the direction of
road. It includes features like super elevation, radius of curve, transition curve, extra
widening and setback distance.
IV. Vertical alignment- Its components like gradient, vertical curves (i.e., summit curve
and valley curve) sight distance and design of length of curves.
V. Intersection elements– Proper design of intersection is very much essential for the
safe and efficient traffic movements. Its features like layout, capacity, etc.
8. Design the road hump as per IRC recommendations, with a neat sketch.( Dec 2014/Jan
2015)
Ans: Design the road hump as per IRC recommendations these are round shaped elevated surface
formed across roadways as physical devices to reduce the speed of the vehicles on minor or
secondary or unimportant uncontrolled roads The road humps design may be carried out based
upon the finding of field experiment. They are observed that the ratio of cross sectional area to
width of the road hump is significant for controlling hump cross speed, this is given the equation
9. Distinguish between skid and slip with practical examples. Enumerate the factors
affecting friction of skid resistance. (Dec2013/jan2014, June/July 2015)
Ans: skid occurs when the wheels slide without revolving or rotation or when the wheels partially
revolve i.e., when the path travelled along the road surface is more than the circumferential
movements of the wheels due to their rotation.
Example: when the brakes are applied, the wheels are locked partially or fully and if the vehicle
moves forward, the longitudinal skidding takes place which may vary from 0 to 100% Slip occurs
when a wheel revolves more than the corresponding longitudinal movement along the roads.
Example: slipping usually occurs in the driving wheel of a vehicle when the vehicle rapidly
accelerates from stationary position or from slow speed on pavement surface which is either
slippery or wet or when the road surface is loose with mud or sand.

Various factors that affect friction are:
Type of the pavement (like bituminous, concrete, or gravel),
Condition of the pavement (dry or wet, hot or cold, etc.),
Condition of the tyre (new or old), and
Speed and load of the vehicle
10. Briefly describe the various road margins. (Dec 2014/Jan 2015)
Ans: The various elements included in the road margins are shoulder, guard rail, foot path, drive
way, cycle track, parking lane, bus bay, lay bye, frontage road and embankment slope. Shoulders:
Shoulders are provided on both sides of the pavement all along the road in the case of undivided
carriageway. The minimum shoulder width recommended by the IRC is 2.5m.
Shoulders also act as service lanes for vehicles that are disabled.
Guard rails: Guard rails are provided at the edge of the shoulder when the road is constructed on a
fill so that vehicles are prevented from running off the embankment, especially when the height of
the fill exceeds 3m.
Drive ways: Drive ways connect the highway with commercial establishment like fuel stations,
service station, etc. Drive ways should be properly designed and located fairly away from an
intersection.
Bus bays: Bus bays may be provided by recessing the kerb to avoid conflict with the moving
traffic. Bus bays should be located at least 75 m away from the intersections.
11. Determine the height of crown with respect to edges of road in the following cases:
i) WBM road 3.8 m wide in low rainfall area.
ii) WBM road 7.0 m wide in heavy rainfall area.
iii) Bituminous road 7.5 m in heavy rainfall area (Dec 2014/Jan 2015, June 2015)
Soln:
i) For WBM road in low rainfall area, provide a cross slope of 1 in 40 or 2.5% Rise of crown
wrt edges on a pavement of width 3.8 m= (3.8/2)*(1/40)=0.0475 m
ii) For WBM Road in heavy rainfall area, provide a cross slope of 1 in 33 or 3.0% Rise of
crown wrt edges on a pavement of width 7 m= (7/2)*(1/33)=0.106 m
iii)Bituminous road in heavy rainfall area, provide a cross slope of 1 in 50 or 2% Rise of crown
wrt edges on a pavement of width 7.5 m=(7.5/2)*(1/50)= 0.075 m

UNIT 3
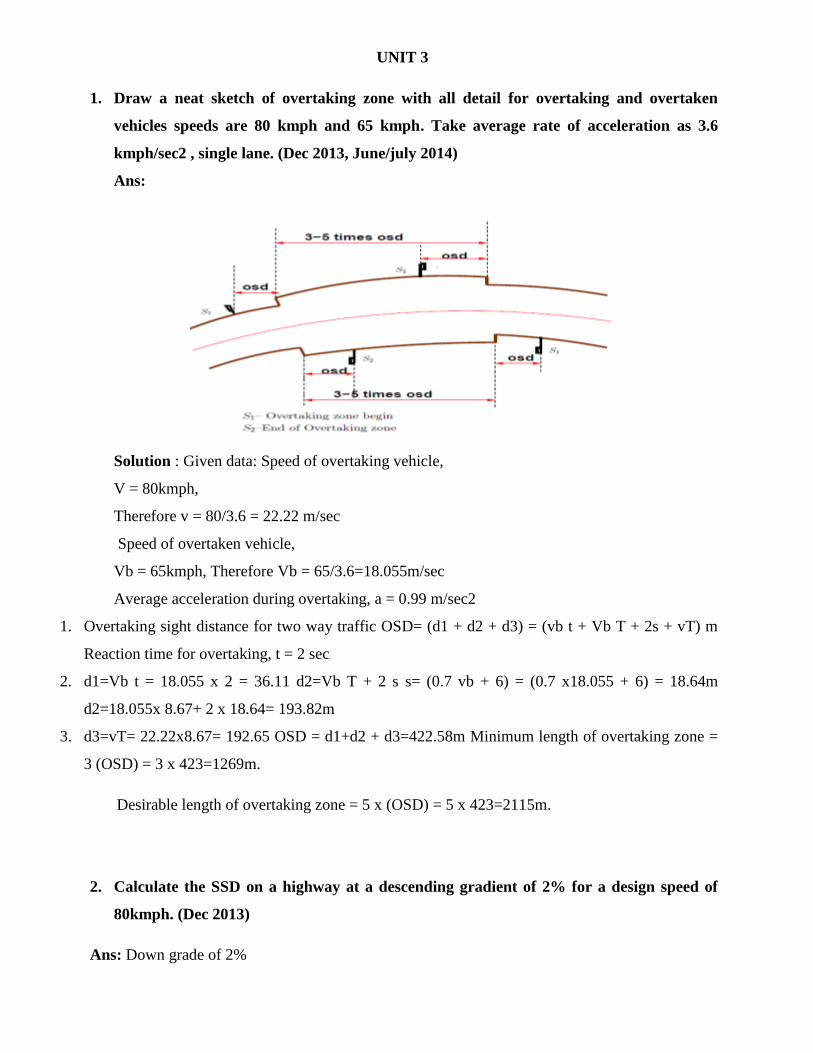
1. Draw a neat sketch of overtaking zone with all detail for overtaking and overtaken
vehicles speeds are 80 kmph and 65 kmph. Take average rate of acceleration as 3.6
kmph/sec2 , single lane. (Dec 2013, June/july 2014)
Ans:
Solution : Given data: Speed of overtaking vehicle,
V = 80kmph,
Therefore v = 80/3.6 = 22.22 m/sec
Speed of overtaken vehicle,
Vb = 65kmph, Therefore Vb = 65/3.6=18.055m/sec
Average acceleration during overtaking, a = 0.99 m/sec2
1. Overtaking sight distance for two way traffic OSD= (d1 + d2 + d3) = (vb t + Vb T + 2s + vT) m
Reaction time for overtaking, t = 2 sec
2. d1=Vb t = 18.055 x 2 = 36.11 d2=Vb T + 2 s s= (0.7 vb + 6) = (0.7 x18.055 + 6) = 18.64m
d2=18.055x 8.67+ 2 x 18.64= 193.82m
3. d3=vT= 22.22x8.67= 192.65 OSD = d1+d2 + d3=422.58m Minimum length of overtaking zone =
3 (OSD) = 3 x 423=1269m.
Desirable length of overtaking zone = 5 x (OSD) = 5 x 423=2115m.
2. Calculate the SSD on a highway at a descending gradient of 2% for a design speed of
80kmph. (Dec 2013)
Ans: Down grade of 2%

3. Explain sight distance and factors causing restriction to sight distance. Give significance
of SSD, ISD and OSD. (Dec 2014)
Ans: Sight distance available from a point is the actual distance along the road surface, over
which a driver from a specified height above the carriage way has visibility of stationary or
moving objects.
Three sight distance situations are considered for design:
Stopping sight distance (SSD) or the absolute minimum sight distance
Intermediate sight distance (ISD) is the defined as twice SSD
Overtaking sight distance (OSD) for safe overtaking operation
Head light sight distance is the distance visible to a driver during night driving under the
illumination of head light
Safe sight distance to enter into an intersection.
Restriction due to overtaking of vehicles
It becomes very difficult for fast moving vehicles to overtake slow moving vehicles

Restriction due to intersection
Significance of SSD At intersections: where two or more roads meet, visibility should be
provided for the drivers approaching the intersection from either side. They should be able to
perceive a hazard and stop the vehicle if required. Stopping sight distance for each road can be
computed from the design speed. The sight distance should be provided such that the drivers
on either side should be able to see each other
Overtaking sight distance The overtaking sight distance is the minimum distance open to
the vision of the driver of a vehicle intending to overtake the slow vehicle ahead safely
against the traffic in the opposite direction. The overtaking sight distance or passing sight
distance is measured along the center line of the road over which a driver with his eye
level 1.2m above the road surface can see the top of an object 1.2 m above the road surface
Stopping sight distance SSD is the minimum sight distance available on a highway at
any spot having sufficient length to enable the driver to stop a vehicle traveling at design
speed, safely without collision with any other obstruction
4. Derive an expression for calculating the overtaking sight distance on the highway (June
2013, Dec2014,June/July 2015)
Ans:

The dynamics of the overtaking operation is given in the figure which is a time-space
diagram. The x-axis denotes the time and y-axis shows the distance traveled by the vehicles.
The trajectory of the slow moving vehicle (B) is shown as a straight line which indicates that
it is traveling at a constant speed. A fast moving vehicle (A) is traveling behind the vehicle B.
The trajectory of the vehicle is shown initially with a steeper slope. The dotted line indicates
the path of the vehicle A if B was absent. The vehicle A slows down to follow the vehicle B
as shown in the figure with same slope from t0 to t1. Then it overtakes the vehicle B and
occupies the left lane at time t3. The time duration T = t3 to t1 is the actual duration of the
overtaking operation. The snapshots of the road at time t0; t1, and t3 are shown on the left
side of the figure. From the Figure the overtaking sight distance consists of three parts.
D1 the distance traveled by overtaking vehicle A during the reaction time t = t1 –t0
D2 the distance traveled by the vehicle during the actual overtaking operation T = t3 –
t1
D3 is the distance traveled by on-coming vehicle C during the overtaking operation
(T).
It is assumed that the vehicle A is forced to reduce its speed to Vb the speed of the
slow moving vehicle B and travels behind it during the reaction time t of the driver. So
d1 is given by:
Then the vehicle A starts to accelerate, shifts the lane, overtake and shift back to the
original lane. The vehicle A maintains the spacing s before and after overtaking. The
spacing s in m is given by:
Let T be the duration of actual overtaking. The distance traveled by B during the
overtaking operation is 2s+ Vb T. Also, during this time, vehicle A accelerated from
initial velocity Vb and overtaking is completed while reaching final velocity v. Hence
the distance traveled is given by:

The distance traveled by the vehicle C moving at design speed v m/sec during
overtaking operation is given by
The overtaking sight distance is
Where
vb is the velocity of the slow moving vehicle in m/sec,
t the reaction time of the driver in sec,
s is the spacing between the two vehicles in m given by equation
a is the overtaking vehicles acceleration in m/sec
In case the speed of the overtaken vehicle is not given, it can be assumed that it moves 16 kmph
slower the design speed.
The acceleration values of the fast vehicle depends on its speed and given in Table below

On divided highways, d3 need not be considered
On divided highways with four or more lanes, IRC suggests that it is not necessary to provide the
OSD, but only SSD is sufficient.
5. What are the factors on which the SSD depends? Explain the reaction time of the driver.
(Dec 2013
Ans: The computation of sight distance depends on: Reaction time of the driver Reaction time of
a driver is the time taken from the instant the object is visible to the driver to the instant when the
brakes are applied. The total reaction time may be split up into four components based on PIEV
theory. In practice, all these times are usually combined into a total perception-reaction time
suitable for design purposes as well as for easy measurement. Many of the studies show that
drivers require about 1.5 to 2 secs under normal conditions. However, taking into consideration
the variability of driver characteristics, a higher value is normally used in design. For example,
IRC suggests a reaction time of 2.5 secs.
Speed of the vehicle The speed of the vehicle very much affects the sight distance. Higher the
speed, more time will be required to stop the vehicle. Hence it is evident that, as the speed
increases, sight distance also increases.
Efficiency of brakes The efficiency of the brakes depends upon the age of the vehicle, vehicle
characteristics etc. If the brake efficiency is 100%, the vehicle will stop the moment the brakes
are applied. But practically, it is not possible to achieve 100% brake efficiency. Therefore the
sight distance required will be more when the efficiency of brakes are less. Also for safe
geometric design, we assume that the vehicles have only 50% brake efficiency.
Frictional resistance between the tyre and the road The frictional resistance between the
tyre and road plays an important role to bring the vehicle to stop. When the frictional resistance
is more, the vehicles stop immediately. Thus sight required will be less. No separate provision
for brake efficiency is provided while computing the sight distance. This is taken into account
along with the factor of longitudinal friction. IRC has specified the value of longitudinal
friction in between 0.35 to 0.4.
Gradient of the road. Gradient of the road also affects the sight distance. While climbing up
a gradient, the vehicle can stop immediately. Therefore sight distance required is less. While
descending a gradient, gravity also comes into action and more time will be required to stop the
vehicle. Sight distance required will be more in this case.

6. Find the safe overtaking sight distance for a design speed of 96 kmph. Assume all the
required data as per IRC (Dec 2013, Dec 2014)
Ans: Given :
design speed, V =96 kmph
Assume speed of overtaken vehicle, Vb = V - 16 = 80 kmph,
Reaction time for overtaking, t = 2 sec
Acceleration, a = 2.5 kmph/sec (from Table 4.8)
d1= 0.28 Vb t ‘=0.28 x 80 x 2 = 44.8 m
d2 = (0.28 Vb T + 2 s) = s= (0.2 Vb + 6) = 0.2 x 80 + 6 = 22 m
d2 = 0.28 x 80 x 11.3 + 2 x22 -=297 m
d3 = 0.28 VT = 0.28 x96 x 11.3 = 303.7 m
OSD on one-way traffic road = d1+ d2 = 341.8 m, say 342 m
OSD on two-way traffic road = d1 + d2 + d3 = 645.5 m, say 646 m
7. Derive the expression for SSD for ascending, descending gradient and level surface
(June/july 2014) (Or) 8. What is stopping sight distance? List out the factors affecting
SSD. Derive the expression for finding SSD on a road with a down gradient of — n%.(
dec2013/jan2014)
Ans: The stopping sight distance is the sum of lag distance and the braking distance. Level
surface Lag distance is the distance the vehicle traveled during the reaction time t and is given by
vt,
Where v is the velocity in m/sec.
Braking distanceis the distance traveled by the vehicle during braking operation. For a level road
this is obtained by equating the work done in stopping the vehicle and the kinetic energy of the
vehicle. If F is the maximum frictional force developed and the braking distance is l, then work
done against friction in stopping the vehicle is
Fl = fWl where W is the total weight of the vehicle.
The kinetic energy at the design speed is

Therefore, the SSD = lag distance + braking distance and given by:
Ascending, descending gradient when there is a ascending gradient of + n% the component of
gravity adds to the braking action and hence the braking distance decreased. The component of
gravity acting parallel to the surface which adds to the braking force is equal to surface which
adds to the braking force is equal to W sin α = W tanα = Wn=100. Equating kinetic energy and
work done:
Similarly the braking distance can be derived for a descending gradient. Therefore the general
equation is given by Equation
8. The speeds of overtaking & overtaken vehicles are 96 kmph and 80 kmph respectively, on a
two way traffic road. If the acceleration of overtaking vehicle is 2.5 kmph/sec calculate the
safe overtaking sight distance (OSD) sketch the overtaking zone( dec2013/jan2014)
Ans: Given :
design speed,V =96 kmph
Assume speed of overtaken vehicle, Vb = V - 16 = 80 kmph,

Reaction time for overtaking,
t = 2 sec Acceleration, a = 2.5 kmph/sec (from Table 4.8)
d1= 0.28 Vb t ‘=0.28 x 80 x 2 = 44.8 m d2 = (0.28 Vb T + 2 s) = s= (0.2 Vb + 6) = 0.2 x 80 + 6 =
22 m
d2 = 0.28 x 80 x 11.3 + 2 x22 -=297 m
d3 = 0.28 VT = 0.28 x96 x 11.3 = 303.7 m
OSD on one-way traffic road = d1+ d2 = 341.8 m, say 342 m
OSD on two-way traffic road = d1 + d2 + d3 = 645.5 m, say 646 m
10. With sketches indicate the circumstances in which sight distance is affected. Describe
how the sight distance required at an uncontrolled intersection is estimated? (Dec
2014/Jan 2015)
Ans: The circumstances in which sight distances are affected are:
I. At horizontal curves when the line of sight is obstructed by objects at the inner side of the
curve as shown in the figure. Here the sight distance is measured along the centre line of
the horizontal curve when the vehicle driver is able to see another vehicle or object on the
carriageway.
II. At vertical curve the line of sight is obstructed by the road surface of the summit curve
(i.e, a vertical curve of the road with convexity upwards)
III. In this case also the sight distance is measured along the centre line of the vertical curve
when the vehicle driver is able to see another vehicle or object on the road.
IV. At an uncontrolled intersection when a driver from one of the approach roads is able to
sight a vehicle from another approach road proceeding towards the intersection
Here the sight distance for each vehicle driver is the distance from the position when the two
can see each other upto the intersection point of the two roads.
Sight Distance at uncontrolled intersection: The design of sight distance at intersections may
be based on 3 possible conditions namely
Enabling the approaching vehicle to change speed
Enabling approaching vehicle to stop
Enabling stopped vehicle to cross a main road

i) Enabling the approaching vehicle to change speed: The sight distance
should be sufficient to enable either one or both the approaching vehicles to
change speed to avoid collision. The vehicle approaching from the minor road
should slow down. The total reaction time required for the driver to decide to
change speed may be assumed as 2 seconds and atleast 1 more second will be
needed for making the change in speed.
ii) Enabling approaching vehicle to stop: The distances for the approaching
vehicle should be sufficient to bring either 1 or both of the vehicles to a stop
before reaching a point of collision. Hence the two sides AC and BC of the
sight triangle should each be equal to the SSD.
iii) Enabling stopped vehicle to cross a main road: This is applicable when the
vehicles entering the intersection from the minor road are controlled by stop
sign and so these vehicles have to stop and then proceed to cross the main
road.

11. Calculate the overtaking sight distance as per AASHTO practice for a design speed of
100 kmph making suitable assumptions. Also calculate the OSD as per IRC practice.
(Dec 2014/Jan 2015, June 2015)
Soln: Given
Design speed V=100 kmph
Assume speed of overtaken vehicle, Vb=V-16=100-16=84 kmph
Reaction time for overtaking, t= 2 secs
Acceleration A= 1.92 kmph/sec
d1=0.28 Vbt=0.28*84*2=47.04 m
d2=0.28VbT + 2s s=(0.2Vb+6)=((0.2*84)+6=22.8 m
T=sqrt((14.4s)/A)=sqrt((14.4*22.8)/1.92)=13.08 sec
d2=(0.28*84*13.08)+(2*22.8)=353.24 m
d3=0.28VT=0.28*100*13.08=366.24 m
OSD on a two way traffic=d 1+d 2+d 3=47.04+353.24+366.24=766.52 m
12. Explain PIEV theory.(June 2015)
Ans: According to PIEV theory the total reaction time of the driver is split into 4 parts namely
time taken by the driver for
i) Perception
ii) Intellection
iii) Emotion
iv) Volition
Perception Time is the time required for the sensations received by the eyes or ears of the driver to be
transmitted to the brain through the nervous system and spinal cord.
Intellection time is the time required for the driver to understand the situation.
Emotion time is the time elapsed during emotional sensations and other mental disturbance such as
fear, anger or any other emotional feelings like superstition. Etc, with reference to the situation.
Volition time is the time taken by the driver for the final action such as brake application
UNIT 4
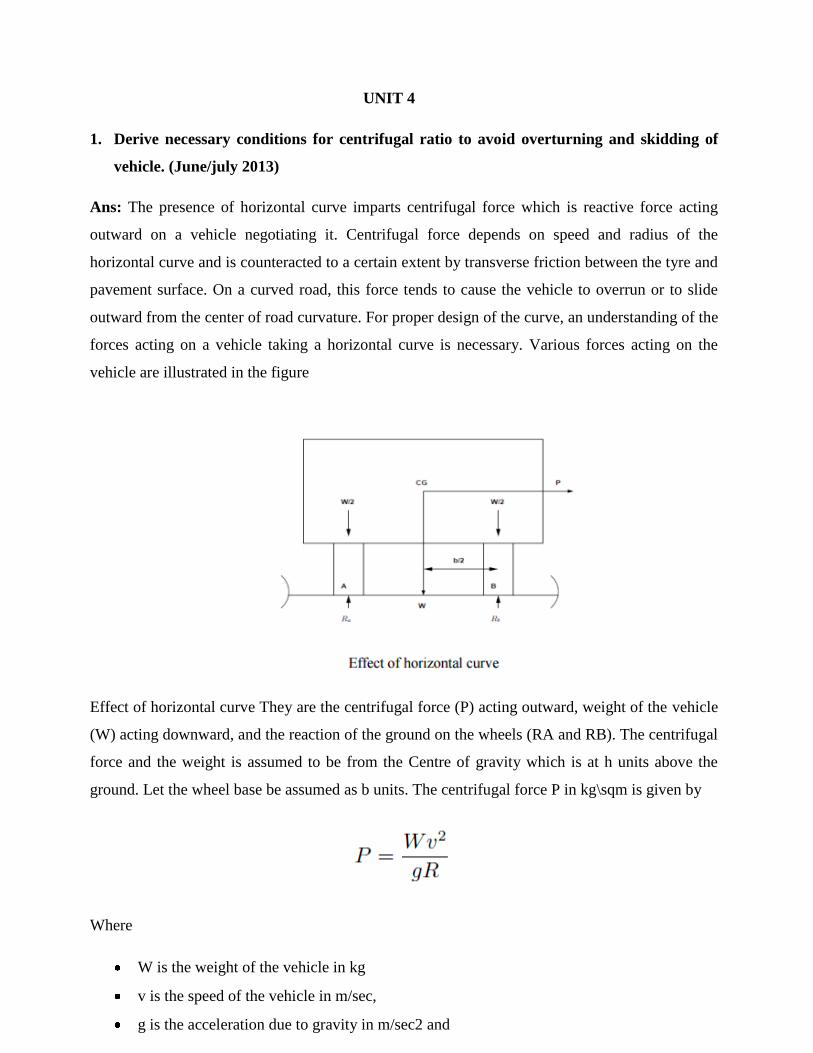
1. Derive necessary conditions for centrifugal ratio to avoid overturning and skidding of
vehicle. (June/july 2013)
Ans: The presence of horizontal curve imparts centrifugal force which is reactive force acting
outward on a vehicle negotiating it. Centrifugal force depends on speed and radius of the
horizontal curve and is counteracted to a certain extent by transverse friction between the tyre and
pavement surface. On a curved road, this force tends to cause the vehicle to overrun or to slide
outward from the center of road curvature. For proper design of the curve, an understanding of the
forces acting on a vehicle taking a horizontal curve is necessary. Various forces acting on the
vehicle are illustrated in the figure
Effect of horizontal curve They are the centrifugal force (P) acting outward, weight of the vehicle
(W) acting downward, and the reaction of the ground on the wheels (RA and RB). The centrifugal
force and the weight is assumed to be from the Centre of gravity which is at h units above the
ground. Let the wheel base be assumed as b units. The centrifugal force P in kg\sqm is given by
Where
W is the weight of the vehicle in kg
v is the speed of the vehicle in m/sec,
g is the acceleration due to gravity in m/sec2 and

R is the radius of the curve in m.
The centrifugal ratio or the impact factor P\W is given by
The centrifugal force has two effects: A tendency to overturn the vehicle about the outer wheels
and a tendency for transverse skidding. Taking moments of the forces with respect to the outer
wheel when the vehicle is just about to override
At the equilibrium over turning is possible when
And for safety the following condition must satisfy:
The second tendency of the vehicle is for transverse skidding. i.e. when the centrifugal force P is
greater than the maximum possible transverse skid resistance due to friction between the
pavement surface and tyre. The transverse skid resistance (F) is given by:

This is counteracted by the centrifugal force (P), and equating:
At equilibrium, when skidding takes place
And for safety the following condition must satisfy
Equation (1) and (2) give the stable condition for design. If equation (1) is violated, the vehicles
will overturn at the horizontal curve and if equation (2) is violated, the vehicle will skid at the
horizontal curve.
2. Write a note on maximum and minimum super elevations (Dec 2013)
Ans: Maximum and minimum super-elevation Depends on (a) slow moving vehicle and (b) heavy
loaded trucks with high CG. IRC specifies a maximum super-elevation of 7 percent for plain and
rolling terrain, while that of hilly terrain is 10 percent and urban road is 4 percent. The minimum
super elevation is 2-4 percent for drainage purpose, especially for large radius of the horizontal
curve

3. Derive expression for super elevation (May/ june 2014)
Ans: Super-elevation or cant or banking is the transverse slope provided at horizontal curve to
counteract the centrifugal force, by raising the outer edge of the pavement with respect to the
inner edge, throughout the length of the horizontal curve. When the outer edge is raised, a
component of the curve weight will be complimented in counteracting the effect of centrifugal
force. In order to find out how much this raising should be, the following analysis may be done.
The forces acting on a vehicle while taking a horizontal curve with super elevation is shown in
figure below
Forces acting on a vehicle on horizontal curve of radius R m at a speed of v m\sec2 are:
P the centrifugal force acting horizontally out-wards through the center of gravity,
W the weight of the vehicle acting down-wards through the center of gravity, and
F the friction force between the wheels and the pavement, along the surface inward.
At equilibrium, by resolving the forces parallel to the surface of the pavement we get
where W is the weight of the vehicle, P is the centrifugal force, f is the coefficient of friction,
θ is the transverse slope due to super elevation. Dividing by W cos θ, we get

We have already derived an expression for P/W.By substituting this in equation above, we get
This is an exact expression for super elevation. But normally, f=0.15 and θ< 40 , 1-f tanθ and
for small θ, tanθ approximately equal to sinθ=E\B=e, then the above equation becomes
Three specific cases that can arise from equation above are as follows
If there is no friction due to some practical reasons, then f = 0 and equation becomes
This result in the situation where the pressure on the outer and inner wheels are same;
requiring very high super-elevation e.

If there is no super-elevation provided due to some practical reasons, then e = 0 and
equation becomes
This results in a very high coefficient of friction
If e = 0 and f = 0:15 then for safe traveling speed from equation is given by
Where vb is the restricted speed
4. What are the objectives of providing extra widening of pavements on horizontal curves?
Derive an expression for the same. (Dec 2014/Jan 2015, June 2015)
Ans: Extra widening refers to the additional width of carriageway that is required on a curved
section of a road over and above that required on a straight alignment. This widening is done due
to two reasons: the first and most important is the additional width required for a vehicle taking a
horizontal curve and the second is due to the tendency of the drivers to ply away from the edge of
the carriageway as they drive on a curve. The first is referred as the mechanical widening and the
second is called the psychological widening. These are discussed in detail below.
Mechanical widening The reasons for the mechanical widening are: When a vehicle negotiates a
horizontal curve, the rear wheels follow a path of shorter radius than the front wheels as shown in
figure 15.5. This phenomenon is called off-tracking, and has the effect of increasing the effective
width of a road space required by the vehicle. Therefore, to provide the same clearance between
vehicles traveling in opposite direction on curved roads as is provided on straight sections, there must
be extra width of carriageway available. This is an important factor when high proportions of vehicles
are using the road. Trailer trucks also need extra carriageway, depending on the type of joint. In
addition speeds higher than the design speed causes transverse skidding which requires additional
width for safety purpose. The expression for extra width can be derived from the simple geometry of a
vehicle at a horizontal curve as shown in figure. Let R1 is the radius of the outer track line of the rear
wheel, R2 is the radius of the outer track line of the front wheel l is the distance between the front and
rear wheel, n is the number of lanes, then the mechanical widening Wm(refer figure) is derived below:

Therefore the widening needed for a single lane road is:
If the road has n lanes, the extra widening should be provided on each lane. Therefore, the extra
widening of a road with n lanes is given by,
Please note that for large radius, R2 is nearly equal R, which is the mean radius of the curve, and then
Wm is given by
Psychological widening Widening of pavements has to be done for some psychological reasons also.
There is a tendency for the drivers to drive close to the edges of the pavement on curves. Some extra
space is to be provided for more clearance for the crossing and overtaking operations on curves. IRC
proposed an empirical relation for the psychological widening at horizontal curves Wps

Therefore, the total widening needed at a horizontal curve We is:
5. Design all the geometric features of a horizontal curve for a state highway passing
through rolling terrain, assuming all the data as per IRC for a ruling minimum radius.
Also, specify the minimum setback distance for a sight distance of 255 mts.(Dec
2013,June 2015)
Ans:
The various geometric elements of the horizontal curve to be designed are'
a. Ruling minimum radius, Ruling
b. Superelevation rate, e
c. Extra widening of pavement, We
d. Length of transition curve, Ls
e. ISD and set-back distance,
assuming Lc greater than S
(a) Ruling minimum radius of curve Ruling design speed of SH on rolling terrain, V = 80 kmph:
Rruling=V 2 /127 (e + f) =802 /127(0.07 + 0.15) = 229 m=, say 230
(b) Design of super elevation, e (for mixed traffic): E=V2 /225R=802 /225R=0.124
As the value of 0.124 is higher than the maximum superelevationi limit the value of e to 0.07.
The curve should be safe for the full spec kmph as the ruling minimum radius has been adopted.
However cl transverse skid resistance developed:
f= V2 /127R=0.149 As this value of lateral friction coefficient, f developed is less than 0.15, the
superelevation design of 0.07 is safe.

(C) Extra widening of Pavement Assume two lane pavement, i.e., W =7.0 m,
Number of lanes, n =2 and wheel base, l=6m
Extra widening of pavement,
=0.157+0.555=0.712 Provide an extra width of 0.71 m and a total,
width of pavement B = W + We=7.0+70.71 =7.71 m
4. Length of transition curve, Ls
Transition curve length, Lsis to be designed considering (i) rate of change of centrifugal acceleration
(C) (ii) rate of introduction of the amount of superelevation E and (iii) minimum length formula; the
highest of three values is adopted at the design length Ls. Design of Lsbased on rate of change of
centrifugal acceleration, C Rate of change of centrifugal acceleration,
As this value of C is within the range 0.5 to 0.8, the value is acceptable for design Length of transition
curve,
Total amount of superelevation, E i.e., the raising of the outer edge of the pavement with respect to
inner edge = B* e=7.71 x 0.07 = 0.54 m. As the terrain is rolling, assume the pavement to be rotated
about the centre at a rate of 1 in 150,
Minimum value of Ls as per IRC is given by;
Adopting the highest of the three values, design length of transition curve = 92 m. (e) ISD and Set-
back distance Intermediate Sight Distance, ISD= 2 SSD Refer Fig. 4.30. The length of circular curve,
Lc is assumed greater than the sight distance S. the minimum clearance or set-back distance needed,
m=CF and half the central angle α/2= angle AOF.

The distance, d between the centre line of the pavement and the centre M inside lane may be taken as
one-fourth the width of pavement at the curve A two-lane pavement) = 7.71/4 = 1.93 m Set-back
distance m' = R - (R - d) cos (α/2) = 230 - (230 -1.93) cos320 =36.6 m, say 37 m
5. While aligning a highway in a built up area, it was necessary to provide a horizontal curve of
radius 325 meter. Design the following geometric features. I) Super elevation ii) Extra widening
of pavement iii) length of transition curve Data available are design speed = 65 kmph, length of
wheel base of largest truck = 6 pavement width = 10.5m. (June/july 2013)
Ans: Given:
Radius of curve, R = 325 m,
Design speed, V = 65 kmph,
Length of wheel base l = 6.0 m,
Pavement width, W= 10.5
(i) Superelevation rate, e from practical considerations of mixed traffic conditions, superelevation to
fully counteract centrifugal force should be designed with 75% of design speed. E=V2
/225R=652 /225*325=0.058
As this value is less than 0.07, it is safe for the design speed. Therefore provide a superelevation rate, e =
0.058.
(ii) Extra widening of pavement, We As the pavement width is 10.5 m, number of lanes, n = 3
(iii) Length of transition curve, Ls, By rate of change of centrifugal acceleration: Allowable rate of
change of centrifugal acceleration C is given by:
c) By rate of introduction of superelevation, E: Total superelevation, E = B x e.
Total pavement width including extra widening on curve,
B = W + We=10.5+0.55= 11.05 m = 0.058= 11.05 x 0.058 = 0.64 m

Superelevation rate, e=0.058
Total superelevation, E=11.05*0.058=0.64
Assuming that superelevation is provided by rotating about the centre line5>the total superelevation to
be distributed along the length of transition curve = E/2. The rate of introduction of superelevation may
be taken as 1 in 100, being built up area. Length of transition curve
6. There is a horizontal highway curve of radius 400m and length 200m on this highway.
Compute the setback distance required from the centre line on inner side of curve so as to
provide for safe overtaking distance of 300m. The distance between the centerline of road
and inner lane is 1.9 m. (June/july 2014)
Ans: Osd= 300m
R=400m
Lc=200m
d=1.9m
The osd of 300m > than circular curve length which is 200m. Hence the required set back distance is CF=
(CG+GF)
7. A national highway passing through rolling terrain in heavy rainfall area has a horizontal
curve of radius 500 m. Design the length of transition curve. Assume data suitably. (June
2014, Dec 2014/Jan 2015)

Ans: Assume V=80kmph, W=7.0m
1. Length of transition curve, Ls, by rate of change of centrifugal acceleration
Allowable rate of change of centrifugal acceleration C is given by:
As this value of C is between 0.5 and 0.8, accepted for design.
8. What is superelevation? With the aid of sketches, explain how super-elevation is introduced on a
horizontal curve in the field(Dec 2013/jan2014)
Ans: While designing the various elements of the road like superelevation, we design it for a particular
vehicle called design vehicle which has some standard weight and dimensions. But in the
actual case, the road has to cater for mixed traffic. Different vehicles with different
dimensions and varying speeds ply on the road. For example, in the case of a heavily
loaded truck with high centre of gravity and low speed, superelevation should be less;
otherwise chances of toppling are more. Taking into practical considerations of all such
situations, IRC has given some guidelines about the maximum and minimum
superelevation etc. These are all discussed in detail in the following sections.
Design of super-elevation
For fast moving vehicles, providing higher superelevation without considering coefficient of friction is
safe, i.e. centrifugal force is fully counteracted by the weight of the vehicle or superelevation. For slow
moving vehicles, providing lower superelevation considering coefficient of friction is safe, i.e.
Centrifugal force is counteracted by superelevation and coefficient of friction. IRC suggests following
design procedure
Step 1: Find e for 75 percent of design speed, neglecting f, i.e.
Step 3: Find f1 for the design speed and max e, i.e.
If f1< 0:15, then the maximum e = 0:07 is safe for the design speed, else go to step 4.
Step 4: Find the allowable speed va for the maximum e = 0:07 and f = 0:15,
If va ≥ v design is adequate, otherwise use speeds adopt control measures or look for speed control
measures.
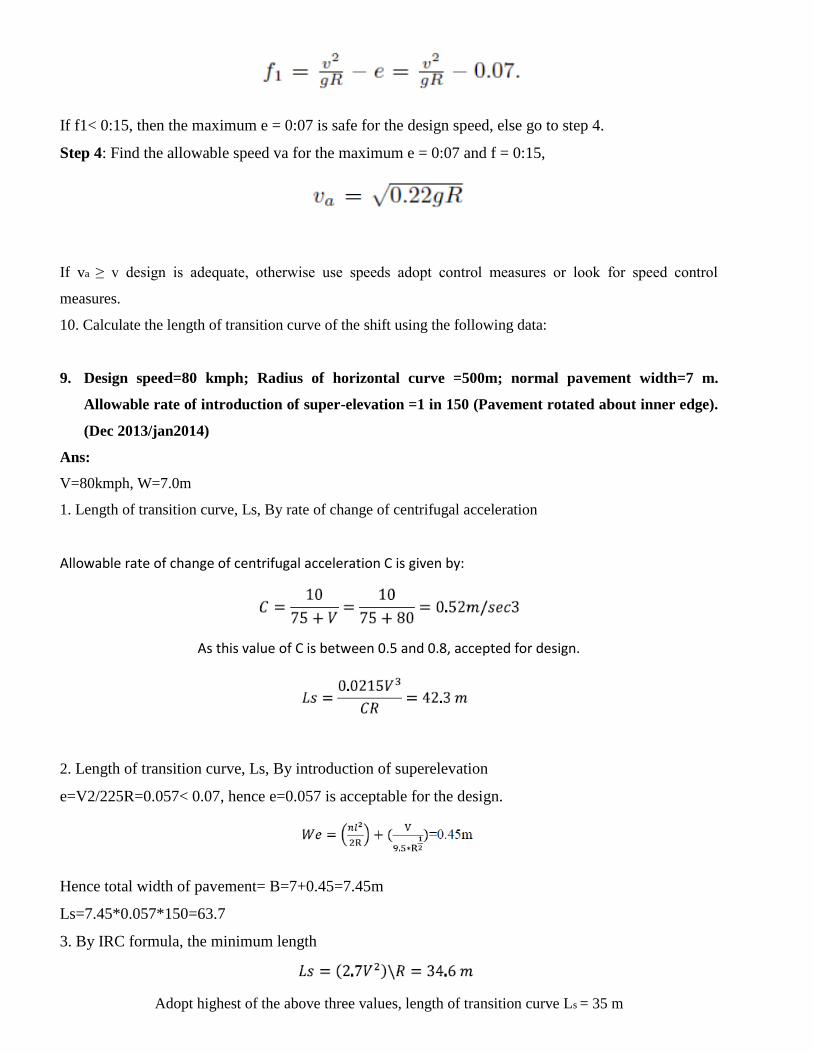
10. Calculate the length of transition curve of the shift using the following data:
9. Design speed=80 kmph; Radius of horizontal curve =500m; normal pavement width=7 m.
Allowable rate of introduction of super-elevation =1 in 150 (Pavement rotated about inner edge).
(Dec 2013/jan2014)
Ans:
V=80kmph, W=7.0m
1. Length of transition curve, Ls, By rate of change of centrifugal acceleration
Allowable rate of change of centrifugal acceleration C is given by:
As this value of C is between 0.5 and 0.8, accepted for design.
2. Length of transition curve, Ls, By introduction of superelevation
e=V2/225R=0.057< 0.07, hence e=0.057 is acceptable for the design.
Hence total width of pavement= B=7+0.45=7.45m
Ls=7.45*0.057*150=63.7
3. By IRC formula, the minimum length
Adopt highest of the above three values, length of transition curve Ls = 35 m

10. A 6 lane divided highway has a curve 1000m long and radius of 500m. The safe SSD is 200m.
Calculate the minimum setback distance from inner edge of the curve to the inner edge of a
building to ensure safe visibility. The width of pavement per lane is 3.5 m.(Dec 2014/Jan
2015)
Soln:Here S<L
m = R-(R-p/2)cosα/2
α/2= (180*200)/(2π(R-((3.5*2)+(3.5/2))=11.66 0
m=500-(500-(3.5*2)-(3.5/2)cos 11.660=500-491.25 cos11.660=18.89 m
Distance from inner edge to obstruction = 18.89-(3.5*3)=8.39 m
11. A 2 lane NH passing through plain terrain has horizontal curve of radius 400 m. The design
speed is 100 kmph. Design the length of transition curve. (Dec 2014/Jan2015)
Soln: Given W=7 m
Design speed V=100 kmph
C=80/(75+V)=80/(75+100)=0.45< 0.5
Hence C=0.5
a) Length of transition curve by rate of change of centrifugal acceleration:
Ls=0.0215V3/CR=(0.0215*1003)/(0.5*400)=107.5m
b) Length of transition curve by rate of introduction of superelevation:
e = V2/225R=1002/(225*400)=0.111>0.07
e = 0.07
c) Extra widening at curve (assuming two lanes and wheel base of 6 m)
We=(nl2/2R)+(V/9.5 √R)= (2*62/2*400)+100/9.5*√400=0.616 m
Total width of pavement=B=7+0.616=7.616 m
d) Length of transition curve based on rate of introduction of superelevation at a rate of 1 in 150
Ls=7.616*0.07*150=79.968 m
e) Length of transition curve as per IRC formula:
Ls= 2.7V2/R=2.7*1002/400=67.5 m
Highest value of Ls is Considered Ls=107.5 m=115 m Minimum length as per IRC)

UNIT 5
1. Explain the following with IRC specification: i) Ruling gradient ii) Limiting gradient ii)
Exceptional gradient IV) Minimum gradient. ( Dec 2013/Jan 2014, June 2015)
(Or)
2. Define a gradient; explain in detail the different gradients adopted on a highway with
specifications as per IRC (Dec 2014)
Ans:
Ruling gradient
The ruling gradient or the design gradient is the maximum gradient with which the designer attempts
to design the vertical profile of the road. This depends on the terrain, length of the grade, speed,
pulling power of the vehicle and the presence of the horizontal curve. In flatter terrain, it may be
possible to provide at gradients, but in hilly terrain it is not economical and sometimes not possible
also. The ruling gradient is adopted by the designer by considering a particular speed as the design
speed and for a design vehicle with standard dimensions. But our country has a heterogeneous traffic and
hence it is not possible to lay down precise standards for the country as a whole. Hence IRC has
recommended some values for ruling gradient for different types of terrain
Limiting gradient
This gradient is adopted when the ruling gradient results in enormous increase in cost of construction.
On rolling terrain and hilly terrain it may be frequently necessary to adopt limiting gradient. But the
length of the limiting gradient stretches should be limited and must be sandwiched by either straight
roads or easier grades.
Exceptional gradient
Exceptional gradient are very steeper gradients given at unavoidable situations. They should be limited
for short stretches not exceeding about 100 meters at a stretch. In mountainous and steep terrain,
successive exceptional gradients must be separated by a minimum 100 meter length gentler gradient.
At hairpin bends, the gradient is restricted to 2.5%
Minimum gradient
This is important only at locations where surface drainage is important. Camber will take care of the
lateral drainage. But the longitudinal drainage along the side drains requires some slope for smooth
flow of water. Therefore minimum gradient is provided for drainage purpose and it depends on the
rain fall, type of soil and other site conditions. A minimum of 1 in 500 may be sufficient for concrete
drain and 1 in 200 for open soil drains are found to give satisfactory performance.

3. A valley curve is formed by descending grade of 1 in 25 meeting an ascending grade of 1 in
30. Design the length of valley curve to fulfill both comfort condition and head light sight
distance requirements for a design speed of 80 kmph. Assume c = 0.6 m/sec. (Dec 2013/Jan
2014,June 2015)
Ans:
Sight distance
SSD = v*t + v2/2gf= = 22.22*2.5 + 22.222/2*9.81*.35 = 127m
N= -.058
Comfort condition Highway
Ls = ( NV3/c)* 2 = 73.1m
Case 1: Length of valley curve greater than stopping sight distance (L > S)
L = NS2/ (1.5+ 0.035S) = 199.5m
4. Explain how the length of valley curve is designed. (Dec 2014/Jan 2015)
Ans: Length of the valley curve
The valley curve is made fully transitional by providing two similar transition curves of equal length The
transitional curve is set out by a cubic parabola y = bx3 where b = 2N/3L2 The length of the valley
transition curve is designed based on two criteria:
I. Comfort criteria: that are allowable rate of change of centrifugal acceleration is limited to a
comfortable level of about 0:6m\sec3.
II. Safety criteria: That are the driver should have adequate headlight sight distance at any part of
the country.
Comfort criteria
The length of the valley curve based on the rate of change of centrifugal acceleration that will ensure
comfort: Let c is the rate of change of acceleration, R the minimum radius of the curve, v is the design
speed and t is the time, then c is given as
For a cubic parabola, the value of R for length Ls is given by:
Therefore,

Where L is the total length of valley curve, N is the deviation angle in radians or tangent of the
deviation angle or the algebraic difference in grades, and c is the allowable rate of change of
centrifugal acceleration which may be taken as 0.6m\sec3.
Safety criteria
Length of the valley curve for headlight distance may be determined for two conditions: (1) length of
the valley curve greater than stopping sight distance and (2) length of the valley curve less than the
stopping sight distance.
Case 1 Length of valley curve greater than stopping sight distance (L > S)
The total length of valley curve L is greater than the stopping sight distance SSD. The sight distance
available will be minimum when the vehicle is in the lowest point in the valley. This is because the
beginning of the curve will have in infinite radius and the bottom of the curve will have minimum
radius which is a property of the transition curve. The case is shown in figure below. From the
geometry of the figure, we have
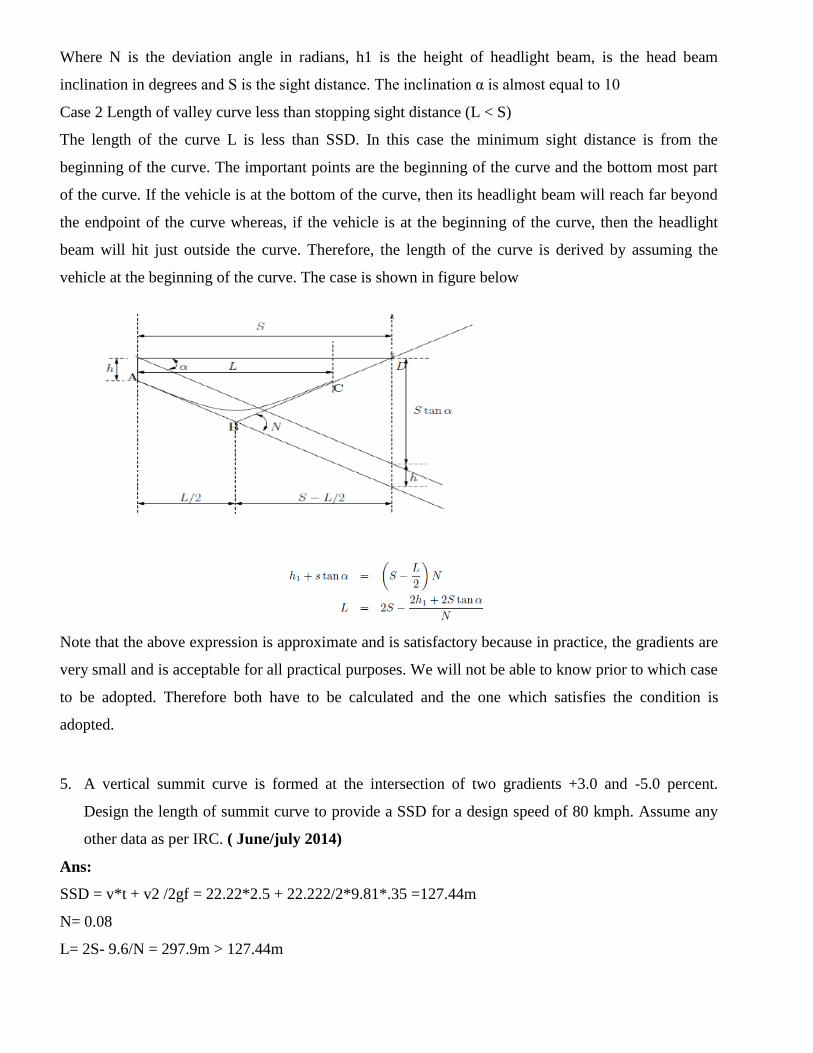
Where N is the deviation angle in radians, h1 is the height of headlight beam, is the head beam
inclination in degrees and S is the sight distance. The inclination α is almost equal to 10
Case 2 Length of valley curve less than stopping sight distance (L < S)
The length of the curve L is less than SSD. In this case the minimum sight distance is from the
beginning of the curve. The important points are the beginning of the curve and the bottom most part
of the curve. If the vehicle is at the bottom of the curve, then its headlight beam will reach far beyond
the endpoint of the curve whereas, if the vehicle is at the beginning of the curve, then the headlight
beam will hit just outside the curve. Therefore, the length of the curve is derived by assuming the
vehicle at the beginning of the curve. The case is shown in figure below
Note that the above expression is approximate and is satisfactory because in practice, the gradients are
very small and is acceptable for all practical purposes. We will not be able to know prior to which case
to be adopted. Therefore both have to be calculated and the one which satisfies the condition is
adopted.
5. A vertical summit curve is formed at the intersection of two gradients +3.0 and -5.0 percent.
Design the length of summit curve to provide a SSD for a design speed of 80 kmph. Assume any
other data as per IRC. ( June/july 2014)
Ans:
SSD = v*t + v2 /2gf = 22.22*2.5 + 22.222/2*9.81*.35 =127.44m
N= 0.08
L= 2S- 9.6/N = 297.9m > 127.44m

6. Explain the different cases of finding the length of summit curve for varying SSD and OSD
(May/ June 2013)
Ans: The important design aspect of the summit curve is the determination of the length of the curve
which is parabolic. As noted earlier, the length of the curve is guided by the sight distance
consideration. That is, a driver should be able to stop his vehicle safely if there is an obstruction on the
other side of the road. Equation of the parabola is given by y = ax2, where a = N \2L, where N is the
deviation angle and L is the length of the In deriving the length of the curve, two situations can arise
depending on the uphill and downhill gradients when the length of the curve is greater than the sight
distance and the length of the curve is greater than the sight distance.
Let L is the length of the summit curve, S is the SSD/ISD/OSD, N is the deviation angle, h1 driver's
eye height (1.2 m), and h2 the height of the obstruction, then the length of the summit curve can be
derived for the following two cases. The length of the summit curve can be derived from the simple
geometry as shown below:
Case a. Length of summit curve greater than sight distance (L > S)
The situation when the sight distance is less than the length of the curve is shown in figure above

Case b. Length of summit curve less than sight distance
The second case is illustrated in figure above
From the basic geometry, one can write
Therefore for a given L, h1 and h2 to get minimum S, differentiate the above equation with respect to
h1 and equate it to zero. Therefore,
Solving the quadratic equation for n1,
Now we can substitute n back to get the value of minimum value of L for a given n1, n2, h1 and h2.
Therefore

When stopping sight distance is considered the height of driver's eye above the road surface (h1) is
taken as 1.2 metres, and height of object above the pavement surface (h2) is taken as 0.15 metres. If
overtaking sight distance is considered, then the value of driver's eye height (h1) and the height of the
obstruction (h2) are taken equal as 1.2 metres.
7. An ascending gradient of 1 in 100 and a descending gradient of 1 in 120 meet at a point. Design a
summit curve for a speed of 80 kmph so as to have an OSD of 420 m. 25 meeting an ascending
grade. ( May/ June 2014, Dec 2014/Jan 2015)
Ans:
SSD = v*t + v2/2gf= 22.22*2.5 + (22.222/2*9.81*.35) =127.44m
N= 0.018
L= 2S- 9.6/N = 422m < OSD
L< OSD

L = 2S- 9.6/N = 2*420 – 9.6/.018 = 306.67m, The length of summit curve is 306.67m
8. What are the circumstances in which a valley curve is formed? Indicate with sketches. (Dec
2014/Jan 2015)
Ans: Valley curves or sag curves with convexity downwards are formed in any one of the cases as shown
in figure. The deviation angle N between the two intersecting gradients is equal to the algebraic difference
between them. Among all the cases the maximum possible deviation angle is obtained when a descending
gradient (-n1) meets with an ascending gradient (+n2). Therefore deviation angle N= -n1-(+n2)= -( n1+n2).
As fast moving vehicles negotiate valley curves, the centrifugal force developed acts downward in addition
to the self weight thus adding additional pressure on the suspension system of the vehicle and discomfort to
passengers due to impact unless the valley curve is properly designed and laid.
9. Derive the expression for calculating length of valley curve of parabolic shape for comfort
condition.(Dec 2014/Jan 2015)
Ans: The length of transition curve Ls fulfilling allowable rate of change of centrifugal acceleration C
Ls=v3/CR
R=Ls/N=L/2N
Ls=(v3/CLs)*N
Ls=((Nv3)/C)0.5
L=2Ls=2(Nv3/C)0.5
Where L = Total length of valley curve=2Ls
N=deviation angle in radians or tangent of the deviation angle or the algebraic difference in the two
gradients
V=design speed in m/sec
C= allowable rate of change of centrifugal acceleration(0.6 m/sec2)

UNIT 6
1. Explain need of grade separated intersection and give advantages and disadvantages of grade
separated and at grade intersection. (Dec2013/Jan 2014, Dec 2014/Jan 2015, June 2015)
Ans: Grade separated intersections are of two types. They are at-grade intersections and grade-
separated intersections. In at-grade intersections, all roadways join or cross at the same vertical level.
Grade separated intersections allows the traffic to cross at different vertical levels. Sometimes the
topography itself may be helpful in constructing such intersections. Otherwise, the initial construction
cost required will be very high. Therefore, they are usually constructed on high speed facilities like
expressways, freeways etc. This type of intersection increases the road capacity because vehicles can
flow with high speed and accident potential is also reduced due to vertical separation of traffic.
Advantages
Maximum facilities are given to the crossing traffic. As roads are separate which
avoid accidents
There is overall increase in comfort and convenience to the motorist and saving in
travel time
Stage constructions of additional ramps are possible after the grade separation
structures between main roads are constructed.
Disadvantages
It is very costly to provide complete grade separation and interchange facilities.
In flat or plain terrain grade separation may introduce undesirable crests sags in the vertical
alignment
2. What are the advantages and limitation of unchannelized and channelized intersection? (
Dec 2014/Jan 2015,June 2015)
Ans: Advantages of channelized intersection
Vehicles approaching an intersection are directed to definite paths by islands, marking etc. and
this method of control is called channelization.
Channelized intersection provides more safety and efficiency.
It reduces the number of possible conflicts by reducing the area of conflicts available in the
carriageway.

If no channelizing is provided the driver will have less tendency to reduce the speed while entering the
intersection from the carriageway.
The presence of traffic islands, markings etc. forces the driver to reduce the speed and becomes
more cautious while maneuvering the intersection.
A channelizing island also serves as a refuge for pedestrians and makes pedestrian crossing safer.
Disadvantages of channelized intersection
It requires more area for construction.
It becomes very uneconomical in places were the traffic volume is low.
Advantages of unchannelized intersection
It is efficient where the traffic volume is low.
Its design and construction is simple.
Disadvantages of unchannelized intersection
Vehicles approaching an intersection have no definite paths hence no of accidents will be
more.
Unchannelized intersection provides more unsafe and inefficient when pedestrian traffic is
more.
There is more number of possible and areas of conflicts available are more in carriageway.
3. What are the grade-separated intersections? Explain the situations at which grade separated
intersections are justified. (Dec 2013, Dec 2014/15)
Ans:Grade separated intersection design is the highest form of intersection treatment This type of
intersection causes least delay and hazard to the crossing traffic and in general is much superior to
intersections at-grade from the point of view of traffic safety, operation and capacity.A highway
grade separation is achieved by means of vertical level separation intersecting roads by means of a
bridge thus eliminating all crossing conflicts at the intersection. The grade separation may be either
by an over bridge/flyover or under pass. Transfer of route at the grade separation or the turning
facilities are provided by interchange facilities‘ consisting of interchange ramps.
Interchange ramps may be classified as:
(i) direct,
(ii) semi-direct and
(iii) indirect ramps

The direct interchange ramp involves diverging to right side and merging from the right; both these
man oeuvres involve conflict with through traffic and therefore this type of interchange ramp is not
free from the conflicts. Semi-direct interchange ramp allows diverging to left but merging is from right
side; thus only the merging manoeuvre from the right causes conflict with through traffic. In the
indirect interchange ramp, a simple diverging to the left and a merging from the left side are involved;
thus both these manoeuvres are simpler, least hazardous and are free from major conflicts; but the
distance to be traversed in indirect interchange is more.
4. Explain the principles governing the design of intersections.( Dec 2013)
Ans: The principles governing the design of intersections are as follows
The number of intersection should be kept at minimum.
The geometric layout should be so selected that hazardous movements of drivers are
eliminated.
The layout should follow the natural vehicles paths.
Vehicles that are forced to wait in order to cross a traffic stream should be provided adequate
space at the junction.
5. With neat sketches, explain the different types of grade intersections. Explain the advantages and
limitations of Rotary intersection (June 2013, June 2015)
Ans:
Trumpet interchange:Trumpet interchange is a popular form of three leg interchange. If one of the
legs of the interchange meets a highway at some angle but does not cross it, then the interchange is
called trumpet interchange. A typical layout of trumpet interchange is shown in figure
Diamond interchange: Diamond interchange is a popular form of four-leg interchange found in the
urban locations where major and minor roads crosses. The important feature of this interchange is that

it can be designed even if the major road is relatively narrow. A typical layout of diamond interchange
is shown in figure
Clover leafinterchange:It is also a four leg interchange and is used when two highways of high
volume and speed intersect each other with considerable turning movements. The main advantage of
cloverleaf intersection is that it provides complete separation of traffic. In addition, high speed at
intersections can be achieved. However, the disadvantage is that large area of land is required.
Therefore, cloverleaf interchanges are provided mainly in rural areas. A typical layout of this type of
interchange is shown in figure
5. Explain the important steps followed while designing rotary intersection along with relevant
formulae employed. (June 2014)
Ans:The design elements include design speed, radius at entry, exit and the central island, weaving
length and width, entry and exit widths. In addition the capacity of the rotary can also be determined
by using some empirical formulae. A typical intersection is shown in figure
Design speed: All the vehicles are required to reduce their speed at a rotary. Therefore, the design
speed of a rotary will be much lower than the roads leading to it. Although it is possible to design
roundabout without much speed reduction, the geometry may lead to large size incurring huge cost
of construction. The normal practice is to keep the design speed as 30 and 40 kmph for urban and
rural areas respectively

Entry, exit and island radius:The radius at the entry depends on various factors like design speed,
super elevation, and coefficient of friction. The entry to the rotary is not straight, but a small curvature
is introduced. This will force the driver to reduce the speed. The speed range of about 20 kmph and 25
kmph is ideal for a radius and the radius of the rotary island so that the vehicles will discharge from
the rotary at a higher rate. A general practice is to keep the exit radius as 1.5 to 2 times the entry
radius. However, if pedestrian movement is higher at the exit approach, then the exit radius could be
set as same as that of the entry radius. The radius of the central island is governed by the design speed,
and the radius of the entry curve. The radius of the central island, in practice, is given a slightly higher
reading so that the movement of the traffic already in the rotary will have priority of movement. The
radius of the central island which is about 1.3 times that of the entry curve is adequate for all practical
purposes.
Width of the rotary: The entry width and exit width of the rotary is governed by the traffic entering
and leaving the intersection and the width of the approaching road. The width of the carriageway at
entry and exit will be lower than the width of the carriageway at the approaches to enable reduction of
speed. IRC suggests that a two lane road of 7m width should be kept as 7m for urban roads and 6.5m
for rural roads. Further, a three lane road of 10.5m is to be reduced to 7 and 7.5m respectively for
urban and rural roads. The width of the weaving section should be higher than the width at entry and
exit. Normally this will be one lane more than the average entry and exit width. Thus weaving width is
given as, W weaving
Where e1 is the width of the carriageway at the entry and e2 is the carriageway width at exit. Weaving
length determines how smoothly the traffic can merge and diverge. It is decided based on many factors
such as weaving width, proportion of weaving traffic to the non-weaving traffic etc. This can be best
achieved by making the ratio of weaving length to the weaving width very high. A ratio of 4 is the
minimum value suggested by IRC. Very large weaving length is also dangerous, as it may encourage
over-speeding

Capacity: The capacity of rotary is determined by the capacity of each weaving section.
Transportation road research lab (TRL) proposed the following empirical formula to find the capacity
of the weaving section
Where e is the average entry and exit width, i.e., (e1+e2)/2, w is the weaving width, l is the length of
weaving, and p is the proportion of weaving traffic to the non-weaving traffic. Shows four types of
movements at a weaving section, a and d are the non-weaving traffic and b and c are the weaving traffic.
Therefore
6. What is a rotary intersection? Under what circumstances traffic rotary is justified? Mention
advantages and limitation of a rotary intersection. (Dec 2013/Jan2014)
Ans: Rotary intersections or round about are special form of at-grade intersections laid out for the
movement of traffic in one direction round a central traffic island. Essentially all the major conflicts at
an intersection namely the collision between through and right-turn movements are converted into
milder conflicts namely merging and diverging
Advantages and disadvantages of rotary
The key advantages of the rotary intersection are listed below:
Traffic flow is regulated to only one direction of movement, thus eliminating severe
conflicts between crossing movements.
All the vehicles entering the rotary are gently forced to reduce the speed and continue to
move at slower speed. Thus, more of the vehicles need to be stopped.
Because of lower speed of negotiation and elimination of severe conflicts, accidents and
their severity are much less in rotaries.
Rotaries are self-governing and do not need practically any control by police or traffic
signals.
They are ideally suited for moderate traffic, especially with irregular geometry, or
intersections with more than three or four approaches.
Although rotaries offer some distinct advantages, there are few specific limitations for rotaries which
are listed below.

All the vehicles are forced to slow down and negotiate the intersection. Therefore the
cumulative delay will be much higher than channelized intersection.
Even when there is relatively low traffic, the vehicles are forced to reduce their speed.
Rotaries require large area of relatively at land making them costly at urban areas.
Since the vehicles are not stopping, and the vehicles accelerate at rotary exits, they are not suitable
when there are high pedestrian movements
Traffic operations in a rotary
The traffic operations at a rotary are three; diverging, merging and weaving. All the other Conflicts are
converted into these three less severe conflicts.
Diverging: It is a traffic operation when the vehicles moving in one direction is separated into
different streams according to their destinations.
Merging: Merging is the opposite of diverging, when traffic streams coming from various
places and going to a common destination are joined together into a single stream it is referred
to as merging.
Weaving: Weaving is the combined movement of both the merging and diverging movements
in the same direction.
7. Indicate the following with line sketches:
i) Traffic manoeuvres at atgrade intersections.
ii) Types of atgrade intersections (Dec 2014/Jan 2015)
Ans: i) Traffic Manoeuvres at atgrade intersections:
T intersection: Figure shows an unchannelised T junction for very light traffic and for minor
and local roads. Obviously it is hazardous to use this in locations where speeds are high and
turning movements are large.
Figure gives the layout of a channelized T junction with single turning roadway providing
for large left turning movement from the main road to the intercepted road.

Y intersection: For most of Y intersections the design can suitably follow the same features as for T
intersections except where the intersection angle is very acute. Figure indicates a channelized Y
intersection with a one way turning roadway for left turning traffic from the main road.
iii) Types of atgrade intersections: The different types of atgrade intersections are T
junction, Y junction, Staggered junction, Staggered & skewed junction, Cross
roads, Scissors junction, Multileg junction, Rotary Intersection

UNIT 7
1. Explain the cloverleaf interchange with its merits and demerits. (Dec 2013)
Ans: Clover leaf interchange: It is also a four leg interchange and is used when two highways of high
volume and speed intersect each other
Advantages
Only one structure is required
Left turning traffic has a direct path
It is very simple to use and does not confuse the drivers
Disadvantages
Relatively large area is required
The carriageway area required is also higher than a rotary interchange
Weaving movements are involved, some them on the roadway of the structure and some
underneath the structure
The U turn are long and operationally difficult
2. List the advantages and disadvantages of a rotary intersection (Dec 2013, June/july 2014)
Ans: The key advantages of the rotary intersection are listed below:
Traffic flow is regulated to only one direction of movement, thus eliminating severe
conflicts between crossing movements.
All the vehicles entering the rotary are gently forced to reduce the speed and continue
to move at slower speed. Thus, more of the vehicles need to be stopped.
Because of lower speed of negotiation and elimination of severe conflicts, accidents
and their severity are much less in rotaries.
Rotaries are self-governing and do not need practically any control by police or traffic
signals.
They are ideally suited for moderate traffic, especially with irregular geometry, or
intersections with more than three or four approaches.
Although rotaries offer some distinct advantages, there are few specific limitations for rotaries
which are listed below.
All the vehicles are forced to slow down and negotiate the intersection. Therefore the
cumulative delay will be much higher than channelized intersection.

Even when there is relatively low traffic, the vehicles are forced to reduce their speed.
Rotaries require large area of relatively at land making them costly at urban areas.
Since the vehicles are not stopping, and the vehicles accelerate at rotary exits, they are
not suitable when there are high pedestrian movements
3. Design the rotary xn for the data given below, with suitable assumptions. The highways
intersect at right angles and have a carriage way width of 15 mts. Also draw the diagram of
the rotary designed. (Dec 2014/Jan 2015)
1-car passengers
2-heavy commercial vehicles
3-scooters/motor cycles
Ans:

This is higher than the traffic flow 2746PCU/hr
4. With neat sketches, explain the advantages of i) Half clover leaf, ii) Clover leaf intersection.
(Jun/jul2013, June 2015).
Ans:
Clover leaf intersection: It is also a four leg interchange and is used when two highways of high
volume and speed intersect each other with considerable turning movements. The main advantage of
cloverleaf intersection is that it provides complete separation of traffic. In addition, high speed at
intersections can be achieved. However, the disadvantage is that large area of land is required.
Therefore, cloverleaf interchanges are provided mainly in rural areas. A typical layout of this type of
interchange is shown in figure.

Half clover leaf intersection: A partial cloverleaf interchange is a modification of a cloverleaf
interchange. This interchange was developed by the Ontario Ministry of Transportation [citation needed] as
a replacement for the cloverleaf on 400-Series Highways, removing the dangerous weaving patterns and
allowing for more acceleration and deceleration space on the freeway. The design has been well received,
and has since become one of the most popular freeway-to-arterial interchange designs in North America. It
has also been used occasionally in some European countries, such as Germany, the Netherlands, and the
United Kingdom
5. With the help of neat sketches, indicate various intersections at grade. State the advantagesof
grade separated intersections.(Dec 2013/Jan 2014)
Ans: Grade separated intersection design is the highest form of intersection treatment This type of
intersection causes least delay and hazard to the crossing traffic and in general is much superior to
intersections at-grade from the point of view of traffic safety, operation and capacity.
A highway grade separation is achieved by means of vertical level separation intersecting roads by means
of a bridge thus eliminating all crossing conflicts at the intersection. The grade separation may be either by
an over bridge/flyover or under pass. Transfer of route at the grade separation or the turning facilities are
provided by ‗interchange facilities‘ consisting of interchange ramps. Interchange ramps may be classified
as: (i) direct,
(ii) semi-direct and
(iii) indirect ramps as shown in Fig below.
The direct interchange ramp involves diverging to right side and merging from the right; both these man
oeuvres involve conflict with through traffic and therefore this type of interchange ramp is not free from
the conflicts. Semi-direct interchange ramp allows diverging to left but merging is from right side; thus
only the merging manoeuvre from the right causes conflict with through traffic. In the indirect interchange
ramp, a simple diverging to the left and a merging from the left side are involved; thus both these
manoeuvres are simpler, least hazardous and are free from major conflicts; but the distance to be traversed
in indirect interchange is more.

Advantages of grade separated intersections
a) Uninterrupted flow is possible for the crossing traffic. As the roads are separated at two levels,
there is no crossing conflict thus avoiding accidents while crossing with no need to stop while
crossing
b) There is increased safety for turning traffic and by indirect interchange ramp even right turn
movement is made quite easy and safe by converting into diverging to left and merging from
left
c) There is overall increase in comfort and convenience to the motorists and saving in travel time
and vehicle operation cost
d) The capacity of the grade separated intersection can practically approach the total capacity of
the two cross roads
e) Grade separation is an essential part of controlled access highway like expressway and
freeway
f) It is possible to adopt grade separation for all likely angles and layout of intersecting roads
g) Stage construction of additional ramps is possible after the grade separation structure between
main roads is constructed.
6. What is an overpass and underpass? Mention the advantages and disadvantages of overpass
and underpass.(Dec 2013/Jan 2014)
Ans: The grade separation intersection structures are classified as:
(i) Over-pass 0r flyover and
(ii) Under-pass.
When the major highway is taken above by raising profile above the general ground level by
embankment or viaduct and an over-bridge across another highway, it is called an over-pass or
flyover. On the contrary if ^ highway is taken by depressing it below-the ground level to cross another
road by means of an under bridge, it is known as under-pass. The choice of the over-pass or under-
pass depends on topography, vertical alignment, drainage, economy, aesthetic features and preferential
aspects for one of the highways. The advantages and disadvantages of over-pass and under-pass are
briefly listed below.
Advantages of an over-pass or flyover
Troublesome drainage problems may be reduced by taking the major highway ; above the cross road.
For the same type of structure when the wider road is taken above the span of the bridge being small,
the cost of the bridge structure will be less,

In an over-pass of major highway, there is an aesthetic preference to the main through traffic and less
feeling of restriction or confinement when compared with the under-pass. Future expansion or lateral
expansion or construction of separate bridge structure for divided highway is possible.
Disadvantages of an over-pass
In rolling terrain, if the major road is to be taken above, the vertical profile will also have undulating
grade line. If the major highway is to be taken over by constructing high embankments or viaduct and
by providing steep gradients, the increased grade resistance may cause speed reduction on heavy
vehicles. Also, there will be restrictions to sight distance unless long vertical curves are provided.
Advantages of an under-pass
The presence of an under pass which can be seen from distance and so, there is a warning to traffic in
advance. When the major highway is taken below, it is advantageous to the turning traffic because the
traffic from the cross road can accelerate while descending the ramp to the major highway and the
traffic from the major highway can decelerate while ascending the ramp to the cross roads. The under-
pass may be of advantage when the main highway is taken along the existing grade without alteration
of its vertical alignment and cross road is depressed and taken underneath.
Disadvantages of an under-pass
There may be troublesome drainage problems at the under pass, especially when the ground water
level rises high during rainy season and the road at the under-pass is to be depressed as much as 5 to7
m below the ground level. It may be necessary even to pump water continuously during the period
when water-logging problems exist .At under-pass the overhead structure may restrict the visibility or
sight distance even at valley curve near the under-pass. There is a feeling of restriction to the traffic at
3 sides while passing along the under-pass and unless the clearance is sufficiently large, this may
affect the capacity at the intersection. There is no possibility of stage construction for the bridge
structure at the under-pass.
UNIT 8
1. Explain the significance of highway drainage. ( Dec 2014, June 2015)
Ans:An increase in moisture content causes decrease in strength or stability of a soil mass the
variation in soil strength with moisture content also depends on the soil type and the mode of stress
application.
Highway drainage is important because of the following reasons:-
Excess moisture in soil subgrade causes considerable lowering of its stability the pavement is
likely to fail due to subgrade failure.
Increase in moisture cause reduction in strength of many pavement materials like stabilized
soil and water bound macadam.
In some clayey soils variation in moisture content causes considerable variation in flume of
subgrade. This sometimes contributes to pavement failure.
One of the most important causes of pavement failure by the formation of waves and
corrugations in flexible pavements is due to poor drainage.
Sustained contact of water with bituminous pavements causes failures due to stripping of bitumen
from aggregates like loosening or detachment of some of the bituminous pavement layers and
formation of pot holes.
TIE- prime cause of failures in rigid pavements by mud pumping is due to the presence of
water in fine subgrade soil.
Excess water on shoulders and pavement edge causes considerable damage.
Excess moisture causes increase in weight and thus increase in stress and simultaneous
reduction in strength of the soil mass. This is one of the main reasons of failure of earth slopes
and embankment foundations.
In places where freezing temperatures are prevalent in winter, the presence of water in the
subgrade and a continuous supply of water from the ground water can cause considerable
damage to the pavement due in frost action.
Erosion of soil from top of unsurfaced roads and slopes of embankment, cut and hill side is
also due to surface water.

2. Explain with neat sketches, how the subsurface drainage is provided to lower the water table
and control seepage flow ( Dec 2014/Jan 2015)
Ans:
Lowering of Water Table: The Highest level of water table should be fairly below the level of
Subgrade, in order that the Subgrade and pavement layers are not subjected to excessive moisture.
From practical considerations it is suggested that the water table should be kept at least 1.0 to 1.2 m
the Subgrade. In places where water table is high (almost at ground level at times) the best remedy is
to take the road formation on embankment of height not less than 1.0 to 1.2 meter. When the formation
is to be at or below the general ground level, it would be necessary to lower the water table.
Control of capillary rise: A layer of granular material of suitable thickness is provided during the
construction of embankment between the Subgrade and the highest level of subsurface water table.
Another method of providing capillary cutoff is by inserting an impermeable bituminous layer in place
of granular blanket.
Control of seepages flow The Highest level of water table should be fairly below the level of
Subgrade, in order that the Subgrade and pavement layers are not subjected to excessive moisture.
From practical considerations it is suggested that the water table should be kept at least 0.6 to 0.9 m
the Subgrade.
3. Explain the design procedure of filter material used in subsurface drain. (Dec 2013)
Ans: The procedure to design the filler materials is as follows
On a gain size distribution chart plot the grain size distribution curve for a foundation soil.
Find the value of D15 size of foundation material & plot a point of particle size 5D15 of foundation to
represent the lower limit of D15 size of the filler. This is fulfill the permeability condition
(D15 of filter)/ D15 of Foundation) > 5
To fulfill the condition to prevent piping
(D15 of filter)/ D85 of Foundation) < 5
4. What are the requirements of a good highway drainage system?( June/july 2013 )
Ans: Requirements of Highway Drainage System
The surface water from the carriageway and shoulder should effectively be drained off without
allowing it to percolate to subgrade.

The surface water from the adjoining land should be prevented from entering the roadway.
The side drain should have sufficient capacity and longitudinal slope to carry away all the
surface water collected.
Flow of surface water across the road and shoulders and along slopes should not cause
formation of cress ruts or erosion.
Seepage and other sources of underground water should be drained off by the subsurface
drainage system.
Highest level of ground water table should be kept well below the level of subgrade, preferably
by at least 1.2 m.
In waterlogged areas special precautions should be taken, especially if detrimental salts are
present or if flooding is likely to occur.
5. The maximum quantity of water expected in one of the open longitudinal drains on clayey
soil is 0.9 m3/sec. Design the cross section and longitudinal slope of a trapezoidal drain
assuming the bottom width of section to be 1.0 m and cross slope to be IV to 1.5 H. The
allowable velocity of flow in the drain is 1.2 m/sec and Manning's roughness co-efficient is
0.02 (June/july 2013, Dec 2013/Jan2014, June 2015)
Ans:
Cross section
The velocity of flow through the clay soil
V = 1.2m/sec
A = Q/V 0.9/1.2 = .75sqm
For trapezoidal c/s 1.5d2 + d – 0.75 = 0
Solving by quadratic equation for d
D= 0.45m
Taking free board as 0.15m now the total depth is 0.45+.15 = 0.60m
Slope: The slope is calculated using manning‘s formula
V= 1/n * R 2/3 * S ½
Hydraulic radius R = area/ perimeter = 2.62m
By substituting the values slope S = 0.0553½
Therefore s = 0.0031 = 1/322.5

6. State the requirements of an efficient drainage system. With the help of neat sketches,
explain how surface drainage is effected in rural highways and urban roads.(Dec
2013/Jan2014, June 2015)
Ans: Requirements of Highway Drainage System
The surface water from the carriageway and shoulder should effectively be drained off without
allowing it to percolate to subgrade.
The surface water from the adjoining land should be prevented from entering the roadway.
The side drain should have sufficient capacity and longitudinal slope to carry away all the
surface water collected.
Flow of surface water across the road and shoulders and along slopes should not cause
formation of cress ruts or erosion.
Seepage and other sources of underground water should be drained off by the subsurface
drainage system.
Highest level of ground water table should be kept well below the level of subgrade,
preferably by at least 1.2 m.
In waterlogged areas special precautions should be taken, especially if detrimental salts are
present or if flooding is likely to occur.
The surface water from the roadway and the adjoining land is to be collected and then disposed of with
the help of surface drainage system. The various components of the surface drainage system are:
(a) the cross slope or camber of the pavement surface and the shoulders,
(b) the road side drains and
(c) cross drains.
This surface water is collected in longitudinal side drains and then the water is disposed off at the
nearest stream, valley or water course with the help of cross drains and cross drainage structures. The
cross section and slope of the road side drains are designed based on the estimated flow of surface
water. Cross drainage structures like culverts and small bridges may be necessary for the disposal of
surface water from the road side drains including the water of the streams crossing the roadway.
Collection of Surface Water
Camber or cross slope
The water from the pavement surface and shoulders is first drained off to the road side drains with the
help of the cross slope or camber. The rate of this cross slope of the pavement or the carriageway is
decided based on: (i) the type of pavement surface and (ii) amount rainfall in the region. The values of
camber range from 1 in 25 or 4.0 % for earth roads to 1 in 60 or 1.7 % for high type bituminous
surface and CC pavements.
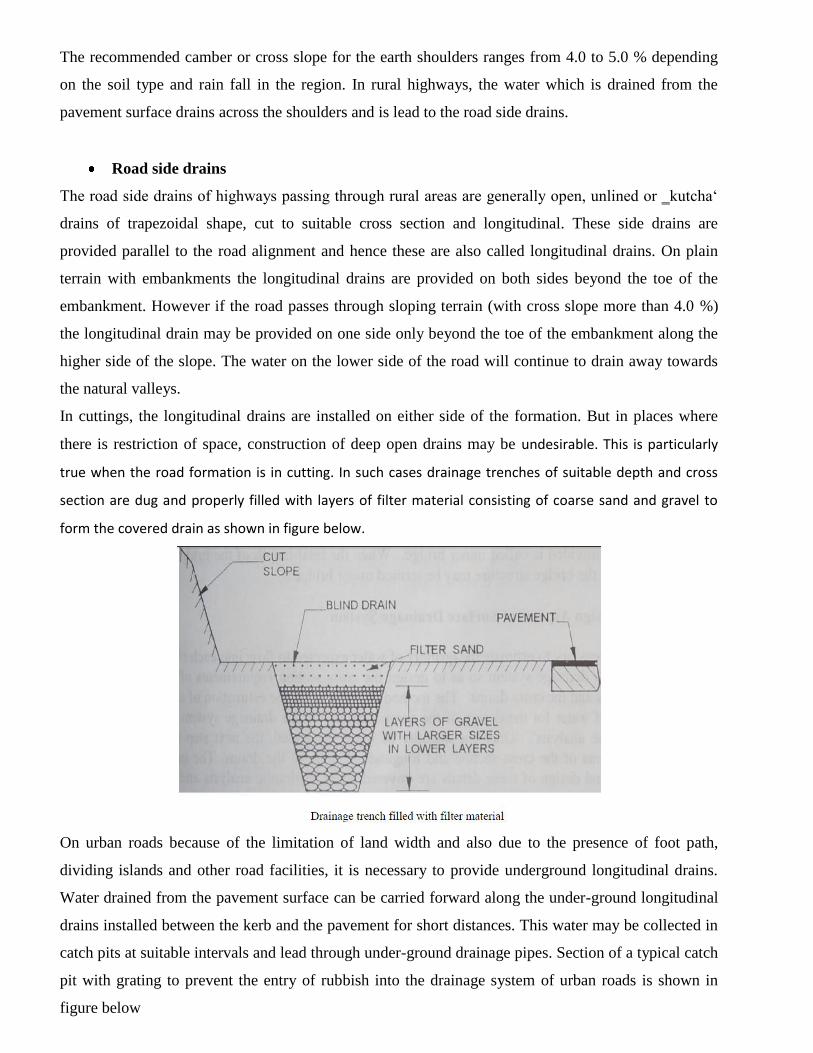
The recommended camber or cross slope for the earth shoulders ranges from 4.0 to 5.0 % depending
on the soil type and rain fall in the region. In rural highways, the water which is drained from the
pavement surface drains across the shoulders and is lead to the road side drains.
Road side drains
The road side drains of highways passing through rural areas are generally open, unlined or ‗kutcha‘
drains of trapezoidal shape, cut to suitable cross section and longitudinal. These side drains are
provided parallel to the road alignment and hence these are also called longitudinal drains. On plain
terrain with embankments the longitudinal drains are provided on both sides beyond the toe of the
embankment. However if the road passes through sloping terrain (with cross slope more than 4.0 %)
the longitudinal drain may be provided on one side only beyond the toe of the embankment along the
higher side of the slope. The water on the lower side of the road will continue to drain away towards
the natural valleys.
In cuttings, the longitudinal drains are installed on either side of the formation. But in places where
there is restriction of space, construction of deep open drains may be undesirable. This is particularly
true when the road formation is in cutting. In such cases drainage trenches of suitable depth and cross
section are dug and properly filled with layers of filter material consisting of coarse sand and gravel to
form the covered drain as shown in figure below.
On urban roads because of the limitation of land width and also due to the presence of foot path,
dividing islands and other road facilities, it is necessary to provide underground longitudinal drains.
Water drained from the pavement surface can be carried forward along the under-ground longitudinal
drains installed between the kerb and the pavement for short distances. This water may be collected in
catch pits at suitable intervals and lead through under-ground drainage pipes. Section of a typical catch
pit with grating to prevent the entry of rubbish into the drainage system of urban roads is shown in
figure below

Drainage of surface water is all the more important on hill roads. Apart from the drainage of water
from the road formation, the efficient diversion and disposal of water flowing down the hill slope
across the road and that from numerous cross streams is an important part of hill road drainage system.
If the drainage system on hill road is not adequate and efficient, it will result in complex maintenance
problems.
Cross drains
On rural stretches of highways, the water flowing along the road side drains are collected by suitable
cross drains through cross drainage structures (CD structures) at locations of natural valleys and
streams and disposed off to the natural water course. These CD structures may generally be a suitable
type of culvert, depending on the quantity of water to be carried across and the span. Different types of
culverts adopted on rural stretches of highways are, slab, box or pipe culverts. The CD structures
should extend up to the full formation width (including the roadway and the shoulders) and the ends
may be protected by suitable abutments and parapet walls. When the width of the stream or river to be
crossed is large (generally more than 6.0 m) the CD structure provided is called minor bridge. When
the total length of the bridge is more than 60 m the bridge structure may be termed major bridge.
7. List the step by step procedure of hydrologic and hydraulic design of longitudinal surface
drain. (Dec 2014/Jan 2015)
Ans:
a) The frequency of return period (such as 10 years, 25 years, etc) is decided based on finances
available and desired margin of safety for the design of the drainage system.
b) The values of coefficients of run-off C1, C2, C3, etc from drainage areas A1, A2, A3, etc are
found and the weighted value of C is computed.

c) Inlet time, T1 for the flow of storm water from the farthest point in the drainage area to the
drain inlet along the steepest path of flow is estimated from the distance, slope of the ground
and type of the cover. This is estimated from the graph of time of flow to inlet v/s distance.
d) Time of flow along the longitudinal drain, T2 is determined for the estimated length of
longitudinal drain L up to the nearest cross drainage or a water course. For an allowable
velocity of flow ‗V‘ in the drain, time T2=L/V
e) The total time T for inlet flow and flow along the drain is taken as the time of concentration or
the design value of rainfall duration T=T1+T2
f) From the rainfall intensity duration frequency curves, the rainfall intensity ‗i‘ is found in
mm/sec corresponding to duration T and frequency of the return period.
g) The total area of drainage Ad is found in units of 1000 m2
h) The run off quantity Q =CiAd
i) The cross sectional area of flow A of the drain A=Q/V where V is the allowable speed of flow
in the drain.
j) The required depth of flow in the drain is calculated for a convenient bottom width and side
slope of the drain. The actual depth of the open channel drain may be increased slightly to give
a free board. The hydraulic mean radius of flow R is determined.
k) The required longitudinal slope S of the drain is calculated using Manning‘s formula adopting
suitable value of roughness coefficient ‘n’.