1
Methodology Methodology Calibration of wind tunnel Calibration of wind tunnel Calibration of rainfall simulator Calibration of rainfall simulator Conclusions Conclusions Literature Literature Portable wind and rainfall simulator Portable wind and rainfall simulator Main objectives Main objectives Introduction Introduction Laboratory results of a portable wind and rainfall simulator Laboratory results of a portable wind and rainfall simulator W. Fister, J. B. Ries, R W. Fister, J. B. Ries, R - - G. Schmidt, T. Iserloh G. Schmidt, T. Iserloh Department of Physical Geography, Trier University, Germany Department of Physical Geography, Trier University, Germany Contact: Contact: Dipl. Dipl. - - Geogr. Wolfgang Fister Geogr. Wolfgang Fister ; Department of ; Department of Physical Geography, Physical Geography, Trier University; Behringstrasse, 54286 Trier, Germany; Phone Trier University; Behringstrasse, 54286 Trier, Germany; Phone : +49 / (0)651 201 : +49 / (0)651 201 - - 4512; E 4512; E - - mail: [email protected] mail: [email protected] Soil degradation and desertification is often caused by wind and water erosion. For many years researchers have been studying both processes separately. Laboratory investigations with wind tunnels that include rainfall simulators have shown the existence of very complex interactions between wind and water erosion. These results were confirmed in recent field research, especially for semi- arid regions. For future quantification and prediction of soil desertification both processes need to be measured together. (1) (1) Major limiting factors that prevent the development of a Major limiting factors that prevent the development of a natural natural turbulent turbulent boundary layer and boundary layer and natural natural drop fall velocities are short tunnel length and drop fall velocities are short tunnel length and low tunnel height. low tunnel height. (2) (2) Due to the properties of full cone nozzles a homogeneous spatial Due to the properties of full cone nozzles a homogeneous spatial drop drop distribution can only be created by using more than one nozzle. distribution can only be created by using more than one nozzle. General objective of this study is to simultaneously measure erosion rates by wind and water erosion with a combined wind and rainfall simulator operational in the field. To reach this goal following calibration measurements were conducted: (1) Homogeneity of airflow direction (2) Homogeneity of wind speed (3) Drop size distribution and drop fall velocity (4) Spatial distribution of rainfall Integrated rainfall simulator Wind tunnel (1) Fig. 10: Results of airflow direction measurement near surface (1); x-axis (tunnel length); y-axis (tunnel width) Fig. 11: Results of wind speed measurements above tarboard; 11x22 raster points; test duration 10 seconds, interval 1 second; black arrow (airflow direction); black line (position of profile) (2) (3) (4) Fig. 6: Woolen wires airflow direction (1) Fig. 7: Pietot tube wind speed (2) Fig. 8: Laser Disdrometer drop size/fall velocity (3) Fig.9: Collecting pans spatial distribution (4) 2 m 3 m 5 m honeycomb & transition section fan working section sediment catching area Combined sediment trap Fig. 3: Dimensional sketch of combined sediment catcher Fig. 5: Modif. Wilson and Cooke Sampler (MWAC) Wilson & Cooke 1980 • passive trap • horizontally installed • low cost • good calibration results Fig. 1: Built up wind tunnel Fig. 2: a) Preliminary nozzle mounting b) Nozzle inside tunnel a) b) Fig. 4: Guelph-Trent Wedge Trap (GTW) Nickling & McKenna-Neuman 1997 • passive trap, vertically integrating • side can be opened for cleaning • low cost • good calibration results 0.13 m a) 0.35 m 0.22 m 0.02 m wind tunnel f l ow di rec tion (air and w a ter) 0.7 m 0.7 m working section runoff inlet undercutting protection 0.6 m gutter system 0.2 m MWAC traps GTW traps a) b) b) 0.04 m 0.01 m drop number drop size [mm] fall velocity [m/s] Drop size distribution vs. drop fall velocity Figure 12: Drop size distribution and drop fall velocity measured by Thies Laser Disdrometer (3); test duration 1 min; intensity 130 mm/h; pressure 0.4 bar; fall heigth 0.7 m; Lechler full cone nozzle 460.608 Figure 13: Spatial Distribution of rainfall test inside tunnel with a single nozzle (4); test duration 12 min; intensity 130 mm/h; pressure 0.4 bar; fall heigth 0.7 m; Lechler full cone nozzle 460.608 tunnel sidewall 0.07 m 0.07 m collecting pan Complete naturally occuring drop spectra is covered Especially larger drops are too slow (max. fall velocity ~6 m/s) compared to natural rainfall droplets (green line) Concentric pattern of rainfall amount with high variations between center and rim (~50%) Runoff from upper sidewall increases water amount in collecting pans Spatial distribution of simulated rainfall is rather inhomogeneous NICKLING, W. G. & MCKENNA-NEUMAN, C. (1997): Wind tunnel evaluation of a wedge-shaped aeolian sediment trap. – Geomorphology, 18, p. 333-345. WILSON, S. J. & COOKE, R. U. (1980): Wind erosion. – In: Kirkby, M. J. & Morgan, R. P. C.: Soil erosion, Chichester. Deflection of airflow from parallel by sidewalls (maximum 3°) Homogeneous, parallel airflow between y=20 and y=50 cm Wind speed variation between 6.5 and 9 m/s Lowest wind speeds near floor and between x = 40-60 cm and y = 10- 50 cm Nearly logarithmical vertical wind profile until 18 cm height tunnel length [cm] tunnel width [cm] tunnel height [cm] wind profile wind speed [m/s] height [cm] Regression Despite the problems to simulate Despite the problems to simulate natural natural wind and rainfall conditions wind and rainfall conditions we we expect to be able to obtain valuable quantitative information re expect to be able to obtain valuable quantitative information re garding the garding the relative impact of wind and water erosion on soil degradation. E relative impact of wind and water erosion on soil degradation. E specially the specially the high mobility and reproducability make this device suitable for high mobility and reproducability make this device suitable for relative in relative in - - situ investigations situ investigations

W. Fister, J. B. Ries, R-G. Schmidt, T. Iserloh · • Wind speed variation between 6.5 and 9 m/s • Lowest wind speeds near floor and between x = 40-60 cm and y = 10-50 cm • Nearly

  • Upload
    others

  • View
    1

  • Download
    0

Embed Size (px)

Citation preview

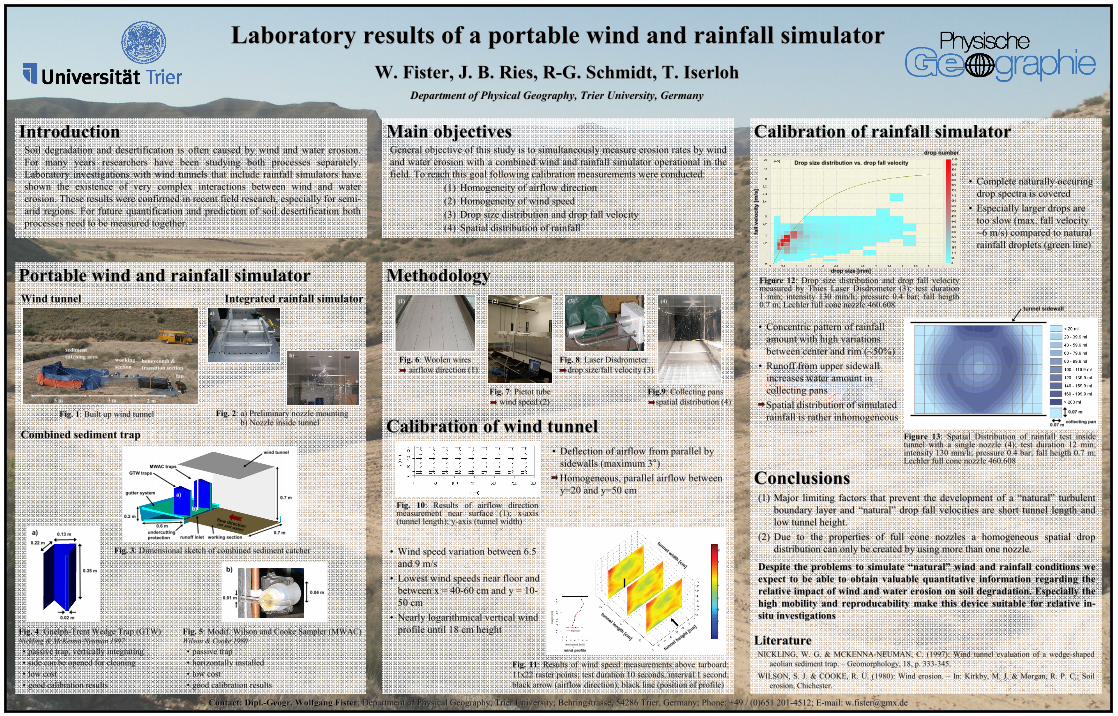
MethodologyMethodology

Calibration of wind tunnelCalibration of wind tunnel

Calibration of rainfall simulatorCalibration of rainfall simulator

ConclusionsConclusions

LiteratureLiterature

Portable wind and rainfall simulatorPortable wind and rainfall simulator

Main objectivesMain objectivesIntroductionIntroduction

Laboratory results of a portable wind and rainfall simulatorLaboratory results of a portable wind and rainfall simulatorW. Fister, J. B. Ries, RW. Fister, J. B. Ries, R--G. Schmidt, T. IserlohG. Schmidt, T. Iserloh

Department of Physical Geography, Trier University, GermanyDepartment of Physical Geography, Trier University, Germany

Contact:Contact: Dipl.Dipl.--Geogr. Wolfgang FisterGeogr. Wolfgang Fister; Department of ; Department of Physical Geography, Physical Geography, Trier University; Behringstrasse, 54286 Trier, Germany; PhoneTrier University; Behringstrasse, 54286 Trier, Germany; Phone: +49 / (0)651 201: +49 / (0)651 201--4512; E4512; E--mail: [email protected]: [email protected]

Soil degradation and desertification is often caused by wind and water erosion. For many years researchers have been studying both processes separately. Laboratory investigations with wind tunnels that include rainfall simulators have shown the existence of very complex interactions between wind and water erosion. These results were confirmed in recent field research, especially for semi-arid regions. For future quantification and prediction of soil desertification both processes need to be measured together.

(1)(1) Major limiting factors that prevent the development of a Major limiting factors that prevent the development of a ““naturalnatural”” turbulent turbulent boundary layer and boundary layer and ““naturalnatural”” drop fall velocities are short tunnel length and drop fall velocities are short tunnel length and low tunnel height.low tunnel height.

(2)(2) Due to the properties of full cone nozzles a homogeneous spatialDue to the properties of full cone nozzles a homogeneous spatial drop drop distribution can only be created by using more than one nozzle.distribution can only be created by using more than one nozzle.

General objective of this study is to simultaneously measure erosion rates by wind and water erosion with a combined wind and rainfall simulator operational in the field. To reach this goal following calibration measurements were conducted:

(1) Homogeneity of airflow direction(2) Homogeneity of wind speed(3) Drop size distribution and drop fall velocity(4) Spatial distribution of rainfall

Integrated rainfall simulatorWind tunnel (1)

Fig. 10: Results of airflow direction measurement near surface (1); x-axis (tunnel length); y-axis (tunnel width)

Fig. 11: Results of wind speed measurements above tarboard; 11x22 raster points; test duration 10 seconds, interval 1 second; black arrow (airflow direction); black line (position of profile)

(2) (3) (4)

Fig. 6: Woolen wiresairflow direction (1)

Fig. 7: Pietot tube wind speed (2)

Fig. 8: Laser Disdrometerdrop size/fall velocity (3)

Fig.9: Collecting pansspatial distribution (4)2 m3 m5 m

honeycomb & transition section

fan

working section

sediment catching area

Combined sediment trap

Fig. 3: Dimensional sketch of combined sediment catcher

Fig. 5: Modif. Wilson and Cooke Sampler (MWAC)Wilson & Cooke 1980• passive trap• horizontally installed• low cost• good calibration results

Fig. 1: Built up wind tunnel Fig. 2: a) Preliminary nozzle mounting b) Nozzle inside tunnel

a)

b)

Fig. 4: Guelph-Trent Wedge Trap (GTW)Nickling & McKenna-Neuman 1997• passive trap, vertically integrating• side can be opened for cleaning• low cost• good calibration results

0.13 ma)

0.35 m

0.22 m

0.02 m

wind tunnel

flow direction(air and water) 0.7 m

0.7 m

working sectionrunoff inletundercutting protection

0.6 m

gutter system

0.2 m

MWAC trapsGTW traps

a)

b)

b)

0.04 m0.01 m

drop number

drop size [mm]

fall

velo

city

[m/s

]

Drop size distribution vs. drop fall velocity

Figure 12: Drop size distribution and drop fall velocity measured by Thies Laser Disdrometer (3); test duration 1 min; intensity 130 mm/h; pressure 0.4 bar; fall heigth 0.7 m; Lechler full cone nozzle 460.608

Figure 13: Spatial Distribution of rainfall test inside tunnel with a single nozzle (4); test duration 12 min; intensity 130 mm/h; pressure 0.4 bar; fall heigth 0.7 m; Lechler full cone nozzle 460.608

tunnel sidewall

0.07 m

0.07 m collecting pan

• Complete naturally occuring drop spectra is covered

• Especially larger drops are too slow (max. fall velocity ~6 m/s) compared to natural rainfall droplets (green line)

• Concentric pattern of rainfall amount with high variations between center and rim (~50%)

• Runoff from upper sidewall increases water amount in collecting pansSpatial distribution of simulated rainfall is rather inhomogeneous

NICKLING, W. G. & MCKENNA-NEUMAN, C. (1997): Wind tunnel evaluation of a wedge-shaped aeolian sediment trap. – Geomorphology, 18, p. 333-345.

WILSON, S. J. & COOKE, R. U. (1980): Wind erosion. – In: Kirkby, M. J. & Morgan, R. P. C.: Soil erosion, Chichester.

• Deflection of airflow from parallel by sidewalls (maximum 3°)Homogeneous, parallel airflow between y=20 and y=50 cm

• Wind speed variation between 6.5 and 9 m/s

• Lowest wind speeds near floor and between x = 40-60 cm and y = 10-50 cm

• Nearly logarithmical vertical wind profile until 18 cm height

tunnel length [cm]

tunnel width [cm]

tunnel height [cm]

wind profilewind speed [m/s]

heig

ht [c

m]

Regression

Despite the problems to simulate Despite the problems to simulate ““naturalnatural”” wind and rainfall conditions wind and rainfall conditions we we expect to be able to obtain valuable quantitative information reexpect to be able to obtain valuable quantitative information regarding the garding the relative impact of wind and water erosion on soil degradation. Erelative impact of wind and water erosion on soil degradation. Especially the specially the high mobility and reproducability make this device suitable for high mobility and reproducability make this device suitable for relative inrelative in--situ investigationssitu investigations