Embed Size (px)
Citation preview
Waikato and Upper North Island Voltage Management © Transpower New Zealand Limited 2007. All rights reserved. i
WAIKATO AND UPPER NORTH ISLAND VOLTAGE MANAGEMENT
ATTACHMENT C: OPTIONS AND COSTING REPORT
Transpower New Zealand Limited
December 2019

Table of Contents
Waikato and Upper North Island Voltage Management © Transpower New Zealand Limited. All rights reserved.
2
Table of Contents
Glossary................................................................................................................................ 4
1 Introduction .................................................................................................................. 6
2 Option assessment approach ...................................................................................... 7
2.1 Refinement since the short list consultation ............................................................. 7
3 Identify options ............................................................................................................. 8
3.1 Key requirements and assessment criteria .............................................................. 9
3.2 Long-list of components ........................................................................................ 10
3.3 The short-list ......................................................................................................... 12
3.3.1 Stage 1 short-listed components ....................................................................... 13
3.3.2 Modelled transmission components .................................................................. 16
3.3.3 Security standards and need dates ................................................................... 17
3.3.4 Short-list options ............................................................................................... 18
4 Assess options ........................................................................................................... 21
4.1 Quantified analysis ................................................................................................ 21
4.1.1 Key parameters used in the analysis ................................................................ 21
4.1.2 Capital and O&M costs ..................................................................................... 27
4.1.3 Unserved energy benefits ................................................................................. 29
4.1.4 Future modelled project capital costs ................................................................ 30
4.1.5 Transmission loss benefits ................................................................................ 31
4.2 Net benefit test ...................................................................................................... 33
4.2.1 Net benefit test .................................................................................................. 33
4.2.2 Sensitivity analysis ............................................................................................ 34
4.3 Unquantified benefits analysis ............................................................................... 36
5 Identify solution .......................................................................................................... 39
5.1 Preferred solution .................................................................................................. 39
5.2 Non-transmission solutions procurement process ................................................. 40

Table of Contents
Waikato and Upper North Island Voltage Management © Transpower New Zealand Limited. All rights reserved
. 3
6 Proposal cost and major capex allowance ................................................................. 41
6.1 Approach to estimating capex ............................................................................... 41
6.2 Capex breakdown ................................................................................................. 42
6.3 Capex estimate ..................................................................................................... 43
6.4 Major capex allowance .......................................................................................... 44
6.5 Project requirements and project management approach to achieve proposed major
capex project outputs ............................................................................................ 44
Appendix 1 Effect on transmission charges ...................................................................... 47
Appendix 2 Unserved energy analysis methodology and assumptions ............................. 49

Glossary
Waikato and Upper North Island Voltage Management © Transpower New Zealand Limited. All rights reserved.
4
Glossary
Capex IM Transpower Capital Expenditure Input Methodology Determination, New Zealand Commerce Commission1.
Cascade failure An incremental, uncontrolled failure of transmission and generation assets resulting in a widespread loss of supply for an extended period. Also referred to as ‘voltage collapse’ in this report.
Code Electricity Industry Participation Code 2010.
Demand management The use of demand reduction pre and/or post-fault.
Dynamic reactive device
Dynamic reactive devices can provide reactive power in a few milliseconds. Common examples are static var compensators (SVCs), static synchronous compensators (STATCOMs), and synchronous condensers. All are capable of rapid dynamic response.
EDGS Electricity Demand and Generation Scenarios.
GEIP Good electricity industry practice.
Grid Reliability Standards
The grid reliability standards (GRS) are a set of standards against which the reliability performance of the existing grid (or future developments to it) can be assessed as defined in the Code (schedule 12.2).
GSC Grid support contract, used for non-transmission solutions.
GXP Grid exit point.
IDC Interest during construction
Immediate investment horizon
The period from 2023 until the end of 2024 which is the subject of our Major Capex Project application with the Commerce Commission.
Investment Test The detailed assessment required for Major Capex Projects, defined in the Commerce Commission’s Capex IM for Transpower.
Long-list consultation Transpower’s consultation document entitled Waikato and Upper North Island Voltage Management Long-list consultation July 2016.
LRMC Long run marginal cost.
MBIE Ministry of Business, Innovation and Employment.
MWh Megawatt hour of electrical energy.
N-1 A security standard that ensures with all facilities in service Transpower’s transmission system remains in a satisfactory state following a single fault event (e.g. a circuit outage).
N-G-1 A security standard that ensures with a generator out of service Transpower’s transmission system remains in a satisfactory state following a single fault event (e.g. a circuit outage). The ‘G’ in N-G-1 is also a proxy for slightly less severe transmission equipment contingencies.
PU Per-unit voltage is the expression of system voltage as fractions of a defined base voltage (e.g. 110 kV, 220 kV).
OV Over-voltage
1 See http://www.comcom.govt.nz/regulated-industries/electricity/electricity-transmission/

Glossary
Waikato and Upper North Island Voltage Management © Transpower New Zealand Limited. All rights reserved
. 5
Present value Future costs discounted to a present value using an assumed discount rate.
Rankine A type of coal/gas generation plant owned and operated by Genesis Energy at Huntly.
RFI Request for information.
SDDP Stochastic dual dynamic programming – a market dispatch model used to determine the optimal dispatch of hydro, thermal and other renewable generation.
Short-list consultation Transpower’s consultation document entitled Waikato and Upper North Island Voltage Management Short-list Consultation June 2019.
STATCOM A static synchronous compensator is a device that provides continuous fast reactive power compensation.
SVC A static var compensator is a device that provides continuous fast reactive power compensation.
TOV Transient over-voltage.
TPM Transmission pricing methodology, defined in Schedule 12.4 of the Code.
Transpower Transpower New Zealand Limited, owner and operator of New Zealand’s high-voltage electricity network (the national grid).
TSR Thyristor switched reactors can absorb varying amounts of reactive power to address over-voltage conditions.
UNI Upper North Island
UNIDRS Upper North Island Dynamic Reactive Support project.
UV Under-voltage
Voltage sensitive load Electrical load that is sensitive to fluctuations in the supplied voltage. Such loads include inductive motors (e.g. industrial motors) that will react following a fault impacting system voltage recovery.
WUNI Waikato and Upper North Island.
WUNIVM Waikato and Upper North Island Voltage Management.

Introduction
Waikato and Upper North Island Voltage Management © Transpower New Zealand Limited. All rights reserved.
6
1 Introduction
This attachment provides an overview of our assessment of options and costs for the
Waikato and Upper North Island Voltage Management Investigation Major Capex Proposal
application.
This document explains how we have applied the Investment Test specified in the
Commerce Commission’s Transpower Capital Expenditure Input Methodology Determination
2012 (Capex IM) and our assessment of the cost and revenue impact of the preferred
option. It is one of the supporting attachments to our main report (‘Waikato and Upper North
Island Voltage Management Major Capex Proposal’) and should be read in conjunction with
our main Investment Proposal.
Investment Proposal
Attachment A –
Compliance Requirements
Attachment B – Power
System Analysis Report
Attachment C – Options
and Costing Report
Attachment D – Summary
of Submissions
Attachment E – CEO
Certification
Attachment F –
Spreadsheet of Pricing by
GXP/GIP

Option assessment approach
Waikato and Upper North Island Voltage Management © Transpower New Zealand Limited. All rights reserved
. 7
2 Option assessment approach
To assess options, we have used our internal Option Assessment Approach. This involves
four key stages of investigation designed to systematically identify the best option, as
illustrated in Figure 1 below.
Figure 1: Option Assessment Approach stages
Verify Need and Determine Assessment level – This step focuses on confirming the
need for the project and determining an appropriate level of assessment given its
complexity and cost. Due to the size and complexity of the project we have applied
our highest level of assessment. The need is described in the main proposal with
detail in the accompanying Power System Analysis report.
Identify Options – This step involves defining a long-list of potential solutions to the
identified need, and then reducing this to a short-list for further analysis.
Assess Options – This step analyses the short-listed options and quantifies costs,
benefits, and unquantified benefits.
Identify Solution – This step involves identifying our preferred option, based on our
analysis.
We summarise these assessment stages below.
2.1 Refinement since the short list consultation
In June 2019 we released our short-list consultation, and with it we released an Options and
Costings report. Since that time, we have considered feedback on our short-list consultation
and have continued to work on our analysis. This has resulted in us refining some of our
work. Since our short-list consultation we have:
• undertaken additional analysis to derive load limits associated with the over-
voltage risk (described in our Power Systems Analysis report). This has allowed us
to include the over-voltage risk in our calculation of unserved energy benefits
(described in Section 4.1.3).
• added two options to our short-list to more clearly show how each option delivers
different voltage stability limits and therefore benefits to electricity consumers.
Identify options
Waikato and Upper North Island Voltage Management © Transpower New Zealand Limited. All rights reserved.
8
• incorporated the new Electricity Demand and Generation Scenarios (EDGS)
published by the Ministry of Business, Innovation and Employment (MBIE) in July
2019 into our analysis. As part of this process we also updated our models to
reflect 2018 actual peak demand. This increased our forecast and brought forward
the need date of components into our immediate investment horizon. In response,
we have also shortened our immediate investment horizon to the period 2023-2024
(inclusive).
• removed TSRs from the short list2 – we consider the analysis in the short-list
consultation sufficient to demonstrate that TSRs have a significantly greater cost
than other equivalent dynamic reactive devices. We have excluded them because
including them would require significant additional analysis for little benefit.
• refined the capital and O&M costs of short-list components.
• reviewed and modified our fault rate and asset availability assumptions.
• assumed pre-fault demand management is only used in our NTS option (in order to
provide greater clarity of how we have calculated unserved energy costs and to
better demonstrate the costs and value of demand management).
These changes are outlined in more detail below.
3 Identify options
We developed a long-list of components to address the voltage stability need for this project.
It contained a wide range of possible components for contributing to meeting the need,
including both transmission and non-transmission solutions (NTSs). In the absence of
significant new generation in the region, no single piece of transmission equipment will be
able to provide a complete economic solution by itself. We refer to the long-list as a long-list
of components, rather than the usual terminology of a long-list of options.
The need for investment was such that while there are many components that could
contribute to meeting the need for both static and dynamic voltage support, many are quite
specific technologies. Components on the long-list fell into five broad categories.
• Transmission Solution – Reactive Power Devices
• Transmission Solution – Grid Assets
• System Operations
• Market Generation
• Demand Side Participation
We consulted on our draft long list of components in 2016. Most submitters agreed with, or
did not comment on, our draft long-list of components3.
2 Option 6 in our short-list consultation used thyristor switched reactors (TSRs) and series capacitors instead of SVCs to manage voltage stability during the immediate investment horizon providing the same benefits as SVCs at significantly greater cost. 3 Refer to Attachment D for more detail.

Identify options
Waikato and Upper North Island Voltage Management © Transpower New Zealand Limited. All rights reserved
. 9
We subsequently evolved our long list – specifically, to include components that help us
manage the over-voltage need, which was highlighted after further investigation of the need
after our consultation in 2016.
3.1 Key requirements and assessment criteria
We used the following criteria to evaluate our long-list components.
1. Fit for purpose
• The design will meet current and forecast energy demand
• The component meets the need of the investigation
2. Technically feasible
• Complexity of component and our experience with the technology
• Reliability, availability and maintainability of the component
• Practicality of implementing the solution by the required dates
• Future flexibility – fits with long term strategy for the Grid
3. Good electricity industry practice (GEIP)
• Consistency with good international practice
• Safety and environmental protections
• Accounts for relative size, duty, age and technological status
• Proven international technology
• Technology risks
4. System security (additional benefit resulting from an economic investment)
• Improved system security
• System operator benefits (controllability)
• Dynamic benefits (modulation features and improved system stability)
5. Indicative cost
• Whether a component will clearly be more expensive than another component
with similar or greater benefits
6. Robustness and adaptability to a range of foreseeable outcomes
In 2016 we consulted on the first five of these assessment criteria. In response to this
consultation we added the ‘robust to foreseeable outcomes’ criteria to this list.
Table 1 in Section 3.2 lists our long-list of components along with our short-listing
assessment.

Identify options
Waikato and Upper North Island Voltage Management © Transpower New Zealand Limited. All rights reserved.
10
3.2 Long-list of components
We prepared a long-list of components which could support voltage stability prior to the
WUNIVM Long-list consultation. The list below details each of the components identified
including these additional options. A mix of transmission, operational, generation, and
demand response solutions are described.
Table 1: Long list to short-list
Long-list option Short-list? Comments
Conventional capacitor banks ✓
Shunt capacitors were included in the short-list as they can provide the lowest cost means of static under-voltage support.
Integrating new or existing shunt capacitors into a protection based automated switching controller would enable them to respond to transient over-voltage events.
Fast mechanically switched shunt capacitors and/or CAPS
✖
(ruled out on criteria 3)
This component was excluded as a standalone component because it is a complex and bespoke solution used infrequently in other parts of the world; however, it may be incorporated as part of a vendor’s SVC proposal during our procurement process.
Thyristor switched capacitor banks
✖
(ruled out on criteria 1)
This component was excluded as a standalone component because it only injects reactive power (meeting only the under-voltage need); however, it may be incorporated as part of a vendor’s SVC proposal during our procurement process.
Synchronous condensers ✓
This component was included in the short-list as it can provide dynamic reactive support and assist with both the under- and over-voltage needs.
STATCOM ✓
STATCOMs can rapidly provide dynamic reactive support to meet both the under- and over-voltage needs.
SVC ✓ SVCs can rapidly provide dynamic reactive support to meet both the under- and over-voltage needs.
Hybrid STATCOM/SVC ✓ Taking the advantages of both SVCs and STATCOMs, this component was included in the short-list.
Hybrid STATCOM/battery ✓
Taking the advantages of both STATCOMs and battery storage, this component was included in the short-list.
Grid-sized battery storage
✖
(ruled out on criteria 5)
With a high cost relative to that of dynamic reactive devices, a grid-sized battery storage was not included in the short-list as a transmission option. However, the owner of a large or aggregated battery may offer its capability as a non-transmission solution.
Series capacitors ✓
This component was included in the short list as it improves system stability to meet the under-voltage need and improves the load division between parallel lines – reducing system losses.

Identify options
Waikato and Upper North Island Voltage Management © Transpower New Zealand Limited. All rights reserved
. 11
Long-list option Short-list? Comments
Series reactors ✖
(ruled out on criteria 1)
Series reactors are used to limit the current flow on transmission lines, hence are used to redirect power flow away from heavily loaded circuits; however, they exacerbate voltage stability issues so do not meet the need of this investigation.
Undergrounding existing overhead lines in the Auckland region
✖
(ruled out on criteria 5)
This component was rejected because of high capital cost for limited voltage stability benefits.
Undergrounding components will be considered as part of Transpower’s future thermal transmission investigations.
New line to Auckland ✖
(ruled out on criteria 1)
This component was rejected because transmission lines are primarily needed for active power transfer.
Upgrading existing lines to reduce impedance
✖
(ruled out on criteria 5)
This component was rejected because of high capital cost and limited voltage stability benefits.
Upgrading existing lines will be considered as part of Transpower’s future thermal transmission investigations.
400 kV conversion ✖
(ruled out on criteria 5)
This component was rejected because of high capital cost. Although part of the original North Island Grid Upgrade development path, this conversion is preceded by the series capacitor component and therefore occurs outside our immediate investment horizon (2023-2024).
Grid reconfiguration ✖
(ruled out on criteria 5)
This option was rejected because of the high cost and limited voltage benefits expected from grid re-configurations.
These components are included as modelled projects to ensure the options assessed are robust to various thermal futures.
Use dynamic analysis to determine voltage stability limits operationally
✖
(ruled out on criteria 1)
This component was rejected as a component as although it can assist the system operator to operate with tighter voltage stability margins, there is insufficient reactive support to address these tightened margins. We note however that this option could be a requirement to support some demand side participation approaches.
Existing market generation
✖
(ruled out on criteria 3)
Should additional market generation be commissioned in the Upper North Island it would assist with providing both active and reactive power. However, this option is not included as Transpower’s grid support contract design does not allow for long term contracts with existing market generation to avoid market distortion.
We considered the influence of market generation on our short-list options in our unquantified benefits assessment.
Demand side participation, including embedded generation
✓
This component (including uncontrolled, pre-fault load cap, and post-fault demand side participation) was included as a potential means of meeting the need.

Identify options
Waikato and Upper North Island Voltage Management © Transpower New Zealand Limited. All rights reserved.
12
Long-list option Short-list? Comments
Automated over-voltage capacitor scheme ✖
Identified following the long-list consultation, this component was included to reduce the over-voltage risk using existing capacitors. However, we intend to deliver this component outside of WUNIVM in order to accelerate its delivery; therefore, we have not included it in our short-list, but instead as a modelled component.
Thyristor switched reactors
✖
(ruled out on criteria 5)
We did not short-list TSRs as they provide lower benefits than SVCs and STATCOMs at a similar cost.
3.3 The short-list
This section presents our short-listed components, and the options we have developed to
meet the over- and under-voltage needs throughout the calculation period.
Creating a short-list of options requires not only selecting from the long-list of components,
but also identification of the quantity and size of components required to address the voltage
stability need.
Many of the long-list components provided comparable voltage support functionality, but with
differing engineering and cost implications. To streamline the preparation of options, we
have grouped components from the long-list that provide equivalent support into ‘building
blocks’, effectively a short-list of representative components.
In certain combinations over time these short-listed components (described below) can
provide voltage stability to meet the need. As the voltage stability need increases with each
year of WUNI load growth, any component will only meet the need for a certain duration.
In other words, while we fully expect the need for additional reactive devices and investment
to continue into the late 2020s and beyond, there remains significant uncertainty around
precisely what, when, and where components will be required beyond then. For this major
capex project, the practical focus is on the investments needed during our immediate
investment horizon - albeit in the context of a longer-term development path to 20454. Any
voltage management investment needed beyond this immediate investment horizon after the
mid-2020s will be addressed through a subsequent stage of this major capex project or a
separate major or base capex project.
Each building block component presents enough detail to prepare an option but leaves room
for future detailed optimisation during component detailed design and procurement.
With all the possible combinations and permutations of components that could meet the
need, this process of using representative building blocks was needed to make analysis of
4 The calculation period of the Investment Test is specified in the Capex IM as a 20-year period from the date of commissioning of our investment proposal. This time horizon was consulted on as part of our long-list consultation, with submissions being supportive of the period to 2045.

Identify options
Waikato and Upper North Island Voltage Management © Transpower New Zealand Limited. All rights reserved
. 13
this complex problem manageable. Within our calculation period we have taken the following
modelling approach:
• Dynamic reactive support that can provide both over- and under-voltage support
was modelled using an SVC as a generic device to provide a representation of the
necessary dynamic response required. All SVC building blocks are modelled in
±150 Mvar blocks.
• Static reactive support is modelled using shunt capacitor to provide a
representation of the necessary static voltage response. They were modelled using
a minimum of 75 Mvar blocks.
• Series capacitors were modelled with a 45% compensation on the Brownhill–
Whakamaru circuits.
3.3.1 Stage 1 short-listed components
We identified the following short-listed components which were utilised within our options.
3.3.1.1 Post-fault demand management scheme
A post-fault demand management scheme could be used to manage high impact, low
probability faults. Of particular concern is the loss of one of a few critical 220 kV circuits into
the UNI region when at high power transfer. These circuits are highly reliable, so the
probability of them tripping is correspondingly low. The worst-case N-G-1 event after the
Huntly Rankine units have retired would be if all the following events occur simultaneously:
• very high demand, such as on a winter evening peak
• Huntly unit 5 is out-of-service
• a tripping of one of a few critical 220 kV circuits into the UNI region (e.g. the
Pakuranga–Whakamaru circuits).
If this unlikely combination did occur it could, unless guarded against, cause voltage collapse
and/or thermal overload of the parallel 220 kV circuits.
A post-fault demand management would need to operate extremely fast. Our investigation
has identified a smart grid option in the form of a rapid post-fault demand management
scheme. Such a scheme would only be armed (i.e. put it into operation) if there is both a
Huntly unit 5 outage (or equivalent transmission outage) and high load in the WUNI region.
In the unlikely event of a trip of one of the critical 220 kV circuits into the UNI region while the
scheme was armed, sufficient WUNI load would be shed instantly to avoid widespread
voltage collapse. That load would then be reinstated once the system operator had stabilised
the system.
While we understand the importance of maintaining a highly reliable transmission network,
we also recognise the need to do this in an efficient manner to not unduly impose costs on
consumers. Because of the risk of non-supply to New Zealand’s largest city, we regard it as
reasonable and prudent to restrict such post-event demand management schemes to
specific high impact, low probability events. Therefore, we have only considered this scheme
for a limited subset of high-risk circuits that operate to the highest level of reliability.

Identify options
Waikato and Upper North Island Voltage Management © Transpower New Zealand Limited. All rights reserved.
14
The inclusion of a demand management scheme enables an option to maintain close to
N-G-1 system security with significantly lower capital costs.
3.3.1.2 Dynamic reactive devices (SVCs)
Dynamic reactive devices are power system components that can inject or absorb variable
amounts of reactive power in a few milliseconds. Common examples are static var
compensators (SVCs), static synchronous compensators (STATCOMs) and synchronous
condensers. All are capable of fast dynamic response, with the performance varying by
technology. Some types of renewable generating sources are also capable of providing
dynamic reactive supply using power electronics, as are batteries.
Dynamic reactive devices must be able to act rapidly following an event to inject and/or
absorb reactive power to maintain voltage stability.
During our analysis we have used SVCs with a symmetrical injection and absorption range
and continuous output to model generic dynamic reactive devices to support both the under-
and over-voltage need.
3.3.1.3 Shunt capacitors
Shunt capacitors help prevent a slow voltage collapse by supporting the voltage level. Post-
fault, shunt capacitors can also be switched to assist with dynamic response and provide
static support once the voltage has stabilised.
Shunt capacitors are included in options in which static voltage stability limits are exceeded
during the immediate investment horizon.
3.3.1.4 Non-transmission solutions (NTS)
As discussed in the short-listed components above, many reactive devices are available as
transmission assets, which Transpower could build and own. However, these and other
components may be available as non-transmission solutions that Transpower could contract
for through a voltage support grid support contract (GSC).5 In our long-list consultation we
included our views on many components and invited feedback on other potential solutions.
In response, we received responses from proponents of NTSs such as synchronous
condenser conversion of generation units, and battery storage systems.
The technical benefit obtained from a voltage support NTS depends on many factors
including its size, its location in the network, the connecting voltage and the extent of voltage
support already on or planned for the network. As a general rule, the benefits of voltage
support are greatest when connected close to Otahuhu and Hamilton as these sites are
optimal to support both the UNI and Waikato regions. Benefits rapidly decay when away
from these sites, with greater quantities of reactive support required to provide the same
level of voltage support.
5 Information on the design features of GSCs is available at www.transpower.co.nz/gridsupport-contracts.

Identify options
Waikato and Upper North Island Voltage Management © Transpower New Zealand Limited. All rights reserved
. 15
The technology of any NTS providing voltage support also greatly impacts the possible
benefits. To resolve the over-voltage issue, any technology must rapidly absorb reactive
power within a millisecond timeframe. Without this high-speed response, the NTS would only
be able to provide under-voltage support and would be of lower value. This may be the case
for synchronous condensers, which due to their high reactance respond slowly during very
short voltage disturbances.
In addition to voltage support NTS, we could defer or avoid the need for transmission
solutions using pre-fault demand management (i.e. demand response) if procured at a large
enough scale.
We model NTS as pre-fault demand management.
3.3.1.5 Series capacitors
Series capacitors reduce the impedance (electrical length) of a transmission line and could
improve system stability in the WUNI region. We have considered series capacitors on the
220 kV Brownhill–Whakamaru (BHL–WKM) overhead circuits. These are the high capacity
400 kV capable circuits built as part of the North Island Grid Upgrade (NIGU) project. Since
their design, Transpower’s long-term plan has been to direct power off the highly loaded
parallel 220 kV circuits onto these high capacity circuits: firstly, through series capacitors and
ultimately via a 400 kV upgrade.
Series capacitors on the BHL–WKM circuits would help to:
• improve load division among the parallel lines in the WUNI region by diverting
power flow from heavily loaded circuits to the BHL–WKM circuits, thus allowing
higher power transfer
• improve dynamic system response
• raise the WUNI load limit
• reduce transmission losses during high transfers as more power is transmitted
through higher capacity circuits.
Series capacitors improve dynamic voltage stability and allow higher power transfer into the
UNI region without overloading the lower capacity parallel circuits. The power transfer
benefit of series capacitors has led this component to be a modelled project within
Transpower’s grid planning since the NIGU project.
The benefits of series capacitors are directly related to the level of compensation selected.
Higher levels of compensation are associated with enhanced voltage stability and greater
power transfer on the BHL–WKM lines. However, the higher compensation and therefore
power transfer accelerates the need for additional thermal capacity from Brownhill into
Auckland. To balance the trade-off between higher levels of compensation and component
costs we have modelled 45% compensation across all options. Modelling series capacitors
with compensation at 45% preserves future transmission optionality and the precise level of
compensation can be optimised during detailed design with a prospective vendor.

Identify options
Waikato and Upper North Island Voltage Management © Transpower New Zealand Limited. All rights reserved.
16
3.3.2 Modelled transmission components
Under the Capex IM each option is considered in the context of a longer-term grid
development path comprised of ‘modelled projects’. The modelled projects are future new
assets or changes to existing assets that are outside of our immediate investment horizon
but could – in theory – affect the options and the choice of the preferred option (i.e. modelled
projects are not stage 1 or 2 components).
In practice, the development plans in the Power Systems Analysis report show there is not a
significant difference in the investment in assets supporting voltage stability other than due
to changes in demand, generation, and the security standard we invest to (i.e. N-1 or N-G-
1)6. In other words, the key investment issue during our immediate investment horizon is to
optimise investment in voltage stability devices today, as we can “catch up” or slow down
future investment as demand and generation patterns evolve. To undertake this
optimization, we need to consider investment requirements across a range of possible
demand futures.
For this reason – rather than using the specific modelled project components identified in the
Power Systems Analysis report – we have used generic dynamic voltage support
components as modelled projects in our economic analysis to estimate the relationship
between demand, generation expansion, unserved energy, and investment after our
immediate investment horizon.
We have included the following modelled transmission components in our economic
analysis.
3.3.2.1 Dynamic reactive devices
Dynamic reactive devices are required to continue to maintain transient voltage stability as
demand grows in the future. We have used a ±150 Mvar building block component to
represent dynamic reactive devices as modelled projects.
3.3.2.2 Thermal transmission components
With further demand growth we will eventually reach thermal transmission capacity limits for
transfer into the UNI. In the absence of significant generation commitments at Huntly or
north and if the Huntly Rankine units were to retire, we expect this to occur in mid-2020s. We
would then need to augment the grid to increase capacity between Whakamaru and
Auckland.
Furthermore, based on asset condition assessment we expect the conductors on the
Otahuhu–Whakamaru (OTA–WKM) 1 and 2 circuits to reach end-of-life in the mid-2030s or
6 The grid enhancements needed to manage thermal constraints on 220 kV circuits into WUNI can also affect the magnitude of voltage support required in the future. In our economic modelling, we have assumed this component does not affect voltage support requirements. This simplifying assumption favours options with the OHW Bussing grid reconfiguration as this requires greater voltage support than the OHW Tee.

Identify options
Waikato and Upper North Island Voltage Management © Transpower New Zealand Limited. All rights reserved
. 17
later7. Any grid reconfiguration may need to take this into consideration, as significant capital
cost savings may be possible if the thermal capacity and condition needs are addressed as
a single project or development path.
There are many ways in which the grid could be developed to increase thermal transfer
limits into the WUNI region and address the condition need, and these have been explored
as modelled projects. Such thermal options identified include reconductoring OTA–WKM 1
and 2, a new cable between Brownhill and Otahuhu (BHL–OTA), a tee connection of
Brownhill–Whakamaru 1 and 2 into Ohinewai (‘OHW Tee’), and bussing OTA–WKM 1 and 2
into Ohinewai and duplexing the southern section between Ohinewai and Whakamaru
(‘OHW Bussing’). We have investigated these options to the point of reassurance that our
short-listed options are robust to different grid futures in the region. More detail on these
projects is available in the Power System Analysis report.
When considering the impact these thermal options have on the future voltage stability need,
we have assumed the OHW Tee is used for options that include the series capacitors and
OHW Bussing is used for options without the series capacitors. However, in our sensitivity
analysis we consider a wider range of possible capital costs encompassing the known
options that may ultimately be preferred to address these thermal constraint and condition
needs in the future.
3.3.3 Security standards and need dates
In addition to selecting components to meet the need, each option is designed to maintain a
level of reliability during the immediate investment horizon under our prudent forecast.
The GRS require us to maintain at least an N-1 level of reliability on the core grid, which
means the power system remains in a stable state without a loss of supply to demand
following a failure of a single transmission circuit or generation unit. However, we can invest
to maintain a higher level of reliability if we can justify this higher level through the
Investment Test.
For this investigation, there are four security standards that we test to determine the
economic level of reliability we should maintain over the immediate investment horizon:
• N-G-1: under this standard we would invest in primary equipment to cover an
outage of the largest regional generator Huntly unit 5 (‘G’) (or an equivalent
transmission asset) and a fault of any single circuit in the WUNI region. This
standard results in the lowest level of unserved energy of the options assessed in
this investigation (i.e. the highest level of security, reliability, and unserved energy
benefits).
• N-G-1 (with demand management): under this standard we would invest in
primary equipment to cover an outage of Huntly unit 5 (‘G’) (or an equivalent
transmission asset) and a fault of OTA–WKM 1 or 2 or another circuit with
equivalent, or less severe, voltage stability demand limits. A post-fault demand
7 This date relates to the majority of the length of these circuits – we have a listed project in RCP3 for replacement of ~30km of northern sections of the circuits.

Identify options
Waikato and Upper North Island Voltage Management © Transpower New Zealand Limited. All rights reserved.
18
management scheme in the WUNI region covers the risk of other specific high
impact lower probability faults (e.g. BHL-WKM 1 or 2 fault).
• N-1: under this standard we would invest in primary equipment to cover a fault of
any single circuit, generator, or transmission component on the core grid in the
WUNI region.
• N: while this standard does not meet the deterministic clause of the Grid Reliability
Standards, we have included two options that do not maintain N-1 security under a
prudent forecast to demonstrate the economic benefits of the other options.
When developing our options, we have added components to ensure our prudent peak
demand forecast remains below the voltage stability limit associated with the standard
selected for that option during the immediate investment horizon. These voltage stability
limits increase as components are commissioned. We have selected the commissioning
date (i.e. need date) of components based on our 2019 prudent demand forecast.
3.3.4 Short-list options
This section summarises our seven short-list options.
Defer investment to 2028 - This option has no capital investment until the end of 2028 and
therefore has a high risk of unserved energy. This option does not meet the deterministic
arm of the GRS and we do not consider the option to be good electricity industry practice,
but we have included it to demonstrate the economic benefits of the other options.
Option 1 – This option represents possible non-transmission solutions that may allow us to
defer or avoid the need for voltage support investment. In this analysis, we assume the NTS
is pre-fault demand management, providing N-G-1 security.
Option 2 – Containing a combination of two SVCs, a post-fault demand management
scheme, and series capacitors commissioned in 2022, this option provides N-G-1 security
(with demand management) during the immediate investment horizon.
The post-fault demand management scheme is an emergency risk mitigation measure
designed to allow the power system to continue operating without pre-fault demand
management during a long-term unplanned outage of Huntly unit 5 or a critical transmission
component.
Option 3 – A combination of two SVCs and a post-fault demand management scheme8
commissioned in 2022, and series capacitors commissioned in 2023. This option provides
firm N-1 security during the immediate investment horizon.
Option 4 – This option contains the greatest upfront capital investment with three SVCs,
series capacitors, and shunt capacitors commissioned in 2022, and an additional SVC and
8 In addition to the firm N-1 security provided by the SVCs, we utilize the post-fault demand management scheme to cover a subset of specific, long-duration N-G-1 contingencies outages that could occur on the grid (e.g. Huntly unit 5, or a BHL-PAK cable outage). We consider it prudent to guard against these long-duration contingencies even in options such as this that do not cover other N-G-1 contingencies, and therefore only provide firm N-1 security.
Identify options
Waikato and Upper North Island Voltage Management © Transpower New Zealand Limited. All rights reserved
. 19
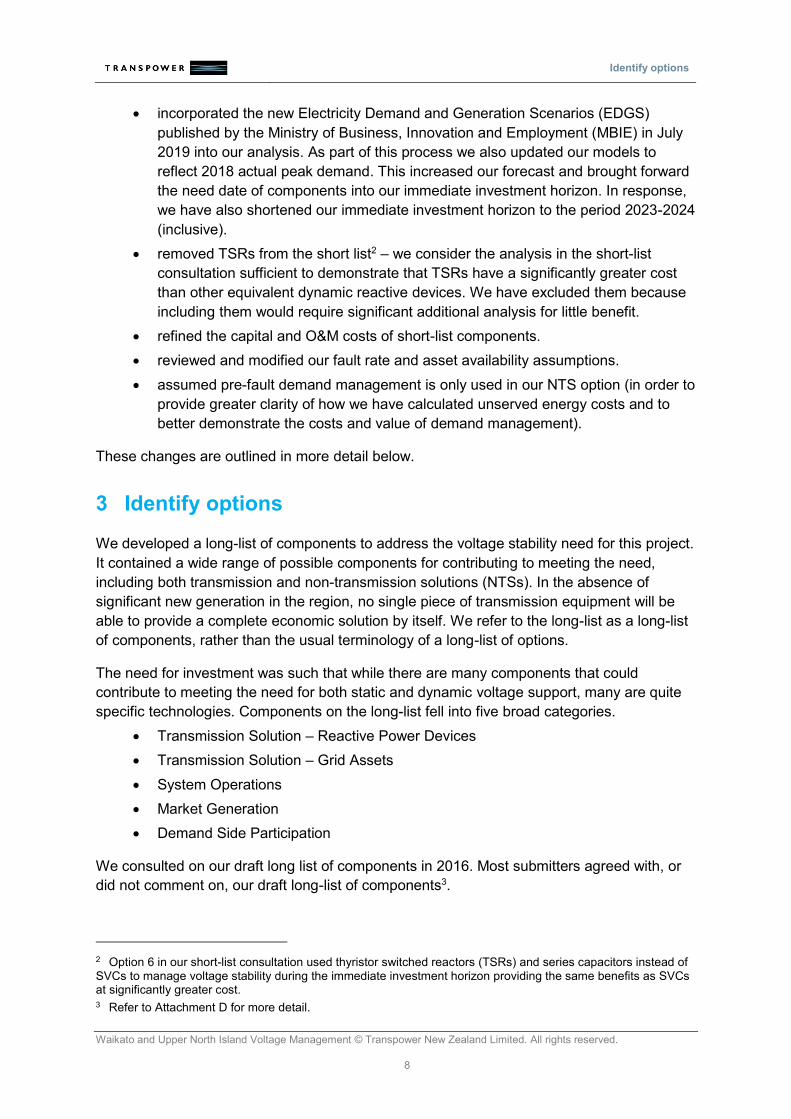
shunt capacitors commissioned in 2023. This option provides the highest level of security
assessed in this investigation: N-G-1 without the use of a post-fault demand management
scheme.
Option 5 – This option tests the costs and benefits of providing N-1 security without the
series capacitors. As a result, the option utilises a different modelled thermal project than
option 2, 3, and 4 to alleviate future thermal constraints. We expect the alternative
reconfiguration (OHW Bussing) to be more expensive than other possible thermal
investments (e.g. OHW Tee) because it requires duplexing of the Otahuhu–Whakamaru 1
and 2 conductors.
Option 6 – This option only invests in two SVCs during the immediate investment horizon
but is included to show the benefits of other options. Like the defer investment option, this
option does not meet the deterministic arm of the GRS and we do not consider the option to
be good electricity industry practice, but we have included it to demonstrate the economic
benefits of the other options.
For the purposes of our economic analysis, we assume the components in each stage are
commissioned at the end of the year prior to the need date.

Identify options
Waikato and Upper North Island Voltage Management © Transpower New Zealand Limited. All rights reserved.
20
Table 2: Short-list of options
Commissioning year Defer investment
Option 1
(NTS) Option 2 Option 3 Option 4 Option 5 Option 6
Security standard
N N-G-1 (with demand mgmt.)
N-G-1 (with demand mgmt.)
N-1 N-G-1 N-1 N
Stage 1
component 1 (2022)
Pre-fault demand management as
NTS
Post-fault demand management
scheme
Post-fault demand management
scheme
± 150 Mvar SVC at HAM110
Post-fault demand management
scheme
Post-fault demand management
scheme
Stage 1
component 2 (2022)
± 150 Mvar SVC at HAM110
± 150 Mvar SVC at HAM110
± 150 Mvar SVC at OTA220
± 150 Mvar SVC at HAM110
± 150 Mvar SVC at HAM110
Stage 1
component 3 (2022)
± 150 Mvar SVC at OTA220
± 150 Mvar SVC at OTA220
Series capacitors with 45%
compensation on BHL–WKM 1&2
± 150 Mvar SVC at OTA220
± 150 Mvar SVC at OTA220
Stage 1
component 4 (2022)
Series capacitors with 45%
compensation on BHL–WKM 1&2
± 150 Mvar SVC
Stage 1
component 5 (2022)
150 Mvar Shunt capacitors
Stage 2
component 1 (2023)
Series capacitors with 45%
compensation on BHL–WKM 1&2
± 150 Mvar SVC ± 150 Mvar SVC
Stage 2
component 2 (2023)
75 Mvar Shunt capacitors
150 Mvar Shunt capacitors
Modelled components
(SVCs, OHW Bussing)
(SVCs, OHW Bussing)
(SVCs, OHW Tee) (SVCs, OHW Tee) (SVCs, OHW Tee) (SVCs, OHW Bussing)
(SVCs, OHW Bussing)

Assess options
Waikato and Upper North Island Voltage Management © Transpower New Zealand Limited. All rights reserved
21
4 Assess options
In this section we quantify the following costs and benefits of each option.
• Stage 1 and stage 2 capital and O&M costs
• Unserved energy benefits
• Future modelled project capital costs
• Transmission loss benefits
Section 4.1 summarises the methodology and assumptions used to determine each of these
four categories that are inputs to the quantified analysis. Appendix 2 presents the detailed
methodology and assumptions.
As per the Capex IM9, we treat some costs and benefits as unquantified where we cannot
calculate an expected value with sufficient accuracy. Unquantified benefits are described
and assessed in Section 4.3.
In accordance with Schedule G, Clause G5(6) and (7), we have used all costs and benefits
in Schedule D, Clause D4(1)(a)-(g), except:
• the cost of ancillary services, including system operator costs: we have not
quantified this benefit as it is not affected by the short-list options.
• operating and maintenance expenditure for modelled transmission projects: we
have not explicitly included this benefit in the results of our quantified analysis as it
is immaterial to the conclusion10.
We also assessed generation dispatch benefits using the hydro-thermal dispatch
optimisation package called SDDP. We found these benefits to be negligible as generation
that could be constrained-on if demand exceeded voltage stability limits was forecast to
already be running during peak periods. We have included competition benefits from
increased voltage capacity as an unquantified benefit.
4.1 Quantified analysis
4.1.1 Key parameters used in the analysis
This section provides a summary of the high-level economic assumptions used in this
assessment.
9 See Schedule D, Clause D1(2)(b). 10 We estimate O&M expenditure to be ~10% of the annualized capital cost of modelled transmission projects – well within the capital cost uncertainty of these projects.

Assess options
Waikato and Upper North Island Voltage Management © Transpower New Zealand Limited. All rights reserved.
22
4.1.1.1 Discount rate
We have applied a discount rate of 7% per annum (real, pre-tax) as specified in the Capex
IM. Our sensitivity analysis uses discount rates of 4% and 10%.
4.1.1.2 Value of lost load
When calculating the economic cost of an interruption to electricity supply in the WUNI
region we use a Value of Lost Load (VoLL) equal to $26,500/MWh. This number is based on
the value specified in the Code defined as $20,000/MWh in 2004 inflated at CPI to 2019
dollars.
Our sensitivity analysis uses VoLLs of +/- 50% of these base values.
4.1.1.3 Calculation period
The Capex IM specifies that we should use a calculation period of 20 years from the
commissioning date of the last delivered asset associated with the proposal. In this proposal,
stage 1 assets are expected to be commissioned in 2022, and stage 2 in 2023. We have
calculated costs and benefits over the calculation period from 2023-2045, as originally
proposed in our long-list consultation in 2016 and supported by submissions received.
4.1.1.4 Demand scenarios
Forecasting load growth is inherently difficult to do with great accuracy. It is likely to be even
harder in the longer term given the potential for electrification and investment in emerging
technologies.
We produced peak demand forecasts for the WUNI region by considering historical rates of
growth and aligning our assumptions about emerging technologies with those in MBIE’s
latest EDGS published in July 201911. The EDGS do not provide forecasts at a regional or
GXP level. We have also updated our models to consider the latest peak demand
information for the region in 2018. In 2018 peak demand in the WUNIVM region grew for the
second year in a row.
We have calculated a probability distribution for future peak demand. We have done this by
calculating a forecast distribution for each EDGS scenario. The distribution considers the fit
of regression models to historical data and then applies the bottom-up technology uptake
assumptions in each EDGS scenario. We have combined the distributions for each scenario
using an equal weighting12 to produce an overall peak demand forecast distribution. Figure 2
shows this combined demand forecast (presented as a distribution).
11 MBIE’s Electricity Demand and Generation Scenarios are published here: mbie.govt.nz/building-and-energy/energy-and-natural-resources/energy-statistics-and-modelling/energy-modelling/electricity-demand-and-generation-scenarios/ 12 MBIE have not provided weightings for the EDGS. Therefore, we consider an equal weighting for each scenario to be appropriate for this proposal.

Assess options
Waikato and Upper North Island Voltage Management © Transpower New Zealand Limited. All rights reserved
23
We use the prudent forecast shown in in Figure 2 to calculate the need date of short-list
components in our immediate investment horizon. This is based on the 10th highest half-hour
from the 90th percentile of our peak demand forecast distribution. We use the 10th highest
peak as WUNI demand is relatively ‘peaky’ – we consider the use of the 10th highest peak to
determine need dates to be a more balanced trade-off between the risk of high demand and
the economic cost of investment.
Figure 3 shows the expected (P50) peak forecast for each of the derived EDGS scenarios.
The Reference, Global, and Growth scenarios have very similar peak demand forecasts,
whereas the Disruptive and Environmental scenarios have higher peak demand forecasts
due to greater electrification of transport and process heat.
We use the combined forecast distribution in our calculation of unserved energy benefits and
future modelled project costs.
Figure 2: Distribution of WUNI peak demand forecasts – 2019 forecast
0
1000
2000
3000
4000
5000
0
1000
2000
3000
4000
5000
1997
1999
2001
2003
2005
2007
2009
2011
2013
2015
2017
2019
2021
2023
2025
2027
2029
2031
2033
2035
2037
2039
2041
2043
2045
WU
NI P
eak
Dem
and
(MW
)
Historical P1 P99 Prudent Expected

Assess options
Waikato and Upper North Island Voltage Management © Transpower New Zealand Limited. All rights reserved.
24
Figure 3: Expected (P50) peak demand forecasts
In addition to these peak forecasts, we have used MBIE’s energy forecasts for calculating
transmission loss benefits. The following shows the underlying13 compound annual growth
rate of energy forecasts in the WUNI region, derived from the national EDGS forecasts:
• Reference: 1.1% p.a.
• Growth: 1.5% p.a.
• Global: 0.6% p.a.
• Environment: 1.2% p.a.
• Disruptive: 1.0% p.a.
13 i.e. excluding bottom up technology assumptions
0
1000
2000
3000
4000
5000
0
500
1000
1500
2000
2500
3000
3500
4000
4500
500019
97
1999
2001
2003
2005
2007
2009
2011
2013
2015
2017
2019
2021
2023
2025
2027
2029
2031
2033
2035
2037
2039
2041
2043
2045
WU
NI P
eak
Dem
and
(MW
)
Historical Reference - P50 Growth - P50
Global - P50 Disruptive - P50 Environmental - P50
Expected

Assess options
Waikato and Upper North Island Voltage Management © Transpower New Zealand Limited. All rights reserved
25
4.1.1.5 Generation scenarios
We have incorporated the EDGS generation scenarios into our assessment of the need and
short-list options.
The EDGS provides limited information about the location of new generation and not at a
sufficiently granular level of detail to specify the specific region or transmission connection
location of new generation plant. Our analysis requires a forecast of expansion within the
WUNI region, as generation expansion or decommissioning can decrease or increase the
need for voltage support.
Therefore, we have generally assumed generation expansion within the WUNI region that is
consistent with that used in our short-list consultation:
• There are similar levels of wind, thermal, geothermal, and hydro expansion in the
generation scenarios used in this proposal as described in the short-list
consultation.
• We have assumed all solar PV expansion in the North Island from the updated
EDGS is built within the WUNI region, as the WUNI region is a good location for
solar PV generation given its high irradiance relative to elsewhere in the North
Island.
• We have assumed the same decommissioning dates as the latest EDGS for
generation plant within the WUNI region (Huntly units 5 and 6, and Te Uku), with
the exception of the Huntly Rankine units, described below.
The EDGS assume the Huntly Rankine units do not begin reducing their capability until 2030
and 203114. As described in the main proposal, we assume the Rankines are
decommissioned by the end of 2022. We have received no information to the contrary, and
respondents to our short-list consultation were generally supportive of us proceeding under
this assumption unless we receive such information. We consider this a reasonable variation
on the EDGS given the significant risk of voltage collapse if the units retire and we do not
invest in voltage support.
Table 3 shows the generation scenarios we have used for expansion in the WUNI region.
We have applied a capacity factor of 0.2 for wind and 0.1 for solar generation when using
these to calculate unserved energy benefits.
14 The EDGS assume the units remain fully operational until 2030 and 2031, then run at restricted capacity solely on gas until 2034.

Assess options
Waikato and Upper North Island Voltage Management © Transpower New Zealand Limited. All rights reserved.
26
Table 3: Generation scenarios (within WUNI region)
Year Reference Growth Environment Global Disruptive
2020 25\Geo\KOE 25\Geo\KOE 25\Geo\KOE 25\Geo\KOE 25\Geo\KOE
2021
2022
2023 -500\Thermal\HLY -500\Thermal\HLY
54\Wind\HTI
-500\Thermal\HLY -500\Thermal\HLY -500\Thermal\HLY
54\Wind\HTI
2024 17\Hydro\KPO 17\Hydro\KPO 17\Hydro\KPO
54\Wind\HTI
17\Hydro\KPO
54\Wind\HTI
17\Hydro\KPO
2025 200\Wind\MPE 200\Wind\MPE
2026 200\Wind\MPE 200\Wind\MPE
2027
2028 54\Wind\HTI
2029
2030 25\Geo\KOE
200\Thermal\SWN
25\Geo\KOE
200\Thermal\MDN
25\Geo\KOE
200\Thermal\MDN
25\Geo\KOE 25\Geo\KOE
200\Thermal\SWN
10\Thermal\HAM
2031 43\Solar\HPI
2032
2033 6\Solar\KOE
2034 -64\Wind\HAM -64\Wind\HAM
42\Wind\SWN
66\Solar\HPI
-64\Wind\HAM -64\Wind\HAM
200\Wind\MPE
-64\Wind\HAM
50\Solar\KOE
2035 1\Solar\KOE
2036 26\Solar\KOE 10\Thermal\MPE
207\Solar\HPI
2037 11\Solar\HPI 241\Solar\HPI
2038 -385\Thermal\HLY
17\Solar\KOE
-385\Thermal\HLY
200\Thermal\OTA
35\Solar\HPI
-385\Thermal\HLY
200\Thermal\OTA
59\Solar\HPI
-385\Thermal\HLY -385\Thermal\HLY
200\Thermal\MDN
200\Solar\MDN
100\Solar\KTA
2039 -50\Thermal\HLY -50\Thermal\HLY -50\Thermal\HLY -50\Thermal\HLY
200\Thermal\MDN
-50\Thermal\HLY
2040 200\Thermal\MDN 39\Solar\HPI 50\Solar\HPI
2041 11\Solar\HPI 193\Solar\HPI
2042 222\Solar\HPI 7\Solar\HPI
2043
2044 125\Solar\HPI
2045 100\Wind\MPE 100\Wind\MPE
7\Solar\HPI
100\Wind\MPE 100\Wind\MPE 100\Wind\MPE
We have not varied the total level or timing of generation expansion in New Zealand from the
2019 EDGS, other than some minor changes to the commissioning years to smooth the
expansion plans and avoid very high SRMCs or demand deficit in our generation dispatch

Assess options
Waikato and Upper North Island Voltage Management © Transpower New Zealand Limited. All rights reserved
27
modelling (used to calculate transmission loss benefits). Like the demand scenarios, we give
each generation scenario an equal weighting.
4.1.2 Capital and O&M costs
This section presents the capital and operating costs for each of the short-list options.
4.1.2.1 Capital expenditure
Table 4 shows the nominal capital expenditures of each short-list component used in the
options.
The capital costs presented in Table 4 have been derived by Transpower in consultation with
potential vendors. We consider all cost estimates to be P50 estimates.
Table 4: Capital cost of short-list components (excl. IDC and inflation)
Component Capital cost Capital cost uncertainty15
± 150 Mvar SVC at OTA $56m -23%/+34%
± 150 Mvar SVC at HAM $54m -23%/+38%
45% series capacitors on BHL-WKM $95m -30%/+50%
± 150 Mvar SVC $56m -30%/+50%
150 Mvar shunt capacitors $7m -30%/+50%
75 Mvar shunt capacitors $5m -30%/+50%
Post-fault demand management scheme $8m -33%/+55%
4.1.2.2 Operating and maintenance expenditure
This section outlines the operating and maintenance (O&M) costs of the components that fall
within our immediate investment horizon.
We assume the transmission-focussed options (options 2-6) will not have any operational
expenditure beyond the standard operating and maintenance of transmission assets. This
contrasts with option 1, for which any operation costs are based on the cost of demand
management.
Table 5 shows the maintenance costs used in this assessment. Our maintenance cost
estimates are based on our expert judgement and historical data from similar equipment. We
assume operating and maintenance costs are 1% of the capital cost of the component per
annum.
15 Excluding changes in foreign exchange rates.
Assess options
Waikato and Upper North Island Voltage Management © Transpower New Zealand Limited. All rights reserved.
28
Table 5: Component O&M costs
Component O&M cost
± 150 Mvar SVC at OTA $0.6m p.a.
± 150 Mvar SVC at HAM $0.5m p.a.
45% series capacitors on BHL-WKM $1.0m p.a.
± 150 Mvar SVC $0.6m p.a.
150 Mvar shunt capacitors $0.07m p.a.
75 Mvar shunt capacitors $0.05m p.a.
Post-fault demand management scheme $0.08m p.a.
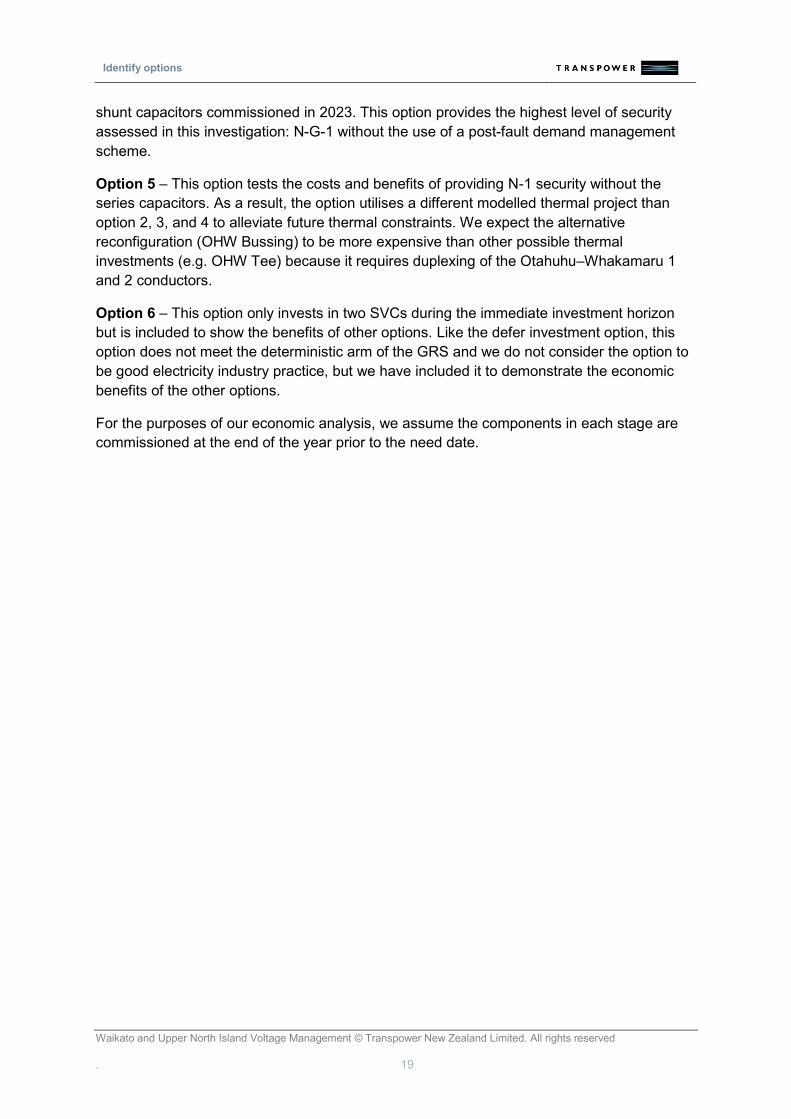
For the NTS option (option 1), all pre-fault demand management is considered an
operational cost, valued at $2,000/MWh. The quantity is determined based on the demand
forecast and voltage stability limits of the WUNI region if we didn’t invest in transmission
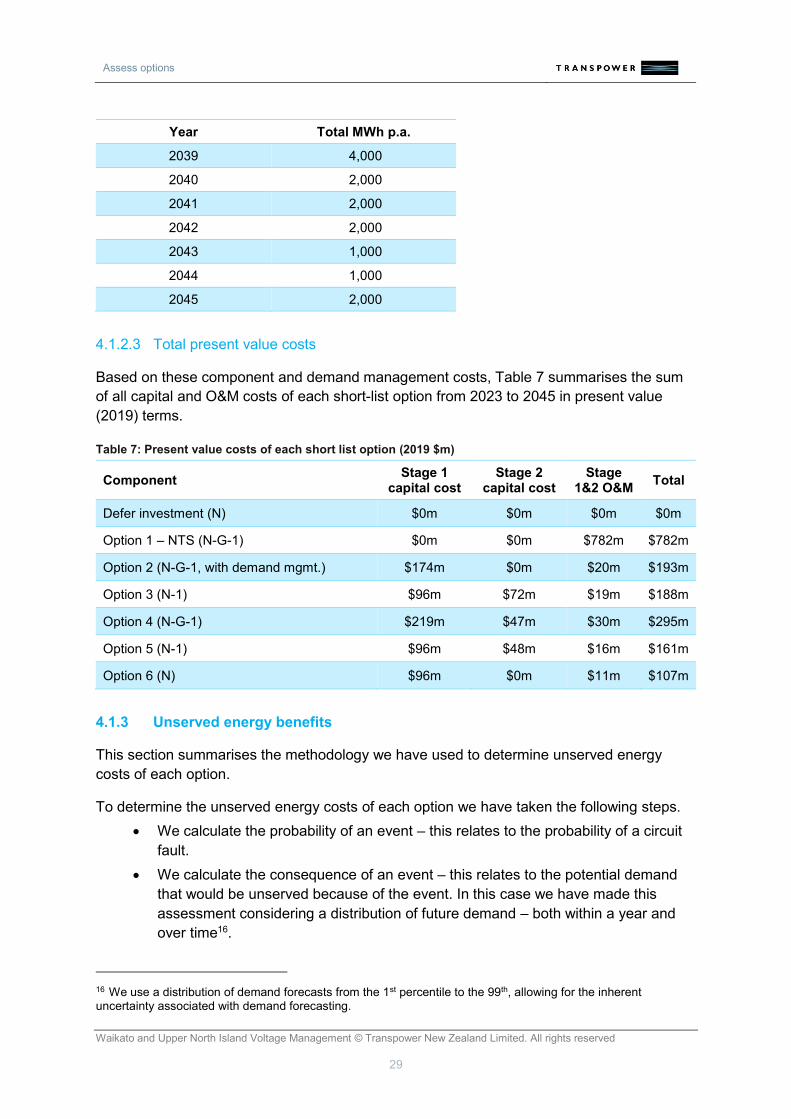
assets (see Section A.2.5 for more detail of these limits). Table 6 summarises the magnitude
of demand response we assume in our analysis. Note:
• The values in Table 6 are expected values – in other words, they are the
probability weighted average of all demand percentiles in our demand distribution.
• The magnitude of demand management decreases from 2029 as the model
assumes transmission components are commissioned (in order to reduce demand
management costs where the cost of avoided demand management exceeds the
cost of the transmission component).
Table 6: Magnitude of demand management
Year Total MWh p.a.
2023 47,000
2024 65,000
2025 65,000
2026 82,000
2027 102,000
2028 127,000
2029 89,000
2030 28,000
2031 19,000
2032 13,000
2033 9,000
2034 6,000
2035 4,000
2036 3,000
2037 2,000
2038 8,000
Assess options
Waikato and Upper North Island Voltage Management © Transpower New Zealand Limited. All rights reserved
29
Year Total MWh p.a.
2039 4,000
2040 2,000
2041 2,000
2042 2,000
2043 1,000
2044 1,000
2045 2,000
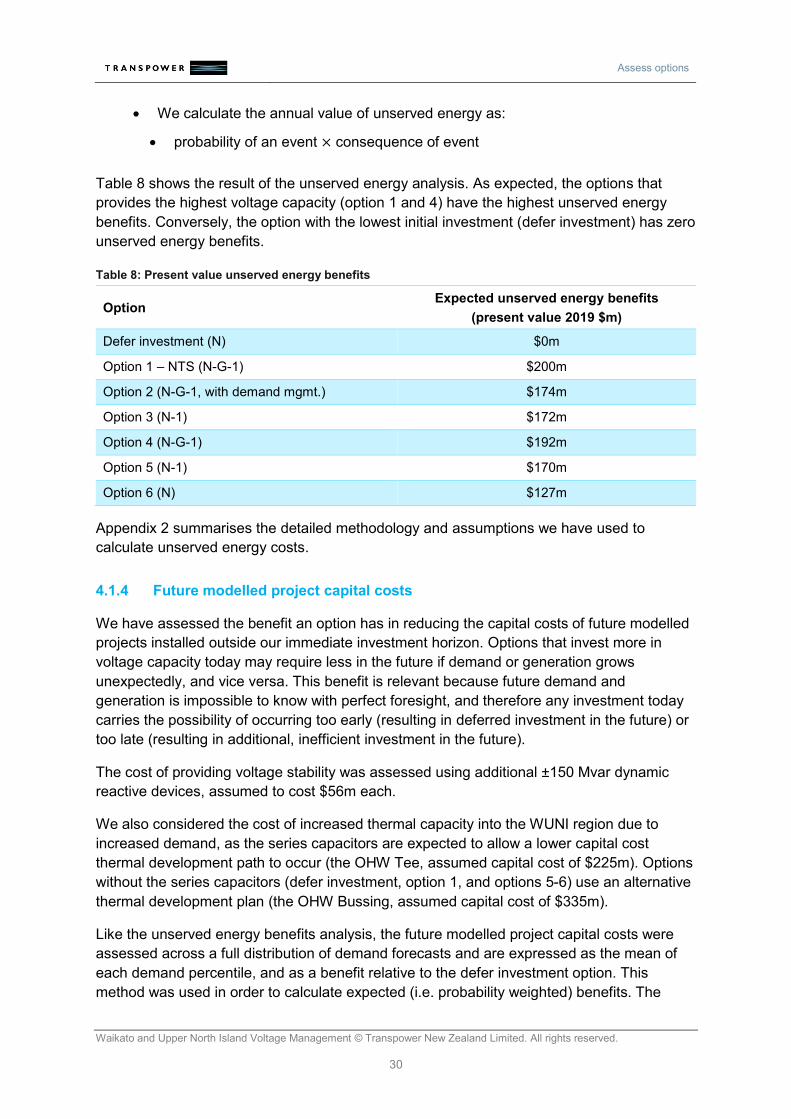
4.1.2.3 Total present value costs
Based on these component and demand management costs, Table 7 summarises the sum
of all capital and O&M costs of each short-list option from 2023 to 2045 in present value
(2019) terms.
Table 7: Present value costs of each short list option (2019 $m)
Component Stage 1
capital cost Stage 2
capital cost Stage
1&2 O&M Total
Defer investment (N) $0m $0m $0m $0m
Option 1 – NTS (N-G-1) $0m $0m $782m $782m
Option 2 (N-G-1, with demand mgmt.) $174m $0m $20m $193m
Option 3 (N-1) $96m $72m $19m $188m
Option 4 (N-G-1) $219m $47m $30m $295m
Option 5 (N-1) $96m $48m $16m $161m
Option 6 (N) $96m $0m $11m $107m
4.1.3 Unserved energy benefits
This section summarises the methodology we have used to determine unserved energy
costs of each option.
To determine the unserved energy costs of each option we have taken the following steps.
• We calculate the probability of an event – this relates to the probability of a circuit
fault.
• We calculate the consequence of an event – this relates to the potential demand
that would be unserved because of the event. In this case we have made this
assessment considering a distribution of future demand – both within a year and
over time16.
16 We use a distribution of demand forecasts from the 1st percentile to the 99th, allowing for the inherent uncertainty associated with demand forecasting.
Assess options
Waikato and Upper North Island Voltage Management © Transpower New Zealand Limited. All rights reserved.
30
• We calculate the annual value of unserved energy as:
• probability of an event × consequence of event
Table 8 shows the result of the unserved energy analysis. As expected, the options that
provides the highest voltage capacity (option 1 and 4) have the highest unserved energy
benefits. Conversely, the option with the lowest initial investment (defer investment) has zero
unserved energy benefits.
Table 8: Present value unserved energy benefits
Option Expected unserved energy benefits
(present value 2019 $m)
Defer investment (N) $0m
Option 1 – NTS (N-G-1) $200m
Option 2 (N-G-1, with demand mgmt.) $174m
Option 3 (N-1) $172m
Option 4 (N-G-1) $192m
Option 5 (N-1) $170m
Option 6 (N) $127m
Appendix 2 summarises the detailed methodology and assumptions we have used to
calculate unserved energy costs.
4.1.4 Future modelled project capital costs
We have assessed the benefit an option has in reducing the capital costs of future modelled
projects installed outside our immediate investment horizon. Options that invest more in
voltage capacity today may require less in the future if demand or generation grows
unexpectedly, and vice versa. This benefit is relevant because future demand and
generation is impossible to know with perfect foresight, and therefore any investment today
carries the possibility of occurring too early (resulting in deferred investment in the future) or
too late (resulting in additional, inefficient investment in the future).
The cost of providing voltage stability was assessed using additional ±150 Mvar dynamic
reactive devices, assumed to cost $56m each.
We also considered the cost of increased thermal capacity into the WUNI region due to
increased demand, as the series capacitors are expected to allow a lower capital cost
thermal development path to occur (the OHW Tee, assumed capital cost of $225m). Options
without the series capacitors (defer investment, option 1, and options 5-6) use an alternative
thermal development plan (the OHW Bussing, assumed capital cost of $335m).
Like the unserved energy benefits analysis, the future modelled project capital costs were
assessed across a full distribution of demand forecasts and are expressed as the mean of
each demand percentile, and as a benefit relative to the defer investment option. This
method was used in order to calculate expected (i.e. probability weighted) benefits. The

Assess options
Waikato and Upper North Island Voltage Management © Transpower New Zealand Limited. All rights reserved
31
method is summarized in Figure 4 below, showing voltage stability limits increasing as a
function of the peak demand percentile. Unserved energy benefits and future investment in
modelled transmission projects were calculated for each demand percentile and averaged to
calculate expected benefits. See Section A.2.1 for more detail.
Figure 4: Quantified cost-benefit analysis methodology (not to scale)
Table 9 shows the results of this assessment.
Table 9: Present value benefit from reduced future capital costs
Option
Expected benefit from reduced future capital costs
(present value 2019 $m)
Defer investment (N) $0m
Option 1 – NTS (N-G-1) -$84m
Option 2 (N-G-1, with demand mgmt.) $142m
Option 3 (N-1) $142m
Option 4 (N-G-1) $164m
Option 5 (N-1) $62m
Option 6 (N) $42m
4.1.5 Transmission loss benefits
We have also considered the cost of transmission losses for all the short-list options. This
section outlines our assessment of these costs.
Assess options
Waikato and Upper North Island Voltage Management © Transpower New Zealand Limited. All rights reserved.
32
Transmission losses across the circuits into the WUNI region are reduced through the
diversion of power away from lower capacity, more highly utilised circuit to higher capacity,
lower utilised circuits. This can be achieved through use of a series capacitor or a
reconfiguration of the grid.
The magnitude of transmission losses, measured in GWh, were assessed using SDDP.
We have estimated the losses for each option using the input assumptions that make up the
MBIE EDGS scenarios, such as electricity demand, fuel prices, and carbon prices.
These transmission losses are converted to loss costs by multiplying the losses by the long-
run marginal cost (LRMC) of energy generation. We assume the LRMC of energy generation
– and therefore of transmission losses – is equal to $80/MWh. We assess the sensitivity of
the net benefit test to this assumption in Section 4.2.2.
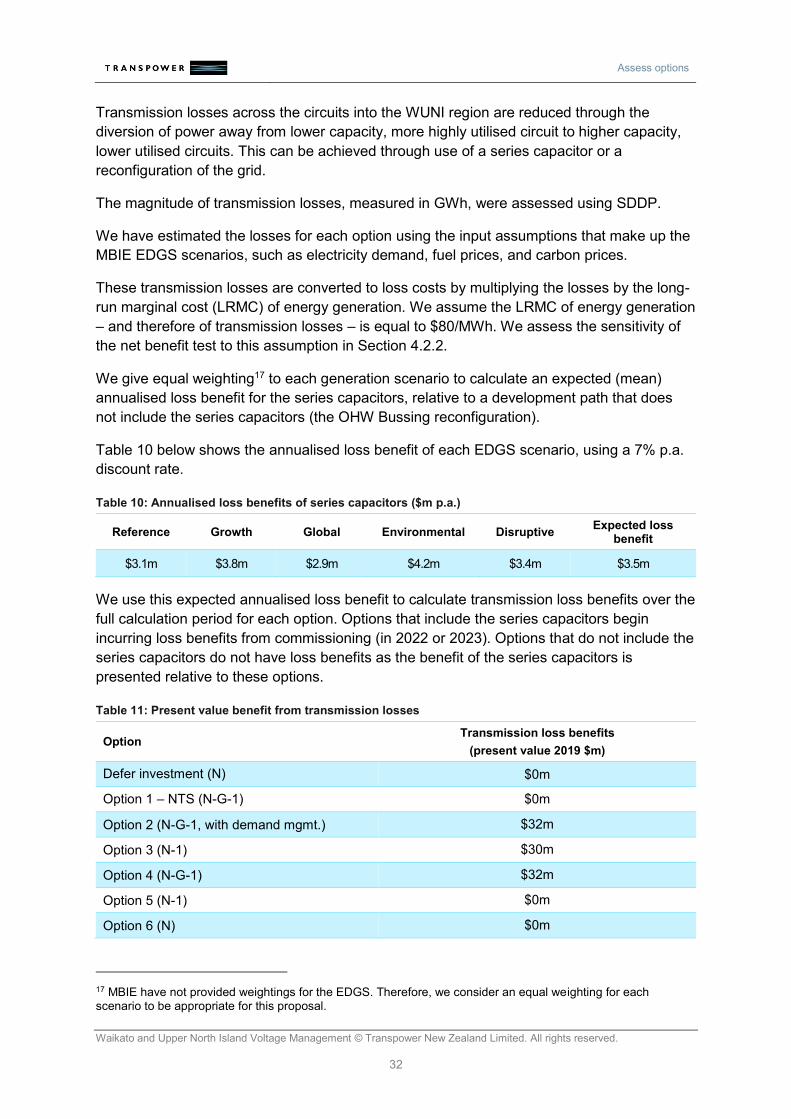
We give equal weighting17 to each generation scenario to calculate an expected (mean)
annualised loss benefit for the series capacitors, relative to a development path that does
not include the series capacitors (the OHW Bussing reconfiguration).
Table 10 below shows the annualised loss benefit of each EDGS scenario, using a 7% p.a.
discount rate.
Table 10: Annualised loss benefits of series capacitors ($m p.a.)
Reference Growth Global Environmental Disruptive Expected loss
benefit
$3.1m $3.8m $2.9m $4.2m $3.4m $3.5m
We use this expected annualised loss benefit to calculate transmission loss benefits over the
full calculation period for each option. Options that include the series capacitors begin
incurring loss benefits from commissioning (in 2022 or 2023). Options that do not include the
series capacitors do not have loss benefits as the benefit of the series capacitors is
presented relative to these options.
Table 11: Present value benefit from transmission losses
Option Transmission loss benefits
(present value 2019 $m)
Defer investment (N) $0m
Option 1 – NTS (N-G-1) $0m
Option 2 (N-G-1, with demand mgmt.) $32m
Option 3 (N-1) $30m
Option 4 (N-G-1) $32m
Option 5 (N-1) $0m
Option 6 (N) $0m
17 MBIE have not provided weightings for the EDGS. Therefore, we consider an equal weighting for each scenario to be appropriate for this proposal.

Assess options
Waikato and Upper North Island Voltage Management © Transpower New Zealand Limited. All rights reserved
33
4.2 Net benefit test
This section presents the net benefit of each option in present value (2019) dollars.
4.2.1 Net benefit test
Table 12 summarises the results of our quantified assessments of options.
Table 12: Net benefit test – (present value 2019 $m)
Defer invest-ment
Option 1 - NTS
Option 2 Option 3 Option 4 Option 5 Option 6
Security standard
N (N-G-1) (N-G-1 with demand mgmt.)
N-1 N-G-1 N-1 N
Stage 1 capital cost
$0 $0 $174 $96 $219 $96 $96
Stage 2 capital cost
$0 $0 $0 $72 $47 $48 $0
Stage 1&2 O&M $0 $782 $20 $19 $30 $16 $11
Total cost (A) $0 $782 $193 $188 $295 $161 $107
Unserved energy benefits
$0 $200 $174 $172 $192 $170 $127
Reduction in future modelled project capital cost
$0 -$84 $142 $142 $164 $62 $42
Transmission loss benefits
$0 $0 $32 $30 $32 $0 $0
Total benefits (B)
$0 $116 $348 $343 $389 $232 $169
Net benefit (B-A)
$0 -$666 $155 $155 $94 $72 $62
Option 2 and option 3 have the highest net-benefit. The higher unserved energy and
transmission loss benefits of option 2 are similar to option 2’s marginally higher capital cost
from commissioning the series capacitors a year earlier than option 3.
The option with the highest level of security – option 4 – has a significantly lower net-benefit
than options 2 and 3, indicating the additional cost of moving from a lower level of security to
full N-G-1 is greater than the benefit.
Option 5 provides N-1 security but has a lower net-benefit than options 2 and 3 because it
does not use the series capacitors and therefore requires a higher capital cost thermal
development path. This development path has a higher cost because it requires duplexing
OTA-WKM-1 and 2, whereas the base case development path only requires a like-for-like
reconducting of these circuits. In addition, it does not have any transmission loss benefits as
it does not include the series capacitors.

Assess options
Waikato and Upper North Island Voltage Management © Transpower New Zealand Limited. All rights reserved.
34
The two options that do not meet the GRS during the immediate investment horizon (defer
investment and option 6) have lower net-benefits than options 2 and 3. This supports the
deterministic arm of the GRS, which requires a minimum of N-1 security on the core grid.
Option 1 has a large negative net-benefit, indicating the cost of such a significant quantity of
demand management is prohibitive.
4.2.2 Sensitivity analysis
In accordance with Schedule D, Clause D7(1) of the Capex IM, we have varied the
magnitude of key variables and assumptions by an amount reflecting their estimated
uncertainty18 to determine the sensitivity of our quantified results, as shown in Table 13. The
option with the highest net-benefit and options with a difference in net-benefit that is within
10% of the project cost of this option are coloured green.
We have not undertaken sensitivity analysis on the following parameters:
• Hydrological inflows sequences: this parameter relates to the calculation of
transmission loss benefits. We have taken the average of the loss benefits across the
84 historical inflow sequences we have modelled to calculate an expected loss
benefit. A particular hydro inflow sequence within the distribution of inflow sequences
is a random variable that cannot be predicted in the long term. It is not consistent
with the definition of an expected benefit to select a portion of this historical inflow
distribution (e.g. a high or low sequence) for the purposes of undertaking a
sensitivity.
• Competition effects: we have not quantified competition effects in our base case
assessment, therefore we cannot undertake a sensitivity on this parameter.
Table 13: Sensitivity analysis of net-benefit analysis (present value net-benefit 2019 $m)
Defer invest-ment
Option 1
Option 2
Option 3
Option 4
Option 5
Option 6
Base case $0 -$666 $155 $155 $94 $72 $62
Discount rate 4%19 $0 -$842 $229 $227 $178 $122 $99
Discount rate 10% $0 -$535 $102 $104 $38 $36 $36
Upper range capital costs
$0 -$666 $72 $75 -$40 $5 $22
18 Where this uncertainty is well defined. Where the uncertainty is not well defined or is itself uncertain, we have varied the parameter by an appropriately large margin to test the sensitivity of the result to this parameter. 19 It’s arguable the 4% sensitivity should be given more weight given the current interest rate outlook. For example, the Treasury recommended a 6% real, pre-tax discount rate for public sector infrastructure projects (https://treasury.govt.nz/information-and-services/state-sector-leadership/guidance/financial-reporting-policies-and-guidance/discount-rates). This was based on a 2.81% risk free rate from May 2018, with 10 year government bond yields having fallen over 1% since that time.

Assess options
Waikato and Upper North Island Voltage Management © Transpower New Zealand Limited. All rights reserved
35
Defer invest-ment
Option 1
Option 2
Option 3
Option 4
Option 5
Option 6
Lower range capital costs
$0 -$666 $206 $205 $175 $113 $87
EDGS Reference20 $0 -$549 $98 $99 $27 $28 $34
EDGS Disruptive20 $0 -$872 $252 $251 $211 $150 $111
EDGS Environmental20 $0 -$680 $174 $175 $107 $75 $70
EDGS Growth20 $0 -$471 $59 $62 -$21 -$14 $8
EDGS Global20 $0 -$579 $90 $93 $24 $24 $34
+50% VoLL21 $0 -$566 $241 $240 $188 $155 $124
-50% VoLL21 $0 -$792 $59 $61 -$20 -$21 -$4
95% HLY U5 availability $0 -$644 $115 $116 $43 $35 $37
85% HLY U5 availability $0 -$699 $194 $194 $138 $108 $89
+100% probability of voltage contingency
$0 -$470 $325 $323 $281 $239 $186
-50% probability of voltage contingency
$0 -$792 $59 $61 -$20 -$21 -$4
2030 Rankine retirement $0 -$204 -$52 -$49 -$124 -$76 -$23
+50% LRMC of losses $0 -$666 $171 $170 $110 $72 $62
-50% LRMC of losses $0 -$666 $139 $140 $78 $72 $62
High capital cost range of thermal modelled projects22
$0 -$666 $103 $104 $42 $72 $62
+75 MW increase in capability of additional short-list DRDs
$0 -$666 $155 $155 $102 $89 $62
-75 MW increase in capability of additional short-list DRDs
$0 -$666 $155 $155 $79 $48 $62
+50 MW increase from modelled DRDs
$0 -$583 $135 $136 $67 $53 $49
-50 MW increase from modelled DRDs
$0 -$971 $195 $195 $138 $110 $93
+50% duration of outage $0 -$566 $241 $240 $188 $155 $124
-50% duration of outage $0 -$792 $59 $61 -$20 -$21 -$4
20 These sensitivities give a 100% weighting to each EDGS scenarios. 21 These variations were undertaken on our base case value for VoLL ($26,500/MWh). We consider these to also be reasonable variations of the Code defined VoLL of $20,000/MWh. 22 This sensitivity assumes a $320m capital cost to increase the thermal capacity of the 220 kV network into the WUNI region for options 2-4 (compared to $225m in the base case). This is equivalent to excluding the capital cost of thermal enhancements from the assessment.

Assess options
Waikato and Upper North Island Voltage Management © Transpower New Zealand Limited. All rights reserved.
36
The sensitivity analysis shows options 2 and 3 have the highest net-benefit in all sensitivity
scenarios except the deferral of the Huntly Rankine retirement. Therefore, we consider
option 2 and option 3 to be robust to uncertainty in the key input parameters.
Option 4 with the highest level of security does not have the highest net-benefit in any
scenarios and is never within 10% of options 2 and 3; strongly indicating this level of security
is uneconomic.
Option 5 (without the series capacitors) is not within 10% of options 2 and 3 in any
sensitivity, including the one that assumes the upper capital cost range of possible thermal
enhancements following the installation of the series capacitors. This demonstrates the
series capacitors are robust to a range of possible future grid configurations driven by the
need to increase the thermal capacity of transmission in WUNI.
The Rankine retirement in 2030 sensitivity (instead of 2022) shows options 2-6 as having a
negative net-benefit relative to the defer investment option. This sensitivity should not be
interpreted as options 2-6 having a negative net-benefit relative to a true “do-nothing”, as our
economic modelling allows all options to invest in additional voltage support from the end of
2028. A true do-nothing option without investment in voltage support over the full calculation
period would result in options 2-6 having present value net-benefits of greater than $600m
each. This sensitivity indicates that should the Rankines remain operational during winter
peak periods after 2022, then it may be beneficial to defer some stage 1 or stage 2
components23.
We do not have perfect foresight of market generation developments, including the
retirement and operation of the Rankine units. Given this uncertainty, the potential cost of
investing too early in stage 1 components (estimated to be $23m in this sensitivity)24 should
be weighed against the risk and foregone benefits from investing too late ($155m from our
base case). Given these foregone benefits significantly exceed the potential cost of investing
too early, we consider this trade-off to be a prudent balance between the risks of investment
and unserved energy.
4.3 Unquantified benefits analysis
We have also considered unquantified costs and benefits.
Costs and benefits can be considered unquantified when they are not possible to quantify
with a satisfactory level of accuracy, or when the investigation resource required for us to
obtain a satisfactory level of accuracy is large relative to the size of the cost/benefit.
The unquantified costs and benefits we have considered include:
23 Note, we have not undertaken the detailed power system modelling necessary to analyse this sensitivity to a high degree of accuracy – this is a high-level estimate of the net-benefit of each option should the Rankines remain operating during winter peak periods after 2022. Furthermore, we have not quantified the potential competition benefits of operating to the N-G-1 level of security, which may be material. 24 We use the net-benefit of option 6 from the 2030 Rankine retirement scenario in this comparison as our staged approach allows us to transition to option 6 by deferring the series capacitors if the Rankine units remain operating after 2022 (and we have certainty they will remain operating).

Assess options
Waikato and Upper North Island Voltage Management © Transpower New Zealand Limited. All rights reserved
37
Competition benefits
Increasing the transmission capability into the WUNI region through improved voltage
management will enable competition to be maintained following the thermal
decommissioning and expected demand growth. By contrast, not investing such that
the voltage stability limit binds more as generation is retired and demand grows may
provide a single participate with market power during periods when transmission
capacity is constrained (if the system operator applies voltage stability constraints in
the market to mitigate the voltage stability risk). Given the offer-based marginal cost
pricing of the wholesale electricity market, this could result in inefficient generation
dispatch, raise prices regionally and transfer value from consumers to generators.
Options that provide the highest voltage stability limits (i.e. minimise the possibility of
market constraints) rank the highest, while options that provide a low voltage stability
limit (i.e. rely more on market constraints) rank the lowest.
Unquantified unserved energy costs
Options that increase transmission capacity into the WUNI region have unserved
energy costs beyond those that we have quantified in our net benefit test.
• Increasing transmission capacity (i.e. voltage stability limits) reduces or removes
the reliance on a single large generation unit (Huntly unit 5) to provide voltage
support. This increases the resiliency of the power system to high impact, low
probability events affecting Huntly unit 5. For example, a long duration gas
supply constraint or a major failure of Huntly unit 5. It is possible we have
underestimated the expected availability of Huntly unit 5 (or critical transmission
assets) due to high-impact, low probability events.
• We have not quantified the decrease in reliability and hence increase in
expected unserved energy costs resulting from all possible faults that could
cause voltage collapse (for example, unforeseen high impact, low probability
events affecting transmission equipment, or faults outside our immediate study
area such as on 110 kV circuits and various 220 kV circuits within the WUNI
region).
Options that have the highest voltage stability limit have the highest unquantified
unserved energy benefits, while options that have a low voltage stability limit have the
lowest unquantified unserved energy benefits.
Operational benefits
It is apparent from the investigative work on this project that irrespective of the
transmission and generation investment path that eventuates, the power system will
need to be operated close to voltage stability limits.
Options with components that assist with the reliable operation of the power system in
these conditions are to be preferred, such as dynamic reactive devices. These

Assess options
Waikato and Upper North Island Voltage Management © Transpower New Zealand Limited. All rights reserved.
38
components provide operational benefits such as managing high voltages in the WUNI
region during low demand periods and increasing the window of time available to take
planned transmission or generation outages.
Options that have the highest voltage stability limits rank the highest, while options that
have low voltage stability limits rank the lowest.
Environment – Global
Investing to manage voltage stability issues in the WUNI region will offer two benefits
to meeting New Zealand’s greenhouse gas emissions commitments. Firstly, it will
enable thermal generation at Huntly or north to retire without compromising security of
supply into the WUNI, or for such generation to restrict its operations to dry year
security. Secondly, it will encourage renewable generation investment south of Huntly
because of the enhanced transfer capability into the WUNI region.
Optionality
Options that commit less capital expenditure today tend to have option value as there
is uncertainty of the benefits of an option due to demand and generation uncertainty.
Our methodology quantifies the option value arising from demand uncertainty;
however, does not quantify the option value due to the possible retention of the
Rankine units after 2022 as this requires a subjective assessment of the probability of
this event occurring. Therefore, we have included optionality as a (partially)
unquantified benefit. We consider optionality only for the stage 2 components, as they
are required after stage 1 and therefore have need dates that are particularly affected
by generation uncertainty.
We have also considered the following unquantified benefits but have concluded there is no
significant difference between the options:
Environment – Local
Some solutions can have visual and/or noises impacts, especially in, or near, urban
areas. All short-list components are substation works, rather than lines, which makes
their environmental impacts confined. We expect the same to be true of non-
transmission solutions. Therefore, we assess the difference in local environmental
impacts between the options as negligible.
Safety
We do not expect safety outcomes to distinguish between options.

Identify solution
Waikato and Upper North Island Voltage Management © Transpower New Zealand Limited. All rights reserved
39
Table 14 evaluates the unquantified benefits identified above for each above using -, ✓, ✓✓,
or ✓✓✓ where more ticks represents greater benefit.
Table 14: Unquantified assessment of benefits
Defer
invest-ment
Option 1
Option 2
Option 3
Option 4
Option 5
Option 6
N N-G-1
N-G-1 (with
demand mgmt.)
N-1 N-G-1 N-1 N
Environment - Global - ✓ ✓ ✓ ✓ ✓ -
Competition benefits - ✓✓✓ ✓✓ ✓ ✓✓✓ ✓ -
Unquantified unserved energy benefits
- ✓✓✓ ✓✓ ✓ ✓✓✓ ✓ -
Operational benefits - ✓✓✓ ✓✓ ✓ ✓✓✓ ✓ -
Optionality ✓✓✓ - ✓ ✓✓✓ - ✓✓✓ ✓✓✓
Unquantified benefits ranking
7 3= 3= 1= 3= 1= 6
The unquantified competition, unserved energy, and operational benefits support options
that provide a higher level of voltage support and transfer capability into the WUNI region.
Options that invest less in stage 1 tend to provide greater optionality given an uncertain
generation and demand future. Given the current significant demand and generation
uncertainty, particularly associated with the timing of the decommissioning of the Rankine
units, we have given greater weight to optionality than other unquantified benefits. As such,
we have ranked option 3 higher than option 2.
5 Identify solution
This section presents our preferred solution from this investigation, which forms the basis of
this major capex proposal.
5.1 Preferred solution
Our base-case net-benefit analysis assessed options 2 and 3 as the options with the highest
net-benefit.
Our sensitivity analysis confirms options 2 and 3 have the highest net-benefit over most
sensitivity scenarios.
When considering unquantified benefits, the Capex IM considers two options as being
similar if the difference in their net benefits is less than 10% of the proposed capital cost of

Identify solution
Waikato and Upper North Island Voltage Management © Transpower New Zealand Limited. All rights reserved.
40
the option with the highest net-benefit25. In this case, options 2 and 3 have the same net-
benefit so we consider unquantified benefits.
Option 2 has significantly higher competition, operational, and unserved energy unquantified
benefits than option 3 as it provides for stable voltage support into the WUNI region without
relying on the single remaining major generator in the WUNI region. As a result, we conclude
N-G-1 (with demand management) is our preferred long-term security standard for the WUNI
region.
However, as indicated above we have given significant weight to the optionality that option 3
provides. Given the current uncertain future of the Rankine units we do not consider it
economically prudent to commit considerable expenditure on the series capacitors at this
time. Doing so risks commissioning the series capacitors earlier than they would be needed
if the Rankine units were to stay.
If the Rankine units do retire in 2022 (or we receive no new information) and there are no
other demand or generation developments, we will undertake additional consultation on the
series capacitors with the intention of applying for them in a stage 2 proposal with a
commissioning date before winter 2024. To reduce the lead time needed to commission the
series capacitors, we are seeking approval for preparatory works for the series capacitors in
this proposal.
We will investigate the use of non-transmission solutions to help deliver N-G-1 security (with
demand management) during 2023 (and as a risk mitigation measure should the Rankine
units retire earlier than 2022 or demand grow unexpectedly).
Table 15 summarises our assessment of our preferred transmission solution.
Table 15: Quantitative and qualitative ranking of options
Defer invest-ment
Option 1 Option 2 Option 3 Option 4 Option 5 Option 6
N N-G-1 N-G-1 (with
demand mgmt.)
N-1 N-G-1 N-1 N
Net-benefit $0 -$666 $155 $155 $94 $72 $62
Unquantified benefits ranking
7 3= 3= 1= 3= 1= 6
Overall ranking 6 7 2 1 4 3 5
5.2 Non-transmission solutions procurement process
In parallel to this MCP application, we are running a second request for information for non-
transmission solutions – the first request being part of the long-list consultation in 2016. In
25 See Schedule D, Clauses (1)(c)(ii) and (2)(a) of the Capex IM.
Proposal cost and major capex allowance
Waikato and Upper North Island Voltage Management © Transpower New Zealand Limited. All rights reserved
41
our main proposal we explain the process we intend to follow to revise our preferred option if
we receive materially new information on reliable and economic NTS.
6 Proposal cost and major capex allowance
Transpower is seeking approval from the Commission to recover the full costs associated
with the proposed investment.
In this section we outline our calculation of the major capex allowance and the cost for the
proposed investment, covering our estimates of capital expenditure and our approach to
estimating those costs.
6.1 Approach to estimating capex
We use TEES (Transpower’s Enterprise Estimating System) to estimate the cost of all capex
projects. TEES provides:
• instant access to the best available, up-to-date information for all users
• the ability to apply cost escalation (commodity input prices and exchange rates)
• consistency of costing across many parts of the business
• a costing system which is easily updated based on lessons learnt
• high quality and detailed spend forecasting capability (spend curves which
determine where spend will occur over the project duration)
• links to and interfaces with key cost forecast information to Transpower’s financial
management system (FMIS).
TEES produces cost estimates for a project based on the historical rates from past projects
or known current rates. For this project, we have used TEES to produce estimates for the
volumetric and enabling works scope items (e.g. cables, foundations, excavation). Because
we have not installed a dynamic reactive device since we began using TEES, TEES does
not have a history of similar assets with which to produce an estimate for these devices.
Therefore, we have based our estimate for the supply and installation of the dynamic
reactive devices (e.g. SVCs) on information from potential vendors received through a
request for information (RFI) process.
We have then added costs to this base estimate, including:
• environmental and property cost
• changes in the cost of foreign exchange and key commodities such as external
labour, copper, steel, and aluminium
• a risk adjustment – to account for cost uncertainty not represented in our lower and
upper bound estimates.
Our estimated capex and proposed major capex allowance represent P50 estimates – i.e.
the probability of the actual cost being higher or lower than our estimate is the same (i.e.
50%).

Proposal cost and major capex allowance
Waikato and Upper North Island Voltage Management © Transpower New Zealand Limited. All rights reserved.
42
To derive P50 estimates for all capex categories other than the risk adjustment, we have
estimated for each cost category a lower bound, an upper bound and a most likely (or mode)
outcome and assumed that all possible capex outcomes would follow a triangular
distribution.
To derive a P50 estimate for the risk adjustment, we have assigned probabilities of
occurrence to each identified risk item and ran a simulation to determine the overall risk
adjustment distribution and to ultimately identify the P50 estimate.
We note that our estimated project cost is expressed in 2019 dollars (it is ‘real 2019’). To
derive a nominal major capex allowance, we have added to it inflation cost and interest
during construction (IDC).
6.2 Capex breakdown
In Table 16 we describe the high-level cost categories used in this application.
Table 16: Cost category descriptions
Stage 1 investigation Investigation costs are costs related to the identification of our preferred solution and the development of this MCP stage 1 proposal.
Design
Design costs are the costs for detailed design and the technical investigations and studies required to implement the preferred solution. This category includes consultant support, e.g. environmental, noise, and commissioning consultants.
Overheads Overhead costs are the Transpower staff and contractor overhead related costs to deliver this project, and some contractor overheads such as insurance, project management, health and safety plans.
Dynamic reactive devices Dynamic reactive devices are the costs to supply and install dynamic reactive devices such as static var compensators (SVCs).
Post-fault demand management scheme
Post-fault demand management are the costs to design, install and commission a post-fault demand management (special protection) scheme in the Waikato and Upper North Island.
Civil works
Civil works are the costs to build foundations and other associated costs for the dynamic reactive devices and transformers to be installed and commissioned. The costs also include associated civil costs for this project such as oil containment, security fencing, earthworks, underground services and drainage.
Primary plant works Primary plant works are the costs of transformer supply and installation as well as associated equipment such as circuit breakers and bus modifications.
Cable works Cable works are the costs of supplying and installing underground cable including the required trenching of the cable.
Protection works Protection works are the costs to supply and install protection schemes related to this project.
Secondary works Secondary works include the design, install and commissioning of SCADA and communication devices.

Proposal cost and major capex allowance
Waikato and Upper North Island Voltage Management © Transpower New Zealand Limited. All rights reserved
43
Miscellaneous works Miscellaneous works include associated project costs not covered elsewhere including environmental costs and stakeholder engagement.
Additional Risk adjustment In addition to our lower and upper bound estimates, we have itemised all foreseeable risks that may affect the cost of the project (e.g. increase in the vendor price for dynamic reactive devices).
Stage 2 Investigation
Stage 2 Investigation costs are costs related to continuing this project including the industry consultation on the stage 2 preferred option and undertaking further studies to develop the preferred solution for the stage 2 proposal.
6.3 Capex estimate
Our estimated capex, both for the Otahuhu and Hamilton dynamic reactive devices and for
the WUNI post-fault demand management are represented in Table 1726. The estimates also
cover preparation works for stage 2 including additional investigation, consultation, obtaining
property rights and environmental approvals, design work and non-binding tendering for
future series capacitor installation. The equipment cost of the series capacitors are to be
included separately as a separate application (stage 2) to the Commerce Commission.
Table 17: Major capex proposal stage 1 capex estimate (excl. IDC and inflation)
Capex, $000, P50
Otahuhu site
Hamilton site
Total project
Real 2019
Stage 1 investigation
Design
Overheads
Otahuhu 220 kV dynamic reactive device - supply and installation
Hamilton 110 kV dynamic reactive device - supply and installation
Post-fault demand management scheme
Civil works
Primary plant works
Cable works
Protection works
Secondary works
Miscellaneous works
Capex - sub-total (Stage1)
Additional Risk adjustment
26 We have redacted Table 17 from the public version of this report as we have not concluded the procurement of transmission components. We have provided Table 17 to the Commerce Commission.

Proposal cost and major capex allowance
Waikato and Upper North Island Voltage Management © Transpower New Zealand Limited. All rights reserved.
44
Capex, $000, P50
Otahuhu site
Hamilton site
Total project
Real 2019
Capex - total risk adjusted (Stage 1)
Stage 2 preparatory works
Capex - total risk adjusted (Stage 1+2) 55,785 54,248 132,269
6.4 Major capex allowance
A summary of our major capex allowance calculation, including financing costs, and inflation
is shown in Table 18 with an annual break down.
Our request for proposals (RFP) for dynamic reactive devices closes in February 2020. We
will update our MCA calculation if there is a material change in our cost estimate from this
RFP.
Table 18: Derivation of Major Capex Allowance and annual allocation
Major Capex Allowance, $000, P50
Total project
2018 2019 2020 2021 2022 2023 2024 Total
Capex - total risk adjusted (real 2019)
1,132 1,509 4,133 57,919 55,848 11,728 - 132,269
Inflation - - 40 1,380 2,511 682 - 4,613
Capex - total risk adjusted (nominal)
1,132 1,509 4,173 59,298 58,359 12,410 - 136,881
Interest during construction (IDC)
28 121 213 1,265 3,388 2,482 89 7,587
Major Capex Allowance 1,160 1,630 4,386 60,563 61,747 14,892 89 144,469
6.5 Project requirements and project management approach to
achieve proposed major capex project outputs
The requirements to complete the dynamic reactive device installations at both Otahuhu
(220 kV) and Hamilton (110 kV) substations are similar and are outlined at a high level as
follows. Both sites are owned by Transpower hence there is no property acquisition required.
• Outline plans (i.e. both sites are designated under the RMA)
• Consents for handling contaminated soils
• Regional Council resource consents (if required)
• Civil works for switchyard development
• Structural works including equipment support structures and buildings
• Electrical site works
• Supply and installation of protection relays, auxiliary relays, cabinets/panels and
circuits
• Station services auxiliaries

Proposal cost and major capex allowance
Waikato and Upper North Island Voltage Management © Transpower New Zealand Limited. All rights reserved
45
• Communication and HMI works
• Equipment supply (including power transformer), installation and commissioning
The following items are included in the requirements to complete the post-fault demand
management scheme.
• Design
• Functionality statement
• VSAT system changes
• Market System integration
• SCADA/EMS changes
• Operator training and documentation
The following items are included in the requirements to complete the stage 1 preparatory
works relating to the series capacitors.
• Additional investigation and consultation
• Obtaining property rights and environmental approvals
• Design work
• Non-binding tendering
The proposed major capex project will be implemented and managed using Transpower’s
standard project delivery procedures including governance oversight, planning, scheduling,
contract management, cost management, risk management, technical review and
performance reporting. Transpower has appropriate processes in place and will deploy
suitably experienced management and technical resources to monitor cost performance
against budget, project milestones against required dates and scope and quality of
deliverables with the objective of delivering the projects to budget, on time and to the
required quality standards.
Factors that may affect Transpower’s ability to achieve each major capex project output that
is proposed include:
• Failure to establish a contract with a suitably qualified dynamic reactive device
vendor for the Upper North Island and Waikato installations. This is largely outside
Transpower’s control, but we consider it to be highly unlikely as four suitable
vendors have advised that they will be submitting proposals in response to an RFP
that we issued in November.
• Technical issues with the implementation of the post-fault demand management
scheme. Transpower has significant experience implementing Special Protection
Schemes throughout the network, although this scheme is more complex and
bespoke than existing schemes. To mitigate this risk, we have undertaken
investigation and modelling of the scheme to confirm its feasibility. Therefore, we
consider the risk of implementation failure is low.
• Failure to secure the property rights and RMA requirements for the BHL-WKM
series capacitor. This is largely outside Transpower’s control. Whilst negotiations
with the landowner of the favoured site have gone well to date there is no formal

Proposal cost and major capex allowance
Waikato and Upper North Island Voltage Management © Transpower New Zealand Limited. All rights reserved.
46
agreement in place to purchase the land. We intend to acquire property rights
following Commerce Commission approval of our proposal. We have partially
mitigated the risk of failing to acquire the land by identifying an alternative site
already owned by Transpower (although this alternative site has a greater risk of
being challenged by under the RMA).

Appendix 1
Waikato and Upper North Island Voltage Management © Transpower New Zealand Limited. All rights reserved
47
Appendix 1 Effect on transmission charges
If the Commerce Commission approves this investment proposal and we commission the
works as outlined, interconnection transmission charges27 will increase.
Table A1-1 shows our estimated increase in interconnection revenue following the proposed
commissioning of the two dynamic reactive devices and the WUNI post-fault demand
management scheme in 2022, and stage 2 preparatory costs28. This table also shows the
resulting increase in dollars per kWh and dollars per kW, assuming annual national energy
demand of 38 GWh and national peak demand of 6500 MW.
Table A1-1: Estimated increase in Transpower’s interconnection revenue (nominal)
Pricing year Increase in annual
interconnection revenue
Increase in annual interconnection revenue (c/kWh)
Increase in annual interconnection revenue ($/kW)
2020/21 $0.2m 0.00 0.04
2021/22 $0.4m 0.00 0.07
2022/23 $5.4m 0.01 0.9
2023/24 $10.1m 0.03 1.6
2024/25 $10.3m 0.03 1.6
2025/26 $10.3m 0.03 1.6
2026/27 $10.4m 0.03 1.6
2027/28 $10.4m 0.03 1.6
2028/29 $10.4m 0.03 1.6
2029/30 $10.3m 0.03 1.6
2030/31 $10.3m 0.03 1.6
2031/32 $10.2m 0.03 1.6
2032/33 $10.1m 0.03 1.6
2033/34 $10.0m 0.03 1.5
2034/25 $9.9m 0.03 1.5
We expect our increase in revenue to peak in 2027, after which revenue decreases as the
assets depreciate. Attachment F presents the estimated increase in transmission costs for
each customer and connection location.
Table A1-2 shows the estimated increase in transmission revenue in 2027/28 of each short-
list option (including stage 2 components)29. For the non-transmission solution option (option
27 The project is for investment in interconnection assets. 28 This calculation assumes our RCP3 vanilla WACC of 4.57%. 29 The revenue increase for option 3 in Table A1.2 does not match Table A1.1 as Table A1.2 assumes the stage 2 components have been commissioned and are incurring revenue.

Appendix 1
Waikato and Upper North Island Voltage Management © Transpower New Zealand Limited. All rights reserved.
48
1), we assume the demand management costs are funded through opex and directly passed
through to customers.
Table A1-2: Estimated increase in transmission revenue in 2027/28 of each short-list option
Option Estimated increase in transmission revenue
in 2027/28 ($m, nominal)
Defer investment (N) $0m
Option 1 – NTS (N-G-1) $200m
Option 2 (N-G-1, with demand mgmt.) $17m
Option 3 (N-1) $17m
Option 4 (N-G-1) $26m
Option 5 (N-1) $15m
Option 6 (N) $10m

Appendix 2
Waikato and Upper North Island Voltage Management © Transpower New Zealand Limited. All rights reserved
49
Appendix 2 Unserved energy analysis methodology and
assumptions
The following sections present the methodology and assumptions we have used to
determine unserved energy costs in Section 4.1.3, and the future capital costs of modelled
projects in Section 4.1.4.
A.2.1 Methodology
This section summarises the methodology we have used for the quantified analysis.
Each option has an upfront capital cost for the assets commissioned in 2022 or 2023 (i.e. the
subject of this investigation). These are shown in Section 4.1.2.
Throughout the 23-year calculation period (2023-2045), we forecast the following costs of
each option:
• Capital costs of modelled components required to maintain voltage stability from
the end of 2028
• Unserved energy costs
• Transmission losses
We add these costs to the stage 1 and stage 2 capital cost and O&M of each option to get
the total cost of an option over the calculation period (after discounting costs to 2019 $). We
present unserved energy and modelled project costs as benefits relative to the “defer
investment” option. Transmission losses are presented as benefits relative to the option with
the lowest loss benefits.
Modelled project capital cost and unserved energy benefits are expected benefits – the
mean of a distribution of future costs as a function of the percentile of the demand forecast.
In other words, we assess future benefits using a distribution of demand rather than a single
demand forecast and take the mean of all percentiles within the distribution to get an
expected benefit. In the high percentiles within this distribution, we expect to have high
unserved energy costs and capital expenditure to mitigate these costs (and therefore high
benefits from short-list options that provide capacity at the beginning of the calculation
period). Similarly, in low demand percentiles, there are low unserved energy costs and low
capital costs.
This method is summarised in Figure A2-1 and Figure A2-2 (stylised representations – not to
scale).
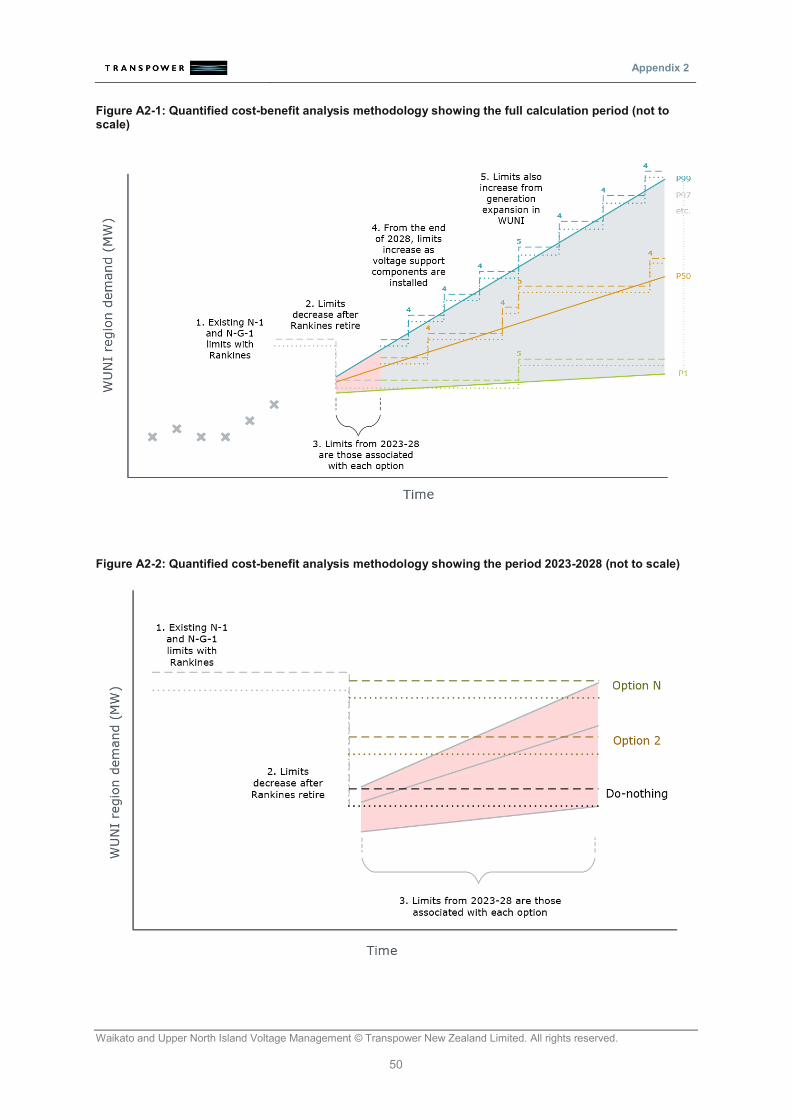
Appendix 2
Waikato and Upper North Island Voltage Management © Transpower New Zealand Limited. All rights reserved.
50
Figure A2-1: Quantified cost-benefit analysis methodology showing the full calculation period (not to scale)
Figure A2-2: Quantified cost-benefit analysis methodology showing the period 2023-2028 (not to scale)

Appendix 2
Waikato and Upper North Island Voltage Management © Transpower New Zealand Limited. All rights reserved
51
These figures illustrate the key features of the methodology:
1. Today’s voltage stability limits are higher than peak demand, in part due to the
thermal generation operating in the WUNI region.
2. Following the Huntly Rankine units’ retirement in 2022 the limits drop significantly.
3. From the end of 2022 to 2023 the stage 1 and stage 2 components are
commissioned. The timing of these components is fixed.
4. No additional components are commissioned until the end of 2028, five years after
the last component within the immediate investment horizon is commissioned. This
assumption is made to test the costs and benefits of deferring investment.
5. Each of the options represent a different trade-off between upfront capital cost and
voltage stability limits – the more we invest during the immediate investment horizon,
the higher the voltage stability limit (as shown in Figure A.2). Therefore, the lower the
risk of demand growing unexpectedly and having high unserved energy costs during
this period. Conversely, if demand does not grow as expected then investing to raise
these limits may be sub-optimal. By using a distribution of demand forecasts and
calculating expected costs, we can ensure our decision is robust to a range of
demand outcomes.
6. From the end of 2028, additional transmission components are commissioned when
the reduction in unserved energy costs from the component is greater than the
annualised capital and O&M cost of the component (i.e. when the annual benefit is
greater than the annualised cost). This allows us to minimise the total cost of each
demand percentile. As components are commissioned the N-1 and N-G-1 voltage
stability limits increase, as seen in Figure A.1.
7. In addition, the voltage stability limits occasionally increase or decrease due to
generation expansion or decommissioning in the WUNI region (per the EDGS), which
may defer or avoid the need for additional future transmission components.
We have used this approach to calculate expected benefits, and to test which stage 1 and 2
components perform the best taking account of the considerable demand growth
uncertainty.
We have made some carefully selected simplifying assumptions to order to consider the
options over a large range of future demand. We have only used SVCs as components to
increase voltage stability limits during the period from the end of 2028. The Power Systems
Analysis report shows there will be a need for assets to increase static limits (primarily static
capacitors). We have not included static components as a modelled project in the analysis
because the cost to increase static limits with static capacitors is much less than the cost of
SVCs, and therefore will not significantly affect our decision today.
The following sections describe the assumptions we have used to quantify unserved energy
costs, and therefore the future investment required to mitigate these costs.

Appendix 2
Waikato and Upper North Island Voltage Management © Transpower New Zealand Limited. All rights reserved.
52
A.2.2 Probability of an event
We have defined two contingency types for this analysis:
• Fault rates refer to faults of the circuit, generation unit, or dynamic reactive device
that can result in a transient voltage stability event (including auto-reclose faults
that only result in a very short disconnection of a circuit (<1s) but can still cause
transient voltage stability events).
• Removal refers to the fault rate plus the removal of the asset due to faults of other
equipment or upstream infrastructure, or from human error processes. For this
analysis, we have removed very short duration disconnections (e.g. auto-reclose
faults) from our population of historical removal events of circuits to avoid skewing
our asset availability values.
There are two types of load limits used in this analysis – dynamic and steady-state. As
described in the Power System Analysis report, based on the generation and transmission
assets operating at any given time, one of these limits will be the ‘binding limit’. In other
words, one of these limits will be lower (in MW) than the other and will be the relevant
operating limit for the grid at that time. This is relevant for this analysis as the type of
contingency that would result in a voltage stability event occurring is different for each limit.
We only assess steady-state limits during the period to 2028 as raising these limits is most
easily achieved using static capacitors, which we have not included as modelled projects in
this economic analysis.
Furthermore, we have assessed the consequence and probability of events based on both
N-G-1 and N-1 limits. N-G-1 refers to a fault or removal occurring when another asset is out
of service. In this instance, the “G” in N-G-1 may be a generating unit, a dynamic reactive
device, or a major 220 kV circuit. N-1 refers to a fault or removal of a single asset.
Table A2-3 shows the contingency type that results in a voltage stability event when WUNI
region load is above the associated limit.
Table A2-3: Contingency types that result in voltage collapse for each of the voltage stability limits
N-1 N-G-1
Steady state30
Removal of “1” n/a31
Dynamic30 Transient fault (e.g. two-phase to
ground) on “1” Transient fault on “1” while “G” is removed
Furthermore, there are many sub-sets of these contingency types that have different
probabilities of occurring and different voltage stability limits, based on the specific asset
failure that defines the contingency. Figure A2-3 and Figure A2-4 show the contingencies
associated with each of the limits used in the analysis. It is not practical to produce an
30 Steady state (or static) and dynamic limits refer to different types of contingencies that cause voltage collapse. Dynamic voltage collapse is initiated by a transient fault (e.g. a two-phase to ground), whereas steady state voltage collapse is initiated by removing a circuit from service (and therefore is more likely to occur). 31 The steady-state N-G-1 limit is higher than the dynamic limit for both under- and over-voltage, so we have not assessed it in this analysis.

Appendix 2
Waikato and Upper North Island Voltage Management © Transpower New Zealand Limited. All rights reserved
53
exhaustive list of all the contingencies that are mitigated with dynamic reactive devices – we
have only included the most significant, known contingencies. We have combined several
individual contingencies into groups represented by the most severe contingency that sets
the limit for that group.
Figure A2-3: Contingency groups used in the analysis (under-voltage)

Appendix 2
Waikato and Upper North Island Voltage Management © Transpower New Zealand Limited. All rights reserved.
54
Figure A2-4: Contingency groups used in the analysis (over-voltage)
Table A2-4 below shows the asset fault rate and availability assumptions we have used in
this analysis to determine the probability of each of these contingencies. For N-1
contingencies, the fault rate influences the probability of a transient contingency, and the
availability influences the probability of a steady-state contingency. For N-G-1 contingencies,
the availability of the “G” asset also influences the probability of a transient contingency.
Table A2-4: WUNI fault rates and asset availability assumptions
Fault Fault rate (p.a.) Availability (% p.a.)
SVC 0.20 98%
Huntly unit 5 1.80 90%
PAK-WKM-1 0.36 99.4%
PAK-WKM-2 0.36 99.4%
HAM-WKM-1 0.74 99.9%
OHW-WKM-1 0.96 99.9%
OTA-WKM-1 5.57 99.9%
OTA-WKM-2 5.67 99.9%
HLY-OHW-1 0.14 99.9%

Appendix 2
Waikato and Upper North Island Voltage Management © Transpower New Zealand Limited. All rights reserved
55
Fault Fault rate (p.a.) Availability (% p.a.)
HLY-OHW-2 0.14 99.9%
OHW-OTA-1 0.59 99.9%
OHW-OTA-2 0.59 99.9%
HLY-OTA-2 0.72 99.9%
DRY-HLY-1 0.43 99.9%
DRY-OTA-1 0.18 99.9%
HAM-OHW-1 0.31 99.9%
The fault rate and asset availability has been determined as follows:
• Huntly unit 5: the fault rates are based on the unit’s historical fault rate. The
availability is assumed to be 90%, allowing for the possibility of a long duration
unplanned outage to the unit or the upstream gas supply. We test the sensitivity of
this assumption to our result in our sensitivity analysis.
• SVC: the fault rate and availability is based on historical transient faults to SVCs
and STATCOMs, and historical faults at our stations that may also cause an SVC
to fault.
• PAK-WKM 1 and 2: the fault rate and availability of the cables that make up the
BHL-PAK sections of the circuits is based on international statistics from CIGRE.
This is combined with the historical fault rate and availability of our 220 kV circuits
to give a weighted average for these circuits.
• OTA-WKM 1 and 2: the fault rates are based on the actual rates for these circuits
as they are outliers in our fleet that experience a greater rate of faults.
• All other circuits: the fault and removed rates and durations are based on the
average fault rate and duration from our 220 kV overhead lines (per 100 km),
scaled up or down based on the length of the line.
We assume 6% of all circuit faults are two-phase to ground faults or worse, based on historic
faults in our fleet. We assume the fault must be within 5 km of the station at either end of the
circuit to be severe enough to cause a significant voltage event.
We assume each voltage stability event has a 50% chance of being an under-voltage event,
and 50% an over-voltage event.
Table A2-5 shows the rate of contingencies per year for each of the contingency sets
included in this analysis. We assume these rates do not change as new transmission or
generation assets are commissioned. UV refers to under-voltage, and OV to over-voltage.

Appendix 2
Waikato and Upper North Island Voltage Management © Transpower New Zealand Limited. All rights reserved.
56
Table A2-5: Annual probability of contingencies
Number of contingencies p.a.
UV N-1 (static) 1.6
UV N-G-OTA–WKM (dynamic) 0.004
UV N-G-OTA-WKM (static) 0.6
UV N-G-1 (dynamic) 0.001
UV N-G-OTA-WKM (dynamic, single phase) 0.06
UV N-G-SVC (dynamic) 0.01
OV N-1 (dynamic) 0.03
OV N-G-1 (dynamic) 0.006
A.2.3 Consequence of event
The consequence of an event is a function of two values:
• Magnitude of unserved demand (MWh per event or MWh p.a.)
• Value of lost load ($/MWh)
The two are multiplied together to give the consequence of an event in $ per event or $ p.a.
A.2.4 Magnitude of unserved demand per event
We have used our demand forecast and the voltage stability limits to calculate the annual
magnitude of demand management.
For all options, the magnitude of unserved demand per event is a fixed value multiplied by
the annual probability of demand being above the associated voltage stability limit. For post-
fault demand management used to cover the UV N-G-1 dynamic contingency in some
options, we assume 400 MW of demand is unsupplied for 8 hours (3200 MWh/event). For all
other contingencies, we assume all North Island demand is lost for 36 hours (144,000
MWh/event).
This method is summarised in Figure A2-5.

Appendix 2
Waikato and Upper North Island Voltage Management © Transpower New Zealand Limited. All rights reserved
57
Figure A2-5: Method to calculate magnitude of unserved demand
The following section presents the voltage stability limits used to calculate the magnitude of
unserved demand.
A.2.5 Voltage stability limits
Table A2-6 shows the voltage stability limits of each option used during the immediate
investment horizon. The limits for the defer investment option, options 1-3, and option 6 were
produced from the modelling presented in the Power Systems Analysis report. For options 4
and 5, we have assumed each additional 150 Mvar dynamic reactive device in these options
increases voltage stability limits by 125 MW. We test the sensitivity of this assumption in our
sensitivity analysis.

Appendix 2
Waikato and Upper North Island Voltage Management © Transpower New Zealand Limited. All rights reserved.
58
Table A2-6: Starting voltage stability limits of each option applying in 2023/2024 (MW)
UV N-1
UV N-G-OTA-WKM (2ph)
UV N-G-OTA-WKM
(static)
UV
N-G-1
UV N-G-OTA-WKM (1ph)
UV N-G- SVC
TOV N-1 TOV
N-G-1
Defer investment
3170 2900 3115 2715 3055 2815 2890 2680
Option 1 3170 2900 3115 2715 3055 2815 2890 2680
Option 2 3455 3375 3415 3075 3415 3175 3455 3355
Option 3 3295
3455
3175
3375
3240
3415
2985
3075
3240
3415
3085
3175
3295
3455
3105
3355
Option 4 3650
3775
3500
3625
3500
3625
3265
3415
3540
3665
3365
3515
3650
3775
3480
3605
Option 5 3295
3490
3175
3300
3240
3365
2985
3110
3240
3365
3085
3210
3295
3490
3105
3230
Option 6 3295 3175 3240 2985 3240 3085 3295 3105
From the end of 2028, modelled dynamic reactive devices are commissioned to increase
demand limits and reduce unserved energy costs. We assume all demand limits increase by
125 MW per additional dynamic reactive device.
Before calculating the consequence of an event, we have modified the limits shown in Table
A2-6:
• We have increased the limits to account for expected generation expansion in the
WUNI region. We assume this generation increases voltage stability limits by 80%
of its real (MW) capacity32, based on the estimated increase for a representative
generation resource located at Huntly. For this unserved energy analysis, we take
the average annual expansion of each of the five generation expansion scenarios
shown in Section 4.1.1.
• Similarly, we have increased the limits for modelled thermal project during the
calculation period, assuming the timing of this increase is triggered from when
peak demand exceeds 3350 MW or from 2025 (whichever occurs latest).
A.2.6 Value of lost load
When calculating the economic cost of an interruption to electricity supply in the WUNI
region we use a Value of Lost Load (VoLL) equal to $26,500/MWh. This number is based on
the value specified in the Code defined as $20,000/MWh in 2004 inflated at CPI to 2019
dollars.
Our sensitivity analysis uses VoLLs of +/- 50% of these base values.
32 We have also multiplied the capacity of solar PV and wind generation by capacity factors of 0.1 and 0.2, representing the estimated output of these resources during the winter peak.