Embed Size (px)
Citation preview

WAJAX CORPORATION News Release
TSX Symbol: WJX
WAJAX REPORTS 2017 FOURTH QUARTER RESULTS
Toronto, Ontario – March 5, 2018 – Wajax Corporation (“Wajax” or the “Corporation”) today announced improved 2017 fourth quarter results compared to the previous year. (Dollars in millions, except per share data) Three Months Ended December 31 Twelve Months Ended December 31
2017 2016 2017 2016
CONSOLIDATED RESULTS
Revenue $376.6 $313.7 $1,319.3 $1,221.9
Equipment sales $156.5 $111.5 $459.8 $412.6
Equipment rental $8.7 $8.0 $31.9 $34.7
Industrial parts $82.9 $77.9 $340.0 $320.4
Product support $110.2 $101.8 $426.0 $398.1
Other $18.3 $14.4 $61.7 $56.1
Net earnings $8.0 $8.9 $30.9 $11.0
Basic earnings per share $0.41 $0.45 $1.58 $0.55
Adjusted net earnings(1)(2)
$10.9
$8.9
$33.5
$20.1
Adjusted basic earnings per share(1)(2)(3)
$0.56 $0.45 $1.71 $1.01
Fourth Quarter Highlights
Revenue in the fourth quarter of 2017 increased 20%, or $62.9 million, to $376.6 million from $313.7 million in the fourth quarter of 2016. The following factors contributed to the increase in revenue: o Regionally, revenue increased 40% and 14% in western and eastern Canada respectively and
decreased 1% in central Canada.
o Equipment sales have increased due primarily to higher construction and material handling sales in all regions and higher forestry and engine and transmission sales in western Canada. These increases were partly offset by a decrease in mining equipment sales in western and eastern Canada and a decrease in power generation sales in central Canada.
o Revenue from industrial parts has increased due to higher sales in all regions.
o Product support revenue has increased on strength in construction parts and service sales in
western Canada and higher engines and transmissions and power generation sales in all regions.
EBIT increased $3.2 million, or 21%, to $18.4 million in the fourth quarter of 2017 versus $15.2 million in the same quarter of 2016.
(1) The year-over-year improvement is primarily due to increased revenue and
a $1.4 million gain recorded on sales of properties offset partially by lower gross profit margins and an accrual of $2.6 million in the prior year for insurance proceeds related to the Fort McMurray wildfires that occurred in the second quarter of 2016.
The Corporation generated net earnings of $8.0 million, or $0.41 per share, in the fourth quarter of 2017 versus $8.9 million, or $0.45 per share, in the same quarter of 2016. The Corporation generated adjusted net earnings of $10.9 million, or $0.56 per share, in the fourth quarter of 2017 versus $8.9 million, or $0.45 per share, in the same quarter of 2016. Adjusted net earnings in the fourth quarter of 2017 excludes the after-tax gain recorded on sales of properties and senior notes redemption costs.
(1)
The Corporation’s backlog at December 31, 2017 of $178.9 million increased $8.6 million, or 5%, compared to September 30, 2017 due primarily to increases in construction and power generation orders offset partially by a decrease in crane and utility orders. The Corporation’s backlog at December 31, 2017 of $178.9 million increased $53.1 million, or 42%, compared to December 31, 2016 due primarily to higher construction, material handling and power generation equipment orders and higher industrial parts orders.
(1)
Inventories of $322.8 million at December 31, 2017 decreased $10.2 million from September 30, 2017 due primarily to lower forestry, crane and utility and engines and transmissions inventory offset partially by higher construction inventory.
The Corporation’s leverage ratio decreased slightly to 2.06 times at December 31, 2017 compared to 2.08 times at September 30, 2017.
(1)
The Corporation declared a Q1 2018 dividend of $0.25 per share payable on April 4, 2018 to shareholders of record on March 15, 2018.
Commenting on the Corporation’s fourth quarter results, President and Chief Executive Officer Mark Foote stated, “We are satisfied with the improvement in our fourth quarter financial results. As compared to the same period last year, we saw strong gains in the construction, forestry and engine and transmission categories and regional strength in our eastern and western Canada performance. We are also very proud to report that 2017 was Wajax’s safest year on record, based on a 33% reduction in recordable incidents and a Total Recordable Incident Frequency (TRIF) rate of 1.45.
We express our thanks to the entire Wajax team
for their hard work and ongoing dedication to improving customer service, working safely and delivering better financial results.”
(4)
Mr. Foote continued, “In 2018, Wajax expects adjusted net earnings to increase, due primarily to organic revenue growth. Given the Corporation’s plans to increase market share in highly competitive categories, gross margins are expected to be under pressure. While Wajax will make planned investments in programs that advance the Corporation’s strategy, an ongoing focus on overall cost productivity is expected to assist Wajax in managing expected margin pressure. Regionally, market conditions in central and eastern Canada are expected to be generally stable, and while conditions in western Canada may continue to improve in 2018, year-over-year gains are not expected to be as significant as they were in 2017.”
(1)
Mr. Foote concluded, “During the year, we completed a comprehensive review and update of our Strategic Plan which defines objectives for organic growth, acquisitions and operations. Our organic growth priorities have been adjusted to increase the focus on product and service categories where Wajax has market share opportunities and where customers are less affected by commodity prices. We also plan to invest in technology and customer-facing teams, focusing on sales professionals and technicians. Our team is very confident in our long term growth potential and opportunities for improved productivity, both of which are enhanced by the benefits of the strategic reorganization completed in the first quarter of 2017. Further details on our Strategic Plan are available in our most recent Management’s Discussion and Analysis, our upcoming Annual Report and on our website.” Wajax Corporation Founded in 1858, Wajax (TSX: WJX) is one of Canada’s longest-standing and most diverse industrial products and services providers. The Corporation operates an integrated distribution system providing sales, parts and services to a broad range of customers in diversified sectors of the Canadian economy, including: construction, forestry, mining, industrial and commercial, oil sands, transportation, metal processing, government and utilities and oil and gas. The Corporation’s goal is to be Canada’s leading industrial products and services provider, distinguished through its three core capabilities: sales force excellence, the breadth and efficiency of repair and
maintenance operations, and the ability to work closely with existing and new vendor partners to constantly expand its product offering to customers. The Corporation believes that achieving excellence in these three areas will position it to create value for its customers, employees, vendors and shareholders. Wajax will webcast its Fourth Quarter Financial Results Conference Call. You are invited to listen to the live webcast on Tuesday March 6, 2018 at 1:00 p.m. ET. To access the webcast, please visit our website wajax.com, under “Investor Relations”, “Events and Presentations”, “Webcasts” and click on the webcast link. Notes: (1) “Adjusted net earnings”, “Adjusted basic earnings per share”, “Backlog” and “Leverage ratio” are
financial measures which do not have standardized meanings prescribed under generally accepted accounting principles (“GAAP”), and may not be comparable to similar measures presented by other issuers. EBIT is an additional GAAP measure. The Corporation’s Management’s Discussion and Analysis includes additional information regarding these financial measures, including definitions and reconciliations to the most comparable GAAP measures, under the heading “Non-GAAP and Additional GAAP Measures”.
(2) Adjusted net earnings for the three months ended December 31, 2017: net earnings excluding gain recorded on sales of properties of $1.2 million (2016 – nil) and senior notes redemption costs of $4.0 million (2016 – nil), or basic earnings per share of $0.15 (2016 - nil). Adjusted net earnings for the twelve months ended December 31, 2017: net earnings excluding restructuring recovery of $0.2 million, gain recorded on sales of properties of $1.2 million (2016 – nil) and senior notes redemption costs of $4.0 million (2016 – nil), or basic earnings per share of $0.13 (2016 - $0.46).
(3) For the three months ended December 31, 2017, the weighted average shares outstanding for calculation of basic earnings per share were 19,504,107 (2016 – 19,805,485), net of shares held in employee benefit plan trusts. For the twelve months ended December 31, 2017, the weighted average shares outstanding for calculation of basic earnings per share were 19,605,884 (2016 – 19,898,004), net of shares held in employee benefit plan trusts.
(4) Total Recordable Incident Frequency (TRIF) is a methodology for measuring injury frequency commonly used by industrial companies. It is calculated as the total number of recordable incidents times 200,000 hours of work divided by the actual number of hours worked. A recordable incident is one that requires medical treatment beyond first aid.
Cautionary Statement Regarding Forward-Looking Information This news release contains certain forward-looking statements and forward-looking information, as defined in applicable securities laws (collectively, “forward-looking statements”). These forward-looking statements relate to future events or the Corporation’s future performance. All statements other than statements of historical fact are forward-looking statements. Often, but not always, forward looking statements can be identified by the use of words such as “plans”, “anticipates”, “intends”, “predicts”, “expects”, “is expected”, “scheduled”, “believes”, “estimates”, “projects” or “forecasts”, or variations of, or the negatives of, such words and phrases or state that certain actions, events or results “may”, “could”, “would”, “should”, “might” or “will” be taken, occur or be achieved. Forward looking statements involve known and unknown risks, uncertainties and other factors beyond the Corporation’s ability to predict or control which may cause actual results, performance and achievements to differ materially from those anticipated or implied in such forward looking statements. There can be no assurance that any forward looking statement will materialize. Accordingly, readers should not place undue reliance on forward looking statements. The forward looking statements in this news release are made as of the date of this news release, reflect management’s current beliefs and are based on information currently available to management. Although management believes that the expectations represented in such forward-looking statements are reasonable, there is no assurance that such expectations will prove to be correct. Specifically, this news release includes forward looking statements regarding, among other things, our expectations and outlook for 2018, including with respect to adjusted net earnings and gross margins, as well as our expectation that our ongoing focus on cost productivity will assist us in offsetting planned investments in our strategy and expected margin pressure; our outlook on regional end market conditions in Canada during 2018, including our expectation that year-over-year gains in western Canada will not be as significant as they were in 2017; the main elements of our updated Strategic Plan, including adjustments to our organic growth priorities, increased technology investments and investments in customer-facing teams; our confidence in our long term growth potential and opportunities for improved productivity; the benefits of the strategic reorganization we completed in the first

quarter of 2017; our goal of becoming Canada’s leading industrial products and services provider, distinguished through our core capabilities; and our belief that achieving excellence in our areas of core capability will position Wajax to create value for its customers, employees, vendors and shareholders. These statements are based on a number of assumptions which may prove to be incorrect, including, but not limited to, assumptions regarding general business and economic conditions; the supply and demand for, and the level and volatility of prices for, oil, natural gas and other commodities; financial market conditions, including interest rates; our ability to execute our updated Strategic Plan, including our ability to develop our core capabilities, execute on our organic growth priorities, complete and effectively integrate acquisitions and to successfully implement new information technology platforms, systems and software; our ability to realize the full benefits from our 2016 strategic reorganization, including cost savings and productivity gains; the future financial performance of the Corporation; our costs; market competition; our ability to attract and retain skilled staff; our ability to procure quality products and inventory; and our ongoing relations with suppliers, employees and customers. The foregoing list of assumptions is not exhaustive. Factors that may cause actual results to vary materially include, but are not limited to, a deterioration in general business and economic conditions; volatility in the supply and demand for, and the level of prices for, oil, natural gas and other commodities; a continued or prolonged decrease in the price of oil or natural gas; fluctuations in financial market conditions, including interest rates; the level of demand for, and prices of, the products and services we offer; levels of customer confidence and spending; market acceptance of the products we offer; termination of distribution or original equipment manufacturer agreements; unanticipated operational difficulties (including failure of plant, equipment or processes to operate in accordance with specifications or expectations, cost escalation, our inability to reduce costs in response to slow-downs in market activity, unavailability of quality products or inventory, supply disruptions, job action and unanticipated events related to health, safety and environmental matters); our ability to attract and retain skilled staff and our ability to maintain our relationships with suppliers, employees and customers. The foregoing list of factors is not exhaustive. Further information concerning the risks and uncertainties associated with these forward looking statements and the Corporation’s business may be found in our Annual Information Form for the year ended December 31, 2017, filed on SEDAR. The forward-looking statements contained in this news release are expressly qualified in their entirety by this cautionary statement. The Corporation does not undertake any obligation to publicly update such forward-looking statements to reflect new information, subsequent events or otherwise unless so required by applicable securities laws. Additional information, including Wajax’s Annual Report, is available on SEDAR at www.sedar.com.
For further information, please contact:
Mark Foote, President and Chief Executive Officer
Email: [email protected]
Darren Yaworsky, Chief Financial Officer Email: [email protected]
Trevor Carson, Vice President, Financial Planning and Risk Management Email: [email protected]
Telephone #: (905) 212-3300

Wajax Corporation Management’s Discussion and Analysis – 2017 The following management’s discussion and analysis (“MD&A”) discusses the consolidated financial condition and results of operations of Wajax Corporation (“Wajax” or the “Corporation”) for the year ended December 31, 2017. This MD&A should be read in conjunction with the information contained in the Corporation’s consolidated financial statements and accompanying notes for the year ended December 31, 2017. Information contained in this MD&A is based on information available to management as of March 5, 2018. Management is responsible for the information disclosed in this MD&A and the consolidated financial statements and accompanying notes, and has in place appropriate information systems, procedures and controls to ensure that information used internally by management and disclosed externally is materially complete and reliable. Wajax’s Board of Directors has approved this MD&A and the consolidated financial statements and accompanying notes. In addition, Wajax’s Audit Committee, on behalf of the Board of Directors, provides an oversight role with respect to all public financial disclosures made by Wajax and has reviewed this MD&A and the consolidated financial statements and accompanying notes. Unless otherwise indicated, all financial information within this MD&A is in millions of Canadian dollars, except ratio calculations, share, share rights and per share data. Additional information, including Wajax’s Annual Report and Annual Information Form, are available on SEDAR at www.sedar.com.
Wajax Corporation Overview Founded in 1858, Wajax (TSX: WJX) is one of Canada’s longest-standing and most diversified industrial products and services providers. The Corporation operates an integrated distribution system providing sales, parts and services to a broad range of customers in diverse sectors of the Canadian economy, including: construction, forestry, mining, industrial and commercial, oil sands, transportation, metal processing, government and utilities and oil and gas. The Corporation’s goal is to be Canada’s leading industrial products and services provider, distinguished through its three core capabilities: sales force excellence, the breadth and efficiency of repair and maintenance operations and the ability to work closely with existing and new vendor partners to constantly expand its product offering to customers. The Corporation believes that achieving excellence in these three areas will position it to create value for its customers, employees, vendors and shareholders.
Strategic Direction and Outlook The strategic reorganization announced by the Corporation in March 2016 was completed during the first quarter of 2017. During the year, the Corporation also completed a comprehensive review and update of its Strategic Plan which defines objectives for organic growth, acquisitions and operations. The key points of the updated Strategic Plan are as follows:
Organic growth priorities have been adjusted to increase the focus on product and service categories where Wajax has market share opportunities, and where customers are less affected by commodity prices. Historically, Wajax’s peak and trough financial performance has been primarily related to categories that are sensitive to commodity prices. While nothing in the updated strategy lessens the potential upside from growth in these very important areas, the investment focus will be in product and service categories that are more durable through the cycle.
Wajax will continue to integrate its historically decentralized infrastructure and will make increased technology investments to lower its cost-to-serve, improve customer access to its full range of products and services, and open new sales channels. Wajax will also continue to consolidate its physical branch network where opportunities exist and make investments in multi-purpose facilities capable of broadening service to local customers.

Wajax will increase investment in its customer-facing teams, focusing on sales professionals and technicians. The Corporation’s reorganization was effective in right-sizing the company to the then-current business conditions and simultaneously enabling the implementation of stronger sales and shop management practices. Using the foundation now built, the Corporation plans to increase hiring to grow its sales and service teams while continuing to focus on the efficiency of personnel costs in support areas.
The majority of Wajax’s growth is expected to result from organic programs. However, Wajax will continue to review acquisition opportunities that allow the Corporation to increase its ability to serve existing and new customers through expanded geographic reach and extensions to its product and service portfolio.
In 2018, Wajax expects adjusted net earnings to increase, due primarily to organic revenue growth.
(1) Given
the Corporation’s plans to increase market share in highly competitive categories, gross margins are expected to be under pressure. While Wajax will make planned investments in programs that advance the Corporation’s strategy, an ongoing focus on overall cost productivity is expected to assist Wajax in managing the expected margin pressure. Regionally, market conditions in central and eastern Canada are expected to be generally stable, and while conditions in western Canada may continue to improve in 2018, year-over-year gains are not expected to be as significant as they were in 2017. See the Non-GAAP and Additional GAAP Measures and Cautionary Statement Regarding Forward-Looking Information sections.
Annual and Fourth Quarter Highlights 2017 Full Year Highlights
Revenue increased $97.4 million or 8%, to $1,319.3 million, in 2017 versus $1,221.9 million in 2016. Revenue in 2016 included approximately $50 million in additional mining equipment sales that were not repeated in 2017. Adjusting for these sales, revenue increased 13% year-over-year. Regionally:
o Revenue in western Canada of $572 million increased 15% over the prior year. Sales gains in the majority of product categories, led by strong gains in construction and forestry, more than offset reductions in mining.
o Revenue in central Canada of $310 million remained essentially unchanged from the prior year.
o Revenue in eastern Canada of $438 million increased 5% over the prior year due primarily to improved results in industrial parts, construction and on-highway transportation sales.
Selling and administrative expenses as a percentage of revenue decreased 110 basis points to 14.9% in 2017 from 16.0% in 2016. Selling and administrative expenses increased by $1.9 million compared to 2016 due mainly to higher annual incentive accruals offset partially by a gain recorded on sales of properties of $1.5 million.
Adjusted EBITDA margin increased to 6.0% in 2017 from 5.2% in 2016. Adjusted EBITDA excludes the after-tax restructuring (recovery) costs and gain recorded on sales of properties.
(1)
EBIT increased $31.1 million, or 116%, to $58.0 million in 2017 versus $26.9 million in 2016.(1)
The year-over-year improvement is attributable to increased revenue, improved parts and service margin rates and a restructuring recovery of $0.3 million in the current year compared to restructuring costs of $12.5 million in the prior year.
Based on the improved EBIT result, the Corporation generated net earnings of $30.9 million, or $1.58 per share, in 2017 versus $11.0 million, or $0.55 per share, in 2016. The Corporation generated adjusted net earnings of $33.5 million, or $1.71 per share, in 2017 versus $20.1 million, or $1.01 per share, in 2016. 2017 adjusted net earnings excludes the after-tax restructuring recovery, gain recorded on sales of properties and senior notes redemption costs.
(1) 2016 adjusted net
earnings excludes the after-tax restructuring costs.(1)

The Corporation’s backlog at December 31, 2017 of $178.9 million increased $8.6 million, or 5%, compared to September 30, 2017 due primarily to increases in construction and power generation orders offset partially by a decrease in crane and utility orders. The Corporation’s backlog at December 31, 2017 of $178.9 million increased $53.1 million, or 42%, compared to December 31, 2016 due primarily to higher construction, material handling and power generation equipment orders and higher industrial parts orders.
(1)
Inventories of $322.8 million at December 31, 2017 decreased $10.2 million from September 30, 2017 due primarily to lower forestry, crane and utility, and engines and transmissions inventory, offset partially by higher construction inventory. Inventories of $322.8 million at December 31, 2017 increased $39.4 million from December 31, 2016. This was due primarily to an increase in equipment inventories, including a new construction equipment line, to support both the Corporation’s increasing backlog and an expansion of construction equipment rental operations.
Working capital of $298.5 million at December 31, 2017 increased $6.0 million and working capital as a percentage of the trailing 12-month sales decreased by 40 basis points from September 30, 2017. Working capital at December 31, 2017 increased $32.6 million from December 31, 2016 due primarily to higher inventory levels. Working capital as a percentage of the trailing 12-month sales decreased by 150 basis points from 2016 despite the higher inventory levels at December 31, 2017.
(1)
The Corporation’s leverage ratio decreased slightly to 2.06 times at December 31, 2017 compared to 2.08 times at September 30, 2017 and 2.07 times at December 31, 2016.
(1)
On September 20, 2017, the Corporation amended its bank credit facility, increasing the facility size from $250.0 million to $300.0 million, expanding financial covenants and extending the maturity date from August 12, 2020 to September 20, 2021. Proceeds from the amended bank credit facility were used to redeem all of the Corporation’s outstanding 6.125% senior notes on October 23, 2017.
Fourth Quarter Highlights
Revenue in the fourth quarter increased $62.9 million, or 20%, to $376.6 million from $313.7 million in the fourth quarter of 2016. The increase in 2017 was primarily due to higher equipment sales and product support revenues in western and eastern Canada, led by strong gains in the construction, forestry and engines and transmissions product categories.
Selling and administrative expenses as a percentage of revenue decreased 270 basis points to 13.3% in the fourth quarter of 2017 from 16.0% in the same quarter of 2016.
Adjusted EBITDA margin decreased to 6.1% in the fourth quarter of 2017 from 6.8% in the same quarter of 2016. Adjusted EBITDA excludes the gain recorded on sales of properties.
(1)
EBIT increased $3.2 million, or 21%, to $18.4 million in the fourth quarter of 2017 versus $15.2 million in the same quarter of 2016.
(1) The year-over-year improvement is primarily due to increased
revenue and a $1.4 million gain recorded on sales of properties offset partially by lower gross profit margins, higher selling and administrative expenses and an accrual of $2.6 million in the prior year for insurance proceeds related to the Fort McMurray wildfires that occurred in the second quarter of 2016.
The Corporation generated net earnings of $8.0 million, or $0.41 per share, in the fourth quarter of 2017 versus $8.9 million, or $0.45 per share, in the same quarter of 2016. The Corporation generated adjusted net earnings of $10.9 million, or $0.56 per share, in the fourth quarter of 2017 versus $8.9 million, or $0.45 per share, in the same quarter of 2016. Adjusted net earnings in the fourth quarter of 2017 excludes the after-tax gain recorded on sales of properties and senior notes redemption costs.
(1)
(1) ”Backlog”, “Leverage ratio”, “Adjusted net earnings”, “EBITDA margin”, “Adjusted EBITDA” and “Adjusted EBITDA margin” do
not have standardized meanings prescribed by generally accepted accounting principles (“GAAP”). “EBIT” and “Working capital” are additional GAAP measures. See the Non-GAAP and Additional GAAP Measures section.

Summary of Annual Operating Results
For the twelve months ended December 31 2017
2016 %
change
Revenue $ 1,319.3 $ 1,221.9 8.0%
Gross profit Selling and administrative expenses Restructuring (recovery) costs Insurance recoveries
$ $ $ $
254.8 197.1 (0.3)
-
$ $ $$
230.9 195.2
12.5 (3.7)
10.3% 1.0%
(102.5)%
(100.0)%
Earnings before finance costs and income taxes(1)
$ 58.0 $ 26.9 115.6%
Finance costs $ 15.2 $ 11.2 36.4%
Earnings before income taxes(1)
$ 42.7 $ 15.7 171.9%
Income tax expense $ 11.8 $ 4.7 150.8%
Net earnings $ 30.9 $ 11.0 180.9%
- Basic earnings per share
(2)
- Diluted earnings per share(2)
$ $
1.58 1.53
$ $
0.55 0.54
187.3% 188.9%
Adjusted net earnings(1)(3)
$ 33.5 $ 20.1 66.7%
- Adjusted basic earnings per share
(1)(2)(3)
- Adjusted diluted earnings per share(1)(2)(3)
$ $
1.71 1.66
$ $
1.01 1.00
69.3% 69.0%
Adjusted EBITDA(1)
$ 78.6 $ 64.0 22.8%
Key ratios: Gross profit margin Selling and administrative expense as a percentage of revenue EBIT margin
(1)
Adjusted EBITDA margin(1)
Effective income tax rate
19.3% 14.9% 4.4% 6.0%
27.7%
18.9% 16.0% 2.2% 5.2%
30.0%
Statement of financial position highlights As at December 31
2017 2016
Trade and other receivables $ 207.4 $ 194.6
Inventories $ 322.8 $ 283.4
Accounts payable and accrued liabilities $ (229.5) $ (232.7)
Other working capital amounts(1)
$ (2.2) $ 20.6
Working capital(1)
$ 298.5 $ 265.9
Rental equipment $ 61.3 $ 58.1
Property, plant and equipment $ 44.8 $ 45.7
Funded net debt(1)
$ 154.9 $ 126.0
Key ratios: Leverage ratio
(1)
2.06 times 2.07 times
(1) These measures do not have a standardized meaning prescribed by GAAP. See the Non-GAAP and Additional GAAP Measures section.
(2) Weighted average shares outstanding for calculation of basic and diluted earnings per share for the twelve months ended December 31, 2017 was 19,605,884 (2016 – 19,898,004) and 20,204,738 (2016 – 20,203,771), respectively.
(3) Net earnings excluding the following: a. after-tax restructuring (recovery) costs of ($0.2 million) (2016 – $9.1 million), or basic and diluted earnings per share of
($0.01) (2016 – $0.46), for the twelve months ended December 31, 2017. b. after-tax gain recorded on sales of properties of $1.2 million (2016 – nil), or basic and diluted earnings per share of

($0.06) (2016 – nil) and ($0.06) (2016 – nil) respectively, for the twelve months ended December 31, 2017. c. after-tax senior notes redemption costs of $4.0 million (2016 – nil), or basic and diluted earnings per share of $0.20
(2016 – nil), for the twelve months ended December 31, 2017.
Annual Results of Operations
Revenue by Geographic Region
For the twelve months ended December 31 2017 2016
Western Canada $ 572.2 $ 498.3
Central Canada 309.6 307.8
Eastern Canada * 437.5 415.8
Total revenue $ 1,319.3 $ 1,221.9
* Includes Quebec and the Atlantic provinces.
Revenue by Market
For the twelve months ended December 31 2017 2016
Construction 17% 14%
Forestry 16% 15%
Mining 13% 9%
Industrial/Commercial 12% 15%
Oil Sands 10% 11%
Transportation 9% 15%
Metal Processing 6% 6%
Government & Utilities 6% 5%
Oil and Gas 3% 2%
Other 8% 8%
Revenue
For the twelve months ended December 31 2017 2016
Equipment sales $ 459.8 $ 412.6
Equipment rental 31.9 34.7
Industrial parts 340.0 320.4
Product support 426.0 398.1
Other
61.7 56.1
Total revenue $ 1,319.3 $ 1,221.9
Revenue in 2017 increased 8.0%, or $97.4 million, to $1,319.3 million from $1,221.9 million in 2016. In addition to regional revenue commentary provided previously herein, the following factors contributed to the increase in revenue:
Equipment sales have increased due primarily to higher construction equipment sales in all regions and higher forestry and engines and transmissions equipment sales in western Canada. These increases were partly offset by a decrease in mining equipment sales in western Canada and a decrease in power generation sales in all regions.
Revenue from industrial parts has increased due primarily to increased bearings and process equipment sales in all regions.

Product support revenue has increased on strength in construction parts and service sales in western and central Canada and higher on-highway parts and service sales in all regions.
Backlog Backlog of $178.9 million at December 31, 2017 increased $53.1 million compared to December 31, 2016 due primarily to increases in construction, material handling, power generation and industrial parts orders.
Gross profit Gross profit increased $23.9 million, or 10%, in 2017 compared to the prior year, due to increased volumes and higher gross profit margins. Gross profit margin percentage of 19.3% in 2017 increased from 18.9% in the prior year due mainly to higher parts margin rates and improved service margins. Selling and administrative expenses Selling and administrative expenses as a percentage of revenue decreased to 14.9% in 2017 from 16.0% in 2016. Selling and administrative expenses increased $1.9 million in 2017 compared to the prior year due mainly to higher annual incentive accruals, offset partially by a gain recorded on sales of properties of $1.5 million. Restructuring (recovery) costs Restructuring recovery of $0.3 million ($0.2 million after-tax), was recorded in the second quarter of 2017 compared to restructuring costs of $12.5 million ($9.1 million after-tax), consisting principally of severance costs, recorded in the first quarter of 2016. Insurance recoveries In 2016, the Corporation recorded $3.7 million of compensation from insurers for business interruption losses, mainly related to the Fort McMurray wildfires, which occurred in early May 2016. Wajax’s branch facilities in the area of the wildfires incurred minimal damage and operations resumed in June 2016. Finance costs Finance costs of $15.2 million increased $4.0 million compared to 2016 due primarily to costs related to the senior notes redemption offset partially by lower average debt levels and lower average interest rates due primarily to the senior notes redemption. See the Liquidity and Capital Resources section. The Corporation redeemed all of its outstanding 6.125% senior notes on October 23, 2017. The redemption amount was 103.063% of the principal amount, including a $3.8 million call premium, plus accrued and unpaid interest to the redemption date. As a result of the early redemption of the senior notes, which were originally due in 2020, the remaining deferred financing costs of $1.6 million relating to the issuance of the senior notes in 2013 were written off in 2017. Income tax expense The Corporation’s effective income tax rate was 27.7% (2016 – 30.0%) compared to the statutory rate of 26.9% (2016 – 26.9%) due to the impact of expenses not deductible for tax purposes. The statutory income tax rate of 26.9% is unchanged compared to 2016. Net earnings In 2017, the Corporation had net earnings of $30.9 million, or $1.58 per share, compared to $11.0 million, or $0.55 per share, in 2016. The $19.9 million increase in net earnings resulted primarily from higher volumes, improved gross profit margins and a restructuring recovery compared to restructuring costs in the prior year. These increases were partially offset by senior notes redemption costs, insurance recoveries of $2.6 million after-tax in 2016 not repeated in the current year and higher selling and administrative expenses compared to the prior year.

Adjusted net earnings (See the Non-GAAP and Additional GAAP Measures section) Adjusted net earnings excludes the restructuring recovery of $0.2 million after-tax, or $0.01 per share (2016 – costs of $9.1 million or $0.46 per share), the gain recorded on sales of properties of $1.2 million after-tax, or $0.06 per share, and the senior notes redemption costs of $4.0 million after-tax, or $0.20 per share. As such, adjusted net earnings increased $13.4 million to $33.5 million, or $1.71 per share, in 2017 from $20.1 million, or $1.01 per share, in 2016. The $13.4 million increase in adjusted net earnings resulted primarily from higher volumes and improved gross profit margins offset partially by insurance recoveries of $2.6 million after-tax in 2016 not repeated in the current year and higher selling and administrative expenses compared to the prior year. Comprehensive income Total comprehensive income of $30.6 million in 2017 included net earnings of $30.9 million offset partially by an other comprehensive loss of $0.3 million. The other comprehensive loss resulted from a $0.4 million after-tax change in the amount of losses on derivative instruments designated as cash flow hedges recorded in the year offset partially by after-tax actuarial gains on pension plans of $0.1 million.
Selected Annual Information The following selected annual information is audited and has been prepared on the same basis as the 2017 annual audited consolidated financial statements. 2017 2016 2015
Revenue $ 1,319.3 $ 1,221.9 $ 1,273.3
Net earnings (loss) $ 30.9 $ 11.0 $ (11.0)
Basic earnings (loss) per share Diluted earnings (loss) per share
$ $
1.58 1.53
$ $
0.55 0.54
$ $
(0.59) (0.59)
Total assets $ 692.6 $ 664.9 $ 677.5 Non-current liabilities $ 161.9 $ 138.6 $ 169.5
Dividends declared per share $ 1.00 $ 1.00 $ 1.23
Revenue in 2017 of $1,319.3 million increased $97.4 million compared to 2016. The increase is attributable to strength in most western Canada markets, led by strong gains in construction and forestry and higher industrial parts revenue in eastern Canada. These gains were partially offset by lower mining equipment revenue primarily in western Canada. Revenue in 2016 of $1,221.9 million decreased $51.4 million compared to 2015 due to weakness in most western Canada markets. In 2016, lower sales to construction, material handling and forestry customers due to lower demand and competitive market pressures were offset by an increase in mining sector activity, including the delivery of four large mining shovels into the oil sands and eastern Canada mining markets. Net earnings in 2017 of $30.9 million increased $41.9 million, or $2.17 per share, from 2015. Excluding the after-tax restructuring recovery of $0.2 million ($0.01 per share), after-tax gain recorded on sales of properties of $1.2 million ($0.06 per share) and after-tax senior notes redemption costs of $4.0 million ($0.20 per share) in 2017 and the after-tax impairment of goodwill and intangible assets of $37.3 million ($2.01 per share) and restructuring costs of $1.5 million ($0.08 per share) in 2015, net earnings increased $5.7 million, or $0.21 per share. This increase was due principally to higher volumes and reduced selling and administrative expenses and finance costs offset partially by lower gross profit margins. See the Non-GAAP and Additional GAAP Measures and Liquidity and Capital Resources sections. The $15.1 million increase in total assets between December 31, 2015 and December 31, 2017 was mainly attributable to higher trade accounts receivable, offset partially by a reduction in cash and deposits on inventory. Non-current liabilities at December 31, 2017 of $161.9 million decreased $7.6 million from December 31, 2015 primarily attributable to a $7.9 million decrease in long-term debt. The decrease in long-term debt resulted mainly from lower working capital at December 31, 2017 compared to December 31, 2015.

Selected Quarterly Information The following table summarizes unaudited quarterly consolidated financial data for the eight most recently completed quarters. This quarterly information is unaudited but has been prepared on the same basis as the 2017 annual audited consolidated financial statements.
Although quarterly fluctuations in revenue and net earnings are difficult to predict, during times of weak energy sector activity, the first quarter will tend to have seasonally lower results. As well, large deliveries of mining trucks and shovels and power generation packages can shift the revenue and net earnings throughout the year. Fourth quarter 2017 net earnings of $8.0 million included an after-tax gain recorded on sales of properties of $1.2 million and after-tax senior notes redemption costs of $4.0 million. Excluding the gain recorded on sales of properties and senior notes redemption costs, fourth quarter 2017 adjusted net earnings were $10.9 million. The $9.7 million net loss in the first quarter of 2016 included after-tax restructuring costs of $9.1 million. Excluding restructuring costs, the first quarter 2016 adjusted net loss was $0.6 million. See the Non-GAAP and Additional GAAP Measures section. A discussion of Wajax’s previous quarterly results can be found in Wajax’s quarterly MD&A available on SEDAR at www.sedar.com.
Consolidated Financial Condition Capital Structure and Key Financial Condition Measures
December 31 2017
December 31 2016
Shareholders’ equity $ 283.7 $ 276.8
Funded net debt(1)
154.9 126.0
Total capital $ 438.6 $ 402.8
Funded net debt to total capital(1)
35.3% 31.3%
Leverage ratio(1)
2.06 2.07
(1) See the Non-GAAP and Additional GAAP Measures section. The Corporation’s objective is to maintain a leverage ratio between 1.5 times and 2.0 times. However, there may be instances where the Corporation is willing to maintain a leverage ratio outside this range to either support key growth initiatives or fluctuations in working capital levels during changes in economic cycles. See the Funded Net Debt section below.
Shareholders’ Equity The Corporation’s shareholders’ equity at December 31, 2017 of $283.7 million increased $6.9 million from December 31, 2016, as earnings of $30.9 million exceeded dividends declared of $19.6 million and $4.6 million in shares purchased during the year through two employee benefit plan trusts funded by the Corporation (for future settlement of share-based compensation plan awards).
2017 2016 Q4 Q3 Q2 Q1 Q4 Q3 Q2 Q1
Revenue $ 376.6 $ 299.0 $ 325.3 $ 318.4 $ 313.7 $ 286.6 $ 336.6 $ 285.0
Net earnings (loss) $ 8.0 $ 9.1 $ 7.6 $ 6.2 $ 8.9 $ 7.6 $ 4.3 $ (9.7)
Net earnings (loss) per share
- Basic $ 0.41 $ 0.45 $ 0.39 $ 0.31 $ 0.45 $ 0.38 $ 0.22 $ (0.49)
- Diluted $ 0.40 $ 0.44 $ 0.37 $ 0.31 $ 0.44 $ 0.37 $ 0.21 $ (0.49)

The Corporation’s share capital, included in shareholders’ equity on the balance sheet, consists of: Number of
Common Shares Amount
Issued and outstanding, December 31, 2016 20,026,819 $ 180.6
Shares held in trust, December 31, 2016 (200,968) $ (1.8)
Purchased for future settlement of certain share-based compensation plans
(321,744) (2.9)
Shares held in trust, December 31, 2017 (522,712) (4.7)
Issued and outstanding, net of shares held in trust, December 31, 2017
19,504,107 $ 175.9
At the date of this MD&A, the Corporation had 19,504,107 common shares issued and outstanding, net of shares held in trust. At December 31, 2017, Wajax had four share-based compensation plans; the Wajax Share Ownership Plan (“SOP”), the Directors’ Deferred Share Unit Plan (“DDSUP”), the Mid-Term Incentive Plan for Senior Executives (“MTIP”) and the Deferred Share Unit Plan (“DSUP”). As of December 31, 2017, there were 388,983 (2016 – 345,458) SOP and DDSUP (treasury share settled) rights outstanding and 498,440 (2016 – 315,916) MTIP and DSUP (market-purchased share settled) rights outstanding. At December 31, 2017, all SOP and DDSUP rights were vested (2016 – 339,504). At December 31, 2017, the number of shares held in trust approximates the number of market-purchased share settled rights outstanding. Depending on the actual level of achievement of the performance targets associated with the outstanding MTIP and DSUP grants, the number of market-purchased shares required to satisfy the Corporation’s obligations could be higher or lower. Wajax recorded compensation expense of $3.8 million for the year (2016 – $2.7 million) in respect of these plans.
Funded Net Debt (See the Non-GAAP and Additional GAAP Measures section) December 31
2017 December 31
2016
Bank indebtedness (cash) $ 1.7 $ (4.9)
Obligations under finance lease 9.5 8.9
Long-term debt 143.7 122.0
Funded net debt(1)
$ 154.9 $ 126.0
(1) See the Non-GAAP and Additional GAAP Measures section.
Funded net debt of $154.9 million at December 31, 2017 increased $28.9 million compared to $126.0 million at December 31, 2016. The increase during the year was due primarily to dividends paid of $19.7 million, common shares purchased and held in trust of $7.5 million and finance lease payments of $4.0 million, offset partially by cash generated from operating activities of $7.1 million. The Corporation’s ratio of funded net debt to total capital increased to 35.3% at December 31, 2017 from 31.3% at December 31, 2016, primarily due to the higher funded net debt level at December 31, 2017. The Corporation’s leverage ratio of 2.06 times at December 31, 2017 decreased slightly from the December 31, 2016 ratio of 2.07 times. See the Non-GAAP and Additional GAAP Measures section. See the Liquidity and Capital Resources section.

Financial Instruments Wajax uses derivative financial instruments in the management of its foreign currency and interest rate exposures. Wajax policy restricts the use of derivative financial instruments for trading or speculative purposes. Wajax monitors the proportion of variable rate debt to its total debt portfolio and may enter into interest rate hedge contracts to mitigate a portion of the interest rate risk on its variable rate debt. A change in interest rates, in particular related to the Corporation’s unhedged variable rate debt, is not expected to have a material impact on the Corporation’s results of operations or financial condition over the longer term. Wajax has entered into interest rate hedge contracts to minimize exposure to interest rate fluctuations on its variable rate debt. All interest rate hedge contracts are recorded in the consolidated financial statements at fair value. As at December 31, 2017, Wajax had the following interest rate hedge contracts outstanding:
$40.0 million, expiring between November 2019 and November 2022, with a weighted average interest rate of 2.01%.
Wajax enters into short-term currency forward contracts to hedge the exchange risk associated with the cost of certain inbound inventory and foreign currency-denominated sales to customers along with the associated receivables as part of its normal course of business. As at December 31, 2017, Wajax had the following contracts outstanding:
to buy U.S. $48.5 million (December 31, 2016 – to buy U.S. $55.1 million), and
to sell U.S. $13.8 million (December 31, 2016 – to sell U.S. $10.8 million). The U.S. dollar contracts expire between January 2018 and December 2018, with a weighted average U.S./Canadian dollar rate of 1.2748. Wajax measures derivative instruments not accounted for as hedging items at fair value with subsequent changes in fair value being recorded in earnings. Derivatives designated as effective hedges are measured at fair value with subsequent changes in fair value being recorded in other comprehensive income until the related hedged item is recorded and affects income or inventory. The fair value of derivative instruments is estimated based upon market conditions using appropriate valuation models. The carrying values reported in the balance sheet for financial instruments are not significantly different from their fair values. A change in foreign currency, relative to the Canadian dollar, on transactions with customers that include unhedged foreign currency exposures is not expected to have a material impact on the Corporation’s results of operations or financial condition over the longer term. Wajax will periodically institute price increases to offset the negative impact of foreign exchange rate increases and volatility on imported goods to ensure margins are not eroded. However, a sudden strengthening of the U.S. dollar relative to the Canadian dollar can have a negative impact mainly on parts margins in the short term prior to price increases taking effect. Wajax is exposed to the risk of non-performance by counterparties to short-term currency forward contracts and long-term interest rate hedge contracts. These counterparties are large financial institutions that maintain high short-term and long-term credit ratings. To date, no such counterparty has failed to meet its financial obligations to Wajax. Management does not believe there is a significant risk of non-performance by these counterparties and will continue to monitor the credit risk of these counterparties. Contractual Obligations
Contractual Obligations
Total
< 1 year
1 - 5 years
After 5 years
Operating leases $ 74.5 $ 18.3 $ 41.4 $ 14.8 Obligations under finance leases
(1) $ 9.5 $ 3.8 $ 5.7 $ -
Bank debt $ 145.0 $ - $ 145.0 $ -
Total $ 229.0 $ 22.1 $ 192.1 $ 14.8 (1) Amounts exclude finance costs.
The operating leases relate primarily to contracts entered into for facilities, a portion of the long-term lift truck rental fleet and office equipment. See the Off Balance Sheet Financing section for additional information.

The obligations under finance leases relate to certain leased vehicles that have a minimum one year term and are extended on a monthly basis thereafter until termination. The bank debt obligation relates to the bank credit facility. See the Liquidity and Capital Resources section. The above table does not include obligations to fund pension benefits. Wajax sponsors certain defined benefit plans that cover executive employees, a small group of inactive employees and certain employees on long-term disability benefits. The defined benefit plans are subject to actuarial valuations in 2018. Management does not expect future cash contribution requirements to change materially from the 2017 contribution level of $0.9 million as a result of these valuations or any declines in the fair value of the defined benefit plans’ assets.
Related Party Transactions The Corporation’s related party transactions, consisting of the compensation of the Board of Directors and key management personnel, totaled $10.6 million in 2017 (2016 – $6.6 million).
Off Balance Sheet Financing Off balance sheet financing arrangements include operating lease contracts for facilities with various landlords and other equipment related mainly to office equipment. The total obligations for all operating leases are detailed in the Contractual Obligations section above. At December 31, 2017, the non-discounted operating lease commitments for facilities totaled $73.7 million and for rental fleet totaled $0.8 million. Although Wajax’s consolidated contractual annual lease commitments decline year-by-year, it is anticipated that existing leases will either be renewed or replaced, resulting in lease commitments being sustained at current levels. In the alternative, Wajax may incur capital expenditures to acquire equivalent capacity. The Corporation had $90.6 million (2016 – $44.4 million) of consigned inventory on-hand from a major manufacturer at December 31, 2017, net of deposits of $6.4 million (2016 – $19.1 million). In the normal course of business, Wajax receives inventory on consignment from this manufacturer which is generally sold or rented to customers or purchased by Wajax. Under the terms of the consignment program, Wajax is required to make periodic deposits to the manufacturer on the consigned inventory that is rented to Wajax customers or on-hand for greater than nine months. This consigned inventory is not included in Wajax’s inventory as the manufacturer retains title to the goods. In the event the inventory consignment program was terminated, Wajax would utilize interest free financing, if any, made available by the manufacturer and/or utilize capacity under its credit facility to finance the purchase of inventory. Although management currently believes Wajax has adequate debt capacity, Wajax would have to access the equity or debt markets, or reduce dividends to accommodate any shortfalls in Wajax’s credit facility. See the Liquidity and Capital Resources section.
Liquidity and Capital Resources
The Corporation’s liquidity is maintained through various sources, including bank and non-bank credit facilities and cash generated from operations.
Bank and Non-bank Credit Facilities On September 20, 2017, the Corporation amended its bank credit facility, extending the maturity date from August 12, 2020 to September 20, 2021. In addition, a $50 million non-revolving term facility was added to the existing $250 million revolving term portion of the facility, increasing the total facility size to $300 million. The existing financial covenants under the credit facility restricting distributions, acquisitions and investments have been increased to a leverage ratio of 4.0 times. The $0.4 million cost of amending the facility has been capitalized and will be amortized over the remaining term of the facility.

The terms of the $300 million bank credit facility include the following:
The facility is fully secured and expires September 20, 2021.
Borrowing capacity is dependent upon the level of inventories on hand and the outstanding trade accounts receivable.
The bank credit facility contains customary restrictive covenants, including limitations on the payment of cash dividends and the maintenance of certain financial ratios, all of which were met as at December 31, 2017. In particular, the Corporation is restricted from declaring dividends in the event the Corporation’s leverage ratio, as defined in the bank credit facility agreement, exceeds 4.0 times.
Borrowings under the bank credit facility bear floating rates of interest at margins over Canadian dollar bankers’ acceptance yields, U.S. dollar LIBOR rates or prime. Margins on the facility depend on the Corporation’s leverage ratio at the time of borrowing and range between 1.5% and 3.0% for Canadian dollar bankers’ acceptances and U.S. dollar LIBOR borrowings, and 0.5% and 2.0% for prime rate borrowings.
At December 31, 2017, Wajax had borrowed $145.0 million and issued $7.3 million of letters of credit for a total utilization of $152.3 million of its $300 million bank credit facility. At December 31, 2017, borrowing capacity under the bank credit facility was equal to $300 million. On September 20, 2017, the Corporation issued a notice of redemption for all of its outstanding 6.125% senior notes due October 23, 2020. The redemption date was October 23, 2017 and the redemption amount was 103.063% of the principal amount, including a $3.8 million call premium, plus accrued and unpaid interest to the redemption date. Under the terms of the bank credit facility, Wajax is permitted to have additional interest bearing debt of $25 million. As such, Wajax has up to $25 million of demand inventory equipment financing capacity with two non-bank lenders. At December 31, 2017, Wajax had no utilization of the interest bearing equipment financing facilities. As of March 5, 2018, Wajax maintained a bank credit facility with a limit of $300 million and an additional $25 million in credit facilities with non-bank lenders, which is permitted under the bank credit facility. As at December 31, 2017, $147.7 million was unutilized under the bank facility and $25 million was unutilized under the non-bank facilities. Wajax maintains sufficient liquidity to meet short-term normal course working capital and maintenance capital requirements and certain strategic investments. However, Wajax may be required to access the equity or debt markets to fund significant acquisitions. In addition, the Corporation’s tolerance to interest rate risk decreases/increases as the Corporation’s leverage ratio increases/decreases. At December 31, 2017, $40 million of the Corporation’s funded net debt, or 26%, was at a fixed interest rate which is within the Corporation’s interest rate risk policy.
Cash Flow
The following table highlights the major components of cash flow as reflected in the Consolidated Statements of Cash Flows for the years ended December 31, 2017 and December 31, 2016:
For the year ended December 31 2017 2016 Change
Net earnings $ 30.9 $ 11.0 $ 19.9
Items not affecting cash flow 52.2 43.4 8.8
Net change in non-cash operating working capital (33.7) 30.9 (64.6)
Finance costs paid (14.8) (10.3) (4.5)
Income taxes paid (7.4) (2.4) (5.0)
Rental equipment additions (19.3) (13.5) (5.8)
Other non-current liabilities (0.8) (0.9) (0.1)
Cash generated from operating activities $ 7.1 $ 58.2 $ (51.1)
Cash used in investing activities $ (1.8) $ (8.9) $ 7.1
Cash used in financing activities $ (11.9) $ (58.1) $ 46.2

Cash Generated From Operating Activities The $51.1 million year over year decrease in cash flows generated from operating activities was mainly attributable to a decrease in cash generated from changes in non-cash operating working capital of $64.6 million and an increase in rental equipment additions of $5.8 million, offset partially by increased net earnings of $19.9 million. Rental equipment additions in 2017 of $19.3 million (2016 – $13.5 million) related primarily to lift trucks. Significant components of non-cash operating working capital, along with changes for the years ended December 31, 2017 and December 31, 2016 include the following:
Changes in Non-cash Operating Working Capital(1) 2017 2016
Trade and other receivables $ (13.1) $ (26.5)
Contracts in progress 3.0 (2.3)
Inventories (36.6) 29.5
Deposits on inventory 12.5 2.0
Prepaid expenses 1.1 1.6
Accounts payable and accrued liabilities (0.8) 25.9
Provisions 0.2 0.6
Total Changes in Non-cash Operating Working Capital $ (33.7) $ 30.9
(1) Increase (decrease) in cash flow
Significant components of the changes in non-cash operating working capital for the year ended December 31, 2017 compared to the year ended December 31, 2016 are as follows:
Trade and other receivables increased $13.1 million in 2017 compared to an increase of $26.5 million in 2016. The increase in 2017 resulted primarily from higher trade receivables from a large oil and gas customer. The increase in 2016 resulted primarily from higher oil sands sales activity in western Canada.
Inventories increased $36.6 million in 2017 compared to a decrease of $29.5 million in 2016. The increase in 2017 was due to higher construction, mining and material handling equipment inventory. The decrease in 2016 was primarily attributable to lower construction and industrial parts inventory.
Deposits on inventory decreased $12.5 million in 2017 compared to a decrease of $2.0 million in 2016. The decrease in 2017 resulted from a decrease in deposits on aged consignment inventory. See the Off Balance Sheet Financing section.
Accounts payable and accrued liabilities decreased $0.8 million in 2017 compared to an increase of $25.9 million in 2016. The increase in 2016 resulted primarily from higher trade payables related to mining equipment inventory.
Investing Activities For the year ended December 31, 2017, Wajax invested $1.5 million in property, plant and equipment additions, net of disposals, compared to $3.1 million for the year ended December 31, 2016. Financing Activities The Corporation used $11.9 million of cash from financing activities in 2017 compared to $58.1 million from financing activities in 2016. Financing activities during the year included a net bank credit facility borrowing of $20.0 million (2016 – repayments of $30 million) offset by dividends paid to shareholders of $19.7 million (2016 – $19.9 million), common shares purchased and held in trust funded by the Corporation totaling $7.5 million (2016 – $3.2 million) and finance lease payments of $4.0 million (2016 – $4.3 million).

Dividends
Dividends to shareholders for the periods January 1, 2017 to December 31, 2017 and January 1, 2016 to December 31, 2016 were declared and payable to shareholders of record as follows: 2017 2016 Month Per Share Amount Per Share Amount
March $ 0.25 $ 5.0 $ 0.25 $ 5.0 June 0.25 4.9 0.25 5.0 September 0.25 4.9 0.25 4.9 December 0.25 4.9 0.25 5.0
Total dividends for the years ended December 31
$ 1.00 $ 19.6 $ 1.00 $ 19.9
For the years ended December 31, 2017 and December 31, 2016, Wajax declared dividends to shareholders totaling $1.00 per share in each year. Dividends paid in 2017 were funded from cash generated from operating activities. On March 5, 2018, the Corporation declared a dividend of $0.25 per share for the first quarter of 2018, payable on April 4, 2018 to shareholders of record on March 15, 2018.

Fourth Quarter Consolidated Results
For the three months ended December 31 2017
2016 %
change
Revenue $ 376.6 $ 313.7 20.0%
Gross profit Selling and administrative expenses Insurance recoveries
$ $ $
68.6 50.2
-
$ $ $
62.8 50.3 (2.6)
9.3% (0.1)% (100.0)
%
Earnings before finance costs and income taxes(1)
$ 18.4 $ 15.2 21.3%
Finance costs $ 7.4 $ 2.8 164.4%
Earnings before income taxes(1)
$ 11.0 $ 12.4 (11.2)%
Income tax expense $ 3.0 $ 3.5 (15.3)%
Net earnings $ 8.0 $ 8.9 (9.5)%
- Basic earnings per share
(2)
- Diluted earnings per share(2)
$ $
0.41 0.40
$ $
0.45 0.44
(8.9)% (9.1)%
Adjusted net earnings(1)(4)
$ 10.9 $ 8.9 22.5%
- Adjusted basic earnings per share
(1)(2)(3)
- Adjusted diluted earnings per share(1)(3)(3)
$ $
0.56 0.54
$ $
0.45 0.44
24.4% 22.7%
Adjusted EBITDA(1)
$ 22.8 $ 21.5 6.1%
Key ratios: Gross profit margin Selling and administrative expense as a percentage of revenue EBIT margin
(1)
Adjusted EBITDA margin(1)
Effective income tax rate
18.2% 13.3% 4.9% 6.1%
26.8%
20.0% 16.0% 4.8% 6.8%
28.2%
(1) These measures do not have a standardized meaning prescribed by GAAP. See the Non-GAAP and Additional GAAP Measures section.
(2) Weighted average shares outstanding for calculation of basic and diluted earnings per share for the three months ended December 31, 2017 was 19,504,107 (2016 – 19,805,485) and 20,132,863 (2016 – 20,250,820), respectively.
(3) Net earnings excluding the following: a. after-tax gain recorded on sales of properties of $1.2 million (2016 – nil), or basic and diluted earnings per share of
($0.06) (2016 – nil), for the twelve months ended December 31, 2017. b. after-tax senior notes redemption costs of $4.0 million (2016 – nil), or basic and diluted earnings per share of $0.20
(2016 – nil), for the twelve months ended December 31, 2017.
Fourth quarter revenue increased $62.9 million, or 20%, due in part to strength in several western and eastern Canada markets. Revenue in the fourth quarter of 2016 included approximately $10 million in additional mining equipment sales that were not repeated in the fourth quarter of 2017. Adjusting for these sales, revenue increased 24% year-over-year.

Revenue
For the three months ended December 31 2017 2016
Equipment sales $ 156.5 $ 111.5
Equipment rental 8.7 8.0
Industrial parts 82.9 77.9
Product support 110.2 101.8
Other
18.3 14.4
Total revenue $ 376.6 $ 313.7
Revenue in the fourth quarter of 2017 increased 20%, or $62.9 million, to $376.6 million, from $313.7 million in the fourth quarter of 2016. The following factors contributed to the increase in revenue:
Regionally, revenue increased 40% and 14% in western and eastern Canada respectively and decreased 1% in central Canada.
Equipment sales have increased due primarily to higher construction and material handling sales in all regions and higher forestry and engines and transmissions sales in western Canada. These increases were partly offset by a decrease in mining equipment sales in western and eastern Canada and a decrease in power generation sales in central Canada.
Revenue from industrial parts has increased due to higher sales in all regions.
Product support revenue has increased on strength in construction parts and service sales in western Canada and higher engines and transmissions and power generation sales in all regions.
Gross profit Gross profit in the fourth quarter of 2017 increased $5.8 million or 9%, as higher volumes offset a decrease in the gross profit margin percentage compared to the prior year. The gross profit margin percentage for the quarter of 18.2% decreased from 20.0% in the fourth quarter of 2016 primarily due to a higher proportion of equipment volumes and lower equipment, parts and service margins compared to last year. Selling and administrative expenses Selling and administrative expenses as a percentage of revenue decreased to 13.3% in the fourth quarter of 2017 from 16.0% in the same quarter of 2016. Selling and administrative expenses decreased $0.1 million in the fourth quarter of 2017 compared to the same quarter last year. The Corporation sold various properties in the fourth quarter of 2017 and recorded a gain of $1.4 million which is included in selling and administrative expenses. Finance costs Quarterly finance costs of $7.4 million increased $4.6 million from the same period last year due primarily to costs related to the senior notes redemption offset partially by lower average interest rates due primarily to the senior notes redemption. The Corporation redeemed all of its outstanding, 6.125% senior notes on October 23, 2017. The redemption amount was 103.063% of the principal amount, including a $3.8 million call premium, plus accrued and unpaid interest to the redemption date. As a result of the early redemption of the senior notes, which were originally due in 2020, the remaining deferred financing costs of $1.6 million relating to the issuance of the senior notes in 2013 were written off in 2017. Income tax expense The Corporation’s effective income tax rate of 26.8% for the fourth quarter of 2017 was slightly lower compared to the statutory rate of 26.9% due to the impact of the non-taxable portion of the gain recorded on sales of properties offset by expenses not deductible for tax purposes. The Corporation’s effective income tax rate of 28.2% for the fourth quarter of 2016 was higher compared to the statutory rate of 26.9% due to the impact of expenses not deductible for tax purposes.

Net earnings In the fourth quarter of 2017, the Corporation generated net earnings of $8.0 million, or $0.41 per share, compared to net earnings of $8.9 million, or $0.45 per share, in the fourth quarter of 2016. The $0.9 million decrease in net earnings resulted from senior notes redemption costs of $4.0 million after-tax and insurance recoveries of $1.9 million after-tax in the prior year related to the Fort McMurray wildfires that occurred in the second quarter of 2016. These decreases were offset partially by higher volumes compared to the prior year. Adjusted net earnings (See the Non-GAAP and Additional GAAP Measures section) Adjusted net earnings exclude the gain recorded on sales of properties of $1.2 million after-tax, or $0.06 per share, and the senior notes redemption costs of $4.0 million after-tax, or $0.20 per share. As such, adjusted net earnings increased $2.0 million to $10.9 million, or $0.56 per share, in the fourth quarter of 2017 from $8.9 million, or $0.45 per share, in the fourth quarter of 2016. The $2.0 million increase in adjusted net earnings resulted primarily from higher volumes and lower finance costs offset partially by lower gross profit margins, insurance recoveries of $1.9 million after-tax in 2016 not repeated in the current year and higher selling and administrative expenses compared to the prior year. Comprehensive income Total comprehensive income of $8.2 million in the fourth quarter of 2017 was comprised of net earnings of $8.0 million and other comprehensive income of $0.2 million. The other comprehensive income resulted primarily from after-tax actuarial gains on pension plans of $0.1 million. Funded net debt (See the Non-GAAP and Additional GAAP Measures section) Funded net debt of $154.9 million at December 31, 2017 increased $1.2 million compared to September 30, 2017. See the Fourth Quarter Cash Flows and Liquidity and Capital Resources sections. Dividends For the fourth quarter ended December 31, 2017 dividends declared totaled $0.25 per share (2016 - $0.25 per share). Backlog (See the Non-GAAP and Additional GAAP Measures section) Consolidated backlog at December 31, 2017 of $178.9 million increased $8.6 million, or 5%, compared to September 30, 2017 due primarily to increases in construction and power generation orders offset partially by a decrease in crane and utility orders.

Fourth Quarter Cash Flows
Cash Flow
The following table highlights the major components of cash flow as reflected in the Consolidated Statements of Cash Flows for the quarters ended December 31, 2017 and December 31, 2016:
For the quarter ended December 31 2017 2016 Change
Net earnings $ 8.0 $ 8.9 $ (0.9)
Items not affecting cash flow 15.8 13.4 2.4
Net change in non-cash operating working capital 2.3 14.2 (11.9)
Finance costs paid (9.4) (4.5) (4.9)
Income taxes paid (1.4) - (1.4)
Rental equipment additions (7.0) (3.8) (3.2)
Other non-current liabilities (0.3) - (0.3)
Cash generated from operating activities $ 8.1 $ 28.2 $ (20.1)
Cash used in investing activities $ (0.6) $ (0.8) $ 0.2
Cash used in financing activities $ (3.9) $ (23.0) $ 19.1
Cash Generated From Operating Activities The $20.1 million decrease in cash flows generated from operating activities was mainly attributable to a decrease in cash generated from changes in non-cash operating working capital of $11.9 million and an increase in finance costs paid of $4.9 million. The increase in finance costs paid was primarily due to the senior notes redemption costs of $5.5 million incurred in the current period. Significant components of non-cash operating working capital, along with changes for the quarters ended December 31, 2017 and December 31, 2016 include the following:
Changes in Non-cash Operating Working Capital(1) 2017 2016
Trade and other receivables $ (33.0) $ (18.5)
Contracts in progress (2.5) (2.7)
Inventories 10.9 8.8
Deposits on inventory 0.9 2.5
Prepaid expenses 0.9 1.1
Accounts payable and accrued liabilities 24.1 21.5
Provisions 1.0 1.5
Total Changes in Non-cash Operating Working Capital $ 2.3 $ 14.2
(1) Increase (decrease) in cash flow
Significant components of the changes in non-cash operating working capital for the quarter ended December 31, 2017 compared to the quarter ended December 31, 2016 are as follows:
Trade and other receivables increased $33.0 million in 2017 compared to an increase of $18.5 million in 2016. The increase in both years resulted primarily from higher sales activity in the fourth quarter compared to the previous quarter.
Inventories decreased $10.9 million in the current quarter compared to a decrease of $8.8 million in 2016. The decrease in 2017 was due to lower forestry, crane and utility and engines and transmissions inventory offset partially by higher construction inventory. The decrease in 2016 was primarily a result of inventory reduction measures.
Accounts payable and accrued liabilities increased $24.1 million in 2017 compared to an increase of $21.5 million in 2016. The increase in both years resulted primarily from higher trade payables, including higher trade payables related to mining equipment inventory.
Investing Activities During the fourth quarter of 2017, Wajax invested $0.3 million in property, plant and equipment additions, net of disposals, compared to $0.7 million in the fourth quarter of 2016. Financing Activities The Corporation used $3.9 million of cash in financing activities in the fourth quarter of 2017 compared to $23.0 million of cash used in the same quarter of 2016. Financing activities in the quarter included bank credit facility borrowings of $2.0 million (2016 – repayments of $17.0 million) offset by dividends paid to shareholders totaling $4.9 million (2016 – $4.9 million) and finance lease payments of $0.9 million (2016 – $1.0 million). See the Liquidity and Capital Resources section.
Critical Accounting Estimates The preparation of the consolidated financial statements in conformity with IFRS requires management to make judgements, estimates and assumptions that affect the application of accounting policies and the reported amounts of assets, liabilities, revenue and expenses. Actual results could differ from those judgements, estimates and assumptions. Note 3 of the annual consolidated financial statements describes the significant accounting policies and methods used in preparation of the annual consolidated financial statements. The Corporation bases its estimates on historical experience and various other assumptions that are believed to be reasonable in the circumstances. The areas where significant judgements and assumptions are used to determine the amounts recognized in the financial statements include the allowance for doubtful accounts, inventory obsolescence, goodwill and intangible assets and operating segments. The key assumptions concerning the future and other key sources of estimation uncertainty that have a significant risk of resulting in a material adjustment to the carrying amount of assets and liabilities within the next fiscal year are as follows: Allowance for doubtful accounts The Corporation is exposed to credit risk with respect to its trade and other receivables. However, this is somewhat minimized by the Corporation’s diversified customer base of over 30,000 customers, with no one customer accounting for more than 10% of the Corporation’s annual consolidated sales, which covers many business sectors across Canada. In addition, the Corporation’s customer base spans large public companies, small independent contractors, OEM’s and various levels of government. The Corporation follows a program of credit evaluations of customers and limits the amount of credit extended when deemed necessary. The Corporation maintains provisions for possible credit losses, and any such losses to date have been within management’s expectations. The provision for doubtful accounts is determined on an account-by-account basis. The $0.8 million provision for doubtful accounts at December 31, 2017 decreased $0.3 million from $1.1 million at December 31, 2016. As economic conditions change, there is risk that the Corporation could experience a greater number of defaults compared to 2017 which would result in an increased charge to earnings. Inventory obsolescence The value of the Corporation’s new and used equipment and high value parts are evaluated by management throughout the year, on a unit-by-unit basis. When required, provisions are recorded to ensure that the book value of equipment and parts are valued at the lower of cost or estimated net realizable value. The Corporation performs an aging analysis to identify slow moving or obsolete lower value parts inventories and estimates appropriate obsolescence provisions related thereto. The Corporation takes advantage of supplier programs that allow for the return of eligible parts for credit within specified time periods. The inventory obsolescence charged to earnings for the three months ended December 31, 2017 was a recovery of $1.7 million (2016 – charge of $1.7 million) and for the twelve months ended December 31, 2017 was $3.2 million (2016 – $10.3 million). As economic conditions change, there is risk that the Corporation could have an increase in inventory obsolescence compared to prior periods which would result in an increased charge to earnings.

Goodwill and intangible assets The value in use of goodwill and intangible assets has been estimated using the forecasts prepared by management for the next five years. The key assumptions for the estimate are those regarding revenue growth, gross margin, discount rate and the level of working capital required to support the business. These estimates are based on past experience and management’s expectations of future changes in the market and forecasted growth initiatives. During the year, the Corporation performed an impairment test, based on value in use, of goodwill and intangible assets with an indefinite life based on its single cash generating unit group and concluded that no impairment existed. Operating segments Determination of the Corporation’s operating segments requires significant judgement. Operating segments have changed since December 31, 2016 as follows: With the completion of the strategic reorganization during the first quarter of 2017, the Corporation’s Chief Executive Officer, who is also the Chief Operating Decision Maker, regularly assesses the performance of, and makes resource allocation decisions based on, the Corporation as a whole. As a result, the Corporation has determined that it comprises a single operating segment and therefore a single reportable segment, which differs from the three reportable segments which existed prior to the reorganization. The corporation began reporting as a single segment in 2017 and has reported 2016 revenue herein on that basis. For comparative purposes, the table below shows 2016 revenue based on the three previously reportable segments.
For the three months ended December 31, 2016
Total
Equipment
Power
Systems
Industrial Component
s
Segment Elimination
s
Equipment sales $ 111.5 $ 86.8 $ 24.7 $ - $ -
Equipment rental 8.0 6.1 1.9 - -
Industrial parts 77.9 - - 77.9 -
Product support 101.7 58.8 43.0 - -
Other
14.5 0.6 0.1 14.9 (1.1)
Total revenue $ 313.7 $ 152.3 $ 69.6 $ 92.8 $ (1.1)
For the twelve months ended December 31, 2016
Total
Equipment
Power
Systems
Industrial Component
s
Segment Elimination
s
Equipment sales $ 412.6 $ 343.7 $ 68.9 $ - $ -
Equipment rental 34.6 24.3 10.4 - -
Industrial parts 320.4 - - 320.4 -
Product support 398.1 227.6 170.5 - -
Other
56.1 1.6 0.1 58.3 (3.9)
Total revenue $ 1,221.
9 $ 597.2 $ 250.0 $ 378.7 $ (3.9)
Changes in Accounting Policies
Accounting standards adopted during the year Effective January 1, 2017, the Corporation adopted the amendments to IAS 7 Statement of Cash Flows, which requires disclosures that enable users of financial statements to evaluate changes in liabilities arising from financing activities, including both changes arising from cash flow and non-cash flow changes. New standards and interpretations not yet adopted The new standards or amendments to existing standards that may be significant to the Corporation set out below are not effective for the year ended December 31, 2017 and have not been applied in preparing these consolidated financial statements. On January 1, 2018, the Corporation will be required to adopt IFRS 15 Revenue from Contracts with Customers. The standard contains a single model that applies to contracts with customers and two approaches to recognizing revenue: at a point in time or over time. The model features a contract-based five-step analysis of transactions to determine whether, how much and when revenue is recognized. New estimates and judgemental thresholds have been introduced, which may affect the amount and/or timing of revenue recognized. The Corporation has completed its assessment of the new standard and has identified the following change that will result from the adoption of IFRS 15:
The revenue recognition pattern for product support service orders will change to an over-time pattern rather than the point in time recognition that was previously used to best depict performance in transferring control of the repair service. While the total amount of revenue recognized under IFRS 15 will not change materially, it will be recognized earlier to reflect the measure of progress over time.
The Corporation also reviewed its other revenue streams including sales of equipment that involves the design, installation and assembly of power generation systems and has concluded that they will be substantially unchanged by the new standard. In addition, the revenue pattern for the rental of equipment will remain unchanged as it is excluded from the scope of the new standard and is accounted for in accordance with IAS 17 Leases. The Corporation intends to use the retrospective transition method, which means that it will record the cumulative impact of the accounting policy change in retained earnings as at January 1, 2017 and will restate the comparative 2017 amounts when reporting 2018 results. The Corporation will elect to use a practical expedient when restating its prior year results in its 2018 financial statements and not disclose the amounts of the transaction price allocated to remaining performance obligations nor provide an explanation of when it expects to recognize that amount as revenue. On January 1, 2017, adoption of IFRS 15 will result in an increase to retained earnings of approximately $1.5 million. For the year ended December 31, 2017, such adoption will result in increases of approximately $0.8 million and approximately $0.1 million to revenue and earnings respectively. On January 1, 2018, the Corporation will be required to adopt IFRS 9 Financial Instruments, which will replace IAS 39 Financial Instruments: Recognition and Measurement. The new standard introduces new requirements for the classification and measurement of financial assets. Under IFRS 9, financial assets are classified and measured based on the business model in which they are held and the characteristics of their contractual cash flows. The standard largely retains the existing accounting requirements for financial liabilities with the exception of accounting for non-substantial modifications of financial liabilities and the accounting treatment of fair value changes attributable to changes in its own credit risk of financial liabilities that are designated as fair value through profit and loss. It also replaces the current “incurred” impairment of financial assets model with a new ‘expected credit loss’ model. IFRS 9 also includes a new general hedge accounting standard which aligns hedge accounting more closely with risk management. The Corporation elects to apply the hedge requirements of IFRS 9 to its existing

hedge relationships. The Corporation’s existing hedge relationships that qualified for hedge accounting under IAS 39 will continue to qualify for hedge accounting under IFRS 9.. Based on the current facts and circumstances, the Corporation does not expect the transition to IFRS 9 to have a material impact on the Corporation’s consolidated financial statements. On January 1, 2019, the Corporation will be required to adopt IFRS 16 Leases. The new standard contains a single lease accounting model for lessees, whereby all leases with a term longer than 12 months are recognized on-balance sheet through a right-of-use asset and lease liability. The model features a front-loaded total lease expense recognized through a combination of depreciation and interest. Lessor accounting remains similar to current requirements. The Corporation’s long term leases primarily relate to rental of real estate. The new standard will result in a material increase in right of use assets and lease obligations but the impact to earnings has not yet been estimated.
Risk Management and Uncertainties As with most businesses, Wajax is subject to a number of marketplace and industry related risks and uncertainties which could have a material impact on operating results and Wajax’s ability to pay cash dividends to shareholders. Wajax attempts to minimize many of these risks through diversification of core businesses and through the geographic diversity of its operations. In addition, Wajax has adopted an annual enterprise risk management assessment which is prepared by the Corporation’s senior management and overseen by the Board of Directors and committees of the Board of Directors. The enterprise risk management framework sets out principles and tools for identifying, evaluating, prioritizing and managing risk effectively and consistently across Wajax. The following are a number of risks that deserve particular comment: Manufacturer relationships and product access Wajax seeks to distribute leading product lines in each of its regional markets and its success is dependent upon continuing relations with the manufacturers it represents. Wajax endeavours to align itself in long-term relationships with manufacturers that are committed to achieving a competitive advantage and long-term market leadership in their targeted market segments. In the equipment, engines, transmissions and power generation categories, and in certain cases in the hydraulics and process pumps portion of the industrial parts category, manufacturer relationships are governed through effectively exclusive distribution agreements. Distribution agreements are for the most part open-ended, but are cancellable within a relatively short notification period specified in each agreement. Although Wajax enjoys good relationships with its major manufacturers and seeks to develop additional strong long-term partnerships, a loss of a major product line without a comparable replacement would have a significantly adverse effect on Wajax’s results of operations or cash flow. There is a continuing consolidation trend among industrial equipment and component manufacturers. Consolidation may impact the products distributed by Wajax, in either a favourable or unfavourable manner. Consolidation of manufacturers may have a negative impact on the results of operations or cash flow if product lines Wajax distributes become unavailable as a result of the consolidation. Suppliers generally have the ability to unilaterally change distribution terms and conditions, product lines or limit supply of product in times of intense market demand. Supplier changes in the area of product pricing and availability can have a negative or positive effect on Wajax’s revenue and margins. A change in one of a supplier’s product lines can result in conflicts with another supplier’s product lines that may have a negative impact on the results of operations or cash flow if one of the suppliers cancels its distribution with Wajax due to the conflict. As well, from time to time suppliers make changes to payment terms for distributors. This may affect Wajax’s interest-free payment period or consignment terms, which may have a materially negative or positive impact on working capital balances such as cash, inventories, deposits on inventory, trade and other payables and bank debt.

Economic conditions/Business cyclicality Wajax’s customer base consists of businesses operating in the natural resources, construction, transportation, manufacturing, industrial processing and utilities industries. These industries can be capital intensive and cyclical in nature, and as a result, customer demand for Wajax’s products and services may be affected by economic conditions at both a global or local level. Changes in interest rates, consumer and business confidence, corporate profits, credit conditions, foreign exchange, commodity prices and the level of government infrastructure spending may influence Wajax’s customers’ operating, maintenance and capital spending, and therefore Wajax’s sales and results of operations. Although Wajax has attempted to address its exposure to business and industry cyclicality by diversifying its operations by geography, product offerings and customer base, there can be no assurance that Wajax’s results of operations or cash flows will not be adversely affected by changes in economic conditions. Commodity prices Many of Wajax’s customers are directly and indirectly affected by fluctuations in commodity prices in the forestry, metals and minerals and petroleum and natural gas industries, and as a result Wajax is also indirectly affected by fluctuations in these prices. In particular, each of Wajax’s products and services categories are exposed to fluctuations in the price of oil and natural gas. A downward change in commodity prices, and particularly in the price of oil and natural gas, could therefore adversely affect Wajax’s results of operations or cash flows. Growth initiatives, integration of acquisitions and project execution The Corporation’s updated Strategic Plan establishes priorities for organic growth, acquisitions and operating infrastructure, including maintaining a target leverage ratio range of 1.5 – 2.0 times. See the Strategic Direction and Outlook section and the Non-GAAP and Additional GAAP Measures sections. While end market conditions remain challenging, the Corporation believes it has a robust strategy and is confident in its growth prospects. The Corporation’s confidence is strengthened by the enhanced earnings potential of a reorganized Corporation and by relationships with its customers and vendors. Wajax’s ability to develop its core capabilities and successfully grow its business through organic growth will be dependent on achieving the individual growth initiatives. Wajax’s ability to successfully grow its business through acquisitions will be dependent on a number of factors including: identification of accretive new business or acquisition opportunities; negotiation of purchase agreements on satisfactory terms and prices; prior approval of acquisitions by third parties, including any necessary regulatory approvals; securing attractive financing arrangements; and integration of newly acquired operations into the existing business. All of these activities associated with growing the business, realizing enhanced earnings potential from the new structure and investments made in systems may be more difficult to implement or may take longer to execute than management anticipates. Further, any significant expansion of the business may increase the operating complexity of Wajax, and divert management away from regular business activities. Any failure of Wajax to successfully manage its growth strategy, including acquisitions, could have a material adverse impact on Wajax’s business, results of operations or financial condition. Key personnel The success of Wajax is largely dependent on the abilities and experience of its senior management team and other key personnel. Its future performance will also depend on its ability to attract, develop and retain highly qualified employees in all areas of its business. Competition for skilled management, sales and technical personnel is intense, particularly in certain markets where Wajax competes. Wajax continuously reviews and makes adjustments to its hiring, training and compensation practices in an effort to attract and retain a highly competent workforce. There can be no assurance, however, that Wajax will be successful in its efforts and a loss of key employees, or failure to attract and retain new talent as needed, may have an adverse impact on Wajax’s current operations or future prospects. Leverage, credit availability and restrictive covenants Wajax has a $300 million bank credit facility which expires September 20, 2021. The bank credit facility contains restrictive covenants which place restrictions on, among other things, the ability of Wajax to encumber or dispose of its assets, the amount of finance costs incurred and dividends declared relative to earnings and certain reporting obligations. A failure to comply with the obligations of the facility could result in an event of default which, if not cured or waived, could require an accelerated repayment of the facility. There can be no assurance that Wajax’s assets would be sufficient to repay the facility in full. Wajax’s short-term normal course working capital requirements can swing widely quarter-to-quarter due to timing of large inventory purchases and/or sales and changes in market activity. In general, as Wajax experiences growth, there is a need for additional working capital. Conversely, as Wajax experiences economic slowdowns, working capital reduces reflecting the lower activity levels. While management
believes the bank credit facility will be adequate to meet the Corporation’s normal course working capital requirements, maintenance capital requirements and certain strategic investments, there can be no assurance that additional credit will become available if required, or that an appropriate amount of credit with comparable terms and conditions will be available when the bank credit facility matures. Wajax may be required to access the equity or debt markets or reduce dividends in order to fund significant acquisitions and growth related working capital and capital expenditures. The amount of debt service obligations under the bank credit facility will be dependent on the level of borrowings and fluctuations in interest rates to the extent the rate is unhedged. As a result, fluctuations in debt servicing costs may have a detrimental effect on future earnings or cash flow. Wajax also has credit lines available with other financial institutions for purposes of financing inventory. These facilities are not committed lines and their future availability cannot be assured, which may have a negative impact on cash available for dividends and future growth opportunities. Quality of products distributed The ability of Wajax to maintain and expand its customer base is dependent upon the ability of the manufacturers represented by Wajax to sustain or improve the quality of their products. The quality and reputation of such products are not within Wajax’s control, and there can be no assurance that manufacturers will be successful in meeting these goals. The failure of these manufacturers to maintain a market presence could adversely affect Wajax’s results of operations or cash flow. Inventory obsolescence Wajax maintains substantial amounts of inventories in its business operations. While Wajax believes it has appropriate inventory management systems in place, variations in market demand for the products it sells can result in certain items of inventory becoming obsolete. This could result in a requirement for Wajax to take a material write down of its inventory balance resulting in Wajax not being able to realize expected revenue and cash flows from its inventory, which would negatively affect results from operations or cash flow. Government regulation Wajax’s business is subject to evolving laws and government regulations, particularly in the areas of taxation, the environment, and health and safety. Changes to such laws and regulations may impose additional costs on Wajax and may adversely affect its business in other ways, including requiring additional compliance measures by Wajax. Insurance Wajax maintains a program of insurance coverage that is comparable to those maintained by similar businesses, including property insurance and general liability insurance. Although the limits and self-insured retentions of such insurance policies have been established through risk analysis and the recommendations of professional advisors, there can be no assurance that such insurance will remain available to Wajax at commercially reasonable rates or that the amount of such coverage will be adequate to cover all liability incurred by Wajax. If Wajax is held liable for amounts exceeding the limits of its insurance coverage or for claims outside the scope of that coverage, its business, results of operations or financial condition could be adversely affected. Information systems and technology Information systems are an integral part of Wajax’s business processes, including marketing of equipment and support services, inventory and logistics, and finance. Some of these systems are integrated with certain suppliers’ core processes and systems. Any disruptions to these systems or new systems due, for example, to the upgrade or conversion thereof, or the failure of these systems or new systems to operate as expected could, depending on the magnitude of the problem, adversely affect Wajax’s operating results by limiting the ability to effectively monitor and control Wajax’s operations. Credit risk Wajax extends credit to its customers, generally on an unsecured basis. Although Wajax is not substantially dependent on any one customer and it has a system of credit management in place, the loss of a large receivable would have an adverse effect on Wajax’s profitability.
Labour relations Wajax has approximately 2,418 employees. At the outset of 2017, Wajax was party to thirteen collective agreements covering a total of approximately 315 employees. Of these, one agreement was consolidated

during the year with another agreement bringing the total number of collective agreements to twelve. During 2017, three collective agreements covering 90 employees were renegotiated, of which one, covering 6 employees, has been ratified, but is still awaiting formal execution. Four collective agreements, covering 59 employees, expired in 2017 and are currently being re-negotiated. Of the remaining five collective agreements, four will expire in 2018 and preparations for re-negotiation are under way. The remaining collective agreement will expire in 2019. Overall, Wajax believes its labour relations to be satisfactory and does not anticipate it will be unable to renew the collective agreements. If Wajax is unable to renew or negotiate collective agreements from time to time, it could result in work stoppages and other labour disturbances. The failure to renew collective agreements upon satisfactory terms could have a material adverse impact on Wajax’s business, results of operations or financial condition. Foreign exchange exposure Wajax’s operating results are reported in Canadian dollars. While the majority of Wajax’s sales are in Canadian dollars, significant portions of its purchases are in U.S. dollars. Changes in the U.S. dollar exchange rate can have a negative or positive impact on Wajax’s revenue, margins and working capital balances. Wajax mitigates certain exchange rate risks by entering into short-term foreign currency forward contracts to fix the cost of certain inbound inventory and to hedge certain foreign-currency denominated sales to customers. In addition, Wajax will periodically institute price increases to offset the negative impact of foreign exchange rate increases on imported goods. The inability of Wajax to mitigate exchange rate risks or increase prices to offset foreign exchange rate increases, including sudden and volatile changes in the U.S. dollar exchange rate, may have a material adverse effect on the results of operations or financial condition of Wajax. A declining U.S. dollar relative to the Canadian dollar can have a negative effect on Wajax’s revenue and cash flows as a result of certain products being imported from the U.S. In some cases market conditions require Wajax to lower its selling prices as the U.S. dollar declines. As well, many of Wajax’s customers export products to the U.S., and a strengthening Canadian dollar can negatively impact their overall competitiveness and demand for their products, which in turn may reduce product purchases from Wajax. A strengthening U.S. dollar relative to the Canadian dollar can have a positive effect on Wajax’s revenue, as Wajax will periodically institute price increases on inventory imported from the U.S. to offset the negative impact of foreign exchange rate increases to ensure margins are not eroded. However, a sudden strengthening U.S. dollar relative to the Canadian dollar can have a negative impact mainly on parts margins in the short-term prior to price increases taking effect. Wajax maintains a hedging policy whereby significant transactional currency risks are identified and hedged. Interest rate risk Wajax has exposure to interest rate fluctuations on its interest-bearing financial liabilities, in particular from its long-term debt. Changes in interest rates can have a negative or positive impact on Wajax’s finance costs and cash flows. Wajax monitors the proportion of variable rate debt to its total debt portfolio and may enter into interest rate hedge contracts to mitigate a portion of the interest rate risk on its variable rate debt. The inability of Wajax to mitigate interest rate risks to offset interest rate increases may have a material adverse effect on the results of operations or financial condition of Wajax. Competition The categories in which Wajax participates are highly competitive and include competitors who are national, regional and local. Competitors can be grouped into three classifications: Capital Equipment Dealers and Distributors – these competitors typically represent a major alternative manufacturer and provide sales, product support, rental, financing and other services in categories such as construction, forestry, mining and power generation. Examples include the regional dealer and distributor networks of Caterpillar, Komatsu, John Deere and Cummins. Competition is based on product range and quality, aftermarket support and price.

Industrial Parts Distributors – these competitors typically represent a broad range of industrial parts manufacturers and offer sales and, in many cases, product support services including design, assembly and repair. Competitive product range varies from focused on specific applications (e.g. hydraulics) to very broad (similar to Wajax). Competitors can be local, regional and national. Competition is based on brand access, product quality, customer service levels, price and ancillary services. Aftermarket Service Providers – these competitors provide aftermarket services in areas such as on-highway transportation. Competitors vary from the dealer and distributor networks of manufacturers such as Freightliner and Western Star to local service providers. Competition is based on customer service levels and price. There can be no assurance that Wajax will be able to continue to effectively compete. Increased competitive pressures, the growing influence of online distribution or the inability of Wajax to maintain the factors which have enhanced its competitive position could adversely affect its results of operations or cash flow. Litigation and product liability claims In the ordinary course of its business, Wajax may be party to various legal actions, the outcome of which cannot be predicted with certainty. One category of potential legal actions is product liability claims. Wajax carries product liability insurance, and management believes that this insurance is adequate to protect against potential product liability claims. Not all risks, however, are covered by insurance, and no assurance can be given that insurance will be consistently available, or will be consistently available on an economically feasible basis, or that the amounts of insurance will at all times be sufficient to cover each and every loss or claim that may occur involving Wajax’s assets or operations. Guaranteed residual value, recourse and buy-back contracts In some circumstances Wajax makes certain guarantees to finance providers on behalf of its customers. These guarantees can take the form of assuring the resale value of equipment, guaranteeing a portion of customer lease payments, or agreeing to buy back the equipment at a specified price. These contracts are subject to certain conditions being met by the customer, such as maintaining the equipment in good working condition. Historically, Wajax has not incurred substantial losses on these types of contracts, however, there can be no assurance that losses will not be incurred in the future. Future warranty claims Wajax provides manufacturers’ and/or dealer warranties for most of the product it sells. In some cases, the product warranty claim risk is shared jointly with the manufacturer. In addition, Wajax provides limited warranties for workmanship on services provided. Accordingly, Wajax has some liability for warranty claims. There is a risk that a possible product quality erosion or a lack of a skilled workforce could increase warranty claims in the future, or may be greater than management anticipates. If Wajax’s liability in respect of such claims is greater than anticipated, it may have a material adverse impact on Wajax’s business, results of operations or financial condition. Maintenance and repair contracts Wajax frequently enters into long-term maintenance and repair contracts with its customers, whereby Wajax is obligated to maintain certain fleets of equipment at various negotiated performance levels. The length of these contracts varies significantly, often ranging up to five or more years. The contracts are generally fixed price, although many contracts have additional provisions for inflationary adjustments. Due to the long-term nature of these contracts, there is a risk that significant cost overruns may be incurred. If Wajax has miscalculated the extent of maintenance work required, or if actual parts and service costs increase beyond the contracted inflationary adjustments, the contract profitability will be adversely affected. In order to mitigate this risk, Wajax closely monitors the contracts for early warning signs of cost overruns. In addition, the manufacturer may, in certain circumstances, share in the cost overruns if profitability falls below a certain threshold. Any failure by Wajax to effectively price and manage these contracts could have a material adverse impact on Wajax’s business, results of operations or financial condition. Environmental factors From time to time, Wajax experiences environmental incidents, emissions or spills in the course of its normal business activities. Wajax has established environmental compliance and monitoring programs, including an internal compliance audit function, which management believes are appropriate for its operations. In addition, Wajax retains environmental engineering consultants to conduct the following activities: environmental site assessments prior to the acquisition or occupation by Wajax; ongoing monitoring of soil and groundwater contamination; and remediation of contaminated sites. To date, these environmental
incidents, emissions and spills have not resulted in any material liabilities to the Corporation, however, there can be no assurance that any future incidents, emissions or spills will not result in a material adverse effect on Wajax’s results of operations or cash flows. Management is not aware of any material environmental concerns for which a provision has not been recorded. Cyber security Wajax’s business relies on information technology including third party service providers, to process, transmit and store electronic information including that related to customers, vendors and employees. A breach in the security of the Corporation’s information technology, or that of its third party service providers, could expose the business to a risk of loss, misuse of confidential information and/or business interruption. The Corporation has general security controls in place, including security tools, and is currently implementing recommendations from a security review performed by a third party. In addition, the Corporation has policies in place regarding security over confidential customer, vendor and employee information, commenced employee security training in late 2016, and has recovery plans in place in the event of a cyber-attack. Despite such security controls, there is no assurance that cyber security threats can be fully detected, prevented or mitigated. Should such threats materialize and depending on the magnitude of the problem, they could have a material impact on Wajax’s business, results of operations or financial condition.
Disclosure Controls and Procedures and Internal Control over Financial Reporting Wajax’s management, under the supervision of its Chief Executive Officer (“CEO”) and Chief Financial Officer (“CFO”), is responsible for establishing and maintaining disclosure controls and procedures (“DC&P”) and internal control over financial reporting (“ICFR”). As at December 31, 2017, Wajax’s management, under the supervision of its CEO and CFO, had designed DC&P to provide reasonable assurance that information required to be disclosed by Wajax in annual filings, interim filings or other reports filed or submitted under applicable securities legislation is recorded, processed, summarized and reported within the time periods specified in such securities legislation. DC&P are designed to ensure that information required to be disclosed by Wajax in annual filings, interim filings or other reports filed or submitted under applicable securities legislation is accumulated and communicated to Wajax’s management, including its CEO and CFO, as appropriate, to allow timely decisions regarding required disclosure. As at December 31, 2017, Wajax’s management, under the supervision of its CEO and CFO, had designed internal control over financial reporting (“ICFR”) to provide reasonable assurance regarding the reliability of financial reporting and the preparation of financial statements for external purposes in accordance with International Financial Reporting Standards (“IFRS”). In completing the design, management used the criteria set forth by the Committee of Sponsoring Organizations of the Treadway Commission (“COSO”) in its 2013 version of Internal Control – Integrated Framework. With regard to general controls over information technology, management also used the set of practices of Control Objectives for Information and related Technology (“COBIT”) created by the IT Governance Institute. During the year, Wajax’s management, under the supervision of its CEO and CFO, evaluated the effectiveness and operation of its DC&P and ICFR. This evaluation included a risk evaluation, documentation of key processes and tests of effectiveness conducted on a sample basis throughout the year. Due to the inherent limitations in all control systems, an evaluation of the DC&P and ICFR can only provide reasonable assurance over the effectiveness of the controls. As a result, DC&P and ICFR are not expected to prevent and detect all misstatements due to error or fraud. The CEO and CFO have concluded that Wajax’s DC&P and ICFR were effective as at December 31, 2017. There was no change in Wajax’s ICFR that occurred during the three months ended December 31, 2017 that has materially affected, or is reasonably likely to materially affect, Wajax’s ICFR.
Non-GAAP and Additional GAAP Measures
The MD&A contains certain non-GAAP and additional GAAP measures that do not have a standardized meaning prescribed by GAAP. Therefore, these financial measures may not be comparable to similar measures presented by other issuers. Investors are cautioned that these measures should not be construed as an alternative to net earnings or to cash flow from operating, investing, and financing activities determined in accordance with GAAP as indicators of the Corporation’s performance. The Corporation’s management believes that:
(i) these measures are commonly reported and widely used by investors and management; (ii) the non-GAAP measures are commonly used as an indicator of a company’s cash operating
performance, profitability and ability to raise and service debt; (iii) the additional GAAP measures are commonly used to assess a company’s earnings
performance excluding its capital, tax structures and restructuring costs; and (iv) “Adjusted net earnings” and “Adjusted basic and diluted earnings per share” provide indications
of the results by the Corporation’s principal business activities prior to recognizing restructuring (recovery) costs, (gain) loss recorded on sales of properties and senior notes redemption costs that are outside the Corporation’s normal course of business. “Adjusted EBITDA” used in calculating the Leverage Ratio excludes restructuring (recovery) costs, (gain) loss recorded on sales of properties and senior notes redemption costs which is consistent with the leverage ratio calculation under the Corporation’s bank credit agreement.
Non-GAAP financial measures are identified and defined below: Funded net debt Funded net debt includes bank indebtedness, current portion of long-term
debt, long-term debt and obligations under finance leases, net of cash. Funded net debt is relevant in calculating the Corporation’s Funded Net Debt to Total Capital, which is a non-GAAP measure commonly used as an indicator of a company’s ability to raise and service debt.
Debt Debt is funded net debt plus letters of credit. Debt is relevant in calculating the Corporation’s Leverage Ratio, which is a non-GAAP measure commonly used as an indicator of a company’s ability to raise and service debt.
EBITDA Net earnings (loss) before finance costs, income tax expense, depreciation and amortization.
EBITDA margin Defined as EBITDA divided by revenue, as presented on the Consolidated Statements of Earnings.
Adjusted net earnings (loss)
Net earnings (loss) before after-tax restructuring (recovery) costs, (gain) loss recorded on sales of properties and senior notes redemption costs.
Adjusted basic and diluted earnings (loss) per share
Basic and diluted earnings (loss) per share before after-tax restructuring (recovery) costs, (gain) loss recorded on sales of properties and senior notes redemption costs.
Adjusted EBITDA EBITDA before restructuring (recovery) costs, (gain) loss recorded on sales of properties and senior notes redemption costs.
Adjusted EBITDA margin Defined as Adjusted EBITDA divided by revenue, as presented on the Consolidated Statements of Earnings.
Leverage ratio
The leverage ratio is defined as debt at the end of a particular quarter divided by trailing 12-month Adjusted EBITDA. The Corporation’s objective is to maintain this ratio between 1.5 times and 2.0 times.
Funded net debt to total capital
Defined as funded net debt divided by total capital. Total capital is the funded net debt plus shareholder’s equity.
Backlog Backlog includes the total sales value of customer purchase commitments for future delivery or commissioning of equipment, parts and related services.

Additional GAAP measures are identified and defined below: Earnings (loss) before finance costs and income taxes (EBIT)
Earnings (loss) before finance costs and income taxes, as presented on the Consolidated Statements of Earnings.
EBIT margin
Defined as EBIT divided by revenue, as presented on the Consolidated Statements of Earnings.
Earnings (loss) before income taxes (EBT)
Earnings (loss) before income taxes, as presented on the Consolidated Statements of Earnings.
Working capital Defined as current assets less current liabilities, as presented on the Consolidated Statements of Financial Position.
Other working capital amounts
Defined as working capital less trade and other receivables and inventories plus accounts payable and accrued liabilities, as presented on the Consolidated Statements of Financial Position.
Reconciliation of the Corporation’s net earnings to adjusted net earnings and adjusted basic and diluted earnings per share is as follows:
Three months ended Twelve months ended
December 31 December 31
2017 2016 2017 2016
Net earnings $ 8.0 $ 8.9 $ 30.9 $ 11.0
Restructuring (recovery) costs, after-tax - - (0.2) 9.1
(Gain) recorded on sales of properties, after-tax (1.2) - (1.2) -
Senior notes redemption, after-tax 4.0 - 4.0 -
Adjusted net earnings $ 10.9 $ 8.9 $ 33.5 $ 20.1
Adjusted basic earnings per share(1)(2)
Adjusted diluted earnings per share(1)(2)
$ $
0.56 0.54
$ $
0.45 0.44
$ $
1.71 1.66
$ $
1.01 1.00
(1) At December 31, 2017 the numbers of basic and diluted shares outstanding were 19,504,107 and 20,132,863, respectively for the three months ended and 19,605,884 and 20,204,738, respectively for the twelve months ended.
(2) At December 31, 2016 the numbers of basic and diluted shares outstanding were 19,805,485 and 20,250,820, respectively for the three months ended and 19,898,004 and 20,203,771, respectively for the twelve months ended.

Reconciliation of the Corporation’s net earnings to EBT, EBIT, EBITDA and Adjusted EBITDA is as follows: Three months ended
December 31 Twelve months ended
December 31 2017 2016 2017 2016
Net earnings $ 8.0 $ 8.9 $ 30.9 $ 11.0 Income tax expense 3.0 3.5 11.8 4.7
EBT 11.0 12.4 42.7 15.7 Finance costs 2.0 2.8 9.8 11.2 Senior notes redemption
(1) 5.5 - 5.5 -
EBIT 18.5 15.2 58.0 26.9 Depreciation and amortization 5.8 6.3 22.4 24.5
EBITDA 24.2 21.5 80.4 51.5 Restructuring (recovery) costs(2)
- - (0.3) 12.5 (Gain) recorded on sales of properties
(3) (1.4) - (1.5) -
Adjusted EBITDA $ 22.8 $ 21.5 $ 78.6 $ 64.0 (1) For the three and twelve months ended December 31, 2017 – Includes the $5.5 million senior notes redemption costs recorded in
the fourth quarter of 2017. (2) For the twelve months ended December 31, 2017 – Includes the $0.3 million restructuring recovery recorded in the second quarter
of 2017. For the twelve months ended December 31, 2016 – Includes the $12.5 million restructuring provision recorded in the first quarter of 2016.
(3) For the three months ended December 31, 2017 – Includes the $1.4 million gain recorded on sales of properties recorded in the fourth quarter of 2017. For the twelve months ended December 31, 2017 – Includes the $1.5 million gain recorded on sales of properties recorded in 2017.
Calculation of the Corporation’s funded net debt, debt and leverage ratio is as follows: December 31 December 31 2017 2016
Bank indebtedness (cash) $ 1.7 $ (4.9) Obligations under finance leases 9.5 8.9 Long-term debt 143.7 122.0
Funded net debt $ 154.9 $ 126.0
Letters of credit 7.3 6.4
Debt 162.2 132.4
Leverage ratio
(1)
2.06
2.07
(1) Calculation uses trailing four-quarter Adjusted EBITDA. This leverage ratio is calculated for purposes of monitoring the Corporation’s objective target leverage ratio of between 1.5 times and 2.0 times. The calculation contains some differences from the leverage ratio calculated under the Corporation’s bank credit facility agreement (“the agreement”). The resulting leverage ratio under the agreement is not significantly different. See the Liquidity and Capital Resources section.
Cautionary Statement Regarding Forward-Looking Information This MD&A contains certain forward-looking statements and forward-looking information, as defined in applicable securities laws (collectively, “forward-looking statements”). These forward-looking statements relate to future events or the Corporation’s future performance. All statements other than statements of historical fact are forward-looking statements. Often, but not always, forward looking statements can be identified by the use of words such as “plans”, “anticipates”, “intends”, “predicts”, “expects”, “is expected”, “scheduled”, “believes”, “estimates”, “projects” or “forecasts”, or variations of, or the negatives of, such words and phrases or state that certain actions, events or results “may”, “could”, “would”, “should”, “might” or “will” be taken, occur or be achieved. Forward looking statements involve known and unknown risks, uncertainties and other factors beyond the Corporation’s ability to predict or control which may cause actual results, performance and achievements to differ materially from those anticipated or implied in such forward looking statements. There can be no assurance that any forward looking statement will materialize. Accordingly, readers should not place undue reliance on forward looking statements. The forward looking statements in this MD&A are made as of the date of this MD&A, reflect management’s current beliefs and are based on information currently available to management. Although management believes that the expectations represented in such forward-looking statements are reasonable, there is no assurance that such expectations will prove to be correct. Specifically, this MD&A includes forward looking statements regarding,
among other things, our goal of becoming Canada’s leading industrial products and services provider, distinguished through our core capabilities; our belief that achieving excellence in our areas of core capability will position Wajax to create value for its customers, employees, vendors and shareholders; the main elements of our updated Strategic Plan, including adjustments to our organic growth priorities, continued integration of our infrastructure, increased technology investments, further consolidation of our physical branch network, investments in multi-purpose facilities, investments in customer-facing teams, focus on cost efficiency in support areas and continued review of acquisition opportunities; our expectations and outlook for 2018, including with respect to adjusted net earnings and gross margins, as well as our expectation that our ongoing focus on cost productivity will assist us in offsetting planned investments in our strategy and expected margin pressure; our outlook on regional end market conditions in Canada during 2018, including our expectation that year-over-year gains in western Canada will not be as significant as they were in 2017; our target leverage ratio range of 1.5 – 2.0 times; our financing, working and maintenance capital requirements, as well as our capital structure and leverage ratio; our estimate of the number of shares required to settle our obligations under certain share-based compensation plans; our expectation that a change in interest rates will not have a material impact on our results of operations over the longer term; our expectation that a change in foreign currency, relative to the Canadian dollar, on transactions with customers that include unhedged foreign currency exposures, will not have a material impact on our results of operations or financial condition over the longer term; our belief there is not a significant risk of non-performance by counterparties to short-term currency forward contracts; our expectation that future defined benefit plan cash contribution requirements will not vary materially from the 2017 contribution level; the adequacy of our debt capacity and sufficiency of our debt facilities; our intention and ability to access debt and equity markets or reduce dividends should additional capital be required, including the potential that we may access equity or debt markets to fund significant acquisitions; our assessment of the impact that the adoption of certain new or amended accounting standards will have, including on the Corporation’s policies and financial statements/results and, where applicable, our intended transition method/plans for such standards; and our confidence in our growth prospects. These statements are based on a number of assumptions which may prove to be incorrect, including, but not limited to, assumptions regarding general business and economic conditions; the supply and demand for, and the level and volatility of prices for, oil, natural gas and other commodities; financial market conditions, including interest rates; our ability to execute our updated Strategic Plan, including our ability to develop our core capabilities, execute our organic growth priorities, complete and effectively integrate acquisitions and to successfully implement new information technology platforms, systems and software; our ability to realize the full benefits from our 2016 strategic reorganization, including cost savings and productivity gains; the future financial performance of the Corporation; our costs; market competition; our ability to attract and retain skilled staff; our ability to procure quality products and inventory; and our ongoing relations with suppliers, employees and customers. The foregoing list of assumptions is not exhaustive. Factors that may cause actual results to vary materially include, but are not limited to, a deterioration in general business and economic conditions; volatility in the supply and demand for, and the level of prices for, oil, natural gas and other commodities; a continued or prolonged decrease in the price of oil or natural gas; fluctuations in financial market conditions, including interest rates; the level of demand for, and prices of, the products and services we offer; levels of customer confidence and spending; market acceptance of the products we offer; termination of distribution or original equipment manufacturer agreements; unanticipated operational difficulties (including failure of plant, equipment or processes to operate in accordance with specifications or expectations, cost escalation, our inability to reduce costs in response to slow-downs in market activity, unavailability of quality products or inventory, supply disruptions, job action and unanticipated events related to health, safety and environmental matters); our ability to attract and retain skilled staff and our ability to maintain our relationships with suppliers, employees and customers. The foregoing list of factors is not exhaustive. Further information concerning the risks and uncertainties associated with these forward looking statements and the Corporation’s business may be found in this MD&A under the heading “Risk Management and Uncertainties” and in our Annual Information Form for the year ended December 31, 2017, filed on SEDAR. The forward-looking statements contained in this MD&A are expressly qualified in their entirety by this cautionary statement. The Corporation does not undertake any obligation to publicly update such forward-looking statements to reflect new information, subsequent events or otherwise unless so required by applicable securities laws. Additional information, including Wajax’s Annual Report, are available on SEDAR at www.sedar.com.
WAJAX CORPORATION
Unaudited Condensed Consolidated Interim Financial Statements
For the three and twelve months ended December 31, 2017

W A J A X C O R P O R A T I O N
C O N D E N S E D C O N S O L I D A T E D S T A T E M E N T S O F
F I N A N C I A L P O S I T I O N
As at (unaudited, in thousands of Canadian dollars)
Note December
31, 2017 December
31, 2016
ASSETS CURRENT Cash $ - $ 4,854 Trade and other receivables 207,353 194,613 Contracts in progress 4,128 7,095 Inventories 322,778 283,421 Deposits on inventory 6,874 19,407 Prepaid expenses 4,329 5,463 Derivative instruments - 553
545,462 515,406
NON-CURRENT Rental equipment 4 61,257 58,106 Property, plant and equipment 5 44,834 45,658 Goodwill and intangible assets 41,005 41,205 Deferred tax assets 13 - 4,573
147,096 149,542
$ 692,558 $ 664,948
LIABILITIES AND SHAREHOLDERS’ EQUITY CURRENT Bank indebtedness $ 1,724 $ - Accounts payable and accrued liabilities 6 229,458 232,715 Provisions 6,043 5,839 Dividends payable 4,876 4,956 Income taxes payable 667 2,287 Obligations under finance leases 7 3,790 3,701 Derivative instruments 396 -
246,954 249,498
NON-CURRENT Provisions 2,150 2,305 Deferred taxes 13 1,401 - Employee benefits 8,545 8,106 Other liabilities 435 1,118 Obligations under finance leases 7 5,721 5,154 Long-term debt 8 143,667 121,952
161,919 138,635
SHAREHOLDERS’ EQUITY Share capital 9 175,863 178,764 Contributed surplus 10,455 7,137 Retained earnings 97,661 90,812 Accumulated other comprehensive (loss) income (294) 102
Total shareholders’ equity 283,685 276,815
$ 692,558 $ 664,948
These unaudited condensed consolidated interim financial statements were approved by the Board of Directors on March 5, 2018.

W A J A X C O R P O R A T I O N
C O N D E N S E D C O N S O L I D A T E D S T A T E M E N T S O F
E A R N I N G S
(unaudited, in thousands of Canadian dollars, except per share data) Note
Three months ended December 31
Twelve months ended December 31
2017 2016 2017 2016
Revenue 12 $ 376,609 $ 313,725 $ 1,319,290 $ 1,221,908 Cost of sales 307,967 250,917 1,064,468 990,966
Gross profit 68,642 62,808 254,822 230,942
Selling and administrative expenses 50,215 50,264 197,145 195,203
Restructuring (recovery) costs - - (315) 12,500
Insurance recoveries - (2,646) - (3,663)
Earnings before finance costs and income taxes 18,427 15,190 57,992 26,902 Finance costs 7,427 2,809 15,249 11,181
Earnings before income taxes 11,000 12,381 42,743 15,721 Income tax expense 13 2,953 3,486 11,844 4,722
Net earnings $ 8,047 $ 8,895 $ 30,899 $ 10,999
Basic earnings per share 14 $ 0.41 $ 0.45 $ 1.58 $ 0.55
Diluted earnings per share 14 $ 0.40 $ 0.44 $ 1.53 $ 0.54
W A J A X C O R P O R A T I O N
C O N D E N S E D C O N S O L I D A T E D S T A T E M E N T S O F
C O M P R E H E N S I V E I N C O M E
Three months ended
December 31 Twelve months ended
December 31 (unaudited, in thousands of Canadian dollars) 2017 2016 2017 2016
Net earnings $ 8,047 $ 8,895 $ 30,899 $ 10,999
Items that will not be reclassified to income
Actuarial gains on pension plans, net of tax expense of $49 (2016 – recovery of $293) and year to date, net of tax expense of $49 (2016 – recovery of $293)
132
(797)
132
(797)
Items that may be subsequently reclassified to income Losses on derivative instruments designated as cash flow hedges in prior periods reclassified to cost of inventory or finance costs during the period, net of tax recovery of $136 (2016 – $11) and year to date, net of tax recovery of $253 (2016 – $147)
368
31
686
408
(Losses) gains on derivative instruments outstanding at the end of the period designated as cash flow hedges, net of tax recovery of $127 (2016 – expense of $33) and year to date, net of tax recovery of $399 (2016 – $418)
(342)
91
(1,082)
(1,135)
Other comprehensive income (loss), net of tax 158 (675) (264) (1,524)
Total comprehensive income $ 8,205 $ 8,220 $ 30,635 $ 9,475
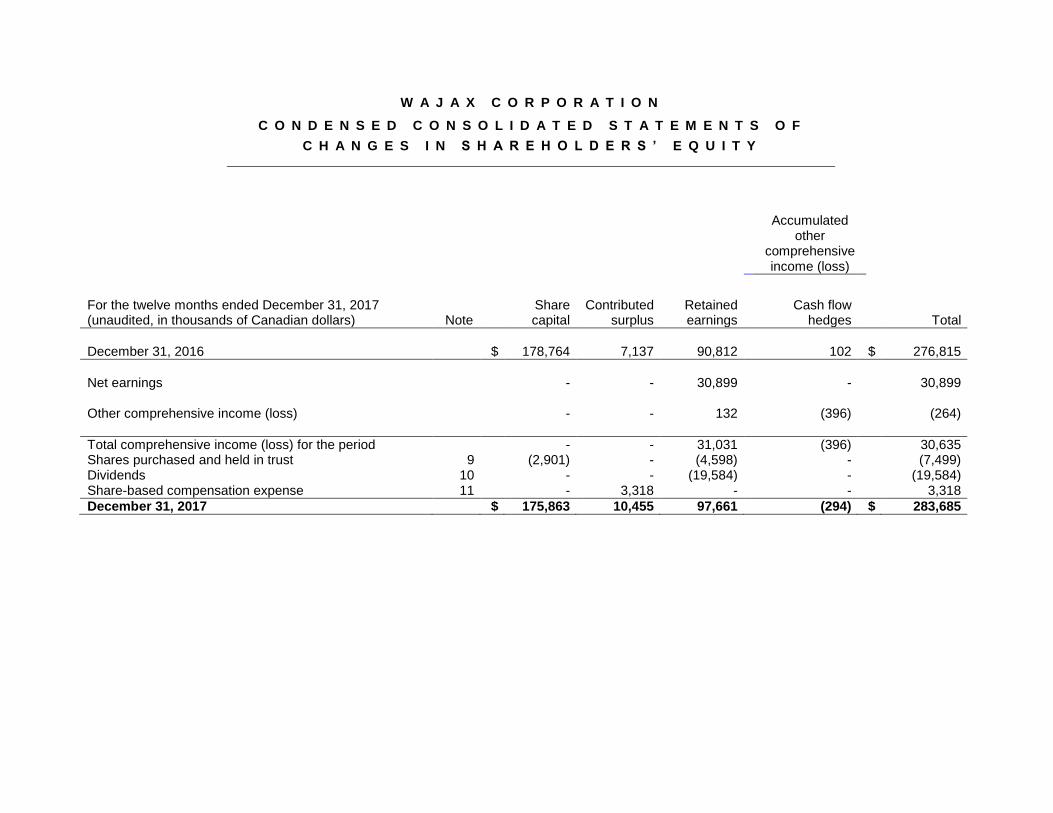
W A J A X C O R P O R A T I O N
C O N D E N S E D C O N S O L I D A T E D S T A T E M E N T S O F
C H A N G E S I N S H A R E H O L D E R S ’ E Q U I T Y
Accumulated other
comprehensive income (loss)
For the twelve months ended December 31, 2017 (unaudited, in thousands of Canadian dollars)
Note
Share capital
Contributed surplus
Retained earnings
Cash flow hedges
Total
December 31, 2016 $ 178,764 7,137 90,812 102 $ 276,815
Net earnings - - 30,899 - 30,899 Other comprehensive income (loss) - - 132 (396) (264)
Total comprehensive income (loss) for the period - - 31,031 (396) 30,635 Shares purchased and held in trust 9 (2,901) - (4,598) - (7,499) Dividends 10 - - (19,584) - (19,584) Share-based compensation expense 11 - 3,318 - - 3,318
December 31, 2017 $ 175,863 10,455 97,661 (294) $ 283,685

W A J A X C O R P O R A T I O N
C O N D E N S E D C O N S O L I D A T E D S T A T E M E N T S O F
C H A N G E S I N S H A R E H O L D E R S ’ E Q U I T Y
Accumulated other
comprehensive income (loss)
For the twelve months ended December 31, 2016 (unaudited, in thousands of Canadian dollars)
Note
Share capital
Contributed surplus
Retained earnings
Cash flow hedges
Total
December 31, 2015 $ 179,829 5,930 101,916 829 $ 288,504
Net earnings - - 10,999 - 10,999 Other comprehensive loss - - (797) (727) (1,524)
Total comprehensive income (loss) for the period - - 10,202 (727) 9,475 Shares issued to settle share-based compensation plans 9 743 (743) - - - Shares purchased and held in trust 7 (1,808) - (1,437) - (3,245) Dividends 8 - - (19,869) - (19,869) Share-based compensation expense 9 - 1,950 - - 1,950
December 31, 2016 $ 178,764 7,137 90,812 102 $ 276,815

41
W A J A X C O R P O R A T I O N
C O N D E N S E D C O N S O L I D A T E D S T A T E M E N T S O F
C A S H F L O W S
Three months ended
December 31 Twelve months
ended December 31
(unaudited, in thousands of Canadian dollars) Note 2017 2016 2017 2016
OPERATING ACTIVITIES
Net earnings $ 8,047 $ 8,895 $ 30,899 $ 10,999
Items not affecting cash flow: Depreciation and amortization: Rental equipment 3,358 3,635 13,402 14,578 Property, plant and equipment 2,299 2,506 8,403 9,161 Intangible assets 148 153 570 809 Gain on disposal of property, plant and equipment 5 (1,434) (21) (1,493) (197) Share-based compensation expense 11 777 622 3,318 1,950 Non-cash rental expense 4 313 187 476 Employee benefits expense, net of payments 203 (36) 443 264 Change in fair value of non-hedge derivative instruments 76 (39) 306 475 Finance costs 7,427 2,809 15,249 11,181 Income tax expense 13 2,953 3,486 11,844 4,722
23,858 22,323 83,128 54,418
Changes in non-cash operating working capital 15 2,270 14,208 (33,660) 30,900
Rental equipment additions 4 (7,038) (3,790) (19,310) (13,538) Other non-current liabilities (254) (48) (838) (925) Finance costs paid (9,373) (4,473) (14,784) (10,299) Income taxes paid (1,377) (2) (7,393) (2,373)
Cash generated from operating activities 8,086 28,218 7,143 58,183
INVESTING ACTIVITIES
Property, plant and equipment additions 5 (2,145) (754) (4,291) (3,888) Proceeds on disposal of property, plant and equipment 5 1,854 67 2,816 833 Intangible assets additions (342) (107) (370) (247) Acquisition of business - 8 - (5,565)
Cash used in investing activities (633) (786) (1,845) (8,867)
FINANCING ACTIVITIES
Net increase (decrease) in bank debt 8 2,000 (17,000) 20,000 (30,000) Common shares purchased and held in trust 9 - - (7,499) (3,245) Deferred financing costs 8 (132) - (567) (367) Finance lease payments 7 (879) (1,000) (3,955) (4,254) Settlement of non-hedge derivative instruments 33 (4) (191) (300) Dividends paid (4,876) (4,948) (19,664) (19,910)
Cash used in financing activities (3,854) (22,952) (11,876) (58,076)
Change in cash and bank indebtedness 3,599 4,480 (6,578) (8,760)
(Bank indebtedness) cash - beginning of period (5,323) 374 4,854 13,614
(Bank indebtedness) cash - end of period $ (1,724) $ 4,854 $ (1,724) $ 4,854

42
W A J A X C O R P O R A T I O N
N O T E S T O C O N D E N S E D C O N S O L I D A T E D
I N T E R I M F I N A N C I A L S T A T E M E N T S
DECEMBER 31, 2017
(unaudited, amounts in thousands of Canadian dollars, except share and per share data)
1. COMPANY PROFILE
Wajax Corporation (the “Corporation”) is incorporated in Canada. The address of the Corporation’s registered
office is 2250 Argentia Road, Mississauga, Ontario, Canada. The Corporation operates an integrated distribution
system providing sales, parts and services to a broad range of customers in diversified sectors of the Canadian
economy, including: transportation, forestry, industrial and commercial, construction, oil sands, mining, metal
processing, government and utilities and oil and gas.
2. BASIS OF PREPARATION
Statement of compliance
These unaudited condensed consolidated interim financial statements have been prepared in accordance with
International Accounting Standard (“IAS”) 34 Interim Financial Reporting and do not include all of the disclosures
required for full consolidated financial statements. Accordingly, these unaudited condensed consolidated interim
financial statements should be read in conjunction with the audited consolidated financial statements of the
Corporation for the year ended December 31, 2016. The significant accounting policies follow those disclosed in
the most recently reported audited consolidated financial statements, except as disclosed in Note 3.
Basis of measurement
These unaudited condensed consolidated interim financial statements have been prepared under the historical
cost basis except for derivative financial instruments and share-based payment arrangements that have been
measured at fair value. The defined benefit liability is recognized as the net total of the fair value of the plan
assets and the present value of the defined benefit obligation.
Functional and presentation currency
These unaudited condensed consolidated interim financial statements are presented in Canadian dollars, which is
the Corporation’s functional currency. All financial information presented in Canadian dollars has been rounded to
the nearest thousand, unless otherwise stated and except share and per share data.

43
3. CHANGE IN ACCOUNTING POLICIES
Accounting standards adopted during the period
Effective January 1, 2017, the Corporation adopted the amendments to IAS 7 Statement of Cash Flows, which
requires disclosures that enable users of financial statements to evaluate changes in liabilities arising from
financing activities, including both changes arising from cash flow and non-cash flow changes. See Notes 7 and 8
for additional disclosures.
New standards and interpretations not yet adopted
On January 1, 2018, the Corporation will be required to adopt IFRS 15 Revenue from Contracts with Customers.
The standard contains a single model that applies to contracts with customers and two approaches to recognizing
revenue: at a point in time or over time. The model features a contract-based five-step analysis of transactions to
determine whether, how much and when revenue is recognized. New estimates and judgemental thresholds have
been introduced, which may affect the amount and/or timing of revenue recognized.
The Corporation has completed its assessment of the new standard and has identified the following change that
will result from the adoption of IFRS 15:
The revenue recognition pattern for product support service orders will change to an over-time pattern
rather than the point in time recognition that was previously used to best depict performance in
transferring control of the repair service. While the total amount of revenue recognized under IFRS 15
will not change materially, it will be recognized earlier to reflect the measure of progress over time.
The Corporation also reviewed its other revenue streams including sales of equipment that involves the design,
installation and assembly of power generation systems and has concluded that they will be substantially
unchanged by the new standard. In addition, the revenue pattern for the rental of equipment will remain
unchanged as it is excluded from the scope of the new standard and is accounted for in accordance with IAS 17
Leases.
The Corporation intends to use the retrospective transition method, which means that it will record the cumulative
impact of the accounting policy change in retained earnings as at January 1, 2017 and will restate the
comparative 2017 amounts when reporting 2018 results. The Corporation will elect to use a practical expedient
when restating its prior year results in its 2018 financial statements and not disclose the amounts of the
transaction price allocated to remaining performance obligations nor provide an explanation of when it expects to
recognize that amount as revenue.
On January 1, 2017, adoption of IFRS 15 will result in an increase to retained earnings of approximately $1,500.
For the year ended December 31, 2017, such adoption will result in increases of approximately $790 and
approximately $140 to revenue and earnings respectively.
On January 1, 2018, the Corporation will be required to adopt IFRS 9 Financial Instruments, which will replace
IAS 39 Financial Instruments: Recognition and Measurement. The new standard introduces new requirements for

44
the classification and measurement of financial assets. Under IFRS 9, financial assets are classified and
measured based on the business model in which they are held and the characteristics of their contractual cash
flows.
The standard largely retains the existing accounting requirements for financial liabilities with the exception of
accounting for non-substantial modifications of financial liabilities and the accounting treatment of fair value
changes attributable to changes in its own credit risk of financial liabilities that are designated as fair value
through profit and loss.
It also replaces the current ‘incurred’ impairment of financial assets model with a new ‘expected credit loss’
model.
IFRS 9 also includes a new general hedge accounting standard which aligns hedge accounting more closely with
risk management. The Corporation elects to apply the hedge requirements of IFRS 9 to its existing hedge
relationships. The Corporation’s existing hedge relationships that qualified for hedge accounting under IAS 39 will
continue to qualify for hedge accounting under IFRS 9.
Based on the current facts and circumstances, the Corporation does not expect the transition to IFRS 9 to have a
material impact on the Corporation’s consolidated financial statements.
On January 1, 2019, the Corporation will be required to adopt IFRS 16 Leases. The new standard contains a
single lease accounting model for lessees, whereby all leases with a term longer than 12 months are recognized
on-balance sheet through a right-of-use asset and lease liability. The model features a front-loaded total lease
expense recognized through a combination of depreciation and interest. Lessor accounting remains similar to
current requirements. The Corporation’s long term leases primarily relate to rental of real estate. The new
standard will result in a material increase in right of use assets and lease obligations but the impact to earnings
has not yet been estimated.
4. RENTAL EQUIPMENT
The Corporation acquired rental equipment with a cost of $7,038 during the quarter (2016 – $3,790) and $19,310
year to date (2016 – $13,538). Equipment with a carrying amount of $474 during the quarter (2016 - $507) and
$586 year to date (2016 – $3,998) was transferred from inventories to rental equipment. Equipment with a
carrying amount of $1,163 during the quarter (2016 - $2,131) and $3,343 year to date (2016 – $8,956) was
transferred from rental equipment to inventories.
5. PROPERTY, PLANT AND EQUIPMENT
The Corporation acquired property, plant and equipment with a cost of $2,145 during the quarter (2016 – $1,051)
and $4,291 year to date (2016 – $7,170). Assets with a carrying amount of $420 during the quarter (2016 – $46)
and $1,323 year to date (2016 – $636) were disposed of, resulting in a gain on disposal of $1,434 during the
quarter (2016 – $21) and $1,493 year to date (2016 – $197).

45
6. ACCOUNTS PAYABLE AND ACCRUED LIABILITIES
December 31, 2017 December 31, 2016
Trade payables $ 114,923 $ 130,043
Deferred income – contract revenue 1,005 25
Deferred income – other 16,941 15,300
Supplier payables with extended terms 36,119 29,232
Payroll, bonuses and incentives 29,577 22,223
Restructuring accrual 468 4,687
Accrued liabilities 30,425 31,205
Accounts payable and accrued liabilities $ 229,458 $ 232,715
7. OBLIGATIONS UNDER FINANCE LEASES
Three months ended December 31
Twelve months ended December 31
2017 2016 2017 2016
Balance at beginning of period $ 8,290 $ 9,533 $ 8,855 $ 11,042 Changes from financing cash flows Finance lease payments (879) (1,000) (3,955) (4,254) Other changes New finance leases 2,100 322 4,611 2,067
Balance at end of period $ 9,511 $ 8,855 $ 9,511 $ 8,855
8. LONG-TERM DEBT
On September 20, 2017, the Corporation amended its bank credit facility, extending the maturity date from August
12, 2020 to September 20, 2021. In addition, a $50,000 non-revolving term facility was added to the existing
$250,000 revolving term portion of the facility, increasing the total facility size to $300,000. The existing financial
covenants under the credit facility restricting distributions, acquisitions and investments have been increased to a
leverage ratio of 4.0 times. The $567 cost of amending the facility has been capitalized and will be amortized over
the remaining term of the facility.
On October 23, 2017, the Corporation redeemed all of its outstanding 6.125% senior notes using proceeds from
the amended bank credit facility. The redemption amount was 103.063% of the principal amount, including a
$3,829 call premium plus accrued and unpaid interest to the redemption date. As a result of the senior notes early
redemption, the remaining deferred financing costs of $1,625 relating to the senior notes 2013 issuance were
written off in the fourth quarter of 2017.
Three months ended December 31
Twelve months ended December 31
2017 2016 2017 2016
Balance at beginning of period $ 140,083 $ 138,759 $ 121,952 $ 151,582 Changes from financing cash flows
Net proceeds (repayments) of borrowings 2,000 (17,000) 20,000 (30,000) Transaction costs related to borrowings (132) - (567) (367)
Other changes Amortization of capitalized transaction costs
91 193 657 737
Write-off of capitalized transaction costs 1,625 - 1,625 -
Balance at end of period $ 143,667 $ 121,952 $ 143,667 $ 121,952

46
9. SHARE CAPITAL
Number of Common Shares Amount
Issued and outstanding, December 31, 2016 and December 31, 2017 20,026,819 $ 180,572
Shares held in trust, December 31, 2016 (200,968) (1,808)
Purchased for future settlement of certain share-based compensation plans
(321,744) (2,901)
Shares held in trust, December 31, 2017 (522,712) (4,709)
Issued and outstanding, net of shares held in trust, December 31, 2017 19,504,107 $ 175,863
Note
Number of Common Shares Amount
Issued and outstanding, December 31, 2015 19,986,241 $ 179,829
Common shares issued to settle share-based compensation plans 11 40,578 743
Issued and outstanding, December 31, 2016 20,026,819 $ 180,572
Shares held in trust, December 31, 2015 - -
Purchased for future settlement of certain share-based compensation plans
(200,968) (1,808)
Shares held in trust, December 31, 2016 (200,968) (1,808)
Issued and outstanding, net of shares held in trust, December 31, 2016 19,825,851 $ 178,764
During the twelve months ended December 31, 2017, the Corporation purchased 321,744 (2016 – 200,968)
common shares on the open market through Employee Benefit Plan Trusts for the future settlement of certain
share-based compensation plans. The cash consideration paid for the purchase was $7,499, (2016 - $3,245) the
reduction in share capital was $2,901 (2016 - $1,808) and the premium charged to retained earnings was $4,598
(2016 - $1,437).
10. DIVIDENDS DECLARED
During the three months ended December 31, 2017, the Corporation declared cash dividends of $0.25 per share
or $4,876 (2016 – dividends of $0.25 per share or $4,956).
Year to date, the Corporation declared cash dividends of $1.00 per share or $19,584 (2016 – dividends of $1.00
per share or $19,869).
On March 5, 2018, the Corporation declared a first quarter 2018 dividend of $0.25 per share or $4,876.

47
11. SHARE-BASED COMPENSATION PLANS
The Corporation has four share-based compensation plans: the Wajax Share Ownership Plan (“SOP”), the Directors’ Deferred Share Unit Plan (“DDSUP”), the Mid-Term Incentive Plan for Senior Executives (“MTIP”) and the Deferred Share Unit Plan (“DSUP”).
a) Treasury share rights plans The Corporation recorded compensation cost of $149 for the quarter (2016 – $187) and $608 for the year to date
(2016 – $731) in respect of the SOP and DDSUP plans.
Twelve months ended December 31, 2017
Twelve months ended December 31, 2016
Number of rights
Fair value at time of grant
Number of rights
Fair value at time of grant
Outstanding at beginning of year 345,458 $ 5,935 325,144 $ 6,008 Granted in the period – new grants 26,891 589 39,164 670 – dividend equivalents 16,634 - 21,728 - Settled in the period - - (40,578) (743)
Outstanding at end of period 388,983 $ 6,524 345,458 $ 5,935
At December 31, 2017, all share rights were vested (December 31, 2016 – 339,504).
b) Market-purchased share rights plans In March 2016, the MTIP and DSUP were amended such that all new grants under the MTIP, comprised of
restricted share units (“RSUs”) and performance share units (“PSUs”), and all new grants under the DSUP will be
settled in market-purchased common shares of the Corporation on a one-for-one basis provided that the time and
performance vesting criteria are met. Whenever dividends are paid on the Corporation’s shares, additional rights
with a value equal to the dividends are credited to the participants’ accounts with the same vesting conditions as
the original MTIP and DSUP rights. Grants prior to March 2016 under these plans will be settled in cash. The
Corporation recorded compensation cost of $628 for the quarter (2016 - $435) and $2,710 for the year to date
(2016 – $1,219) in respect of these plans. The following RSUs and PSUs under the plans are outstanding:
Twelve months ended December 31, 2017
Twelve months ended December 31, 2016
Number of rights
Fair value at time of grant
Number of rights
Fair value at time of grant
Outstanding at beginning of year 315,916 $ 5,211 - $ - Granted in the period – new grants 219,440 5,378 324,702 5,549 – dividend equivalents 20,944 - 11,007 - Forfeitures (57,860) (1,165) (19,793) (338)
Outstanding at end of period 498,440 $ 9,424 315,916 $ 5,211
At December 31, 2017, no RSUs or PSUs were vested (December 31, 2016 – nil). At December 31, 2017, the
number of shares held in trust approximates the number of market-purchased share settled rights outstanding.
c) Cash-settled rights plans The Corporation recorded compensation cost of $320 for the quarter (2016 – $538) and compensation cost of
$455 for the year to date (2016 – $776) in respect of the share-based portion of the MTIP and DSUP for grants
dated before March, 2016. At December 31, 2017, the carrying amount of the share-based portion of these
liabilities was $1,373 (December 31, 2016 – $1,634).
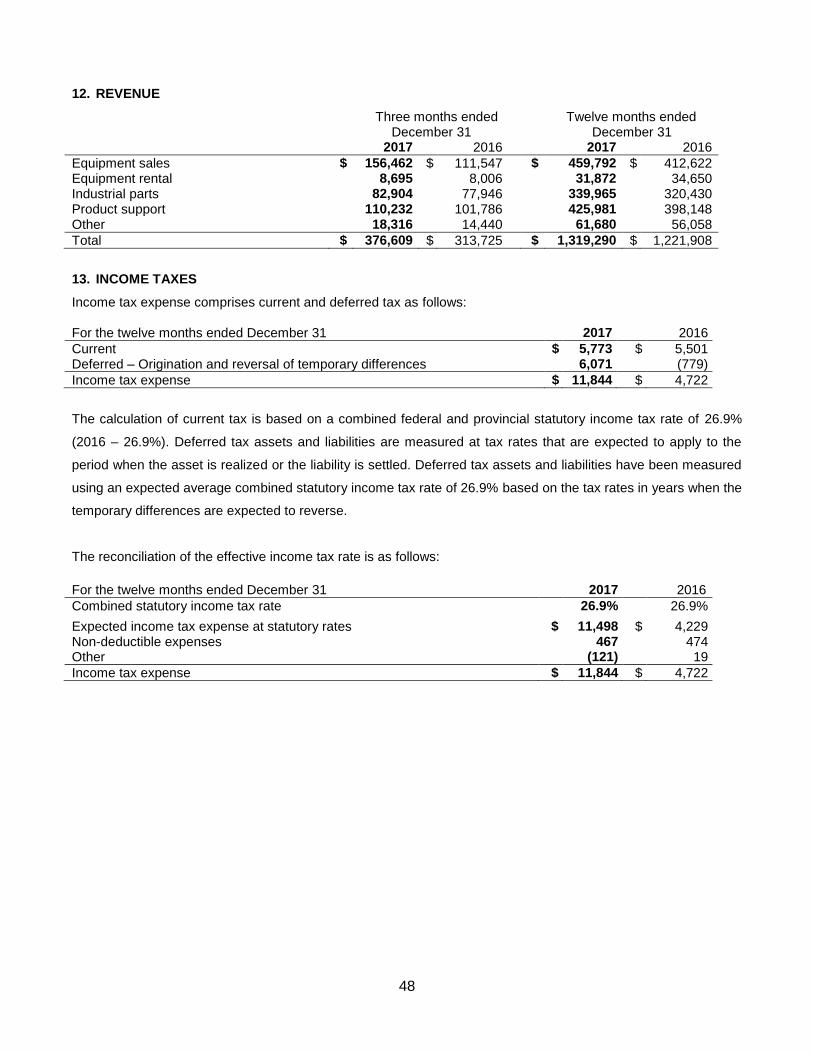
48
12. REVENUE
Three months ended December 31
Twelve months ended December 31
2017 2016 2017 2016
Equipment sales $ 156,462 $ 111,547 $ 459,792 $ 412,622 Equipment rental 8,695 8,006 31,872 34,650 Industrial parts 82,904 77,946 339,965 320,430 Product support 110,232 101,786 425,981 398,148 Other 18,316 14,440 61,680 56,058
Total $ 376,609 $ 313,725 $ 1,319,290 $ 1,221,908
13. INCOME TAXES
Income tax expense comprises current and deferred tax as follows: For the twelve months ended December 31
2017
2016
Current $ 5,773 $ 5,501 Deferred – Origination and reversal of temporary differences 6,071 (779)
Income tax expense $ 11,844 $ 4,722
The calculation of current tax is based on a combined federal and provincial statutory income tax rate of 26.9%
(2016 – 26.9%). Deferred tax assets and liabilities are measured at tax rates that are expected to apply to the
period when the asset is realized or the liability is settled. Deferred tax assets and liabilities have been measured
using an expected average combined statutory income tax rate of 26.9% based on the tax rates in years when the
temporary differences are expected to reverse.
The reconciliation of the effective income tax rate is as follows:
For the twelve months ended December 31
2017 2016
Combined statutory income tax rate 26.9% 26.9%
Expected income tax expense at statutory rates $ 11,498 $ 4,229 Non-deductible expenses 467 474 Other (121) 19
Income tax expense $ 11,844 $ 4,722

49
14. EARNINGS PER SHARE
The following table sets forth the computation of basic and diluted earnings per share:
Three months ended December 31
Twelve months ended December 31
2017 2016 2017 2016
Numerator for basic and diluted earnings per share:
– net earnings $ 8,047 $ 8,895 $ 30,899 $ 10,999
Denominator for basic earnings per share: – weighted average shares, net of shares held in trust
19,504,107 19,805,485 19,605,884 19,898,004
Denominator for diluted earnings per share:
– weighted average shares, net of shares held in trust
19,504,107 19,805,485 19,605,884 19,898,004
– effect of dilutive share rights 628,756 445,335 598,854 305,767
Denominator for diluted earnings per share 20,132,863 20,250,820 20,204,738 20,203,771
Basic earnings per share $ 0.41 $ 0.45 $ 1.58 $ 0.55
Diluted earnings per share $ 0.40 $ 0.44 $ 1.53 $ 0.54
For the quarter, 5,533 anti-dilutive share rights (2016 – nil) were excluded from the above calculation. For the
year to date, 15,204 anti-dilutive share rights (2016 – nil) were excluded from the above calculation.
15. CHANGES IN NON-CASH OPERATING WORKING CAPITAL
Three months ended December 31
Twelve months ended December 31
2017 2016 2017 2016
Trade and other receivables $ (33,036) $ (18,463) $ (13,071) $ (26,462) Contracts in progress (2,460) (2,654) 2,967 (2,253) Inventories 10,921 8,836 (36,600) 29,506 Deposits on inventory 876 2,491 12,533 2,012 Prepaid expenses 915 1,050 1,063 1,567 Accounts payable and accrued liabilities 24,076 21,482 (756) 25,935 Provisions 978 1,466 204 595
Total $ 2,270 $ 14,208 $ (33,660) $ 30,900
16. OPERATING SEGMENTS
With the completion of the reorganization during the first quarter of 2017, the Corporation’s Chief Executive
Officer, who is also the Chief Operating Decision Maker, regularly assesses the performance of, and makes
resource allocation decisions based on, the Corporation as a whole. As a result, the Corporation has determined
that it comprises a single operating segment and therefore a single reportable segment, which differs from the
three reportable segments which existed prior to the reorganization.