Embed Size (px)
Citation preview

COPYRIGHT MATERIAL
NOT FOR REPRODUCTION
01
1.1 Warehouse audit
Introduction This section provides an audit checklist for a warehouse and its operations. The list of questions is not exhaustive and can be added to by users to mirror their own operations.
Audits should be undertaken by an independent person from within the company or by an outside consultant. The purpose of the audit should be explained to the staff. Results need to be shared with all the staff, and they need to take ownership of any improvements necessary.
The audits are based on what we see as best practice in a warehouse. A full set of audit forms with over 100 questions can be purchased from http://howtologistics.com , discount code: lsct0104; an extract is shown in Table 1.1 .
Warehouse management tools and guides
TABLE 1.1 Warehouse audit checklists – example questions
Carried out by: Location: Date:
Item No Poor Good Excellent N/ A Comments
Comprehensive signage for delivery drivers in multiple languages
Stock adequately protected from theft and pilferage
(Continued)

COPYRIGHT MATERIAL
NOT FOR REPRODUCTION
Warehouse Management Tools and Guides 5
Carried out by: Location: Date:
Item No Poor Good Excellent N/A Comments
Escape routes clearly marked and obstruction free
Is there disabled access into the building?
Racking condition is checked regularly and reported
Are there any overhanging pallets in the racks?
Weight capacity visible on the end of the racks
Are sufficient security measures in place for high-value items?
Are sufficient safety measures in place for hazardous items?
All electrical items tested (UK PAT test)
Staff have correct licence for type of truck operated
Responsible staff trained to operate MHE
Record of safety training kept up to date
TABLE 1.1 Warehouse audit checklists – example questions (Continued)

COPYRIGHT MATERIAL
NOT FOR REPRODUCTION
The Logistics and Supply Chain Toolkit6
Further informationSuggested reading to ensure safe and legal practices:
UK HSE – http://www.hse.gov.uk
UK COMAH – http://www.hse.gov.uk/comah/index.htm
UK SEMA – http://www.sema.org.uk/
USA OSHA – www.osha.gov/
USA EPA – http://www.epa.gov/lawsregs/regulations/
European Safety and Health at Work – https://osha.europa.eu/en/safety-and-health-legislation
Risk – www.ioshroutefinder.co.uk
ReferencesAckerman, K (2003) Auditing Warehouse Performance, Ackerman Publications,
Columbus, OHRichards, G (2014) Warehouse Management, 2nd edn, Kogan Page, LondonUnited Kingdom Warehousing Association – www.ukwa.org.uk
1.2 5S or 5C, also known as Gemba Kanri
Introduction5S, also known as 5C, has its origins in Japan. 5S focuses on organizing the workplace effectively and standardizing work procedures (see Figure 1.1). 5S simplifies processes and reduces waste and non-value-adding activities while improving quality, efficiency and productivity. Safety is sometimes in-cluded as a sixth S.
The tool is also effective in getting employees involved in the improve-ment process and ‘owning’ their area of work, taking pride in how it looks and performs.
When to useWhen a company is looking to improve efficiency within the warehouse and instil a culture of continuous improvement.

COPYRIGHT MATERIAL
NOT FOR REPRODUCTION
Warehouse Management Tools and Guides 7
How to use5S needs to be carried out in the correct order. You need to give individuals responsibility for each task and for their respective work areas within the warehouse:
a The first S (Sort or Seiri or Clear out) concentrates on removing any unnecessary items from the work area. This can include obsolete and damaged stock, over-stocks, defective equipment, broken pallets, waste packaging, etc. It can also refer to unnecessary movement within the warehouse. For example, the introduction of a cross-aisle within the picking area will reduce the amount of travel undertaken by the operators. Items marked for disposal can be put into a holding area until a consensus is reached as to what should be done with them.
b The second S (Straighten or Seiton or Configure) focuses on efficient and effective placement of items, for example location labelling and putting frequently used items in easy-to-access locations. Shadow
SeiriSort or Clear out
SeitonStraighten or
Configure
ShitsukeSustain or
Continually improve
Safety
SeisoShine or Clean
SeiketsuStandardize or
Conform
FIGURE 1.1 The steps of 5S

COPYRIGHT MATERIAL
NOT FOR REPRODUCTION
The Logistics and Supply Chain Toolkit8
boards can be used to ensure items are returned to their correct locations (see Figure 1.2). Directional signs in the warehouse are also part of this, as they should reduce the amount of time taken to find items. Items such as tools, empty pallets and packaging should be placed in easily accessible areas close to the point of need. Finally, parking areas for handling equipment need to be set up, with reminders to staff to put the equipment on charge if required.
FIGURE 1.2 Shadow boards courtesy of Fabufacture
c The third S (Shine or Seiso or Clean) comes after you have cleared the area of any unnecessary items. Thoroughly clean the area and produce a timetable for cleaning. This can be done at the end of each shift, with defects to equipment reported immediately. Staff take pride in a clean work area, they work better and, from experience, clean warehouses tend to be more efficient! Suggestions include

COPYRIGHT MATERIAL
NOT FOR REPRODUCTION
Warehouse Management Tools and Guides 9
putting bins at the front of each aisle to capture waste paper, packaging and broken pallets and making brooms and dust pans easily accessible.
d The fourth S (Standardize or Seiketsu or Conform) is all about creating standards for each work area. Walk through each process with the relevant staff and then produce, document and display best practice procedures within the warehouse. Make them simple to read and understand. A photograph displaying the process with minimal text works well in this situation.
e The fifth S (Sustain or Shitsuke or Continually improve) ensures continuous improvement. Staff are encouraged not to return to previous work practices but to accept change and take things to a new level. Regular checks and audits need to be carried out, with the potential for bonus payments on achieving high performance scores.
More recently, companies have introduced a sixth S, which covers safety. It can be argued that safety is at the heart of the operation and therefore is a valuable addition to the 5S mentality.
An example of how to use the 5S tool is shown in Table 1.2. Companies that have instigated 5S have improved quality, increased efficiency, im-proved safety, reduced waste and given employees a sense of ownership.
TABLE 1.2 5S tool
5S ActionsPerson/Group responsible Measurement Checked by
Sor
t
Audit MHE and remove defective equipment
WM Reduced maintenance costs, increased space
GM
Identify obsolete stock and dispose of it
Inventory manager
Increased available locations, lower stock holding costs
GM
Label locations. Introduce shadow boards
WM/external No. of locations labelled/total no. of locations. All equipment in correct location
Put-away team. Housekeeping team
(Continued)

COPYRIGHT MATERIAL
NOT FOR REPRODUCTION
The Logistics and Supply Chain Toolkit10
5S ActionsPerson/Group responsible Measurement Checked by
Str
aigh
ten
ABC analysis WM Increased pick productivity rates, shorter travel distances
GM
Slotting analysis
WM Increased pick productivity rates, shorter travel distances
GM
Reduce pick travel time
Picking team Increased items picked per hour
WM
Shi
ne
Identify and remove broken pallets
Housekeeping Visual WM
Provide bins at the end of each aisle
WM Visual GM
Sta
ndar
dize
Produce new procedures for each section
Team leaders Visual WM
Set up a communication cell for each team
WM/Team leaders
Visual GM
Sus
tain
Set up regular review meetings between staff and team leaders
WM/Team leaders
No. of improvement suggestions made per month.
No. of improvements introduced
WM
Key
WM = Warehouse Manager
GM = General Manager
MHE = Mechanical or Materials Handling Equipment
TABLE 1.2 5S tool (Continued)

COPYRIGHT MATERIAL
NOT FOR REPRODUCTION
Warehouse Management Tools and Guides 11
TABLE 1.3 6S audit tool
1S – SORT – ACTIVITY DESCRIPTIONS YES NO
1Only the required stock and packaging present in the work area
2Only the required tools and equipment are present in the work area
3Only the required paperwork is present in the work area (signage)
4Unnecessary items have been removed from the general area
2S – STRAIGHTEN ACTIVITY DESCRIPTIONS
5 Locations for all stock are clearly defined and labelled
6Equipment and tools are properly labelled and have a clearly defined storage location
7Paperwork/scanners/voice equipment is properly labelled and has a clearly defined location
8Walkways, access to equipment and work area boundaries are clearly defined and marked
3S – SHINE – ACTIVITY DESCRIPTIONS
9Storage containers, shelving/racking and storage areas are clean and damage free
10Tools and equipment are clean, fully maintained and damage free
11 Work surfaces are clean and damage free
12Walls and partitions are clean, uncluttered and damage free – no excessive signage
13 Cleaning equipment available and neatly stored
4S – STANDARDIZE – ACTIVITY DESCRIPTIONS
14Displayed KPIs are correct, relevant for the department and up to date
15Tools, equipment, paperwork stored neatly and returned immediately after use
16Maintenance records for tools and material handling equipment are easily accessible and up to date
17Waste products (waste oil, rubbish) consistently cleaned up and removed from the work areas
(Continued)
COPYRIGHT MATERIAL
NOT FOR REPRODUCTION
The Logistics and Supply Chain Toolkit12
5S – SUSTAIN – ACTIVITY DESCRIPTIONS YES NO
18Is the 6S audit visible to all, up to date and shared with all staff?
19Recognition is given to teams who get involved in 6S activities
20Time and resources are continually allocated to 6S activities
21Has the team improved items that were not already identified on the previous audit?
6S – SAFETY – ACTIVITY DESCRIPTIONS
22Are employees wearing suitable PPE required for their current work?
23Walkways and access to safety equipment are clearly identified and unobstructed (no hazards or obstacles in the way of fire extinguishers, emergency access doors)
24Is the working environment suitable for the work in hand (lighting, air quality, temperature)?
25Are the equipment and tools provided correctly for the current work activity?
TABLE 1.3 6S audit tool (Continued)
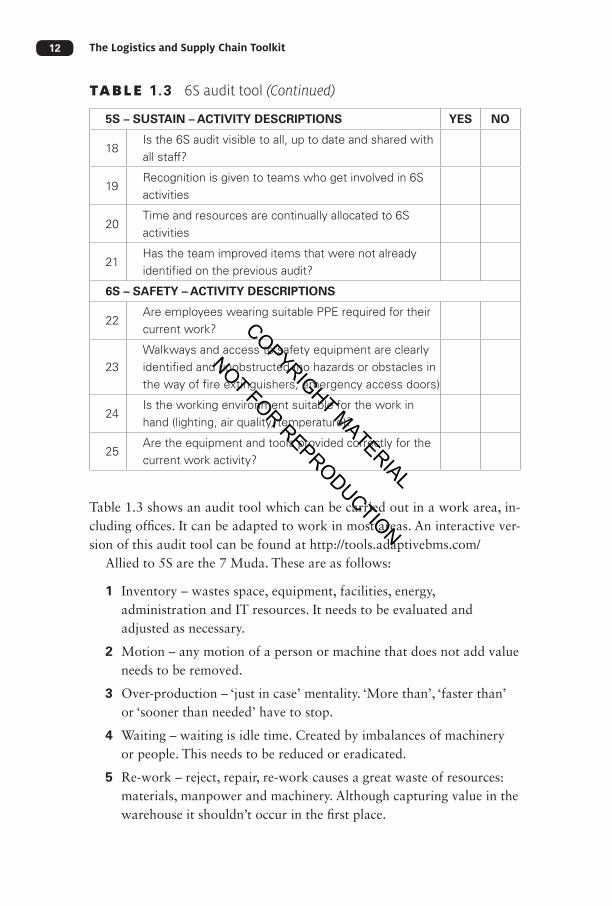
Table 1.3 shows an audit tool which can be carried out in a work area, in-cluding offices. It can be adapted to work in most areas. An interactive ver-sion of this audit tool can be found at http://tools.adaptivebms.com/
Allied to 5S are the 7 Muda. These are as follows:
1 Inventory – wastes space, equipment, facilities, energy, administration and IT resources. It needs to be evaluated and adjusted as necessary.
2 Motion – any motion of a person or machine that does not add value needs to be removed.
3 Over-production – ‘just in case’ mentality. ‘More than’, ‘faster than’ or ‘sooner than needed’ have to stop.
4 Waiting – waiting is idle time. Created by imbalances of machinery or people. This needs to be reduced or eradicated.
5 Re-work – reject, repair, re-work causes a great waste of resources: materials, manpower and machinery. Although capturing value in the warehouse it shouldn’t occur in the first place.

COPYRIGHT MATERIAL
NOT FOR REPRODUCTION
Warehouse Management Tools and Guides 13
6 Processing – non-logical flow in the wrong sequence that adds no value – needs to be regularly evaluated – walk through the process regularly.
7 Conveyance – essential but adds no value. Every time you move something it adds cost. Reduce these movements.
Companies need to carry out an audit to identify areas that can be improved based on the 7 Muda. Discuss the process/procedures and how any changes can benefit the organization.
Further informationThere is an abundance of literature on this topic and websites specifically for Six Sigma and Lean: www.isixsigma.com
Referenceshttp://tools.adaptivebms.com/ [accessed 3 March 2013]Toyota TPS system. www.toyota-forklifts.co.uk
1.3 Pareto analysis, 80/20 rule, ABC analysis or the vital few analysis
IntroductionVilfredo Pareto was an Italian economist who calculated that 80 per cent of the land in Italy was owned by 20 per cent of the population and that 20 per cent of his pea plants produced 80 per cent of the crop. This idea was taken further by Joseph Juran, a US consultant. It is now used by companies to identify and separate best-selling products and profitable customers from slow-moving products and less profitable customers.
The tool is used heavily within the warehouse environment. Examples are as follows:
20 per cent of the stock lines account for 80 per cent of sales;
20 per cent of the stock lines produce 80 per cent of the profit;
20 per cent of stock lines appear most frequently on orders;
20 per cent of the stock keeping units (SKU) account for 80 per cent of the stock value;
20 per cent of suppliers provide 80 per cent of the stock lines;
20 per cent of customers produce 80 per cent of turnover;
COPYRIGHT MATERIAL
NOT FOR REPRODUCTION
The Logistics and Supply Chain Toolkit14
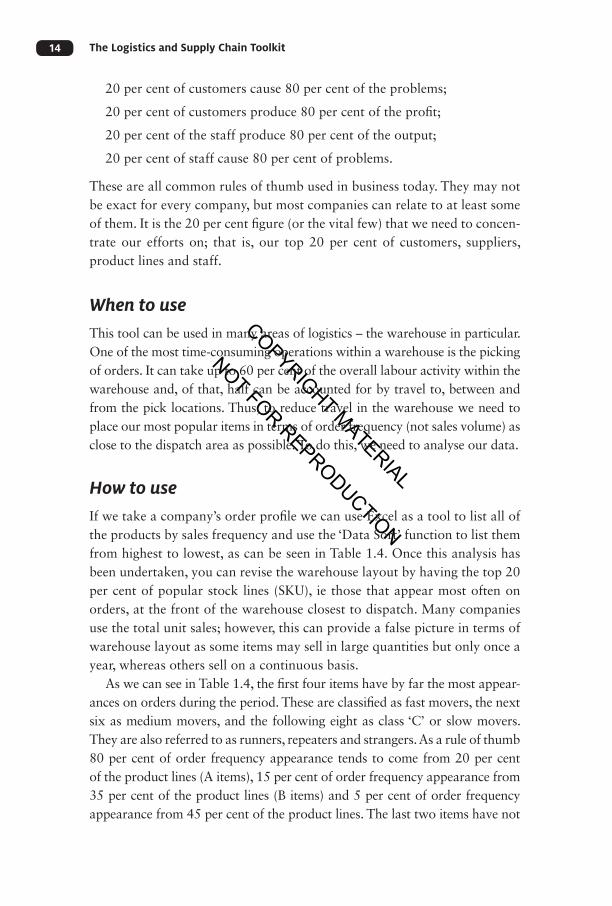
20 per cent of customers cause 80 per cent of the problems;
20 per cent of customers produce 80 per cent of the profit;
20 per cent of the staff produce 80 per cent of the output;
20 per cent of staff cause 80 per cent of problems.
These are all common rules of thumb used in business today. They may not be exact for every company, but most companies can relate to at least some of them. It is the 20 per cent figure (or the vital few) that we need to concen-trate our efforts on; that is, our top 20 per cent of customers, suppliers, product lines and staff.
When to useThis tool can be used in many areas of logistics – the warehouse in particular. One of the most time-consuming operations within a warehouse is the picking of orders. It can take up to 60 per cent of the overall labour activity within the warehouse and, of that, half can be accounted for by travel to, between and from the pick locations. Thus, to reduce travel in the warehouse we need to place our most popular items in terms of order frequency (not sales volume) as close to the dispatch area as possible. To do this, we need to analyse our data.
How to useIf we take a company’s order profile we can use Excel as a tool to list all of the products by sales frequency and use the ‘Data Sort’ function to list them from highest to lowest, as can be seen in Table 1.4. Once this analysis has been undertaken, you can revise the warehouse layout by having the top 20 per cent of popular stock lines (SKU), ie those that appear most often on orders, at the front of the warehouse closest to dispatch. Many companies use the total unit sales; however, this can provide a false picture in terms of warehouse layout as some items may sell in large quantities but only once a year, whereas others sell on a continuous basis.
As we can see in Table 1.4, the first four items have by far the most appear-ances on orders during the period. These are classified as fast movers, the next six as medium movers, and the following eight as class ‘C’ or slow movers. They are also referred to as runners, repeaters and strangers. As a rule of thumb 80 per cent of order frequency appearance tends to come from 20 per cent of the product lines (A items), 15 per cent of order frequency appearance from 35 per cent of the product lines (B items) and 5 per cent of order frequency appearance from 45 per cent of the product lines. The last two items have not

COPYRIGHT MATERIAL
NOT FOR REPRODUCTION
TA
BL
E 1
.4
ABC
ana
lysi
s of
pic
k lis
t fre
quen
cy
Pro
du
ct c
od
e R
anki
ng
(by
o
rder
freq
uen
cy)
Freq
uen
cy
in p
erio
d
Cu
mu
lati
ve
freq
uen
cy
Cu
mu
lati
ve %
of
tota
l fre
qu
ency
C
um
ula
tive
% o
f n
um
ber
of
sto
ck li
nes
C
ateg
ory
123
1 30
0 30
0 30
5
A
235
2 22
5 52
5 52
.5
10
A
127
3 15
0 67
5 67
.5
15
A
134
4 12
5 80
0 80
20
A
167
5 40
84
0 84
25
B
222
6 30
87
0 87
30
B
361
7 25
89
5 89
.5
35
B
363
8 25
92
0 92
40
B
221
9 17
93
7 93
.7
45
B
344
10
15
952
95.2
50
B
345
11
10
962
96.2
55
C
166
12
8 97
0 97
60
C
177
13
6 97
6 97
.6
65
C
189
14
6 98
2 98
.2
70
C
190
15
6 98
8 98
.8
75
C
111
16
4 99
2 99
.2
80
C
1035
17
4
996
99.6
85
C
1037
18
4
1,00
0 10
0 90
C
126
19
0 1,
000
100
95
X
135
20
0 1,
000
100
100
X
Tota
l 1,
000
COPYRIGHT MATERIAL
NOT FOR REPRODUCTION
The Logistics and Supply Chain Toolkit16
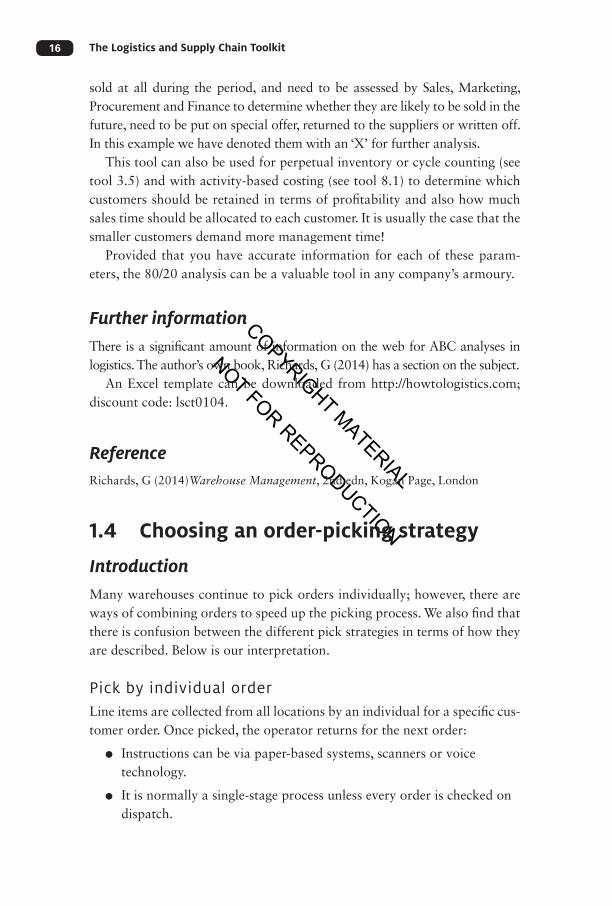
sold at all during the period, and need to be assessed by Sales, Marketing, Procurement and Finance to determine whether they are likely to be sold in the future, need to be put on special offer, returned to the suppliers or written off. In this example we have denoted them with an ‘X’ for further analysis.
This tool can also be used for perpetual inventory or cycle counting (see tool 3.5) and with activity-based costing (see tool 8.1) to determine which customers should be retained in terms of profitability and also how much sales time should be allocated to each customer. It is usually the case that the smaller customers demand more management time!
Provided that you have accurate information for each of these param-eters, the 80/20 analysis can be a valuable tool in any company’s armoury.
Further informationThere is a significant amount of information on the web for ABC analyses in logistics. The author’s own book, Richards, G (2014) has a section on the subject.
An Excel template can be downloaded from http://howtologistics.com; discount code: lsct0104.
ReferenceRichards, G (2014)Warehouse Management, 2nd edn, Kogan Page, London
1.4 Choosing an order-picking strategy
IntroductionMany warehouses continue to pick orders individually; however, there are ways of combining orders to speed up the picking process. We also find that there is confusion between the different pick strategies in terms of how they are described. Below is our interpretation.
Pick by individual orderLine items are collected from all locations by an individual for a specific cus-tomer order. Once picked, the operator returns for the next order:
●● Instructions can be via paper-based systems, scanners or voice technology.
●● It is normally a single-stage process unless every order is checked on dispatch.

COPYRIGHT MATERIAL
NOT FOR REPRODUCTION
Warehouse Management Tools and Guides 17
●● Handling equipment can range from a trolley to a forklift truck.
●● Prone to error if using paper-based system.
●● Time-consuming.
●● Training can be time-consuming for scanning and paper pick.
Cluster pickingOperators take several individual orders out into the warehouse at the same time:
●● Operation is as per individual order pick otherwise.
●● Order sizes are lower than for individual order picks.
●● Orders are clustered in a particular area.
●● Normally a single-stage process unless every order is packed and checked on dispatch.
●● Handling equipment can range from a trolley to a forklift truck but requires segregated sections.
●● Reliant on operator being accurate in sorting.
●● System assistance required to ensure orders are clustered efficiently.
●● Training can be very time-consuming.
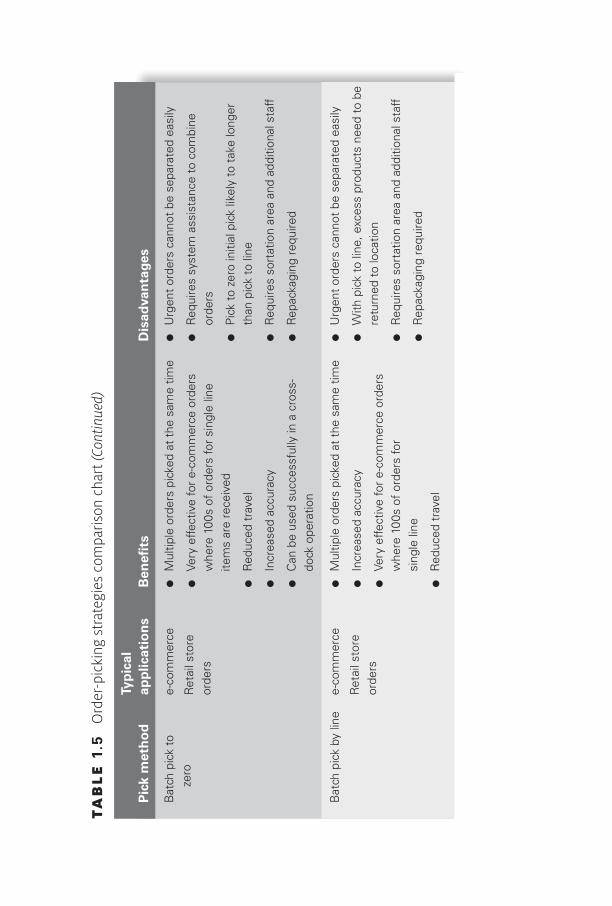
Pick by batchLarge quantities of items are collected for a large number of orders that have the same product lines. All orders are consolidated onto one pick request:
●● Typical use in e-commerce applications.
●● One to five lines per order maximum.
●● Can pick exact amount from reserve storage and allocate to zero or pick full cartons/pallets and return remainder to stock (pick by line) once allocation is completed.
●● Handling equipment is mainly reach or forklift trucks for pallet quantities.
●● Two-stage process – pick then sort and label. Possible return of unused stock.
●● Requires additional space to sort and label.
●● Reliant on system to consolidate orders.
COPYRIGHT MATERIAL
NOT FOR REPRODUCTION
The Logistics and Supply Chain Toolkit18
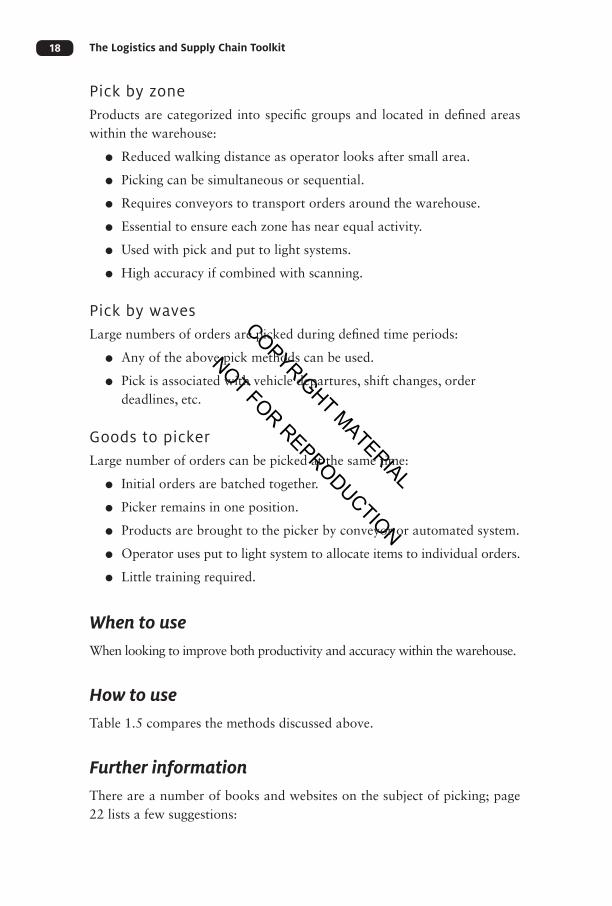
Pick by zoneProducts are categorized into specific groups and located in defined areas within the warehouse:
●● Reduced walking distance as operator looks after small area.
●● Picking can be simultaneous or sequential.
●● Requires conveyors to transport orders around the warehouse.
●● Essential to ensure each zone has near equal activity.
●● Used with pick and put to light systems.
●● High accuracy if combined with scanning.
Pick by wavesLarge numbers of orders are picked during defined time periods:
●● Any of the above pick methods can be used.
●● Pick is associated with vehicle departures, shift changes, order deadlines, etc.
Goods to pickerLarge number of orders can be picked at the same time:
●● Initial orders are batched together.
●● Picker remains in one position.
●● Products are brought to the picker by conveyor or automated system.
●● Operator uses put to light system to allocate items to individual orders.
●● Little training required.
When to useWhen looking to improve both productivity and accuracy within the warehouse.
How to useTable 1.5 compares the methods discussed above.
Further informationThere are a number of books and websites on the subject of picking; page 22 lists a few suggestions:

COPYRIGHT MATERIAL
NOT FOR REPRODUCTION
TA
BL
E 1
.5
Ord
er-p
icki
ng s
trat
egie
s co
mpa
rison
cha
rt
Pic
k m
eth
od
Ty
pic
al
app
licat
ion
s B
enefi
ts
Dis
adva
nta
ges
Pic
k by
indi
vidu
al
orde
r M
ost
oper
atio
ns
●●
Sin
gle-
stag
e op
erat
ion
●●
Flex
ible
●●
Qui
ck im
plem
enta
tion
●●
Abi
lity
to is
olat
e ur
gent
ord
ers
●●
Pic
ker
able
to
deci
de p
ick
path
if u
sing
pa
per
pick
sys
tem
●●
Util
ize
man
ual o
r te
chno
logy
sys
tem
s
●●
Low
pic
k ra
te
●●
Very
labo
ur in
tens
ive
●●
Can
resu
lt in
bot
tlene
cks
at th
e pi
ck fa
ce
●●
Trai
ning
can
tak
e so
me
time
depe
ndin
g on
th
e to
ols
used
Clu
ster
pic
king
M
ost
oper
atio
ns
with
low
cub
e ite
ms
●●
Mul
tiple
ord
ers
pick
ed a
t th
e sa
me
time
●●
Red
uce
trav
el in
the
war
ehou
se if
or
ders
clu
ster
ed in
a p
artic
ular
are
a
●●
Red
uce
over
all p
ick
time
●●
Trai
ning
can
tak
e so
me
time
●●
Acc
urac
y ca
n be
an
issu
e if
no t
echn
olog
y is
us
ed
●●
Urg
ent
orde
rs c
anno
t be
sep
arat
ed e
asily
●●
Req
uire
s eq
uipm
ent t
o ho
ld m
ultip
le o
rder
s
●●
Req
uire
s lo
w c
ube
item
s in
the
mai
n
●●
Req
uire
s sy
stem
ass
ista
nce
to c
ombi
ne
orde
rs
●●
Can
res
ult
in b
ottle
neck
s
●●
May
req
uire
sec
ond
stag
e to
pac
k or
ders
(Continued)
COPYRIGHT MATERIAL
NOT FOR REPRODUCTION
Bat
ch p
ick
to
zero
e-
com
mer
ce
Ret
ail s
tore
or
ders
●●
Mul
tiple
ord
ers
pick
ed a
t th
e sa
me
time
●●
Very
effe
ctiv
e fo
r e-
com
mer
ce o
rder
s w
here
100
s of
ord
ers
for
sing
le li
ne
item
s ar
e re
ceiv
ed
●●
Red
uced
tra
vel
●●
Incr
ease
d ac
cura
cy
●●
Can
be
used
suc
cess
fully
in a
cro
ss-
dock
ope
ratio
n
●●
Urg
ent
orde
rs c
anno
t be
sep
arat
ed e
asily
●●
Req
uire
s sy
stem
ass
ista
nce
to c
ombi
ne
orde
rs
●●
Pic
k to
zer
o in
itial
pic
k lik
ely
to t
ake
long
er
than
pic
k to
line
●●
Req
uire
s so
rtat
ion
area
and
add
ition
al s
taff
●●
Rep
acka
ging
req
uire
d
Bat
ch p
ick
by li
ne
e-co
mm
erce
Ret
ail s
tore
or
ders
●●
Mul
tiple
ord
ers
pick
ed a
t th
e sa
me
time
●●
Incr
ease
d ac
cura
cy
●●
Very
effe
ctiv
e fo
r e-
com
mer
ce o
rder
s w
here
100
s of
ord
ers
for
sing
le li
ne
●●
Red
uced
tra
vel
●●
Urg
ent
orde
rs c
anno
t be
sep
arat
ed e
asily
●●
With
pic
k to
line
, exc
ess
prod
ucts
nee
d to
be
retu
rned
to
loca
tion
●●
Req
uire
s so
rtat
ion
area
and
add
ition
al s
taff
●●
Rep
acka
ging
req
uire
d
Pic
k m
eth
od
Typ
ical
ap
plic
atio
ns
Ben
efi t
sD
isad
van
tage
s
TA
BL
E 1
.5
Ord
er-p
icki
ng s
trat
egie
s co
mpa
rison
cha
rt (Contin
ued)

COPYRIGHT MATERIAL
NOT FOR REPRODUCTION
Zone
pic
k S
ituat
ions
whe
re
ther
e ar
e la
rge
num
bers
of
SK
Us
and
low
nu
mbe
r of
item
s pe
r or
der
line
●●
Less
tra
vel f
or o
pera
tor
●●
Ord
ers
can
be p
icke
d si
mul
tane
ousl
y or
se
quen
tially
●●
Can
acc
omm
odat
e di
ffere
nt fa
mili
es o
f ite
ms
on o
rder
s su
ch a
s ha
zard
ous,
te
mpe
ratu
re c
ontr
olle
d, a
mbi
ent
etc
●●
Less
tra
inin
g if
pick
to
light
use
d
●●
Nor
mal
ly r
equi
res
conv
eyor
s
●●
Cos
t of
equ
ipm
ent
●●
Nor
mal
ly c
ombi
ned
with
pic
k/pu
t to
ligh
t sy
stem
s
●●
Can
lead
to
idle
tim
e if
wor
k is
not
bal
ance
d be
twee
n zo
nes
Wav
e pi
ck
Whe
n or
ders
are
re
leas
ed o
n a
timed
bas
is o
r to
m
eet
depa
rtin
g tr
ucks
●●
Abi
lity
to s
ched
ule
wor
k ef
fi cie
ntly
●●
Ord
ers
are
pick
ed in
tim
e fo
r a
prod
uctio
n ru
n or
veh
icle
dep
artu
re
●●
Urg
ent
orde
rs c
anno
t be
sep
arat
ed e
asily
●●
Req
uire
s a
WM
S t
o m
anag
e th
e al
loca
tion
Goo
ds t
o pi
cker
H
igh
inte
nsity
pi
ck o
pera
tions
●
● H
igh
pick
rat
es
●●
Hig
h ac
cura
cy
●●
Equ
ipm
ent
mov
es, o
pera
tors
sta
y in
the
sa
me
plac
e
●●
Red
uced
spa
ce r
equi
rem
ent
●●
Prod
uct
secu
rity
●●
Erg
onom
ic w
orks
tatio
ns
●●
Trai
ning
is le
ss in
tens
ive
●●
Hig
h eq
uipm
ent
cost
s
●●
Hig
h en
ergy
cos
ts
●●
Pote
ntia
l sys
tem
failu
re
●●
Hig
h op
port
unity
cos
t
●●
Sta
ndar
dize
d un
it lo
ads
requ
ired
●●
Lim
ited
to s
mal
ler
item
s in
the
mai
n
TA
BL
E 1
.5
Ord
er-p
icki
ng s
trat
egie
s co
mpa
rison
cha
rt (Contin
ued)

COPYRIGHT MATERIAL
NOT FOR REPRODUCTION
The Logistics and Supply Chain Toolkit22
Ackerman, K (2000) Warehousing Profitably, Ackerman Publications, Columbus, OHFrazelle, EH (2002) World Class Warehousing and Materials Handling, McGraw-
Hill, New YorkRichards, G (2014) Warehouse Management, 2nd edn, Kogan Page, LondonVan den Berg, J P (2012) Highly Competitive Warehouse Management,
Management Outlook Publishing, Utrecht, Netherlands
1.5 Choosing pick technology
IntroductionThe picking function in a warehouse can be up to 55 per cent of the oper-ating cost, with travel to, between and from locations being up to 50 per cent of that labour involvement. It is therefore crucial to choose the most appropriate method of picking.
Many warehouses continue to use system-created paper pick lists to pick orders within the warehouse. There are a number of alternatives, the majority requiring some form of technology. Table 1.6 shows the advantages and dis-advantages of each method. One thing to point out here is that many ware-houses will use a combination of pick methods, depending on requirements such as velocity of movement, lead times and accuracy requirements.
When to useWhen looking to improve both productivity and accuracy within the warehouse.
How to useTable 1.6 compares the different picking systems. A new picking method called ‘vision pick’ utilizing technology similar to Google glasses has been introduced by a number of companies recently. This is currently in its early stages and therefore not included, but as more companies use the system we will look to update the table.
Further informationThere is some excellent content at http://www.inventoryops.com/order_picking.htm

COPYRIGHT MATERIAL
NOT FOR REPRODUCTION
Warehouse Management Tools and Guides 23
TABLE 1.6 Pick technology comparison chart
Applications and pick rate Benefi ts Drawbacks
Paper picking ●● Most operations
●● Where there is very little systems support
●● Low cost areas
●● <100 lines per hour
●● Low cost
●● Single-stage picking operation although two-stage update operation (key information into system)
●● Flexible
●● Quick implementation
●● Ability to isolate urgent orders
●● Picker able to decide pick path
●● Low maintenance
●● Suitable as part of a contingency plan
●● Low pick rate
●● Not hands free
●● Low accuracy
●● Duplicated tasks
●● Not real time
●● Training can take some time
●● Requires manual update of system from written instructions
●● Requires return to desk for further instructions
Pick by label ●● Most operations
●● Where there is very little systems support
●● Low cost areas
●● <100 lines per hour
●● Low cost
●● Reasonably accurate
●● Single-stage picking operation although two-stage update operation
●● Flexible
●● Quick implementation
●● Low maintenance
●● Low pick rate
●● Not hands free
●● Duplicated tasks
●● Need to print labels
●● Not real time
●● Training can take some time
●● Label information may be diffi cult to read
●● Can damage product if errors made
●● Requires return to desk for further instructions
(Continued)

COPYRIGHT MATERIAL
NOT FOR REPRODUCTION
The Logistics and Supply Chain Toolkit24
Applications and pick rate Benefi ts Drawbacks
Barcode scanning with gun
●● Most operations
●● <100 lines per hour
●● Improved accuracy*
●● Paperless
●● Flexible
●● Real-time stock update**
●● Ability to deal with multi-SKU locations
●● Low/medium pick rate
●● Not hands free
●● Can take longer than paper picking
●● Cost of hardware
●● Requires barcode on every product
●● Issues with international bar code standards
●● Requires system interface
●● Requires maintenance
●● Real time system requires wireless receivers throughout warehouse
Wearable scanners
●● Most operations
●● <150 lines per hour
●● Paperless
●● Flexible
●● Improved accuracy
●● Improved productivity
●● Hands free
●● Less strain on operators
●● Damage reduction
●● Real-time stock update
●● Ability to deal with multi-SKU locations
●● Cost of hardware
●● Requires bar code on product
●● Issues with international bar code standards
●● Requires system interface
●● Requires maintenance
TABLE 1.6 Pick technology comparison chart (Continued)
(Continued)

COPYRIGHT MATERIAL
NOT FOR REPRODUCTION
Warehouse Management Tools and Guides 25
Applications and pick rate Benefi ts Drawbacks
Voice picking ●● Most operations
●● Ideal for temperature-controlled areas
●● Heavy, awkward items
●● 100–250 lines per hour
●● Paperless
●● Flexible
●● Fewer processes
●● Improved accuracy*
●● Improved productivity
●● Quick training
●● Hands free/eyes free
●● Improved safety
●● Less strain on operators
●● Damage reduction
●● Real-time stock update
●● Cost of hardware
●● Diffi cult in very noisy environments
●● Requires system interface
●● Requires maintenance
●● Problem with multi-SKU location
●● Serial number capture is an issue
●● Accuracy issue if product in incorrect location
●● Unsure of long-term health issues
Voice picking plus fi nger scanning
●● Most operations
●● Ideal for temperature-controlled areas
●● 125–250 lines per hour
●● Paperless
●● High accuracy
●● Good productivity
●● Hands free
●● Less strain on operators
●● Damage reduction
●● Real-time stock update
●● Ability to deal with multi-SKU location
●● Cost of hardware and software
●● Requires bar code
●● Requires system interface
●● Issues with international bar code standards
●● Unsure of long-term health issues
TABLE 1.6 Pick technology comparison chart (Continued)
(Continued)

COPYRIGHT MATERIAL
NOT FOR REPRODUCTION
The Logistics and Supply Chain Toolkit26
Applications and pick rate Benefi ts Drawbacks
Pick to light ●● High no. SKUs high frequency sales per individual item
●● Mail order/e-commerce
●● (approx. 250–450 lines per hour)
●● High accuracy*
●● High productivity
●● High pick rate
●● Easy to train staff
●● Staff can choose pick sequence
●● Real-time stock update
●● Hands free
●● Improved safety
●● Damage reduction
●● Simultaneous or sequential picking
●● Can be used for goods-to-person and person-to-goods picking (zone)
●● Cost of hardware
●● Requires system interface
●● System failure
●● Cost of maintenance
●● Low fl exibility
●● Long implementation time
●● Limited in terms of product types
●● Problem with multi-SKU locations
●● Diffi culty with batched or clustered orders
Put to light ●● Retail store operations
●● High accuracy
●● High productivity
●● Damage reduction
●● High pick rate
●● Easy to train
●● Real-time stock update
●● Can be used for goods-to-person picking
●● Cost of hardware
●● System failure
●● Limited in terms of product types
●● Cost of maintenance
●● Two-stage operation
TABLE 1.6 Pick technology comparison chart (Continued)
(Continued)

COPYRIGHT MATERIAL
NOT FOR REPRODUCTION
Warehouse Management Tools and Guides 27
Applications and pick rate Benefi ts Drawbacks
RFID ●● High-value goods
●● Items requiring accurate traceability
●● 200–300 lines per hour
●● Very high accuracy
●● High productivity
●● Real-time stock update
●● Cost of hardware
●● Cost of tags
●● Read distances very short
●● Requires international standards
●● Issues with certain types of products – metal and liquids
●● Requires system interface
●● Cost of maintenance
* High accuracy is dependent on accurate put-away. Can be supplemented by reading out last four digits of barcode for voice picking.
** Scanning can be real time or information can be downloaded once the tasks are completed.
TABLE 1.6 Pick technology comparison chart (Continued)
1.6 Cross-docking
Introduction Cross-docking is a technique utilized in distribution centres and warehouses to speed up the throughput of products. It eliminates the need to store product by consolidating items during the inbound process and taking them directly to the shipping or despatch area.
Items are likely to remain on site for a maximum of 24 hours, with most leaving in a much shorter time. These can be despatched separately or can be consolidated with product picked from stock. The costs of holding and handling inventory are signifi cantly reduced. Walmart puts some of its suc-cess down to cross-docking as much as 85 per cent of its products through working closely with its suppliers and having sophisticated IT systems.

COPYRIGHT MATERIAL
NOT FOR REPRODUCTION
The Logistics and Supply Chain Toolkit28
When to useThe pressure on companies to reduce order lead times requires products to move through the supply chain much faster. Cross-docking enables this to happen.
A variant of this is a sequencing centre where parts destined for a produc-tion line are consolidated and sorted so that they arrive at the production line only when they are required.
How to useTo operate an efficient cross-dock requires a good information technology system. Advanced shipping notifications (ASNs) are essential and goods need to be identified easily at the inbound stage to enable staff to move them directly to the dispatch or shipping area as opposed to the storage area. To enable this, barcodes have to be aligned across suppliers and customers.
Suppliers can be requested to label the items with information that en-ables the goods-in team to identify the items quickly. Alternatively, the in-bound team are alerted to the fact that a transfer of goods is required by an instruction on the paperwork, a voice message or a message on the barcode scanner. If the company is using scan technology, a message appears on screen as soon as the goods for cross-docking have been identified. Instructions as to where to move the product should also be given at this time.
Ideally a vehicle is already waiting on the loading dock for the items in question. This requires excellent coordination and planning. Alternatively, the pallets or cartons are placed in a section of the dispatch area that is marked out for outbound loads. If space is at a premium in the dispatch area, drive-in racking can be used to hold the products until the outbound vehicle arrives; see Figure 1.3.
The coordination of inbound and outbound movements is key to the system working effectively. An example of this is the hub operation for a parcel or pallet distribution operation where items arrive in time to meet a departing vehicle returning to its geographic area. A vehicle cannot de-part until the last vehicle carrying goods destined for its area has arrived.
Finally, warehouse design plays its part in terms of where the inbound and outbound doors are located. If they are situated next to each other as in Figure 1.3, there is a need to ensure that congestion is not an issue. Alternatively, doors can be situated at opposite sides of the building, with

COPYRIGHT MATERIAL
NOT FOR REPRODUCTION
Warehouse Management Tools and Guides 29
InboundOutboundA
C
Grid
C
AA
A AB B AA C C
Drive-in rack
A
C B
B B
B B
B
BC C
C C
B CB
A A A
FIGURE 1.3 Example of cross-dock operation
forklift trucks travelling the length of the building to load out the vehicles – less congestion but increased travel distances.
Further informationFurther information can be found at http://www.werc.org/store/item.aspx?ItemId=27
1.7 Slotting or item profiling
IntroductionInventory slotting or profiling is the process of identifying the most efficient placement for each stock item in a warehouse or distribution centre, taking into account item popularity, characteristics and safety aspects. Strategically placing the item in the optimum location allows workers to pick items effi-ciently, quickly and accurately, and reduces the risk of injuries.
When to useTo enable you to improve the efficiency of your picking operation within the warehouse.
COPYRIGHT MATERIAL
NOT FOR REPRODUCTION
The Logistics and Supply Chain Toolkit30
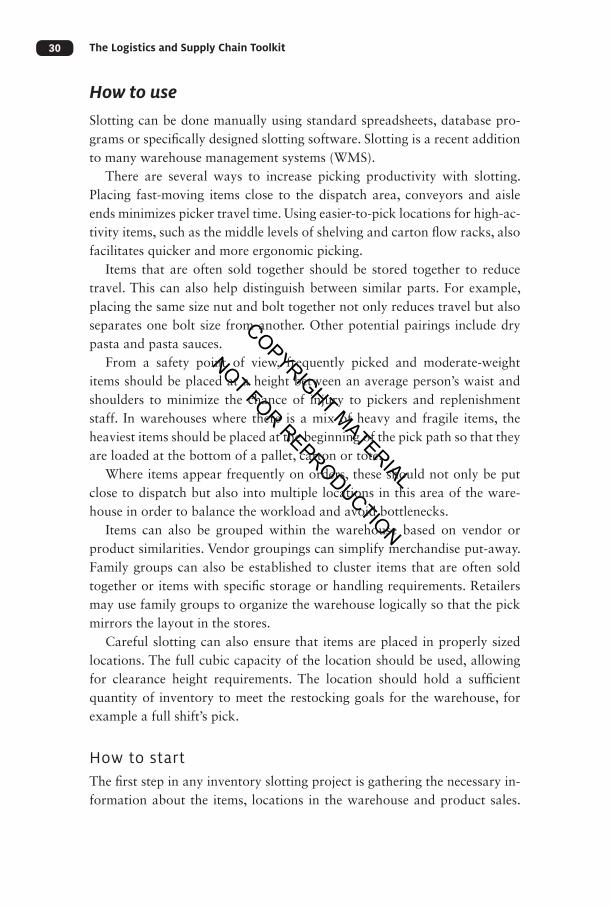
How to useSlotting can be done manually using standard spreadsheets, database pro-grams or specifically designed slotting software. Slotting is a recent addition to many warehouse management systems (WMS).
There are several ways to increase picking productivity with slotting. Placing fast-moving items close to the dispatch area, conveyors and aisle ends minimizes picker travel time. Using easier-to-pick locations for high-ac-tivity items, such as the middle levels of shelving and carton flow racks, also facilitates quicker and more ergonomic picking.
Items that are often sold together should be stored together to reduce travel. This can also help distinguish between similar parts. For example, placing the same size nut and bolt together not only reduces travel but also separates one bolt size from another. Other potential pairings include dry pasta and pasta sauces.
From a safety point of view, frequently picked and moderate-weight items should be placed at a height between an average person’s waist and shoulders to minimize the chance of injury to pickers and replenishment staff. In warehouses where there is a mix of heavy and fragile items, the heaviest items should be placed at the beginning of the pick path so that they are loaded at the bottom of a pallet, carton or tote.
Where items appear frequently on orders, these should not only be put close to dispatch but also into multiple locations in this area of the ware-house in order to balance the workload and avoid bottlenecks.
Items can also be grouped within the warehouse based on vendor or product similarities. Vendor groupings can simplify merchandise put-away. Family groups can also be established to cluster items that are often sold together or items with specific storage or handling requirements. Retailers may use family groups to organize the warehouse logically so that the pick mirrors the layout in the stores.
Careful slotting can also ensure that items are placed in properly sized locations. The full cubic capacity of the location should be used, allowing for clearance height requirements. The location should hold a sufficient quantity of inventory to meet the restocking goals for the warehouse, for example a full shift’s pick.
How to startThe first step in any inventory slotting project is gathering the necessary in-formation about the items, locations in the warehouse and product sales.

COPYRIGHT MATERIAL
NOT FOR REPRODUCTION
Warehouse Management Tools and Guides 31
Data may already be stored in the WMS or ERP (enterprise resource plan-ning) system. Otherwise items and cases need to be physically measured. The following information is typically needed for each SKU:
●● item length, width, height and weight;
●● case quantity and dimensions (length, width, height and weight) for items stored by the case;
●● pallet quantity (or cases/tier and tiers/pallet – TiHi) for items stored by the pallet;
●● vendor if items are to be stored in vendor groupings;
●● family group if items are to be stored by product groupings;
●● special storage conditions, if applicable (flammable, refrigeration, high value, etc);
●● maximum stacking height or crushability factor, if applicable;
●● items that often appear together on an order;
●● items that are very similar resulting in miss-picks or that can cause a chemical reaction should not be stored next to each other.
Each pick location in the warehouse needs to be defined. Information typically required for each slot is:
●● location number;
●● usable size (length, width, height);
●● weight capacity;
●● proximity to material handling equipment (MHE) and shipping;
●● position within the pick path;
●● types of items eligible to be stored here (hazard code, vendor or family group, batch code).
Item movement can be captured in terms of the number of times each item was sold (hits), the quantity sold, sales forecast (stocking level) and the on-hand quantity. Hits and quantity sold are most typically used because high-hit items should be placed in the most efficient locations and the optimal size location can be established using the quantity sold and the dimensions.
If items change frequently and do not have any historical movement figures, sales forecasts may be used instead of history. On-hand quantity data are important for warehouses that choose to size locations in slow pick areas to a typical on-hand inventory level, rather than a sales level.

COPYRIGHT MATERIAL
NOT FOR REPRODUCTION
The Logistics and Supply Chain Toolkit32
Slotting rulesOnce the necessary data have been collected, slotting rules must be estab-lished by setting up constraints (rules that cannot be broken) and objectives (goals). Constraints include weight limits, hazardous material areas and vendor/family group areas. Objectives define factors such as the desired stock level, where faster-moving items are placed and how activity will be balanced. Examples of some typical rules include:
●● Put the fast-moving items close to the shipping dock and on the lower pallet rack levels. Store slower-moving items on higher levels and further away from the dock.
●● In the case pick area, locate taller cases and heavier cases at the beginning of the pick path. Put faster-moving cases on floor/lower levels.
●● If using carousels, balance the activity among carousels in pod. Spread faster-moving items among the carousels and put them on the centre shelves.
●● Place fast-moving items into carton flow racks, with the very fastest on the centre levels. Balance the workload among the flow rack units.
●● Put slower-moving items into shelving, with the faster-moving ones placed closer to the take-away conveyor or end of aisle. Locate heavier items on the centre levels.
Proper slotting takes time to establish, and regular maintenance is required to keep items positioned efficiently; however, slotting software can ease the burden of keeping items in proper locations. Slotting items properly increases picking productivity and makes order selection easier, safer and more accurate.
Trial re-slotting runs should be made to test the rules and refine them so that they will yield the desired results. You can opt to make the profile changes gradually during normal operations, rather than interrupting fulfilment activities to move hundreds of items. You can review item placement on a weekly basis and move items each night to relocate the most badly placed SKUs. Although it will take several months to achieve the optimal profile, picking productivity will increase with each set of moves.(Reproduced by kind permission of Sedlak Management Consultants, http://www.jasedlak.com)
Further informationDetails on specific slotting software can be found at http://www.slot3d.com, http://www.insight-holdings.com/dc-expert-40

COPYRIGHT MATERIAL
NOT FOR REPRODUCTION
Warehouse Management Tools and Guides 33
1.8 Resource planning
IntroductionLabour is a significant cost within a warehouse operation. Warehouse man-agers are constantly charged with optimizing the number of staff employed and reducing overall headcount by increasing productivity. Planning work is therefore crucial to the running of a cost-effective warehouse.
Labour management enables warehouse managers to compare produc-tivities between staff and engineered standards, and as a result identify op-portunities for further training or possible redeployment. The system can also be used to introduce incentive schemes and be part of an appraisal system.
There are a number of labour management systems (LMSs) available on the market, some of which are listed at the end of this tool. Some WMSs also have a labour management module. However, it is possible to plan the resources required within a warehouse manually through the use of spreadsheets.
When to useIt is our contention that all warehouses should operate with some form of resource plan to ensure that the correct number of staff are deployed each day and therefore it should be part of daily operations. Resource planning enables the warehouse manager to reasonably calculate the number of staff required each day for each section of the warehouse and, when busy, to cal-culate how many additional staff may be required.
How to useTable 1.7 details a number of warehouse tasks together with the volume of activity, productivity standards and the expected time to undertake these tasks. Forms such as this can be completed each day based on the activities planned for the coming days and weeks. It requires advanced information in terms of receipts and orders, whether forecast or actual. It also requires staff to undertake time-and-motion studies to calculate the time required to undertake each activity.
The data can be updated with actual figures once the task has been completed: this provides a more accurate picture for future similar work. Table 1.7 details an in-handling operation over the course of one day. Each

COPYRIGHT MATERIAL
NOT FOR REPRODUCTION
The Logistics and Supply Chain Toolkit34
activity is listed together with the expected volume and this, together with the engineered standards previously estimated, enables the warehouse manager to calculate the number of staff required and the equipment needed. By completing this form, the warehouse manager is able to calcu-late the number of people and equipment required for that particular day’s operation.
Utilizing an electronic LMS enables you to evaluate the productivity of individuals as well as the team as a whole. It measures the performance of each individual for completed tasks against existing labour standards to de-termine how the time spent performing each task compares with the ex-pected task completion time. The system, if interfacing with voice or radio frequency, can more accurately measure the task in hand, taking into ac-count idle time, delays and bottlenecks. The system is able to assign the op-erator an overall score. This enables the warehouse manager to compare performance against engineered standards and the operator’s peers. The system is a great deal more sophisticated than a spreadsheet and will pro-duce the data much faster. A number of steps are required to set up the system; see (Figure 1.4).
The more sophisticated LMSs can also create a list of tasks for an operator and coordinate tasks. As Obal (2011) says: ‘When you start interleaving and measuring people, you are driving out a lot of ineffi-ciencies. You’re maximizing your labour that is already there in the warehouse.’
Although many WMSs have LMS as an option or even inbuilt, there are a large number of standalone systems that can be interfaced with both ware-house and transport management systems. A list of suppliers of LMS can be found at the website below.
Further informationhttp://www.capterra.com/workforce-management-software?gclid=CMaxj8 DF57UCFXDKtAodqxsAYA
ReferenceObal, P (2011) cited in 2011Market Trends Report: Warehouse Management
Programs, http://www.warehousemanagementsystemsguide.com/blog/2011-market-trends-report-warehouse-management-systems-1020911/#ixzz2Kzs7qs30

COPYRIGHT MATERIAL
NOT FOR REPRODUCTION
TA
BL
E 1
.7
In-h
andl
ing
reso
urce
pla
n
Act
ivit
y D
escr
ipti
on
Dai
ly v
olu
me
(ave
rage
)P
rod
uct
ivit
y st
and
ard
(u
nit
s p
er h
ou
r)H
ou
rs
req
uir
edM
HE
Ty
pe
1M
HE
Ty
pe
2M
HE
Ty
pe
3
Oth
er e
qu
ipm
ent
eg r
adio
freq
uen
cy
scan
ner
Inb
ou
nd
op
erat
ion
Act
ivit
y (u
nit
s)U
nit
of
mea
sure
Un
load
ing
Unl
oad
palle
tized
tra
iler
260
Palle
ts52
5P
PT
RFS
Unl
oad
loos
e lo
aded
co
ntai
ners
& p
alle
tize
5000
Cas
es20
025
RFS
Str
etch
-wra
p pa
llets
100
Palle
ts40
2.5
Pu
t-aw
ay
Col
lect
pal
lets
, put
aw
ay in
wid
e ai
sle
rack
ing
210
Palle
ts20
10.5
FLT
RFS
Col
lect
pal
lets
, put
aw
ay in
driv
e-in
rac
king
124
Palle
ts16
7.75
FLT
RFS
Col
lect
pal
lets
, put
aw
ay in
pic
k lo
catio
ns26
Palle
ts5
5.2
PP
TR
FS (Continued)

COPYRIGHT MATERIAL
NOT FOR REPRODUCTION
Act
ivit
y D
escr
ipti
on
Dai
ly v
olu
me
(ave
rage
)P
rod
uct
ivit
y st
and
ard
(u
nit
s p
er h
ou
r)H
ou
rs
req
uir
edM
HE
Ty
pe
1M
HE
Ty
pe
2M
HE
Ty
pe
3
Oth
er e
qu
ipm
ent
eg r
adio
freq
uen
cy
scan
ner
Inb
ou
nd
op
erat
ion
Act
ivit
y (u
nit
s)U
nit
of
mea
sure
Su
b-t
ota
l55
.95
Anc
illar
y w
ork
(col
lect
pa
perw
ork,
equ
ipm
ent
etc.
(15%
)
8.39
Tota
l Ho
urs
req
uir
ed64
.34
10.2
018
.25
Ava
ilabl
e pr
oduc
tive
hour
s pe
r pe
rson
/tru
ck
per
day
7.2
88
App
rox.
num
ber
of
staf
f re
quire
d8.
94
App
rox.
num
ber
of
equi
pmen
t re
quire
d1.
282.
28
TA
BL
E 1
.7
In-h
andl
ing
reso
urce
pla
n (Contin
ued)

COPYRIGHT MATERIAL
NOT FOR REPRODUCTION
Warehouse Management Tools and Guides 37
1.9 Task interleaving
IntroductionMinimal movement within a warehouse is key to efficiency and productivity. There are a number of ways of reducing the amount of travel undertaken in a warehouse.
As we have seen in the ABC/Pareto tool (tool 1.3), the notion of placing the most popular items as close to the dispatch area as possible reduces the amount of travel in the warehouse. Another method of movement reduc-tion is task interleaving or dual cycling. Task interleaving is controlled by a WMS that allocates tasks to ensure an operator travels full both ways.
Decide on the labourparameters such as working
hours and utilization rate
Perform a time-and-motionstudy or alternatively
interview staff
Agree and set the labourstandards
Compare standards v actual
Revise standards if required
Identify the activity
FIGURE 1.4 Setting up a labour management system
COPYRIGHT MATERIAL
NOT FOR REPRODUCTION
The Logistics and Supply Chain Toolkit38
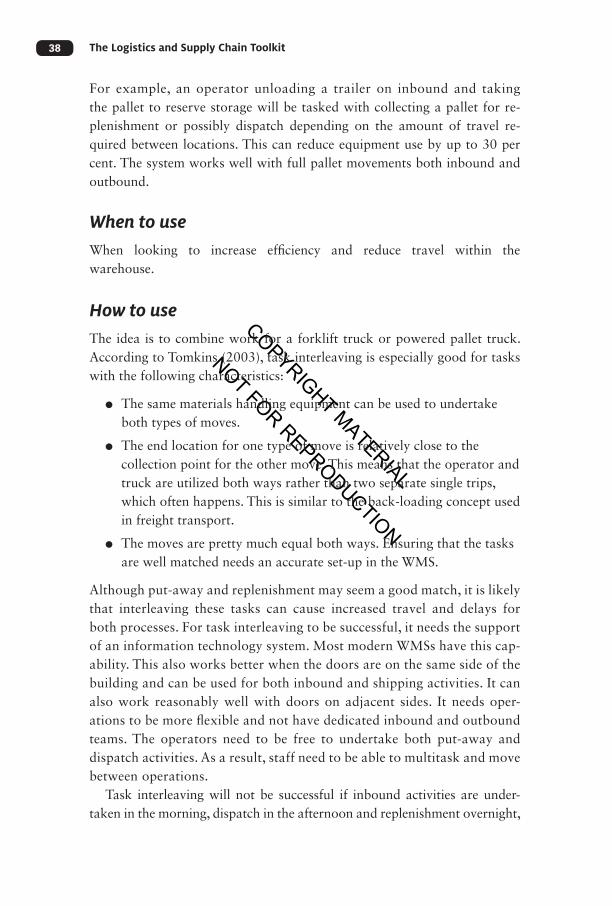
For example, an operator unloading a trailer on inbound and taking the pallet to reserve storage will be tasked with collecting a pallet for re-plenishment or possibly dispatch depending on the amount of travel re-quired between locations. This can reduce equipment use by up to 30 per cent. The system works well with full pallet movements both inbound and outbound.
When to useWhen looking to increase efficiency and reduce travel within the warehouse.
How to useThe idea is to combine work for a forklift truck or powered pallet truck. According to Tomkins (2003), task interleaving is especially good for tasks with the following characteristics:
●● The same materials handling equipment can be used to undertake both types of moves.
●● The end location for one type of move is relatively close to the collection point for the other move. This means that the operator and truck are utilized both ways rather than two separate single trips, which often happens. This is similar to the back-loading concept used in freight transport.
●● The moves are pretty much equal both ways. Ensuring that the tasks are well matched needs an accurate set-up in the WMS.
Although put-away and replenishment may seem a good match, it is likely that interleaving these tasks can cause increased travel and delays for both processes. For task interleaving to be successful, it needs the support of an information technology system. Most modern WMSs have this cap-ability. This also works better when the doors are on the same side of the building and can be used for both inbound and shipping activities. It can also work reasonably well with doors on adjacent sides. It needs oper-ations to be more flexible and not have dedicated inbound and outbound teams. The operators need to be free to undertake both put-away and dispatch activities. As a result, staff need to be able to multitask and move between operations.
Task interleaving will not be successful if inbound activities are under-taken in the morning, dispatch in the afternoon and replenishment overnight,

COPYRIGHT MATERIAL
NOT FOR REPRODUCTION
Warehouse Management Tools and Guides 39
for example. Task interleaving works best at larger facilities where more tasks can be queued up and staff will have continuous work.
The key is to manage the task allocation and not to disrupt urgent operations. The tasks have to be controlled sufficiently well and planned to coincide with other tasks. Releasing tasks too early or too late can have a devastating effect on productivity and on equipment and man-power usage.
Referencehttp://www.tompkinsinc.com/task-interleaving/
1.10 Selecting warehouse storage equipment
IntroductionThe selection of warehouse storage equipment is best carried out in conjunc-tion with the equipment manufacturers. They are the experts and have ex-perience of different types of warehouse operations. Ensure that you get a number of opinions and, if necessary, use a consultant to sense-check the options.
In this guide we look specifically at storage media. There are a number of different options when it comes to choosing the method of storage. The choice of how to store product will very much depend on the product size, its speed of throughput, the number of pallets per line item and the stock rotation policy (see Table 1.8).
There are, of course, many variables that will impact on the price. The main one is pallet size and type; for example, with drive-in racking there are different design options and alternative support rails available. On dou-ble-deep racking it would normally be the use of adjustable pallet racking (APR), but some trucks require a low-level beam to accommodate reach legs, which would increase the price, and very narrow aisle (VNA) oper-ational costs will fluctuate depending on the guidance system used. In terms of special MHE required, we mean anything other than a counterbalance or reach truck.
Figure 1.5 provides an approximate figure in terms of how many pal-lets can be stored within a specific area utilizing the different types of racking.

COPYRIGHT MATERIAL
NOT FOR REPRODUCTION
TA
BL
E 1
.8
Choo
sing
a w
areh
ouse
rack
ing
syst
em
Use
o
f
flo
or
sp
ace
Use
o
f cu
bic
sp
ace
Sp
eed
of
thro
ug
hp
ut
Acc
ess
to
ind
ivid
ual
p
alle
ts
Sp
ecia
l M
HE
re
qu
ired
Ro
tati
on
o
f st
ock
Palle
ts s
tore
d a
t g
rou
nd
leve
l in
4,
636
sq m
etre
s (5
0k s
q ft
)C
ost
per
lo
cati
on
*
Adj
usta
ble
palle
t ra
ckin
g**
****
***
**N
oFI
FO1,
250
100
Very
nar
row
ais
le**
***
***
***
**Ye
sFI
FO1,
650
100
Driv
e in
rac
king
****
***
***
*N
oFI
LO2,
120
200
Dou
ble-
deep
ra
ckin
g**
***
***
**Ye
sFI
LO1,
650
100
Push
-bac
k ra
ckin
g**
***
***
**N
oFI
LO1,
950
500
Gra
vity
-fed
rack
ing
****
***
****
*N
oFI
FO2,
500
700
Mob
ile r
acki
ng**
****
**
****
No
FIFO
2,32
540
0
Sat
ellit
e ra
ckin
g**
***
****
***
*Ye
sFI
LO2,
500
500
*The
cos
t co
lum
n as
sum
es t
hat
stan
dard
adj
usta
ble
palle
t ra
ckin
g is
giv
en a
bas
e co
st o
f 10
0.SO
UR
CE:
Info
rmat
ion
prov
ided
by
Nen
e Lt
d

COPYRIGHT MATERIAL
NOT FOR REPRODUCTION
Warehouse Management Tools and Guides 41
1.11 Warehouse location numbering
IntroductionWhen you enter the majority of warehouses you are faced with row upon row of storage racks. An interesting aspect from a consultancy viewpoint is how each row or aisle of racking is identified. The following text suggests how to number rows of racking or shelving within a warehouse facility.
5576(60,000)
5111(55,000)
4646(50,000)
4182(45,000)
3717(40,000)
3252(35,000)
2788(30,000)
2323(25,000)
1858(20,000)
1394(15,000)
929(10,000)
464(5,000)
100 200 300 400 600 700 800 900 11001200 1300 1400 1600 1700 1800 1900 21002200 2300 2400500 1000 1500 2000 2500
WID
E AIS
LE P
ALL
ET R
ACKI
NG
(V.N
.A.)
NARR
OW
AIS
LE P
ALL
ET R
ACK
ING
WID
E AIS
LE D
OUB
LE D
EEP
PALL
ET R
ACK
ING
(V.N
.A.)
NARR
OW A
ISLE
DOU
BLE
DEEP
PAL
LET
RACK
ING
DRIV
E IN
RAC
KING
MOB
ILE P
ALLE
T RA
CKIN
G
SATE
LLITE & P
ALLET
LIV
E ST
ORAGE
NUMBER OF PALLETS AT GROUND LEVEL
AREA
OF
BU
ILD
ING
IN S
QU
ARE
MET
RES
(SQ
UA
RE
FEET
)FIGURE 1.5 Pallet rack capacity
SOURCE: reproduced by kind permission of Constructor Group, http://www.constructor-group.co.uk/

COPYRIGHT MATERIAL
NOT FOR REPRODUCTION
The Logistics and Supply Chain Toolkit42
When to useIf a company is looking to introduce greater efficiency into its picking oper-ation and reduce travel time, it needs to consider carefully how it numbers its pick locations.
How to do itIn Figure 1.6 we see that each row of racking is given a letter: A, B, C, etc. This results in one-sided picking as denoted by the arrows. The numbers denoted in the boxes are the pallet locations. The shaded area is an order pick location.
In this example the first pick location will have a location identification (ID) of A (row) 06 (bay) 01 (ground floor) – A0601, while the second loca-tion will be B0401. The pick list produced for the operator will automatic-ally send him or her to the location in Row A. This can result in large walking distances as the order picker first visits the location on one side of
A B C D E F G H
10
09
10
09
10
09
10
09
10
09
10
09
10
09
10
09
08
06
07
08
06
07
08
06
07
08
06
07
08
06
07
08
06
07
08
06
07
08
06
07
04
05
04
05
04
05
04
05
04
05
04
05
04
05
04
05
03
01
02
03
01
02
03
01
02
03
01
02
03
01
02
03
01
02
03
01
02
01
02
0303
First pick location – Row A location 0606
FIGURE 1.6 Pallet row numbering
SOURCE: adapted from and reproduced by kind permission of JP van den Berg

COPYRIGHT MATERIAL
NOT FOR REPRODUCTION
Warehouse Management Tools and Guides 43
the aisle and then returns to visit the locations on the other side. This method of identification can be utilized in very wide aisles; however, for narrow aisles and shelving it is more efficient to number the aisles as can be seen in Figure 1.7.
In Figure 1.7 the aisles are given letters, as opposed to each row, which results in the picker traversing the aisle and thus picking from both sides at one pass. This will reduce the amount of travel significantly. In the example the first pick location is A0801 and the second becomes A1101. As a result, the pick travel has reduced significantly. This is referred to as snake path or S-shape picking.
It can also be noted in Figure 1.7 that the location numbers begin at the other end of the aisle for aisle B thus allowing the picker to travel less and in sequence. Care should be taken in terms of which items are at the begin-ning of the pick sequence: heavier items should be picked first. The section on slotting (tool 1.7) gives further guidance on this subject.
A B C D
19
17
20
18
02
04
01
03
19
17
20
18
02
04
01
03
15
11`
13
16
12
14
06
10
08
05
19
07
15
11
13
16
12
14
06
10
08
05
09
07
07
09
08
10
14
12
13
11
07
09
08
10
14
12
13
11
05
01
03
06
02
04
16
20
18
15
19
17
05
01
03
06
03
04
16
20
18
15
19
17
0808 First pick location – Aisle A location 08
FIGURE 1.7 Aisle numbering
SOURCE: adapted from and reproduced by kind permission of JP van den Berg

COPYRIGHT MATERIAL
NOT FOR REPRODUCTION
The Logistics and Supply Chain Toolkit44
1.12 Selecting warehouse material handling equipment (MHE)
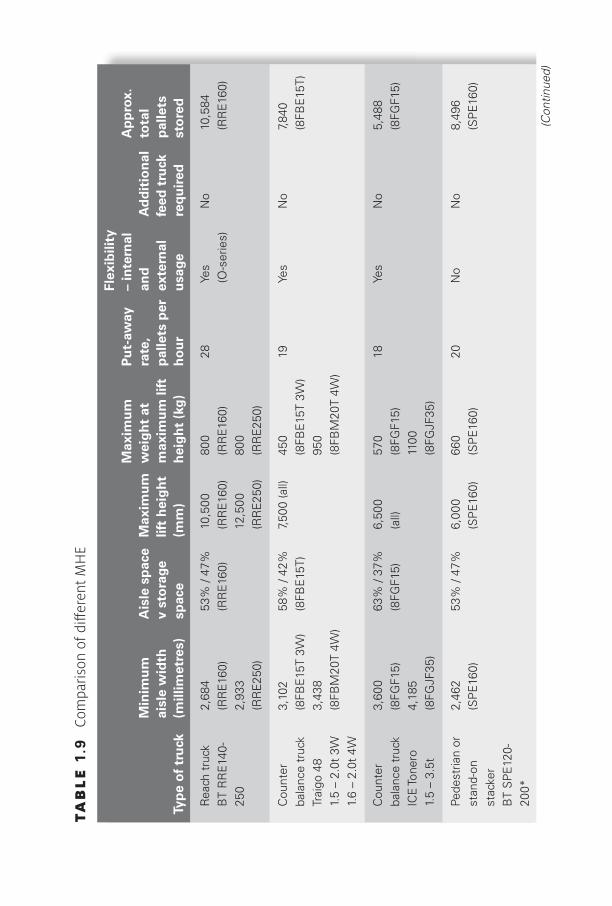
IntroductionThe choice of MHE within a warehouse is closely linked to the choice of storage medium. It is therefore key to ensure that they are done simultan-eously, taking into account the trade-off between additional space capacity and speed of throughput. In choosing the most appropriate equipment we are looking to:
●● ensure staff safety;
●● lower unit handling costs;
●● reduce handling time;
●● maximize cubic space utilization;
●● reduce energy consumption and emissions.
Table 1.9 compares different truck types working in a racked storage envir-onment. We have taken a warehouse with the following storage area dimen-sions – 48 metres × 120 metres × 10 metres – to bring out the differences between the trucks. Note the lift height capability of the trucks together with the aisle space required. Also note that the VNA truck requires another truck to transport the product to and from the racked area.
1.13 Warehouse space calculations
IntroductionFor those companies that do not have access to warehouse design software there are a number of simple ways to calculate the space required for specific operations. In this tool we have included a calculation for dock space and racked pallet storage.
How to do it
1. Calculation of dock space requirementsThe formula for this is relatively simple, as follows:
Dock space = Roundup ((Number of loads received x hours per load) / hours per shift) × (Size of load × pallet dimensions)
(continues on page 47)
COPYRIGHT MATERIAL
NOT FOR REPRODUCTION
TA
BL
E 1
.9
Com
paris
on o
f diff
eren
t MH
E
Typ
e o
f tr
uck
Min
imu
m
aisl
e w
idth
(m
illim
etre
s)
Ais
le s
pac
e v
sto
rage
sp
ace
Max
imu
m
lift
hei
gh
t (m
m)
Max
imu
m
wei
gh
t at
m
axim
um
lift
h
eig
ht
(kg
)
Pu
t-aw
ay
rate
, p
alle
ts p
er
ho
ur
Flex
ibili
ty
– in
tern
al
and
ex
tern
al
usa
ge
Ad
dit
ion
al
feed
tru
ck
req
uir
ed
Ap
pro
x.
tota
l p
alle
ts
sto
red
Rea
ch t
ruck
B
T R
RE
140-
250
2,68
4 (R
RE
160)
2,
933
(RR
E25
0)
53%
/ 47
%
(RR
E16
0)
10,5
00
(RR
E16
0)
12,5
00
(RR
E25
0)
800
(RR
E16
0)
800
(RR
E25
0)
28
Yes
(O-s
erie
s)
No
10,5
84
(RR
E16
0)
Cou
nter
ba
lanc
e tr
uck
Trai
go 4
8 1.
5 –
2.0t
3W
1.
6 –
2.0t
4W
3,10
2 (8
FBE
15T
3W)
3,43
8 (8
FBM
20T
4W)
58%
/ 42
%
(8FB
E15
T)
7,50
0 (a
ll)
450
(8FB
E15
T 3W
) 95
0 (8
FBM
20T
4W)
19
Yes
No
7,84
0 (8
FBE
15T)
Cou
nter
ba
lanc
e tr
uck
ICE
Tone
ro
1.5
– 3.
5t
3,60
0 (8
FGF1
5)
4,18
5 (8
FGJF
35)
63%
/ 37
%
(8FG
F15)
6,
500
(all)
57
0 (8
FGF1
5)
1100
(8
FGJF
35)
18
Yes
No
5,48
8 (8
FGF1
5)
Pede
stria
n or
st
and-
on
stac
ker
BT
SP
E12
0-20
0*
2,46
2 (S
PE
160)
53
% /
47%
6,
000
(SP
E16
0)
660
(SP
E16
0)
20
No
No
8,49
6 (S
PE
160)
(Continued)
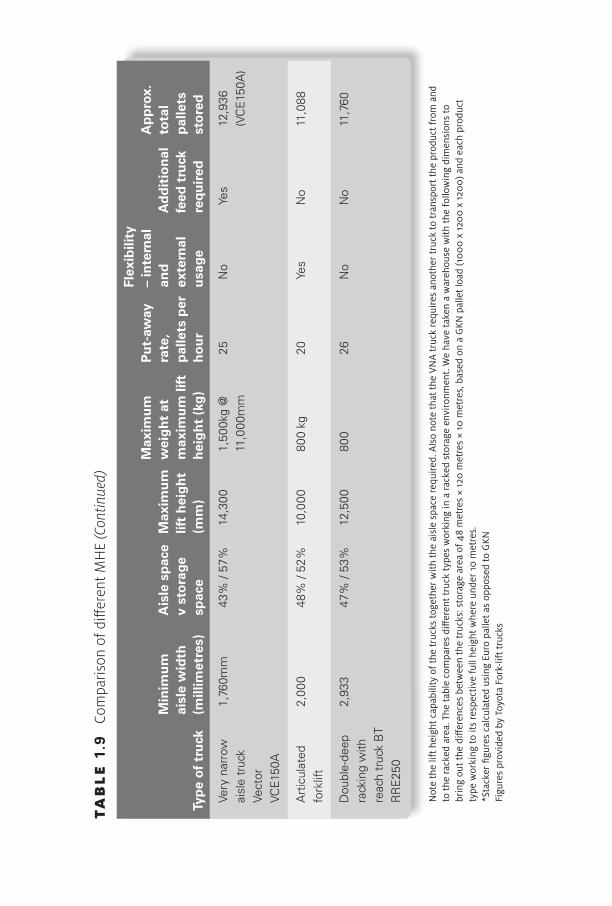
COPYRIGHT MATERIAL
NOT FOR REPRODUCTION
Typ
e o
f tr
uck
Min
imu
m
aisl
e w
idth
(m
illim
etre
s)
Ais
le s
pac
e v
sto
rage
sp
ace
Max
imu
m
lift
hei
gh
t (m
m)
Max
imu
m
wei
gh
t at
m
axim
um
lift
h
eig
ht
(kg
)
Pu
t-aw
ay
rate
, p
alle
ts p
er
ho
ur
Flex
ibili
ty
– in
tern
al
and
ex
tern
al
usa
ge
Ad
dit
ion
al
feed
tru
ck
req
uir
ed
Ap
pro
x.
tota
l p
alle
ts
sto
red
Very
nar
row
ai
sle
truc
k Ve
ctor
VC
E15
0A
1,76
0mm
43
% /
57%
14
,300
1,
500k
g @
11
,000
mm
25
N
o Ye
s 12
,936
(V
CE
150A
)
Art
icul
ated
fo
rklif
t 2,
000
48%
/ 52
%
10,0
00
800
kg
20
Yes
No
11,0
88
Dou
ble-
deep
ra
ckin
g w
ith
reac
h tr
uck
BT
RR
E25
0
2,93
3 47
% /
53%
12
,500
80
0 26
N
o N
o 11
,760
Not
e th
e lif
t hei
ght c
apab
ility
of t
he tr
ucks
toge
ther
wit
h th
e ai
sle
spac
e re
quir
ed. A
lso
note
that
the
VNA
truc
k re
quir
es a
noth
er t
ruck
to
tran
spor
t th
e pr
oduc
t fr
om a
nd
to th
e ra
cked
are
a. T
he ta
ble
com
pare
s di
ff er
ent t
ruck
type
s w
orki
ng in
a ra
cked
sto
rage
env
iron
men
t. W
e ha
ve t
aken
a w
areh
ouse
wit
h th
e fo
llow
ing
dim
ensi
ons
to
brin
g ou
t the
diff
eren
ces
betw
een
the
truc
ks: s
tora
ge a
rea
of 4
8 m
etre
s ×
120
met
res
× 10
met
res,
bas
ed o
n a
GKN
pal
let
load
(10
00
x 1
200
x 1
200
) an
d ea
ch p
rodu
ct
type
wor
king
to it
s re
spec
tive
full
heig
ht w
here
und
er 1
0 m
etre
s.*S
tack
er fi
gure
s ca
lcul
ated
usi
ng E
uro
palle
t as
oppo
sed
to G
KNFi
gure
s pr
ovid
ed b
y To
yota
For
k-lif
t tru
cks
TA
BL
E 1
.9
Com
paris
on o
f diff
eren
t MH
E (Contin
ued)

COPYRIGHT MATERIAL
NOT FOR REPRODUCTION
Warehouse Management Tools and Guides 47
Data
Receiving 20 loads per day
Each load is 26 pallets
Each pallet is 1 m × 1.2 m
45 minutes per load to unload vehicle
30 minutes per load to stage prior to put-away
8 hours per day work shift
Calculation
Roundup ((20 × 1.25)/8) × (26 × (1.2 × 1.0))
= roundup (3.125) × 31.2
= 4 × 31.2
= 124.8 square metres
Dock space = 124.80 square metres
Add double the space for working and travel area = 249.60 square metres
Total space required = 374.40 square metres
2. Pallet storage calculationThis tool enables operators to calculate the number of pallets that can be stored within a particular cubic area. It works on the basis of calculating width, length and height modules within the warehouse.
A module width is calculated as follows:
Module width = Width of aisle + 2 Pallet lengths (short side) + 100 mm
For example, given the following data:
Aisle = 2,500 mm (variable with type of MHE used)
Pallet size = 1,200 mm × 1,000 mm
Two pallets short side = 2 × 1,000 mm = 2,000 mm
Clearance = 100 mm between back-to-back pallets
Therefore:
Width of module = 4,600 mm (the sequence is pallet–aisle–pallet–clearance)
A module length is calculated as follows:
Module length = Width of upright + Clearance + 2 Pallets (long side)

COPYRIGHT MATERIAL
NOT FOR REPRODUCTION
The Logistics and Supply Chain Toolkit48
Rack upright plus clearance = 420 mm (120 mm + 3 × 100 mm)
Two pallets (long side) = 2 × 1,200 mm = 2,400 mm
Therefore:
Length of module = 2,820 mm (the sequence is upright–clearance–pallet–clearance–pallet–clearance) (see Figure 1.9).
Module height = Height of pallet + 150 mm
Pallet height = 1,350 mm
Clearance above pallet = 150 mm
APR beam width of 140 mm
Therefore:
Height of module = 1,640 mm (sequence is pallet and goods–clearance–beam height) (see Figure 1.10).
AisleAisle
FIGURE 1.8 Width module calculation
FIGURE 1.9 Length module calculation
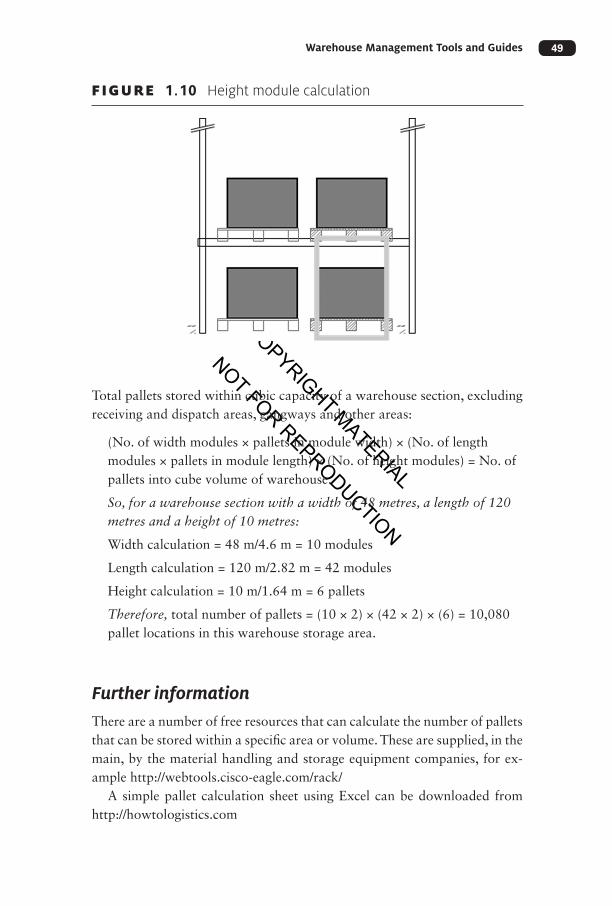
COPYRIGHT MATERIAL
NOT FOR REPRODUCTION
Warehouse Management Tools and Guides 49
Total pallets stored within cubic capacity of a warehouse section, excluding receiving and dispatch areas, gangways and other areas:
(No. of width modules × pallets in module width) × (No. of length modules × pallets in module length) × (No. of height modules) = No. of pallets into cube volume of warehouse.
So, for a warehouse section with a width of 48 metres, a length of 120 metres and a height of 10 metres:
Width calculation = 48 m/4.6 m = 10 modules
Length calculation = 120 m/2.82 m = 42 modules
Height calculation = 10 m/1.64 m = 6 pallets
Therefore, total number of pallets = (10 × 2) × (42 × 2) × (6) = 10,080 pallet locations in this warehouse storage area.
Further informationThere are a number of free resources that can calculate the number of pallets that can be stored within a specific area or volume. These are supplied, in the main, by the material handling and storage equipment companies, for ex-ample http://webtools.cisco-eagle.com/rack/
A simple pallet calculation sheet using Excel can be downloaded from http://howtologistics.com
FIGURE 1.10 Height module calculation
COPYRIGHT MATERIAL
NOT FOR REPRODUCTION
The Logistics and Supply Chain Toolkit50
1.14 Warehouse location
IntroductionLocating a warehouse strategically and in the most cost-effective geographic location is one of the most important decisions a company will make. The decision as to whether to operate the warehouse in-house or outsource is covered elsewhere in this book (see tool 5.1).
The selection of a warehouse location requires multiple criteria to be as-sessed, including both quantitative and qualitative data. Many companies will look at the location and size of customers which, although relevant, are not as important as they would be when locating a retail outlet. Factors to take into account include the following:
●● cost of land, rent, rates and local taxation;
●● access to transport networks;
●● availability of trained labour;
●● transport links for staff;
●● availability of funding, grants, etc;
●● availability of existing buildings;
●● availability and cost of utilities, including telecoms;
●● availability of finance and resources;
●● goods traffic flows;
●● proximity to ports, including inland ports and airports;
●● location of suppliers and manufacturing points;
●● the potential neighbours, eg opportunities for co-loading or, negatively, chemical facilities.
When to useWhen the company is looking to locate or relocate a warehouse operation.
How to useFigure 1.11 provides a list of criteria companies need to take into account when deciding on a new location for their warehouse. Fortunately, this does not have to be a totally manual decision as there are a number of software programs available that will take the majority of these criteria into account and produce a number of viable alternatives.

COPYRIGHT MATERIAL
NOT FOR REPRODUCTION
Exi
sten
ce o
f m
od
es
of
tran
spo
rt
Tel
eco
mm
un
icat
ion
sy
stem
s
En
erg
y an
d w
ater
u
tilit
ies
Qu
alit
y an
d
relia
bili
ty o
f m
od
es
of
tran
spo
rt
Pro
xim
ity
to p
ort
s an
d a
irp
ort
s
Exi
stin
g s
ites
Geo
gra
ph
y
Wea
ther
Nei
gh
bo
urs
Co
ng
esti
on
Aw
ay f
rom
fl
oo
d p
lain
s
Aw
ay f
rom
sub
sid
ence
Pro
xim
ity
to
cust
om
ers
Pro
xim
ity
to
sup
plie
r/p
rod
uce
r
Lead
tim
es a
nd
re
spo
nsi
ven
ess
Tra
ffic
flo
ws
Lan
d c
ost
Lab
ou
r co
sts
Tra
nsp
ort
atio
n c
ost
Tax
ince
nti
ves
Tax
str
uct
ure
s
Fin
anci
al in
cen
tive
s
Han
dlin
g c
ost
s
Go
vern
men
t p
olic
ies
Ind
ust
ry r
egu
lati
on
s
En
terp
rise
zo
nes
an
d c
on
stru
ctio
n
pla
ns
Pla
nn
ing
reg
ula
tio
ns
Po
litic
al s
tab
ility
Sec
uri
ty
Lab
ou
r av
aila
bili
ty
Ski
lled
lab
ou
r
Tra
nsp
ort
lin
ks
for
staf
f
Ind
ust
rial
Rel
atio
ns
reco
rd
Infr
astr
uct
ure
En
viro
nm
ent
Mar
kets
Co
st
Sel
ecti
on
cri
teri
a fo
r w
areh
ou
se lo
cati
on
Mac
ro
envi
ron
men
tLa
bo
ur
char
acte
rist
ics
FIG
UR
E
1.1
1
War
ehou
se lo
catio
n cr
iteria
SOU
RCE
: re
prod
uced
from
Dem
irel
et a
l (20
10),
wit
h pe
rmis
sion
from
Els
evie
r

COPYRIGHT MATERIAL
NOT FOR REPRODUCTION
The Logistics and Supply Chain Toolkit52
Route planning and optimization software will produce a viable loca-tion; however, supply chain optimization tools will further enhance this decision.
Further informationThe websites for a number of providers of this software are:
Cirrus Logistics – http://cirruslogistics.com/products/cost2serv-network-strategy/
JDA – http://www.jda.com/solutions/
Llama Soft – www.llamasoft.com
Plan LM – www.solvoyo.com
SCM Globe – https://scmglobe.com/user_sessions/new
ReferencesDemirel, T, Demirel, N Ç and Kahraman, C (2010) Multi-criteria warehouse
location selection using Choquet integral, Expert Systems with Applications, 37 (5), pp 3943–52
1.15 Justifying a warehouse management system (WMS)
IntroductionA WMS has become essential to the smooth and efficient operation of com-plex warehousing and distribution environments around the world. Recognizing the need for a WMS is a reasonably straightforward exercise for many warehouse managers. Inaccurate inventories and pressure to con-tinually reduce costs and improve service levels make the investment deci-sion almost intuitive. Investments, however, are rarely made based on intuition. Fortunately, the benefits of a WMS can be identified and, to a great extent, quantified, to provide an accurate basis for justification.
When to useWhen contemplating the acquisition of a WMS.
COPYRIGHT MATERIAL
NOT FOR REPRODUCTION
Warehouse Management Tools and Guides 53
How to useRed Prairie (now JDA) suggests a five-step plan to justify the introduction of a WMS.
Step 1: Define the problem areasFour principal benefits can be expected to arise from the implementation of a WMS. These benefits lie in the four areas that cause the majority of efficiency problems in warehouses, including: inventory accuracy, resource management, customer service and visibility. The first step is to identify the main problems currently experienced. Begin by creating a matrix using these four benefits as the primary categories. Next, list the facility’s problems under each category.
Common problems occurring under inventory accuracy include excess inventory, lost product, and miss-picks. Under resource management, prob-lems may include wasting time looking for material, inefficient pick paths and no means of measuring performance. Customer service problems in-clude ship errors and delayed shipments. Finally, information management problems may include stock-outs, false stock-outs, transaction update de-lays of hours and days, and data entry errors.
Step 2: Estimate the costsOnce any warehousing problems have been documented, the next step is to estimate the costs associated with each. This step is critical to understanding the severity of any problems. A variety of equations and industry standards can be used to quickly estimate the costs. Four examples of typical costs are listed in Table 1.10. Having completed a quick estimate of the costs, it be-comes easy to identify the most urgent problems – those problems that rep-resent your biggest cost factors. The first example indicates the impact of ship errors. Two calculations are made: one assuming a ship accuracy of 98.5 per cent and one assuming 96 per cent. Ship accuracy above 95 per cent is often thought of as excellent, yet the cost of errors in these two cases is significant – $33,750 and $90,000 respectively.
Step 3: Identify the savingsThe savings associated with the reduction of inventory levels may them-selves justify investment in a WMS. Many companies have reported redu-cing inventory levels by as much as 30 per cent. This level of reduction greatly affects carrying costs, which typically equate to 25 to 35 per cent of the cost of inventory (see Table 1.11).

COPYRIGHT MATERIAL
NOT FOR REPRODUCTION
The Logistics and Supply Chain Toolkit54
TABLE 1.10 Typical cost penalty if no WMS
Occurrence (%) Cost/Occurrence Total cost
Ship errors 1.5
4.0
(assume 50k orders pa)
$45
$45
$33,750
$90,000
Shrinkage 1.0 .01 × $1m in invoicing
.01 × $7m in invoicing
$10,000
$70,000
Data entry errors
4.0
(assume 100k transactions pa)
$10 $40,000
Lost product 5.0
7.0
(assume 50k orders × 5 lines per order)
$2.50
(10 minutes searching × $15/
hour)
$31,500
$43,750
TABLE 1.11 Potential cost savings from introducing a WMS
Potential cost savings (%)
Labour utilization 10–35
Inventory reduction 5–30
Floor space utilization 10–30
Maintenance 0–10
Shrinkage 50–75
Rolling stock 10–20
Increase shipping accuracy to 99+
Increase data entry accuracy to 99+
Realistically, during the few months of implementation cost savings will not be maximized because of ‘learning curve’ issues such as training and a

COPYRIGHT MATERIAL
NOT FOR REPRODUCTION
Warehouse Management Tools and Guides 55
re-engineered warehouse culture. However, over time, users should expect near-perfection in those areas that were once major problems. Estimated cost savings should take into consideration the fact that year two will return greater savings than year one. Minimizing the learning curve can be accom-plished through training (commencing long before implementation) com-bined with good internal communication (change management).
Step 4: Determine the cost of a WMSAt this point in the process, it will be reasonably clear how much money and time a good WMS product will be able to save. The next step is to determine how much will have to be spent to integrate the system. Although vendors use various pricing models, the components of their pricing proposals usu-ally fall into five categories:
1 licence fees;
2 custom development (if applicable);
3 computer hardware;
4 RF hardware; and
5 services such as design, implementation, training, testing and travel.
Your internal costs to implement the system should also be included when defining the total cost of the implementation, as well as the cost of mainten-ance over the time period for which you are calculating the ROI.
An alternative pricing and implementation model may also be considered. WMS systems are now available on a SaaS (software as a service) basis. In this model you typically pay a modest upfront implementation fee and then have a single monthly payment (including system and hardware costs and maintenance fees) for a specified period such as three or five years. Add the sum of the payments for the life of the contract and the implementation fee to determine total system costs.
Step 5: Calculate the ROISee tool 8.3. Once calculated and accepted by the board you can begin the process of supplier selection (see tool 1.16).
Referencehttp://www.jda.com/knowledge-center/

COPYRIGHT MATERIAL
NOT FOR REPRODUCTION
The Logistics and Supply Chain Toolkit56
1.16 Selecting a warehouse management system (WMS)
IntroductionIf I had to choose one tool to operate within a warehouse it would have to be a WMS, closely followed by ABC analysis (see tool 1.3). This tool de-scribes how you should go about choosing a WMS.
A WMS can process data quicker and can coordinate movements within the warehouse. It can produce reports and handle large volumes of transac-tions, as seen in e-commerce operations. The potential benefits of having a WMS in place include the following:
●● efficient and effective labour management;
●● improvements in productivity and accuracy;
●● stock visibility and traceability;
●● accurate stock-takes;
●● reduction in picking errors;
●● reduction in returns;
●● accurate reporting;
●● improved responsiveness;
●● remote data visibility;
●● automatic replenishments;
●● improved customer service; and
●● minimized paperwork.
To embark on a WMS project you need to be certain that you are going to achieve significant business benefits. Such systems need capital investment, plus there are some running costs involved; however, the main ‘cost’ is the drive, enthusiasm and commitment needed from the entire warehousing team and senior management to ensure that the system is set up correctly, used properly and regularly optimized. A WMS is not a ‘quick fix’ option. A WMS is more than a stock control and data collection tool. It is a system that helps you ‘automate’ your warehousing operations as much as possible.
IT projects arguably should be justified on the same basis as any other busi-ness investment. A WMS is very much a tactical ‘execution’ system and is there-fore a lot easier to justify than many IT projects. It forms an important component for strategic business improvement but nevertheless is still tactical.

COPYRIGHT MATERIAL
NOT FOR REPRODUCTION
Warehouse Management Tools and Guides 57
When to useWhen you have decided on the purchase or rental of a WMS.
How to use
Step 1: Undertake a return on investment (ROI) calculationThe justification process (see tool 1.15) is important because it helps you to set a budget for your project and also focus on the functional ‘must haves’ rather than the ‘nice to haves’ when selecting suppliers. The key areas to consider are:
●● the potential for a WMS to give you improved stock accuracy – by reducing errors, providing real-time information and enabling perpetual inventory counting;
●● the potential for increased productivity and cost savings – through improved labour, equipment and space utilization;
●● the need for improved traceability – a WMS can give you two-way traceability, almost as a by-product of being in place;
●● improved customer and client service – through overall improved warehouse control, improved pick and dispatch accuracy.
The more transactions per day (eg pallet moves, picks) and locations in the warehouse, the greater the potential for payback and the greater the justifi-cation. In addition, warehouses use expensive equipment where optimiza-tion can bring significant savings – sometimes to such an extent that less equipment needs to be purchased and fewer staff employed.
Understand the cost methods used by WMS vendors. These can be broken up into four main components:
1 Licences – the software licence needed to run the system. Typically this is charged by ‘user’, ie PC user or radio data terminal user, although different models are now being offered, including paying by transaction and/or paying monthly rather than outright purchase of the system.
2 Professional services – the costs for project management, training and go-live support.
3 Development costs for requirements not catered for in the package, including interfaces to third-party systems.

COPYRIGHT MATERIAL
NOT FOR REPRODUCTION
The Logistics and Supply Chain Toolkit58
4 Support costs – typically an annual cost based on licence costs and often development costs; the scope of service and cost varies significantly from supplier to supplier.
Ensure that the suppliers you approach give you costs for all of the above. Ask them to indicate which prices are fixed and which are variable. Watch out for hidden costs such as travel costs, travel time and project manage-ment time. Summarize all the costs in a spreadsheet, showing the initial cost and then costs for years one to five with accumulated totals. You may be surprised by the results!
In addition, there are the hardware and infrastructure costs. These costs have to be considered in terms of project budget and ROI, of course, but in many cases can be managed as a separate project with interdependencies with the main project.
Step 2: Decide on the processModern WMSs are highly configurable, normally by the end user, and should be capable of working in virtually any type of warehousing environment. In the past, the production of large detailed ITTs (tender documents) was an important part of the WMS selection process. This reflected the limited func-tionality of most systems at that time. A major disadvantage of ITTs is that they cannot hope to take account of a company’s future requirements and are often over-prescriptive. The other disadvantage is that many WMS providers will often not respond to ITTs. They consume a vast amount of time, which the vendor might prefer to spend in other directions under its own control.
There are spreadsheet templates that are downloadable from the internet; however, many of these are, or were originally, prepared by WMS vendors and are slanted towards their products. Most WMS vendors therefore view such documents with suspicion.
Step 3. Understand and analyse your existing systemsIf your ERP/business system already has a WMS module then you should analyse this in the first place. The same due diligence applies to this selection as to any other system, but normally any small shortfalls in functionality are outweighed by reducing any risks of systems not interfacing with each other reliably and accurately.
Similarly, if your warehouse is highly automated, with cranes, con-veyors or sortation systems, you may wish to focus on the WMS provided by the automation systems company. This will typically be known as a warehouse control system or WCS. Again, shortfalls in functionality are

COPYRIGHT MATERIAL
NOT FOR REPRODUCTION
Warehouse Management Tools and Guides 59
often outweighed by the avoidance of an interface to an external WMS. There are many papers available on this subject and some of these are mentioned below.
Step 4: Is there an in-house development capability?Owing to the ‘packaged’ nature of the WMS market nowadays, in-house development is very rarely viable as a typical WMS vendor will have per-haps 100+ clients over which it amortizes the continuous development costs; these same 100+ clients serve as a very valuable and thorough proving ground for the product in question. In-house development is sometimes viable if the overall requirements are particularly specialized or require spe-cialized integration with existing in-house systems.
Step 5: Request for informationPrepare a short RFI document (request for information); this should typic-ally be no more than a few pages long. In this document you describe your business, your future business direction, your warehouse and your plans for the warehouse. Then talk in broad terms about what you want to achieve from the WMS.
By this stage you will have completed an operational specification for the warehouse to gain capital approval. The key elements from this specification are an ideal base for the RFI, for example number of loading bays, number and type of reserve locations, number of pick face locations, and pick and pack station details. Of particular relevance is the number of users, ie administrative users, forklift-truck drivers, pickers, packers and so on. Provide a guide to the number of transactions per day (receipts, put-aways, picks, dispatches) and indicate if there are any significant peaks across the day, week or month.
Do not try to describe how the system should work – in fact it can be dangerous to be too specific at this point, as there may be faster, better, cheaper ways of doing things and part of the selection process is to see how potential suppliers can guide you in this regard. You could use the services of a specialist consultant to help you.
Within the RFI, ask the vendor for budget costs and implementation timescales. You should ask for supplier information, including:
●● company history;
●● financial history and status;
●● number of sites using its current WMS product;
●● who owns the IP (intellectual property – source code) for the WMS;

COPYRIGHT MATERIAL
NOT FOR REPRODUCTION
The Logistics and Supply Chain Toolkit60
●● client list;
●● daily rates and support charges;
●● support cover;
●● development plans;
●● track record.
We suggest that you send this RFI to six to 10 suppliers initially. Focus on suppliers that have experience in your market – this is particularly the case if you are a third-party logistics provider; WMS vendors with no experience in this sector are unlikely to have the functionality and importantly the ex-pertise to help you. Focus on suppliers that have a track record linking to any business or ERP system you are operating.
At this stage you will need to decide whether to purchase the software and hardware outright or to rent the software and operate it on a third-party server platform. A SaaS (Software as a Service) WMS is an inter-net-based application that is developed, hosted and maintained by a third-party software provider on secure servers. The vendor rents out the system to a number of different clients. These clients, in turn, will choose the various modules within the software they require and pay for them as they use them. The advantages are:
●● lower cost of entry;
●● reduced start-up costs;
●● instant upgrades;
●● user-driven innovation;
●● ability to turn on and off as required, eg to run a temporary warehouse operation.
Such a system will be attractive to start-up companies and small and medium- sized enterprises (SMEs), although it could benefit larger companies that are looking for a temporary fix. Potential disadvantages include the possibility of poor internet links between the companies and worries over data security.
Step 6: Short listProduce a short list of three to five suppliers. Price, of course, is not the main criterion at this stage but can be used to rule out suppliers that will exceed your budget. Get the suppliers to visit you for an informal meeting. This will help you get a feel of their company – how professional they are, how

COPYRIGHT MATERIAL
NOT FOR REPRODUCTION
Warehouse Management Tools and Guides 61
carefully they listen and respond to your needs, how well they answer your questions.
Before you get into the detailed demonstration stage, do a little more checking on each of the suppliers; this will help you to reject unsuitable sup-pliers at an early stage. A good way of doing this is to telephone-interview at least six reference sites, preferably sites you choose from a longer list. These calls should all be made with the knowledge of the supplier – unless you have contacts with their clients already.
Get the short-listed suppliers to provide you with a tailored demonstra-tion. Get them to focus on what you believe is especially important for your operation – for instance, pick face replenishment, or kitting and assembly. At some time during the selection process you should also get them to give you an overview of their company, products and people and of their strategy – in terms of both company and product.
Visit their head office to get a better understanding of their culture, man-agement and team working. It is very important to get a good ‘people’ fit with any organization you select. It is always worth asking the suppliers why they think they should be selected for your project.
The reference site visit/s is often the crux of supplier selection. Make sure you are given a choice of sites, not just ‘the one’, and make sure it is similar in terms of size and processes to yours – or preferably slightly larger and slightly more complex.
If you have identified any gaps in functionality, now is the time to get these specified and costed. The supplier should be asked to provide an ac-curate project cost, clearly identifying any variable costs. This is where the contacts you have developed with the suppliers’ reference sites will pay off, as you can talk to them about how well the supplier worked to budget and time.
Step 7: Final choiceChoose the most appropriate supplier. Utilize a decision matrix, taking into account the criteria mentioned above (see tool 6.2).
SummaryHere are 20 tips for choosing a WMS:
1 Have a clear long-term vision of what your warehouse could look like in the future – this will help you ensure that you choose a solution that is sufficiently scalable, flexible and functional.

COPYRIGHT MATERIAL
NOT FOR REPRODUCTION
The Logistics and Supply Chain Toolkit62
2 Ensure complete ‘buy-in’ from senior management.
3 Keep an open mind about how your WMS will operate – let the WMS vendors listen to your needs and show you different ways of using their solution.
4 Ensure that your processes are working efficiently before introducing a WMS.
5 Look for a supplier that is warehouse and logistics focused; more generalist companies will often change strategy and reduce their focus on warehousing as their fortunes change.
6 Look for a supplier with a strong team of warehousing specialists, otherwise you will be training the supplier in warehousing or at best will be reliant on one or two individuals.
7 Choose a WMS vendor that you get along with – it is about partnership.
8 Make sure that help desk and support cover is available during your working hours – 24/7 if necessary.
9 Look for a WMS that has been specified by warehouse and logistics professionals, rather than by programmers and analysts.
10 Make sure that the product is relatively new but with a sound track record, and uses the latest software technology.
11 Make sure that the product is being developed on an ongoing basis to meet future warehousing and supply chain needs. Historically, WMS vendors have made their money by charging their customers significant amounts of money for development work. This has several major disadvantages: it invariably costs more than functionality provided as a package, it extends the project time and it introduces risk (bespoke software often fails to perform due to both technical issues and differences in interpretation of the specification). A further disadvantage is that custom software often makes software upgrades cumbersome, risky and expensive.
12 Choose a WMS vendor that can demonstrate a significant track record in your type of warehousing operation; get them to take you to customer sites to see the WMS in action, and make sure that you talk to the users and the management team at each site.
13 Look for a WMS that is an end-user-configurable package. Nowadays it is impossible to predict future WMS needs, particularly in a third-party environment, so flexibility is the name of the game.

COPYRIGHT MATERIAL
NOT FOR REPRODUCTION
Warehouse Management Tools and Guides 63
14 Where small but important changes are needed to make the system meet your very specific needs, ensure that these changes do not compromise the package upgrade route.
15 Look for relevant reference sites. Look for a vendor with a good, active user group, and ensure that this group has real influence on the product strategy and support services.
16 Ensure that the vendor is of the right size – not so small that it has insufficient resource and not so large that you have no influence on product development and service levels.
17 Ensure that the vendor will help and support you in commercial and technical discussions with suppliers, customers and clients.
18 Have an in-depth demonstration of the WMS. Make sure that potential users of the system go along. Ensure that the WMS is easy to use and related closely to your operation.
19 Make sure that you involve your IT team in ensuring that the WMS vendor can work with you to provide solid interfaces with your other business systems. Do not let them dominate the project – a WMS is a tactical, operational solution and, as such, in most cases the project should be managed and run by logistics people.
20 Make sure that you identify a project champion in your organization, build a team around him or her and get the champion to own the WMS implementation.
(This tool is adapted from a white paper written by Stephen Cross and re-produced with his permission. The original paper can be found at http://www.cenglobal.com/atms/wp-content/uploads/2015/04/chapter-12- systems.pdf)
Further informationA comprehensive list of WMSs can be found at http://www.capterra.com/warehouse-management-software
Two examples of WMS RFP templates are https://www.highjump.com/resources/rfp-templates/rfp-1 and http://transportation-warehousing. technologyevaluation.com/
Papers discussing best of breed versus ERP WMSs can be found at http://www.inboundlogistics.com/cms/article/the-million-dollar-question-erp-or-wms/ and http://www.clydebuiltsolutions.com/white-papers/one-stop-vs-vs- best-of-breed/

COPYRIGHT MATERIAL
NOT FOR REPRODUCTION
The Logistics and Supply Chain Toolkit64
1.17 How to implement a WMS
IntroductionOnce you have decided you really need a WMS, and you have selected a WMS vendor, the hard work begins. There is no substitute for good and ro-bust project management, alongside the selection of a good team. The WMS project must be owned from the top of the organization to the bottom. A project sponsor is an invaluable member of the project team – someone who ensures that the focus is maintained on delivering business benefits with minimal disruption.
A project champion needs to be appointed to effectively take charge of the project and this person will often come from a warehousing rather than an IT background. Crucial to this is having project management experience. IT staff should also be represented on the team, but increasingly IT is seen as a business support function as opposed to the main ‘drivers’ of a WMS project. Too many projects have failed when the project manager has not been experienced or has not been able to concentrate fully on the project itself.
Use the guidance and support of your WMS vendor as much as possible; a major part of your selection process should have been to identify a vendor that adds value during the implementation process. This guidance needs to be paid for, of course, so make sure that you have budgeted for it.
Methodology before technology is the key reminder for virtually all IT projects, particularly WMS projects. Ensure that your warehouse is running in an optimal manner with tried and tested processes before trying to imple-ment a WMS: otherwise expect failure! That is not to say you cannot intro-duce new and better processes while implementing a WMS – this is often the case – but if your warehouse is disorganized, tackle that problem before doing anything else. Do not automate a bad process: you just get the wrong result faster.
In the case of a greenfield operation, methodology before technology is not normally possible as timescales are tight. Here it is vital to have a strong and experienced management team with a logistics background. In addition, you may want to use the services of a specialist consultant or an interim manager. Interim management can be a very cost-effective way of providing the extra resource needed in this change management process.
The scope of the project should be documented. The scope is just building on the WMS description you wrote for your RFI, ie what you want the system to do for your business. This need not be an arduous or tedious task
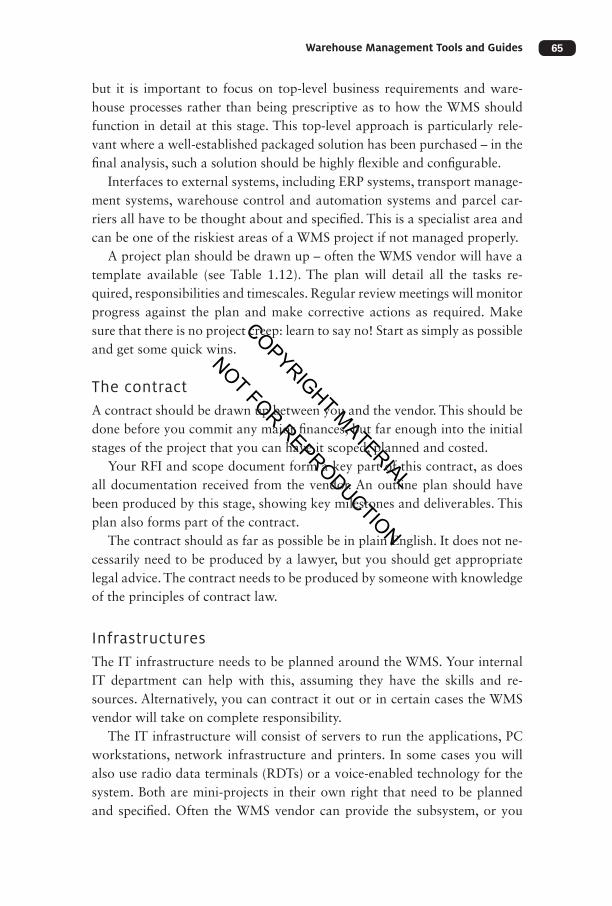
COPYRIGHT MATERIAL
NOT FOR REPRODUCTION
Warehouse Management Tools and Guides 65
but it is important to focus on top-level business requirements and ware-house processes rather than being prescriptive as to how the WMS should function in detail at this stage. This top-level approach is particularly rele-vant where a well-established packaged solution has been purchased – in the final analysis, such a solution should be highly flexible and configurable.
Interfaces to external systems, including ERP systems, transport manage-ment systems, warehouse control and automation systems and parcel car-riers all have to be thought about and specified. This is a specialist area and can be one of the riskiest areas of a WMS project if not managed properly.
A project plan should be drawn up – often the WMS vendor will have a template available (see Table 1.12). The plan will detail all the tasks re-quired, responsibilities and timescales. Regular review meetings will monitor progress against the plan and make corrective actions as required. Make sure that there is no project creep: learn to say no! Start as simply as possible and get some quick wins.
The contractA contract should be drawn up between you and the vendor. This should be done before you commit any major finances, but far enough into the initial stages of the project that you can have it scoped, planned and costed.
Your RFI and scope document form a key part of this contract, as does all documentation received from the vendor. An outline plan should have been produced by this stage, showing key milestones and deliverables. This plan also forms part of the contract.
The contract should as far as possible be in plain English. It does not ne-cessarily need to be produced by a lawyer, but you should get appropriate legal advice. The contract needs to be produced by someone with knowledge of the principles of contract law.
InfrastructuresThe IT infrastructure needs to be planned around the WMS. Your internal IT department can help with this, assuming they have the skills and re-sources. Alternatively, you can contract it out or in certain cases the WMS vendor will take on complete responsibility.
The IT infrastructure will consist of servers to run the applications, PC workstations, network infrastructure and printers. In some cases you will also use radio data terminals (RDTs) or a voice-enabled technology for the system. Both are mini-projects in their own right that need to be planned and specified. Often the WMS vendor can provide the subsystem, or you
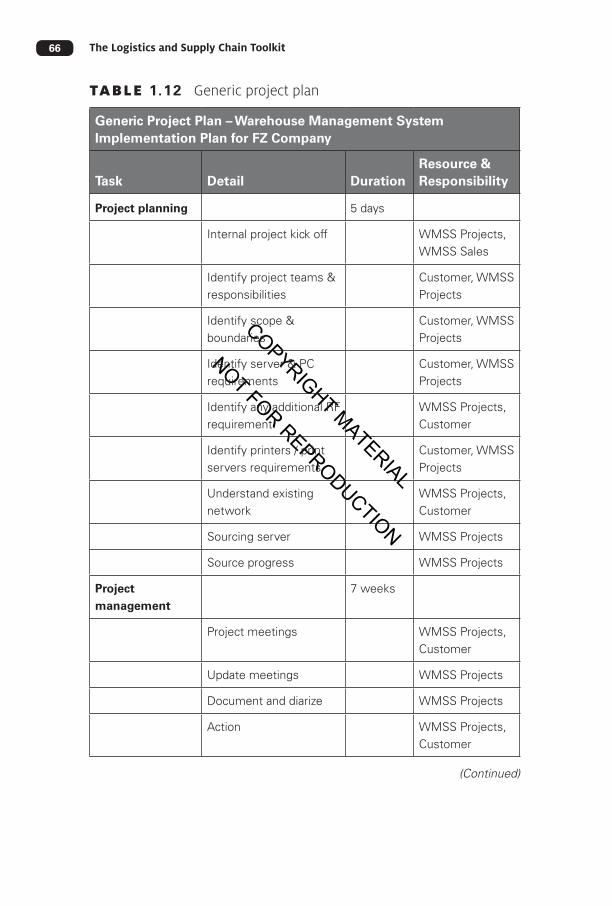
COPYRIGHT MATERIAL
NOT FOR REPRODUCTION
The Logistics and Supply Chain Toolkit66
TABLE 1.12 Generic project plan
Generic Project Plan – Warehouse Management System Implementation Plan for FZ Company
Task Detail DurationResource & Responsibility
Project planning 5 days
Internal project kick off WMSS Projects, WMSS Sales
Identify project teams & responsibilities
Customer, WMSS Projects
Identify scope & boundaries
Customer, WMSS Projects
Identify server & PC requirements
Customer, WMSS Projects
Identify any additional RF requirement
WMSS Projects, Customer
Identify printers / print servers requirements
Customer, WMSS Projects
Understand existing network
WMSS Projects, Customer
Sourcing server WMSS Projects
Source progress WMSS Projects
Project management
7 weeks
Project meetings WMSS Projects, Customer
Update meetings WMSS Projects
Document and diarize WMSS Projects
Action WMSS Projects, Customer
(Continued)

COPYRIGHT MATERIAL
NOT FOR REPRODUCTION
Warehouse Management Tools and Guides 67
Generic Project Plan – Warehouse Management System Implementation Plan for FZ Company
Task Detail DurationResource & Responsibility
Identify RF Hardware
2 days
RF survey Hardware vendor
Design overall hardware configuration
Customer, WMSS Projects
Order equipment Customer
Configuration/consultancy
3 days
Identify existing/ proposed business processes
WMSS Projects, Customer
Business process document
WMSS Projects, Customer
Present – process overview
WMSS Projects, Customer
Acceptance/gap analysis WMSS Projects, Customer
Configuration WMSS Projects
Interface (if any) 2 days
Specify & agree interface requirements
WMSS Projects
Installation & commission
7 days
Server available Customer
Remote access implemented
WMSS Technical/Customer
Install progress WMSS Deployment
TABLE 1.12 Generic project plan (Continued)
(Continued)

COPYRIGHT MATERIAL
NOT FOR REPRODUCTION
The Logistics and Supply Chain Toolkit68
Generic Project Plan – Warehouse Management System Implementation Plan for FZ Company
Task Detail DurationResource & Responsibility
Deploy standard WMS WMSS Deployment
Application, data, menus, scripts
WMSS Deployment
Shutdown, truncate, back-up etc
WMSS Deployment
Create deployment document for support
WMSS Deployment
Data collection sheet Customer
Interface (if any) 3 days
Develop & test interface WMSS Devt, WMSS Projects
Install WMSS Deployment
Training 15 days
Training on full system WMSS Trainer, Customer
General guides – WMSS & Warehousing
WMSS Projects, Customer
STP & datahub overview WMSS Projects, Customer
Basic data set-up WMSS Projects, Customer
Inbound processes WMSS Projects, Customer
Outbound processes WMSS Projects, Customer
In-house processes WMSS Projects, Customer
(Continued)
TABLE 1.12 Generic project plan (Continued)

COPYRIGHT MATERIAL
NOT FOR REPRODUCTION
Warehouse Management Tools and Guides 69
Generic Project Plan – Warehouse Management System Implementation Plan for FZ Company
Task Detail DurationResource & Responsibility
Train the users Customer
Change management Customer
Go-live preparation
2 days
Create implementation plan
WMSS Projects, Customer
Resourcing WMSS Projects, Customer
Determine & source necessary consumables
WMSS Projects, Customer
Data entry support
10 days
Locate and harvest static data
Customer
Preliminary dynamic data WMSS Projects, Customer
Full data take-on WMSS Projects, Customer
Stock take pre go live Customer
Documentation 1 day
Document revisions to user manual
WMSS Projects
System live 3 days
Go-live support WMSS Projects
Project summary meeting
WMSS Projects, Customer
Project review meeting
1 day WMSS Projects, Customer
Total days 54 days WMSS Projects
TABLE 1.12 Generic project plan (Continued)

COPYRIGHT MATERIAL
NOT FOR REPRODUCTION
The Logistics and Supply Chain Toolkit70
may prefer your IT supplier to provide the wireless network backbone and then the WMS vendor or hardware vendor provides the necessary equip-ment. Note that if you are considering a SaaS, the software will be run on the vendor’s server to which you will have remote access.
Pilot projectSet up a pilot project, either as a conference room pilot or ideally in the warehouse itself. Focus on one customer, one product group or one func-tion, such as receiving. Create a test plan and continue to test to ensure that the system is operating as required and that operatives understand the system and are working optimally.
Start working out how you are going to do a ‘data take-on’, ie all the data you need to start and run the system, including locations, location maps, product codes, product details, pallet sizes and configurations. A lot of these data can come from your ERP system. You can construct spreadsheet tem-plates to compile them. You also need to start planning the ‘rules’ within the warehouse, for example put-away rules, replenishment rules, FIFO, LIFO, etc. If you are moving into a warehouse with existing stock, consider how you are going to label and record this stock.
Remember that you are testing for failure as well as testing for success. This is an ideal opportunity to test the interfaces to external systems; inter-face testing invariably takes longer than planned.
Ensure that you train the trainers or super users and then cascade the training down to the users; this way, you will build your in-house expertise.
Going liveThe go-live stage needs to be planned carefully. Go live can be a ‘big bang’ or can be phased, according to the nature of your operation. You are likely to need extra personnel during this period. Budget very carefully for the on-site support you may need from the WMS vendor; costs can escalate in this area, particularly for out-of-hours, evening and weekend support. It is likely that your perform-ance levels will be low to start with until the operation has moved up the learning curve; for this reason it is best to go live during a quiet period if pos-sible, although ensure that your key personnel are not on holiday at this time.
In summaryAs with all system projects, and indeed projects in general, the more you plan and prepare, the better your results will be. Supplier selection is the

COPYRIGHT MATERIAL
NOT FOR REPRODUCTION
Warehouse Management Tools and Guides 71
crux of a successful project along with good project management and good project ownership. Obal (2001) says that during implementation the fol-lowing have to be avoided:
●● establishing an unrealistic implementation schedule;
●● buying a low-end system and expecting high-end results;
●● failing to track vendor progress;
●● failing to develop a contingency plan;
●● overselling the system to users;
●● lack of system integration training;
●● providing the software vendor with faulty, incomplete or out-of-date data;
●● thinking a newly integrated WMS will eliminate all inefficiencies within the operation;
●● blaming the WMS provider for glitches that occur during the software’s initial launch;
●● failing to audit the results to see if the system is working as efficiently as possible.
(Adapted from JDA and a white paper written by Stephen Cross and repro-duced with his permission.)
Further informationFor additional information visit www.JDA.com
ReferenceObal, P (2001) Selecting Warehouse Software from WMS & ERP, http://www.
cenglobal.com/atms/wp-content/uploads/2015/04/chapter-12-systems.pdf
1.18 Warehouse maturity scan, by Jeroen van den Berg
IntroductionThis tool enables companies to assess the maturity of their warehouse oper-ations (an introduction to maturity models is given in tool 4.7). The model

COPYRIGHT MATERIAL
NOT FOR REPRODUCTION
The Logistics and Supply Chain Toolkit72
comes from Highly Competitive Warehouse Management by Jeroen van den Berg (2012). In his book he makes a distinction between four phases of warehouse maturity:
●● Phase 1 – Reactive. The warehouse is not well structured.
●● Phase 2 – Effective. Processes are streamlined with more transparency in the operation.
●● Phase 3 – Responsive. Processes are better planned and controlled by the use of intelligent IT.
●● Phase 4 – Collaborative. The warehouse is an equal partner in the supply chain and generates more added value.
When to useThe scan can be used to assess the maturity of a distribution centre.
How to useThe assessment requires answers to 18 specific questions about your current warehouse operation. The four answers to each question represent an in-creasing level of sophistication. If you believe that your operation ranks in between two answers, you should select the lowest answer; for example, if your distribution centre almost meets the requirements of answer c but not completely, then choose answer b.
Example questionAre services and service level agreements (SLAs) formally defined for the distribution centre?
a No, we do not distinguish services and SLAs.
b Somewhat, we do have a few SLAs (response time, accuracy) for some clients/customers.
c Yes, we use a complete list of all available warehouse services and associated service levels for all clients/customers.
d Yes, we use a complete list of all available warehouse services and associated service levels for all clients/customers and charge fees per individual service.
A comprehensive maturity model can be completed online at http://www.jvdbconsulting.com/english/research/46-maturity-model.html

COPYRIGHT MATERIAL
NOT FOR REPRODUCTION
Warehouse Management Tools and Guides 73
A full supply chain maturity scan can be completed at http://www.jvdb-consulting.com/english/supply-chain-maturity-scan.html
Referencevan den Berg, J P (2012) Highly Competitive Warehouse Management: An action
plan for best-in-class performance, Management Outlook Publishing, Utrecht, Netherlands
1.19 Warehouse risk assessments
IntroductionWarehouses, like any industrial facility, can be dangerous places to work in, especially with the movement of forklift trucks, the risk of slips and trips, and people working at height. So, to ensure a safe and secure environment, companies need to undertake risk assessments regularly. (A full description of risk assessment is included in tool 4.12.) Note that:
●● a hazard can be anything – whether work materials, equipment, work methods or practices – that has the potential to cause harm;
●● a risk is the chance, high or low, that somebody may be harmed by the hazard.
The following are potential risk areas:
●● falls from height;
●● slips, trips and falls;
●● manual handling;
●● falling objects;
●● operation of MHE;
●● operation of other machinery;
●● traffic movements;
●● portable electrical equipment;
●● lighting;
●● hazardous substances; and
●● fire.
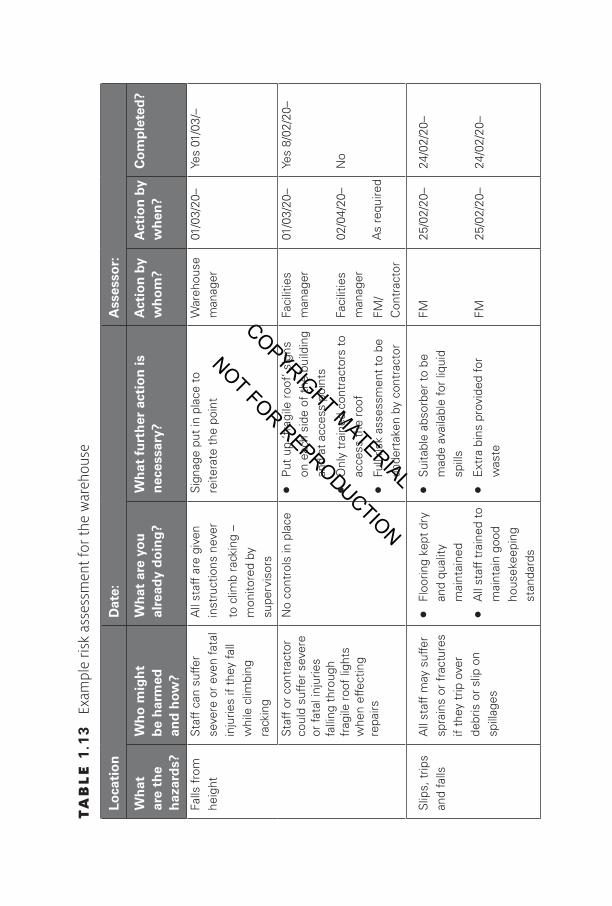
COPYRIGHT MATERIAL
NOT FOR REPRODUCTION
TA
BL
E 1
.13
Ex
ampl
e ris
k as
sess
men
t for
the
war
ehou
se
Loca
tio
nD
ate:
Ass
esso
r:
Wh
at
are
the
haz
ard
s?
Wh
o m
igh
t
be
har
med
an
d h
ow?
Wh
at a
re y
ou
al
read
y d
oin
g?
Wh
at f
urt
her
act
ion
is
nec
essa
ry?
Act
ion
by
wh
om
?A
ctio
n b
y w
hen
?C
om
ple
ted
?
Falls
fro
m
heig
htS
taff
can
suf
fer
seve
re o
r ev
en fa
tal
inju
ries
if th
ey fa
ll w
hile
clim
bing
ra
ckin
g
All
staf
f ar
e gi
ven
inst
ruct
ions
nev
er
to c
limb
rack
ing
– m
onito
red
by
supe
rvis
ors
Sig
nage
put
in p
lace
to
reite
rate
the
poi
ntW
areh
ouse
m
anag
er01
/03/
20–
Yes
01/0
3/–
Sta
ff o
r co
ntra
ctor
co
uld
suffe
r se
vere
or
fata
l inj
urie
s fa
lling
thr
ough
fr
agile
roo
f lig
hts
whe
n ef
fect
ing
repa
irs
No
cont
rols
in p
lace
●●
Put
up ‘f
ragi
le r
oof’
sig
ns
on e
ach
side
of
the
build
ing
and
at a
cces
s po
ints
●●
Onl
y tr
aine
d co
ntra
ctor
s to
ac
cess
the
roo
f
●●
Full
risk
asse
ssm
ent
to b
e un
dert
aken
by
cont
ract
or
Faci
litie
s m
anag
er
Faci
litie
s m
anag
er
FM/
Con
trac
tor
01/0
3/20
–
02/0
4/20
–
As
requ
ired
Yes
8/02
/20–
No
Slip
s, t
rips
an
d fa
llsA
ll st
aff
may
suf
fer
spra
ins
or f
ract
ures
if
they
trip
ove
r de
bris
or
slip
on
spill
ages
●●
Floo
ring
kept
dry
an
d qu
ality
m
aint
aine
d
●●
All
staf
f tr
aine
d to
m
aint
ain
good
ho
usek
eepi
ng
stan
dard
s
●●
Sui
tabl
e ab
sorb
er t
o be
m
ade
avai
labl
e fo
r liq
uid
spill
s
●●
Ext
ra b
ins
prov
ided
for
was
te
FM FM
25/0
2/20
–
25/0
2/20
–
24/0
2/20
–
24/0
2/20
–

COPYRIGHT MATERIAL
NOT FOR REPRODUCTION
Warehouse Management Tools and Guides 75
When to useTo ensure the safety of all visitors to, and staff working in, a warehouse.
How to useThe guiding principles that should be considered throughout the risk assess-ment process can be broken down into a series of steps:
●● Step 1: Identifying hazards and those at risk.
●● Step 2: Evaluating and prioritizing risks.
●● Step 3: Deciding on preventive action.
●● Step 4: Taking action.
●● Step 5: Monitoring and reviewing.
As can be seen in the risk assessment form in Table 1.13, it is essential that there is a suitable person responsible for the action to be taken, and that a target date is set for completion. We have completed part of the form as an example. The form can be downloaded from http://howtologistics.com, discount code lsct0104
Further information
●● http://osha.europa.eu/topics/riskassessment
●● http://www.hse.gov.uk/risk/
●● http://www.hse.gov.uk/toolbox/index.htm
●● http://www.osha.gov/Publications/3220_Warehouse.pdf
1.20 How to ‘green’ your warehouse and save energy
IntroductionIn recent years environmental issues have come to the fore, both at home and at work, with corporate social responsibility (CSR) initiatives concen-trating on the environment, waste, health and safety, and the local commu-nity. The introduction of these initiatives does not have to cost the earth. In the majority of cases there are grants and significant opportunities for cost saving as well as the resulting reduction of the company’s impact on the environment.

COPYRIGHT MATERIAL
NOT FOR REPRODUCTION
The Logistics and Supply Chain Toolkit76
The following list provides warehouse managers with ideas on how to reduce their impact on the environment and thus help companies achieve their CSR targets and save energy:
●● Lighting in a non-automated warehouse can be up to 70 per cent of the total energy costs. Ways to reduce lighting costs are as follows:
●– Introduce energy-efficient lighting.
●– Switch off all non-essential lighting out of business hours.
●– Install movement sensors and timers.
●– Introduce and regularly clean skylights and clerestory windows to increase the use of natural light.
●– Switch off lights when daylight is sufficient.
●– Turn off external lights when daylight is sufficient.
●– Switch off office lights on exit or introduce motion sensors.
●● Use of alternative energy production methods:
●– solar panels;
●– wind turbines;
●– biomass boilers.
●● Heating/air conditioning can make up 15 per cent of a warehouse’s energy costs:
●– Use zoned and time-controlled thermostats that are set accurately (a 1 per cent reduction in temperature on the thermostat can reduce heating bills by 8 per cent).
●– Experiment with switch-on times for heating and air conditioning and switch off well before close of business.
●– Ensure hot water supply is sized in relation to site occupancy.
●● Install time controls on equipment that is not required after close of business, such as vending machines.
●● Use of natural ventilation systems:
●– using ventilation stacks;
●– atria and automatic window openings combined with automatic control systems;
●– passive cooling such as breathable walls;
●– using the effective thermal mass of buildings to reduce cooling and ventilation energy.
●● Cooling the warehouse can also increase energy costs:

COPYRIGHT MATERIAL
NOT FOR REPRODUCTION
Warehouse Management Tools and Guides 77
●– Introduce sunlight reflectors.
●– Use mobile air handling units.
●– Switch off equipment when not in use.
●– Ensure all doors have sufficient seals to prevent air and water entry.
●● Make better use of resources:
●– Rain water collection for reuse in vehicle washing, toilets, etc.
●– Low water use in sanitary appliances.
●– Check insulation levels and increase where practical.
●– Reuse or recycle where feasible and cost-effective.
●– Move to utilizing plastic totes/bins in place of cardboard.
●– Utilize plastic or aluminium pallets.
●– Use of gas, electric or hybrid forklift trucks.
●– In-rack charging for narrow aisle trucks and shuttle systems.
●● Movement reduction within the warehouse to reduce energy consumption:
●– Use of ABC analysis (see tool 1.3) to ensure that popular items are placed close to the dispatch area.
●● Kinetic-energy plates positioned on the access road to produce power from vehicles entering and leaving the site.
●● Introduce car-sharing schemes for staff.
●● Encourage staff to walk or cycle to work or take public transport.
●● Introduce training in green initiatives such as fuel-efficient driving.
●● Source materials locally, such as packaging, paper, MHE, etc.
●● Continually assess the situation by walking around the warehouse at various times during operating hours.
●● Plant trees and shrubs to assist with the removal of emissions.
●● Finally, ensure that your warehouse is operating effectively – no unnecessary movements, accurate picking and dispatch, and effective utilization of space and packaging materials.
In the UK, the Carbon Trust Implementation Services provides expert support to warehouse and logistics companies that are looking to cut energy costs by implementing new lighting or heating equipment (see Figure 1.12 for its figures on energy usage in an SME warehouse). The new service introduces warehouses to established suppliers of energy-efficient equipment that are accredited by the Carbon Trust. It helps warehouse companies obtain a set of high-quality
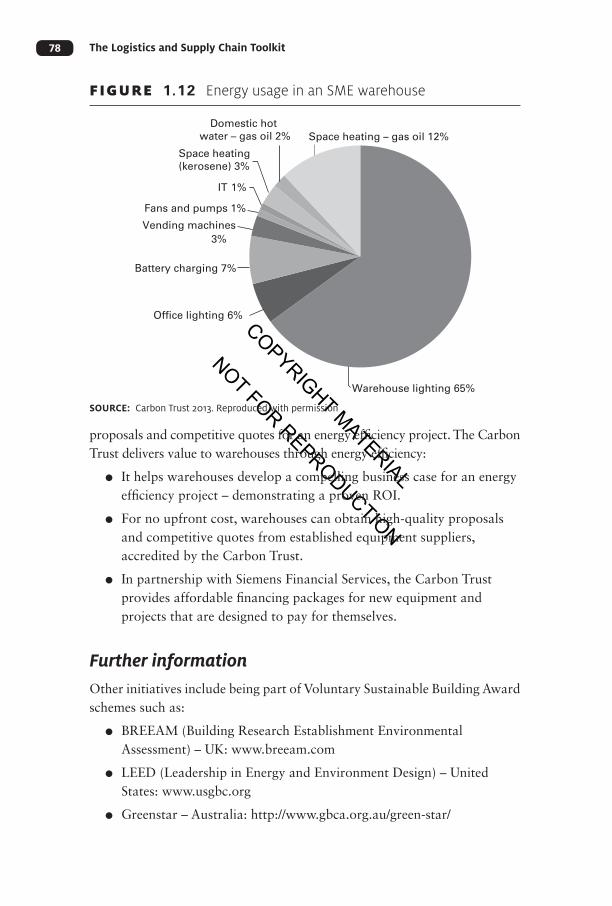
COPYRIGHT MATERIAL
NOT FOR REPRODUCTION
The Logistics and Supply Chain Toolkit78
proposals and competitive quotes for an energy efficiency project. The Carbon Trust delivers value to warehouses through energy efficiency:
●● It helps warehouses develop a compelling business case for an energy efficiency project – demonstrating a proven ROI.
●● For no upfront cost, warehouses can obtain high-quality proposals and competitive quotes from established equipment suppliers, accredited by the Carbon Trust.
●● In partnership with Siemens Financial Services, the Carbon Trust provides affordable financing packages for new equipment and projects that are designed to pay for themselves.
Further informationOther initiatives include being part of Voluntary Sustainable Building Award schemes such as:
●● BREEAM (Building Research Establishment Environmental Assessment) – UK: www.breeam.com
●● LEED (Leadership in Energy and Environment Design) – United States: www.usgbc.org
●● Greenstar – Australia: http://www.gbca.org.au/green-star/
Warehouse lighting 65%
Office lighting 6%
Battery charging 7%
Vending machines
Fans and pumps 1%
IT
Space heating (kerosene) 3%
Domestic hot water – gas oil 2% Space heating – gas oil 12%
1%
3%
FIGURE 1.12 Energy usage in an SME warehouse
SOURCE: Carbon Trust 2013. Reproduced with permission

COPYRIGHT MATERIAL
NOT FOR REPRODUCTION
Warehouse Management Tools and Guides 79
●● CASBEE (Comprehensive Assessment System for Built Environment Efficiency) – Japan: http://www.ibec.or.jp/CASBEE/english/index.htm
Referenceshttp://www.carbontrust.com/www.ukwa.org.uk
1.21 Hazardous packaging and labelling
The consignor/supplier is responsible for ensuring that packaging of haz-ardous items conforms to the regulations for the product. The packaging can vary from a cardboard box or paper bag for low-risk powders in small quantities to very sophisticated double-skinned stainless steel packages for more complex high-risk products.
To promote the safe storage and transportation of dangerous goods, an international system of classification has been introduced (The UN Classification System). Examples are:
●● UN1263: Paint or paint-related materials
●● UN1498: Sodium nitrate
●● UN1500: Sodium nitrite
The system divides the different types of dangerous goods into classified groups, each group identified by a code marking. There are nine classes, some with divisions, as shown in Table 1.14.
In general, the package needs to be UN approved and compatible with the product. For every UN number there is a list of packaging options avail-able to the packer.
All over the world there are different laws on how to identify the haz-ardous properties of chemicals (called ‘classification’) and how information about these hazards is then passed to users (through labels and safety data sheets for workers). This can be confusing because the same chemical can have different hazard descriptions in different countries; for example, a chemical could be labelled as ‘toxic’ in one country but not in another. This also acts as a barrier to international trade.
Given the expanding international market in chemical substances and mix-tures, to help protect people and the environment and to facilitate trade, the United Nations has developed a ‘Globally Harmonized System’ (GHS) on clas-sification and labelling. The GHS is a single worldwide system for classifying

COPYRIGHT MATERIAL
NOT FOR REPRODUCTION
The Logistics and Supply Chain Toolkit80
TABLE 1.14 Hazardous classes
Class Type of material
1 Explosive substances and articles
2.1 Flammable gas (eg butane)
2.2 Non-fl ammable and non-toxic gases which could cause asphyxiation (eg nitrogen, helium, carbon dioxide) or oxidizers (eg oxygen)
2.3 Toxic gases (eg chlorine, phosgene)
3 Flammable liquids (eg lighter fl uid, petrol)
4.1 Flammable solids, self-reactive substances and solid desensitized explosives
4.2 Substances liable to spontaneous combustion
4.3 Substances which, in contact with water, emit fl ammable gases
5.1 Oxidizing substances
5.2 Organic peroxides
6.1 Toxic substances
6.2 Infectious substances
7 Radioactive material
8 Corrosive substances
9 Miscellaneous dangerous substances and articles
and communicating the hazardous properties of industrial and consumer chem-icals. GHS sits alongside the UN Transport of Dangerous Goods system. The GHS is not a law – it’s an international agreement. To make the GHS legally apply, each country or bloc of countries must adopt the GHS through legisla-tion. EU Member States agreed to adopt the GHS across the EU through a direct-acting Regulation, the European Regulation (EC) No 1272/2008 on Classifi cation, Labelling and Packaging of substances and mixtures. This is also known as the ‘CLP Regulation’ or just ‘CLP’. This will fi nally lead to a reduction in the regulatory burden on manufacturers, which currently have to struggle with many different systems of classifi cation depending on the countries they manufacture in and export to. Figure 1.13 shows the new pictograms.

COPYRIGHT MATERIAL
NOT FOR REPRODUCTION
Warehouse Management Tools and Guides 81
Further information
●● UK – www.hse.gov.uk/ghs/
●● United States – https://www.osha.gov/dsg/hazcom/pictograms/index.html
●● EU – http://ec.europa.eu/enterprise/sectors/chemicals/classification/index_en.htm
●● Details regarding hazardous goods transportation can be found in tool 2.13.
GHS Pictograms and Hazard Classes
• Oxidizers • Flammables • Self Reactives • Pyrophorics • Self-Heating
• Explosives • Self Reactives • Organic Peroxides
• Emits Flammable Gas • Organic Peroxides
• Acute toxicity (severe) • Corrosives • Gases Under Pressure
• Carcinogen • Respiratory Sensitizer • Reproductive Toxicity • Target Organ Toxicity • Mutagenicity • Aspiration Toxicity
• Environmental Toxicity • Irritant • Dermal Sensitizer • Acute toxicity (harmful) • Narcotic Effects • Respiratory Tract • Irritation
FIGURE 1.13 GHS pictograms
SOURCE: reproduced from United States Department of Labor (nd)Reproduced from http://www.osha.gov/dsg/hazcom/ghs.html

COPYRIGHT MATERIAL
NOT FOR REPRODUCTION
The Logistics and Supply Chain Toolkit82
ReferenceUnited States Department of Labor (nd) [accessed 9 May 2013] A Guide to The
Globally Harmonized System of Classification and Labelling of Chemicals
(GHS), Occupational Safety and Health Administration, Washington, DC, https://www.osha.gov/dsg/hazcom/ghsguideoct05.pdf