Embed Size (px)
Citation preview

Building on the ndings of a
study on the water supply
and governance situation in
six towns across India
Context
In India, out of the total population of 1.21
billion (as on 1 March 2011), about 377.1
million people live in urban areas, with a
net addition of 91 million people in just
one decade (2001–2011). The percentage
of urban population, according to the
Census 2011, stands at 31.6 per cent of 1
the total population .
Within the urban demography, the results
of Census 2011 also reveal that between
2001 and 2011 there has been a
significant increase in the number of
towns across India. A total of 2,774 towns
(242 statutory and 2,532 census towns)
have been added to the existing 5,161
towns because of the change in their
demographic and workforce
characteristics. Unlike earlier decades
where urban population growth was
noticeable in metropolitan cities, this new
urban growth is occurring outside these
areas, resulting in the existing small cities
and towns growing at a much faster rate
than the metropolises and big cities.
With such a significant growth in the
demographic and workforce
characteristics in most towns, especially
the statutory towns, the demand for
amenities and key services is also
increasing. While the municipalities in
urban local bodies have been divided as
municipal corporations/ nagar nigams
(for large urban areas), municipal
councils/ nagar palika parishads (for
medium-sized urban areas) and notified
area councils/ nagar panchayats (for small
town areas in transition from rural to
urban settings) to improve their
performance and address the problems of
the communities effectively, urban
governance and the public services
delivery systems have not grown
adequately and equipped themselves to
1 http://mohua.gov.in/cms/urban-growth.php
WASH service delivery in small and medium towns
Policy insights and recommendations for
Jal Jeevan Mission and Swachh Bharat Mission 2.0
1
Wa
terA
id /
Sri
shti
Bh
ara
dw
aj
To throw light on the existing scenario of
WASH governance, drinking water
infrastructure, and service delivery situations
in small and medium towns across the
country, WaterAid India conducted an in-depth
study of six small and medium towns in four
different geographical regions of India. The
study named 'Assessment of drinking water
situation, governance and service delivery
infrastructure in small and medium towns'
intended to provide insights and guidance to
various actors to improve WASH services with
a focus on drinking water supply, and to build
a case for political attention to these otherwise
less attended urban segments. This policy
note is based on the findings from this study,
supplemented with a review of available
literature on WASH governance and the
existing scenario in small and medium towns,
with emphasis on vulnerable and marginalised
populations. This note intends to provide
relevant actors at the national, state, and local
body level with important insights and
necessary recommendations to help improve
WASH service delivery in thousands of small
and medium towns across the country and
achieve some of the specific objectives set out
under the flagship missions in urban
areas—the Jal Jeevan Mission and the Swachh
Bharat Mission 2.0. In addition, it intends to
contribute towards India achieving the United
Nations' Sustainable Development Goal
6—Ensure availability and sustainable
management of water and sanitation for all by
2030 and related goals.
meet the needs of this rapid
'urbanisation'. These settings do not have
the sufficient capacities and
arrangements to realise and act upon this
vast increase in demand for various public
services in a timely manner, leaving many
households unserved or underserved. The
small and medium town settings are
already inflicted with severe shortage of
basic services like potable water, well laid
out drainage systems, sewerage
networks, sanitation facilities, appropriate
solid waste disposal, and importantly,
human resources to plan and impart all
these. So there is an urgent need to
attend to these settings as part of our
urban focus; to meet their basic demands
around water, sanitation, and hygiene
(WASH) services and ensure the equitable 2and sustainable growth of urban India .
Given the substantial increase in
migration from rural areas to small and
medium towns for employment and
education in the past two decades, it is
important for various actors, from the
local to the national level, to understand
the existing scenarios associated with
basic necessities, especially with regard to
water supply and allied issues, and devise
action plans that ensure its sustainability
and meet the growing needs of these
populations.
32 https://www.wsp.org/content/targeting-urban-poor-and-improving-services-small-towns-0

In order to capture the perspectives of
households and communities on their
water supply and sanitation situation, a
total of six towns from various parts of
India were shortlisted. These were Bakshi
Ka Talab nagar panchayat (Uttar Pradesh),
Bodh Gaya nagar panchayat (Bihar),
Dindori nagar palika parishad (Madhya
Pradesh), Kanker nagar palika parishad
(Chhattisgarh), Chandbali notified area
council (Odisha), and Palamaner
municipality (Andhra Pradesh). Among the
selected six towns, Bakshi Ka Talab and
Palamaner were considered as medium
towns since their population ranges
between 50,000 and 1,00,000, while the
other four were considered as small towns
with populations ranging from 20,000 to 350,000 . Within these selected towns, a
total of 1,200 households were surveyed,
covering a comparatively larger sample
from medium towns, followed by
approximately six Key Informant
Interviews and one Focus Group
Discussion per town. The entire study
process was conducted between
September and November 2019. In
addition, shortlisted water samples from
each town were tested for their water
quality at an NABL-accredited laboratory.Ÿ To consolidate learning around critical
service gaps and suggest solutions
especially in the context of the poor
and other marginalised populations in
the small and medium towns of India.
Ÿ To understand the current mandates as
well as the policy, regulatory and legal
framework; specific functions; finances;
and functionaries allocated to the local
bodies in order to fulfil these
mandates.
Ÿ To understand sanitation systems at
individual and household levels as well
as community levels from a drinking
water safety point of view.
Ÿ To assess the drinking water supply
situation and service delivery in four
small and two medium towns. This
included assessment of the quantity
and quality of the water supplied.
In order to address the critical knowledge
gaps around the water supply situation,
governance, and service delivery in small
and medium towns of India and to
provide recommendations to municipal
bodies, water utilities, and governments,
WaterAid India conducted a study in 2019
in six small and medium towns spread
across India with the following objectives:
Brief description of the study
43 http://mohua.gov.in/upload/uploadfiles/files/URDPFI%20Guidelines%20Vol%20I.pdf

Policy and regulatory environment
for water supply and sanitation in
small and medium towns
In contrast, Andhra Pradesh was found to
be one of the pioneering study states to
have ground and surface water regulation
measures in place through the Water,
Land and Trees Act, 2002. However,
implementation of these policies by the
local bodies needs further attention in all
the study states.
In terms of regulation on groundwater
use, two states, namely Odisha and
Chhattisgarh, still await enactment of the
groundwater regulation bill.
Also, while all the study states have
adopted the national policy on faecal
sludge and septage management (FSSM)
as applicable to their states, the states'
FSSM-related actions appear to be limited
to cities and select Atal Mission for
Rejuvenation and Urban Transformation
(AMRUT) towns, leaving behind all the
small and medium towns.
When compared to their water policies,
the wastewater reuse and septage
management policies were recent and
drafted between 2016 and 2019 in five of
the six study states.
An assessment of the policy measures on
urban water supply and sanitation was
conducted across all the selected six study
towns through a review of existing state
policy on water, groundwater regulation,
water conservation, and solid and liquid
waste management. The key points that
emerged were that while the study states
had adopted relevant policies,
corresponding interventions and by laws
by the urban local bodies (ULBs) were
absent across states. It was also found
that the state water policies for some
states like Uttar Pradesh and Madhya
Pradesh were as old as 1999 and 2003
respectively (the Uttar Pradesh policy was
being revised at the time of preparing this
brief).
Key insights from
the study
5

Figure 1 : Access to drinking water supply by sources (in %)
16.1
86.3
36.7
0
9.4
34.4
30.5
8.3 1
3.3
30.6
0
21.1 2
8.9
17
67.2
0.4
10
26.7
24.4
4.4
22.2
8.3
0
22.8
73.3
45
32.1
30.3
Chandbali Palamaner Dindori BKT BodhGaya Kanker Total
Household Public PWS Public standposts Public Hand Pump Private Sources
Water supply service delivery by various
public and private sector organisations in
the form of individual piped water supply
(PWS) connections, public tap posts,
standposts, handpumps, borewells, and
wells was found to be varied across the
study towns. While Palamaner had the
highest number and proportion of
households dependent on public water
sources, Bakshi Ka Talab (BKT), with the
highest level of private water sources, had
the lowest reliance on publicly provided
water supply. Within the public water
supply service delivery, Palamaner was
the town with the highest number of
1. Acces water supply and sourcess to
Water supply service delivery
(Figure 1).
household-level piped water supply
connections, Kanker had the highest
proportion of households relying on
public tap posts or stand posts, and
Chandbali had the maximum population
primarily dependent on hand pumps.
Across all six towns, Bakshi Ka Talab was
the only study town that was found to not
have any provision for PWS. Overall, while
69.1 per cent of the study households in
the six study towns reported using public
water sources as their primary water
source, an important finding was that only
30.5 per cent of the 1,200 study
households in the six towns had access to
publicly provided household-level PWS,
with the situation varying between towns
6

(Figure 2a), though this varies heavily
private. These are mainly households of
100/- per household per month for this
service.
between towns.
Despite the availability of various public
and private water sources, the challenges
associated with accessing water from
these sources have made many
households dependent on tanker
based water supply, both public and
marginalised families located in the
periphery of the towns. The town
authorities of Kanker and Palamaner,
unlike the other four towns, provide
regular tanker-based water supply to the
last mile population while the other towns
use tanker-based supply seasonally to
address shortages. While Kanker supplies
it free of cost, Palamaner charges INR
via public piped water connections,
their household premises (86.3 per cent)
access to drinking water sources within
maximum number of households with
Palamaner was found to have the
community wells. In this respect,
standposts, public handpumps and
followed by Bakshi Ka Talab via private
borewells with submersible pumps. Of the
1,200 study households in the six study
towns, it was found that 43.2 per cent did
not have access to a drinking water
source within their household premises
Water sources inside household premises
2. Equity and inclusion in water supply
consisted of piped water connections,
private borewells with submersible
pumps, private handpumps and private
dug wells, while water sources outside
premises comprised public tap posts or
86.3
20
66.1
42.8
54.4
71.3
56.8
13.8
80 33.9
57.2
45.6
28.8
43.2
Palamaner Chandbali Kanker Dindori Bodh Gaya BKT Total
Water sources inside premises (%) Water sources outside premises (%)
Figure 2a : Access to drinking water sources (in %) within and outside household
premises in the six study towns. (n=1,200)
7
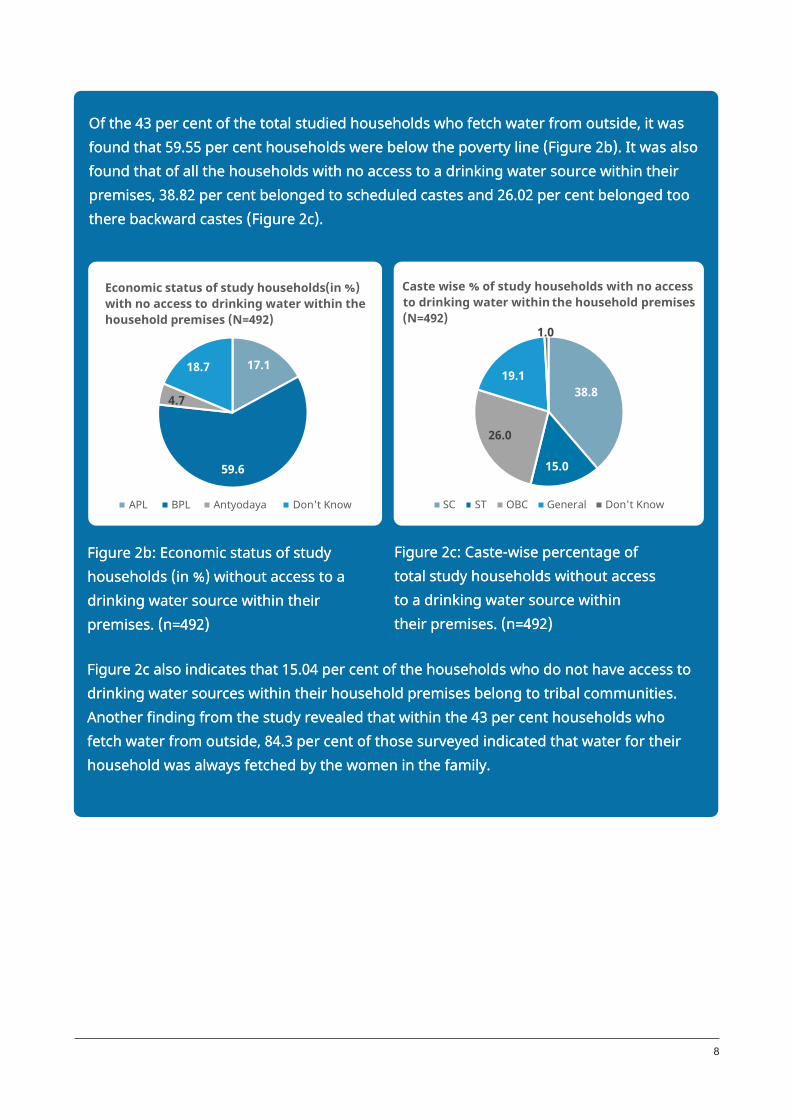
Figure 2c also indicates that 15.04 per cent of the households who do not have access to
drinking water sources within their household premises belong to tribal communities.
Another finding from the study revealed that within the 43 per cent households who
fetch water from outside, 84.3 per cent of those surveyed indicated that water for their
household was always fetched by the women in the family.
Figure 2b: Economic status of study
households (in %) without access to a
drinking water source within their
premises. (n=492)
Figure 2c: Caste-wise percentage of
total study households without access
to a drinking water source within
their premises. (n=492)
Economic status of study households(in %)
with no access to drinking water within the
household premises (N=492)
17.1
59.6
4.7
18.7
APL BPL Antyodaya Don't Know
38.8
15.0
26.0
19.1
1.0
Caste wise % of study households with no access
to drinking water within the household premises
(N=492)
SC ST OBC General Don't Know
Of the 43 per cent of the total studied households who fetch water from outside, it was
found that 59.55 per cent households were below the poverty line (Figure 2b). It was also
found that of all the households with no access to a drinking water source within their
premises, 38.82 per cent belonged to scheduled castes and 26.02 per cent belonged too
there backward castes (Figure 2c).
Figure 2b: Economic status of study
households (in %) without access to a
drinking water source within their
premises. (n=492)
Figure 2c: Caste-wise percentage of
total study households without access
to a drinking water source within
their premises. (n=492)
Figure 2c also indicates that 15.04 per cent of the households who do not have access to
drinking water sources within their household premises belong to tribal communities.
Another finding from the study revealed that within the 43 per cent households who
fetch water from outside, 84.3 per cent of those surveyed indicated that water for their
household was always fetched by the women in the family.
8
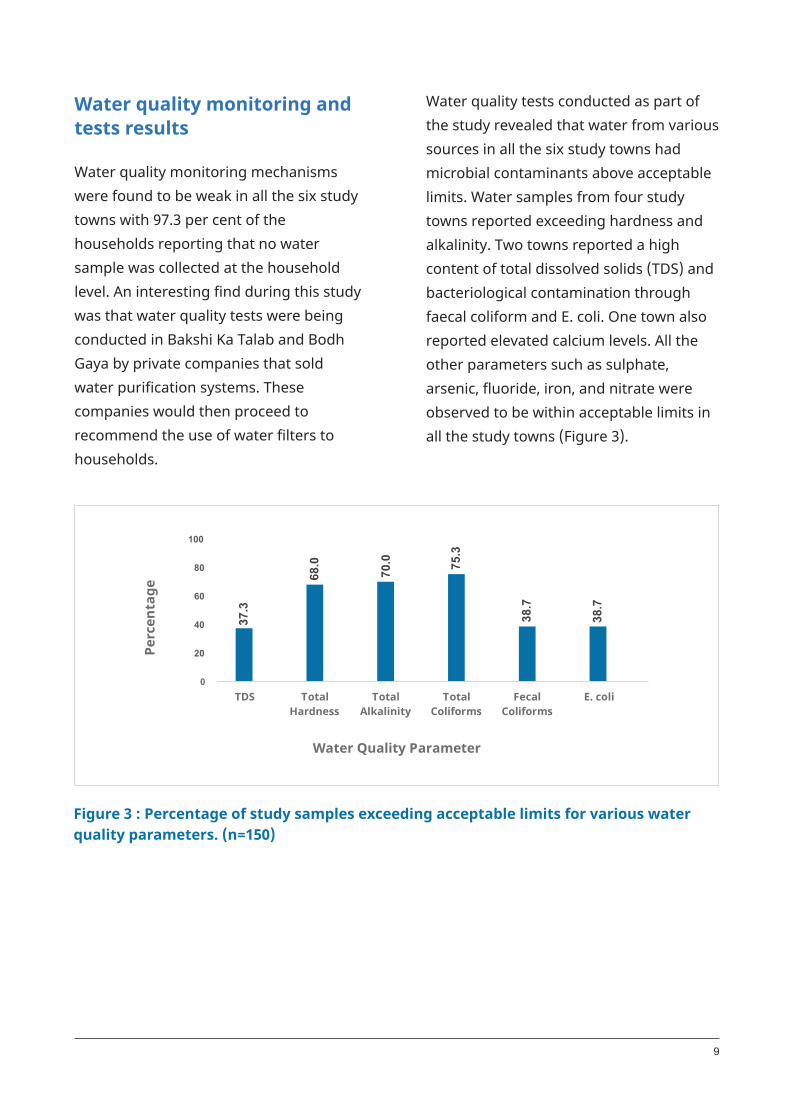
Water quality monitoring mechanisms
were found to be weak in all the six study
towns with 97.3 per cent of the
households reporting that no water
sample was collected at the household
level. An interesting find during this study
was that water quality tests were being
conducted in Bakshi Ka Talab and Bodh
Gaya by private companies that sold
water purification systems. These
companies would then proceed to
recommend the use of water filters to
households.
Water quality monitoring and
tests results
Water quality tests conducted as part of
the study revealed that water from various
sources in all the six study towns had
microbial contaminants above acceptable
limits. Water samples from four study
towns reported exceeding hardness and
alkalinity. Two towns reported a high
content of total dissolved solids (TDS) and
bacteriological contamination through
faecal coliform and E. coli. One town also
reported elevated calcium levels. All the
other parameters such as sulphate,
arsenic, fluoride, iron, and nitrate were
observed to be within acceptable limits in
all the study towns (Figure 3).
9
37.3
68.0
70.0 75.3
38.7
38.7
0
20
40
60
80
100
TDS Total
Hardness Alkalinity
Total Total
Coliforms
Fecal
Coliforms
E. coli
Pe
rce
nta
ge
Water Quality Parameter
Figure 3 : Percentage of study samples exceeding acceptable limits for various water
quality parameters. (n=150)

10
An interesting finding based on the water
quality results was that in Palamaner, the
study town with the maximum PWS
connections, all the 13 source samples
showed higher than acceptable levels of
TDS, hardness, alkalinity, magnesium, and
calcium. This possibly indicates that while
some of the medium towns are
forerunners in ensuring access to piped
water supply to all households under their
jurisdiction, their attention towards water
quality could be weaker.
Another finding was that bacteriological
contamination by total coliform and
chemical contamination due to hardness
and alkalinity was prevalent among all the
study towns. Since the six small and
medium towns were selected taking
diverse factors into consideration, findings
from this study could largely represent
most small and medium towns across the
country. Our overall findings infer that
water quality surveillance and
management across various small and
medium towns is possibly suboptimal and
needs attention.
Wa
terA
id /
Sri
shti
Bh
ara
dw
aj
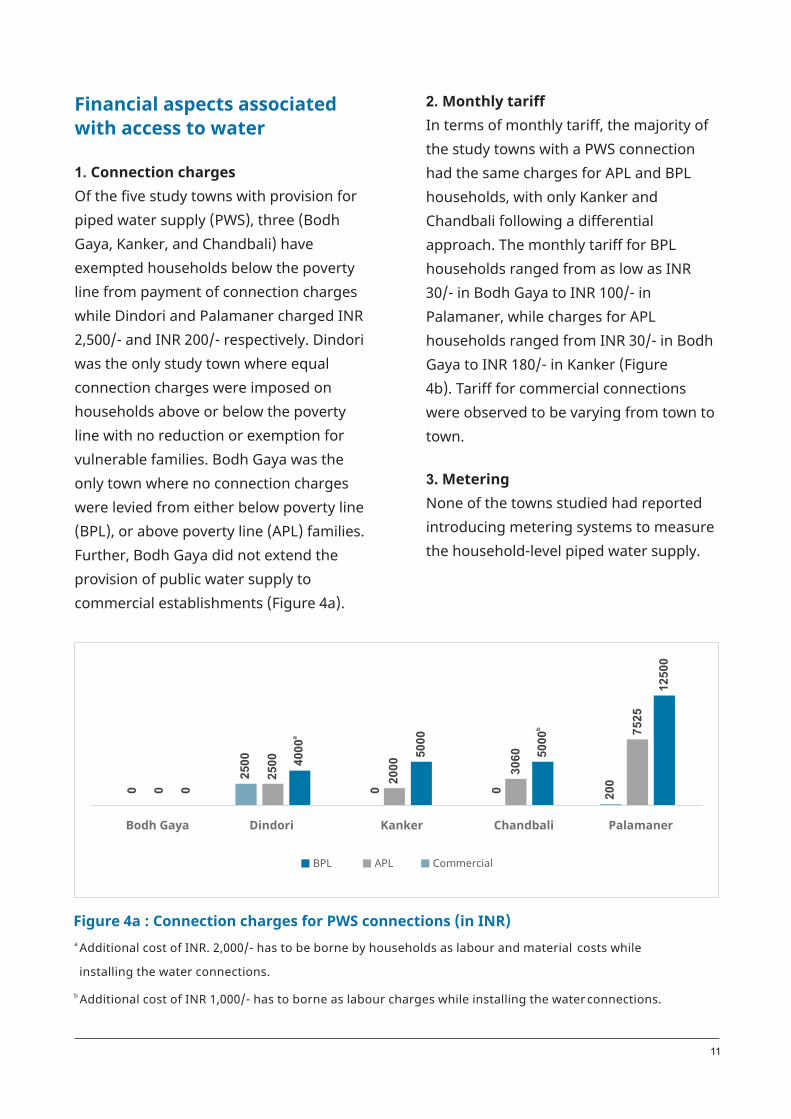
2,500/- and INR 200/- respectively. Dindori
was the only study town where equal
connection charges were imposed on
households above or below the poverty
line with no reduction or exemption for
vulnerable families. Bodh Gaya was the
only town where no connection charges
were levied from either below poverty line
(BPL), or above poverty line (APL) families.
Further, Bodh Gaya did not extend the
provision of public water supply to
commercial establishments (Figure 4a).
Financial aspects associated
with access to water
1. Connection charges
Of the five study towns with provision for
piped water supply (PWS), three (Bodh
Gaya, Kanker, and Chandbali) have
exempted households below the poverty
line from payment of connection charges
while Dindori and Palamaner charged INR
2. Monthly tariff
In terms of monthly tariff, the majority of
the study towns with a PWS connection
had the same charges for APL and BPL
households, with only Kanker and
Chandbali following a differential
approach. The monthly tariff for BPL
households ranged from as low as INR
30/- in Bodh Gaya to INR 100/- in
Palamaner, while charges for APL
households ranged from INR 30/- in Bodh
Gaya to INR 180/- in Kanker (Figure
4b). Tariff for commercial connections
were observed to be varying from town to
town.
3. Metering
None of the towns studied had reported
introducing metering systems to measure
the household-level piped water supply.
Figure 4a : Connection charges for PWS connections (in INR)
0
2500
0 0 200
0
2500
2000
3060
7525
0
a4000
5000
b5000
12500
Bodh Gaya Dindori Kanker Chandbali Palamaner
BPL APL Commercial
a Additional cost of INR. 2,000/- has to be borne by households as labour and material costs while
installing the water connections.
b Additional cost of INR 1,000/- has to borne as labour charges while installing the water connections.
11

Figure 4b : Monthly tariff for PWS connections (in INR).
30 8
0
60
50 1
00
30 8
0
18
0
96
10
0
0
25
0 36
0
32
9
80
0
Bodh Gaya Dindori Kanker Chandbali Palamaner
BPL APL Commercial
Reliability of water supplyIn terms of frequency, the least reliable
supply was in Palamaner, where water
was supplied once every two days for a
total of two hours. It was best in
Chandbali with water supplied twice a day
for a total of eight hours.
Impact of sanitation on
drinking water safetyThough a vast majority of urban centres
in India have achieved the open
defecation free (ODF) status, the study
found that only 80 per cent of the
surveyed households (HHs) reported
having a functional household toilet. This
indicates that the remaining households
were either dependent on community or
public toilets or defecated in the open.
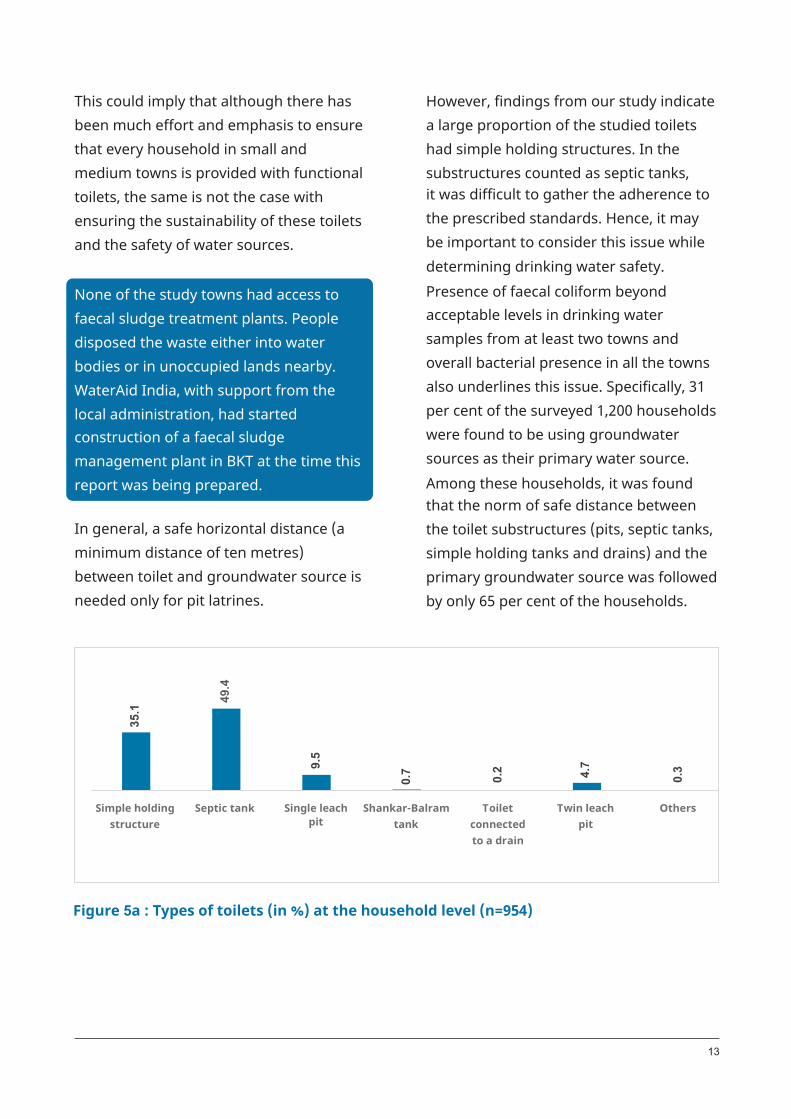
Out of all the study households with
functional toilets, 49.4 per cent reported
having a septic tank-based toilet structure
and approximately 35 per cent had simple
holding tanks (Figure 5a). While 80 per
cent of the studied households had access
to toilets within their premises, it was
found that 84.6 per cent of the total toilets
at household level were at an unsafe
distance (<10m) from their primary water
source (Figure 5b).
12
None of the study towns had access to
faecal sludge treatment plants. People
disposed the waste either into water
bodies or in unoccupied lands nearby.
WaterAid India, with support from the
local administration, had started
construction of a faecal sludge
management plant in BKT at the time this
report was being prepared.
In general, a safe horizontal distance (a
minimum distance of ten metres)
between toilet and groundwater source is
needed only for pit latrines.
This could imply that although there has
been much effort and emphasis to ensure
that every household in small and
medium towns is provided with functional
toilets, the same is not the case with
ensuring the sustainability of these toilets
and the safety of water sources.
acceptable levels in drinking water
samples from at least two towns and
overall bacterial presence in all the towns
also underlines this issue. Specifically, 31
per cent of the surveyed 1,200 households
were found to be using groundwater
sources as their primary water source.
Among these households, it was found
that the norm of safe distance between
the toilet substructures (pits, septic tanks,
simple holding tanks and drains) and the
primary groundwater source was followed
by only 65 per cent of the households.
it was difficult to gather the adherence to
the prescribed standards. Hence, it may
be important to consider this issue while
determining drinking water safety.
Presence of faecal coliform beyond
However, findings from our study indicate
a large proportion of the studied toilets
had simple holding structures. In the
substructures counted as septic tanks,
Figure 5a : Types of toilets (in %) at the household level (n=954)
35.1
49.4
9.5
0.7 0.2 4.7
0.3
Simple holding
structure
Septic tank Single leach
pit
Shankar-Balram
tank
Toilet
connected
to a drain
Twin leach
pit
Others
13
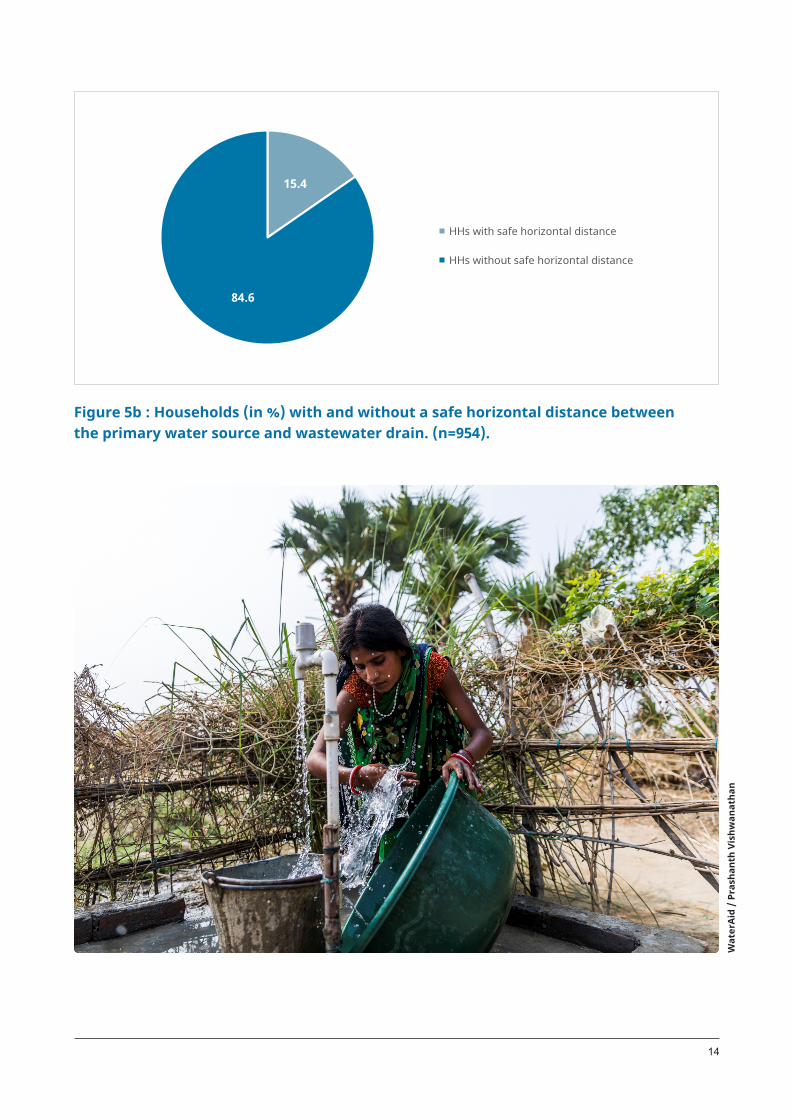
Figure 5b : Households (in %) with and without a safe horizontal distance between
the primary water source and wastewater drain. (n=954).
15.4
84.6
HHs with safe horizontal distance
HHs without safe horizontal distance
Wa
terA
id /
Pra
sha
nth
Vis
hw
an
ath
an
14
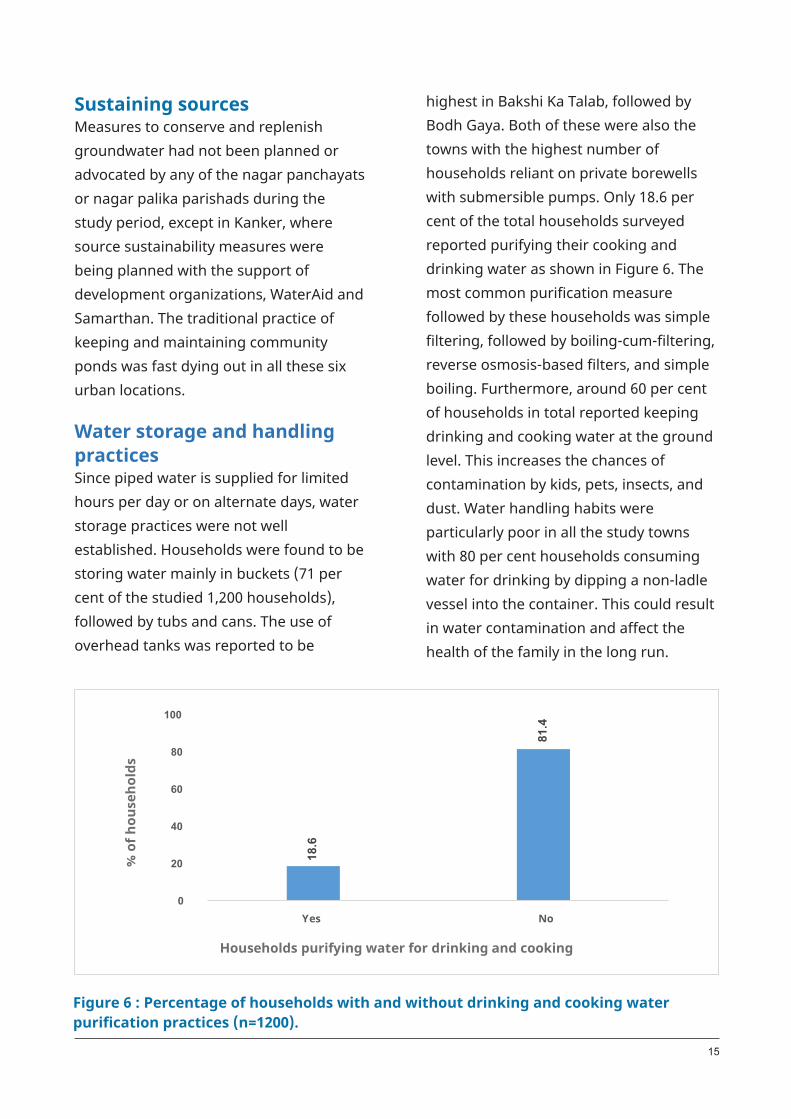
highest in Bakshi Ka Talab, followed by
Bodh Gaya. Both of these were also the
towns with the highest number of
households reliant on private borewells
with submersible pumps. Only 18.6 per
cent of the total households surveyed
reported purifying their cooking and
drinking water as shown in Figure 6. The
most common purification measure
followed by these households was simple
filtering, followed by boiling-cum-filtering,
reverse osmosis-based filters, and simple
boiling. Furthermore, around 60 per cent
of households in total reported keeping
drinking and cooking water at the ground
level. This increases the chances of
contamination by kids, pets, insects, and
dust. Water handling habits were
particularly poor in all the study towns
with 80 per cent households consuming
water for drinking by dipping a non-ladle
vessel into the container. This could result
in water contamination and affect the
health of the family in the long run.
Sustaining sourcesMeasures to conserve and replenish
groundwater had not been planned or
advocated by any of the nagar panchayats
or nagar palika parishads during the
study period, except in Kanker, where
source sustainability measures were
being planned with the support of
development organizations, WaterAid and
Samarthan. The traditional practice of
keeping and maintaining community
ponds was fast dying out in all these six
urban locations.
Water storage and handling
practicesSince piped water is supplied for limited
hours per day or on alternate days, water
storage practices were not well
established. Households were found to be
storing water mainly in buckets (71 per
cent of the studied 1,200 households),
followed by tubs and cans. The use of
overhead tanks was reported to be
18.6
81.4
0
20
40
60
80
100
Yes No
% o
f h
ou
seh
old
s
Households purifying water for drinking and cooking
Figure 6 : Percentage of households with and without drinking and cooking water
purification practices (n=1200).
15
Wa
terA
id /
Sri
shti
Bh
ara
dw
aj

Jal Jeevan Mission Goals and eventually
the Sustainable Development Goal 6,
collective action by the relevant local,
state, and central government actors, in
coordination with civil society
organisations and bilateral agencies, is
important.
Hence, drawing from the study findings
and literature review, WaterAid India
proposes the following recommendations
for various actors involved in this process,
keeping in mind the indicators of
Sustainable Development Goal 6 and
related other goals associated with
drinking water, sanitation, and hygiene
(WASH). Since the characteristics of the six
study towns broadly represent the
different types of small and medium
towns across the country, it is hoped that
these findings can be generalised in a
broad manner toaddress national, state,
and local-level policy and programmes for
WASH, with a focus on PWS in small and
medium town settings.
Ÿ There is a need to have a focussed
component within the Jal Jeevan
Mission for various categories of small
and medium towns, which are not
covered by AMRUT and similar schemes
currently. National allocation of funds
to states needs to be modified to
ensure adequate financial support for
the considerable number of small and
medium towns. This will help provide
universal access to functional
household-level tap connections and
the necessary operations and
Findings from the 'Assessment of
drinking water situation, governance
and service delivery infrastructure in
small and medium towns' study
conducted by WaterAid India in six
small and medium towns with different
characteristics present stark
differences in the way each of the six
study towns has provisioned and
prioritised piped water supply service
delivery for its population, yet the
challenges faced by them have certain
commonalities. It has shown that
access to safe drinking water (in small
and medium towns) is still a challenge
due to absent or poor household-level
piped water supply (PWS) coverage.
The study also indicates that sanitation
in these towns requires improvement if
they are to achieve the sustainable
development goals.
From this primary study and desk
research of the limited secondary
literature that is available on small and
medium towns, it can be inferred that
there is a huge need and scope for
developing sustainable PWS in these
settings and addressing the several
challenges identified. For these towns to
attain their maximum potential and
achieve universal, safe, and sustainable
PWS in a few years so as to reach the
Key policy
recommendations for
small and medium towns
17
maintenance under these schemes
and enable them to cover all the left-
out households and populations; a
large chunk of who belong to the
marginalised sections of society and
are reliant on public standposts to
meet their water needs. States should
be encouraged to plan their own
schemes or to top up the national level
schemes while ensuring that new PWS
connections are provided at a minimal
connection charge so that no
household is left behind. These
schemes can be extended to cover
commercial establishments and
market and public spaces as well.
Ÿ There is a clear need for ensuring
periodic water quality testing as an
inseparable element of piped water
supply. This is missing in most small
and medium town settings. There
should be clear and actionable
mandates, coupled with necessary
provisions in all these towns towards
this, including necessary human
resources, infrastructure, and
protocols. Special allocations should be
made for towns located in water
quality-affected geographies so that
the necessary technological or other
required strategies to address the
water quality issues can be deployed.
Ÿ Instead of water tankers, water supply
for the homeless or people living in
informal settlements could be provided
through overhead or ground-level
water tanks that store sufficient water
and provide running water at the
community level at all times. This will
help avoid overcrowding around water
tanks and ensure adequate supply for
everyone. Mobile water tankers from
quality-certified vendors could be used
for filling these stationary collection
tanks.
Ÿ There is a need to initiate and
strengthen ward and mohalla-level
community platforms in all small and
medium towns. This will ensure
participation across social groups.
Women and people from the most
vulnerable groups can take part in the
process of planning and imparting PWS
in their locality and lead various
measures for water security, sanitation,
hygiene initiatives and their
sustainability. Such structures can also
help in ensuring inclusion of all the left-
out groups and user-level monitoring
of equitable service provision.
Ÿ Installing water meters and introducing
usage-based tariffs have the potential
to limit water usage, limit water
scarcity, and ensure the sustainability
of PWS across the country in the long
run. However, the current pattern of
PWS connections in all the study towns
including small and medium towns,
should make universal metering
mandatory. While implementing
functional household tap connection
schemes in these town settings,
metering should be ensured as part of
all new household and commercial
18

Similarly, corrective measures in terms
of retrofitting, terrain-appropriate
toilet technologies, and safe sanitation
substructures can be brought to the
fore of the SBM 2.0 (urban) in these
settings as well.
Ÿ The study also highlighted the gaps in
terms of solid and liquid waste
management measures in these towns.
Under SBM 2.0 (urban), it will be
important to ensure clear guidelines
accompanied by necessary financial
provisions for various components
under these, such as grey water
management, stormwater
management and faecal sludge
management. This may also need to
include technologies for treatment and
reuse of wastewater. Legal and policy
gaps, wherever prevalent, need to be
addressed too, through appropriate
measures. During this process, it may
be important to ensure that
programmes should be solution-driven
and not just technology driven.
Ÿ In order to ensure planning and
implementation of water safety, to
manage PWS, and to ensure equitable
sanitation and hygiene services across
the town, it may be important to have
mandates and provisions for water
utility institutions that not only provide
and manage services but also regulate
the water and sanitation situation in
the town with appropriate authorities
for the same. A medium-term roadmap
may be developed to set up such
connections from the very beginning.
Meters should also be installed in
those households who already have
PWS connections to ensure universal
metering. The process of recording
and analysing the meter reading
should be institutionalised as well. A
gradual roadmap for linking tariffs to
usage can be developed building on
this, which would essentially lead to
measured use of water. This will also
enable differential water tariffs for
commercial purposes.
Ÿ In order to ensure sustainability of PWS
in small and medium towns across the
country and to achieve the Sustainable
Development Goal 6 by 2030, it may be
important for the Ministry of Housing
and Urban Affairs, with support from
the Ministry of Jal Shakti and
corresponding ministries at the state
level, to develop necessary
frameworks, design, and a road map
for ensuring capacity building of actors
involved in PWS. Staff members should
be oriented thoroughly in technica l,
implementation, operations and
maintenance, and monitoring and
evaluation aspects.
Ÿ Other key issues that emerged from
the six-town study were around gaps in
terms of sanitation coverage and
safety. The need for identifying and
ensuring coverage of all left-out
populations in these settings could be
prioritised under Swachh Bharat
Mission 2.0 (SBM 2.0) in urban areas.
19
While the apex or state-level water
utilities can play an important role in
this process, technical support from
WASH sector experts, organisations,
and successful utilities from other
settings can be availed too.
Ÿ There is a need to build clarity around
the responsibilities of the ULBs of small
and medium towns in protection and
recharging of groundwater sources,
regulating groundwater depletion, and
ensuring safety and sustainability of
local water bodies such as wells, ponds,
lakes, canals, streams, wetlands, rivers
etc. Providing clear guidelines and
indicators to local bodies towards their
better upkeep will be important. Source
sustainability of drinking water sources
and measures like rainwater harvesting
are the other measures wherein roles
and responsibilities of the local bodies
in these towns are to be fixed clearly.
Wherever state level legislations and
policies are missing in this context, it
may be important to introduce them.
Ÿ The study also found major gaps in
public knowledge, awareness,
practices, and behaviours around water
storage, purification, and handling. The
sanitation situation indicates
knowledge and practice gaps in those
issues as well. There is a need to
change behaviour related to disposal
and management of solid and liquid
waste as well,
which lead to unhygienic surroundings
and pollution of local water bodies.
Here, it will be important to develop a
comprehensive WASH behaviour
change strategy for these settings,
along with a clear roadmap, framework,
and resources for its implementation, in
partnership with a range of civil society
actors.
Ÿ Finally, recent events such as the
COVID-19 pandemic, floods, cyclones,
and other natural disasters have
highlighted the need for efficient and
effective WASH delivery services to help
recover from unforeseen events and to
ensure good public health. However,
our study suggests that the small and
medium towns have a long way to go in
this regard. Hence, it is important to
develop WASH-related disaster
preparedness and resilience strategies
for small and medium towns with clear
roles, responsibilities, and institutional
arrangements, given their high-risk
status due to rapid urbanisation, which
led to sudden changes in their physical
characteristics and leaves them highly
vulnerable.
20

This note has been prepared by Amulya Miriyala, building on the findings of the study on
'Assessment of drinking water situation, governance and service delivery infrastructure in
small and medium towns' conducted by WaterAid India's policy unit. The said study was
led by Nirma Bora, supported by Anurag Gupta, Chanchal Kumar, Manas Biswal, Pankaj
Kumar, Purna Mohanty and Shishir Chandra, under the overall guidance of Arundati
Muralidharan and VR Raman. We would also like to acknowledge the review inputs to this
note from Chandra Ganapathy and Vanita Suneja. We thank our supporting agencies,
TRIOs Development Support (P) Ltd for conducting the household surveys and key
informant interviews, and Equinox Lab for conducting the water quality tests. We
thankfully acknowledge the facilitation support and inputs from the four regional office
teams of WaterAid India and their partners, namely, People's Organization for Rural
Development (PORD), Samarthan, National Institute of Women, Child and Youth
Development (NIWCYD), Pragati Jubak Sangh, (PJS), Pragati Grameen Vikas Samiti (PGVS)
and Vigyan Foundation.
WASH service delivery in small and medium towns,
February 2021
This note has been prepared by Amulya Miriyala, building on the findings
of the study on ‘Assessment of drinking water situation, governance and
service delivery infrastructure in small and medium towns’ conducted by
WaterAid India's policy unit.
The said study was led by Nirma Bora, supported by Anurag Gupta,
Chanchal Kumar, Manas Biswal, Pankaj Kumar, Purna Mohanty and Shishir
Chandra, under the overall guidance of Arundati Muralidharan and
VR Raman. We would also like to acknowledge the review inputs to this
note from Chandra Ganapathy and Vanita Suneja. We thank our
supporting agencies, TRIOs Development Support (P) Ltd for conducting
the household surveys and key informant interviews, and Equinox Lab for
conducting the water quality tests. We thankfully acknowledge the
facilitation support and inputs from the four regional office teams of
WaterAid India and their partners, namely, People's Organization for
Rural Development (PORD), Samarthan, National Institute of Women,
Child and Youth Development (NIWCYD), Pragati Jubak Sangh, (PJS),
Pragati Grameen Vikas Samiti (PGVS) and Vigyan Foundation.
For detailed individual reports pertaining to the study
'Assessment of drinking water situation, governance and service
delivery infrastructure in small and medium towns'
WaterAid India Country Office
Ground Floor, 004 and 005A
NSIC Business Park, Okhla Industrial Estate
New Delhi – 110020
Tel +91 11 6612 4400
Email [email protected]
W W W . W A T E R A I D I N D I A . I N
WaterAid India Country Office
Ground Floor, 004 and 005A
NSIC Business Park, Okhla Industrial Estate
New Delhi – 110020
Tel +91 11 6612 4400
Email [email protected]
click here.